Article

Changes to the Transport Behaviour of Inhabitants of a Large City Due the Pandemic

by
Marta Borowska-Stefańska
1,*,
Maxim A. Dulebenets
2,
Piotr Koneczny
3,
Michał Kowalski
1,
Edyta Masierek
1,
Filip Turoboś
3 and
Szymon Wiśniewski
1
1
Faculty of Geographical Sciences, University of Lodz, 90-142 Łódź, Poland
2
Department of Civil & Environmental Engineering, College of Engineering, Florida A&M University-Florida State University (FAMU-FSU), Tallahassee, FL 32310, USA
3
Institute of Mathematics, Lodz University of Technology, 93-590 Łódź, Poland
*
Author to whom correspondence should be addressed.
Sustainability 2024, 16(6), 2568; https://doi.org/10.3390/su16062568
Submission received: 31 January 2024 / Revised: 14 March 2024 / Accepted: 15 March 2024 / Published: 21 March 2024
(This article belongs to the Special Issue Economic and Social Consequences of the COVID-19 Pandemic)

Abstract

:
On 11 March 2020, the World Health Organisation (WHO) classified the COVID-19 outbreak as a global pandemic and, in consequence, many countries took steps to prevent the importation and subsequent local transmission of the SARS-CoV-2 virus, resulting in restrictions on economic activity, transport, travel, and daily mobility. Although the COVID-19 pandemic and its impact on daily mobility have been widely addressed in the literature, there is a limited number of studies that indicate to what extent these changes have become permanent. The purpose of this study was to determine the nature and scale of the impact of the COVID-19 pandemic on the local transport system of a large city in Poland (Łódź) and, above all, to identify the permanence of this impact. To accomplish these objectives, a questionnaire survey was conducted using the computer-assisted telephone interviewing (CATI) technique on a sample of 500 residents, which included questions on daily mobility in the period before (autumn 2019) and after (autumn 2022) the pandemic. In addition, the results of the questionnaire survey were juxtaposed with data from intelligent transport systems (ITS) (data from 20 induction loops, and data on the number of tickets validated in public transport vehicles). Not only did the pandemic change the frequency of spatial motivations, but it also affected trip durations and preferred modes of transport. The most unfavourable changes concern the modal division and the increase in the use of private transport at the expense of public transport. Understanding the durability of the impact of the pandemic on changes in the spatial mobility of the population may help to develop transport policies and increase the resilience of transport systems to possible future pandemics.

1. Introduction

On 11 March 2020, the WHO classified the COVID-19 outbreak as a global pandemic [1]. In consequence, many countries took steps to prevent the importation and subsequent local transmission of the SARS-CoV-2 virus [2], resulting in restrictions on economic activity, transport, travel, and daily mobility [3,4,5,6]. Severe restrictions, including stay-at-home policies, remote operation of schools, public institutions, and workplaces, cancellations of mass events and public gatherings, and passenger limits on public transport, affected approximately 90% of the global population, contributing to an overall reduction in mobility on an unprecedented scale [7,8]. The introduction of non-pharmaceutical icountermeasures to reduce the spread of the coronavirus affected population mobility, especially regularly-taken journeys [4,9,10]. During the initial period of the first pandemic wave in Europe, passenger traffic fell by as much as 90% [7]. The highest drop was recorded for public transport, with demand “evaporating” and transport operators reducing services [11]. This was due to the fact that public transport was perceived as far less safe than it had been before the pandemic [12], due to the possible high risk of virus transmission on buses, trams, trains, and underground [13]. As proven by Przybyłowski et al. [4], the pandemic had a huge impact on changes in mobility patterns, with the popularity of shared means of mobility declining in favour of private modes of transport. Pandemic-related changes in the modal split were also recognised by De Haas et al. [14], Beck and Hensher [15], and Jenelius and Cebecauer [11], whose analyses revealed that there was an increase in the use of cars and non-motorised modes of transport (cycling, walking) at the expense of public transport, which was particularly noticeable when considering daily mobility.
Although the COVID-19 pandemic and its impact on daily mobility have been widely addressed in the literature [16,17], there are limited studies that indicate to what extent the changes in mobility have become permanent. Hence, the purpose of this study was to determine the nature and scale of the impact of the pandemic on the local transport system of a large city in Poland (Łódź) and, above all, to identify the constancy of this impact. The constancy of the temporal changes in travel behaviour caused by the coronavirus [18,19] is relevant when we consider the goal of implementing guidelines for sustainable urban transport. Another aspect for key stakeholders in the transport sector is a transport policy that addresses inefficiencies in controlling transport demand and supply [20].
A global pandemic with such far-reaching consequences on people’s lives is a rare occurrence [21]. This—together with the fact that researchers have had the opportunity to employ state-of-the-art information technology [22] (e.g., intelligent transport systems data) [23] for the first time to observe the effects of the global pandemic, and the measures taken on transport—means the research conducted can be considered innovative. We not only utilised data obtained from ITS in our research, but also from the surveys we conducted. This was to understand not only changes in the number of vehicles on the road network, but also the reasons for these changes and their characteristics in relation to motivation, frequencies, and journey length. Overall, it appears that post-pandemic mobility varies dependent on region. Whether the changes in travel patterns that have occurred due to the pandemic will continue post-pandemic warrants further investigation.
The research is also substantiated by the period over which the threat occurred (here: nearly four years), which enables the researchers to examine the changes when compared to periods of “normal” conditions. It is equally important, however, to determine whether the changes in the transport behaviour of the population (at least on a local scale) are likely to end with the cessation of the threat, or whether they are permanent enough that a substantial alteration to the public transport services provided is necessary. The results yield a broad diagnostic base, enabling the authors to provide a number of recommendations, including management of sustainable urban mobility. The relevance of the results presented herein for the development of social sciences, socio-economic geography, and spatial economics must not be underestimated either, as there will surely be other events in the future that will threaten people’s health and lives, thus affecting transport behaviour. The results of this study, therefore, can contribute to a better understanding of changes in the transport behaviour of the population under health-affecting and life-threatening circumstances. An innovative approach to such a defined research problem may result from: an innovative context (constant relevance of the problem), interdisciplinarity (research conducted at the interface of several scientific disciplines), the use of new research methods (e.g., big data analysis), a long-term perspective of the application of the obtained results (in the event of any factors limiting mobility), adaptability (the study takes into account the adaptability of the transport system), and potential practical implications.

2. The Impact of the Pandemic on Urban Transport Behaviour and Mobility

Transport mobility is an activity undertaken by residents to meet their transport needs [24,25]. Analysis of the transport behaviour of residents in cities has been the subject of a number of academic studies, where the authors have primarily attempted to identify its contributing factors [26,27,28,29,30]. The spatial-temporal data that predicts population movement is gaining increasing attention among researchers [31].
A new train of thought in this regard emerged in 2019, when the COVID-19 outbreak caused a huge change in the behaviour and mobility of citizens across the globe [3,32]. This change mainly stemmed from the strict measures taken by governments to ensure people remained isolated and kept social distance. In addition to these restrictions, changes in mobility were compounded by fear of contracting the virus or infecting others when travelling and sharing common space. Even though the combined safety measures and restrictions that were adopted in different countries varied, thus affecting people’s lives in slightly different ways, they still produced similar changes in behaviour [11,14,33,34,35,36,37]. Severe restrictions, including stay-at-home policies, the remote operation of schools, public institutions, and workplaces, cancellations of mass events and public gatherings, and passenger limits on public transport, affected approximately 90% of the global population, contributing to an overall reduction in mobility on an unprecedented scale [7,8]. Commuting rates fell, and public transport operators sharply decreased their frequency/routes [11]. There was also an increase in the use of cars and non-motorised modes of transport, i.e., cycling, at the expense of public transport, especially for daily mobility, including shopping trips [14,15], with the increase in online grocery shopping certainly being of particular impact [6]. The largest decrease in the number of trips taken was for those related to leisure [38].
Research from the early stages of the pandemic shows significant differences in psychosocial health between countries. It is well known that younger age groups had greater problems with mental health, loneliness and, therefore, quality of life than older age groups. Other features that affected the deterioration of psychosocial health during this period were: gender, marital status, level of education, status on the job market, and geographical factors (whether a person resides in a rural or urban setting) [39]. Research carried out over a similar period in Italy shows the fear of illness during the pandemic fully mediates the relationship between negative affect and spiritual well-being and flourishing; moreover, this fear partially mediates the relationship between negative affect and post-traumatic stress disorder (PTSD) symptoms [40]. Psychosocial well-being was also studied among parents and children, and the results of this research testify, inter alia, to the fact that pandemics can have serious psychosocial consequences for parents of children, with this population having experienced more psychosocial problems than adults without children [41]. It is difficult to clearly assess to what extent psychosocial changes in the face of the pandemic have influenced, and will influence, the mobility of residents. This depends on many variables, including the effectiveness of plans to mitigate the psychosocial consequences of COVID-19 [42]. However, the pandemic seems to have left its mark on the use of public transport. Yap et al. [43] showed the increasing role of crowding in public transport and its impact on the assessment of its functioning.
A number of studies have clearly shown that there was a markedly lower propensity to travel during the pandemic, which affected public transport in particular [44]. The restrictions and fear of contracting the virus on mass transit meant people more frequently opted to use their own car for regular journeys [45], while the modal share of cycling also increased [34]. The reduced access to public transport particularly affected people with disabilities, however [46]. Trips taken to access public amenities or reach commercial facilities were significantly reduced [47], as were commuting to work and school [15,48], trips to visit friends and family, or to go to church or seek medical advice [49,50,51]. The results of studies on mobility conducted in a number of countries explicitly indicated correlations between the restrictions imposed and changes in transport behaviour during the COVID-19 pandemic. These restrictions on mobility did, however, lead to a significant drop in the number of new cases [2,52,53,54]. Studies that have addressed the issue of how changes in spatial mobility affected the spread of the COVID-19 pandemic [55] have also shown that public transport was a key factor in the spread of the pandemic. Researchers also investigated how the pandemic and the accompanying nationwide and local restrictions reduced demand for public transport, thereby limiting mobility in cities [56,57].
The analysis of the comprehensive review of the literature on the COVID-19 pandemic performed by Shortall et al. [58] reveals the need for research on the permanence of its social and economic effects. Therefore, the authors of the research presented herein address the question of which transport behaviour that emerged during the pandemic has been perpetuated. The analyses and results presented both aim to identify the changes in the transport behaviour of the population during the pandemic (their nature and the magnitude of impact on the local transport system) in a selected large city in Poland (Łódź), and to determine the permanence of these changes, which is vital for planning technical infrastructure and managing the various modes of transport. This approach was intended to gauge whether the post-pandemic reality had permanently changed transport behaviour (as indicated by observations related to the limitation of mobility and changes in the means of transport used for its implementation), or whether the pandemic period was a temporary influence on the functioning of the transport system, before returning to the state observed before the pandemic.
During (and also after) the pandemic, a drop in demand for public transport was inevitable due to the associated high risk of infection. In addition, the impact on mobility that the pandemic had has further increased the need for new transport policies [59]. It is particularly important in urban areas to deliver transport solutions that meet the changing needs of the population. As each city has different endogenous conditions, it is worth conducting research on different locations so that any recommendations and conclusions will not only reflect this diversity but also show common features. Many potential passengers who curtailed or eschewed public transport altogether during and after the pandemic declare that they would consider returning to its regular use if it met certain requirements. These include, first and foremost, that public transport be integrated with other forms of mobility and, secondly, that the policy on fares is fair. The pandemic caused a significant drop in the use of public transport in all Polish cities, but the magnitude of this decline varied, depending, inter alia, on ticket costs (when fares are higher, the propensity to avoid public transport also increases). The appeal of the public transport option is also affected by the ease of purchasing tickets and the range of tickets offered. In the age of online and digital communication technologies (whose popularity increased even further during the pandemic), there has been a noticeable rise in demand for such solutions as e-ticketing and ticket vending machines. Another factor that contributed to the drop in the popularity of public transport was remote learning and working, both imposed during the pandemic. The latter in particular has proven (at least in some industries and sectors) to be not only as efficient as the previous form of work organisation, but also considerably cheaper. It is therefore estimated that despite the cessation of the pandemic, this factor could still see an ongoing reduction in trips taken by public transport of as much as 20% [60].
Research on the post-pandemic reality indicates the effect of the pandemic on modal choice. Bouhouras et al. [61] showed that residents of urban areas were more willing to change the means of transport used for their journeys (to a bike sharing system) during the pandemic. Their study showed that after the pandemic ended, the role of these means of transport in the post-pandemic reality had strengthened compared to pre-pandemic observations. Similarly, research using the Sankey diagram showed that modality profiles have been transformed due to the pandemic, and that a number of these changes will remain post-pandemic [62,63]. However, this study did not show the whole picture of residents’ modality profiles, as it concerned trips unrelated to commuting to the main city.

3. Description of the Research Areas

The study was conducted in Łódź, a large Central European city with a population of over 658,000 [64]. It is difficult to conclusively indicate how the number of trips made within the Łódź transport system has changed in recent years, or to present the changes that have occurred in the modal split of these trips in the last few decades, as research in this regard was performed sporadically by the city administration in 1995 [65] and 2013 [66]. However, this study has recently been conducted more systematically by a local research centre (Łódź University). Earlier studies revealed that the average daily number of trips made by the average resident of Łódź increased from 2.13 in the mid-1990s to 2.4 in 2013. However, subsequent studies from late 2021 have shown a significant decrease in daily mobility (to below 1.4 trips per day on weekdays) [63], which has been attributed to the effects of the pandemic [63,67].
On weekdays, daily mobility in Łódź is dominated by obligatory motivations (slightly over 50% of all trips are to commute to school or work) [63], which is in line with the situation in other Polish cities [68], whereas optional trips on weekdays were mainly made to retail facilities (26.2%), to visit friends and family (5.3%), and for recreational purposes (4.1%).
With regard to the modal split of regularly-taken trips, clear changes have been observed, i.e., an increasing switch from public transport in favour of private cars (Table 1), which is mainly due to a rise in car ownership and changes to the family model. Since Łódź is the most congested Polish city (according to the Tom Tom Traffic Index [69]), the increase in the share of passenger cars in the modal split may only deepen this unfavourable condition. That is why it is so important to conduct research that could help those responsible for transport policy take action to improve this situation [63].
The aforesaid functional parameters (modal shift, mobility levels, etc.) of the urban transport system in Łódź are long-established. However, they have been undergoing significant transformations over the last ten years. The transport system of Łódź is concentric in nature, partially delimited by the ring road of motorways and expressways running primarily around the edge of the city or beyond its defined limits. This layout features a grid-like network, where the routing of public transport lines is determined by the existing infrastructure, whose shape depends on the mode of transport: concentric (tram lines), concentric with an emerging band-shaped layout (bus lines), and circular and peripheral (train lines).

4. Data and Methods

Typically, research on the spatial mobility of people is based on the use of one of the data sources used in this article [70,71]. Each of them on their own offers a considerable amount of information and can be perceived as a reliable and relatively comprehensive (with an awareness of their weaknesses) source of data. However, only when the analysis is carried out in two ways, specifically in parallel on complementary data (ITS and data from the questionnaire survey), is a synergistic value achieved. Each source has weaknesses that the other successfully complements. Thanks to ITS technologies, it is possible to obtain accurate data on road traffic, travel times, road capacity, etc. Questionnaires can complement this data by providing information about traveller preferences and behaviour. The ITS data and the results from the questionnaires enable the analysis of trends in the transport behaviour of the population, which is important for planning the development of transport infrastructure. The combination of ITS data and questionnaire results allows for a better understanding of the needs of road users and the adaptation of transport infrastructure to meet these demands. The information collected from ITS can be used for route planning and optimisation of the transport network. Questionnaires may reveal preferred travel routes and the factors that influence their choice. Data from ITS can be used for dynamic traffic management, which leads to increased efficiency of transport systems and a reduction in traffic congestion. Questionnaires can provide additional information about preferred travel times and travel purposes. Understanding the preferences and habits of road users allows for better adaptation of the transport on offer, including timetables, types of connections, and means of transport. By combining the ITS data and the information obtained from questionnaires, it is possible to identify the issues in the transport system and introduce appropriate solutions (Figure 1).
ITS data and questionnaire surveys on the spatial mobility of people can be used in various studies and projects related to transport planning, road traffic analysis, transport infrastructure management, and social research, including those phenomena not directly related to the transport system (e.g., changes in legislation or the impact of natural conditions). In this way, it is possible to analyse a very wide set of factors modifying the functioning of the transport system (marked in red in Figure 1). By examining the results of population spatial mobility questionnaires in combination with ITS data, it is possible to gauge the population’s attitude towards changes in the fare structure. ITS data can provide information on actual traffic patterns, such as traffic volumes at different times of the day, the busiest locations, and seasonal changes. Combined with survey results, how these traffic patterns correlate with traveller preferences and the reasons why people choose certain travel routes can be assessed. Data from questionnaire surveys can help identify those areas affected by insufficient transport accessibility for residents, e.g., areas where there is a lack of convenient transport links. ITS data can provide information on existing transport infrastructure and actual travel patterns, enabling the assessment of transport accessibility in various areas. Once transport investments have been made, such as changes to road infrastructure or the introduction of new transport services, both ITS data and survey results can be used to assess the effects of these interventions on population mobility, traffic congestion, travel times, and other indicators. Using ITS data and questionnaire survey results, it is possible to create forecasting models that help predict changes in population mobility behaviour in response to factors such as demographic changes, changes in transport policy, or the introduction of new transport technologies [72,73,74].

4.1. Data from Surveys

In order to determine the permanence of the impact that the pandemic had on the local transport system in Łódź, a survey was conducted using the CATI. This involved a representative sample of 500 adult residents (sample size was determined at a confidence equalling of 97%, with a maximum error of 5%). The research tool was a survey questionnaire consisting of two parts: respondent’s particulars and questions on daily mobility in autumn 2019 and autumn 2022, including the impact of the pandemic on possible changes in transport behaviour (Table 2). The period of autumn in 2019 was chosen as it was a time that people still remember that is not associated with the pandemic or Christmas. Autumn 2022 (post-pandemic period) was chosen for comparison of a similar period.
The research was performed in October 2022 by an external company (specialising in questionnaire research). The company endeavoured to ensure the sample selected for the study was representative. The survey was representative in terms of gender and age (Table 3). The population of Łódź is ageing rapidly due to demographic reasons. We are dealing here with ageing both from the base of the age pyramid and from its apex. This process is the most advanced among all voivodeship cities in Poland, which explains why it is so important to undertake research especially concerning older age groups.
The Wilcoxon test, which is a non-parametric alternative to the Student’s t-test, was employed to analyse the results of the questionnaire survey, as it enables one to compare population means that do not follow a normal distribution, which is impossible with the majority of parametric tests for equality of means within groups [75].
For data analysis, the authors have utilized Python along with the numpy (NumPy), pandas, and scipy modules (SciPy).
Questionnaire-based research on people’s transport behaviour has great potential. The questionnaire distributed by telephone made it possible to collect data from a relatively large and diverse group of respondents representing various socially, demographically and spatially diverse groups. Compared to other research methods, such as personal interviews or field observations, questionnaire research can be relatively cheap, especially when using remote tools (e.g., the telephone). Respondents are more likely to answer honestly when the survey is anonymous, which may lead to better data quality. Questionnaires also allow for the standardisation of questions and procedures, which facilitates the comparison of data between different groups and over different time periods (as seen in the case of this study). A questionnaire survey can be easily scaled, which means it can be carried out on a large scale over a short time period. Nevertheless, this method of obtaining information about spatial mobility has certain limitations. It can be difficult to obtain a high response rate, especially when the survey is long and requires considerable respondent involvement. There is also a risk of measurement errors related to the interpretation of questions by respondents or distortions resulting from imprecise answers. Certain social groups, such as older people, uneducated people, or people who did not consent to having their telephone numbers included in the research contractor’s databases, may be excluded from the study, which may introduce distortions in the results. However, in this study, measures were taken that eliminated the indicated imperfections [76].

4.2. Load on the Urban Road Network

The third main source of data on the transport behaviour of the population in Łódź (besides the results of the questionnaire survey and data on the number of tickets validated in public transport vehicles) are empirical measurements made by induction loops supporting the ITS system in Łódź [77]. The data was collected between 2016 and 2022, although this study employs only data from the years 2019–2022. This data boasts a range of attributes that allow it to be classified as a big data set [78], and it is applicable in both geographic and traffic engineering studies [79,80]. Due to changes in the way the data is archived (by the City of Łódź) and the properties of the detectors and the system built around them, it had to undergo a number of validation procedures to enable its application in the study [81].
The first stage, which is continuous and performed automatically by the Sydney Coordinated Adaptive Traffic System (SCATS), involves traffic monitoring based on measurements from detectors (induction loops). The system aggregates the number of vehicles recorded at 15-min intervals 24 h a day for each lane within the junctions covered by the system (the system was monitoring over 270 junctions at the time this paper was being prepared). The data is archived and can be exported as a tabular summary containing the measurements at 15-min intervals for each loop installed within a single junction (the database allows the export of a single file containing data on a given junction). The series of files retrieved from the archives must then be combined into a single, uniform database, which poses a major methodological challenge but is necessary for the inter-period comparability of the data. The procedure also involved the removal of measurement errors, both those detected directly by the system and those manifested by abnormal vehicle numbers recorded (e.g., the number of vehicles passing through a given junction within a 15-min time interval was greater than the reasonable lane capacity in free-flow traffic). As the traffic monitoring system underwent some changes (e.g., quantitative; the number of induction loop detectors increased from ca. 230 to 270 monitored junctions) over the years in question, the authors decided to limit the study area only to those junctions and detectors for which there were observations in each of the analysed periods in order to eliminate the effect of excessive accumulation of vehicles from measurements made by the increasing number of detectors. The final database contains information on the junction, lane, date, and time of measurements (in 15-min intervals).
This allowed the authors to analyse the temporal changeability of vehicle traffic flows on the urban road network. However, a weakness of the inference based on the data from inductive loops must be stated here. Namely, the vehicle numbers reported by the sensors do not reveal the magnitude of capacity overruns at junctions or the resulting traffic queues. As a result, the representation of traffic volumes at 15-min intervals on the road network only shows the proportion of traffic that passed through a junction in a given interval. In addition, the ITS data shows only the entire traffic volume with no breakdown into trip motivation, thus forcing the researcher to be cautious when drawing conclusions regarding the impact of the pandemic on traffic volumes related to commuting to work, school, retail facilities, etc. For each year in question (2019–2022), the average vehicle number recorded by the urban ITS in 15-min intervals for each day of the week was determined. In order to analyse the spatial dimension of the changes under study, the volume of the average daily traffic at the junctions covered by induction loops was “superimposed” (presented as a pie chart) on the map of the road network in the city.

4.3. Public Transport Provision and Its Uptake

The performance of public transport in Łódź was analysed to assess the quality and quantity of the service provided, the ticketing options available, and the degree to which these services were used in 2019–2022. Data on the temporal and spatial fluctuations in the number of tickets validated in public transport vehicles was provided by the transport organiser, the city council, represented by the road and transport management authority within the boundaries of the city [82]. The data on ticket validations, which provides information on date and time, vehicle identity card, and geographical location, has been structured as follows:
  • the total number of ticket validations on all public transport vehicles at hourly intervals for the second week of October in each year between 2019 and 2022,
  • the number of ticket validations per tram and bus for the second week of October in each year between 2019 and 2022,
  • the number of ticket validations by passengers (either beginning a journey or continuing their journey by punching another ticket) registered by the system in the vicinity of a given tram or bus stop for the second week of October in each year between 2019 and 2022.
Measurements are taken automatically in each public transport vehicle and then sent to the system’s headquarters. In order to visualise the temporal and spatial changeability of how the urban public transport system is used, averaged data on the number of tickets validated was used for the adopted time intervals. Thematic maps showing the number of ticket validations by route for each tram and bus line were compiled using spatial concatenation. This allowed the aggregation of the number of ticket validations for those sections of the public transport network where there is reciprocal substitutability in service by the vehicles of the public transport operator.
Information on the temporal changes in the services provided by the transport operator was taken from the website of the city’s municipal transport body (The Municipal Transport Company in Łódź—MPK Łódź). Historical timetables for the indicated dates were obtained via their server. The number of trips taken by pairs of trams or buses (with each member of the pair travelling in the opposite direction) on a given day was then totalled using an additional division into pre-peak, peak, and post-peak periods (for working days).
When reviewing the results and drawing conclusions, one must remember that the data on which the study is based takes into account neither holders of period tickets (monthly, weekly, etc.) or single-line tickets, nor those entitled to travel for free (e.g., senior citizens). What is more, the data only indicates where and when a given user validated their ticket. Although it is reasonable to assume that they punched it at the beginning of the journey, this is obviously not the only possibility. The researcher is also unable to determine how long a given trip on a given ticket lasted, as the data does not indicate where and when the user got off (ended the trip) or transferred (changed vehicles and continued the trip). After all, a given passenger could have punched consecutive tickets in the course of a single journey [82]. In addition, there is no possibility to keep track of trips made by those passengers who did not punch a ticket even though they were obliged to do so. Despite the said limitations, the data employed is still the largest and most accurate dataset available to illustrate the nature of how public transport is actually used in Łódź.
The undoubted advantages of analyses conducted on the basis of ITS data include the fact that the ITS generates large amounts of data from a number of sources, such as road sensors, traffic monitoring systems, and navigation applications. This rich source of data allows for a more accurate understanding of movement and mobility. Thanks to the automation of the data collection process, ITS data is often more reliable and accurate than that collected using traditional methods. ITS data can also be collected and shared in real time, enabling quick analysis and rapid response to changes in road traffic. The availability of ITS data enables the integration of different data sources, which can lead to more comprehensive analyses and a better understanding of mobility. The limitations of this approach include the risk of system failure and data loss; ITS systems are susceptible to technical failures, which can lead to interruptions in data collection or inaccurate analysis results. The effectiveness of ITS data depends on the installed infrastructure, which, in cases of absence or insufficiency, may lead to the inability to collect comprehensive data. There is also a risk of manipulation of ITS data by the intentional actions of third parties, which may lead to false or distorted analysis results. Collecting large amounts of data can lead to privacy concerns, especially when it comes to tracking vehicle and user movements. This study implemented remedial actions that addressed the identified threats to the reliability and validity of these data.

5. Results and Discussion

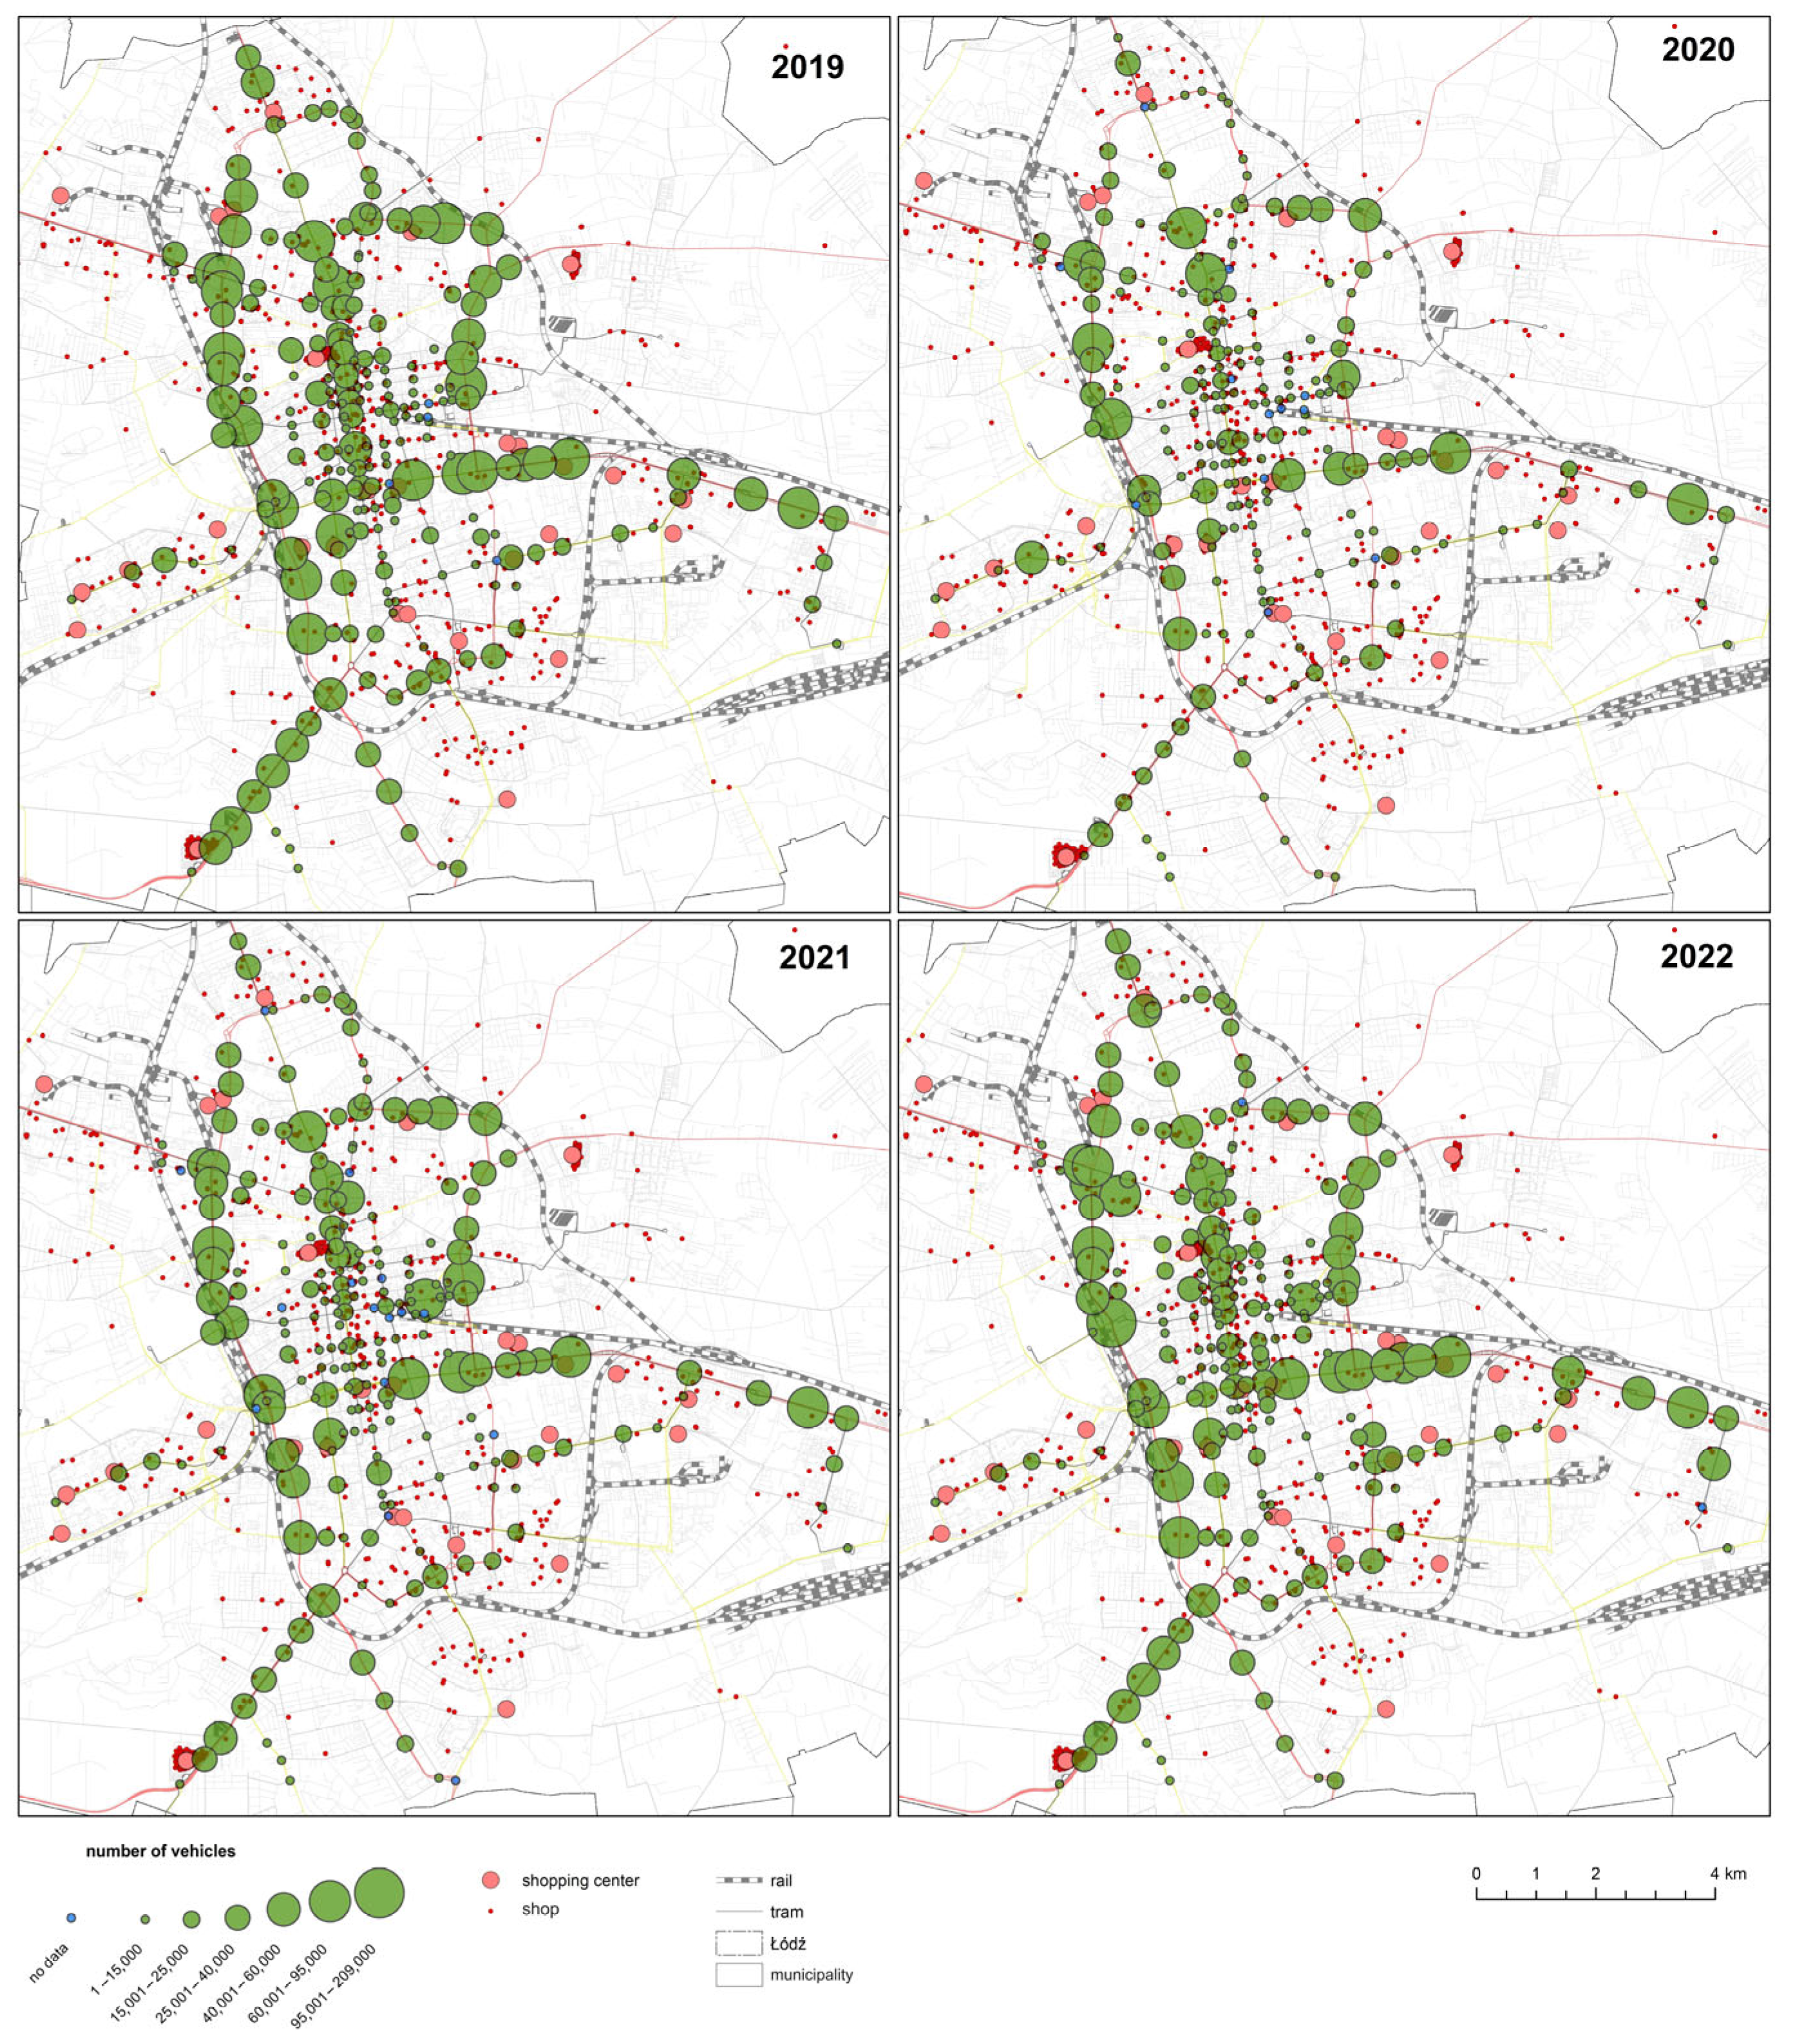
5.1. Load on the Urban Road Network

In order to determine the extent to which the pandemic-related changes in mobility have been perpetuated in the transport landscape of Łódź, an analysis of the road network load was first conducted for four consecutive years (2019–2022) and divided into three periods: pre-pandemic (2019), pandemic (2020–2021), and post-pandemic (2022). As regards vehicular transport, no significant changes were observed in the temporal distribution of trips. During the pandemic, the relative number of vehicles on the network at weekends changed quite significantly, but the decrease in the number of weekend trips by passenger car was only temporary and almost reverted to the previously observed level once the pre-pandemic conditions returned. Observations for the pandemic period take significantly lower volumes than in the pre-pandemic period. Once the pandemic was over, traffic volumes on Łódź roads increased, exceeding the level recorded before the threat emerged (Figure 2). It is worth noting that the levels observed before the pandemic were exceeded in particular in the period immediately before the morning rush hour and during the morning and afternoon transport peak hours. This may indicate the frequent use of the car as a means of transport for obligatory trips. During other periods of the day, a decrease in traffic intensity has been observed in the post-pandemic period compared to 2019. This is particularly noticeable in the evening and at night. It is difficult to clearly indicate the cause of this phenomenon, and speculations in this regard may be due to eschewing the car in favour of other modes of transport at this time of day, or perhaps a change in travel motivation.
The analysis of the spatial changeability of the road network load (Figure 3) may be subject to some interpretative errors (due to periodic exclusions of certain sections of the network during their redevelopment and expansion, or the construction of new segments). Both in the pre-pandemic and post-pandemic periods, the highest network loads were observed on the main transport arteries (the inner city ring road and metered access roads to the city). Areas in which lower traffic intensity is observed in the post-pandemic period than before are elements of the road network that are significantly affected by reduced accessibility as a result of renovations.
On the basis of this analysis, one can therefore restate after Christidis et al. [83] that there is still a high level of ambiguity concerning either societal developments or the economy after the pandemic. It is impossible to confidently predict the duration or intensity of behavioural changes, much less accurately assess their impact on mobility. The inertia rate in Łódź was so low that the short-term decrease in trips, as predicted by Christidis et al. [83], was actually ultra-short.

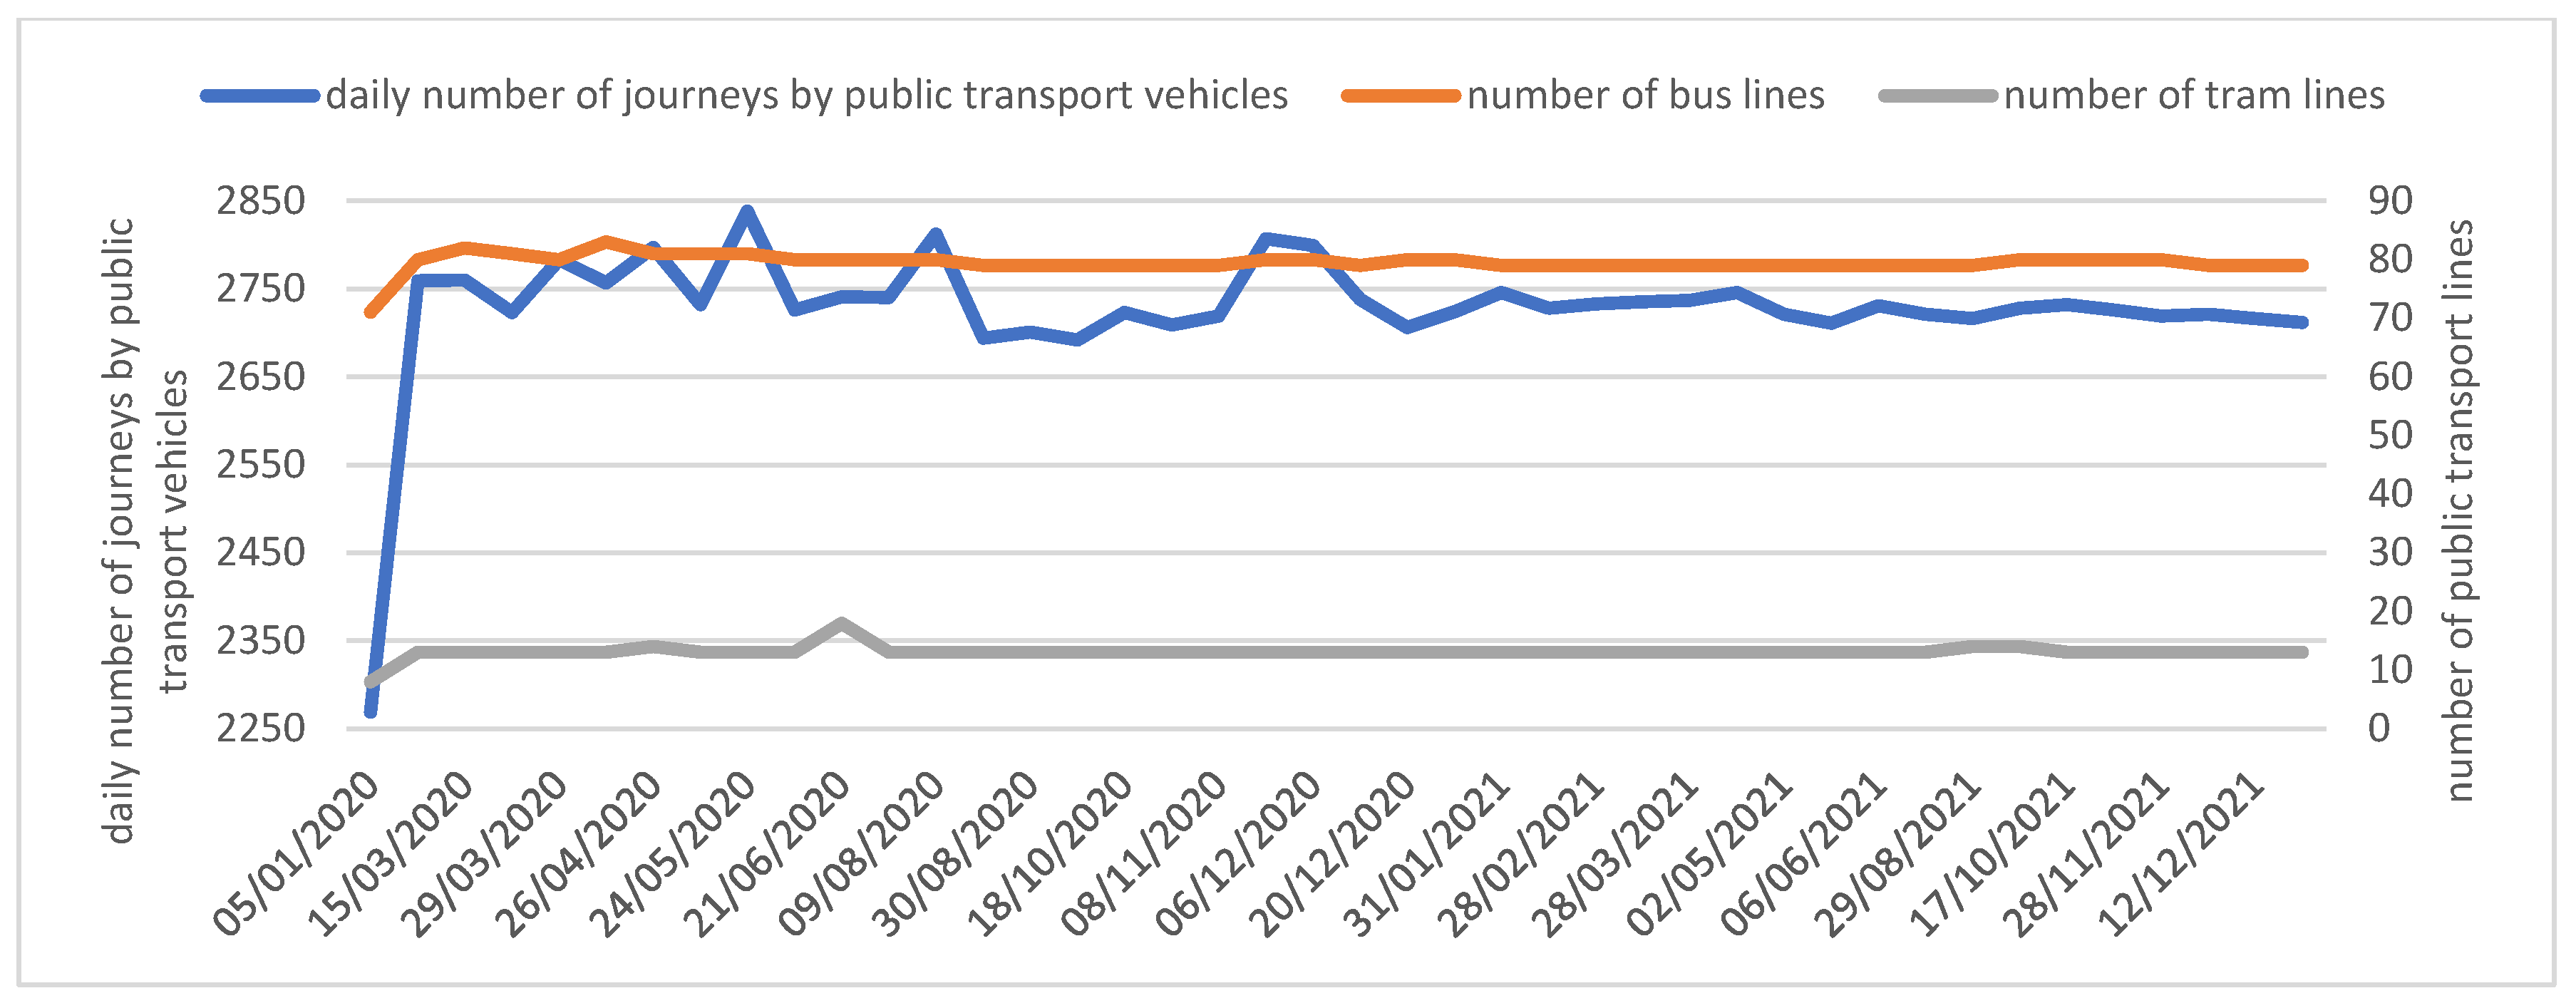
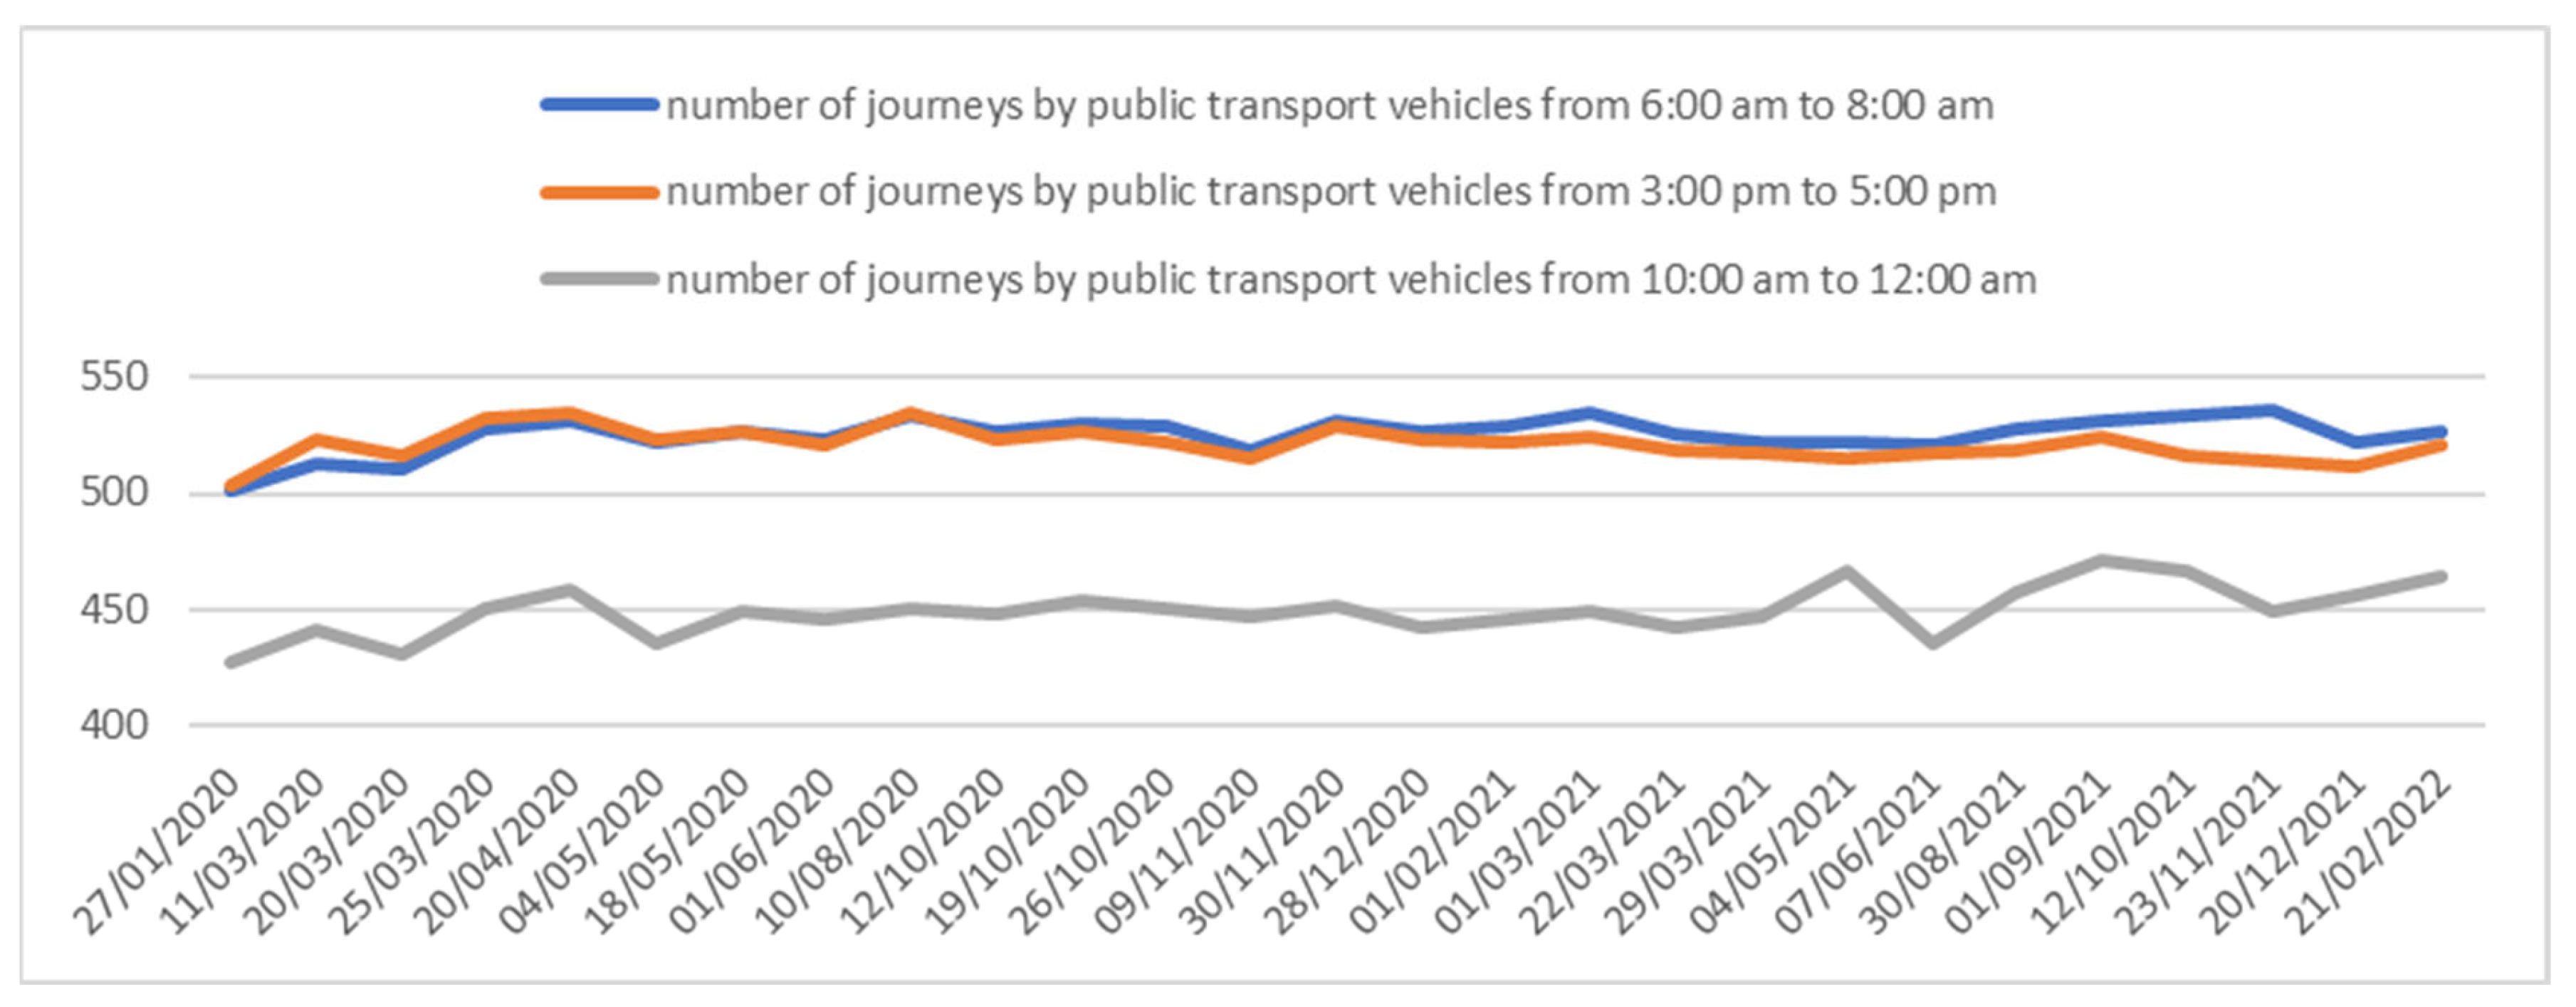
5.2. Public Transport Provision and Its Uptake

During the pandemic period, the local transport operator reduced their planned transport tasks (Figure 4, Figure 5, Figure 6 and Figure 7). For 2021, they introduced a modified service favouring buses at the expense of trams, mainly due to the scheduled roadworks and investments for the network of tram tracks (ongoing or new), which necessitated the temporary use of replacement bus services. The restrictions implemented after March 2020 following the spread of the COVID-19 virus resulted in a decrease in the transport timetable, with a particularly pronounced drop in the frequency of the tram service. In 2021, the Municipal Transport Company’s vehicles covered 48,340,000 vehicle-kilometres, a decrease of 0.5% compared to the previous year. For trams, the total dropped by 1,156,400 vehicle-kilometres compared to the previous year, while for buses, this value increased by 865,200 vehicle-kilometres. In general, 2021 was yet another consecutive year in which the total vehicle-kilometres decreased, since in 2019 it amounted to 52,300,000 vehicle-kilometres [84].
Although the number of bus and tram lines did not change significantly on Saturdays in the period under study (Figure 3), the situation was different in regard to the daily number of journeys. Reduced during the first lockdown, they only increased in the second half of 2021. On Sundays in the analysed period, the number of bus and tram lines and the frequency of public transport vehicles did not change significantly (Figure 5). This was mainly due to the fact that the local carrier’s timetable was traditionally more limited on Sundays, compared to the other days of the week. The low base effect resulted in no changes in this scope. On weekdays, slightly greater variability was observed in the number of public transport vehicle journeys. In the initial period of the pandemic, an increase in the number of journeys was observed, which later fell (Figure 6). It should be noted that these changes did not apply to rush hours (Figure 7).
This resulted in slight changes in passenger numbers on the main transport axes (Figure 8). In 2022, once the pandemic restrictions were lifted, the structure of the temporal daily distribution of passenger traffic was still similar to the situation during the pandemic. However, in absolute terms, a clear rise in passenger traffic was observed (Figure 9). At the same time, pronounced rises in passenger numbers were observed on all main transport axes, both within the city and on suburban lines (Figure 10).
Although Zhao and Gao [85] and Christidis et al. [83] observed that the impact of the COVID-19 pandemic on decisions made by individuals concerning public transport may persist for a time once the crisis is over, in Łódź, there was a dynamic rise in passenger numbers on public transport when compared to observations made during the pandemic.
However, scientists still lack sufficiently detailed data on how population mobility is evolving after the pandemic and whether (and if so, how) the criteria for choosing modes of public transport will change. While there are studies addressing this phenomenon [85,86,87], it is difficult to clearly indicate how universal their results are and to what extent they only show changes typical of the society these authors analysed. For this reason, the quantitative picture presented above requires the research to be expanded with information portraying post-pandemic mobility in Łódź in qualitative terms. Nevertheless, the results of the analyses presented herein still fall within the predictions of the rapid return to pre-pandemic levels made by Ehsani at al. [88].

5.3. Analyses of the Questionnaires

Changes in daily mobility in 2019–2022 were assessed with regard to how often different motivations were pursued, trip duration, and the mode of transport used. The frequency at which different spatial behaviour motivations were pursued (which were considered statistically significant) affected six trip motivations over the analysed period (Table 4).
The respondents reported that the greatest pandemic-related changes occurred for remote working. For those who declared they were working remotely, the frequency of this form of work increased (Figure 11); 49% stated that this increase stemmed directly from the pandemic, while 13.7% claimed that it was due to both the pandemic and unrelated factors. The rise in the percentage of people working remotely due to the pandemic was also noted by Ahlers et al. [89].
The frequency of the other analysed motivations behind spatial behaviour decreased (Figure 12), and in each case the pandemic had some impact on this decrease (response rate was no less than 15%). The largest percentage change in the frequency that different motivations were pursued (for which respondents claimed the pandemic as a direct cause) was for entertainment and culture, and for working outside the home. In this case, 20.2% of the respondents indicated that it stemmed directly from the pandemic, while 11.4% stated that the impact was only partially the result of the pandemic, and that there were also other factors. These results corroborate the preliminary study by Kellermann et al. [90], who established that long-term pandemic-related changes in daily mobility manifest themselves as a continuous (absolute and relative) decline in the frequency of trips and distances covered.
As regards trip duration for the different motivations, statistically significant changes for the period in question (2019–2022) applied to seven motivations (Table 5).
The respondents declared that the pandemic caused, to some extent, a change in trip duration only for the first five motivations above. In each case, however, they stated that the trip duration had decreased. In this regard, the pandemic had the greatest impact on tourism (33.3% of changes in this respect) (Figure 13) and recreation/sports and hobbies.
Some minor changes were also observed for the mode of transport used. Namely, there was an increase of 2.6 percentage points in the use of private transport. Unfortunately, in the modal split of the daily mobility in Łódź, there was also a decline of 2.58 percentage points in public transport use. No changes were recorded for other modes of transport. In general, the largest percentage change in the chosen mode of transport pertained to working outside the home (11.83% of the respondents declared a change in this respect) and to mobility related to entertainment and culture (11.13%) in the analysed period (2019–2022). Łódź residents claimed that the pandemic had had a direct impact on ca. 9.75% of their changes in the mode of transport, and for 6.09% of them the impact was indirect. The pandemic also caused a rise in the use of privately owned cars and active transport (bikes, scooters, etc.), which is expected to continue after the pandemic. By contrast, public transport and taxis are likely to play a lesser role. Ong et al. [86] also confirmed that the pandemic triggered a rise in the importance of cars at the expense of mass transit.

6. Conclusions

The COVID-19 pandemic has undoubtedly impacted numerous facets of day-to-day life, particularly in terms of daily mobility patterns, and these may have long-lasting effects. Although the future remains uncertain, we can anticipate certain shifts in travel behaviour based on current trends and expectations. Understanding individuals’ travel patterns is necessary to promote changes to the modal split and increase the resilience of cities when faced by future emergencies and pandemics. The purpose of the study was to determine the nature and scale of the impact of the COVID-19 pandemic on the local transport system of a large city in Poland (Łódź) and, above all, to identify the permanence of this impact. The study employed both quantitative and qualitative data, which made it possible to determine not only whether vehicle numbers on the network had changed in the period under study, but also what had caused this change. This study provides new knowledge on the widely-addressed impact of the pandemic on various aspects of life by addressing the overlooked issue of how persistent these changes are. Not only did the pandemic change the frequency of spatial motivations, but it also affected trip durations and preferred modes of transport. According to respondents, the greatest pandemic-related changes were related to remote working. This was the only motivation for spatial behaviour where the frequency increased, while in all other cases a decrease was noted whenever it was necessary to travel or commute. As regards trip duration, this decreased for each motivation under study. The changes that were triggered to the greatest extent by the pandemic pertained to two motivations: tourism, and recreation/sport and hobbies. As for preferred modes of transport, there was a rise in the use of private transport at the expense of mass transit. The largest percentage change in the modal shift for the different trip motivations directly influenced by the pandemic applied to two motivations: working outside the home, and mobility related to entertainment and culture.
These results confirm that it has become noticeably more popular to work remotely. As for the other daily motivations, the respondents stated that they can also be pursued online, so there was less pressure to commute. For these motivations, however, the pace of change has not been that dynamic. As regards sustainable transport, the most adverse changes concern the growing popularity of the car in the modal split. To address the reluctance to use public transport, measures must be taken to improve the cleanliness of public transport vehicles, which could help to increase the use of mass transit for regularly-taken journeys. Future studies should address the reluctance of the general public to use mass transit and the actions that would encourage them to do so once again. If cities are to pursue sustainable mobility, knowledge of how permanent the pandemic-related changes in spatial mobility of the population are could facilitate the development of sustainable transport policies.
Research on population mobility was extremely important for transport organisers and decision-makers in organising public transport after the COVID-19 pandemic. For example, do more people prefer their own means of transport over public transport? Have preferences regarding travel times changed? It was possible to identify peak times and places where the demand for public transport was highest, allowing transport organisers to adapt timetables to the changing needs of passengers. Based on mobility data, vehicle capacity and frequency of trips could also be adjusted to actual demand. In the event of future crisis situations, more journeys can be planned during peak hours or on heavier routes. Mobility studies also helped identify the risk of COVID-19 infection and suggested appropriate preventative measures. Transport bodies could alter cleaning and disinfection procedures and introduce restrictions on the number of passengers in vehicles. The analysis helped promote alternative forms of travel, such as cycling, hiking, and carpooling. Thanks to this, it was possible to reduce the pressure on public transport during peak hours and minimize the risk of infection. The research also provided valuable information on travel patterns, which could be useful when planning new transport infrastructure or modifying existing ones.
This study on the lasting impact of changes in transport behaviour due to the COVID-19 pandemic contributes to the development of scientific achievements in the field of socio-economic geography on several levels. It contributes to understanding how changes in transport behaviour vary depending on the geographical space considered, e.g., a city or a district. This may include analysing differences between urban or suburban areas (with different daily mobility patterns), areas with different levels of population density, or areas with different levels of socio-economic development. The study helps identify changes in population patterns, prime business locations, and infrastructure development in the context of the pandemic. The study also gauges how changes in transport behaviour have affected accessibility to services, jobs, education, and important destinations. This may lead to a better understanding of inequalities in transport accessibility for different social groups and regions. Based on the collected data, models for predicting spatial behaviour in the context of crisis situations can be developed. The study helps identify areas of the economy most exposed to the effects of changes in transport behaviour and suggest best responses.
Potential limitations of the study presented include: the study may capture changes that may not be representative of long-term trends; residents may be more inclined to exaggerate or minimize changes due to concerns or expectations; different social groups may have different experiences and reactions to changes in communication behavior, which may make it difficult to obtain a representative cross-section of the population; the period of the pandemic may make it difficult to compare current communication behavior with that from previous years, which may limit the ability to assess changes; and the pandemic may have had differential impacts on different aspects of travel behavior, depending on the specific urban environment, infrastructure, culture and other local factors, which may limit the geographical universality of inferences.

Author Contributions

Conceptualization, M.B.-S. and S.W.; methodology, M.B.-S., P.K., M.K., E.M., F.T. and S.W.; software, M.B.-S., P.K., F.T. and S.W.; validation, M.B.-S., P.K., F.T. and S.W.; formal analysis, M.B.-S.; investigation, M.B.-S.; resources, M.B.-S. and M.K.; data curation, M.B.-S., P.K., F.T. and S.W.; writing—original draft preparation, M.B.-S., M.A.D., P.K., M.K., E.M., F.T. and S.W.; writing—review and editing, M.B.-S., M.K., E.M. and S.W.; visualization, M.B.-S. and S.W.; supervision, M.B.-S.; project administration, M.B.-S. and S.W.; funding acquisition, M.B.-S. and S.W. All authors have read and agreed to the published version of the manuscript.

Funding

This research was funded under the framework of the 2% subsidy for tertiary education, aimed at academies and universities which participated in the IDUB Contest (“Inicjatywa Doskonałości—Uczelnia Badawcza”). The project is co-financed by the Polish National Agency for Academic Exchange and under the research projects no. 2019/35/D/HS4/00697, financed from the funds of the National Science Centre in Poland.

Data Availability Statement

The raw data supporting the conclusions of this article will be made available by the authors on request.

Conflicts of Interest

The authors declare no conflict of interest.

References

  1. Ali, I. The COVID-19 Pandemic: Making Sense of Rumor and Fear. Med. Anthropol. 2020, 39, 376–379. [Google Scholar] [CrossRef] [PubMed]
  2. Nouvellet, P.; Bhatia, S.; Cori, A.; Ainslie, K.E.C.; Baguelin, M.; Bhatt, S.; Boonyasiri, A.; Brazeau, N.F.; Cattarino, L.; Cooper, L.V.; et al. Reduction in Mobility and COVID-19 Transmission. Nat. Commun. 2021, 12, 1090. [Google Scholar] [CrossRef] [PubMed]
  3. Baig, A.S.; Butt, H.A.; Haroon, O.; Rizvi, S.A.R. Deaths, Panic, Lockdowns and US Equity Markets: The Case of COVID-19 Pandemic. Financ. Res. Lett. 2021, 38, 101701. [Google Scholar] [CrossRef] [PubMed]
  4. Przybylowski, A.; Stelmak, S.; Suchanek, M. Mobility Behaviour in View of the Impact of the COVID-19 Pandemic—Public Transport Users in Gdansk Case Study. Sustainability 2021, 13, 364. [Google Scholar] [CrossRef]
  5. Smolarski, M. Restrictions on Regional Passenger Transport during Epidemiological Threat (COVID-19)—An Example of the Lower Silesian Voivodship in Poland. Pr. Kom. Geogr. Komun. PTG 2020, 23, 56–61. [Google Scholar] [CrossRef]
  6. Shamshiripour, A.; Rahimi, E.; Shabanpour, R.; Mohammadian, A. How Is COVID-19 Reshaping Activity-Travel Behavior? Evidence from a Comprehensive Survey in Chicago. Transp. Res. Interdiscip. Perspect. 2020, 7, 100216. [Google Scholar] [CrossRef] [PubMed]
  7. Budd, L.; Ison, S. Responsible Transport: A Post-COVID Agenda for Transport Policy and Practice. Transp. Res. Interdiscip. Perspect. 2020, 6, 100151. [Google Scholar] [CrossRef]
  8. Combs, T.S.; Pardo, C.F. Shifting Streets COVID-19 Mobility Data: Findings from a Global Dataset and a Research Agenda for Transport Planning and Policy. Transp. Res. Interdiscip. Perspect. 2021, 9, 100322. [Google Scholar] [CrossRef]
  9. Hsiehchen, D.; Espinoza, M.; Slovic, P. Political Partisanship and Mobility Restriction during the COVID-19 Pandemic. Public Health 2020, 187, 111–114. [Google Scholar] [CrossRef]
  10. Oszter, V. COVID-19 Impacts on Passenger Rail Transport in Hungary, Slovenia, Croatia, Serbia and Romania. Pr. Kom. Geogr. Komun. PTG 2020, 23, 7–13. [Google Scholar] [CrossRef]
  11. Jenelius, E.; Cebecauer, M. Impacts of COVID-19 on Public Transport Ridership in Sweden: Analysis of Ticket Validations, Sales and Passenger Counts. Transp. Res. Interdiscip. Perspect. 2020, 8, 100242. [Google Scholar] [CrossRef] [PubMed]
  12. Morawska, L.; Tang, J.W.; Bahnfleth, W.; Bluyssen, P.M.; Boerstra, A.; Buonanno, G.; Cao, J.; Dancer, S.; Floto, A.; Franchimon, F.; et al. How Can Airborne Transmission of COVID-19 Indoors Be Minimised? Environ. Int. 2020, 142, 105832. [Google Scholar] [CrossRef] [PubMed]
  13. Musselwhite, C.; Avineri, E.; Susilo, Y. Editorial JTH 16—The Coronavirus Disease COVID-19 and Implications for Transport and Health. J. Transp. Health 2020, 16, 100853. [Google Scholar] [CrossRef] [PubMed]
  14. De Haas, M.; Faber, R.; Hamersma, M. How COVID-19 and the Dutch ‘Intelligent Lockdown’ Change Activities, Work and Travel Behaviour: Evidence from Longitudinal Data in the Netherlands. Transp. Res. Interdiscip. Perspect. 2020, 6, 100150. [Google Scholar] [CrossRef] [PubMed]
  15. Beck, M.J.; Hensher, D.A. Insights into the Impact of COVID-19 on Household Travel and Activities in Australia—The Early Days under Restrictions. Transp. Policy 2020, 96, 76–93. [Google Scholar] [CrossRef]
  16. Świtała, M. Wpływ Pandemii COVID-19 Na Codzienną Mobilność Mieszkańców Warszawy. Gospod. Mater. Logistyka 2021, 9, 19–31. [Google Scholar] [CrossRef]
  17. Borkowski, P.; Jażdżewska-Gutta, M.; Szmelter-Jarosz, A. Lockdowned: Everyday Mobility Changes in Response to COVID-19. J. Transp. Geogr. 2021, 90, 102906. [Google Scholar] [CrossRef]
  18. Jones, C.; Philippon, T.; Venkateswaran, V. Optimal Mitigation Policies in a Pandemic: Social Distancing and Working from Home. Rev. Financ. Stud. 2021, 34, 5188–5223. [Google Scholar] [CrossRef]
  19. Yilmazkuday, H. COVID-19 Spread and Inter-County Travel: Daily Evidence from the U.S. Transp. Res. Interdiscip. Perspect. 2020, 8, 100244. [Google Scholar] [CrossRef]
  20. Mogaji, E.; Adekunle, I.; Aririguzoh, S.; Oginni, A. Dealing with Impact of COVID-19 on Transportation in a Developing Country: Insights and Policy Recommendations. Transp. Policy 2022, 116, 304–314. [Google Scholar] [CrossRef]
  21. Kaur, H.; Garg, S.; Joshi, H.; Ayaz, S.; Sharma, S.; Bhandari, M. A Review: Epidemics and Pandemics in Human History. Int. J. Pharma Res. Health Sci. 2020, 8, 3139–3142. [Google Scholar] [CrossRef]
  22. Heiler, G.; Reisch, T.; Hurt, J.; Forghani, M.; Omani, A.; Hanbury, A.; Karimipour, F. Country-Wide Mobility Changes Observed Using Mobile Phone Data During COVID-19 Pandemic. In Proceedings of the 2020 IEEE International Conference on Big Data (Big Data), Atlanta, GA, USA, 10–13 December 2020; pp. 3123–3132. [Google Scholar]
  23. Fernando, R.; Wang, H.; Zhang, Y.; Prakash, M.; Debnath, A. The Effects of Travel Containment Measures within COVID-19. In Proceedings of the 2020 24th International Conference Information Visualisation (IV), Melbourne, Australia, 7–11 September 2020; pp. 403–408. [Google Scholar]
  24. Delso, J.; Martín, B.; Ortega, E. A New Procedure Using Network Analysis and Kernel Density Estimations to Evaluate the Effect of Urban Configurations on Pedestrian Mobility. The Case Study of Vitoria–Gasteiz. J. Transp. Geogr. 2018, 67, 61–72. [Google Scholar] [CrossRef]
  25. Mohan, D.; Tiwari, G. Mobility, environment and safety in megacities. IATSS Res. 2000, 24, 39–46. [Google Scholar] [CrossRef]
  26. Bruns, A.; Matthes, G. Moving into and within Cities—Interactions of Residential Change and the Travel Behavior and Implications for Integrated Land Use and Transport Planning Strategies. Travel. Behav. Soc. 2019, 17, 46–61. [Google Scholar] [CrossRef]
  27. De Vos, J.; Ettema, D.; Witlox, F. Changing Travel Behaviour and Attitudes following a Residential Relocation. J. Transp. Geogr. 2018, 73, 131–147. [Google Scholar] [CrossRef]
  28. Cao, J.; Ermagun, A. Influences of LRT on Travel Behaviour: A Retrospective Study on Movers in Minneapolis. Urban Stud. 2017, 54, 2504–2520. [Google Scholar] [CrossRef]
  29. Stevens, M.R. Does Compact Development Make People Drive Less? J. Am. Plan. Assoc. 2017, 83, 7–18. [Google Scholar] [CrossRef]
  30. Wang, D.; Lin, T. Built Environment, Travel Behavior, and Residential Self-Selection: A Study Based on Panel Data from Beijing, China. Transportation 2019, 46, 51–74. [Google Scholar] [CrossRef]
  31. Xiao, G.; Chen, L.; Chen, X.; Jiang, C.; Ni, A.; Zhang, C.; Zong, F. A Hybrid Visualization Model for Knowledge Mapping: Scientometrics, SAOM, and SAO. IEEE Trans. Intell. Transp. Syst. 2024; 1–14, Early Access. [Google Scholar] [CrossRef]
  32. Olayode, I.O.; Severino, A.G.; Campisi, T.; Tartibu, L.K. Comprehensive Literature Review on the Impacts of COVID-19 Pandemic on Public Road Transportation System: Challenges and Solutions. Sustainability 2022, 14, 9586. [Google Scholar] [CrossRef]
  33. Echaniz, E.; Rodríguez, A.; Cordera, R.; Benavente, J.; Alonso, B.; Sañudo, R. Behavioural Changes in Transport and Future Repercussions of the COVID-19 Outbreak in Spain. Transp. Policy 2021, 111, 38–52. [Google Scholar] [CrossRef]
  34. Molloy, J.; Schatzmann, T.; Schoeman, B.; Tchervenkov, C.; Hintermann, B.; Axhausen, K.W. Observed Impacts of the COVID-19 First Wave on Travel Behaviour in Switzerland Based on a Large GPS Panel. Transp. Policy 2021, 104, 43–51. [Google Scholar] [CrossRef]
  35. Tarkowski, M.; Puzdrakiewicz, K.; Jaczewska, J.; Połom, M. COVID-19 Lockdown in Poland—Changes in Regional and Local Mobility Patterns Based on Google Maps Data. Pr. Kom. Geogr. Komun. PTG 2020, 23, 46–55. [Google Scholar] [CrossRef]
  36. Cartenì, A.; Di Francesco, L.; Martino, M. How Mobility Habits Influenced the Spread of the COVID-19 Pandemic: Results from the Italian Case Study. Sci. Total Environ. 2020, 741, 140489. [Google Scholar] [CrossRef] [PubMed]
  37. Engle, S.; Stromme, J.; Zhou, A. Staying at Home: Mobility Effects of COVID-19. SSRN Electron. J. 2020, 4, 86–102. [Google Scholar] [CrossRef]
  38. Borkowski, P.; Jażdżewska-Gutta, M.; Szmelter-Jarosz, A. Mobilność Mieszkańców Polski w Czasie Epidemii Koronawirusa; Uniwersytet Gdański: Sopot, Poland, 2020. [Google Scholar]
  39. Geirdal, A.K.Ø.; Price, D.; Schoultz, M.; Thygesen, H.; Ruffolo, M.; Leung, J.; Bonsaksen, T. The Significance of Demographic Variables on Psychosocial Health from the Early Stage and Nine Months after the COVID-19 Pandemic Outbreak. A Cross-National Study. Int. J. Environ. Res. Public Health 2021, 18, 4345. [Google Scholar] [CrossRef] [PubMed]
  40. Zammitti, A.; Imbrogliera, C.; Russo, A.; Zarbo, R.; Magnano, P. The Psychological Impact of Coronavirus Pandemic Restrictions in Italy. The Mediating Role of the Fear of COVID-19 in the Relationship between Positive and Negative Affect with Positive and Negative Outcomes. Eur. J. Investig. Health Psychol. Educ. 2021, 11, 697–710. [Google Scholar] [CrossRef]
  41. Lateef, R.; Alaggia, R.; Collin-Vézina, D. A Scoping Review on Psychosocial Consequences of Pandemics on Parents and Children: Planning for Today and the Future. Child. Youth Serv. Rev. 2021, 125, 106002. [Google Scholar] [CrossRef]
  42. Dubey, S.; Biswas, P.; Ghosh, R.; Chatterjee, S.; Dubey, M.J.; Chatterjee, S.; Lahiri, D.; Lavie, C.J. Psychosocial Impact of COVID-19. Diabetes Metab. Syndr. Clin. Res. Rev. 2020, 14, 779–788. [Google Scholar] [CrossRef]
  43. Yap, M.; Wong, H.; Cats, O. Public Transport Crowding Valuation in a Post-Pandemic Era. Transportation 2023, 1–20. [Google Scholar] [CrossRef]
  44. Shibayama, T.; Sandholzer, F.; Laa, B.; Brezina, T. Impact of COVID-19 Lockdown on Commuting. Eur. J. Transp. Infrastruct. Res. 2021, 21, 70–93. [Google Scholar] [CrossRef]
  45. Turoń, K.; Kubik, A. Transport Policies and Business Practices during COVID-19 and Their Impact on the Management of New Transport Mobility Systems—Introductory Part. In Proceedings of the 12th International Scientific Conference “Business and Management 2022”, Vilnius, Lithuania, 12–13 May 2022. [Google Scholar]
  46. Cochran, A.L. Impacts of COVID-19 on Access to Transportation for People with Disabilities. Transp. Res. Interdiscip. Perspect. 2020, 8, 100263. [Google Scholar] [CrossRef]
  47. Yang, M.; Han, C.; Cui, Y.; Zhao, Y. COVID-19 and Mobility in Tourism Cities: A Statistical Change-Point Detection Approach. J. Hosp. Tour. Manag. 2021, 47, 256–261. [Google Scholar] [CrossRef]
  48. Politis, I.; Georgiadis, G.; Papadopoulos, E.; Fyrogenis, I.; Nikolaidou, A.; Kopsacheilis, A.; Sdoukopoulos, A.; Verani, E. COVID-19 Lockdown Measures and Travel Behavior: The Case of Thessaloniki, Greece. Transp. Res. Interdiscip. Perspect. 2021, 10, 100345. [Google Scholar] [CrossRef] [PubMed]
  49. Pawar, D.S.; Yadav, A.K.; Choudhary, P.; Velaga, N.R. Modelling Work- and Non-Work-Based Trip Patterns during Transition to Lockdown Period of COVID-19 Pandemic in India. Travel. Behav. Soc. 2021, 24, 46–56. [Google Scholar] [CrossRef] [PubMed]
  50. Semple, T.; Fountas, G.; Fonzone, A. Trips for Outdoor Exercise at Different Stages of the COVID-19 Pandemic in Scotland. J. Transp. Health 2021, 23, 101280. [Google Scholar] [CrossRef] [PubMed]
  51. Kumagai, N. The Impact of the COVID-19 Pandemic on Physician Visits in Japan. Front. Public Health 2021, 9, 743371. [Google Scholar] [CrossRef]
  52. Harris, J.E. Mobility Was a Significant Determinant of Reported COVID-19 Incidence during the Omicron Surge in the Most Populous, U.S. Counties. BMC Infect. Dis. 2022, 22, 691. [Google Scholar] [CrossRef]
  53. Kephart, J.L.; Delclòs-Alió, X.; Rodríguez, D.A.; Sarmiento, O.L.; Barrientos-Gutiérrez, T.; Ramirez-Zea, M.; Quistberg, D.A.; Bilal, U.; Diez Roux, A.V. The Effect of Population Mobility on COVID-19 Incidence in 314 Latin American Cities: A Longitudinal Ecological Study with Mobile Phone Location Data. Lancet Digit. Health 2021, 3, e716–e722. [Google Scholar] [CrossRef]
  54. Tokey, A.I. Spatial Association of Mobility and COVID-19 Infection Rate in the USA: A County-Level Study Using Mobile Phone Location Data. J. Transp. Health 2021, 22, 101135. [Google Scholar] [CrossRef]
  55. Chinazzi, M.; Davis, J.T.; Ajelli, M.; Gioannini, C.; Litvinova, M.; Merler, S.; Pastore y Piontti, A.; Mu, K.; Rossi, L.; Sun, K.; et al. The Effect of Travel Restrictions on the Spread of the 2019 Novel Coronavirus (COVID-19) Outbreak. Science 2020, 368, 395–400. [Google Scholar] [CrossRef] [PubMed]
  56. Aloi, A.; Alonso, B.; Benavente, J.; Cordera, R.; Echániz, E.; González, F.; Ladisa, C.; Lezama-Romanelli, R.; López-Parra, Á.; Mazzei, V.; et al. Effects of the COVID-19 Lockdown on Urban Mobility: Empirical Evidence from the City of Santander (Spain). Sustainability 2020, 12, 3870. [Google Scholar] [CrossRef]
  57. Vannoni, M.; McKee, M.; Semenza, J.C.; Bonell, C.; Stuckler, D. Using Volunteered Geographic Information to Assess Mobility in the Early Phases of the COVID-19 Pandemic: A Cross-City Time Series Analysis of 41 Cities in 22 Countries from March 2nd to 26th 2020. Global Health 2020, 16, 85. [Google Scholar] [CrossRef] [PubMed]
  58. Shortall, R.; Mouter, N.; van Wee, B. COVID-19 and Transport. A Review of Factors of Relevance to the Design of Measures and Their Effects Worldwide. Eur. J. Transp. Infrastruct. Res. 2022, 22, 118–130. [Google Scholar]
  59. Cho, S.-H.; Park, H.-C. Exploring the Behaviour Change of Crowding Impedance on Public Transit Due to COVID-19 Pandemic: Before and After Comparison. Transp. Lett. 2021, 13, 367–374. [Google Scholar] [CrossRef]
  60. Wolański, M.; Czerliński, M.; Kozłowska, P.; Paczek, P.; Makurat, D.; Kaczorowski, J. Analiza Wpływu COVID-19 Na Transport Publiczny w Miastach; Raport Końcowy Centrum Unijnych Projektów Transportowych: Warszawa, Poland, 2021. [Google Scholar]
  61. Bouhouras, E.; Basbas, S.; Ftergioti, S.; Paschalidis, E.; Siakantaris, H. COVID-19′s Pandemic Effects on Bike Sharing Systems: A New Reality for Urban Mobility? Appl. Sci. 2022, 12, 1230. [Google Scholar] [CrossRef]
  62. Hook, H.; De Vos, J.; Van Acker, V.; Witlox, F. Evolutions in undirected travel (satisfaction) during the COVID-19 pandemic. Transp. Res. Part F: Traffic Psychol. Behav. 2023, 94, 99–113. [Google Scholar] [CrossRef]
  63. Wiśniewski, S.; Borowska-Stefańska, M.; Dulebenets, M.; Kowalski, M.; Masierek, E. Changeability of Transport Behaviour in a Large City from the Perspective of Working Days and Sundays: The Case of Łódź, Poland. Morav. Geogr. Rep. 2023, 31, 14–26. [Google Scholar] [CrossRef]
  64. GUS. Główny Urząd Statystyczny. 2022. Available online: https://stat.gov.pl/ (accessed on 15 January 2024).
  65. Wójcik, S. Determinanty Zachowań Transportowych Mieszkańców Łodzi; Wydawnictwo Uniwersytetu Łódzkiego: Łódź, Poland, 2020. [Google Scholar]
  66. ITS Prezeglad. Aktualizacja Studium Systemu Transportowego Dla Miasta Łodzi; ITS Prezeglad: Łódź, Poland, 2013. [Google Scholar]
  67. Borowska-Stefańska, M.; Dulebenets, M.A.; Horňák, M.; Kowalski, M.; Kozłowski, D.; Turoboś, F.; Wiśniewski, S. Assessing the Effects of Sunday Shopping Restrictions on Urban Mobility Patterns in Poland. J. Transp. Geogr. 2023, 113, 103741. [Google Scholar] [CrossRef]
  68. Szarata, A. Wyniki Badań Podróży w Krakowie–KBR 2013. Transp. Miej. Reg. 2015, 5, 4–8. [Google Scholar]
  69. Tom Tom Traffic Index. 2023. Available online: https://www.tomtom.com/traffic-index/ (accessed on 15 January 2024).
  70. Richardson, A.J.; Ampt, E.S.; Meyburg, A.H. Survey Methods for Transport Planning; Eucalyptus Press: Melbourne, Australia, 1995. [Google Scholar]
  71. Kowalski, M.; Wiśniewski, S. Natężenie Ruchu a Zagospodarowanie Łodzi–Zarys Problematyki w Świetle Danych z Obszarowego Systemu Sterowania Ruchem. Pr. Kom. Geogr. Komun. PTG 2017, 20, 20–36. [Google Scholar] [CrossRef]
  72. Oskarbski, J.; Miszewski, M.; Zawisza, M.; Żarski, K. Zasilanie Modeli Systemów Transportowych Danymi z Systemu Zarządzania Ruchem. Zesz. Nauk. Tech. Stowarzyszenia Inżynierów Tech. Komun. W Krakowie. Ser. Mater. Konf. 2014, 1, 279–290. [Google Scholar]
  73. Szarata, A. Budowa Modelu Symulacyjnego Województwa Małopolskiego–Model Popytu. Transp. Miej. Reg. 2013, 10, 17–21. [Google Scholar]
  74. Bernardin, V.L.; Trevino, S.; Slater, G.; Gliebe, J. Simultaneous Travel Model Estimation from Survey Data and Traffic Counts. Transp. Res. Rec. 2015, 2494, 69–76. [Google Scholar] [CrossRef]
  75. Blair, R.C.; Higgins, J.J. A Comparison of the Power of Wilcoxon’s Rank-Sum Statistic to That of Student’s t Statistic under Various Nonnormal Distributions. J. Educ. Stat. 1980, 5, 309–335. [Google Scholar] [CrossRef]
  76. Bonnel, P.; Le Nir, M. The Quality of Survey Data: Telephone versus Face-to-Face Interviews. Transportation 1998, 25, 147–167. [Google Scholar] [CrossRef]
  77. Borowska-Stefańska, M.; Kowalski, M.; Kurzyk, P.; Mikušová, M.; Wiśniewski, S. Application of Intelligent Transportation Systems in Analyses of Human Spatial Mobility in Cities. Pr. Kom. Geogr. Komun. PTG 2021, 24, 7–30. [Google Scholar] [CrossRef]
  78. Li, S.; Dragicevic, S.; Castro, F.A.; Sester, M.; Winter, S.; Coltekin, A.; Pettit, C.; Jiang, B.; Haworth, J.; Stein, A.; et al. Geospatial Big Data Handling Theory and Methods: A Review and Research Challenges. ISPRS J. Photogramm. Remote Sens. 2016, 115, 119–133. [Google Scholar] [CrossRef]
  79. Kowalski, M.; Wiśniewski, S. Centrum Handlowe Jako Czynnik Ruchotwórczy w Transporcie Samochodowym–Przykład Portu Łódź. Prz. Geogr. 2017, 89, 617–639. [Google Scholar] [CrossRef]
  80. Po, L.; Rollo, F.; Bachechi, C.; Corni, A. From Sensors Data to Urban Traffic Flow Analysis. In Proceedings of the 2019 IEEE International Smart Cities Conference (ISC2), Casablanca, Morocco, 14–17 October 2019; pp. 478–485. [Google Scholar]
  81. Borowska-Stefańska, M.; Kowalski, M.; Kurzyk, P.; Sahebgharani, A.; Wiśniewski, S. Spatiotemporal Changeability of the Load of the Urban Road Transport System under Permanent and Short-Term Legal and Administrative Retail Restrictions. Sustainability 2022, 14, 5137. [Google Scholar] [CrossRef]
  82. Borowska-Stefańska, M.; Kowalski, M.; Kurzyk, P.; Sahebgharani, A.; Sapińska, P.; Wiśniewski, S.; Goniewicz, K.; Dulebenets, M.A. Assessing the Impacts of Sunday Trading Restrictions on Urban Public Transport: An Example of a Big City in Central Poland. J. Public Trans. 2023, 25, 100049. [Google Scholar] [CrossRef]
  83. Christidis, P.; Christodoulou, A.; Navajas-Cawood, E.; Ciuffo, B. The Post-Pandemic Recovery of Transport Activity: Emerging Mobility Patterns and Repercussions on Future Evolution. Sustainability 2021, 13, 6359. [Google Scholar] [CrossRef]
  84. MPK. Sprawozdanie z Działalności MPK-Łódź Spółka z o.o. Za 2021 Rok—Informacje Rzeczowo-Finansowe; Miejskie Przedsiębiorstwo Komunikacyjne: Łódź, Poland, 2022. [Google Scholar]
  85. Zhao, P.; Gao, Y. Public Transit Travel Choice in the Post COVID-19 Pandemic Era: An Application of the Extended Theory of Planned Behavior. Travel. Behav. Soc. 2022, 28, 181–195. [Google Scholar] [CrossRef] [PubMed]
  86. Ong, F.; Loa, P.; Nurul Habib, K. A Behavioural Analysis of Post-Pandemic Modality Profiles for Non-Commuting Trips in the Greater Toronto Area. Travel. Behav. Soc. 2024, 34, 100690. [Google Scholar] [CrossRef]
  87. Liu, Z.; Wang, X.C.; Dai, J.; Li, X.; Li, R. Impacts of COVID-19 Pandemic on Travel Behavior in Large Cities of China: Investigation on the Lockdown and Reopening Phases. J. Transp. Eng. A Syst. 2022, 148, 05021011. [Google Scholar] [CrossRef]
  88. Ehsani, J.P.; Michael, J.P.; Duren, M.L.; Mui, Y.; Porter, K.M.P. Mobility Patterns Before, During, and Anticipated after the COVID-19 Pandemic: An Opportunity to Nurture Bicycling. Am. J. Prev. Med. 2021, 60, e277–e279. [Google Scholar] [CrossRef]
  89. Ahlers, E.; Mierich, S.; Zucco, A. Homeoffice: Was wir aus der Zeit der Pandemie für die zukünftige Gestaltung von Homeoffice Lernen; WSI Report No. 65, Hans-Böckler-Stiftung; Wirtschafts- und Sozialwissenschaftliches Institut (WSI): Düsseldorf, Germany, 2021; Available online: http://hdl.handle.net/10419/233635 (accessed on 15 January 2024).
  90. Kellermann, R.; Sivizaca Conde, D.; Rößler, D.; Kliewer, N.; Dienel, H.-L. Mobility in Pandemic Times: Exploring Changes and Long-Term Effects of COVID-19 on Urban Mobility Behavior. Transp. Res. Interdiscip. Perspect. 2022, 15, 100668. [Google Scholar] [CrossRef]
Figure 1. Scheme of research procedure.
Sustainability 16 02568 g001
Figure 2. Temporal differences in changes in the average number of vehicles compared to 2019 on weekdays (top) and weekends (bottom) in 2020, 2021 and 2022. Source: own study based on data provided by the city’s ITS operator—the city authorities of Łódź.
Sustainability 16 02568 g002
Figure 3. Spatial differentiation of the average daily number of vehicles on the Łódź road network in 2019–2022. Source: own study based on data provided by the city’s ITS operator—the city authorities of Łódź.
Sustainability 16 02568 g003
Figure 4. Diversification of the number of journeys by public transport vehicles on Saturdays in Łódź in the period between 25 January 2020 and 4 December 2021. Source: own study based on data provided by the city’s ITS operator—the city authorities of Łódź.
Sustainability 16 02568 g004
Figure 5. Diversification of the number of journeys by public transport vehicles on Sundays in Łódź in the period between 5 January 2020 and 12 December 2021. Source: own study based on data provided by the city’s ITS operator—the city authorities of Łódź.
Sustainability 16 02568 g005
Figure 6. Diversification of the number of journeys by public transport vehicles on working days in Łódź in the period between 27 January 2020 and 21 February 2021. Source: own study based on data provided by the city’s ITS operator—the city authorities of Łódź.
Sustainability 16 02568 g006
Figure 7. Diversification of the number of journeys by public transport vehicles in peak and off-peak periods on working days in Łódź in the period between 27 January 2020 and 21 February 2021. Source: own study based on data provided by the city’s ITS operator—the city authorities of Łódź.
Sustainability 16 02568 g007
Figure 8. Average number of tickets validated in trams (A,B) and buses (C,D) by route against the background of population density of Łódź in 2019 (A,C) and 2020 (B,D). Source: own study based on data provided by the city’s ITS operator—the city authorities of Łódź.
Sustainability 16 02568 g008
Figure 9. Temporal differentiation in the number of tickets validated in local public transport vehicles in selected weeks of 2021 and 2022 in Łódź. Source: own study based on data provided by the city’s ITS operator—the city authorities of Łódź.
Sustainability 16 02568 g009
Figure 10. Spatial differentiation in the number of tickets validated in local public transport vehicles in selected weeks of 2021 and 2022 in Łódź. Source: own study based on data provided by the city’s ITS operator—the city authorities of Łódź.
Sustainability 16 02568 g010
Figure 11. Average frequency of working from home in 2019 and 2022. Source: own study based on the results from the surveys.
Sustainability 16 02568 g011
Figure 12. Average frequency of working outside the home in 2019 and in 2022. Source: own study based on the results from the surveys.
Sustainability 16 02568 g012
Figure 13. Average trip duration for the motivation of tourism in 2019 and in 2022. Source: own study based on the results from the surveys.
Sustainability 16 02568 g013
Table 1. Changes in the structure of transport modes in Łódź.
Transport ModesShare of Transport Modes [%]
Year
199520132021
on foot2727.410.8
public transport5245.515.8
car2024.670.7
bicycle11.81.3
Source: data from [63,65,66].
Table 2. Schematic structure of the questionnaire.
Respondent’s particularsHouseholdTotal number of members
No. of people under 6 years of age
No. of cars
No. of bicycles (not including children’s bikes)
No. of motorcycles/mopeds
Net income per capita
RespondentGender
Age
Address of residence
Type of housing
Education
Driving licence
Primary occupation
Place of employment/school
Questions about transport behaviour in 2019 and 2022 Changes in transport behaviourFrequency of each daily mobility in 2019
Frequency of each daily mobility in 2022
Changes in frequency of each daily mobility
Reasons for changes in frequency of each daily mobility
Preferred means of transport of each daily mobility in 2019
Preferred means of transport of each daily mobility in 2022 Changes in preferred means of transport of each daily mobility
Reasons for changes in preferred means of transport of each daily mobility
Time of displacements of each daily mobility in 2019
Time of displacements of each daily mobility in 2022
Changes in time of displacements of each daily mobility
Reasons for changes in time of displacements of each daily mobility
Table 3. Demographic characteristics of respondents and inhabitants 18+ of Łódź.
Characteristics N = 500Total Sample [%]Characteristics of Inhabitants 18+ of Łódź (2021) Total
[%]
Gender Gender
 Female56 Female (18+)55.42
 Male44 Male (18+)44.57
Age Age
 18–2910.6 18–2914.10
 30–3915.2 30–3918.19
 40–4917 40–4917.76
 50–5912.6 50–5913.05
 60 and over44.6 60 and over36.90
Source: own study based on the results from the surveys.
Table 4. The Wilcoxon signed-rank test showing the frequency of each daily mobility.
Daily MobilityThe Wilcoxon Result Statisticp-Value
remote working299.00.0006039711729740746
working outside the home1890.00.011091331445240387
pursuing religious activities119.00.011091331445240387
entertainment and culture3854.50.0009923016731719998
tourism3339.00.028034371141600654
recreation/sports and hobbies2511.00.041368595468895326
Source: own study based on the results from the surveys.
Table 5. The Wilcoxon signed-rank test showing the trip duration of each daily mobility.
Daily MobilityThe Wilcoxon Result Statisticp-Value
working outside the home3487.50.028660785532901547
entertainment and culture927.51.060176566858605 × 10−6
tourism971.54.222586356576828 × 10−11
recreation/sports and hobbies1372.50.02083562081460548
eating out1838.00.0034904468435099914
dropping off or collecting other persons125.50.026884239798445307
school education7.00.020231306339527272
Source: own study based on the results from the surveys.
Disclaimer/Publisher’s Note: The statements, opinions and data contained in all publications are solely those of the individual author(s) and contributor(s) and not of MDPI and/or the editor(s). MDPI and/or the editor(s) disclaim responsibility for any injury to people or property resulting from any ideas, methods, instructions or products referred to in the content.

