Article

Assessing the Carbon Footprint of Plastic Bottle Blow Mold Based on Product Life Cycle for Managing the Mold Industry’s Carbon Emission

by
Abdurrahman Yavuzdeğer
1,*,
Burak Esenboğa
2,
Kübra Tümay Ateş
3,
Özge Demirdelen
4 and
Mehmet Yüksel
5
1
Department of Energy Systems Engineering, Adana Alparslan Türkeş Science and Technology University, 01250 Adana, Türkiye
2
Department of Electrical and Electronics Engineering, Adana Alparslan Türkeş Science and Technology University, 01250 Adana, Türkiye
3
Department of Industrial Engineering, Çukurova University, 01330 Adana, Türkiye
4
Department of Law, Çağ University, 33800 Mersin, Türkiye
5
Petka Mold Industry, 01100 Adana, Türkiye
*
Author to whom correspondence should be addressed.
Sustainability 2024, 16(5), 2149; https://doi.org/10.3390/su16052149
Submission received: 26 January 2024 / Revised: 26 February 2024 / Accepted: 27 February 2024 / Published: 5 March 2024

Abstract

:
Calculating the carbon footprint (CF) holds paramount importance in today’s world as it provides a tangible measure of our impact on the environment. In the corporate realm, businesses armed with CF data can optimize operations, reduce waste, and adopt greener technologies, leading to both environmental and economic benefits. In this study, carbon emissions—a significant global issue—are investigated through the lens of the ISO 14067-ISO Product Based Carbon Footprint (CF) standard, focusing on the operations of a mold company. The primary innovation lies in meticulously tracing every stage of plastic bottle blow mold production, the most prevalent product in the mold industry, from its raw material input to its final form as a mold in the factory. Subsequently, detailed calculations and analysis are conducted to quantify the carbon footprint associated with this process and its impact on the environment. The calculated CF for one ton of PBBM produced by Petka Mold Industry is presented. This study fills a critical gap in the literature by providing a holistic understanding of the carbon footprint of plastic bottle blow mold (PBBM) production, thereby offering valuable insights for managing carbon emissions and promoting sustainability within the mold industry. By integrating a life cycle product carbon footprint thinking into industrial practices, a greener, more sustainable future can be paved, mitigating the ecological footprint of the PBBM.

1. Introduction

1.1. Background

Global warming, an alarming consequence of the greenhouse effect, stands as a profound threat to the delicate ecological balance of our planet and human societies. The release of carbon dioxide (CO2) and other greenhouse gases forms a heat-trapping blanket in the atmosphere, resulting in a gradual increase in Earth’s average temperature. This phenomenon not only disrupts ecosystems but also leads to habitat loss, putting numerous plant and animal species at risk [1,2]. Addressing this crisis necessitates immediate and concerted global efforts. Key measures include the widespread adoption of renewable energy sources, extensive reforestation initiatives, the promotion of sustainable agricultural practices, and international collaboration aimed at reducing greenhouse gas emissions. These collective actions are crucial for mitigating the adverse effects of global warming on our planet and safeguarding the well-being of future generations [3,4,5].
The global effort to combat climate change has been significantly influenced by pivotal international agreements, conventions, and protocols aimed at mitigating the impact of greenhouse gas emissions. The initiation of coordinated international endeavors can be traced back to the United Nations Framework Convention on Climate Change (UNFCCC) in 1992 [6]. Its primary goal is to stabilize greenhouse gas concentrations in the atmosphere to prevent detrimental interference with the climate system. Following the UNFCCC, the Kyoto Protocol, adopted in 1997, marked a significant step by introducing mandatory emission reduction targets for developed countries. These nations committed to collectively reducing emissions by 5.2% below 1990 levels during the commitment period from 2008 to 2012 [7]. However, recognizing the need for a more inclusive approach, the Paris Agreement emerged in 2015 as a groundbreaking milestone [8]. Unlike its predecessors, this agreement involves all nations, both developed and developing, in a global endeavor to combat climate change. The core objective of the Paris Agreement is to limit the global temperature increase to well below 2 degrees Celsius above pre-industrial levels, with an additional aspiration to cap the increase at 1.5 degrees Celsius [9]. Under this agreement, countries voluntarily submit Nationally Determined Contributions (NDCs), outlining their climate action plans. This process promotes transparency, accountability, and collective progress toward a sustainable, low-carbon future. These conventions and protocols stand as a testament to international collaboration and serve as the foundation of global efforts to address the pressing challenges posed by climate change. They reflect a collective commitment to finding solutions and working together to ensure a sustainable and resilient future for the planet. The surge in global interest in sustainability is a direct response to the escalating challenges of global warming and climate change, attributed to the rising levels of greenhouse gases [10,11]. The sustainability paradigm offers a means to produce goods with reduced energy consumption, minimal impact on natural resources, and without environmental pollution. Additionally, it advocates for the reuse or recycling of products at the end of their lifespan.
The mold industry plays a vital role in this context, transforming raw materials like steel, iron, zinc, and aluminum into high-value products through various methods. However, this process demands substantial amounts of labor, energy, and water, with a predominant reliance on fossil fuels for energy. The imminent depletion of these resources, coupled with the significant environmental impact of greenhouse gas emissions and escalating unit energy prices, has propelled the mold industry, like other sectors, to prioritize increasing energy efficiency and incorporating renewable energy sources into production. Blowing molds, also known as pet-shaped molds, represent a prevalent mold type, particularly in packaging production. These molds, crucial for mass production, shape hollow plastic materials such as bottles, tubes, canisters, fuel tanks, or jars. Typically crafted from alloy materials like steel, iron, zinc, and aluminum, blowing molds are engineered to meet the growing consumer demand for more efficient and practical solutions. This underscores the industry’s commitment to adapting to sustainable practices in response to the global call for environmental responsibility [12].
In this context, it becomes evident that blowing molds play a crucial role in streamlining manufacturing processes, yielding substantial savings in labor, energy, time, and materials. The adoption of blowing molds not only facilitates automation in manufacturing but also enhances the quality of blow molding processes, reducing error rates and significantly shortening production times. Consequently, end users experience faster and more abundant fulfillment of their demands, resulting in the production of healthier, error-free products. The Life Cycle Assessment (LCA) emerges as an indispensable and systematic methodology for comprehensively evaluating the environmental impacts associated with products, processes, or services across their entire life cycle [13,14,15]. This approach meticulously considers all stages, encompassing raw material extraction, manufacturing, transportation, usage, and eventual disposal or recycling. Offering a holistic perspective, LCA unveils the environmental footprint linked to a specific product or activity. It examines various environmental aspects, including energy consumption, resource depletion, greenhouse gas emissions, water usage, and pollution. Beyond pinpointing significant environmental impacts, LCA serves as a tool for identifying improvement opportunities. Its outcomes are invaluable for decision makers, empowering them to make informed choices by comparing different products or processes in terms of their environmental performance. Industries, businesses, and policymakers increasingly rely on LCA as a strategic tool to design and implement sustainable solutions. This methodology guides the development of eco-friendly technologies and practices, acting as a framework in our collective pursuit of a more sustainable future. By striking a balance between human needs and environmental preservation, LCA plays a pivotal role in shaping a path toward sustainable and harmonious coexistence [16].

1.2. Literature Review

Within the existing literature, numerous studies have delved into the environmental implications of different mold materials throughout their life cycles. In a study by Vita et al., a comprehensive analysis was conducted on the autoclave and pressurized bag molding processes, encompassing both economic and environmental perspectives. The researchers utilized the standardized Life Cycle Assessment (LCA) methodology to evaluate the environmental impacts associated with these molding processes. The study also involved a comparative assessment of the costs linked to both production techniques, employing parametric methods for estimation and comparison. Various scenarios were meticulously considered, encompassing diverse production batches, mold production techniques, and end-of-life alternatives. The findings consistently pointed towards the autoclave process exhibiting a lower environmental impact compared to the pressurized bag molding process [17]. In a comparable investigation, Forcellese et al. conducted a comparative Life Cycle Assessment (LCA) to scrutinize the distinctions between pressure bag molding and autoclave bag molding techniques employed in the production of automotive components utilizing carbon fiber-reinforced plastic (CFRP). Through a thorough assessment of environmental factors under different scenarios, the study unveiled that the autoclave bag molding process, specifically utilizing a composite mold and polyurethane master, demonstrated the highest efficiency. Interestingly, the autoclave bag molding process employing an aluminum mold emerged as the most environmentally sustainable option [18].
Wegmann et al. explored three innovative thermoplastic impregnation methods designed for automotive applications, comparing them with traditional techniques like resin compression and resin transfer molding using glass or carbon fibers, as well as metal processes, through a Life Cycle Assessment (LCA). The comprehensive analysis covered various stages of the process, encompassing raw material extraction, mold production, actual manufacturing, and energy losses. The study also considered the end-of-life stage, evaluating the energy used for recycling and incineration of the carbon bonnet. The results underscored the potential of these new thermoplastic impregnation methods for manufacturing automobile components. Notably, the energy required for producing a thermoplastic car bonnet was found to be comparable to that needed for steel production, indicating their practical viability [19].
Kafara et al. conducted a comparison of environmental effects associated with traditional and additive manufacturing techniques for producing mold cores in CFRP production. The study involved four separate LCAs for different mold core manufacturing processes, including casting with low-melting alloy, milling using plaster-like materials such as Aquapour, additive manufacturing using High-Impact Polystyrene (HIPS), and additive manufacturing with powder materials like salt. The findings revealed that additive manufacturing processes significantly outperformed traditional methods, particularly in terms of resource conservation [20].
In a study by Gouveia et al., a comparison was made between direct energy deposition technology and traditional iron casting for repairing damaged glass bottle molds. The evaluation included both environmental and economic factors, incorporating both LCA and life cycle costing analyses for each approach. The research aimed to provide a comprehensive understanding of the strengths and limitations of these systems. The results, particularly in the hybrid repair scenario, were promising, indicating a significant reduction in environmental impacts and life cycle costs by avoiding the need to produce a new mold. Additionally, this approach unveiled unexpected economic advantages [21].
Burchart-Korol conducted a Life Cycle Assessment (LCA) of steel production in Poland, examining both integrated steel production and electric arc furnace routes. The study identified key sources of environmental impact and proposed pollution prevention methods for the most environmentally taxing steelmaking processes. Utilizing data from existing steel plants in Poland, the life cycle inventory revealed that pig iron production in blast furnaces significantly contributes to greenhouse gas emissions and fossil fuel consumption in the national integrated steel production route. Similarly, in the electric arc furnace route, a notable impact was attributed to electricity consumption. The research also explored alternative fuel consumption in a national iron ore sinter plant. The findings underscore the importance of pollution prevention techniques, particularly through raw material substitutions in iron-making processes, to mitigate environmental impacts in the iron and steel industry [22].
Over the past four decades, global plastic production has seen a significant surge, quadrupling in volume. If this trend persists, projections indicate that greenhouse gas emissions from plastics could constitute 15% of the global carbon budget by 2050. Despite this concerning forecast, comprehensive assessments of strategies to reduce the life-cycle emissions of plastics on a global scale have been lacking. Zhang and Suh gathered data on ten traditional and five bio-based plastics, evaluating their greenhouse gas emissions under various mitigation methods. The study highlighted that substituting fossil fuels with biomass could further reduce emissions significantly. This research underscores the urgency of integrating strategies across energy, materials, recycling, and demand management to effectively address the escalating life-cycle greenhouse gas emissions resulting from plastics [23].
Baldowska-Witos et al. underscored the importance of understanding the environmental impact associated with shaping beverage bottles, specifically analyzing distinct stages of the life cycle of a blow molding machine used in bottle production. Among various impact categories studied, marine aquatic ecotoxicity was identified as posing the highest potential harm during the bottle manufacturing process. A novel aspect of this research was providing updated and detailed geographic data related to bottle production in Poland. The study suggests focusing efforts on water management, emphasizing enhanced water use efficiency and recycling in both bottling and bottle shaping processes. Additionally, the research recommends implementing a management system for wastewater from the production process and extensively using rainwater to minimize pollution [24].
Alhazmi et al. under consideration examines progress in LCA, focusing on six key parameters: goals and scope, functional units, impact assessment categories, system boundaries, geographical context, and uncertainty analysis. The review emphasizes LCA’s potential in shaping an efficient waste management framework during waste recycling development. When comparing LCA studies, thorough consideration of methodologies, system goals, boundaries, and local factors is crucial [25]. Mannheim conducted an environmental assessment of polypropylene and PP-PE-PET (Polypropylene-Polyethylene- Polyethylene terephthalate) mixed-plastic products throughout their life cycle, with a specific focus on the looping method during the production stage. The research seeks to provide insights for optimizing injection-molding processes, aiming for more environmentally favorable outcomes. The study reveals that environmental impact categories are notably high during the production stage. The findings aim to contribute to a better understanding of the life cycle of plastic products in the European Union, providing insights for more sustainable practices in the plastic manufacturing industry [26]. Aryan et al. employed the LCA technique to evaluate the potential environmental impacts of various plastic waste management scenarios in Dhanbad City, India, focusing on two major plastic wastes: PET and PE. Four scenarios, including recycling of PET and PE waste, were assessed and compared. Notably, the study suggests that recycling PE waste has lower environmental impacts than recycling PET waste, emphasizing the need to encourage PE waste recycling, potentially through the installation of PE waste recyclers or collectors in public places in India. The findings provide valuable insights for policymakers working towards improved plastic waste management strategies [27]. Arena et al. examined the Italian system of plastic packaging waste recycling in operation until 2001, specifically focusing on post-consumer PE and PET liquid containers. The research, conducted in collaboration with the Italian Consortium for Packaging (CONAI) and major Italian companies in the field, analyzes and quantifies various phases of the recycling process, including collection, compaction, sorting, reprocessing, and refuse disposal. The success of the study leads to an extension of the joint research program with CONAI for an additional three years. The study contributes to understanding and optimizing waste management practices in Italy [28].
Bałdowska-Witos et al. introduced a fresh, systematic method for examining uncertainty and sensitivity within life cycle assessment, specifically tailored to aid the development of eco-friendly food packaging materials. Demonstrating the application of this approach, a real-world experiment utilizing data from bottle production technology is presented. The findings offer valuable insights into the variability of life cycle assessment metrics related to global warming [29]. Chen et al. conducted a comparative analysis of the environmental impact throughout the life cycle of PET bottles made from bio-based materials against those made entirely from fossil fuels, as well as those utilizing a blend of bio-based and fossil-based materials. Through an attributional LCA and sensitivity analysis, the study evaluates the environmental footprint from raw material extraction to product manufacturing across twelve different scenarios. The findings indicate that bio-based PET bottles demonstrate inferior performance in other environmental categories such as ecotoxicity and ozone depletion effects. [30]. A meta-analytical review examined 14 LCA research papers covering the period from 2010 to 2022, focusing on the environmental impact of PET bottles. Following PRISMA guidelines, the review encompasses six key phases: raw material production (MP), bottle production (BP), distribution and transportation (DT), collection and transport (CT), waste management (WM), and environmental benefits (EB). By standardizing the data and using global warming potential as the primary indicator, the study establishes a consistent functional unit, revealing an average emission rate of 5.1 kg CO2 equivalent per 1 kg of PET bottles [31]. Olatayo et al. conducted a comprehensive assessment of the life cycle impacts of single-use PET bottles and a reusable PET bottle, considering consumption habits in South Africa and the material flow within urban environments. This thorough analysis, tailored to local conditions, is crucial for accurately assessing environmental impacts. Across 13 impact categories examined, the reusable PET bottle consistently demonstrated lower environmental impact compared to the single-use bottle. Insights gathered from this evaluation of alternatives to plastic water bottles offer valuable guidance for policymakers and manufacturers, empowering them to make informed decisions and prioritize enhancements in life cycle impacts [32].

1.3. The Legal Framework of the Relationship between Green Steel and the European Green Deal

The European Union (EU) has adopted a new growth strategy with the European Green Deal. It is possible to say that the EU is in a transformation [33]. The European Green Deal can be considered the first step taken in this transformation and the beginning of the path. It is an indication of the mentioned situation that progress will be made step by step with a series of legal regulations regarding the ambitious targets set out by the European Green Deal [34]. It is said that it will be a necessity to put the legal regulations in force and drafted in line with the European Green Deal. It will be indispensable for the sectors that have trade relations with the EU to follow the regulations and prepare themselves for the obligations imposed and to harmonize themselves [35].
EU Commission President Ursula von der Leyen stated that Europe should move towards a zero-pollution target for the health of its citizens, children, and grandchildren and that the European Union Commission should put forward a cross-cutting strategy to protect the health of citizens from environmental degradation and pollution [36]. EU, “Pathway to a Healthy Planet for All, EU Action Plan: Towards Zero Pollution for Air, Water and Soil” has set out the 2030 Targets within the framework of air, water, soil, biodiversity, noise, and waste. With the 2050 Zero Pollution Vision, “What kind of environment should we have?” determined the scope of the question [37]. The action steps to be taken on these issues are addressed as improving human health, supporting change throughout society, protecting natural ecosystems and biodiversity, enforcement of pollution-related laws more strictly and with sanctions, promoting knowledge and innovation, supporting digital solutions for zero pollution, reducing pollution caused by manufacturing and consumption, and minimizing the EU’s pollution footprint abroad and promoting global change [38].
Action Plan, Article 191/2 of the Treaty on the Functioning of the EU [39] for better implementation of the “polluter pays” principle and as a result, zero emissions and to maximize the joint power between the zero-pollution target, announced that relevant instruments and incentives are supported to complete the phase-out of the concept of “pollution without paying”. Here, the polluter does not only bear the costs of preventing and eliminating pollution. It is also held responsible for the environmental damage caused by pollution [40]. More clearly, the polluter bears the costs of both preventing and eliminating pollution. In addition, it also compensates for the damages caused by pollution. The damages mentioned are related to people, human assets, and nature. The fight against pollution is also for justice and equality. Pollution has harmful aspects that affect human health and future generations [41]. The involvement of law here creates the obligation to make a bilateral evaluation of the polluter and the affected [42].
The EU, which aims to turn the transition to a green economy into an economic and industrial opportunity for Europe on its way to becoming the first climate-neutral continent, announced many of its policies with the “Fit for 55” legislative amendment package published on 14 July 2021, and at the same time, especially the climate law and also announced many new regulations, including the carbon border tax [43]. The European Climate Law aims to make it a legal obligation to achieve the EU’s climate target of reducing EU emissions by at least 55% by 2030. EU countries are also working on new legislation to achieve this goal and make the EU climate-neutral by 2050. To create a low-carbon economy, the EU has focused on ensuring the transition to energy obtained from zero carbon emissions and renewable resources in every field, from production to consumption. These policies, targets, and action steps have also confronted international trade with some additional costs and liabilities [44]. The Carbon Border Adjustment Mechanism, which envisages taxing the products to be exported to the EU market according to their carbon intensity, will affect world trade due to the size and importance of the EU market [45]. The EU Commission is committed to supporting the implementation of the Borderline Carbon Regulation Mechanism transition period, which will start on 1 October 2023 and last until 31 December 2025, and published the Carbon Border Adjustment Mechanism Implementation Regulation on 17 August 2023 to provide guidance. The sectors focused on within the scope of the Border Carbon Regulation Mechanism are iron and steel, cement, aluminum, fertilizer, electricity, and hydrogen, which have the highest carbon risk in the first stage [46].
Regarding steel, which is one of the sectors with high carbon emissions, the August 2023 global crude steel production data of the World Steel Association increased by 2.2 percent compared to August 2022, reaching 152.6 million tons, and shared that during the said period, China’s production increased by 3.2 percent and reached 86.4 million tons, while Japan’s production decreased by 2.9 percent to 7.1 million tons. While Germany’s production decreased by 1 percent to 2.8 million tons, the production of the USA increased by 1.1 percent and reached 7 million tons [47]. As can be seen, the global steel demand is very high [48]. Steel production is an energy-intensive process due to steel as a basic raw material (made by heating coal at high temperatures) and the need for fossil fuels for operations. Steel production also produces harmful and polluting compounds such as carbon monoxide (CO), nitrogen oxide (N2O), and sulfur dioxide (SO2), which affect soil and vegetation and contribute to acid rain. In this state, the size of the steel industry and steel production seem to pose a major problem in terms of climate change [49]. The iron and steel industry alone is responsible for a high proportion of global CO2 emissions. For this reason, a road map is being created to reduce carbon emissions in steel production and industry [50], and it is one of the sectors focused on within the scope of the Carbon Border Adjustment Mechanism.
The world steel defines low-carbon steel as “steel produced using technologies and practices that result in significantly less CO2 emissions than in conventional steel production” [51]. The Carbon Border Adjustment Mechanism will initially be applied to the import of products with high carbon emissions. Importers will be obliged to report the greenhouse gas emissions [52] that occur during the production process of the products, without incurring any financial liability. The data obtained in this process will play a role in determining the final rules for the implementation of the Carbon Border Adjustment Mechanism after 2026 [53].

1.4. Research Aims

The mold industry, a crucial component of contemporary manufacturing, has faced increased scrutiny due to its environmental implications, especially concerning climate change and carbon emissions. While various studies investigate the life cycle impacts of plastic products, there is no research available in the existing literature regarding the carbon footprint of Plastic Bottle Blow Mold based on product life cycle. The lack of specific research on the environmental impact of PBBM is a noteworthy gap in the literature, considering the widespread utilization of plastic bottles across diverse sectors. This paper seeks to fill this gap by conducting an in-depth product life cycle carbon footprint to quantify the Carbon Footprint (CF) associated with PBBM, thereby providing insights into their environmental implications. Additionally, the study aims to propose strategies for mitigating the ecological footprint of PBBM, contributing to a more sustainable and environmentally conscious plastic manufacturing industry.
The distinctive contribution of this paper arises from the analyses and calculations performed, laying the foundation for future, more targeted studies. These studies aim to pinpoint and mitigate carbon emissions at various stages, promoting sustainability for both life and the environment. The results are anticipated to further amplify the impact of such efforts. Combining both life cycle assessment (LCA) and ISO-14067 Product-Based Carbon Footprint calculations [54], this study meticulously tracked the carbon emission processes of the plastic bottle blow mold, conducting comprehensive calculations throughout.

2. Materials and Methods

Petka initiated its operations in 2005, when seasoned entrepreneurs with extensive experience joined forces. The company is based in Adana and operates from a state-of-the-art 3700 m2 facility, showcasing innovation. Throughout the years, the company has honed its expertise in manufacturing plastic preform molds, PBBM, and single-stage molds. The products produced by the company are shown in Figure 1.
The company produces blow molds for plastic bottles, which are generally used in large quantities in the packaging industry. Blowing molds are one of the manufacturing processes that require serious experience and a high level of precision. Blowing molds, which are perfectly designed according to requests, needs, and machine models, are manufactured with the aim of maximum strength and low weight. Blowing molds are used in the production of plastic products. In these molds, as in other molds, there is a volumetric cavity that gives the product its shape. Preformed and heated tubular (preform) polymer material is inflated in the mold cavity.

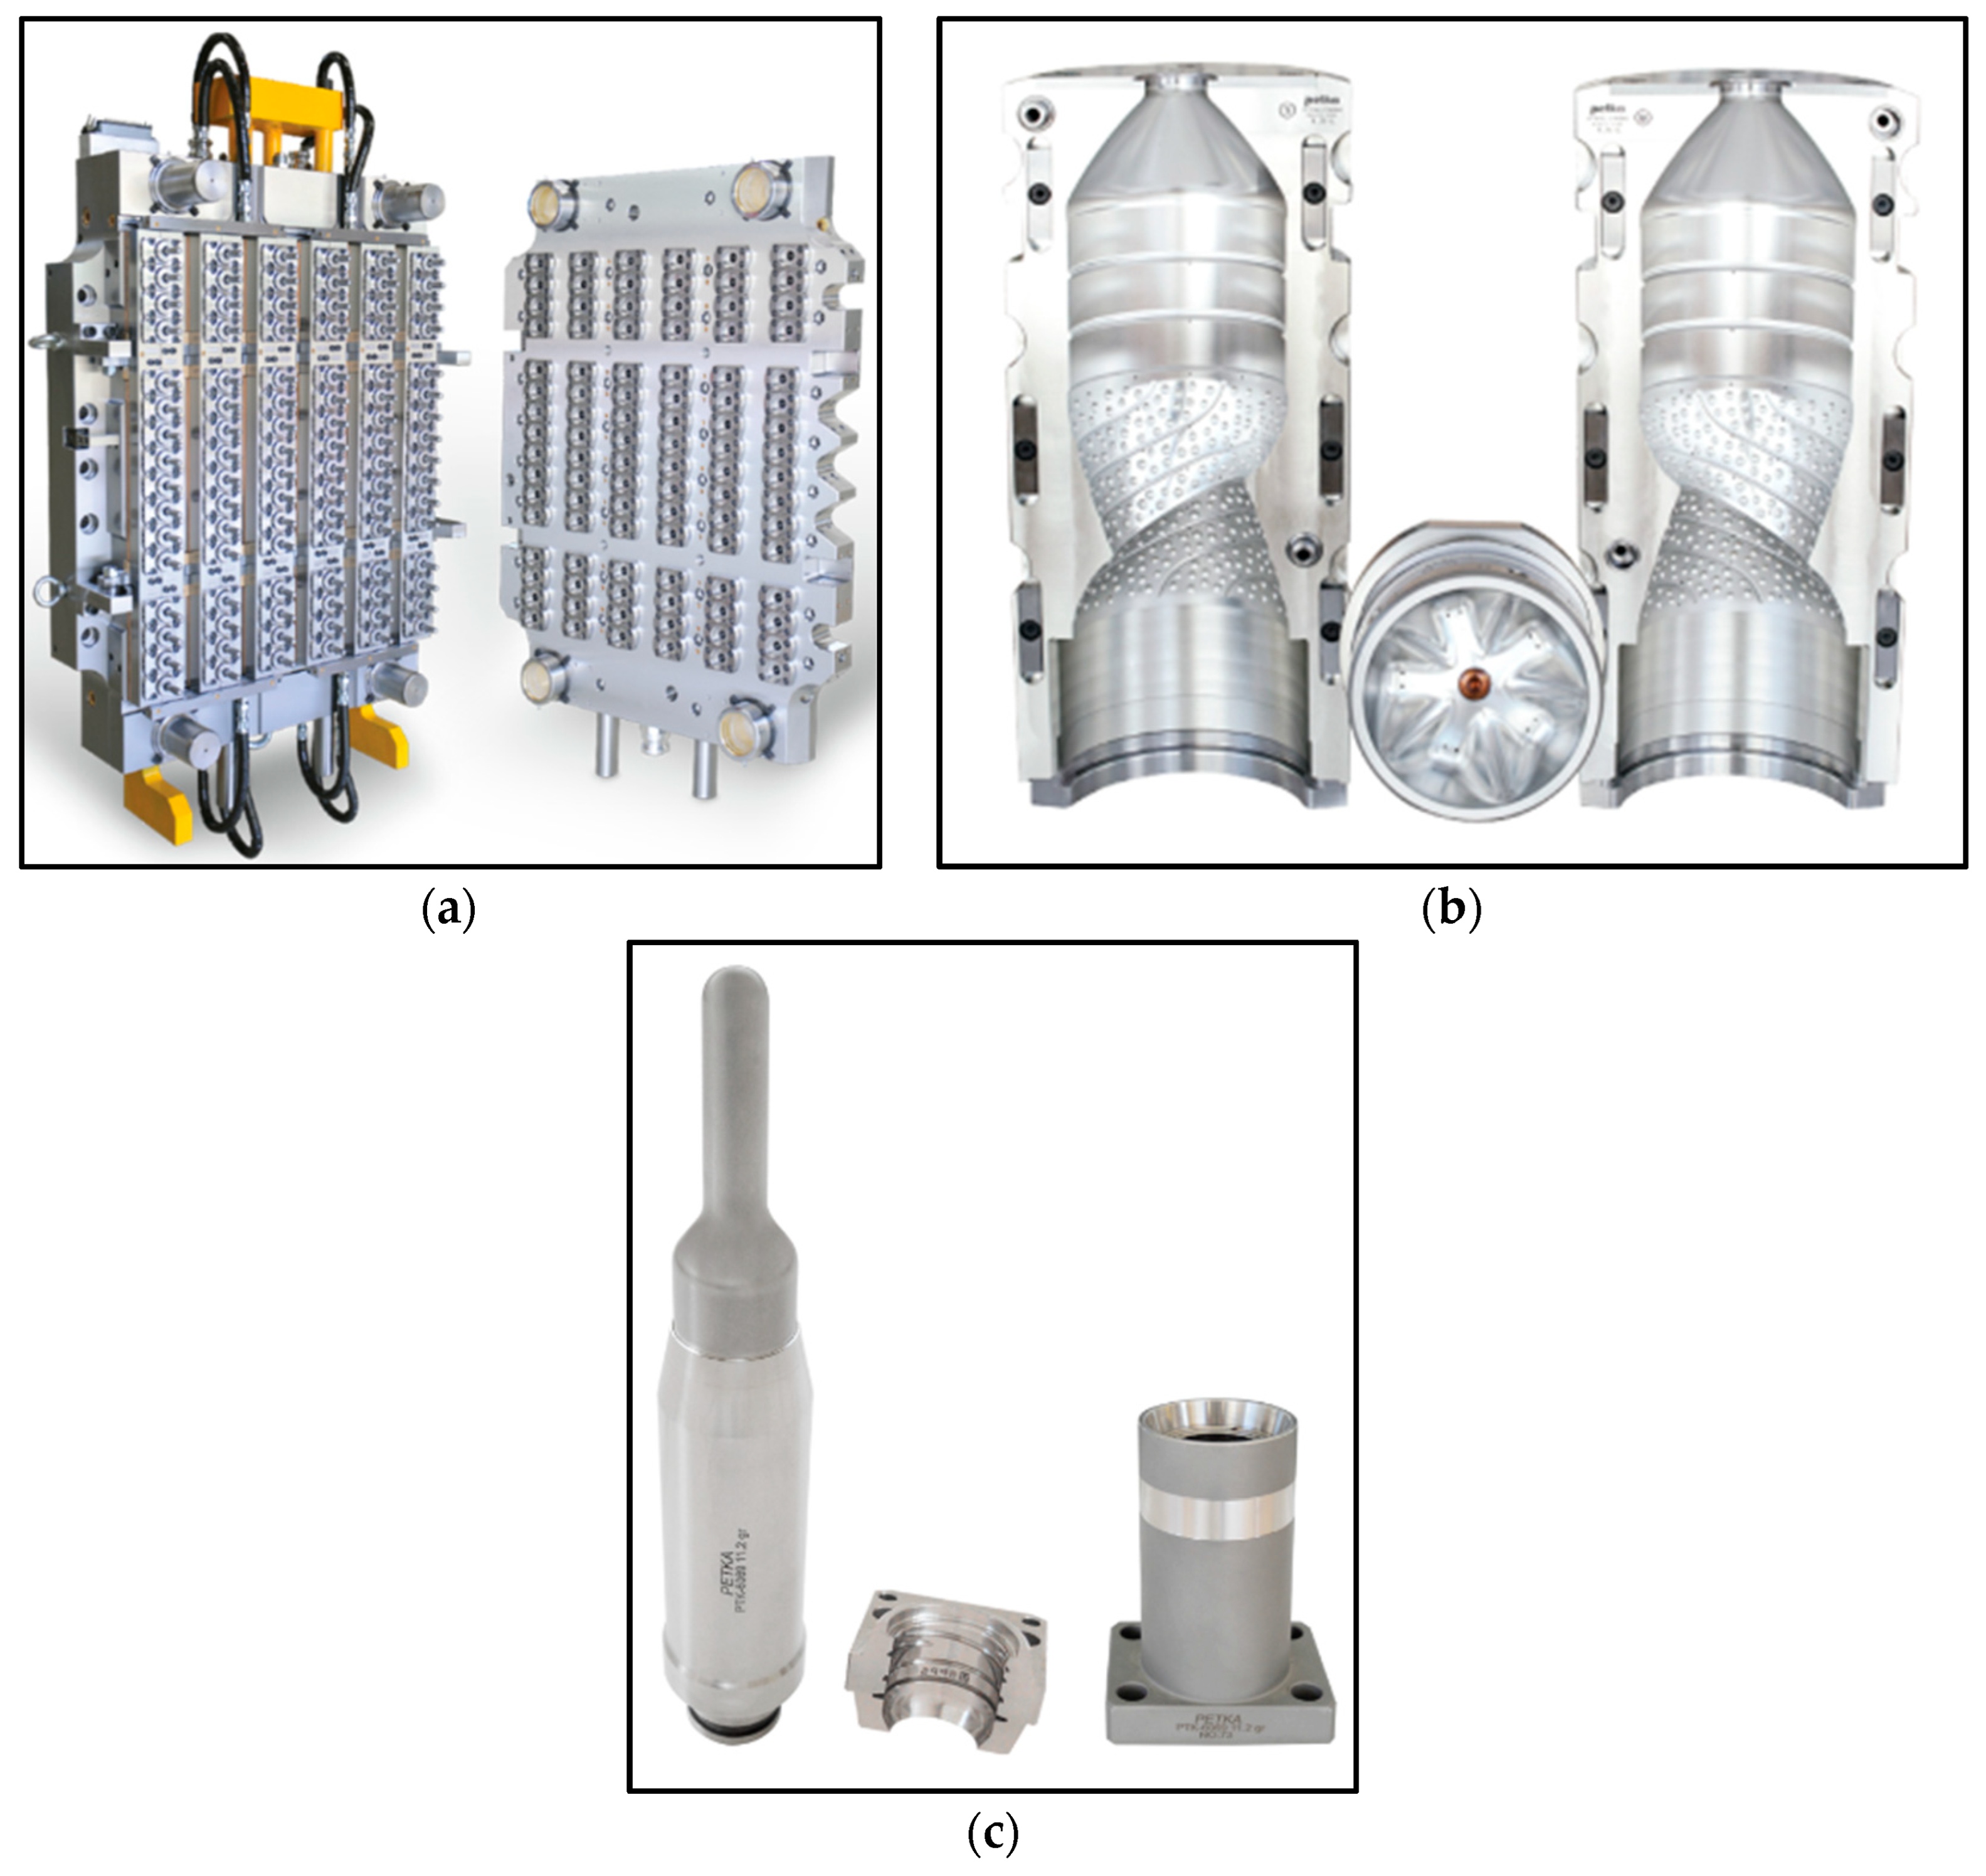
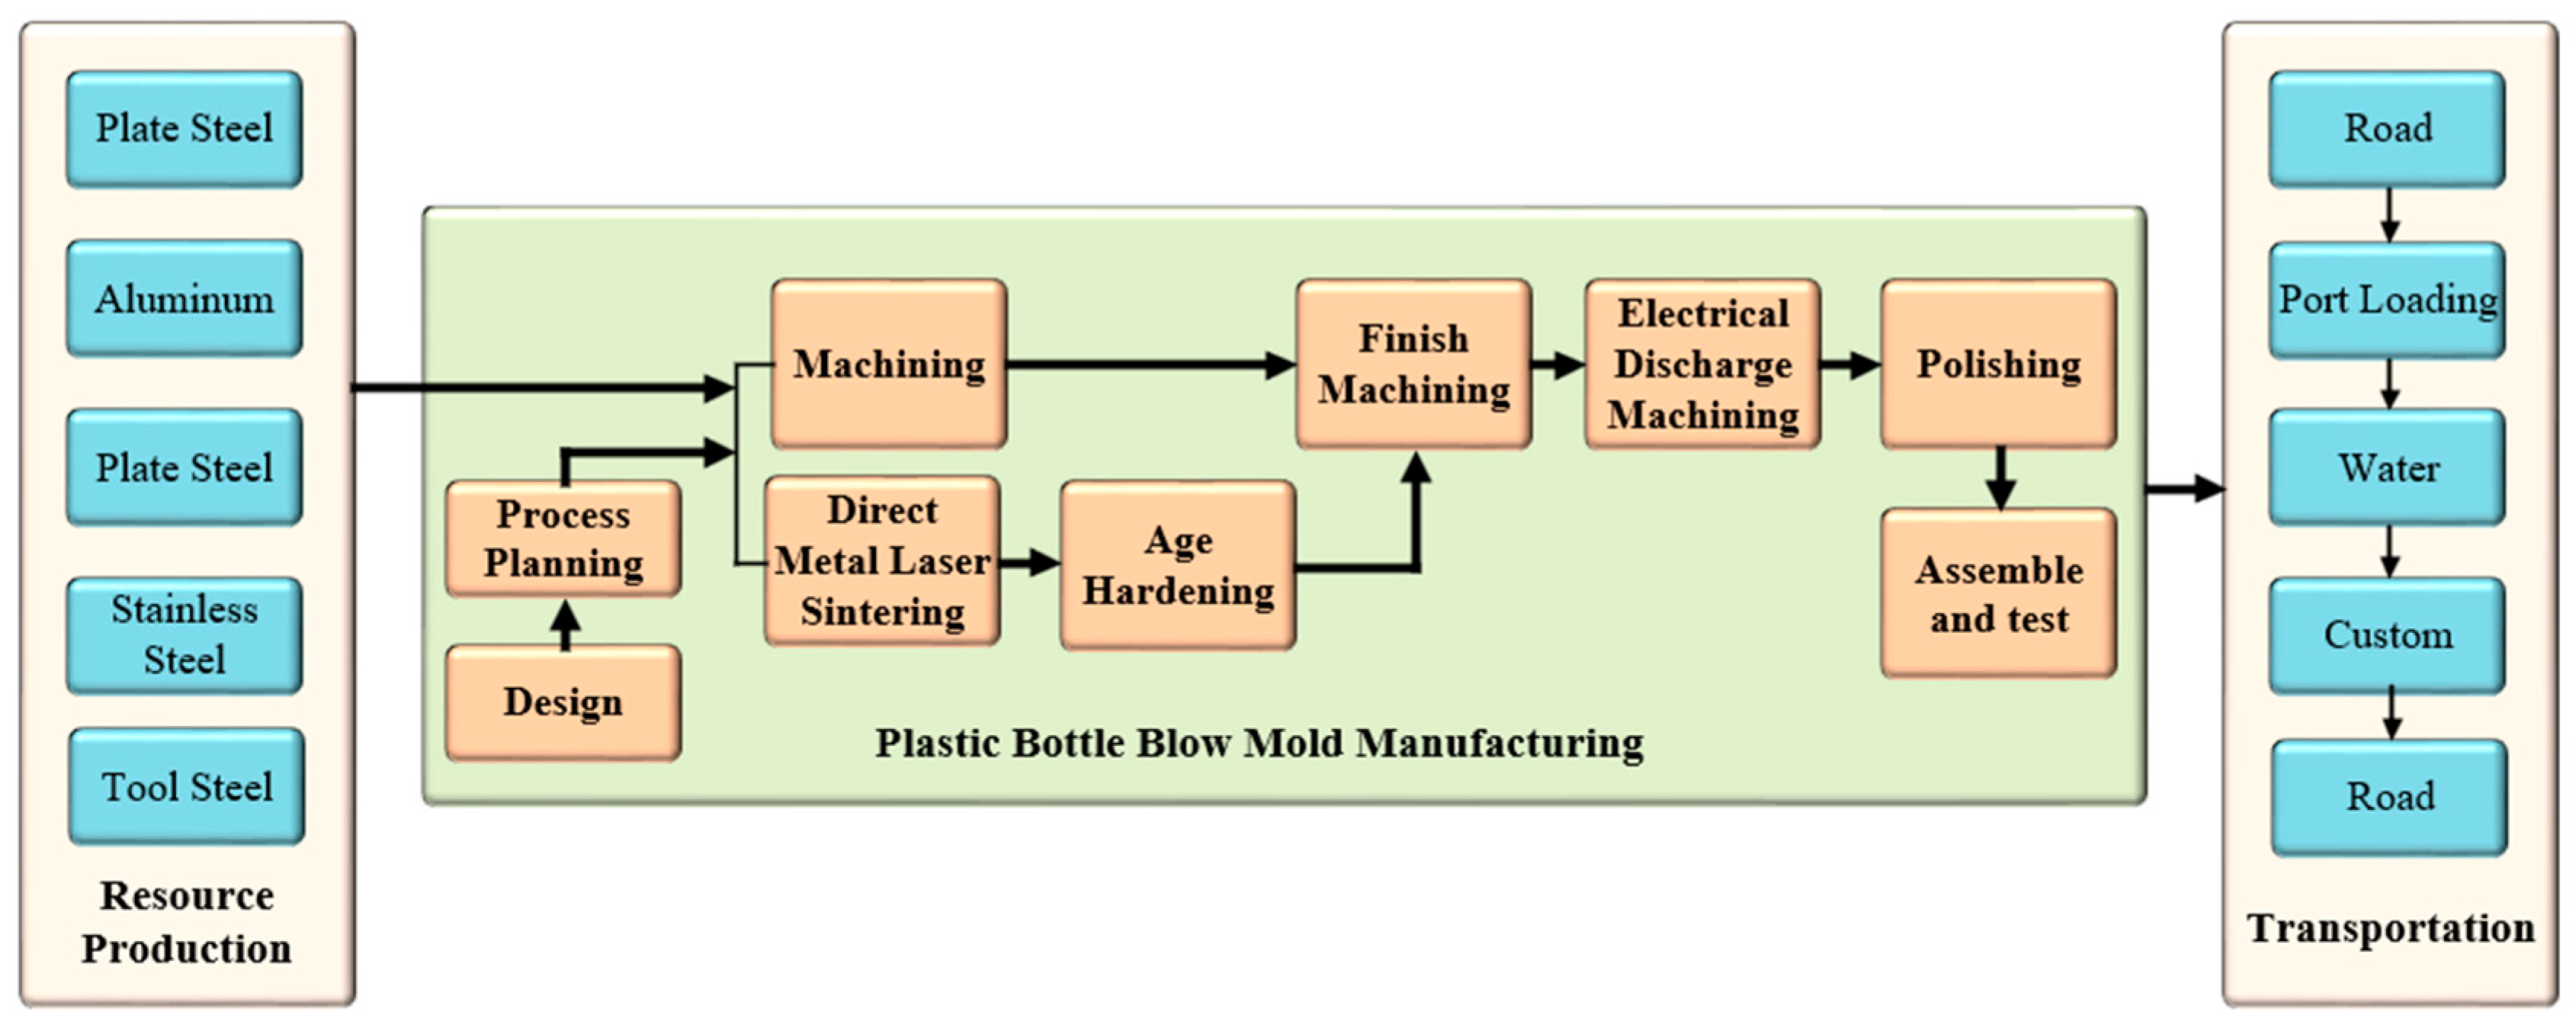
2.1. Product-Based Carbon Tracking and Analysis of “Plastic Bottle Blow Mold”

The ISO-14067 Product Based Carbon Calculation standard is applied to assess the existing carbon emission processes of plastic bottle blow mold. This involved conducting product-based carbon calculations to unveil the current sustainable potential. The analysis encompasses both present and future sustainable initiatives, examining carbon emissions under the established standard rules. The product underwent a detailed step-by-step examination, including energy measurements and analyses.
The elements used in the blowing mold are the body, base mold, connection and carrying plates, cooling channels, jaw, and air discharge channels. The body is the part where the mold cavity is located, giving the product its shape. It is made of alloy steel or alloy aluminum material. The material is chosen to have high resistance and good polishability. Additionally, 3.4265 (DIN) quality aluminum (7075), which is preferred in body construction, has very high wear resistance. Its machinability is very good due to its high hardness. It has good polishability and dimensional accuracy. The mold cavity is polished or chrome plated in very good quality. Base mold forms the bottom part of the bottle. It is movably guided at the bottom of the mold. The base mold is mounted on the arm on the bottom plate of the moving disk. The base retracts, allowing the mold to be released. When the mold is opened, the base mold is withdrawn, and the product remains on the base and is removed from there with the help of tongs. As the mold closes, it lifts up and fits into the slot inside the mold. The base mold is made of alloy steel material. Connection and carrying plates enable the mold to be mounted on the carrying unit. It is usually made of manufacturing steel. To obtain a product of the desired quality through cooling channels, the mold must be cooled evenly. Cooling channels are opened into the body and around the mold cavities, especially the jaw part where the preform sits needs to be cooled. The cooling element is lime-free water. The screw and throat part of the jaw preform is placed between the two jaw halves. The jaw is embedded in the throat of the mold and is tightened with screws. The air trapped inside the air discharge channels during inflation must be expelled. For this purpose, air discharge channels were opened in the mold. After the production phase is completed, the product is delivered to the customer. The blow mold production processes in the company are shown in Figure 2. Also, Figure 3 presents the schematic view of the production process PBBM.

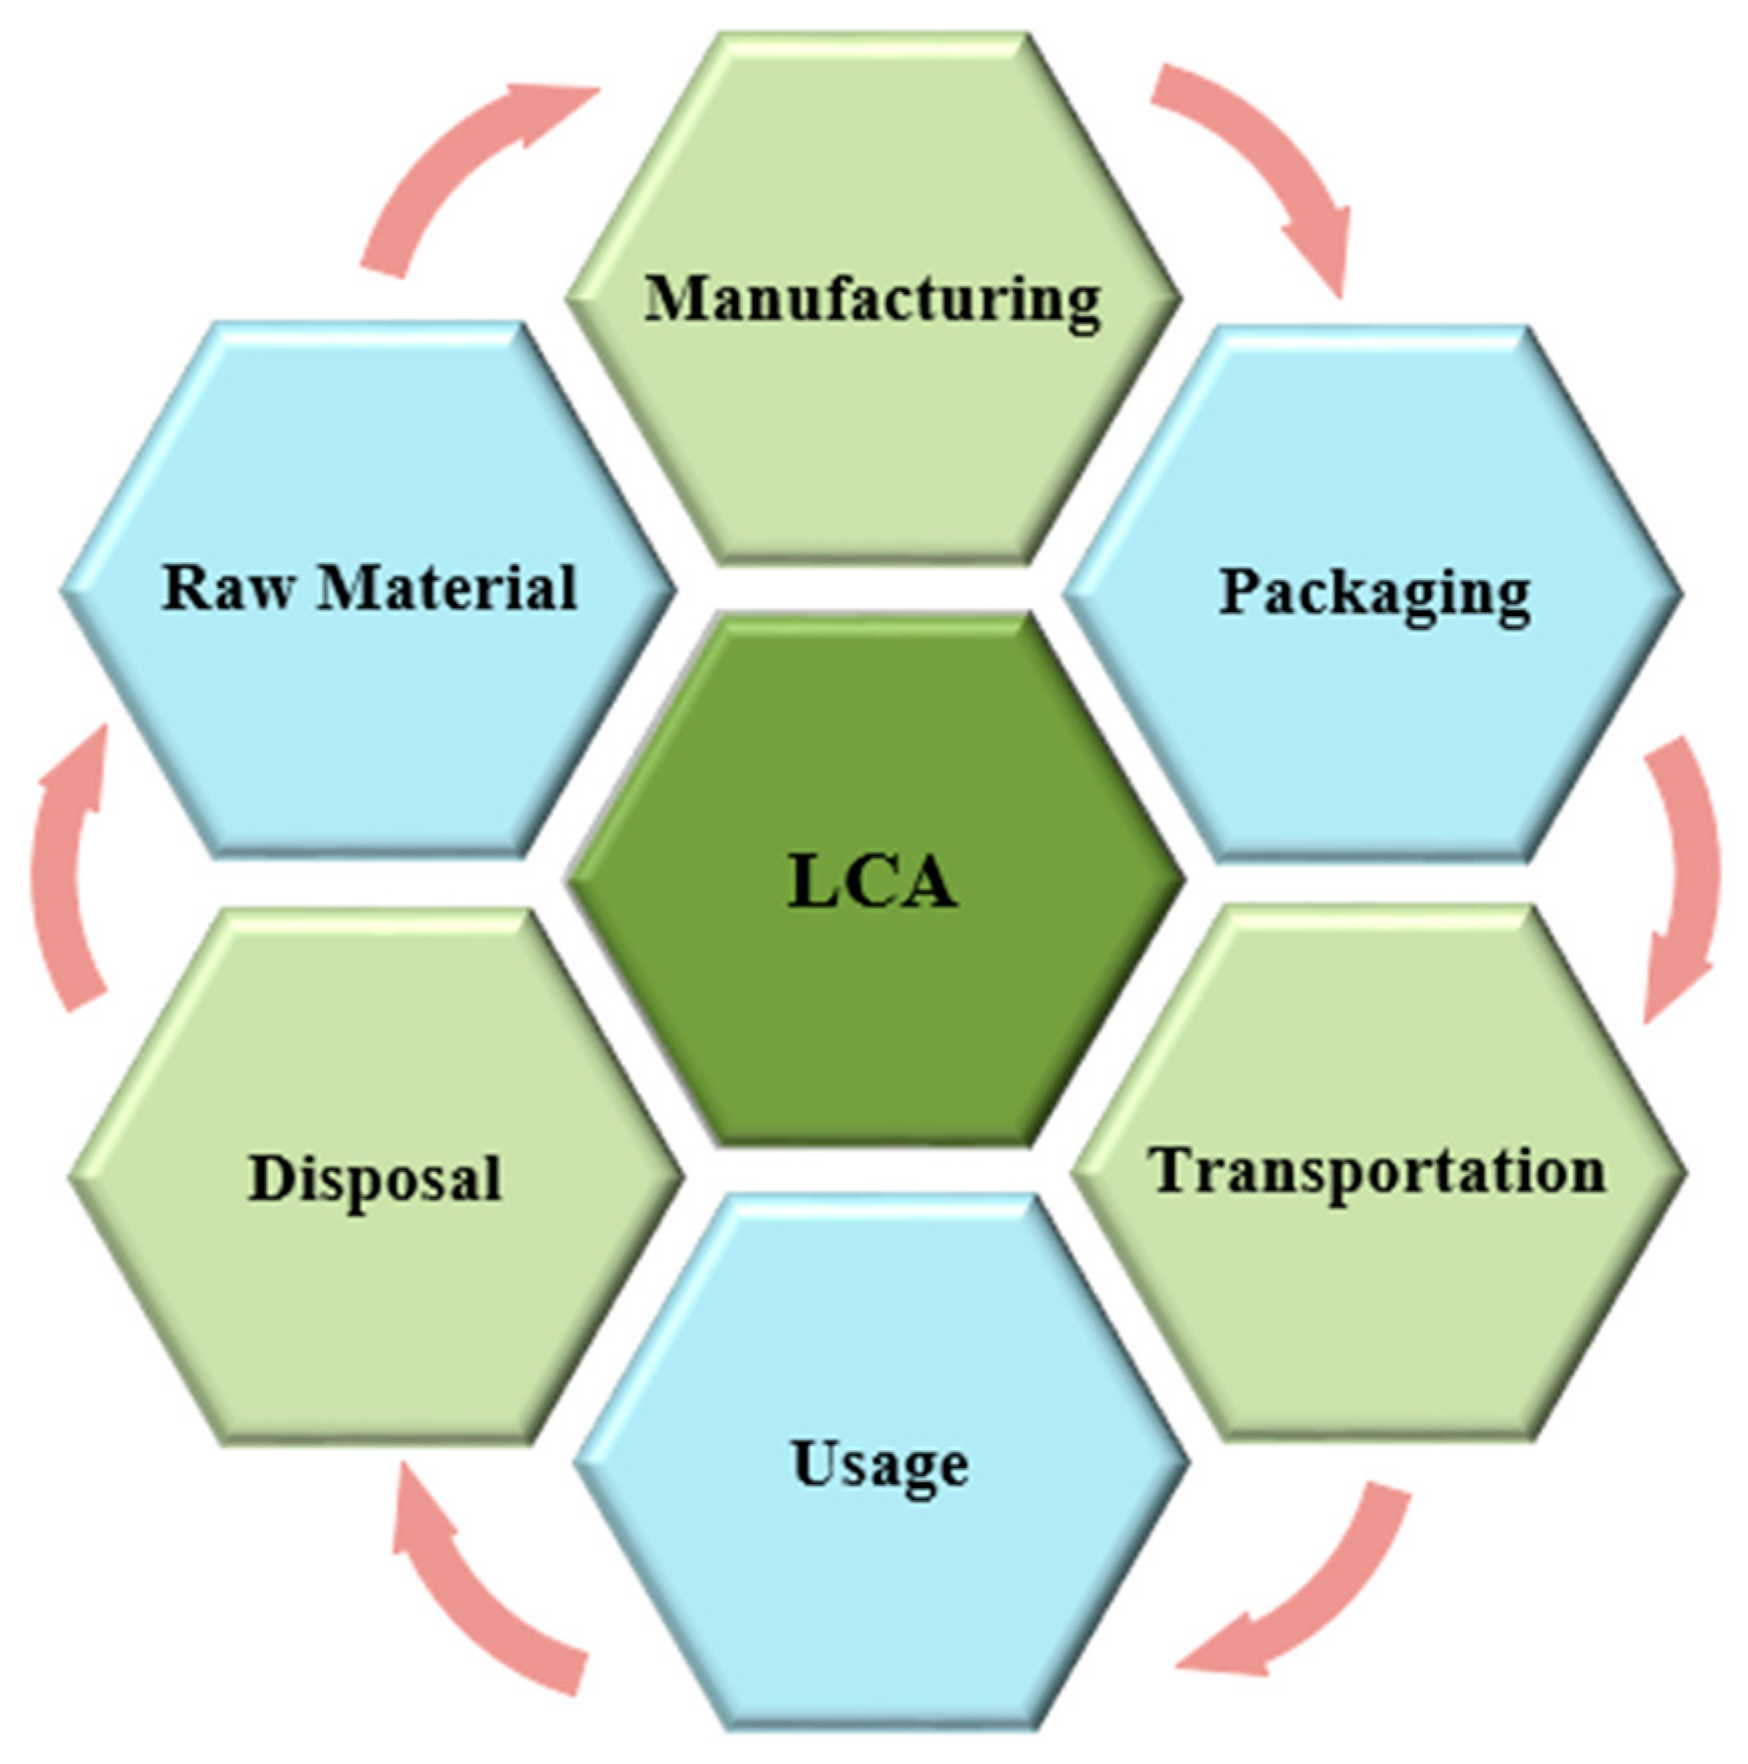
2.2. Life Cycle Assessment Analysis

The Kyoto Protocol and the principles of LCA designate the CF as the standard measure for greenhouse gas emissions during production, acknowledged as a primary contributor to global warming. Greenhouse gases, including CO2, water vapor, and methane, vary in their global warming potential, atmospheric density, and residence time. Among these, CO2 predominates, and thus, all emissions are expressed in CO2 equivalents.
The foundation of LCA calculations lies in the inventory table, a compilation of organized data through inventory analysis, with a systematic approach outlined in ISO 14044. Impact assessment utilizes this data to calculate numerical results for chosen impact categories. The interpretation phase evaluates the entire LCA process and results, offering suggestions for reducing environmental impacts. LCA stages are shown in Figure 4.
LCA also considers various impact categories, such as acidification potential, causing acid rain; eutrophication potential from nitrogen and phosphorus-containing wastes; the potential of volatile organic compounds and nitrogen oxides to form photochemical ozone in the presence of heat and sunlight; and the toxicity potential of chemical substances released into the environment.
Terms like “cradle to grave,” “cradle to door,” and “door to door” delineate the stages considered in a product’s LCA. The term “cradle” signifies the inclusion of raw material acquisition in the LCA study, encompassing both the initial stages of obtaining resources and the later stages of product consumption and waste disposal. “Door” typically refers to the factory door.
The LCA process involves four key phases:
  • Step 1: Clarify the study’s objective.
The current goal is to assess the CF of PBBM using the LCA approach. This study focuses on gauging the environmental impact of the manufacturing process, specifically considering greenhouse gas emissions throughout the entire supply chain—from energy and fuel to raw material acquisition and product transportation.
  • Step 2: Define the functional unit.
In the life cycle analysis, the functional unit is established as 25 kg of concentrated product. An inventory analysis is conducted for this determined functional unit, comprehensively considering all inputs and outputs within the selected system boundaries. The aim is to evaluate the environmental impacts associated with the production and use of the specified amount of product.
  • Step 3: Establish system boundaries.
This phase is focused on determining the CF (CO2-eq), a globally recognized impact category synonymous with global warming potential. The cradle-to-gate LCA method was employed to calculate the CF for the chosen functional unit. This involved utilizing data from the inventory table and incorporating emission factors for all inputs and outputs gathered from the literature.
For this study, the defined system boundaries encompassed key stages: the transportation of raw materials to the factory, the production processes within the enterprise, and the subsequent storage or direct transportation of the resulting PBBM. This comprehensive scope ensures a holistic assessment, as illustrated in Figure 5.
A few byproducts in the production process, specifically those constituting less than 1% of the final product weight, were deemed inconsequential and thus excluded from consideration. Additionally, data related to intermediate transports between plants and waiting times for raw materials and intermediate products in subsequent processes were limited and deemed unreliable.
The life cycle of the products under investigation involves the following stages:
  • Source of Raw Materials: Raw materials are transported via sea and road.
  • Production Process: Both production phases for the goods align with the factory’s established production cycle.
  • Stuffing: Packaging for the produced items is crafted using both recyclable and nonrecyclable materials.
  • Delivery of Finished Goods: The finalized products are assuredly shipped via cargo ships to Europe and then delivered by road to businesses in Turkey.
  • Last Phase: The ultimate stage involves the disposal of both the product and its packaging.
It is worth noting that emissions stemming from the final products’ service life and usage phase, post-transfer to the companies, are omitted from consideration due to their uncontrollable nature.
  • Step 4: Gathering data.
For this step, data pertinent to Petka Company’s PBBM product for the year 2023 are collected. The acquisition of these data involves a multifaceted approach:
  • Information on raw materials is sourced directly from the purchasing unit.
  • Production quantities and shipment details are obtained from invoices, marketing records, and the foreign trade unit. The computation of this information relies primarily on the installed power of the machines, given that not all aspects of energy consumption are equipped with individual meters. The study predominantly relies on primary data.
Yearly information extracted from the company encompasses:
  • Quantity of purchased raw materials
  • Shipment details during the raw material supply phase
  • Utilization of natural gas and electricity during production
  • Quantity of PBBMs processed by the business
  • Amount of purchased packaging materials
  • Information on shipments during the raw material supply phase
  • Details regarding product delivery to customers
  • Wastewater and solid waste generation
This comprehensive dataset provides a robust foundation for the subsequent stages of the product life cycle carbon footprint, ensuring a thorough analysis of the environmental impact associated with PBBM production and usage.

3. Results

The findings of this study carry significance for future endeavors in the realm of green agreements and sustainability, especially about production facilities. By revealing the specific points and quantities of carbon emissions, the study serves as a noteworthy model for other businesses and production facilities. Notably, the ISO-14067 product-based CF calculation standard was employed as the benchmark in this study.
The study specifically focuses on the production of PBBM utilizing steel as the raw material. By adopting a cradle-to-gate approach, the assessment covers the entire spectrum of environmental impacts associated with the product’s life cycle, contributing valuable insights into the sustainability aspects of PBBM production.

3.1. CF Analysis of the Transportation Process

Raw materials undergo transportation via road, seaway, and airway. Specifics regarding this transportation and ton CO2 equivalents phase can be found in Table 1. The data in Table 1 are computed based on 1 ton of raw material, and 25 kg of raw materials are used to manufacture each PBBM product. Additionally, the weight of each mold produced in the manufacturing process is 12 kg. Figure 6 presents the distribution of carbon emission amount of the transportation process of the product according to transport mode.

3.2. CF Analysis of Energy Consumption

The electricity used in the production of PBBM is used to meet the energy needs of the production process. This electricity is used to provide energy for operating various machines, processing materials, shaping mold, and other production stages. Electricity consumption can be determined by measuring it at various stages of the production process. These measurements can be used to increase energy efficiency and reduce environmental impacts. Additionally, the use of electricity from renewable energy sources can contribute to sustainability goals. In particular, the amount of electricity used during PBBM production is an important parameter considered in product life cycle carbon footprint and CF calculations. Energy consumption during the production process of one PBBM product is given in Table 2.
The product life cycle carbon footprint conducted in this study unveils a comprehensive understanding of the total CF attributed to PBBM within the operations of Petka Mold Industry. The calculated CF for one ton of PBBM stands at 87,437.018-ton CO2-eq, encompassing the entirety of the product’s life cycle. The transportation-related activities, notably product delivery, significantly augment the overall CF. These findings not only provide a quantitative measure of the environmental consequences but also underscore the imperative for targeted sustainability initiatives within the mold industry.

3.3. Uncertainty Analysis

Uncertainty analysis is important to increase the reliability of CF calculations. This analysis evaluates how accurate and reliable calculations are, while also identifying opportunities for improvement and providing stronger foundations for future decisions. Cumulative uncertainty refers to the total uncertainty or the sum of uncertainties associated with multiple factors or variables in a system, model, or analysis. In various fields such as science, engineering, finance, and decision-making, cumulative uncertainty arises when multiple sources of uncertainty are considered together. The cumulative uncertainty analysis is given in Equation 1. This suggests that the study is considering the overall or total level of uncertainty associated with a particular process, measurement, or prediction. Cumulative uncertainty takes into account the combined impact of various sources of uncertainty, providing a comprehensive understanding of the overall uncertainty in the study.
u = ± ( H 1 I 1 ) 2 + ( H 2 I 2 ) 2 + + ( H n I n ) 2 I 1 + I 2 + + I n
where u is the percentage uncertainty in the sum of the quantities. In and Hn are the uncertain quantities and the percentage uncertainties associated with them, respectively. The cumulative uncertainty in the study uses the first-order propagation Gaussian method.
In the context of a CF analysis for a PBBM, uncertainties may arise from the energy consumption during the manufacturing process, the choice of raw materials, the end-of-life, and other relevant factors. These factors include measurement errors, variability in input data, model assumptions, and other sources of unpredictability. The goal of uncertainty analysis is to provide a comprehensive assessment of the reliability and limitations of the study results. The resources used for uncertainty analysis in this study are water, electricity, raw materials, and boron oil. Activity data and emission factors are given in Table 3.
Using the data in Table 3, the cumulated uncertainty value was calculated as 6.8%. This value is defined as “good” according to the Intergovernmental Panel on Climate Change for the uncertainty assessment of national inventory data [55]. The findings offer valuable insights for industry stakeholders and policymakers. Manufacturers can use this information to identify opportunities for carbon footprint reduction, while policymakers can formulate targeted strategies to incentivize sustainable practices within the plastic molding industry.

4. Discussion

In this study, the sustainability of the production line for the chosen product within the factory is under scrutiny, and a product life cycle carbon footprint is conducted within specified system boundaries. The initial step involves defining these boundaries and creating a detailed process flow chart. Subsequently, CF calculations are performed using data derived from various measurements taken along the production line, generously shared by the company. The focus of this study extends beyond mere CF analysis; it encompasses a product life cycle carbon footprint and evaluation of greenhouse gas emissions throughout the entire process. This spans from the procurement of raw materials essential for blow mold production to the ultimate delivery of the manufactured blow mold to the customer, and onward to the subsequent disposal stage. The investigation provides a holistic perspective on the environmental impact, offering insights into the sustainability aspects of the entire life cycle of the product. Carbon footprint analysis is a widely employed technique for precisely quantifying direct and indirect carbon emissions across a product’s entire life cycle, playing a pivotal role in evaluating greenhouse gas emissions. In the phase of emissions calculation, two key methodologies derived from LCA are utilized: the “bottom-up” process analysis (PA) and the “top-down” economic input–output analysis (EIO). In this study, the product life cycle carbon footprint tool is employed to compute and scrutinize the CF based on the actual production process of the PBBM product. The primary aim is to conduct a comprehensive cradle-to-customer plus waste product life cycle carbon footprint for PBBM production, providing a thorough evaluation of its environmental impacts. This encompasses the cradle-to-gate processes within the PBBM production chain—from the extraction of raw materials to the delivery to the customer, inclusive of waste processes.
According to the investigation results, it is observed that:
  • Compared to Table 1 and Table 2 the product delivery part constitutes a significant part of the calculated carbon footprint amount.
  • Further categorizing deliveries by transportation modes reveals that sea transportation has the least environmental impact in terms of carbon emissions (Figure 6).
  • To enhance the robustness of the findings, a thorough uncertainty analysis has been conducted. This involved the identification and quantification of uncertainties associated with data sources, model parameters, and key assumptions. The results of the uncertainty analysis provide a more detailed understanding of the reliability of the calculated CF.
The application of product life cycle carbon footprint can yield concrete advantages in the environmental assessment of the processes responsible for the logistics unit. The results present valuable insights to leverage this information to pinpoint areas for reducing CF. The companies can develop specific strategies to encourage sustainable practices within the plastic molding industry.

5. Conclusions

The aim of assessing the product-based carbon footprint is to thoroughly examine the energy needs of the manufactured item at every stage. This entails comprehending the various forms of energy utilized and accurately measuring the resulting carbon emissions produced during each stage of the product’s manufacture. The study employed both life cycle analysis and the ISO-14067 Product-Based Carbon Footprint standard to conduct detailed calculations for the chosen product. Turkey, as a participant in international agreements, has demonstrated its commitment to carbon emission reduction efforts. This study aligns with the collective goal of contributing to initiatives aiming for carbon neutrality by 2050. It aims to make a meaningful and lasting impact by addressing the root causes of carbon emissions and actively intervening in the phenomenon. Hence, this paper fills an important gap in the literature by providing comprehensive calculating of the carbon footprint of plastic bottle blow mold based on product life cycle, thus offering valuable insights for managing carbon emissions and promoting sustainability within the mold industry. According to the investigation results, it is observed that the CF of one-ton PBBM for Petka Mold Industry is calculated as 87437.018-ton CO2−eq. The carbon emissions from transportation bring about a significant role in the overall calculated carbon footprint. A thorough examination of delivery methods reveals that sea transportation has the lowest environmental impact in terms of carbon emissions. The results of the uncertainty analysis increase the calculated CF’s reliability. The identified stages contributing significantly to carbon emissions within the PBBM life cycle provide a roadmap for targeted environmental improvement strategies. This research not only quantifies the ecological footprint of PBBM but also lays the groundwork for future studies in sustainable manufacturing processes. The integration of life cycle thinking into industrial practices is paramount for steering towards a greener and more sustainable future. Industry practitioners can leverage these findings to implement specific measures aimed at reducing carbon emissions, optimizing operations, and adopting environmentally friendly technologies. In the future study, product life cycle carbon footprint of plastic bottle production will be carried out to select the right raw materials and perform appropriate waste management with the valuable findings obtained from this study.

Author Contributions

Conceptualization, Ö.D., A.Y. and B.E.; methodology, M.Y.; software, A.Y. and B.E.; validation, Ö.D., B.E. and A.Y.; formal analysis, A.Y., K.T.A. and B.E.; investigation, A.Y., B.E. and K.T.A.; resources, K.T.A. and M.Y.; data curation, M.Y.; writing—original draft preparation, A.Y., Ö.D. and B.E.; writing—review and editing, A.Y., B.E. and Ö.D.; visualization, A.Y. and B.E.; supervision, A.Y. and B.E.; project administration, A.Y. and B.E.; funding acquisition, M.Y. All authors have read and agreed to the published version of the manuscript.

Funding

This research was supported by Petka Mold Industry (Design Center Project Number: PTK 01012023).

Institutional Review Board Statement

Not applicable.

Informed Consent Statement

Not applicable.

Data Availability Statement

No new data were created or analyzed in this study. Data sharing is not applicable to this article.

Acknowledgments

The authors would like to acknowledge the Petka Mold Industry Design Center for full financial support and the data process.

Conflicts of Interest

The authors declare that this study received funding from Petka Mold Industry. The funder had the following involvement with the study: in the collection, analyses, or interpretation of data.

References

  1. Turner, M.G.; Calder, W.J.; Cumming, G.S.; Hughes, T.P.; Jentsch, A.; LaDeau, S.L.; Lenton, T.M.; Shuman, B.N.; Turetsky, M.R.; Ratajczak, Z.; et al. Climate Change, Ecosystems and Abrupt Change: Science Priorities. Philos. Trans. R. Soc. B 2020, 375, 20190105. [Google Scholar] [CrossRef]
  2. Zandalinas, S.I.; Fritschi, F.B.; Mittler, R. Global Warming, Climate Change, and Environmental Pollution: Recipe for a Multifactorial Stress Combination Disaster. Trends Plant Sci. 2021, 26, 588–599. [Google Scholar] [CrossRef]
  3. Ramanathan, V.; Feng, Y. Air Pollution, Greenhouse Gases and Climate Change: Global and Regional Perspectives. Atmos. Environ. 2009, 43, 37–50. [Google Scholar] [CrossRef]
  4. Lu, Y.; Yuan, J.; Lu, X.; Su, C.; Zhang, Y.; Wang, C.; Cao, X.; Li, Q.; Su, J.; Ittekkot, V.; et al. Major Threats of Pollution and Climate Change to Global Coastal Ecosystems and Enhanced Management for Sustainability. Environ. Pollut. 2018, 239, 670–680. [Google Scholar] [CrossRef]
  5. Jacobson, M.Z. Review of Solutions to Global Warming, Air Pollution, and Energy Security. Energy & Environmental Science 2009, 2, 148–173. [Google Scholar]
  6. Bodansky, D. The United Nations Framework Convention on Climate Change: A Commentary. Yale J. Int. Law 1993, 18, 451. [Google Scholar]
  7. Bohringer, C. The Kyoto Protocol: A Review and Perspectives. Oxf. Rev. Econ. Policy 2003, 19, 451–466. [Google Scholar] [CrossRef]
  8. Liu, P.R.; Raftery, A.E. Country-Based Rate of Emissions Reductions Should Increase by 80% beyond Nationally Determined Contributions to Meet the 2 °C Target. Commun. Earth Env. 2021, 2, 29. [Google Scholar] [CrossRef] [PubMed]
  9. Falkner, R. The Paris Agreement and the New Logic of International Climate Politics. Int. Aff. 2016, 92, 1107–1125. [Google Scholar] [CrossRef]
  10. Panwar, N.L.; Kaushik, S.C.; Kothari, S. Role of Renewable Energy Sources in Environmental Protection: A Review. Renew. Sustain. Energy Rev. 2011, 15, 1513–1524. [Google Scholar] [CrossRef]
  11. Bilgen, S.; Keleş, S.; Kaygusuz, A.; Sarı, A.; Kaygusuz, K. Global Warming and Renewable Energy Sources for Sustainable Development: A Case Study in Turkey. Renew. Sustain. Energy Rev. 2008, 12, 372–396. [Google Scholar] [CrossRef]
  12. Masato, D.; Kim, S.K. Global Workforce Challenges for the Mold Making and Engineering Industry. Sustainability 2023, 16, 346. [Google Scholar] [CrossRef]
  13. Finnveden, G.; Hauschild, M.Z.; Ekvall, T.; Guinée, J.; Heijungs, R.; Hellweg, S.; Koehler, A.; Pennington, D.; Suh, S. Recent Developments in Life Cycle Assessment. J. Environ. Manag. 2009, 91, 1–21. [Google Scholar] [CrossRef] [PubMed]
  14. Kendall, A. Time-Adjusted Global Warming Potentials for LCA and Carbon Footprints. Int. J. Life Cycle Assess. 2012, 17, 1042–1049. [Google Scholar] [CrossRef]
  15. Góralczyk, M. Life-Cycle Assessment in the Renewable Energy Sector. Appl. Energy 2003, 75, 205–211. [Google Scholar] [CrossRef]
  16. Yao, Y.; Xu, P.; Li, J.; Hu, H.; Qi, Q. Advancements and Applications of Life Cycle Assessment in Slope Treatment: A Comprehensive Review. Sustainability 2024, 16, 398. [Google Scholar] [CrossRef]
  17. Vita, A.; Castorani, V.; Germani, M.; Marconi, M. Comparative Life Cycle Assessment and Cost Analysis of Autoclave and Pressure Bag Molding for Producing CFRP Components. Int. J. Adv. Manuf. Technol. 2019, 105, 1967–1982. [Google Scholar] [CrossRef]
  18. Forcellese, A.; Marconi, M.; Simoncini, M.; Vita, A. Life Cycle Impact Assessment of Different Manufacturing Technologies for Automotive CFRP Components. J. Clean. Prod. 2020, 271, 122677. [Google Scholar] [CrossRef]
  19. Wegmann, S.; Rytka, C.; Diaz-Rodenas, M.; Werlen, V.; Schneeberger, C.; Ermanni, P.; Caglar, B.; Gomez, C.; Michaud, V. A Life Cycle Analysis of Novel Lightweight Composite Processes: Reducing the Environmental Footprint of Automotive Structures. J. Clean. Prod. 2022, 330, 129808. [Google Scholar] [CrossRef]
  20. Kafara, M.; Süchting, M.; Kemnitzer, J.; Westermann, H.-H.; Steinhilper, R. Comparative Life Cycle Assessment of Conventional and Additive Manufacturing in Mold Core Making for CFRP Production. Procedia Manuf. 2017, 8, 223–230. [Google Scholar] [CrossRef]
  21. Gouveia, J.R.; Pinto, S.M.; Campos, S.; Matos, J.R.; Sobral, J.; Esteves, S.; Oliveira, L. Life Cycle Assessment and Cost Analysis of Additive Manufacturing Repair Processes in the Mold Industry. Sustainability 2022, 14, 2105. [Google Scholar] [CrossRef]
  22. Burchart-Korol, D. Life Cycle Assessment of Steel Production in Poland: A Case Study. J. Clean. Prod. 2013, 54, 235–243. [Google Scholar] [CrossRef]
  23. Zheng, J.; Suh, S. Strategies to Reduce the Global Carbon Footprint of Plastics. Nat. Clim. Chang. 2019, 9, 374–378. [Google Scholar] [CrossRef]
  24. Bałdowska-Witos, P.; Piasecka, I.; Flizikowski, J.; Tomporowski, A.; Idzikowski, A.; Zawada, M. Life Cycle Assessment of Two Alternative Plastics for Bottle Production. Materials 2021, 14, 4552. [Google Scholar] [CrossRef]
  25. Alhazmi, H.; Almansour, F.H.; Aldhafeeri, Z. Plastic Waste Management: A Review of Existing Life Cycle Assessment Studies. Sustainability 2021, 13, 5340. [Google Scholar] [CrossRef]
  26. Mannheim, V. Life Cycle Assessment Model of Plastic Products: Comparing Environmental Impacts for Different Scenarios in the Production Stage. Polymers 2021, 13, 777. [Google Scholar] [CrossRef]
  27. Aryan, Y.; Yadav, P.; Samadder, S.R. Life Cycle Assessment of the Existing and Proposed Plastic Waste Management Options in India: A Case Study. J. Clean. Prod. 2019, 211, 1268–1283. [Google Scholar] [CrossRef]
  28. Arena, U.; Mastellone, M.L.; Perugini, F. Life Cycle Assessment of a Plastic Packaging Recycling System. Int. J. Life Cycle Assess. 2003, 8, 92. [Google Scholar] [CrossRef]
  29. Bałdowska-Witos, P.; Piotrowska, K.; Kruszelnicka, W.; Błaszczak, M.; Tomporowski, A.; Opielak, M.; Kasner, R.; Flizikowski, J. Managing the Uncertainty and Accuracy of Life Cycle Assessment Results for the Process of Beverage Bottle Moulding. Polymers 2020, 12, 1320. [Google Scholar] [CrossRef] [PubMed]
  30. Chen, L.; Pelton, R.E.O.; Smith, T.M. Comparative Life Cycle Assessment of Fossil and Bio-Based Polyethylene Terephthalate (PET) Bottles. J. Clean. Prod. 2016, 137, 667–676. [Google Scholar] [CrossRef]
  31. Go, Y.-J.; Kang, D.-H.; Park, H.-J.; Lee, J.-H.; Shim, J.-K. Meta-Analysis of Life Cycle Assessment Studies for Polyethylene Terephthalate Water Bottle System. Sustainability 2024, 16, 535. [Google Scholar] [CrossRef]
  32. Olatayo, K.I.; Mativenga, P.T.; Marnewick, A.L. Life Cycle Assessment of Single-Use and Reusable Plastic Bottles in the City of Johannesburg. S. Afr. J. Sci. 2021, 117, 1–10. [Google Scholar] [CrossRef]
  33. European Commission. Delivering the European Green Deal. Available online: https://commission.europa.eu/strategy-and-policy/priorities-2019-2024/european-green-deal/delivering-european-green-deal_en (accessed on 24 October 2023).
  34. European Commission. European Green Deal. Available online: https://www.consilium.europa.eu/en/policies/green-deal (accessed on 24 October 2023).
  35. European Commission. Commission Outlines Road to Zero Pollution Action Plan. Available online: https://environment.ec.europa.eu/news/commission-outlines-road-zero-pollution-action-plan-2020-10-01_en (accessed on 24 October 2023).
  36. European Commission. EU Biodiversity Strategy. Available online: https://commission.europa.eu/system/files/2020-05/env-20-002_factsheet1-vbo-en-b.pdf (accessed on 24 October 2023).
  37. European Commission. Zero Pollution Action Plan. Available online: https://environment.ec.europa.eu/strategy/zero-pollution-action-plan_en (accessed on 24 October 2023).
  38. Scott, J. Reducing the EU’s Global Environmental Footprint. Ger. Law J. 2020, 21, 10–16. [Google Scholar] [CrossRef]
  39. Official Journal of the European Union. Consolidated Version of the Treaty on the Functioning of the European Union. Available online: https://eur-lex.europa.eu/LexUriServ/LexUriServ.do?uri=CELEX:12012E/TXT:en:PDF (accessed on 24 October 2023).
  40. Hansen, D.; Mowen, M.; Guan, L. Cost Management: Accounting and Control; Cengage Learning: Boston, MA, USA, 2007; ISBN 978-0-324-55967-5. [Google Scholar]
  41. World Health Organization. How Air Pollution is Destroying Our Health. Available online: https://www.who.int/news-room/spotlight/how-air-pollution-is-destroying-our-health (accessed on 26 October 2023).
  42. Ghorani-Azam, A.; Riahi-Zanjani, B.; Balali-Mood, M. Effects of Air Pollution on Human Health and Practical Measures for Prevention in Iran. J. Res. Med. Sci. Off. J. Isfahan Univ. Med. Sci. 2016, 21, 65. [Google Scholar]
  43. European Commission. Fit for 55: Delivering on the Proposals. Available online: https://commission.europa.eu/strategy-and-policy/priorities-2019-2024/european-green-deal/delivering-european-green-deal/fit-55-delivering-proposals_en (accessed on 26 October 2023).
  44. Almeida, D.V.; Kolinjivadi, V.; Ferrando, T.; Roy, B.; Herrera, H.; Gonçalves, M.V.; Van Hecken, G. The “Greening” of Empire: The European Green Deal as the EU First Agenda. Political Geogr. 2023, 105, 102925. [Google Scholar] [CrossRef]
  45. Official Journal of the European Union. Regulation (EU) 2023/956 of the European Parliament and of the Council of 10 May 2023 Establishing a Carbon Border Adjustment Mechanism. Available online: https://eur-lex.europa.eu/legal-content/EN/TXT/PDF/?uri=CELEX:32023R0956 (accessed on 26 October 2023).
  46. European Commission. Carbon Border Adjustment Mechanism. Available online: https://taxation-customs.ec.europa.eu/carbon-border-adjustment-mechanism_en (accessed on 26 October 2023).
  47. The World Steel Association. Steel Statistics. Available online: https://worldsteel.org/steel-topics/statistics (accessed on 27 October 2023).
  48. The World Steel Association. Available online: https://worldsteel.org/media-centre/press-releases/2023/worldsteel-short-range-outlook-april-2023 (accessed on 27 October 2023).
  49. Eckardt, N.A.; Ainsworth, E.A.; Bahuguna, R.N.; Broadley, M.R.; Busch, W.; Carpita, N.C.; Castrillo, G.; Chory, J.; DeHaan, L.R.; Duarte, C.M. Climate Change Challenges, Plant Science Solutions. Plant Cell 2023, 35, 24–66. [Google Scholar] [CrossRef] [PubMed]
  50. Burritt, R.L.; Schaltegger, S.; Zvezdov, D. Carbon Management Accounting: Explaining Practice in Leading German Companies. Aust. Account. Rev. 2011, 21, 80–98. [Google Scholar] [CrossRef]
  51. Brander, M.; Davis, G. Greenhouse Gases, CO2, CO2e, and Carbon: What Do All These Terms Mean; White Papers; Econometrica: Edinburgh, UK, 2012. [Google Scholar]
  52. United States Environmental Protection Agency. Greenhouse Gas Reporting Program Requirements for Importers and Exporters. Available online: https://www.epa.gov/importing-exporting/greenhouse-gas-reporting-program-requirements-importers-and-exporters (accessed on 27 October 2023).
  53. Siy, A.L.; Wang, A.; Zheng, T.; Hu, X. Research on the Impact of the EU’s Carbon Border Adjustment Mechanism: Based on the GTAP Model. Sustainability 2023, 15, 4761. [Google Scholar] [CrossRef]
  54. Suer, J.; Traverso, M.; Ahrenhold, F. Carbon Footprint of Scenarios towards Climate-Neutral Steel According to ISO 14067. J. Clean. Prod. 2021, 318, 128588. [Google Scholar] [CrossRef]
  55. Greenhouse Gas Protocol. Available online: https://ghgprotocol.org/calculation-tools-and-guidance (accessed on 30 October 2023).
Figure 1. The products produced by the company are (a) plastic preform mold, (b) PBBM, and (c) single-stage molds.
Sustainability 16 02149 g001
Figure 2. The production process of PBBM.
Sustainability 16 02149 g002
Figure 3. Schematic view of the production process PBBM.
Sustainability 16 02149 g003
Figure 4. Life cycle assessment stages.
Sustainability 16 02149 g004
Figure 5. Product life cycle as system boundary for PBBM.
Sustainability 16 02149 g005
Figure 6. Distribution of carbon emission amount of the transportation process of the product according to transport mode.
Sustainability 16 02149 g006
Table 1. Distances and ton CO2 equivalents during the transportation process of raw materials and the product.
Countries of Raw Material SupplyTransport ModeDistance (km)Ton CO2 Equivalent
GermanyRoad64481181.134273
FranceAirway29731859.561474
Countries of Product DeliveryTransport ModeDistance (km)Ton CO2 Equivalent
AzerbaijanRoad20701181.134
Saudi ArabiaAirway16921859.561474
BelgiumAirway28713155.319735
PakistanAirway33773711.429727
LibyaAirway14961644.15128
LebanonSeaway3262.94052
UzbekistanAirway27623035.52529
KyrgyzstanAirway33803714.726822
South AfricaAirway66217276.68825
IraqRoad1104629.9382789
KuwaitAirway14201560.624878
Czech RepublicRoad27791585.687026
RussiaAirway86149467.058237
KazakhstanAirway28443125.645882
KyrgyzstanRoad46692664.113971
CyprusSeaway2552.3001
LebanonAirway84579294.510275
JordanAirway991410,895.79932
GeorgiaAirway749823.1746714
United Arab EmiratesAirway22852511.287215
TunisiaAirway24082646.468102
Czech RepublicAirway22122431.057908
GreeceAirway9331025.396487
PolandRoad32201837.31998
GermanyRoad32241839.602365
IraqAirway9221013.307139
Table 2. Outlines the energy consumption during the production process.
Electricity Activity Data (MWh)CO2 eq/MWhTon CO2 Equivalent
0.900.440.40
Electricity LeakageCO2 eq/MWhTon CO2 Equivalent
0.14630.130.06
Table 3. The ranking of uncertainties of indirectly measured emissions.
Source
Description
Activity DataUnit Used to Measure
Activity Data
GHG Emission FactorUncertainty of Emission Factor
Water93.00lt0.18+/−5.0%
Electricity0.90kW0.44+/−5.0%
Boron oil7.00kg0.05+/−5.0%
Raw material0.03kg0.36+/−5.0%
Disclaimer/Publisher’s Note: The statements, opinions and data contained in all publications are solely those of the individual author(s) and contributor(s) and not of MDPI and/or the editor(s). MDPI and/or the editor(s) disclaim responsibility for any injury to people or property resulting from any ideas, methods, instructions or products referred to in the content.

