Research on Urban Street Network Structure Based on Spatial Syntax and POI Data


1
Guangxi Key Laboratory of Green Building Materials and Construction Industrialization, School of Civil Engineering, Guilin University of Technology, Guilin 541004, China
2
Department of Engineering, School of Science and Technology, University of London, London EC1V OHB, UK
*
Authors to whom correspondence should be addressed.
Sustainability 2024, 16(5), 1757; https://doi.org/10.3390/su16051757
Submission received: 16 November 2023
/
Revised: 31 January 2024
/
Accepted: 18 February 2024
/
Published: 21 February 2024
Abstract
:The rapid development of cities has led to increasingly problems in the road network structure of urban streets. Combining emerging big data technology with traditional street network analysis methods has become a new way to tackle it. Guilin is a famous international tourist city, and the “Two Rivers and Four Lakes” scenic area is an iconic symbol of Guilin’s scenery. Its streets connect various tourist spots. This study focused on the street’s layout of the “Two Rivers and Four Lakes” scenic area, and used a combination of spatial syntax and POI big data to analyse their spatial structure. The research results indicated that: (1) there was a positive correlation between the global integration value of the street and the POI value; (2) by combining functional density indicators with global integration analysis, streets that significantly deviate from the overall trend can be identified, and classified according to their characteristics to reveal the reasons for their contradictions; (3) we needed to propose three plans for optimizing the proportion of high street, enhancing street functions, and “improving street space” for different types of streets to ultimately realize the purpose of sustainable development of streets and cities.
1. Background
Streets greatly affect the spatial structure of cities and are essential for their development, while rapid urbanization has made urban spatial structures increasingly complex. Guilin is an international tourist city, with the “Two Rivers and Four Lakes” scenic area located in its central urban area. It consists of the Li river and Taohua river, as well as the four lakes of Shanhu, Ronghu, Guihu, and Mulong, forming the surrounding water system of Guilin city. It is a landmark of Guilin. Although Guilin has a high reputation in the international community, the central urban area where the “Two Rivers and Four Lakes” scenic area is located has become increasingly prominent due to the increasing number of tourists. The contradiction between the functional composition of its streets and its road network has had a significant impact on tourists’ sightseeing and citizens’ lives, thereby limiting the sustainable development of the region.
The planning of Guilin since the Tang Dynasty was based on the topography of the land; there is a strong “feng shui concept” and “choose the land to build the city” urban construction idea. Roads are mostly parallel or perpendicular to the water system, leading to the formation of an irregular road network that differs from the traditional square grid or radial pattern. Therefore, the method of selecting the structure of the street network in Guilin city, on the other hand, requires multidimensional considerations.
In fact, the structure of street networks has always been a focus of research for planners. The concept of modernism in the last century made transportation function the dominant factor in urban form design. The description of street network morphology is also based on the dynamic characteristics of traffic flow. Hagget and Chorley proposed that network analysis techniques should be divided into two categories: network geometric structure analysis and network topological structure analysis [1].
Over the last decades, scholars believed that the interpretation of urban street networks based on transportation cannot truly reflect all the characteristics of urban network space, making the change from simple transportation functions to the urban place functions and experiences of street space [2,3].
During this period, most studies on urban streets used qualitative methods to conduct characteristic analysis of street networks. With the increasing demand for cognitive understanding of street systems, people need more precise descriptions to guide design. A series of new quantitative description technologies for street systems have emerged. Giuseppe Borruso identified and defined urban boundaries by analysing the spatial distribution patterns of network density during his research on the boundaries of urban centres in Trieste, Italy, and Swindon, UK [4]. Tsiota constructed urban street network models using different modelling methods and analysed different feature indicators [5]. The content and methods for analysing the structure of street networks are constantly improving, and suitable research methods need to be selected based on the characteristics of the research scope.
Since Hillier proposed spatial syntax, new access points have emerged for spatial understanding, which is the study of street spatial topological relationships in 1970s. With the deepening of spatial syntax research, it has become an effective scientific method for topological analysis of street spatial structure, which has been widely recognized and used by professionals in the international industry. Hillier proposed spatial syntax as a form analysis theory and method practice for deconstructing urban space through spatial cognition, which was subsequently widely applied in the topology research of street space [6]. Marshall proposed path structure analysis on this basis [7].
International scholars have applied spatial syntax to analyse urban spatial morphology [8], explain the growth and development structure of urban space [9], explore the relationship between human behaviour and street space [10], and explore the relationship between urban spatial structural features and spatial shaping features [11]. At the same time, many scholars combine spatial syntax with other methods, theories, and technical methods when exploring urban spatial issues, which increases the scientific nature of the research. Esposito used a combination of spatial syntax and spatial cognition to cross check and verify the results of overlap, and validated the results of spatial syntax methodology using spatial cognition [12]. Atakara combined spatial syntax with GIS technology to analyse the urban spatial growth of Famagusta city, enhancing the rigor of the research and paying attention to the details of the spatial growth and morphological evolution of Famagusta city [13]. Srivanit utilised POI reflect economic activity functions, to explore the space syntax to measure the values of urban morphology, Finally, the Pearson index was used to study the relationship between the degree of spatial configuration of economic activities and spatial diversity patterns [14]. The combination of multiple research and technical methods to analyse urban issues has become a trend internationally.
In empirical research and quantitative analysis of urban space in China, most of them are based on spatial syntax, which also proves the inherent logic between spatial form and spatial function. Scholars mainly use spatial syntax to study spatial structure [15], road network morphology [16], and street space shaping [17]. Most scholars use geometric and topological analysis methods to analyse street space morphology. The research results have certain reference significance, but the results are limited to the study of street space morphology at the geometric and topological levels.
With the widespread use of mobile devices and the advancement of various location sensing technologies [18], the big data environment provides diverse technical support for conducting various researches. Scholars have used AI combined with computer vision technology to extract data related to vehicle trajectories, street view maps for business analysis, and heat maps to analyse the degree of crowd congregation [19,20].
Points of interest (POIs) are places of interest that are frequented by foot traffic during the day, including restaurants, supermarkets, transportation hubs, parks, cafes, and tourist attractions. POI data, characterized by its large sample size and fast updates, has been widely used in the fields of urban vitality measurement, intelligent transportation, and public service facilities. In the process of development in China, the number of published research results of POI has been on the rise since 2011. Nowadays, it has become one of the preferred data for many scholars. Multiple scholars have conducted in-depth research on the acquisition, mining, and classification processes of POI [21,22,23]. Bui believes that POI and urban road networks are important information for location-based services (LBS) and navigation. The association between POI and urban road networks has gained complementary advantages for each data source, which not only benefits various applications but also validates the reliability and accuracy of POI [23,24].
Xinglong Zhang conducted a study on the accessibility evaluation of public service facilities using POI, and concluded that POI data are widely used in spatial analysis and are applicable to accessibility analysis and evaluation [25]. Yu Wenhao and Ai Tinghua found that using the kernel density distribution of information can effectively explain the aggregation characteristics of certain elements in a region [26]. Li Ping conducted a correlation study on the distribution of POI data in street space [24,27]. Liang Fan [28] and Wang Mengdi [29] combined spatial syntax with POI data when studying urban space, and found that their validation results support each other.
Several scholars have proven that the research method of combining big data with existing traditional methods for street spatial structure is fully feasible. However, scholars only use big data to demonstrate the topological relationship of street spatial structure and have not delved into the mechanism of interaction between the two. At present, the complex spatial structure of streets in cities requires more rigorous research methods. The aim of this study was to fill the gap of spatial syntax in advanced spatial analysis and quantitative analysis. By combining spatial syntax with POI data, the structure analysis of the street road network was carried out, and the correlation of the two analysis results were investigated to understand the interaction between the two; further in-depth research was conducted on the geometric characteristics of the streets themselves, as well as the distribution and aggregation of POIs in order to identify the streets with abnormal street values in the “Two Rivers and Four Lakes” scenic area. Ultimately, the cause of the contradiction between individual streets and the overall road structure of the block and its solutions were explored, with the aim of using a single street optimisation method to drive the optimisation of the local area and even the overall road network structure of the street.
2. Data Sources and Research Methods
2.1. Data Sources
2.1.1. Data of Collection
The urban street data was collected from OSM (open street map) [30] and combined with the Baidu map to obtain the Guilin city satellite map and the current situation of the street to calibrate to each other, calculate the geometric length of the road to the axis of the drawing, and was then subsequently imported into Depthmap for analysis.
2.1.2. Data of POI
POI is also called point of interest data. POI data is the point data of real geographical entities, with spatial and attribute information, high accuracy, comprehensive coverage, fast updates, large data volume, etc., which is widely used in urban research. The POI point data of Guilin was acquired through the Baidu map API interface, downloaded, preprocessed and imported into ArcGIS10.2 software for visual representation. This study referred to Professor Long Ying’s classification of POIs. It combined the characteristics of urban development and the actual situation of Guilin city, the crawled POI data were screened and organized [31], and the study was carried out in six aspects, namely: government agencies, medical services, public facilities, shopping services, living services, science and education.
2.2. Research Methods
2.2.1. Spatial Abstract Model—Spatial Syntax
The commonly used spatial abstraction model method in “street urbanism” method is called spatial syntax. In this paper, spatial syntax was employed to analyse the street structure within the scope of the study and the inherent spatial connections.
Spatial syntax theory is a descriptive theory on the perception and understanding of inhabited space in the physical and social dimensions proposed by Professor B. Hillier of Barlett College, University of London, in the 1970s, and is a typical spatial abstraction model. The method focuses on the quantitative study of space and has been applied in the study of urban spatial morphology, the evolution of urban structure and pattern, the construction of urban transport networks, and the design of urban public space. Nowadays, the theory of spatial syntax has formed a relatively perfect theoretical system, methodology and application tools and is more and more applied to urban planning [32].
This research collected road data through OSM, and used CAD to further extract roads in the form of axes and imported them into Depthmap1.0 software. It quantitatively analysed the street structure and individual characteristics of the research scope and surrounding areas, mainly using integration to summarise the overall and individual characteristics of the street.
The degree of integration reflected the degree of agglomeration and deaglomeration of space and local space. In general, the larger the value of the integration degree, the higher the accessibility of the space in the whole spatial system; integration was used to describe how far this street was from other streets, measuring the space potential that reaches that street. On the contrary, the lower the value of the integration degree, the less the accessibility of the space in the entire spatial system [33]. The formula is as follows.
is a space, n is the number of axis lines. The total depth is the sum of the topological distance from any axis to all other axis.
Mean depth is the ratio of total depth to n − 1.
(relativized asymmetry) is a theoretical attributive method. of diamond is the axis model for scholars to choose on the basis of experience close to the average value of the total depth distribution of the real city. This pattern is called the “diamond” mode.
is a comparison of the real city axis with the of diamond with n axis lines.
Integration () is the inverse of .
2.2.2. Spatial Analysis and Statistics
(1) Kernel density method
To clarify the statistical effect of space, the kernel density method and interpolation method are the more commonly used research methods. What is reflected is the aggregation of POIs [27], which is calculated by the formula:
The kernel density is the value of the kernel density. If the value is higher, it means the denser the POI distribution in this area; if the value is lower, it means the more discrete the POI distribution.
(2) Functional Density
The functional density of the street and the density of POIs around the street are related to vitality [34]. The formula is:
2.3. Statistical Analysis Using Pearson Correlation Coefficient
Pearson’s correlation coefficient is also known as the sample correlation coefficient, product-moment correlation coefficient or correlation coefficient. It was introduced by Galton in 1877 and later developed by Pearson. It measures the linear relationship between two random variables. For example, it was used in this study to analyse the degree of association between two sets of data [35], The formula is as follows:
The Pearson correlation coefficient between two variables is defined as the quotient of the covariance and standard deviation between the two variables:
The above equation defines the overall correlation coefficient, commonly represented by lowercase Greek letters. Estimating the covariance and standard deviation of the sample yields the Pearson correlation coefficient, often represented by lowercase English letters:
The value of r is usually taken as an absolute value followed by an interval from 0 to 1 for linking intensity levels as shown in the table below (Table 1).
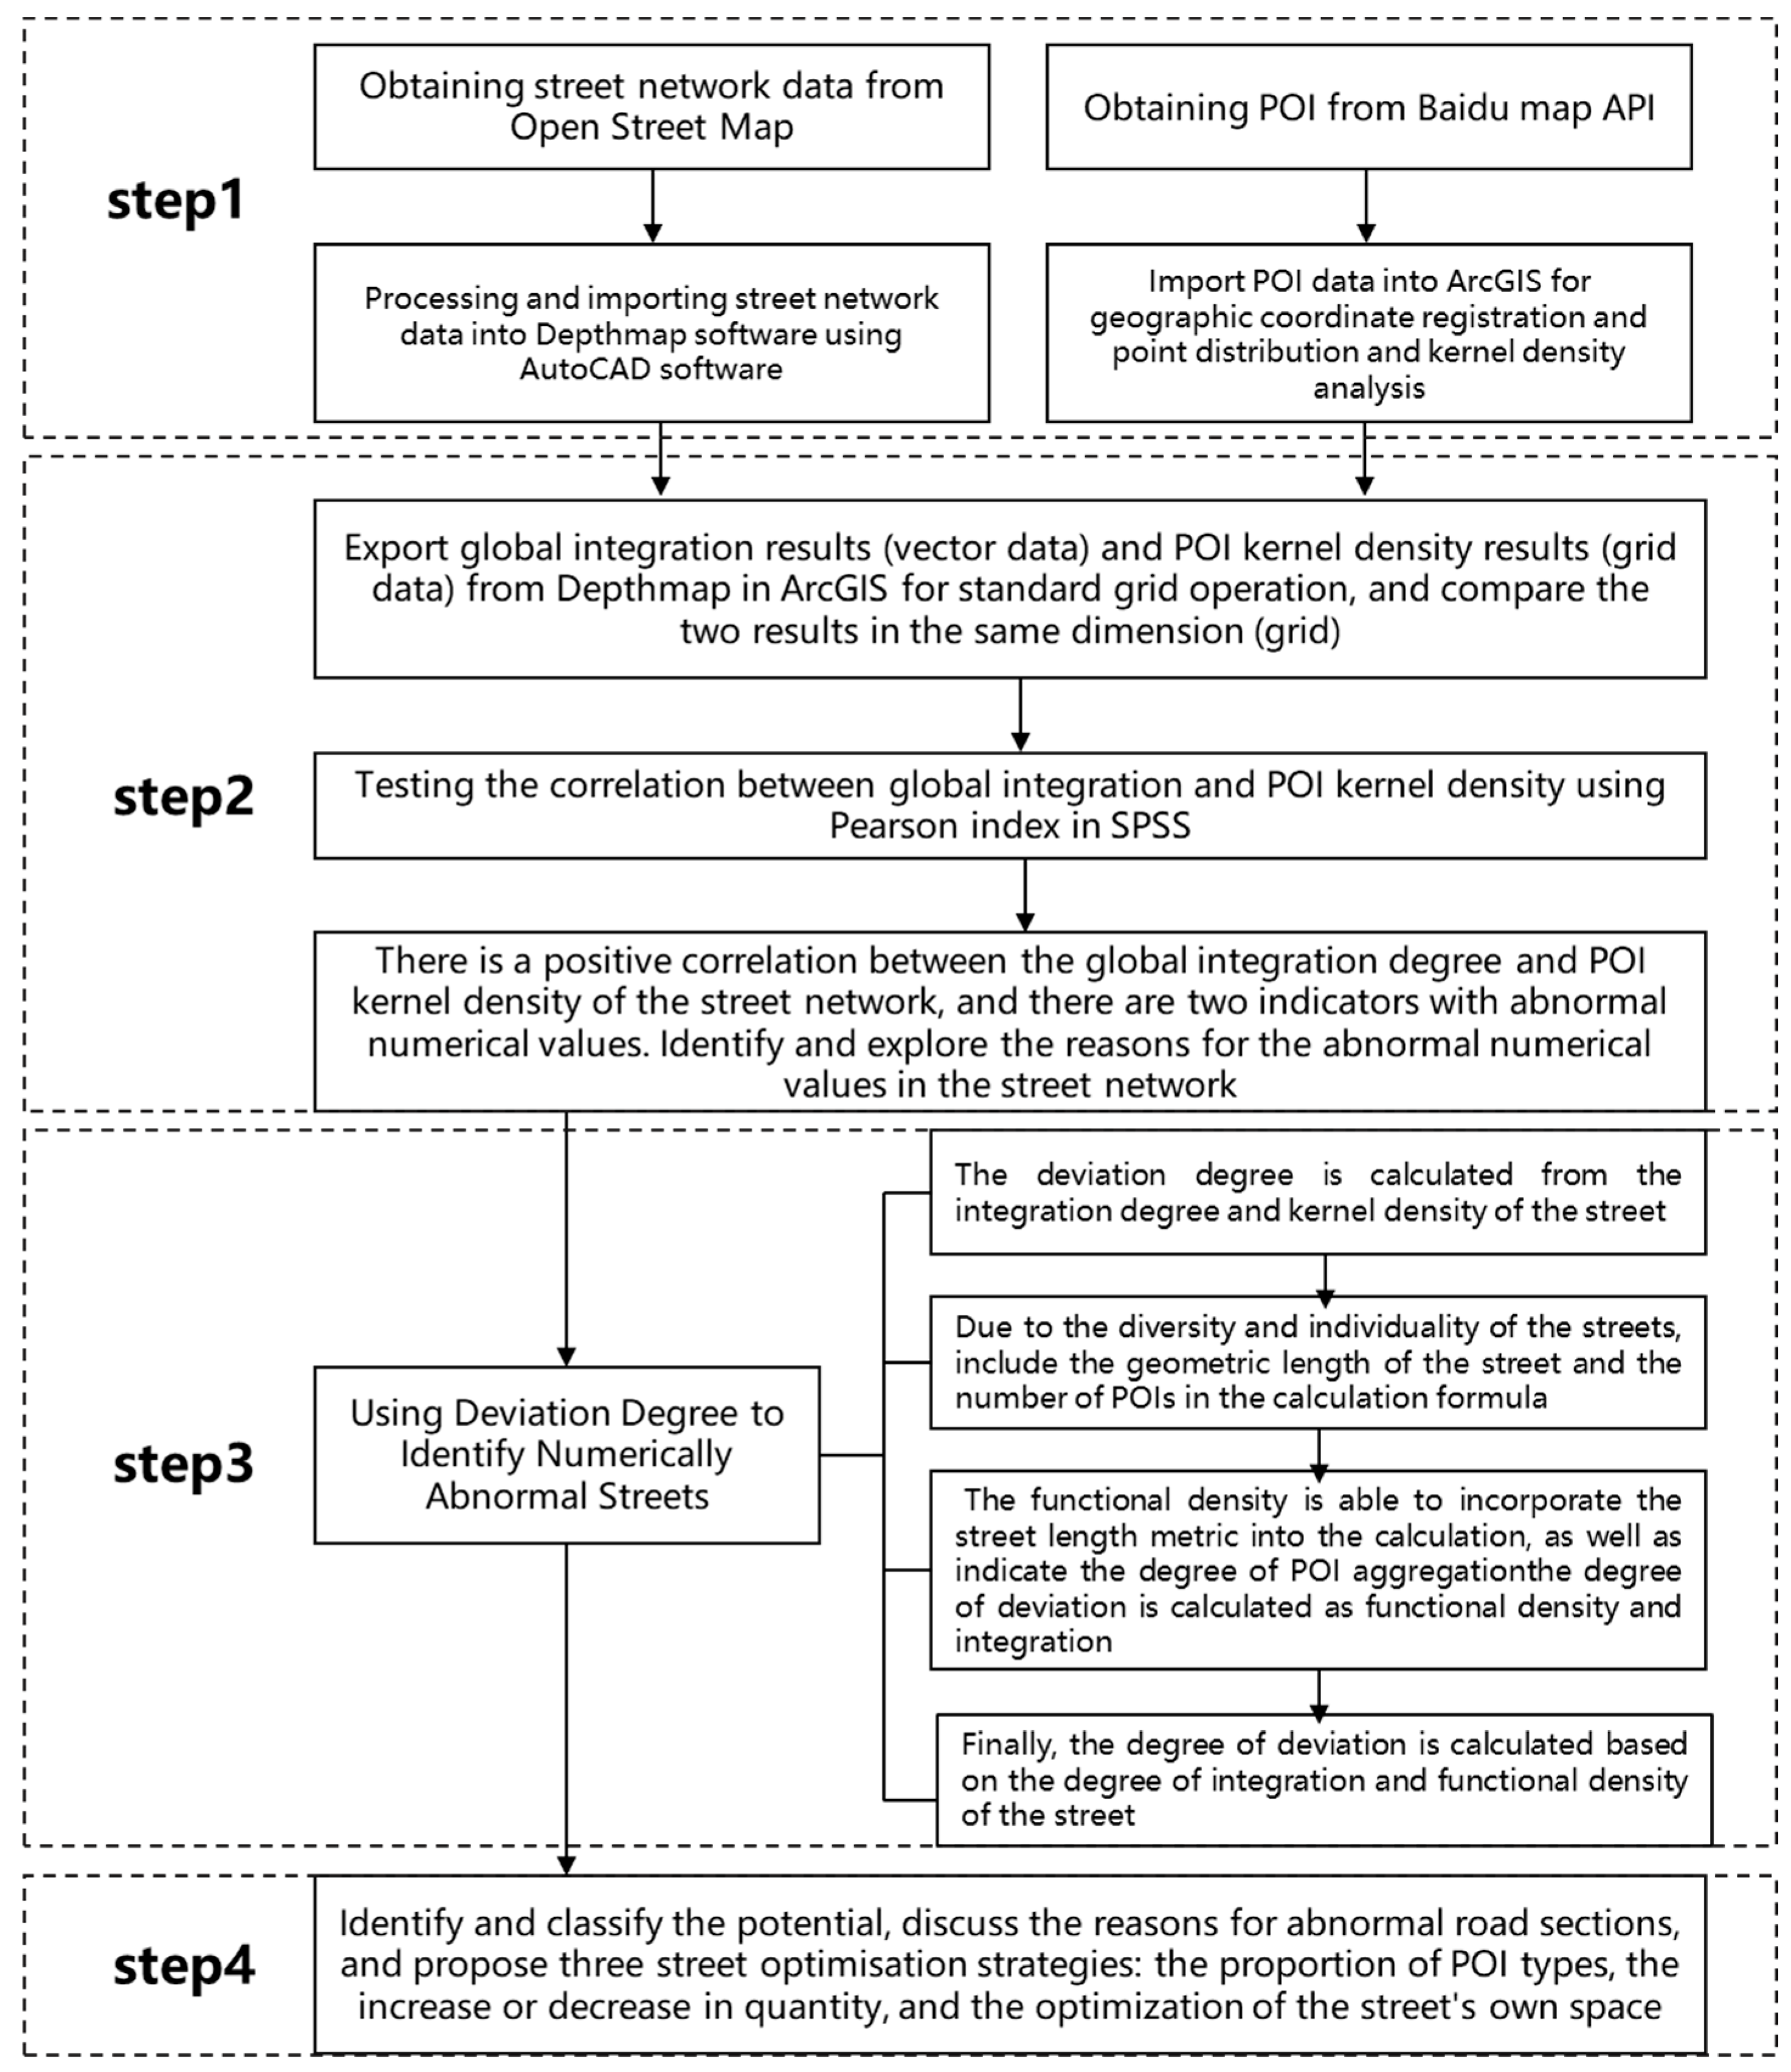
2.4. Technical Streamline
In order to better display the content of the paper, the research process is summarized by the technical streamline (Figure 1).
3. Analysis of the Current Situation of Street Network Structure
3.1. Research Scope
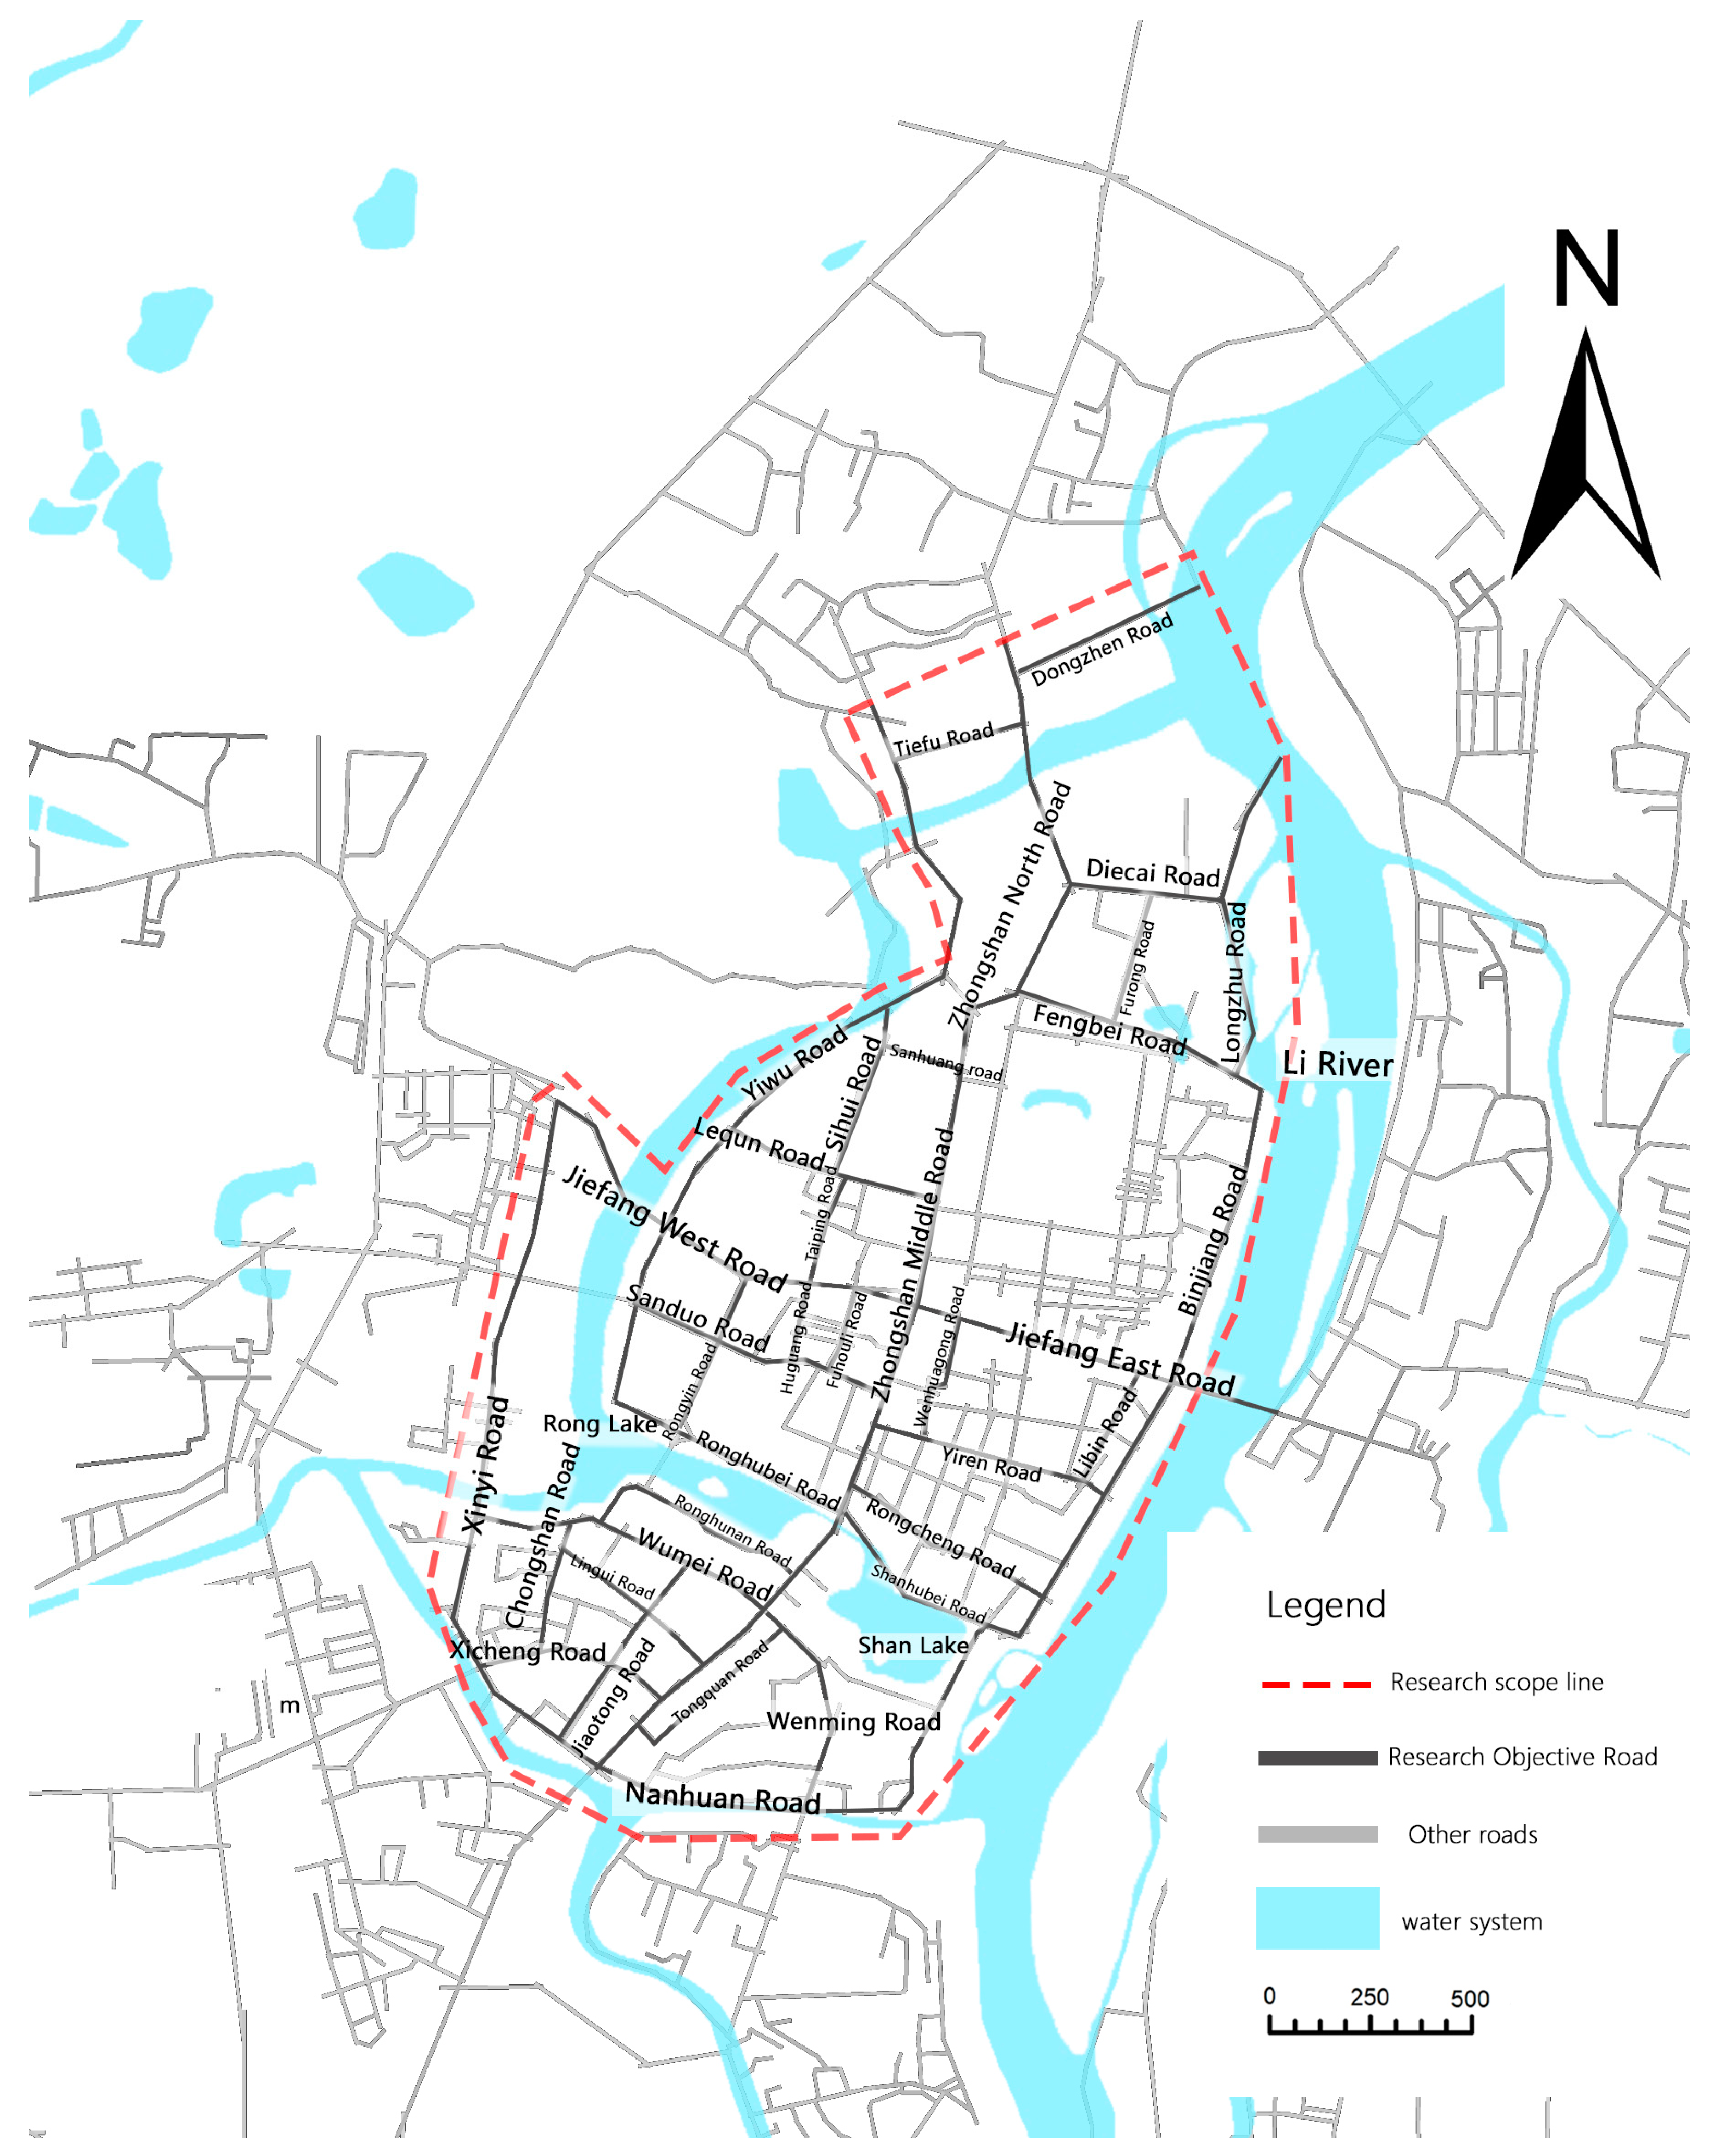
The “Two Rivers and Four Lakes” in Guilin city are important scenic spots in the central urban area of Guilin, depositing the historical and cultural heritage of Guilin. Due to the limitations of water system and terrain, the distribution, density, and direction of streets within the research scope in Guilin city are complex. Many famous scenic spots in Guilin, such as the Sun and Moon Twin Towers, Elephant Trunk Mountain, Jingjiang Prince’s Mansion, Mulong Lake, and Gunanmen, are connected by scenic streets, surrounded by the surrounding water system. At the same time, these streets also carry the dual functions of vehicle movement and residents’ daily commutes. Therefore, studying the streets within the scope of the “Two Rivers and Four Lakes” scenic area in Guilin can provide a new analytical method and theory for the sustainable development of the street space around the core scenic area in the urban centre. Section.
The research objects selected in this study were a total of 35 streets in the “Two Rivers and Four Lakes” urban water system belt, including the main roads, secondary roads, and branch roads that allow traffic and pedestrians to pass through (Figure 2). Specifically, it included six main roads, 12 secondary roads, and 17 branch roads. North to Dongzhen Road and Tiefo Road, south to Nanhuan Road, west to Yiwu Road and Xinyi Road in Guihu, east to Longzhu Road, Binjiang Road, and some sections of Nanhuan Road in Lijiang.
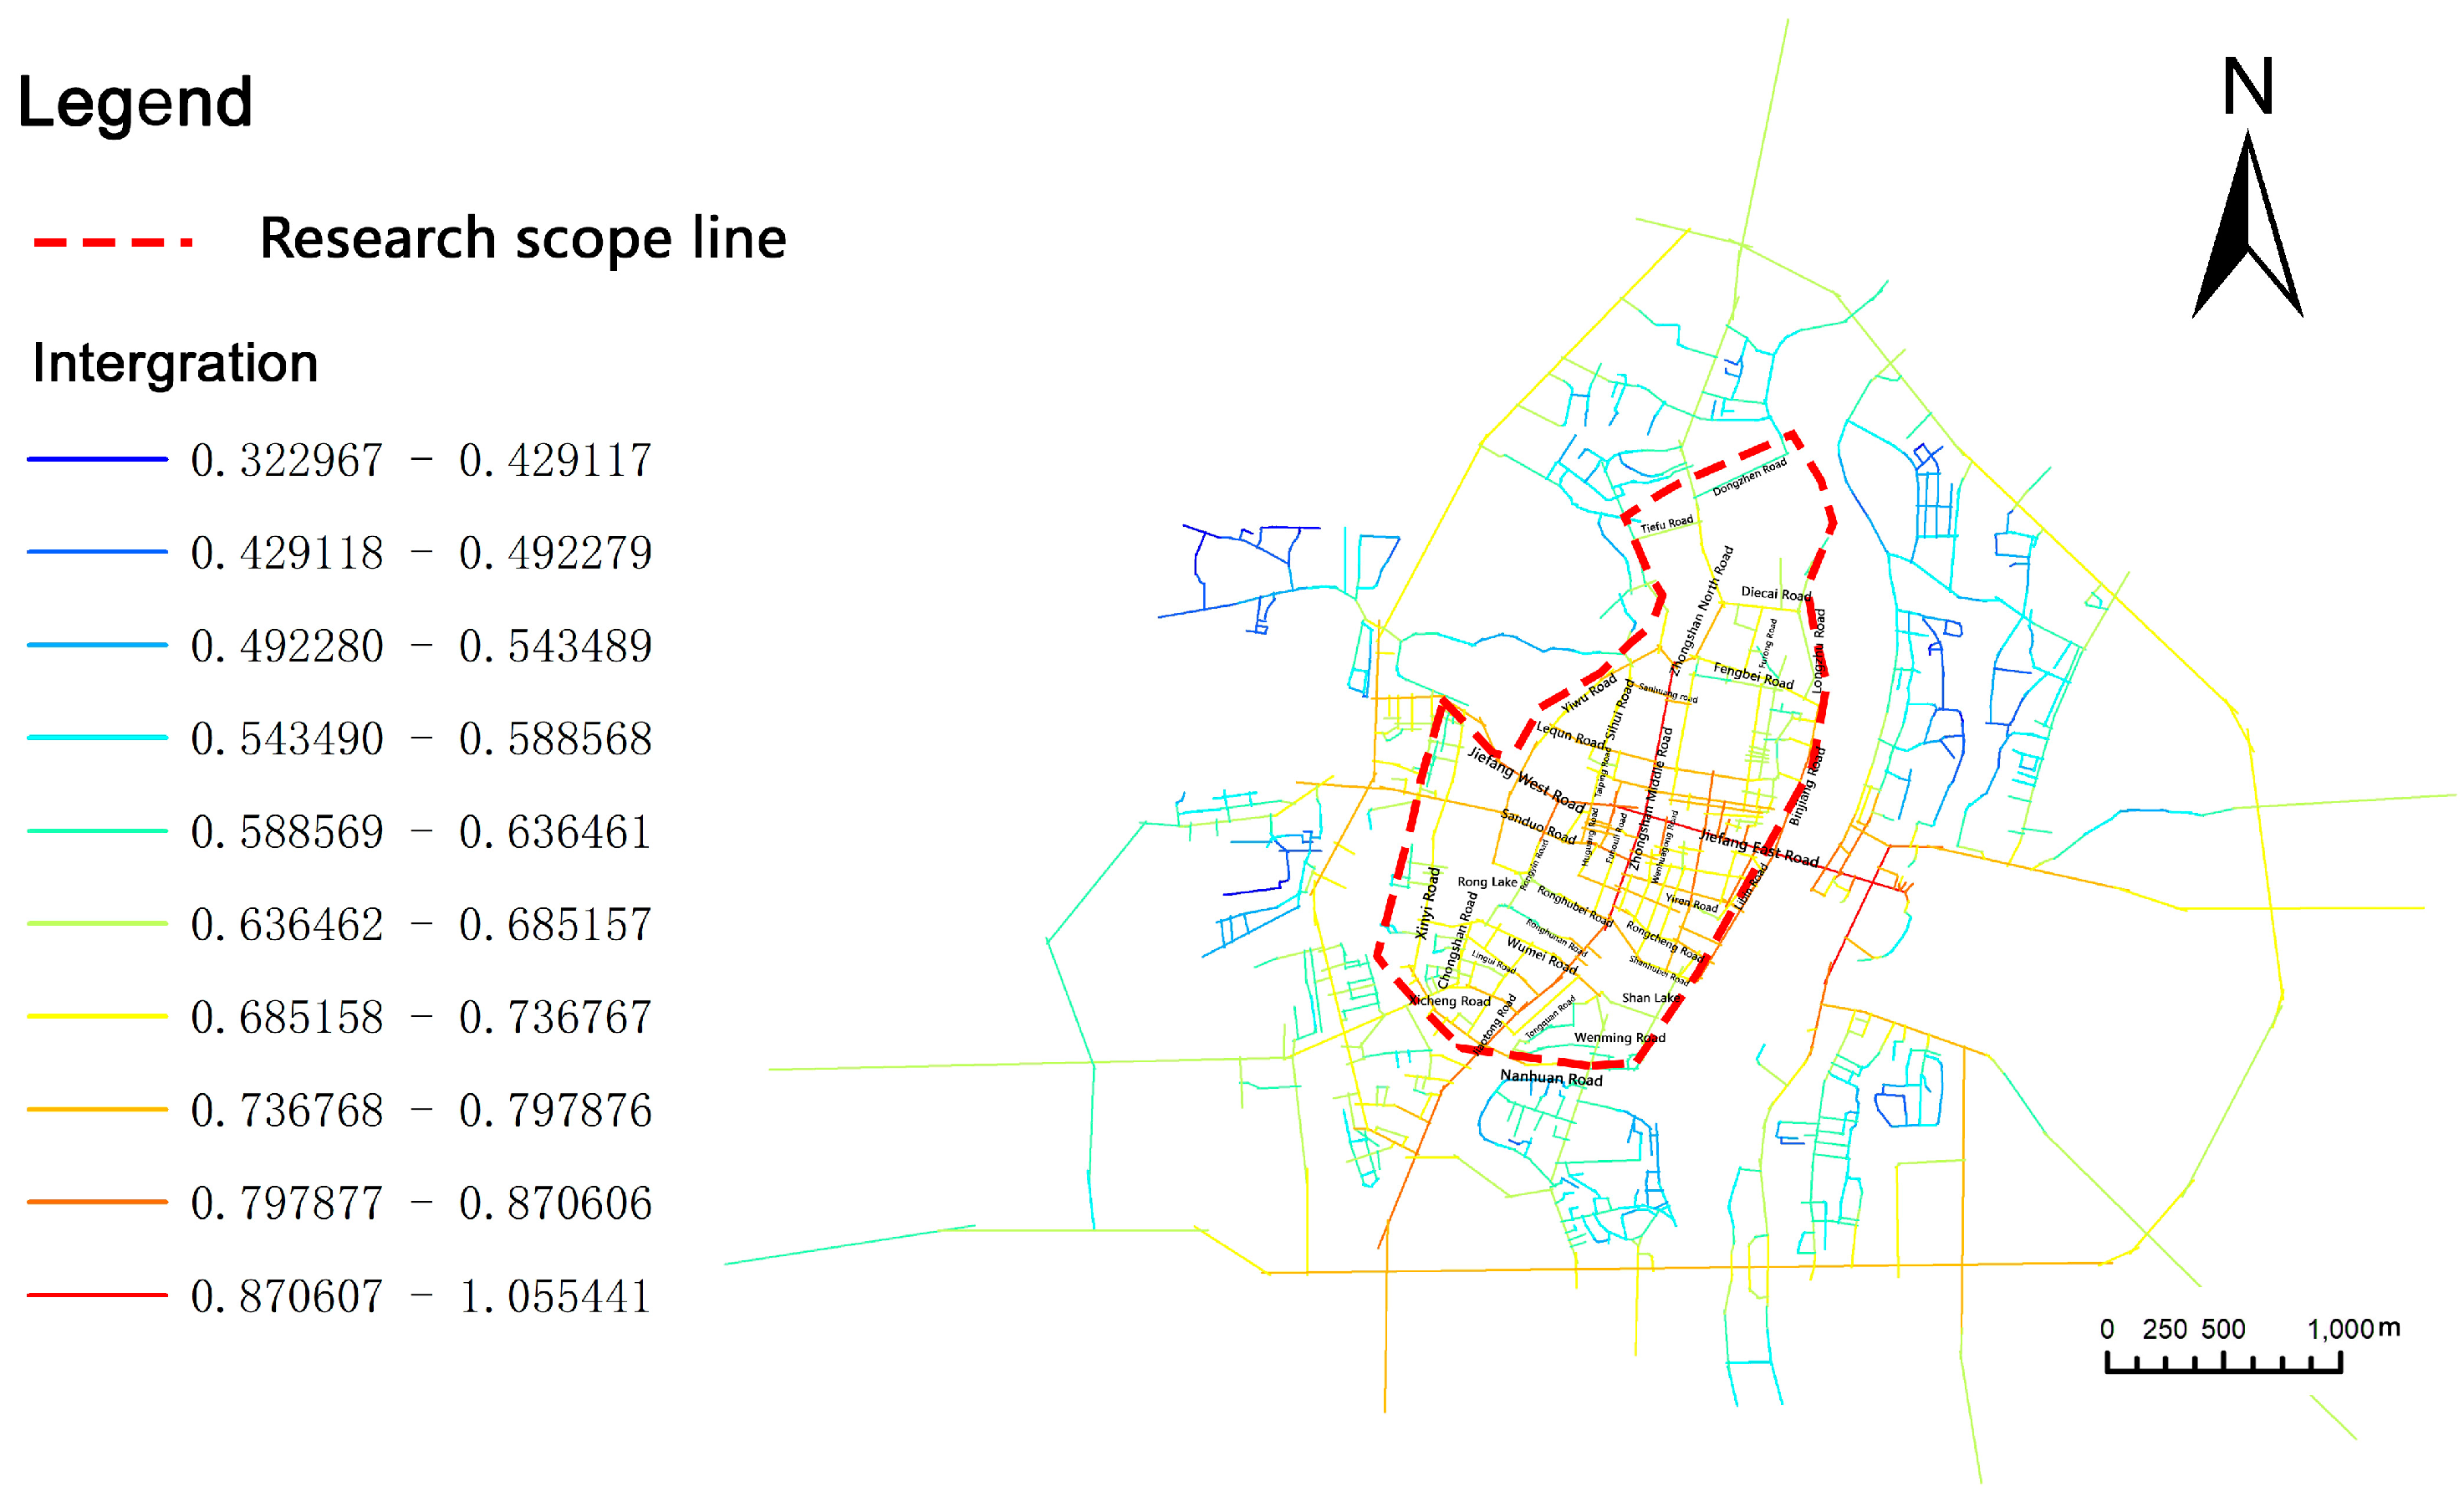
3.2. Analysis of Spatial Abstract Models—Integration Analysis
After the output of the Depthmap calculation, the integration visualisation results were obtained, and the change from warm to cold colours was usually used to represent the transition from high integration value to low integration value (Figure 3). Results were categorised using the natural discontinuity method. In order to avoid the selection of the scope limitations that led to the bias of local spatial analysis results, this paper selected the “Two Rivers and Four Lakes” scenic area of each level of streets and some streets outside the scope of the axial map drawing.
In general, streets with the highest level of overall integration were located at the geometric centre of the “Two Rivers and Four Lakes” area. The integration levels form a pattern of decreasing grades radiating outward from the central “cross-shaped” hub. Specifically, “Zhongshan Middle Road”, “Jiefang East Road”, and “Jiefang West Road” exhibited the highest overall integration levels, representing the highest accessibility. These three streets align with the core distribution of commercial, entertainment, cultural, and tourism functions, including the Micro-Smiling Pavilion, Dongxi Lane, Wangcheng Department Store, and Zhengyang Pedestrian Street.
On a local level, roads classified as orange (middle integration level) within the study area were primarily oriented perpendicular to “Jiefang Road” and “Zhongshan Middle Road”, while most other roads displayed warmer colours, indicating generally good overall street accessibility. Within this range, streets that connected more smoothly with surrounding roads were found in areas with greater coherence in their layout. In areas beyond this range, except for main roads and some secondary roads with higher integration levels, most internal streets were represented by cooler colours, indicating lower street accessibility. In summary, the streets within the “Two Rivers and Four Lakes” area generally exhibited good overall accessibility, and their quantified indicators aligned with the functional positioning of the “Two Rivers and Four Lakes” region.
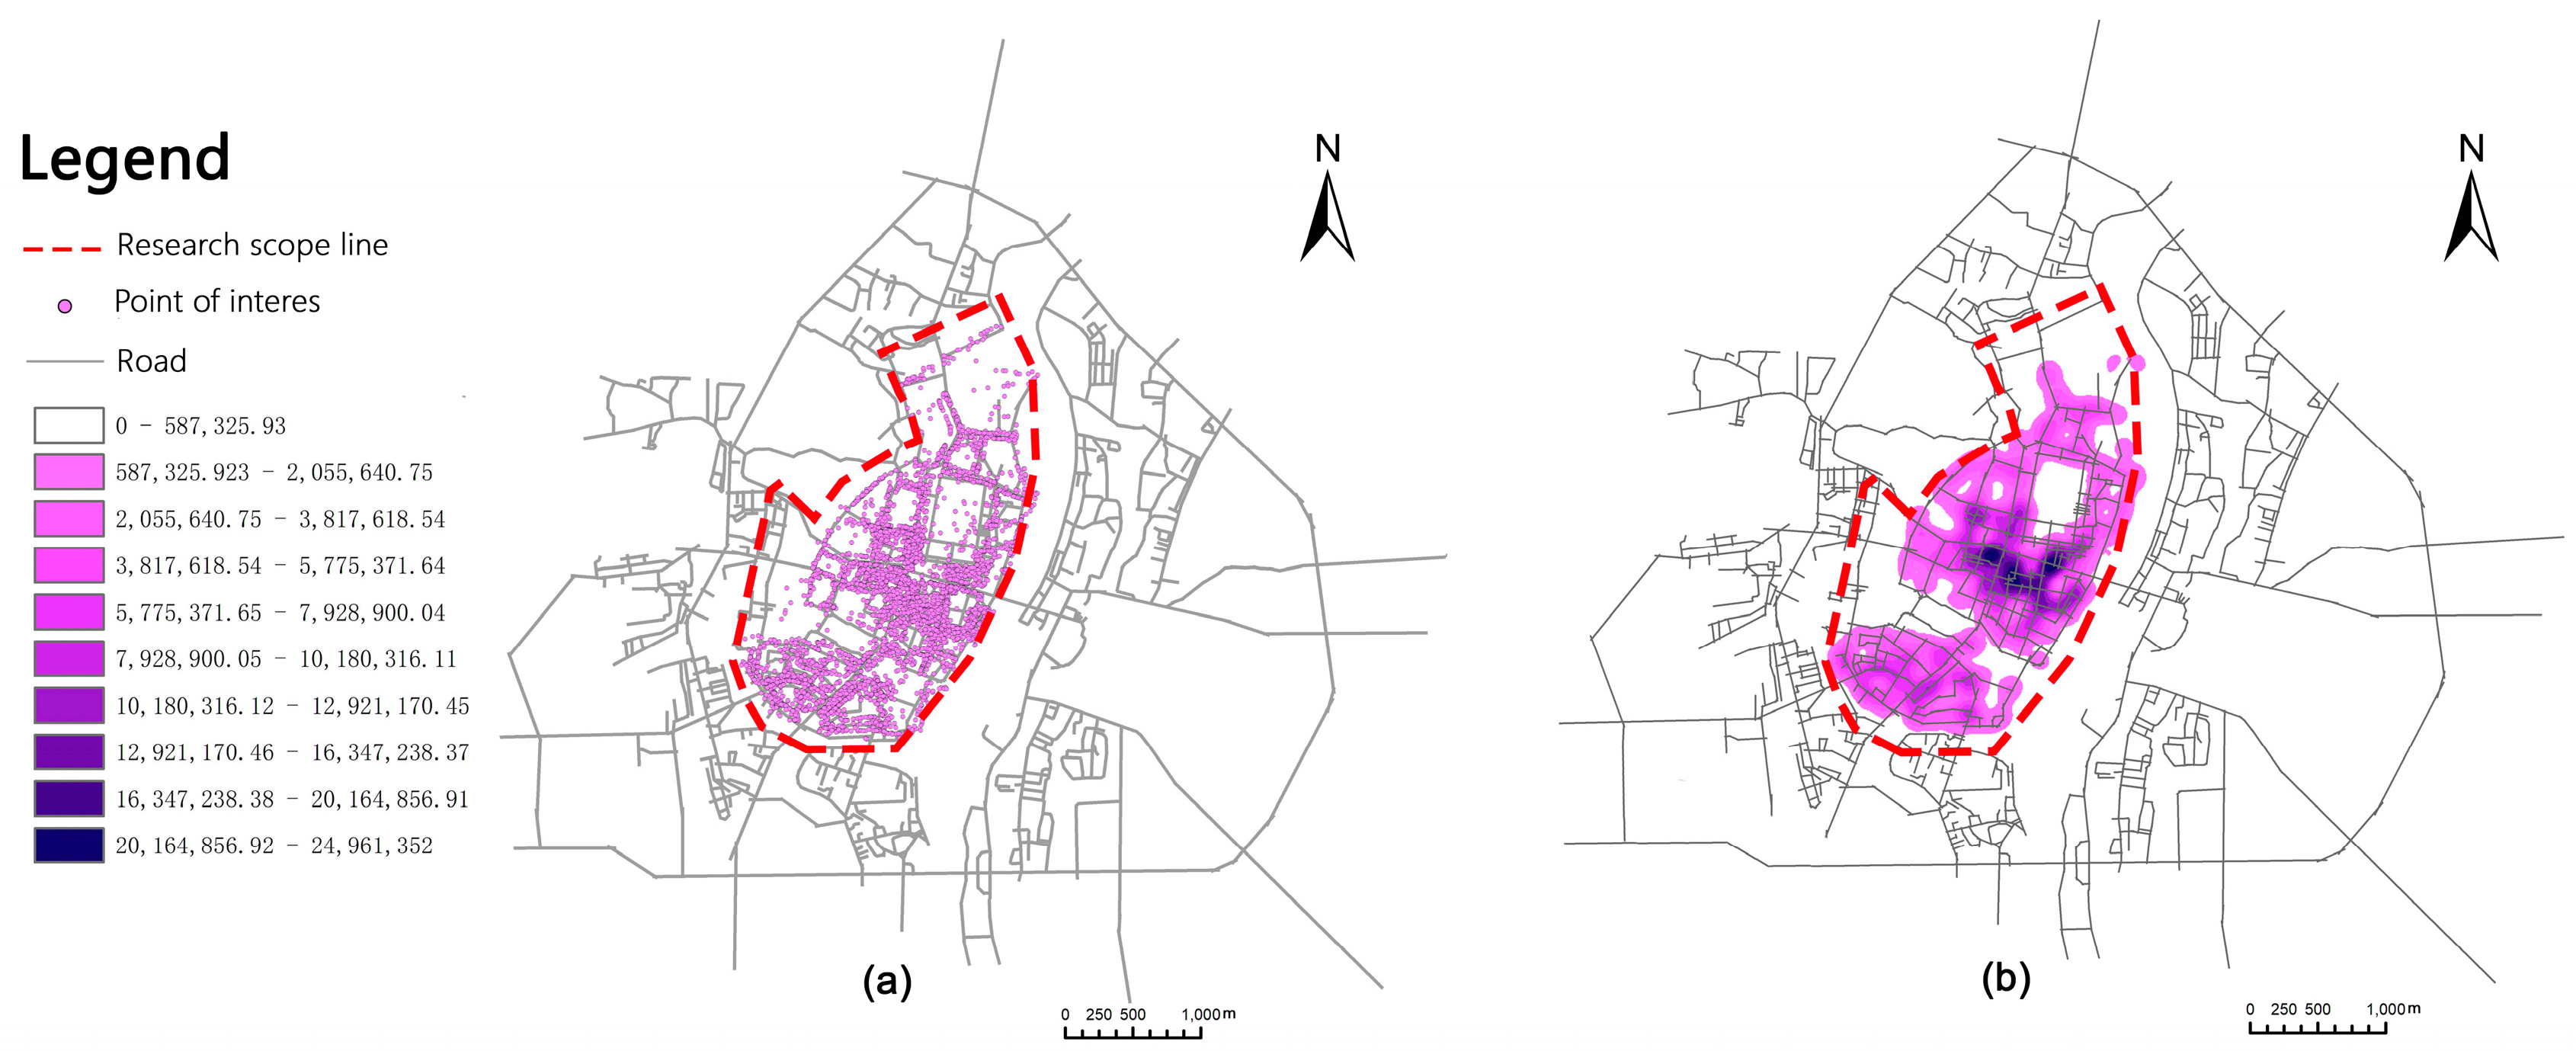
3.3. Spatial Analysis and Statistics—Analysis of POI Spatial Distribution
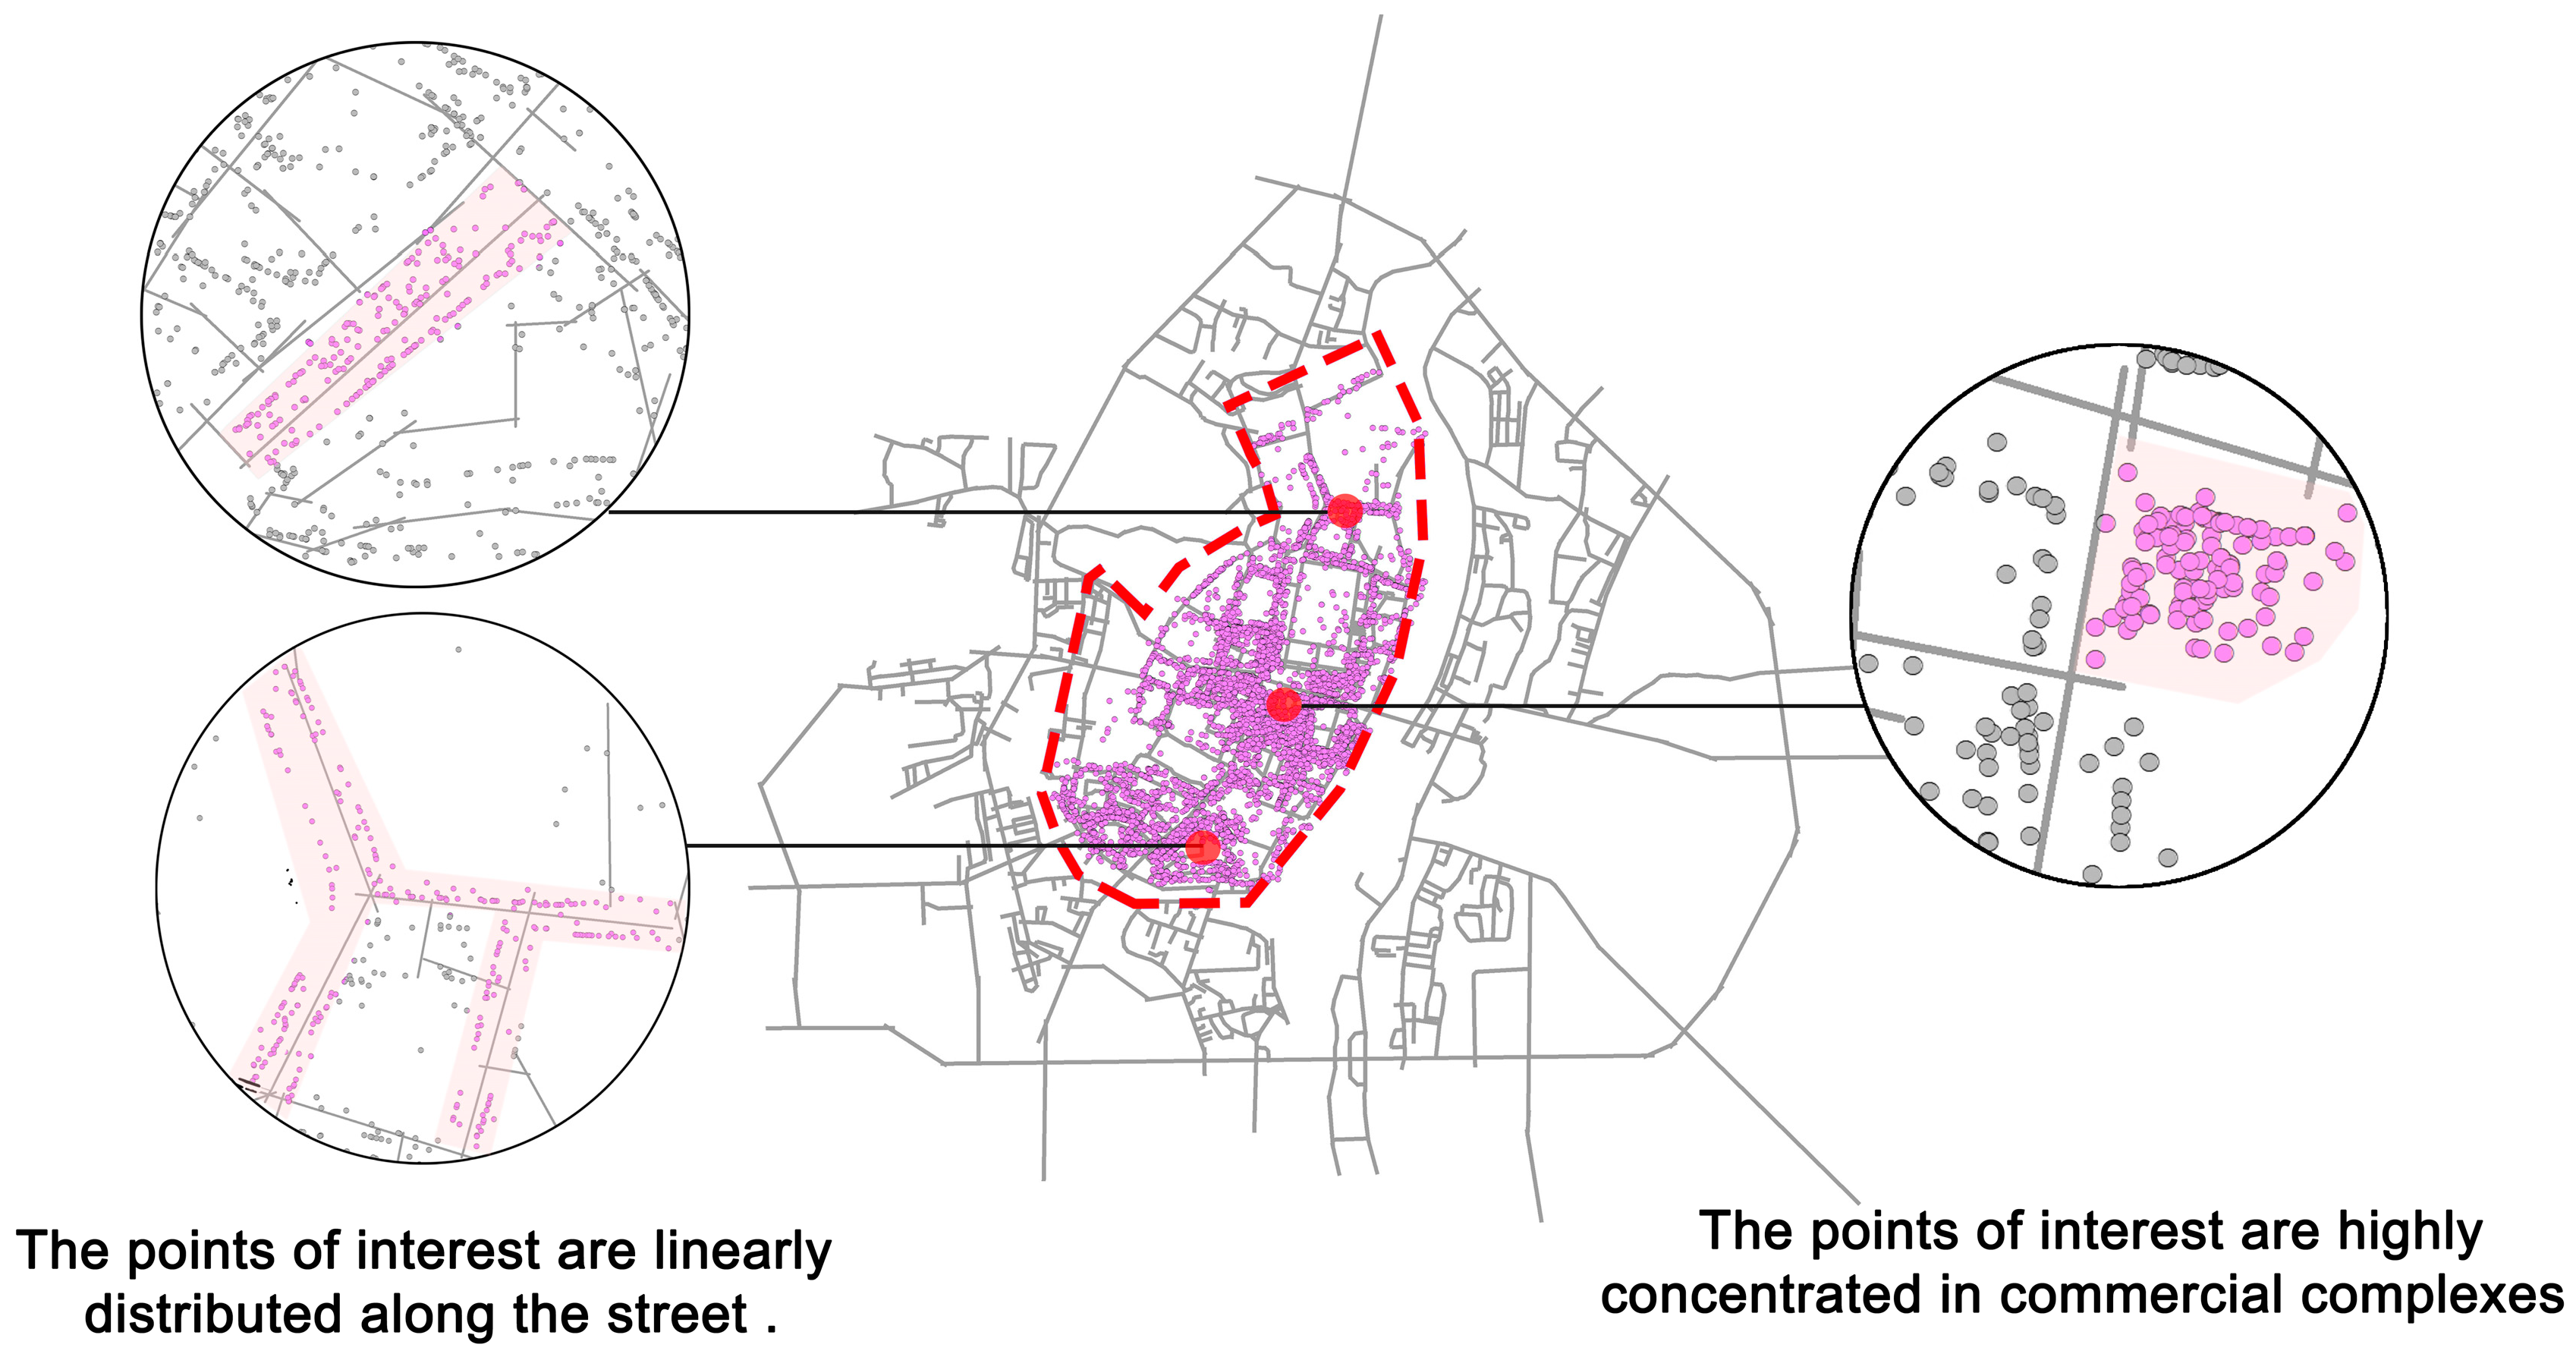
The application above of spatial syntax software for Depthmap integration analysis involved selecting a larger area than the study scope. Subsequently, in the following sections analysing POI data, POI distributionand kernel density calculation were analysed within the “Two Rivers and Four Lakes” scenic area and categorised using the natural discontinuity method as shown in Figure 4. The specific spatial characteristics of POI distribution are shown in Figure 5.
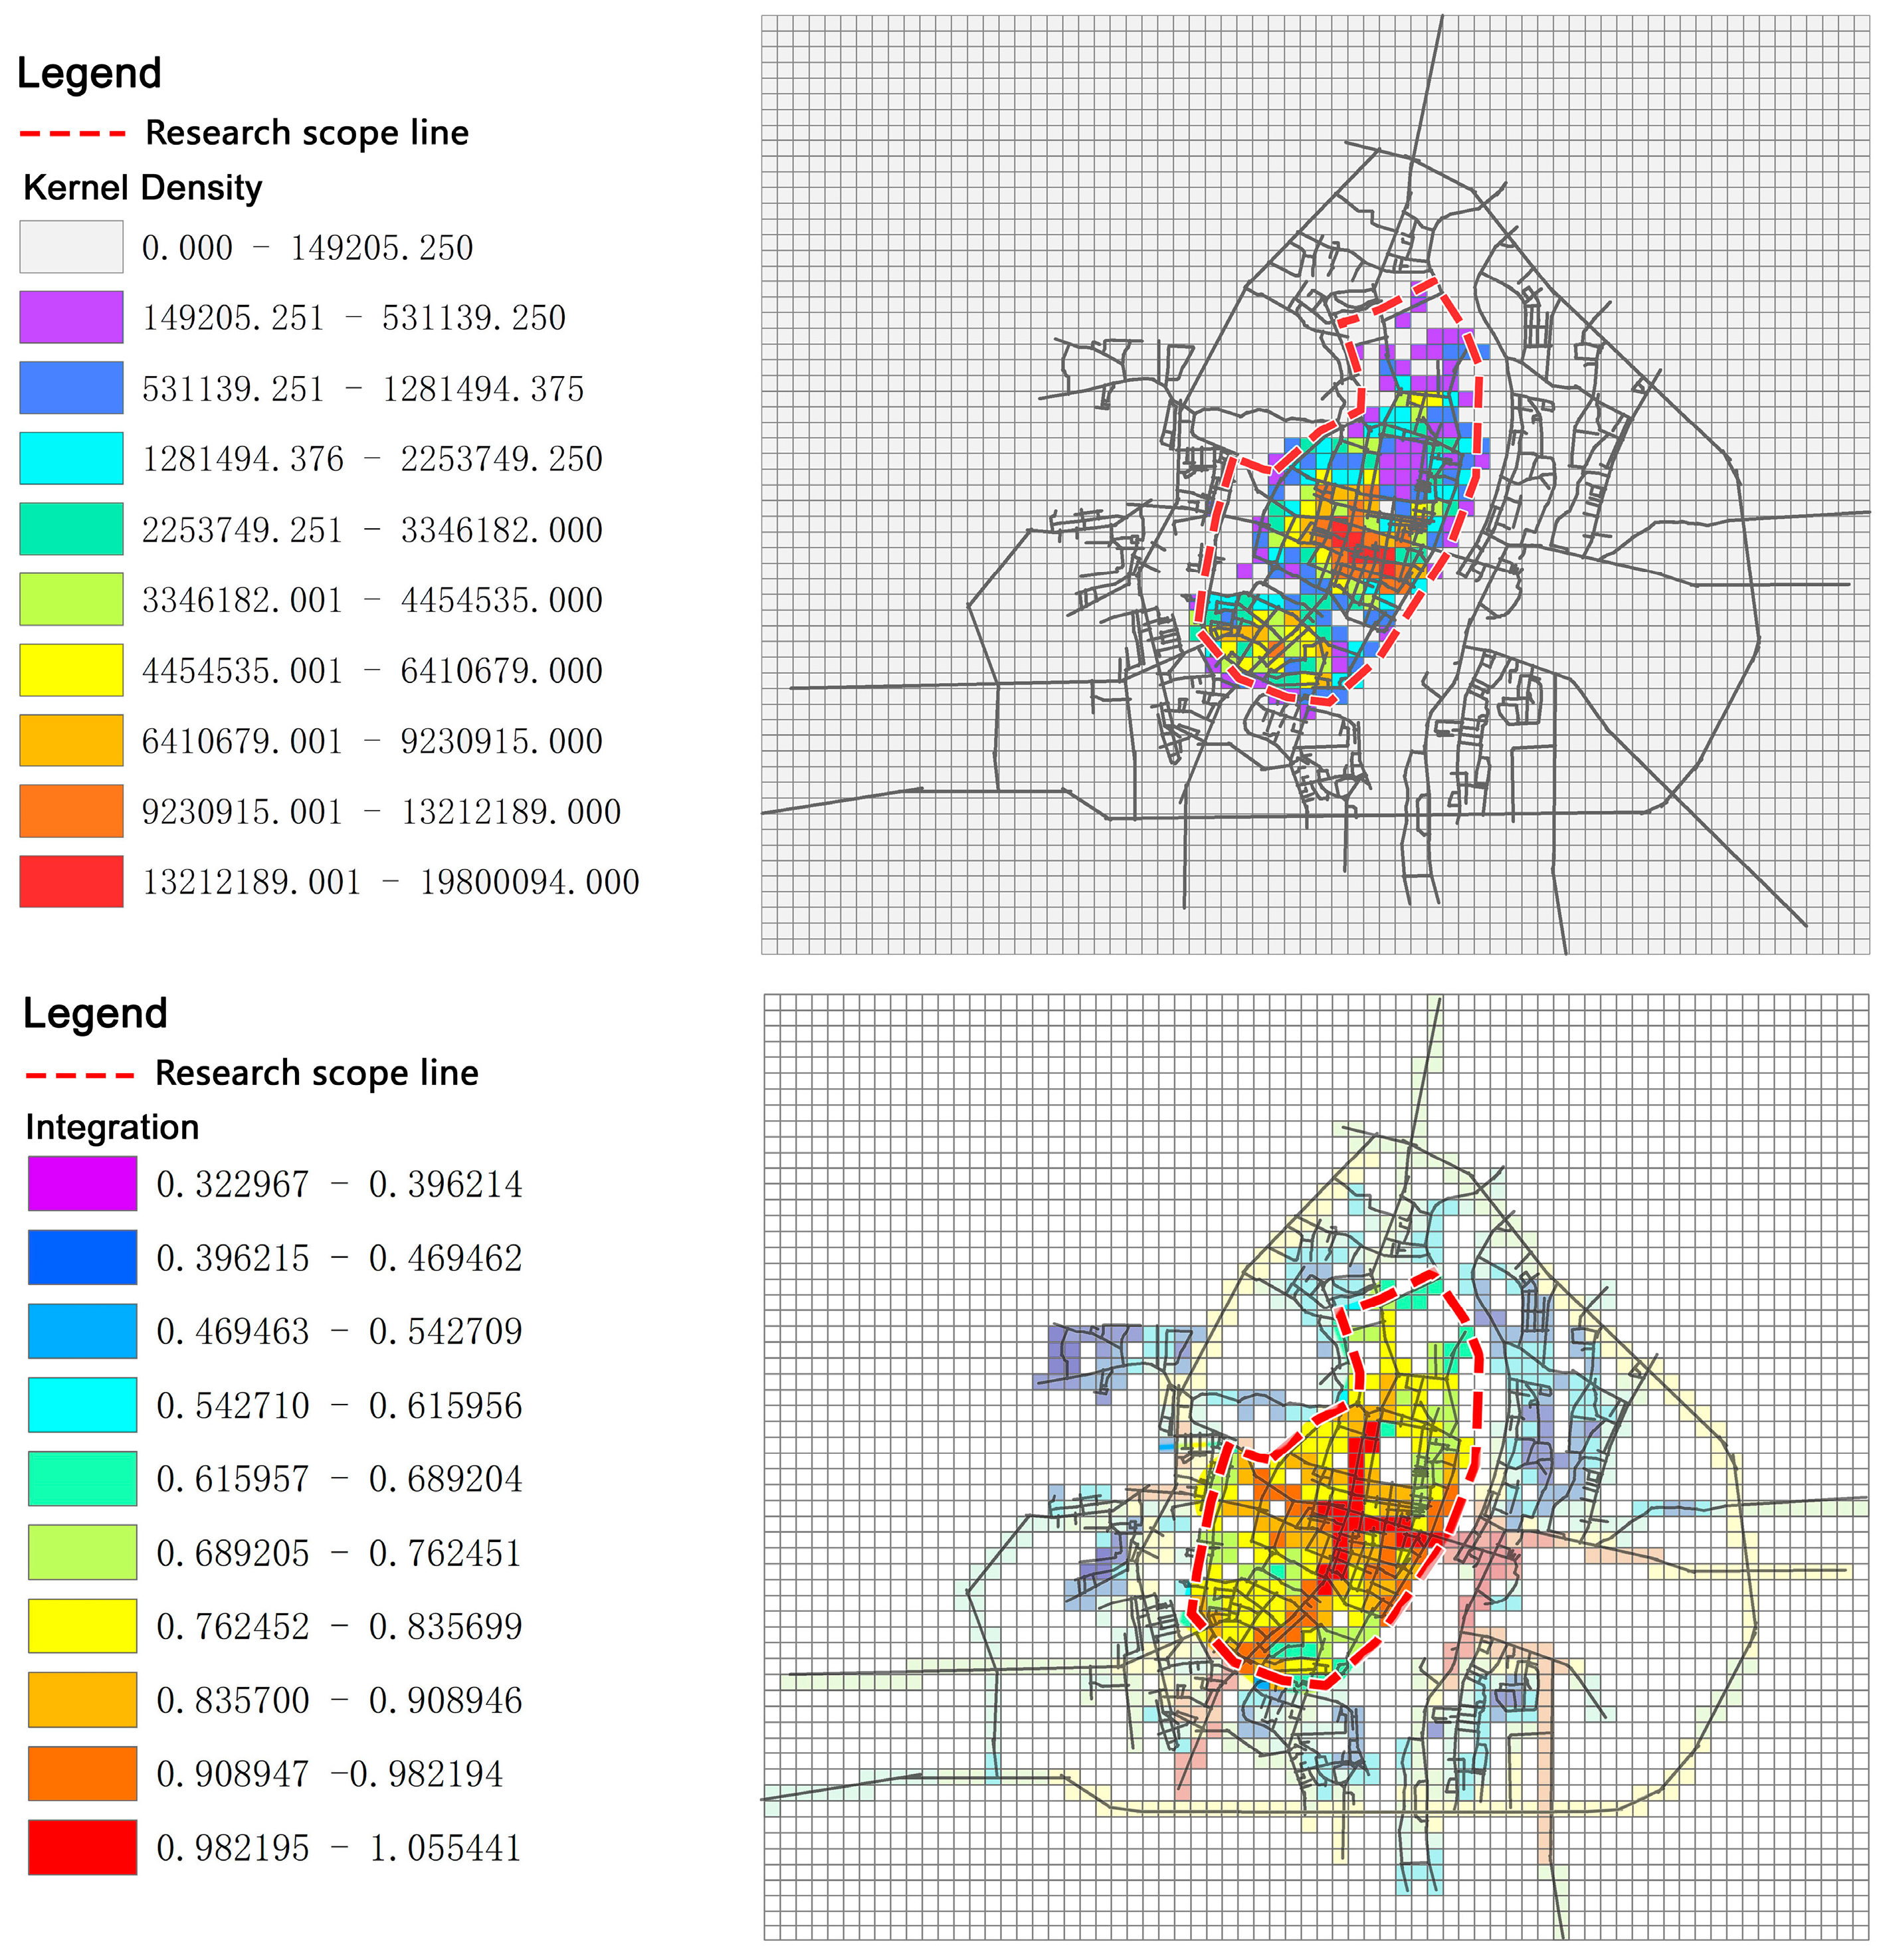
The results showed that POI points were linearly distributed along the street and were obviously clustered in the commercial complexes and pedestrian streets on both sides of Jiefang East Road and Jiefang West Road. However, the purely quantitative distribution map produced the phenomenon of overlapping points and incomplete display in the visual range, so the kernel density calculation by ArcGIS software was needed to reflect the degree of POI aggregation. The results showed that the highest kernel density was concentrated in the geometric centre of “Two Rivers and Four Lakes”, and the three kernel density poles were located on both sides of Jiefang Road and Zhongshan Middle Road, covering Zhengyang Pedestrian Street, and Weixiao Hall and Cultural Palace. In addition, the area of higher secondary nuclear density in the south was the neighbourhood of the Guilin department store building, i.e., to the right of Zhongshan Zhong Road. The distribution of other kernel density values was consistent with the street orientation. This distribution was similar to the hierarchical structure distribution of integration, and the relationship between the two will be further verified subsequently.
3.4. Spatial Data Correlation Testing
After the above analyses, it was found that there were multiple structural overlaps between integration and POI kernel density, so it was hypothesised that there was a correlation between the street characteristics themselves and the POI distribution. To verify this inference, the correlation analysis of the integration degree and POI kernel density values transformed the two kinds of data into the same dimension for data reprocessing. In this paper, grid analysis was performed in ArcGIS, and the two data were placed in the same range of fishing nets for spatial connection, with the results shown in Figure 6.
The grid through which each street passes was selected for data counting and processing and the corresponding values in the same range of each street were derived (Table 2) and subsequently imported into SPSS for bivariate Pearson analysis in Table 3.
The correlation coefficient from Table 3 was 0.628, which showed that integration was positively correlated with POI kernel density values, and the correlation laid between moderately strong and very strong. It showed that the street network structure was positively correlated with the POI kernel density values as a whole, although there were individual streets that deviated from the overall trend values.
The following section identified POI values that deviated significantly from the overall street network by using the deviation degree, with integration as the reference target, and explored the reasons for the contradiction between individual streets and the overall structure. The formula is as follows:
To explore the reasons for the contradiction between individual streets and the overall structure, it was necessary to incorporate the characteristics of the street itself into the research process in order to make the research results more reliable. Next, we observed the geometric characteristics of streets from the perspective of axes. Street length was one of the geometric features of a line segment and was used as a measure of a planar axis. Considering that the length of a roadway contained a lot of information, there was bound to be a significant gap between the businesses on either side of shorter and longer streets, with longer streets tending to have more urban activities. In addition, in the quantitative system indicators of street vitality in China [31], “street length” was used as the calculation of functional density (Formula (8)). Unlike the , functional density reflected the degree of POI aggregation per metre of the street.
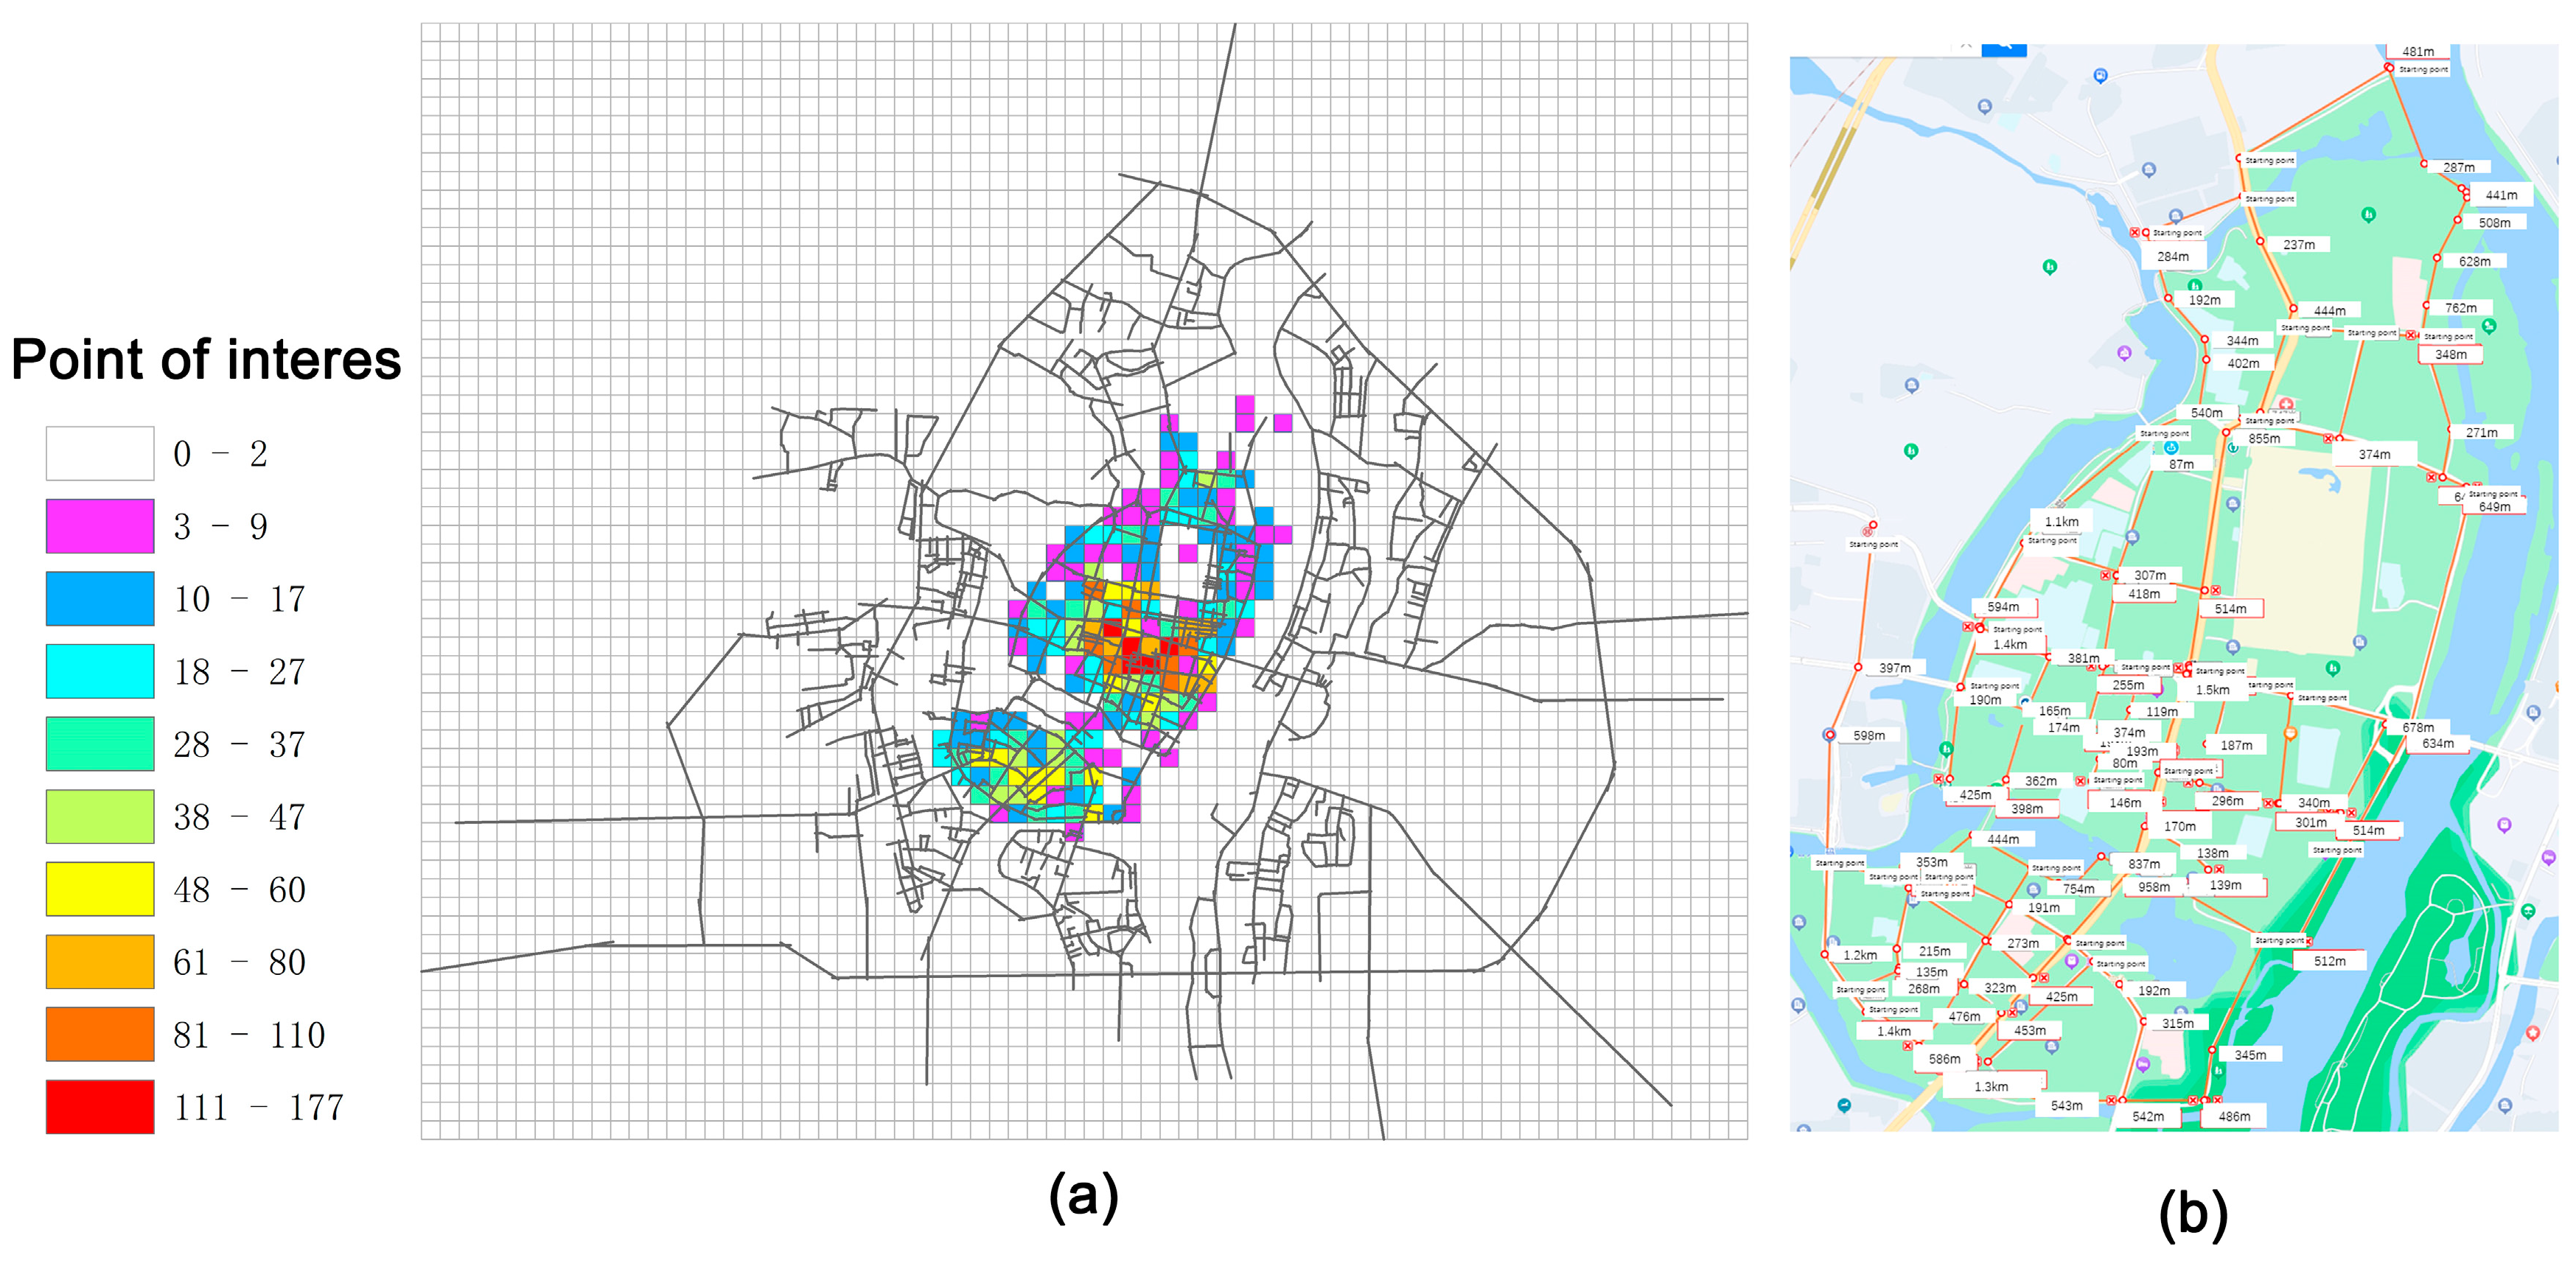
The number of POIs was also gridded, and the street length was obtained via the Baidu Maps measurement tool and OSM road network processing, as shown in Figure 7.
After obtaining the length of each street POI and the length of the street, the functional density results were calculated according to Formula (8) and shown in Table 4.
In fact, the kernel density of POI was achieved by creating an influence area (usually based on radius) around each point and calculating the number of points within that area. The functional density index was related to POI data and street geometric length.
In theory, the relationship between the two was close. To verify the functional density, while considering the geometric characteristics of the street, it can also reflect the aggregation ability like the POI kernel density calculation. In addition to the need for a correlation test between kernel density data and functional density data, it was also necessary to explore whether functional density had a similar correlation with integration for subsequent entry into the study. The results are shown in Table 5.
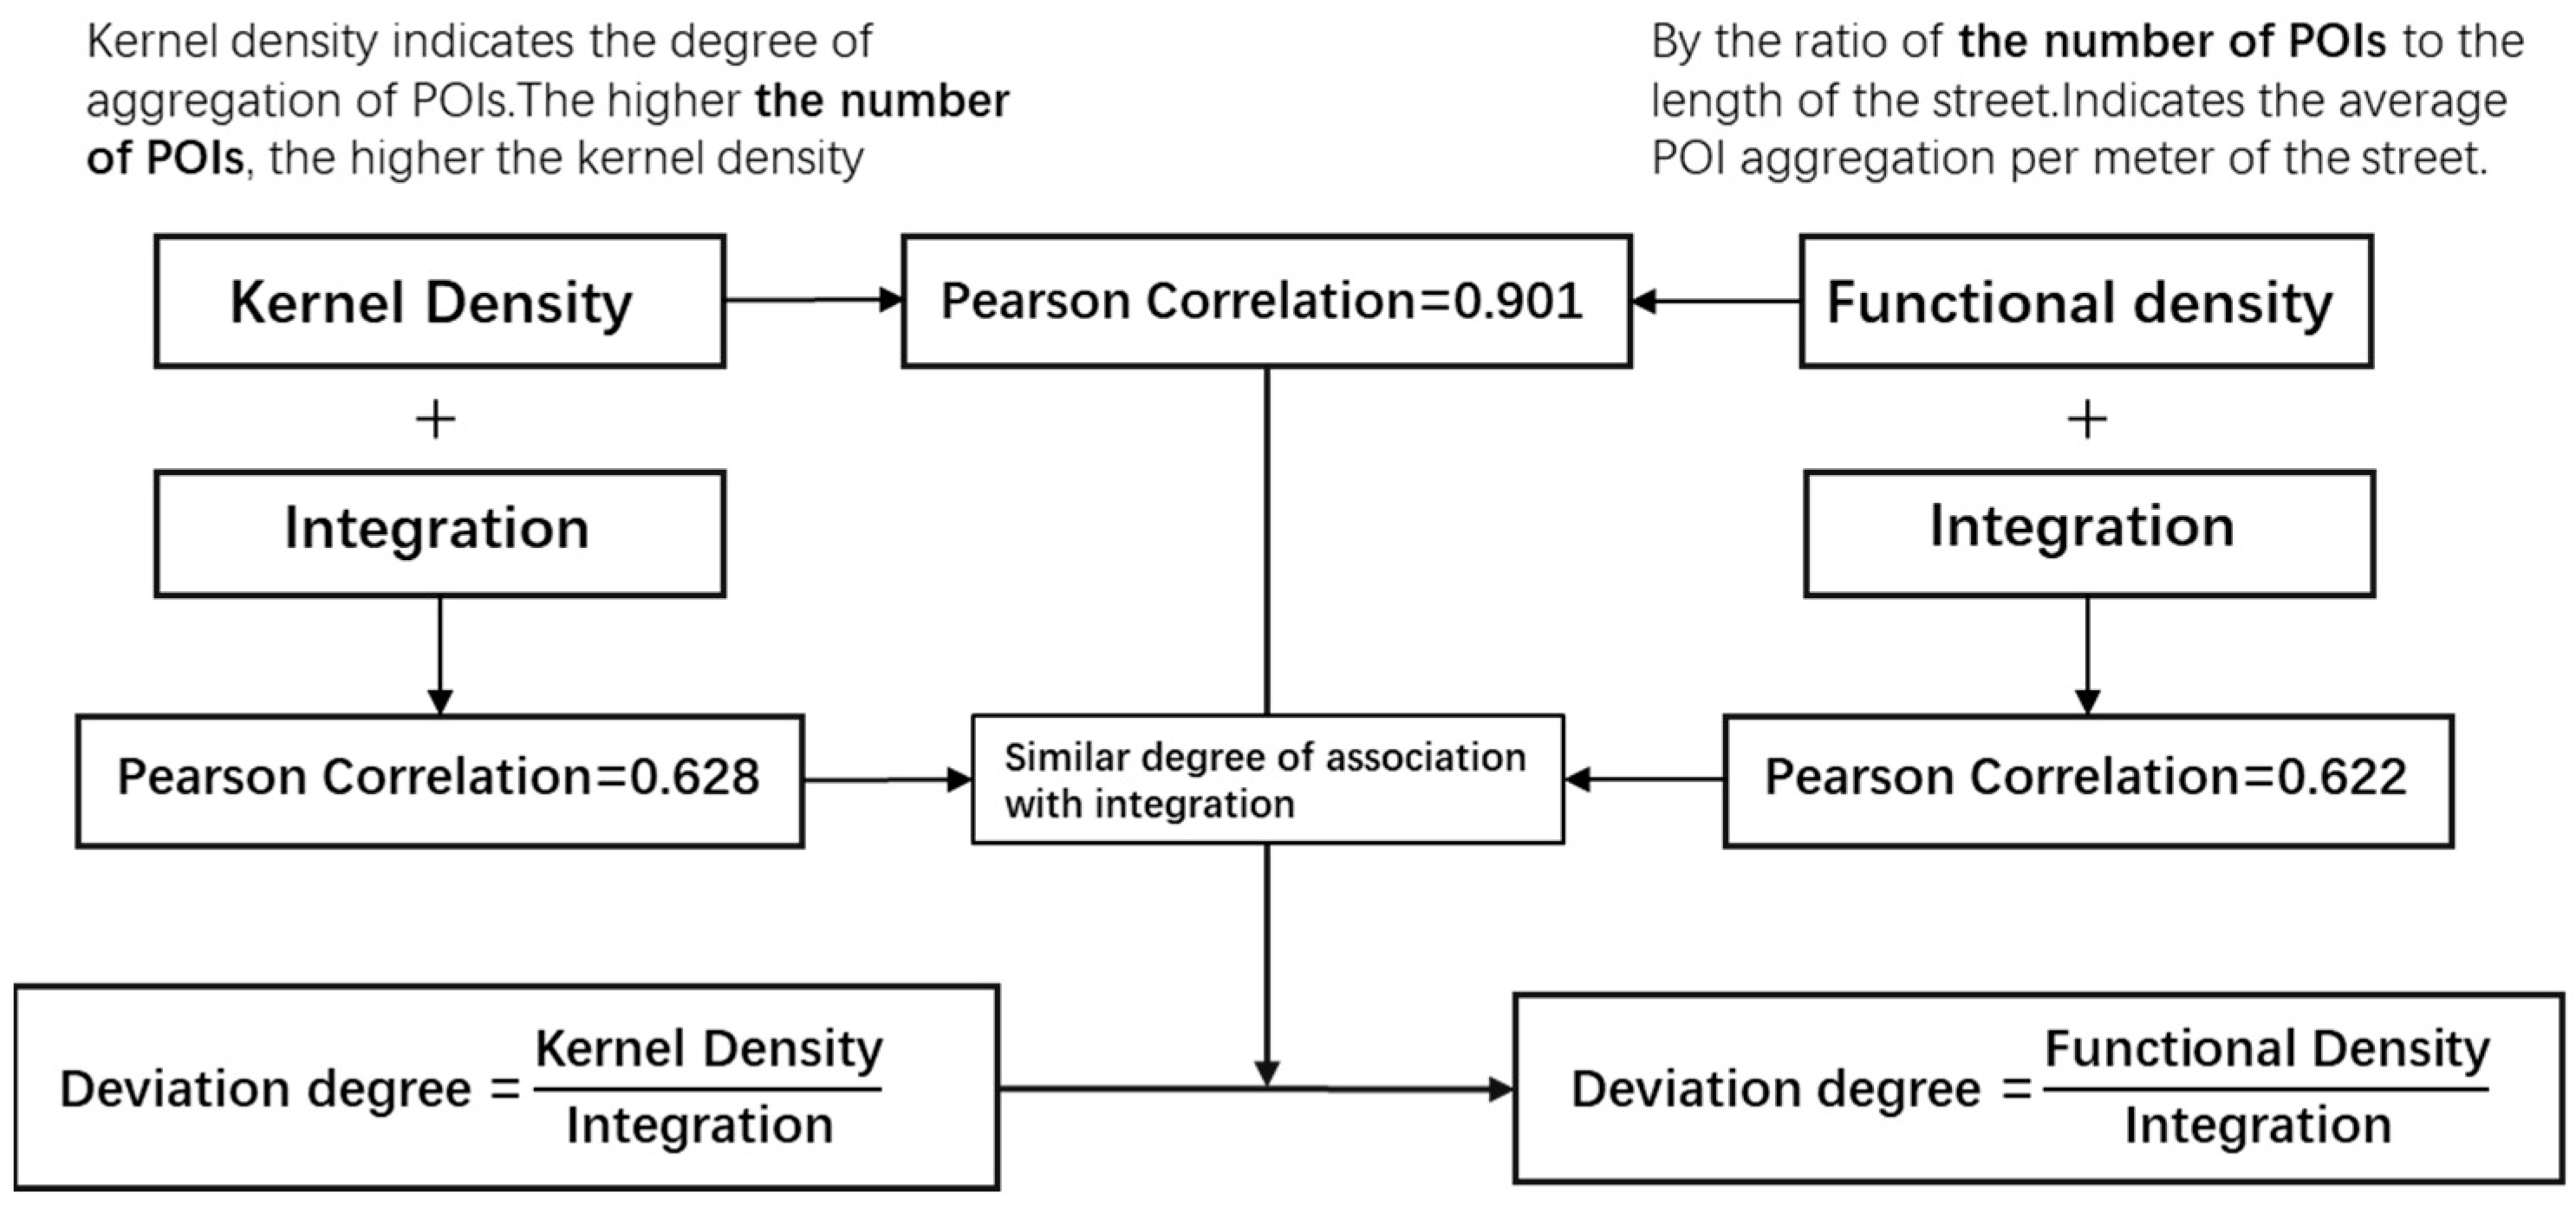
The results showed that there was a strong correlation between functional density and nuclear density. At the same time, the functional density and integration degree was 0.622 between highly strong and very strong. This study replaced the kernel density index with the functional density index to represent the degree of POI aggregation on each street and applied it to the calculation of deviation degree. The calculated results are shown in Table 6.
Figure 8 summarises the detailed derivation and calculation process. Table 6, on the other hand, represents the calculated data and results of the deviation.
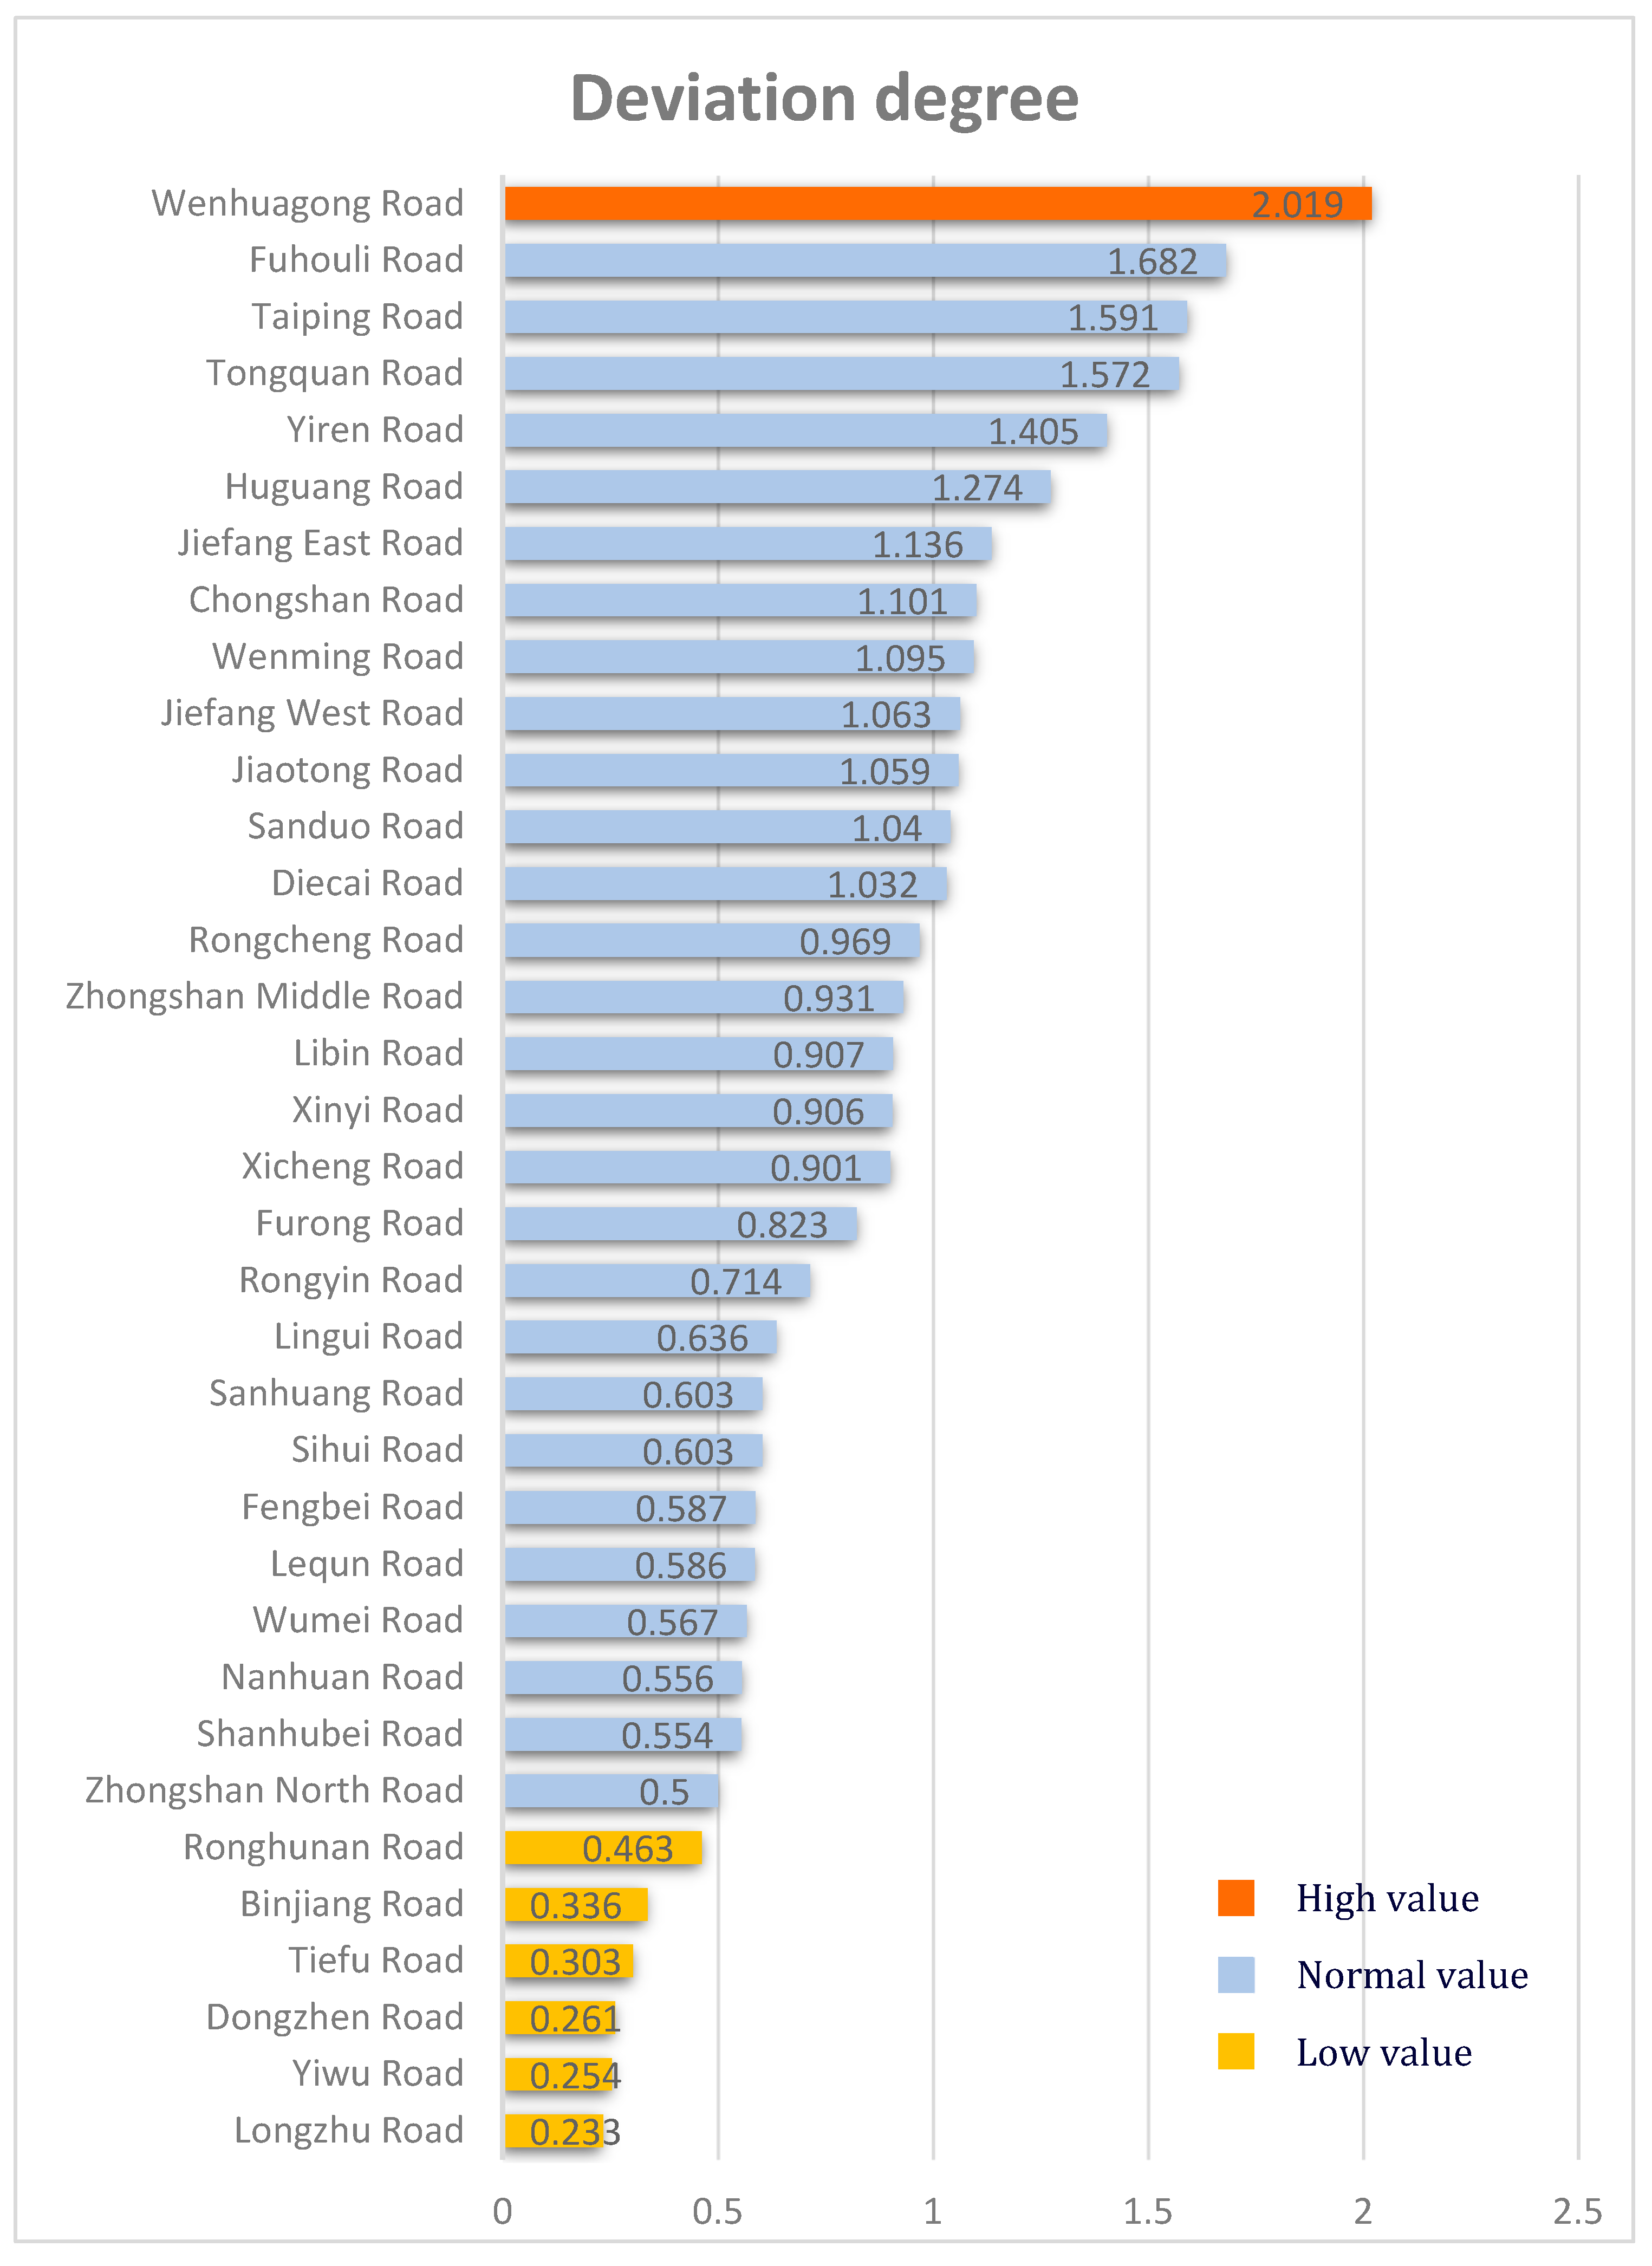
Figure 9 shows that the deviation degree of Longzhu Road, Yiwu Road, Dongzhen Road, Tiefo Road, Binjiang Road, Ronghu South Road and Wenhua Palace Road was abnormal, and the relationship between their functional density and integration degree deviated from the overall law.
According to the results of deviation, the abnormal streets are analyzed and classified as shown in Table 7.
Networks ranged between 0.65 and 0.95. Generally, the streets were easily accessible. The main reason for the high or low deviation degree was the functional density. The table above analysed the reasons for the high or low deviation values. Based on this, the streets were classified into “potential streets” and “abnormal streets”. In the subsequent research, specific optimisation suggestions are proposed based on the specific conditions of the streets.
4. Street Space Optimisation Strategy
Through the spatial abstraction model and spatial analysis statistics, streets with significant deviations from the overall street network were identified. The specific reasons for the contradiction between individual streets and the overall structure were explored, and optimisation strategies were proposed as seen in Table 8.
The roads in the table above were divided into two categories of streets and targeted optimisation strategies were proposed.
4.1. Potential Street Optimisation Strategy
(1) Utilise Resource Advantages and Optimise the Proportion of Business Formats
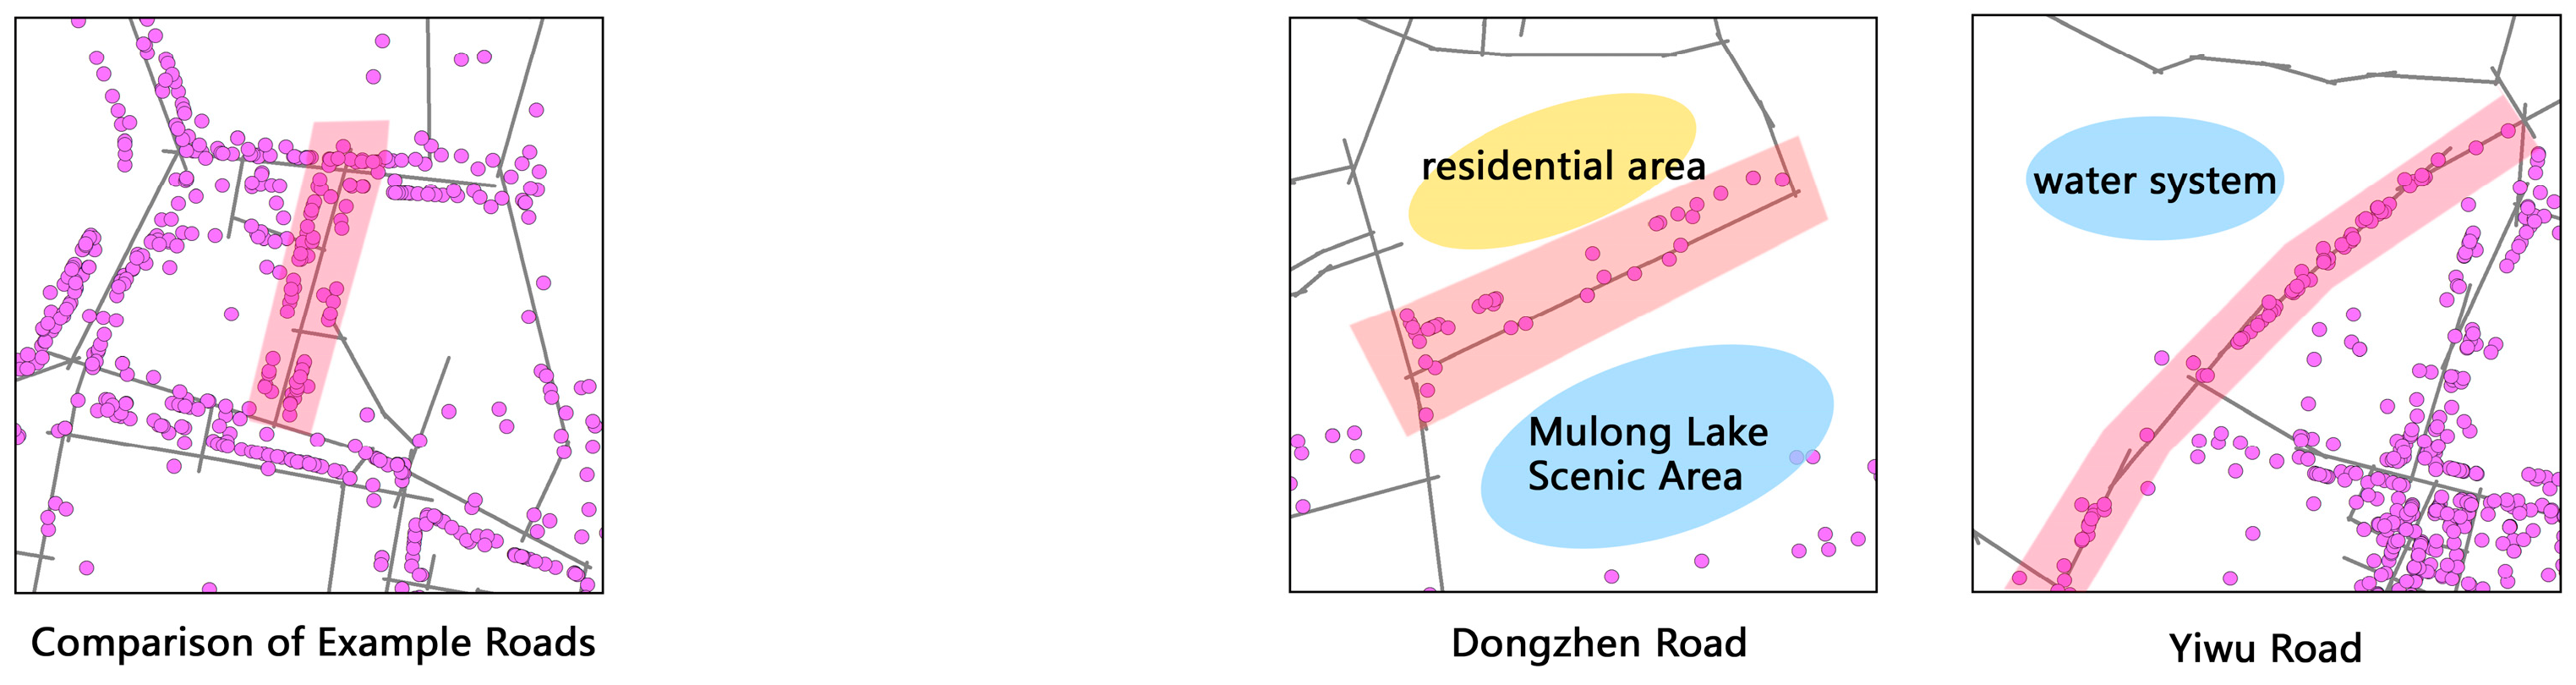
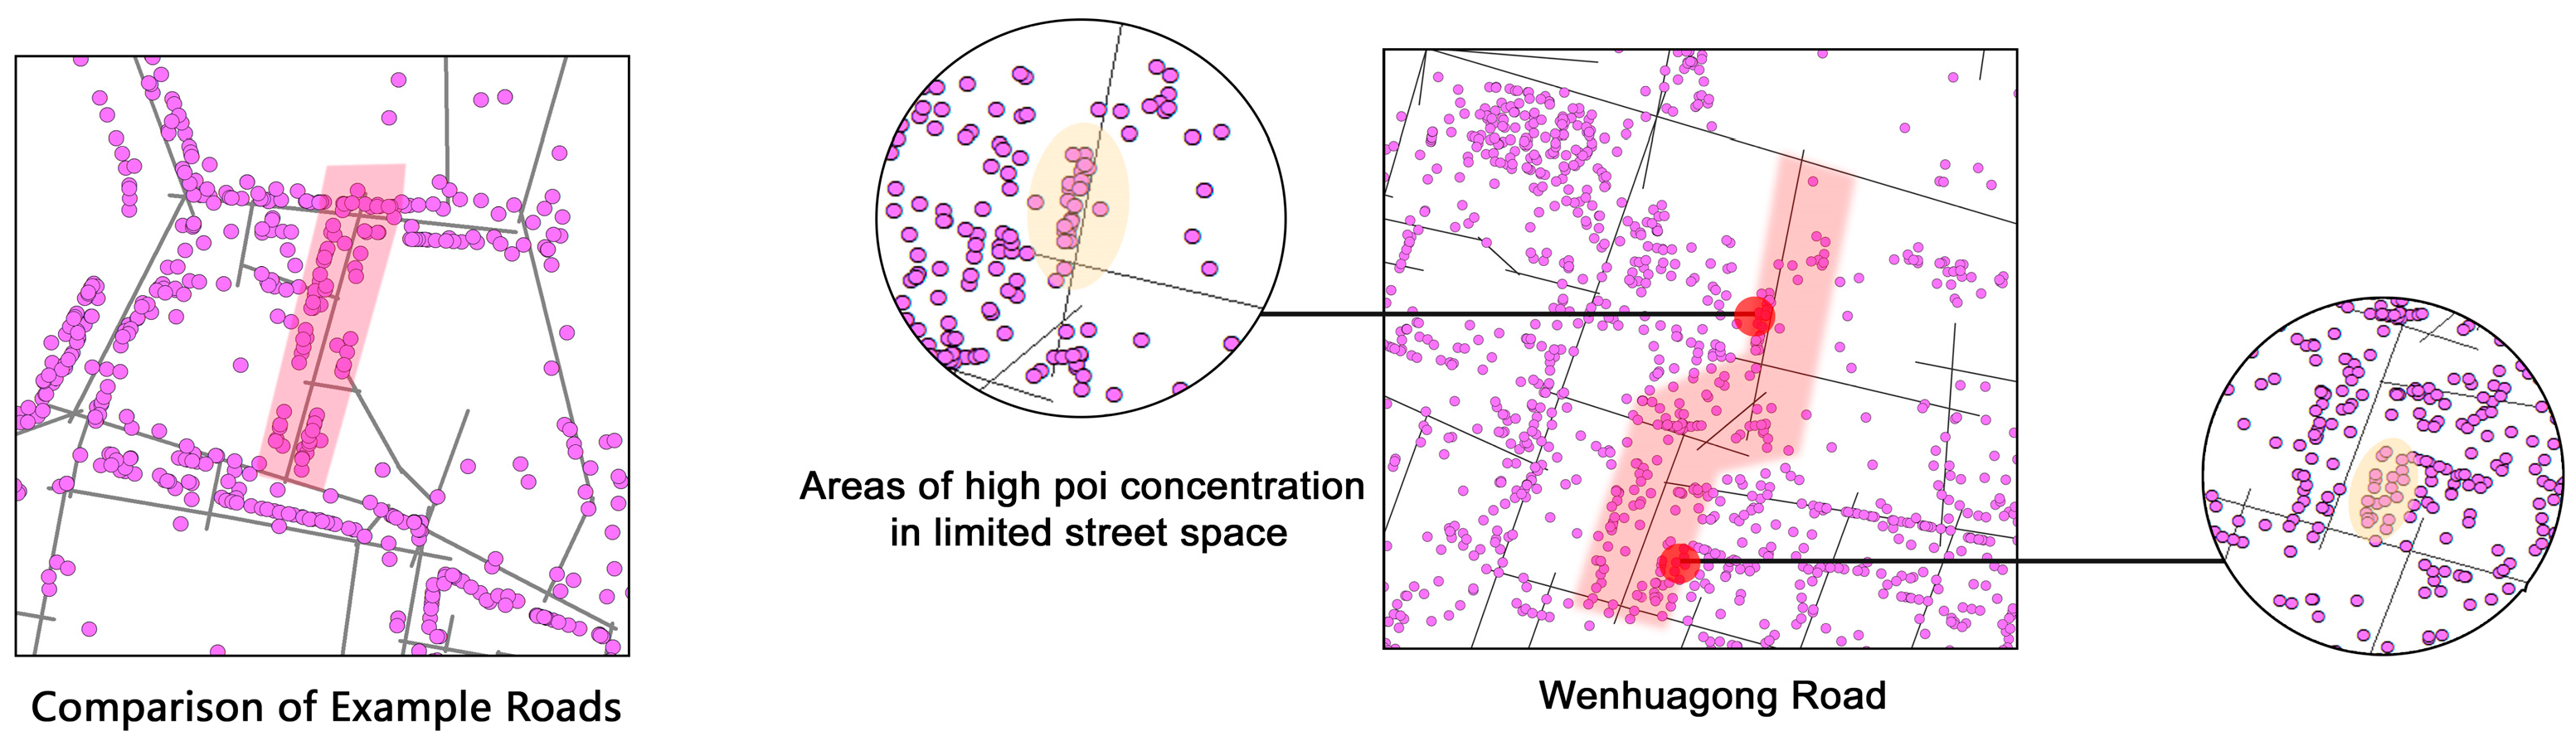
The geographic characterization of the six streets in the “Potential Roads” identified that four roads have similar characteristics (Table 9). “Yiwu Road”, “Binjiang Road”, and “Ronghunan Road” were adjacent to water systems and “Dongzhen Road” was adjacent to scenic spots. The difference in POI distribution between a normal roadway and a potential roadway is illustrated in Figure 10. Normally, POI are linearly distributed on both sides of the road. In contrast, among the potential roads, the waterfront roads showed the phenomenon of linear distribution of POIs on one side. The POI distribution of the scenic road was less and scattered.
According to the Ecological Infrastructure of Guilin and the Guilin Urban Master Plan, the number and height of buildings are generally controlled or limited around urban water system zones and scenic spots. At the same time, one side of the waterfront street was planned in a waterfront space-oriented manner. As a result, waterfront streets have a linear distribution of POIs on one side, while streets near scenic spots control the number and height of buildings around them, resulting in a decentralized POI distribution. Therefore, the functional density is low.
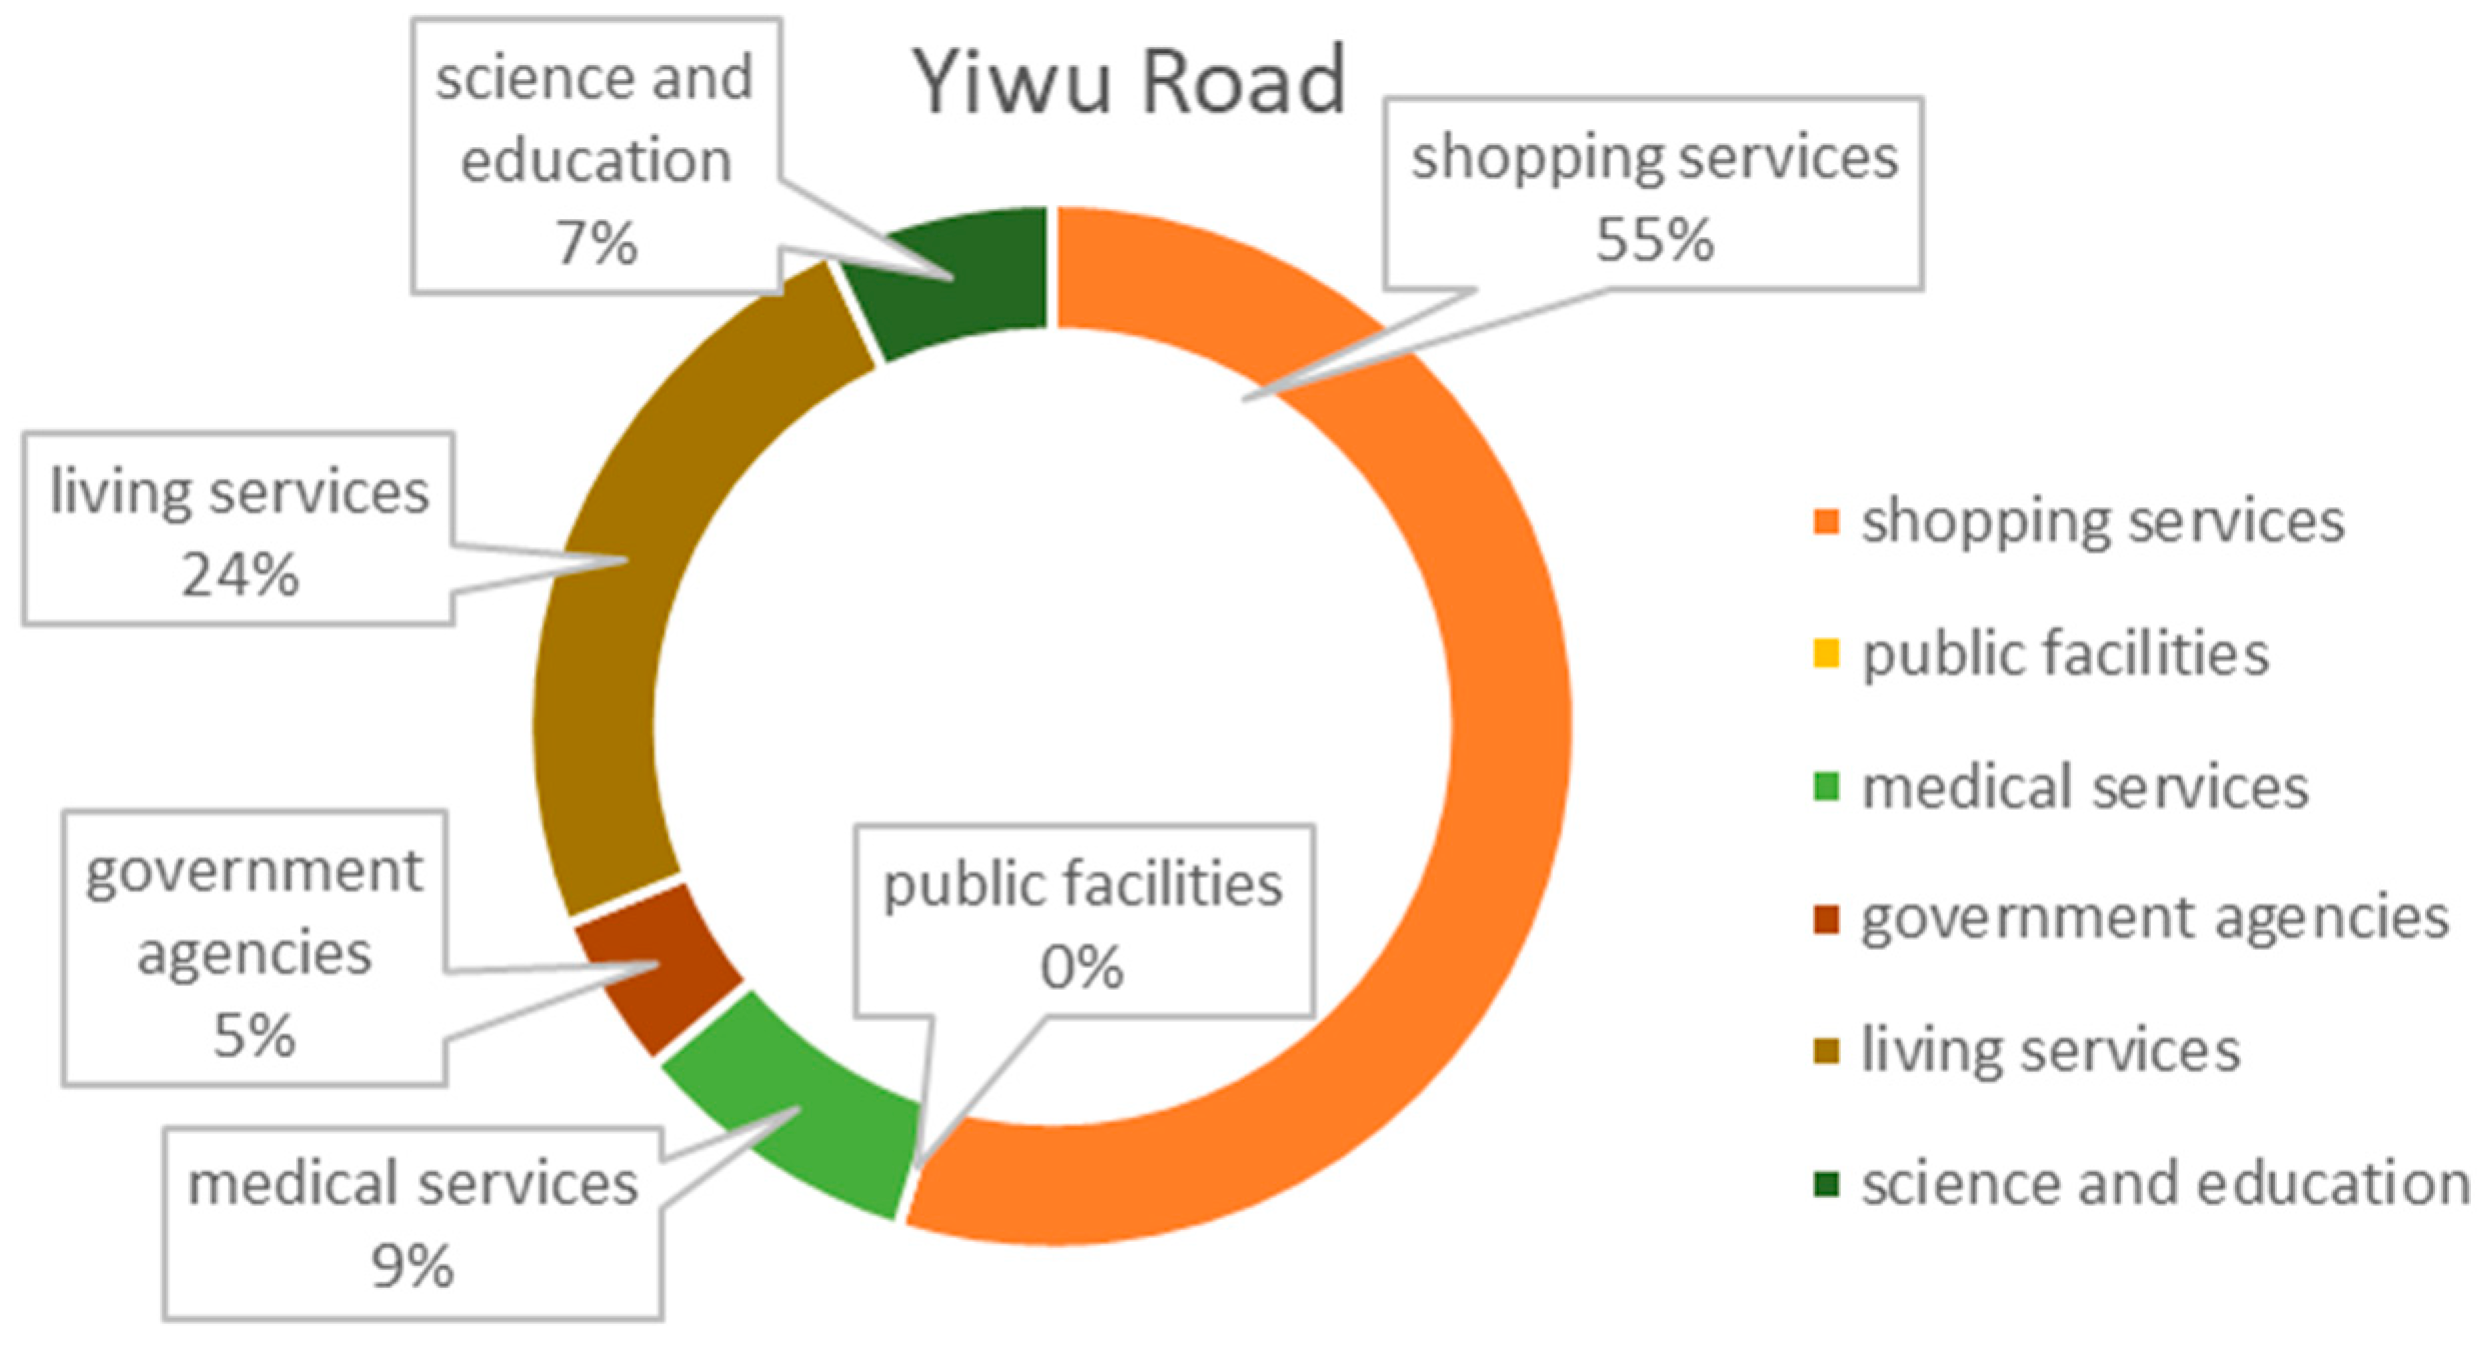
Under the guidance of policy and planning, streets with such characteristics do not aim to increase the number of POIs to enrich functions. Instead, POIs on the other side of the street were analysed by function type. While the number of POI points remained unchanged, some unreasonable POI points were replaced with functions, such as adding convenience or sports facilities in the street space. The optimisation strategy was based on the example of Yiwu Road.As shown in Table 10 and Figure 11.
From the circular map, we can see that Yiyiwu Road had 55% of shopping facilities accounting for more than half of the total, followed by 24% of living service areas, culture, sports, science and education, and government agencies; medical services accounted for a similar proportion to meet the needs of residents in their daily lives. According to the integration analysis, the road had high integration and good accessibility but lacked public facilities. Under the premise of not changing the number of POIs, adding fitness equipment and leisure seats in the street space increases the distribution density of public facilities and expands the service radius. Also, adding suitable nonprofit living service facilities and replacing the function of relocated and vacant governmental organisations’ spaces with several public activity venues with public service facilities or small-scale public service facilities, such as increasing the number of public toilets and breastfeeding rooms for mothers and babies, improves the convenient functions of the street in terms of public services so that it can become a street with a mixed process of leisure, daily life and shopping.
(2) Stimulating Composite Potential and Improving Street Functionality
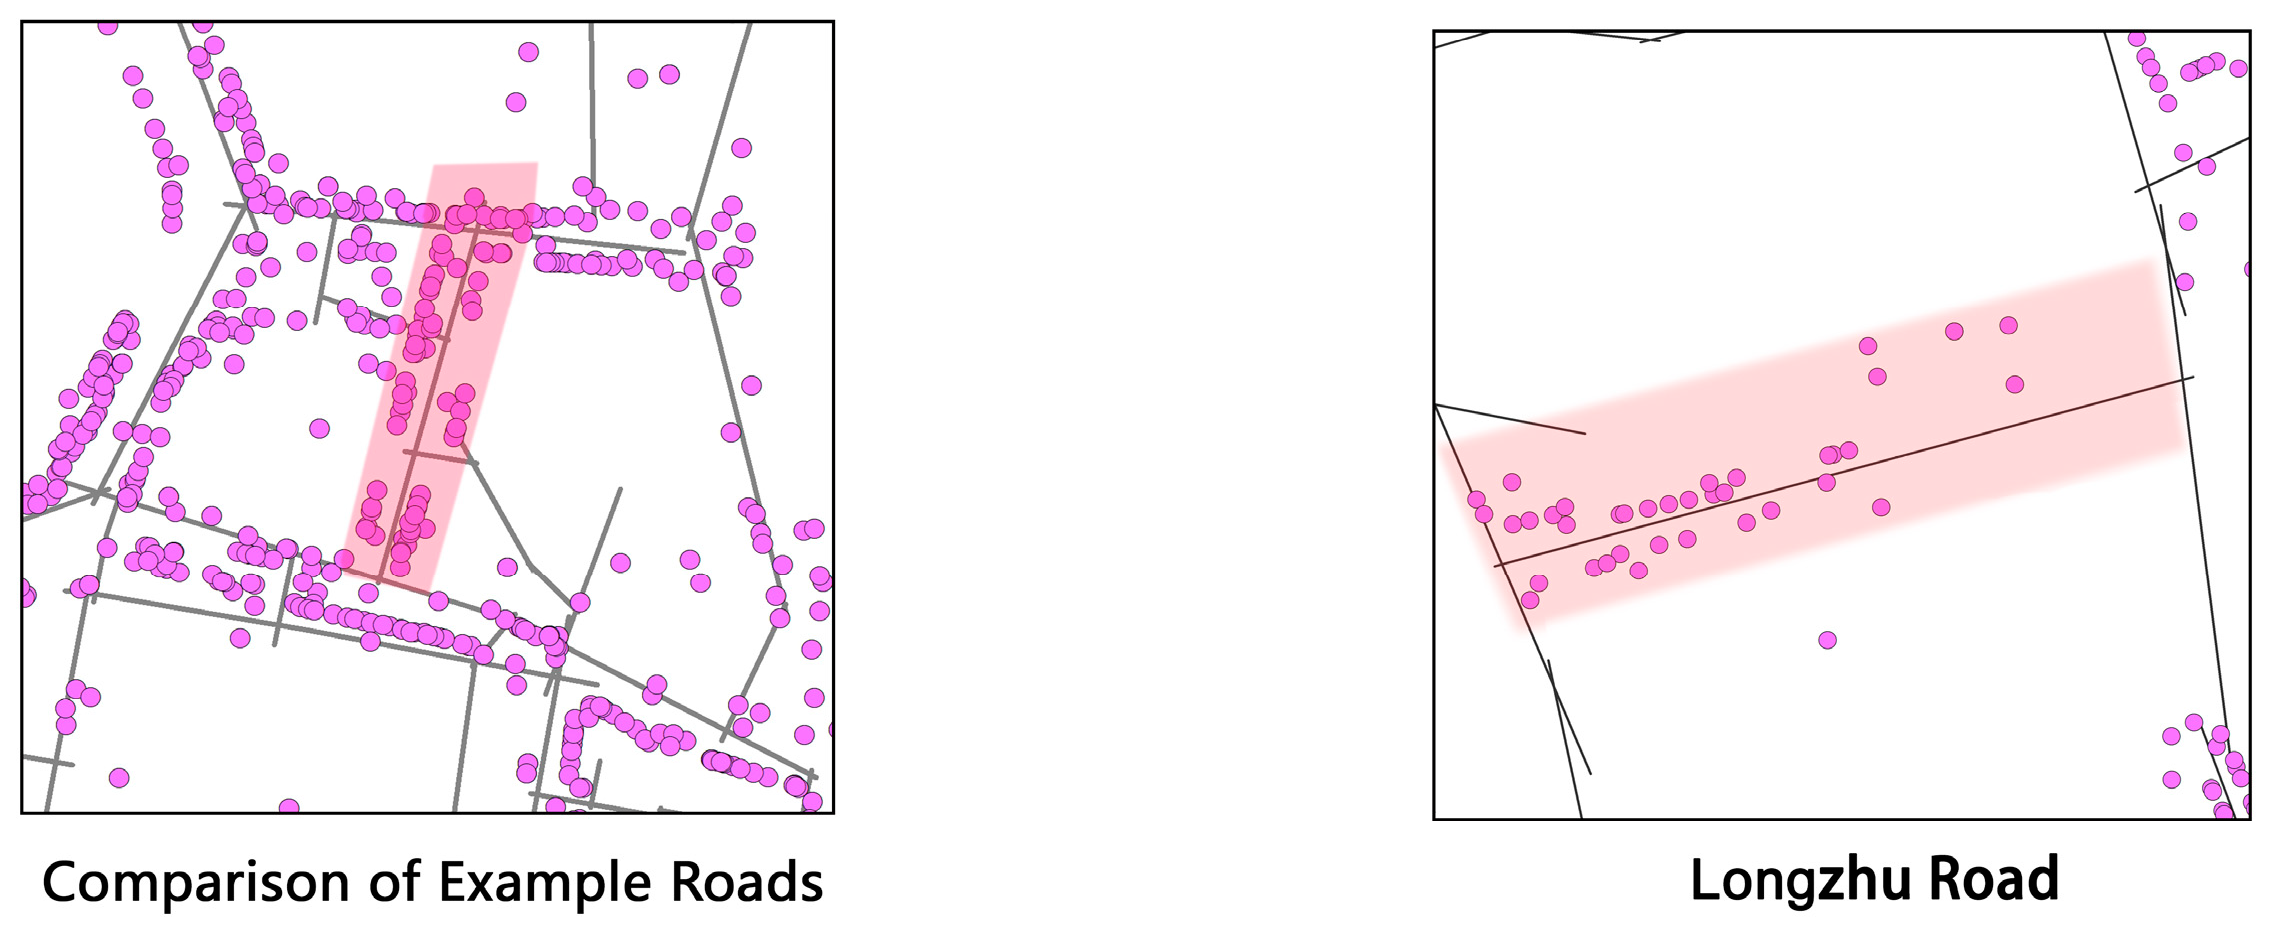
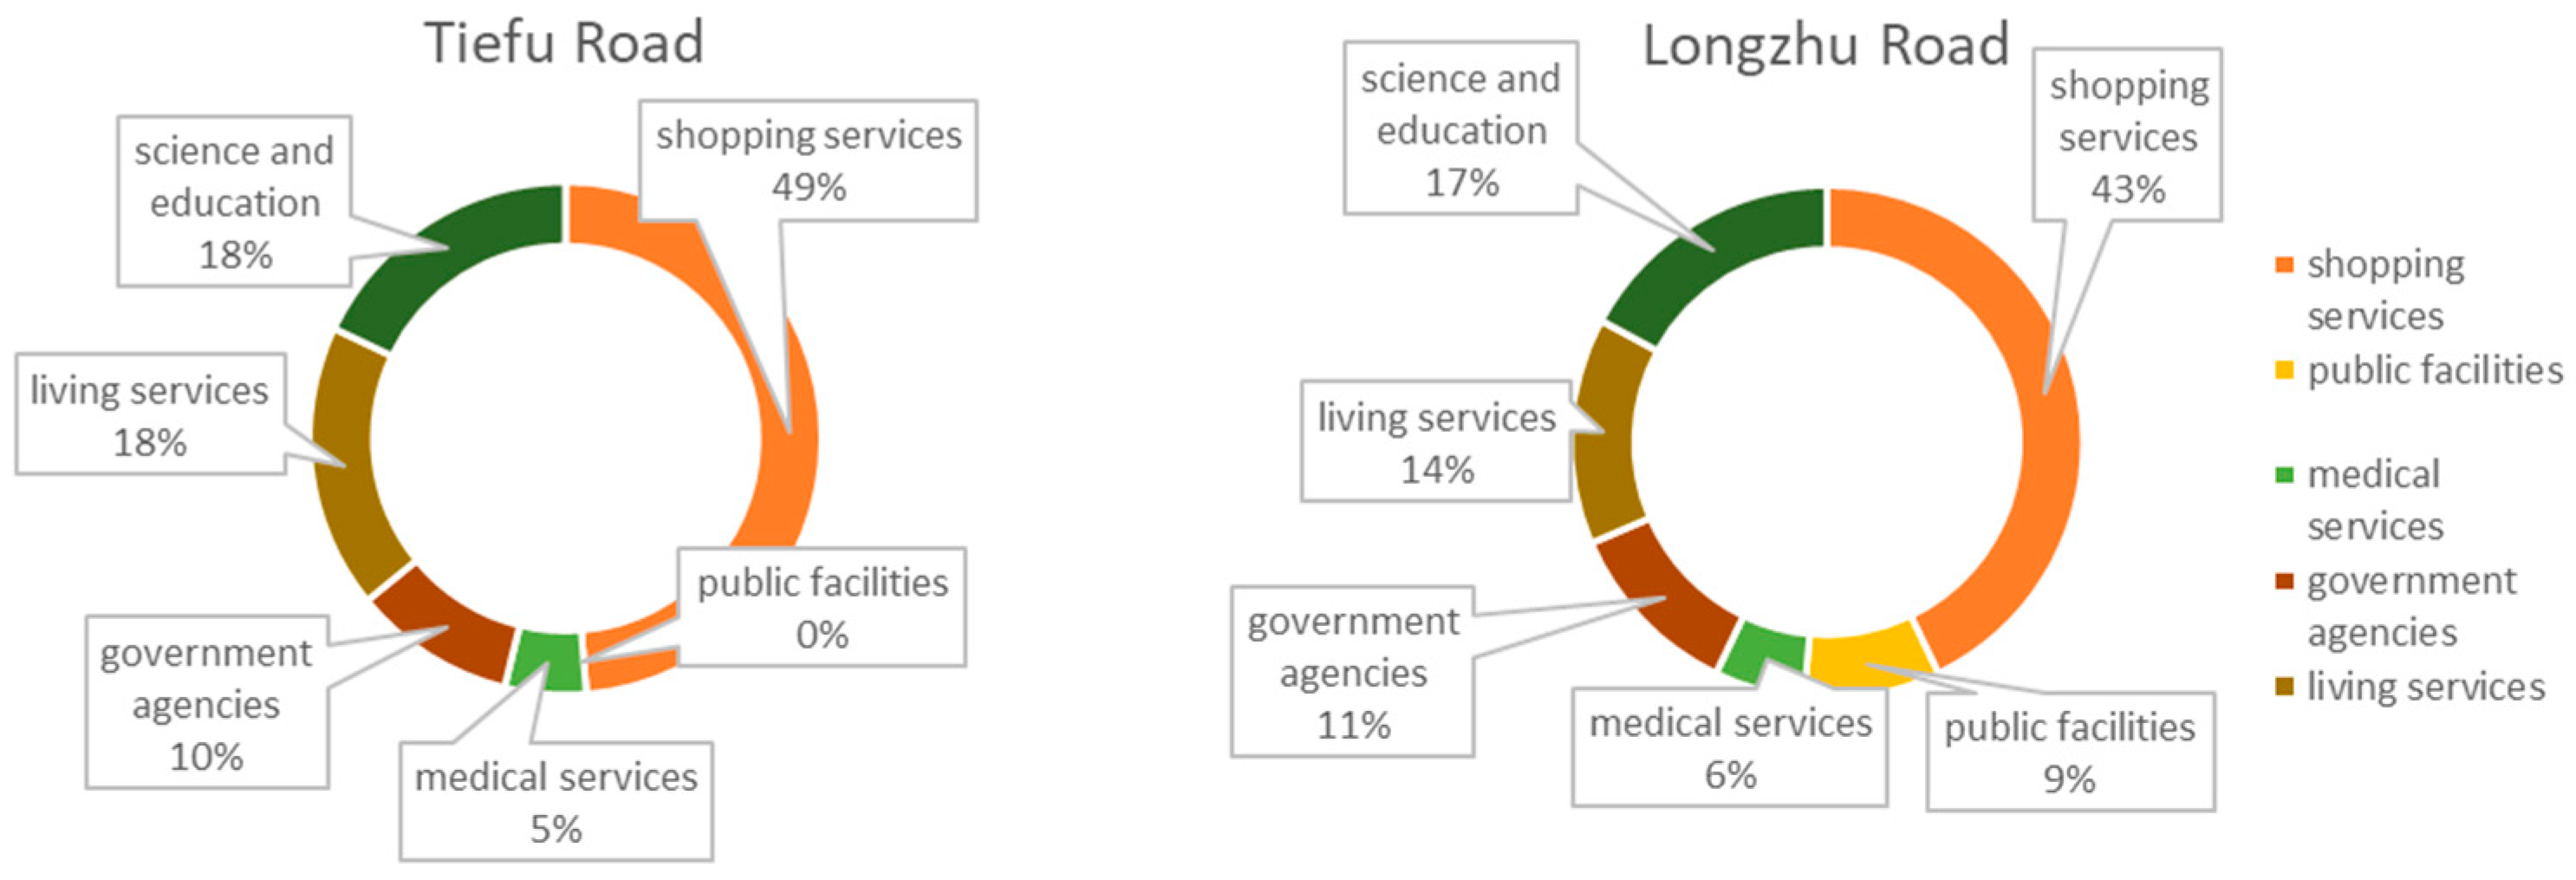
Longzhu Road and Tiefo Road were far away from the centre area of the study area, at the edge of the Two Rivers and Four Lakes Scenic Area, and were roads with a strong sense of life. They are both potential streets (Table 11). Despite the difference in the number of POI distributions between the two roads (Figure 12), the percentage of POI types is similar. (Table 12 and Figure 13)
In terms of POI types, Longzhu Road and Tiefo Road had suitable walking distances from Folongzhou Park, Gui Lake and Mulong Lake Scenic Area, which can appropriately increase the number of public facilities POIs such as public toilets and sports and leisure facilities. The original science, education and cultural facilities, government agencies, etc., can be upgraded to enhance the service quality and provide more diversified services, such as increasing the number of cultural performances, public lectures, and other activities in order to improve the satisfaction of residents and tourists, and to diversify the functions that the street carries in the original space.
4.2. Potential Street Optimisation Strategy
Wenhuagong Road is a abnormal Street. The street connecting Jiefang East Road to the POI agglomeration pole. (Table 13).
Compared to normal streets, the POIs on Wenhuagong Road exhibit a phenomenon of agglomeration and compressing street space (Figure 14).
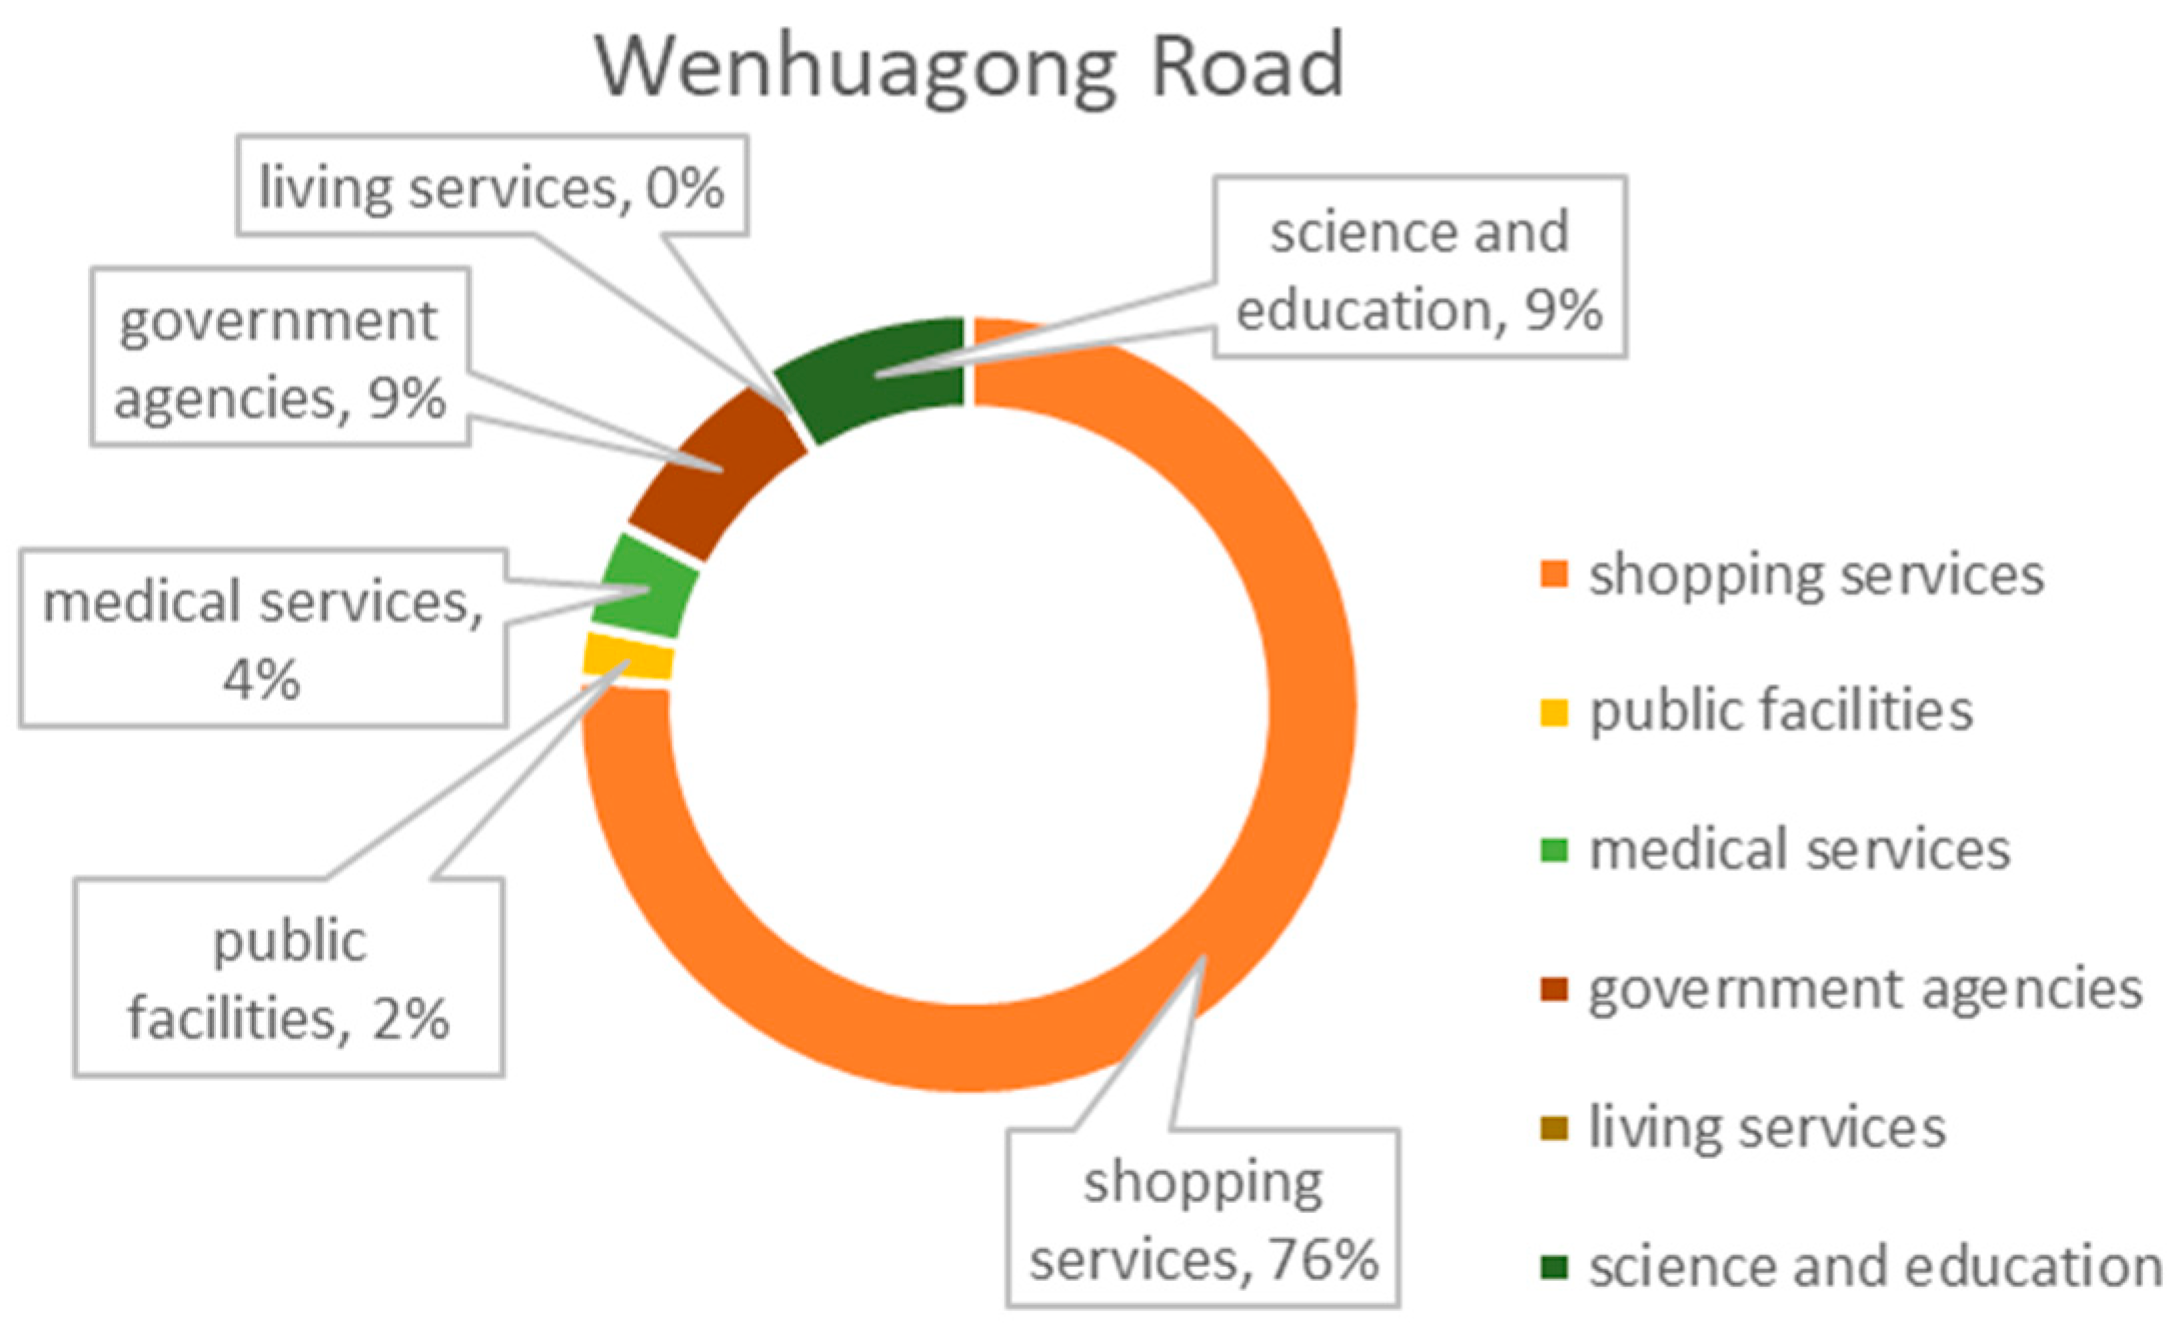
As shown in Table 14 and Figure 15, shopping services account for 64% of the POI types, reflecting the primary function of the street for shopping and catering. Still, the street was only 280 m long, and the street space was limited, so the street space had high functional density. Reflecting on the current situation of the street, the compression of the street space occurs, and there was a certain period, such as congestion of traffic and pedestrian flow. Optimisation strategy for such cases was needed to optimise the space from the street itself. This can be summarised as resolving functional conflicts and improving branching space. Specific measures were: (1) adjusting the spatial sequence, which can be considered in the form of enlarging the space of the entrance and exit nodes and expanding the buffer zone when connecting the transition with other roads; (2) controlling the side interfaces formed by commercial and other facilities in the architectural interfaces, and reserving the spatial scale to meet the passage of pedestrian traffic without encroaching on the model roads; (3) enhancing the connectivity between the branch roads and the density of the road network, so as to make the geometric characteristics of the roads more balanced, in order to disperse pedestrian and vehicular traffic.
5. Conclusions
The roads in the above table were classified into three types of streets, and targeted optimisation strategies were proposed to enhance the function of the roads, optimise the proportion of business, and optimise the space of the side streets.
By analysing the street network structure of the “Two Rivers and Four Lakes” in Guilin city, it can be seen that the integration degree of these roads was positively correlated with the POI value. Still, there were individual streets that did not match the overall trend. It can be seen that the integration degree of the roads in the “Two Rivers and Four Lakes” scenic area was positively correlated with the POI value, but there were individual streets that were inconsistent with the overall trend; through the analysis of the functional density index combined with the degree of integration, we identified “potential streets” such as Yiwu Road, Longzhu Road, Tiefo Road, etc., which were significantly deviated from the overall trend, as well as “anomalous streets” such as Wenhuagong Road. We proposed different optimisation strategies, namely “optimise the proportion of business”, “enhance the function of the street”, and “improve the street space”.
The present study, although valuable for researching urban street network structures, has limitations in its practical application for urban management and city planning. One reason was that the assumptions of spatial syntax analysis may not fully correspond to the actual situation. Another reason was the quality of points of interest (POI) data was not good enough and there were possible inaccuracies in the calculation methods for indicators.
In the future, we will conduct more comprehensive and meaningful research. One of the development directions involves analysing the impact of urban travel systems using new models or data. For example, collecting and organizing data on crowd behaviour, travel preferences, and modes of transportation, and using mathematical models and additional tools for analysis. This will assist urban planners in gaining a better understanding of the operational mechanisms of travel systems and in formulating more effective travel planning schemes [36,37,38,39]. Consequently, it will improve the travel efficiency of the city and enhance the convenience for tourists.
Another area of research worth exploring is the operational mechanism and spatial layout of urban transportation systems. Specifically, we can study the impact of traffic flow and mobility on urban streets. In this research analysis, we found that point of interest (POI) data has gradually been utilised in the field of contemporary urban transportation systems. Some researchers have combined the monitoring of points of interest (POI) activity flow with genetic algorithm (GA) techniques to estimate road traffic flow, potentially resulting in reduced economic costs [40]. Researchers have incorporated points of interest (POI) into land use, population movement, and other data to predict the spread of viruses using the “node-place” model [41]. Furthermore, some researchers have integrated points of interest (POI) with GPS trajectories to develop urban heavy truck mobile networks [42]. Research has also found that integrating various methods and data sources, such as Chat GPT, NLP, and RL models, along with traffic flow data, public transportation data, and travel survey data [43,44,45], can further uncover the dynamic characteristics and evolving trends of urban street transportation systems. These findings offer new insights for our research on urban streets.
Furthermore, we can delve deeper into the intersection of spatial syntax with other fields. For example, integrating spatial syntax with transportation engineering, logistics management, and geographic information systems. By continuously expanding the research methods for street network systems and exploring new technologies, we aim to offer a more comprehensive and in-depth understanding of urban street networks. This approach and method can help identify additional future development opportunities for the sustainable growth of scenic areas such as Guilin’s “Two Rivers and Four Lakes” and other cities, ultimately contributing to the achievement of sustainable development goals for street and urban transportation systems.
Author Contributions
L.Y.: Conceptualization, Investigation, Methodology, Writing—review & editing. Q.J.: Writing—review & editing. F.F.: review & editing, Supervision. All authors have read and agreed to the published version of the manuscript.
Funding
This study was supported by Guangxi Key Laboratory of Green Building Materials and Construction Industrialization (No. 19-J-21-6) and Guilin University of Technology Research Initiation Fee (Qizhi Jin) (RD2100000684). Any opinions, findings and conclusions expressed in this paper do not represent the views of the funders.
Institutional Review Board Statement
Not applicable.
Informed Consent Statement
Not applicable.
Data Availability Statement
No new data were created in writing this perspective.
Conflicts of Interest
The authors declare no conflicts of interest.
References
- Haggett, P.; Chorley, R.J. Network Analysis in Geography; Hodder Education: London, UK, 1969. [Google Scholar]
- Jacobs, J. The Death and Life of Great American Cities; Random House: New York, NY, USA, 1961. [Google Scholar]
- Alexander, C. The Pattern of Streets. J. Am. Plan. Assoc. 1966, 32, 273–278. [Google Scholar] [CrossRef]
- Borruso, G. Network Density and the Delimitation of Urban Areas. Trans. GIS 2003, 7, 177–191. [Google Scholar] [CrossRef]
- Tsiotas, D.; Polyzos, S. The topology of urban road networks and its role to urban mobility. Transp. Res. Procedia 2017, 24, 482–490. [Google Scholar] [CrossRef]
- Hillier, B.; Hanson, J. The social logic of space. An Integration of GIS, Internet and Virtual Reality for the visualisation, Analysis, and Exploration of Geospatial Data. Int. J. Geogr. Inf. Sci. 1984, 392, in press. [Google Scholar]
- Marshall, S. Streets and Patterns; Spon Press: New York, NY, USA, 2005. [Google Scholar]
- Yoo, C.; Lee, S. When Organic Urban Forms and Grid Systems Collide: Application of Space Syntax for Analyzing the Spatial Configuration of Barcelona, Spain. J. Asian Archit. Build. Eng. 2017, 16, 597–604. [Google Scholar] [CrossRef]
- Suchoń, F.; Olesiak, J. Historical Analysis of the Example of Nowy Sącz in Space Syntax Perspective. Guidelines for Future Development of Urban Matrix in Medium-Sized Cities. Sustainability 2021, 13, 11071. [Google Scholar] [CrossRef]
- Tawfik, M.; Shehayeb, D.; Abdelaty, A.; Pinto, R.; Shalaby, A. Relationship between spatial analysis of streets and walking behavior. J. Urban Plan. Dev. 2022, 148, 04022005. [Google Scholar] [CrossRef]
- Kuzulugil, A.; Ünsal, Ö.; Demircioglu, N.; Aytatlı, B. Space syntax-based analysis method to improve the accessibility of urban tourism in a historic environment. Gazi ÜNiversitesi MÜHendislik Mimar. FakÜLtesi Derg. 2023, 38, 2359–2374. [Google Scholar] [CrossRef]
- Esposito, D.; Santoro, S.; Camarda, D. Agent-Based Analysis of Urban Spaces Using Space Syntax and Spatial Cognition Approaches: A Case Study in Bari, Italy. Sustainability 2020, 12, 4625. [Google Scholar] [CrossRef]
- Atakara, C.; Allahmoradi, M. Investigating the Urban Spatial Growth by Using Space Syntax and GIS—A Case Study of Famagusta City. ISPRS Int. J. Geo-Inf. 2021, 10, 638. [Google Scholar] [CrossRef]
- Srivanit, M.; Kongphunphin, C.; Rinchumphu, D. Exploring the Association of Spatial Capital and Economic Diversity in the Tourist City of Surat Thani, Thailand. ISPRS Int. J. Geo-Inf. 2022, 11, 507. [Google Scholar] [CrossRef]
- Xu, L.; Xu, J. The application of spatial syntax in urban design: A case study of spatial structure analysis in the Hexi area of Nanjing City. Mod. Urban Res. 2011, 26, 42–46. [Google Scholar]
- Fu, B.; Wu, J.; Chen, X. Research on space syntax application within the city transportation area. Urban Plan. Int. 2009, 23, 79–83. [Google Scholar]
- Xu, Y.; Rollo, J.; Esteban, Y. Evaluating Experiential Qualities of Historical Streets in Nanxun Canal Town through a Space Syntax Approach. Buildings 2021, 11, 544. [Google Scholar] [CrossRef]
- Miller, H.J.; Shaw, S.-L. Geographic Information Systems for Transportation in the 21st Century. Geogr. Compass 2015, 9, 180–189. [Google Scholar] [CrossRef]
- Chen, X.; Wang, Z.; Hua, Q.; Shang, W.L.; Luo, Q.; Yu, K. AI-Empowered Speed Extraction via Port-Like Videos for Vehicular Trajectory Analysis. IEEE Trans. Intell. Transp. Syst. 2023, 24, 4541–4552. [Google Scholar] [CrossRef]
- Li, J.; Li, J.; Yuan, Y.; Li, G. Spatiotemporal distribution characteristics and mechanism analysis of urban population density: A case of Xi’an, Shaanxi, China. Cities 2019, 86, 62–70. [Google Scholar] [CrossRef]
- Rae, A.; Murdock, V.; Popescu, A.; Bouchard, H. Mining the Web for Points of Interest; Association for Computing Machinery: Portland, OR, USA, 2012; pp. 711–720. [Google Scholar] [CrossRef]
- Lamprianidis, G.; Skoutas, D.; Papatheodorou, G.; Pfoser, D. Extraction, Integration and Analysis of Crowdsourced Points of Interest from Multiple Web Sources; Association for Computing Machinery: Dallas, TX, USA, 2014; pp. 16–23. [Google Scholar] [CrossRef]
- Bui, T.-H.; Park, S.-B. Point of interest mining with proper semantic annotation. Multimed. Tools Appl. 2016, 76, 23435–23457. [Google Scholar] [CrossRef]
- Jansuwan, S.; Liu, Z.; Song, Z.; Che, A. An evaluation framework of automated electric transportation system. Disclaimer/P Transp. Res. Part E Logist. Transp. Rev. 2021, 148, 102265. [Google Scholar] [CrossRef]
- Zhang, X.; Sun, L.; Shao, Z.; Zhou, X. Accessibility Evaluation of Public Service Facilities in Villages and Towns Based on POI Data: A Case Study of Suining County, Xuzhou, China. J. Urban Plan. Dev. 2023, 149. [Google Scholar] [CrossRef]
- Yu, W.; Ai, T. The visualization and analysis of POl features under network space supported by Kernel Density estimatior. Acta Geod. Et Cartogr. Sin. 2015, 44, 82–90. [Google Scholar]
- LiP Research on the correlation between POI data distribution and street network characteristics: A case study of chongqing’s historical urban area. In Proceedings of the Urban Development and Planning; China Urban Science Research Association, Zhengzhou Municipal People’s Government, Henan Provincial Department of Natural Resources, Henan Provincial Department of Housing and Urban-Rural Development, 2019.
- Liang, F.; Liu, J.; Liu, M.; Zeng, J.; Yang, L.; He, J. Scale-Dependent Impacts of Urban Morphology on Commercial Distribution: A Case Study of Xi’an, China. Land 2021, 10, 170. [Google Scholar] [CrossRef]
- Wang, M.; Liu, J.; Zhang, S.; Zhu, H.; Zhang, X. Spatial pattern and micro-location rules of tourism businesses in historic towns: A case study of Pingyao, China. J. Destin. Mark. Manag. 2022, 25, 100721. [Google Scholar] [CrossRef]
- Boeing, G. OSMnx: New methods for acquiring, constructing, analyzing, and visualizing complex street networks. Comput. Environ. Urban Syst. 2017, 65, 126–139. [Google Scholar] [CrossRef]
- Long, Y.; Ai, T. Quantitative evaluation on street vibrancy and its impact factors: A case Study of Chengdu. New Archit. 2016, 1, 52–57. [Google Scholar]
- Duan, J.; Hiller, B. Spatial Syntax in China; Southeast University Press: Nanjing, China, 2015. [Google Scholar]
- Duan, Y.; Wang, S.; Dai, X. Spatial Syntax Tutorial, 1st ed.; China Architecture & Building Press: Beijing, China, 2011. [Google Scholar]
- Liu, M.; Jiang, Y.; He, J. Quantitative Evaluation on Street Vitality: A Case Study of Zhoujiadu Community in Shanghai. Sustainability 2021, 13, 3027. [Google Scholar] [CrossRef]
- Zou, K.H.; Tuncali, K.; Silverman, S.G. Correlation and Simple Linear Regression. Radiology 2003, 227, 617–628. [Google Scholar] [CrossRef]
- Huang, D.; Yang, Y.; Peng, X.; Huang, J.; Mo, P.; Liu, Z.; Wang, S. Modelling the pedestrian’s willingness to walk on the subway platform: A novel approach to analyze in-vehicle crowd congestion. Transp. Res. Part E Logist. Transp. Rev. 2024, 181, 103359. [Google Scholar] [CrossRef]
- Wang, D.; Liao, F. Formulation and solution for calibrating boundedly rational activity-travel assignment: An exploratory study. Commun. Transp. Res. 2023, 3, 100092. [Google Scholar] [CrossRef]
- Fu, X.; van Lierop, D.; Ettema, D. Is multimodality advantageous? Assessing the relationship between multimodality and perceived transport adequacy and accessibility in different travel contexts. Transp. Res. Part A Policy Pract. 2024, 179, 103893. [Google Scholar] [CrossRef]
- Bas, J.; Al-Khasawneh, M.B.; Erdoğan, S.; Cirillo, C. How the design of Complete Streets affects mode choice: Understanding the behavioral responses to the level of traffic stress. Transp. Res. Part A Policy Pract. 2023, 173, 103698. [Google Scholar] [CrossRef]
- Kolat, M.; Tettamanti, T.; Bécsi, T.; Esztergár-Kiss, D. On the relationship between the activity at point of interests and road traffic. Commun. Transp. Res. 2023, 3, 100102. [Google Scholar] [CrossRef]
- Zhou, J.; Zhou, M.; Zhou, J.; Zhao, Z. Adapting node–place model to predict and monitor COVID-19 footprints and transmission risks. Commun. Transp. Res. 2023, 3, 100110. [Google Scholar] [CrossRef]
- Yang, Y.; Jia, B.; Yan, X.Y.; Zhi, D.; Song, D.; Chen, Y.; de Bok, M.; Tavasszy, L.A.; Gao, Z. Uncovering and modeling the hierarchical organization of urban heavy truck flows. Transp. Res. Part E Logist. Transp. Rev. 2023, 179, 103318. [Google Scholar] [CrossRef]
- Qu, X.; Lin, H.; Liu, Y. Envisioning the future of transportation: Inspiration of ChatGPT and large models. Commun. Transp. Res. 2023, 3, 100103. [Google Scholar] [CrossRef]
- Han, Y.; Wang, M.; Leclercq, L. Leveraging reinforcement learning for dynamic traffic control: A survey and challenges for field implementation. Commun. Transp. Res. 2023, 3, 100104. [Google Scholar] [CrossRef]
- Zhong, C.; Wu, P.; Zhang, Q.; Ma, Z. Online prediction of network-level public transport demand based on principle component analysis. Commun. Transp. Res. 2023, 3, 100093. [Google Scholar] [CrossRef]
Figure 1.
Technique flowchart.

Figure 2.
Scope of “Two Rivers and Four Lakes”.

Figure 3.
Analysis of regional integration degree in the study area.

Figure 4.
POI distribution (a) and nuclear density analysis (b) within the research scope.

Figure 5.
POI linear distribution and aggregation distribution characteristics.

Figure 6.
Analysis of grid integration and grid kernel density in the research scope.

Figure 7.
POI grid (a) and street ranging length (b).

Figure 8.
Schematic diagram of the relationship between integration, kernel density, functional density, and deviation.
Figure 8.
Schematic diagram of the relationship between integration, kernel density, functional density, and deviation.

Figure 9.
Deviation degree result arrangement.

Figure 10.
Difference in POI D distribution between normal and Dongzhen Road and Yiwu Road.

Figure 11.
Proportion of POI formats on Yiwu Road.

Figure 12.
Difference in POI Distribution between Longzhu Roads.

Figure 13.
Proportion of POI formats on Tiefo Road and Longzhu Road.

Figure 14.
Difference in POI Distribution between normal and abnormal roads.

Figure 15.
Proportion of POI formats on Wenhuagong Road.


Table 1.
Classification of correlation strength based on correlation coefficients.
| Correlation Value | 0 | 0.2 | 0.5 | 0.8 | 1 |
|---|---|---|---|---|---|
| Correlation Strength | None | Weak | Moderate | Strong | Perfect |
Table 2.
Summary of road integration and POI core density after processing.
| Street Name | Street Level | Road Integration | Kernel Density | Street Name | Street Level | Road Integration | Kernel Density |
|---|---|---|---|---|---|---|---|
| Zhongshan North Road | Main Road | 0.769 | 0.053 | Fuhouli Road | Side Road | 0.885 | 0.521 |
| Zhongshan Middle Road | Main Road | 0.986 | 0.364 | Yiren Road | Side Road | 0.933 | 0.744 |
| Jiefang East Road | Main Road | 1.044 | 0.387 | Libin Road | Side Road | 0.903 | 0.461 |
| Jiefang West Road | Main Road | 0.988 | 0.406 | Furong Road | Side Road | 0.767 | 0.25 |
| Xinyi Road | Main Road | 0.717 | 0.058 | Dongzhen Road | Side Road | 0.690 | 0.004 |
| Nanhuan Road | Main Road | 0.855 | 0.202 | Shanhubei Road | Side Road | 0.825 | 0.016 |
| Yiwu Road | Secondary Road | 0.802 | 0.046 | Rongcheng Road | Side Road | 0.910 | 0.245 |
| Wenming Road | Secondary Road | 0.800 | 0.314 | Huguang Road | Side Road | 0.929 | 0.447 |
| Longzhu Road | Secondary Road | 0.686 | 0.05 | Rongyin Road | Side Road | 0.921 | 0.233 |
| Fengbei Road | Secondary Road | 0.834 | 0.115 | Wenhuagong Road | Side Road | 0.959 | 1 |
| Diecai Road | Secondary Road | 0.782 | 0.241 | Sanhuang Road | Side Road | 0.844 | 0.233 |
| Binjiang Road | Secondary Road | 0.915 | 0.09 | Taiping Road | Side Road | 0.849 | 0.632 |
| Sanduo Road | Secondary Road | 0.873 | 0.376 | Tiefu Road | Side Road | 0.700 | 0.001 |
| Sihui Road | Secondary Road | 0.809 | 0.17 | Ronghunan Road | Side Road | 0.805 | 0.033 |
| Lequn Road | Secondary Road | 0.880 | 0.315 | Lingui Road | Side Road | 0.800 | 0.235 |
| Xicheng Road | Secondary Road | 0.836 | 0.425 | Tongquan Road | Side Road | 0.871 | 0.353 |
| Chongshan Road | Secondary Road | 0.784 | 0.201 | Jiaotong Road | Side Road | 0.841 | 0.306 |
| Wumei Road | Secondary Road | 0.848 | 0.159 |
Table 3.
Correlation analysis between integration and kernel density values.
| Integration | Kernel Density | ||
|---|---|---|---|
| Integration | Pearson Correlation | 1 | 0.628 ** |
| Sig. (Two-tailed) | \ | 0.000 | |
| Cases | 35 | 35 | |
| Kernel Density Value | Pearson Correlation | 0.628 ** | 1 |
| Sig. (Two-tailed) | 0.000 | \ | |
| Cases | 35 | 35 |
Note: ** Significant at the 0.01 level (two-tailed).
Table 4.
Calculation of street POI quantity, street length, and functional density.
| Street Name | Number of POI | Street Length (m) | Functional Density | Street Name | Number of POI | Street Length (m) | Functional Density |
|---|---|---|---|---|---|---|---|
| Zhongshan North Road | 342 | 890 | 0.384 | Fuhouli Road | 506 | 340 | 1.488 |
| Zhongshan Middle Road | 1800 | 1968 | 0.915 | Yiren Road | 726 | 554 | 1.310 |
| Jiefang East Road | 756 | 637 | 1.187 | Libin Road | 394 | 481 | 0.819 |
| Jiefang West Road | 622 | 592 | 1.051 | Furong Road | 194 | 307 | 0.632 |
| Xinyi Road | 256 | 394 | 0.650 | Dongzhen Road | 80 | 445 | 0.179 |
| Nanhuan Road | 402 | 846 | 0.475 | Shanhubei Road | 190 | 416 | 0.456 |
| Yiwu Road | 376 | 1843 | 0.204 | Rongcheng Road | 268 | 304 | 0.881 |
| Wenming Road | 460 | 525 | 0.876 | Huguang Road | 194 | 164 | 1.183 |
| Longzhu Road | 122 | 764 | 0.160 | Rongyin Road | 238 | 362 | 0.657 |
| Fengbei Road | 258 | 527 | 0.490 | Wenhuagong Road | 546 | 282 | 1.936 |
| Diecai Road | 276 | 342 | 0.807 | Sanhuang Road | 84 | 165 | 0.509 |
| Binjiang Road | 670 | 2179 | 0.307 | Taiping Road | 320 | 237 | 1.350 |
| Sanduo Road | 534 | 588 | 0.908 | Tiefu Road | 60 | 283 | 0.212 |
| Sihui Road | 202 | 414 | 0.488 | Ronghunan Road | 200 | 537 | 0.372 |
| Lequn Road | 258 | 500 | 0.516 | Lingui Road | 202 | 397 | 0.509 |
| Xicheng Road | 348 | 462 | 0.753 | Tongquan Road | 542 | 396 | 1.369 |
| Chongshan Road | 246 | 285 | 0.863 | Jiaotong Road | 406 | 456 | 0.890 |
| Wumei Road | 226 | 470 | 0.481 |
Table 5.
Correlation analysis between integration, kernel density, and functional density.
| Integration | Kernel Density | Functional Density | ||
|---|---|---|---|---|
| Integration | Pearson Correlation | 1 | 0.628 ** | 0.622 ** |
| Sig. (Two-tailed) | \ | 0.000 | 0.000 | |
| Cases | 35 | 35 | 35 | |
| Kernel Density | Pearson Correlation | 0.628 ** | 1 | 0.901 ** |
| Sig. (Two-tailed) | 0.000 | \ | 0.000 | |
| Cases | 35 | 35 | 35 | |
| Functional Density | Pearson Correlation | 0.622 ** | 0.901 ** | 1 |
| Sig. (Two-tailed) | 0.000 | 0.000 | \ | |
| Cases | 35 | 35 | 35 |
Note: ** Significant at the 0.01 level (two-tailed).
Table 6.
Calculation of Deviation Degree.
| Street Name | Functional Density | Road Integration | Deviation Degree | Street Name | Functional Density | Road Integration | Deviation Degree |
|---|---|---|---|---|---|---|---|
| Zhongshan North Road | 0.384 | 0.769 | 0.500 | Fuhouli Road | 1.488 | 0.885 | 1.682 |
| Zhongshan Middle Road | 0.915 | 0.986 | 0.931 | Yiren Road | 1.310 | 0.933 | 1.405 |
| Jiefang East Road | 1.187 | 1.044 | 1.136 | Libin Road | 0.819 | 0.903 | 0.907 |
| Jiefang West Road | 1.051 | 0.988 | 1.063 | Furong Road | 0.632 | 0.767 | 0.823 |
| Xinyi Road | 0.650 | 0.717 | 0.906 | Dongzhen Road | 0.179 | 0.690 | 0.261 |
| Nanhuan Road | 0.475 | 0.855 | 0.556 | Shanhubei Road | 0.456 | 0.825 | 0.554 |
| Yiwu Road | 0.204 | 0.802 | 0.254 | Rongcheng Road | 0.881 | 0.910 | 0.969 |
| Wenming Road | 0.876 | 0.800 | 1.095 | Huguang Road | 1.183 | 0.929 | 1.274 |
| Longzhu Road | 0.160 | 0.686 | 0.233 | Rongyin Road | 0.657 | 0.921 | 0.714 |
| Fengbei Road | 0.490 | 0.834 | 0.587 | Wenhuagong Road | 1.936 | 0.959 | 2.019 |
| Diecai Road | 0.807 | 0.782 | 1.032 | Sanhuang Road | 0.509 | 0.844 | 0.603 |
| Binjiang Road | 0.307 | 0.915 | 0.336 | Taiping Road | 1.350 | 0.849 | 1.591 |
| Sanduo Road | 0.908 | 0.873 | 1.040 | Tiefu Road | 0.212 | 0.700 | 0.303 |
| Sihui Road | 0.488 | 0.809 | 0.603 | Ronghunan Road | 0.372 | 0.805 | 0.463 |
| Lequn Road | 0.516 | 0.880 | 0.586 | Lingui Road | 0.509 | 0.800 | 0.636 |
| Xicheng Road | 0.753 | 0.836 | 0.901 | Tongquan Road | 1.369 | 0.871 | 1.572 |
| Chongshan Road | 0.863 | 0.784 | 1.101 | Jiaotong Road | 0.890 | 0.841 | 1.059 |
| Wumei Road | 0.481 | 0.848 | 0.567 |
Table 7.
Deviation from street values and causes.
| Street | Functional Density | Integration | Deviation Degree | |
|---|---|---|---|---|
| Longzhu Road | 0.160 | 0.686 | 0.233 | This kind of high integration degree of the street is on behalf of good accessibility. However, the low functional density value meant that the number of POI per metre in the street was small. This kind of street had the potential to enhance the mixed function on the premise of good accessibility and sufficient street space. This type of street was characterized by a low deviation degree value |
| Yiwu Road | 0.204 | 0.802 | 0.254 | |
| Dongzhen Road | 0.179 | 0.690 | 0.261 | |
| Tiefo Road | 0.212 | 0.700 | 0.303 | |
| Binjiang Road | 0.307 | 0.915 | 0.336 | |
| Ronghu South Road | 0.372 | 0.805 | 0.463 | |
| Wenhuagong Road | 1.936 | 0.959 | 2.019 | This type of street space had a high density of functional facilities, with a large number of points of interest (POIs) per metre of street. This indicated that the street space was compressed, leading to abnormal situations such as traffic congestion and pedestrian crowding. Streets with these characteristics exhibited a high deviation degree value. |
Table 8.
Deviation from street categorisation.
| Street Name | Longzhu Road | Yiwu Road | Binjiang Road | Tiefu Road | Dongzhen Road | Ronghunan Road | Wenhua Gong Road |
|---|---|---|---|---|---|---|---|
| Street Level | Secondary Road | Secondary Road | Secondary Road | Side Road | Side Road | Side Road | Side Road |
| Type | Potential | Potential | Potential | Potential | Potential | Potential | Abnormal |
Table 9.
Four streets with similar characteristics among the potential streets.
| Street Name | Street Level | Type | Street Features |
|---|---|---|---|
| Yiwu Road | Secondary Road | Potential Street | Alongside Gui Lake |
| Binjiang Road | Secondary Road | Potential Street | Alongside Li River |
| Dongzhen Road | Side Road | Potential Street | Near Scenic Area |
| Ronghunan Road | Side Road | Potential Street | Alongside Rong Lake |
Table 10.
Number POI formats on Yiwu Road.
| Street Name | Shopping Services | Public Facilities | Medical Services | Government Agencies | Living Services | Science and Education |
|---|---|---|---|---|---|---|
| Yiwu Road | 109 | 0 | 18 | 10 | 48 | 14 |
Table 11.
Other potential streets.
| Street Name | Street Level | Type | Street Features |
|---|---|---|---|
| Longzhu Road | Secondary Road | Potential Street | \ |
| Tiefu Road | Side Road | Potential Street | \ |
Table 12.
Number POI formats on Tiefo Road and Longzhu Road.
| Street Name | Shopping Services | Public Facilities | Medical Services | Government Agencies | Living Services | Science and Education |
|---|---|---|---|---|---|---|
| Longzhu Road | 15 | 3 | 2 | 4 | 5 | 6 |
| Tiefu Road | 19 | 0 | 2 | 4 | 7 | 7 |
Table 13.
Categorised abnormal streets.
| Street Name | Street Level | Type | Street Features |
|---|---|---|---|
| Wenhuagong Road | Side Road | Abnormal Street | \ |
Table 14.
Number POI formats on Wenhuagong Road.
| Street Name | Shopping Services | Public Facilities | Medical Services | Government Agencies | Living Services | Science and Education |
|---|---|---|---|---|---|---|
| Wenhuagong Road | 35 | 1 | 2 | 4 | 13 | 4 |
Disclaimer/Publisher’s Note: The statements, opinions and data contained in all publications are solely those of the individual author(s) and contributor(s) and not of MDPI and/or the editor(s). MDPI and/or the editor(s) disclaim responsibility for any injury to people or property resulting from any ideas, methods, instructions or products referred to in the content. |
© 2024 by the authors. Licensee MDPI, Basel, Switzerland. This article is an open access article distributed under the terms and conditions of the Creative Commons Attribution (CC BY) license (https://creativecommons.org/licenses/by/4.0/).
Share and Cite
MDPI and ACS Style
Yang, L.; Jin, Q.; Fu, F. Research on Urban Street Network Structure Based on Spatial Syntax and POI Data. Sustainability 2024, 16, 1757. https://doi.org/10.3390/su16051757
AMA Style
Yang L, Jin Q, Fu F. Research on Urban Street Network Structure Based on Spatial Syntax and POI Data. Sustainability. 2024; 16(5):1757. https://doi.org/10.3390/su16051757
Chicago/Turabian StyleYang, Luxiao, Qizhi Jin, and Feng Fu. 2024. "Research on Urban Street Network Structure Based on Spatial Syntax and POI Data" Sustainability 16, no. 5: 1757. https://doi.org/10.3390/su16051757
Note that from the first issue of 2016, this journal uses article numbers instead of page numbers. See further details here.