
Advancing Urban Healthcare Equity Analysis: Integrating Public Participation GIS with Fuzzy Best–Worst Decision-Making

 , ,
, , 
Abstract
:1. Introduction
2. Materials and Methods
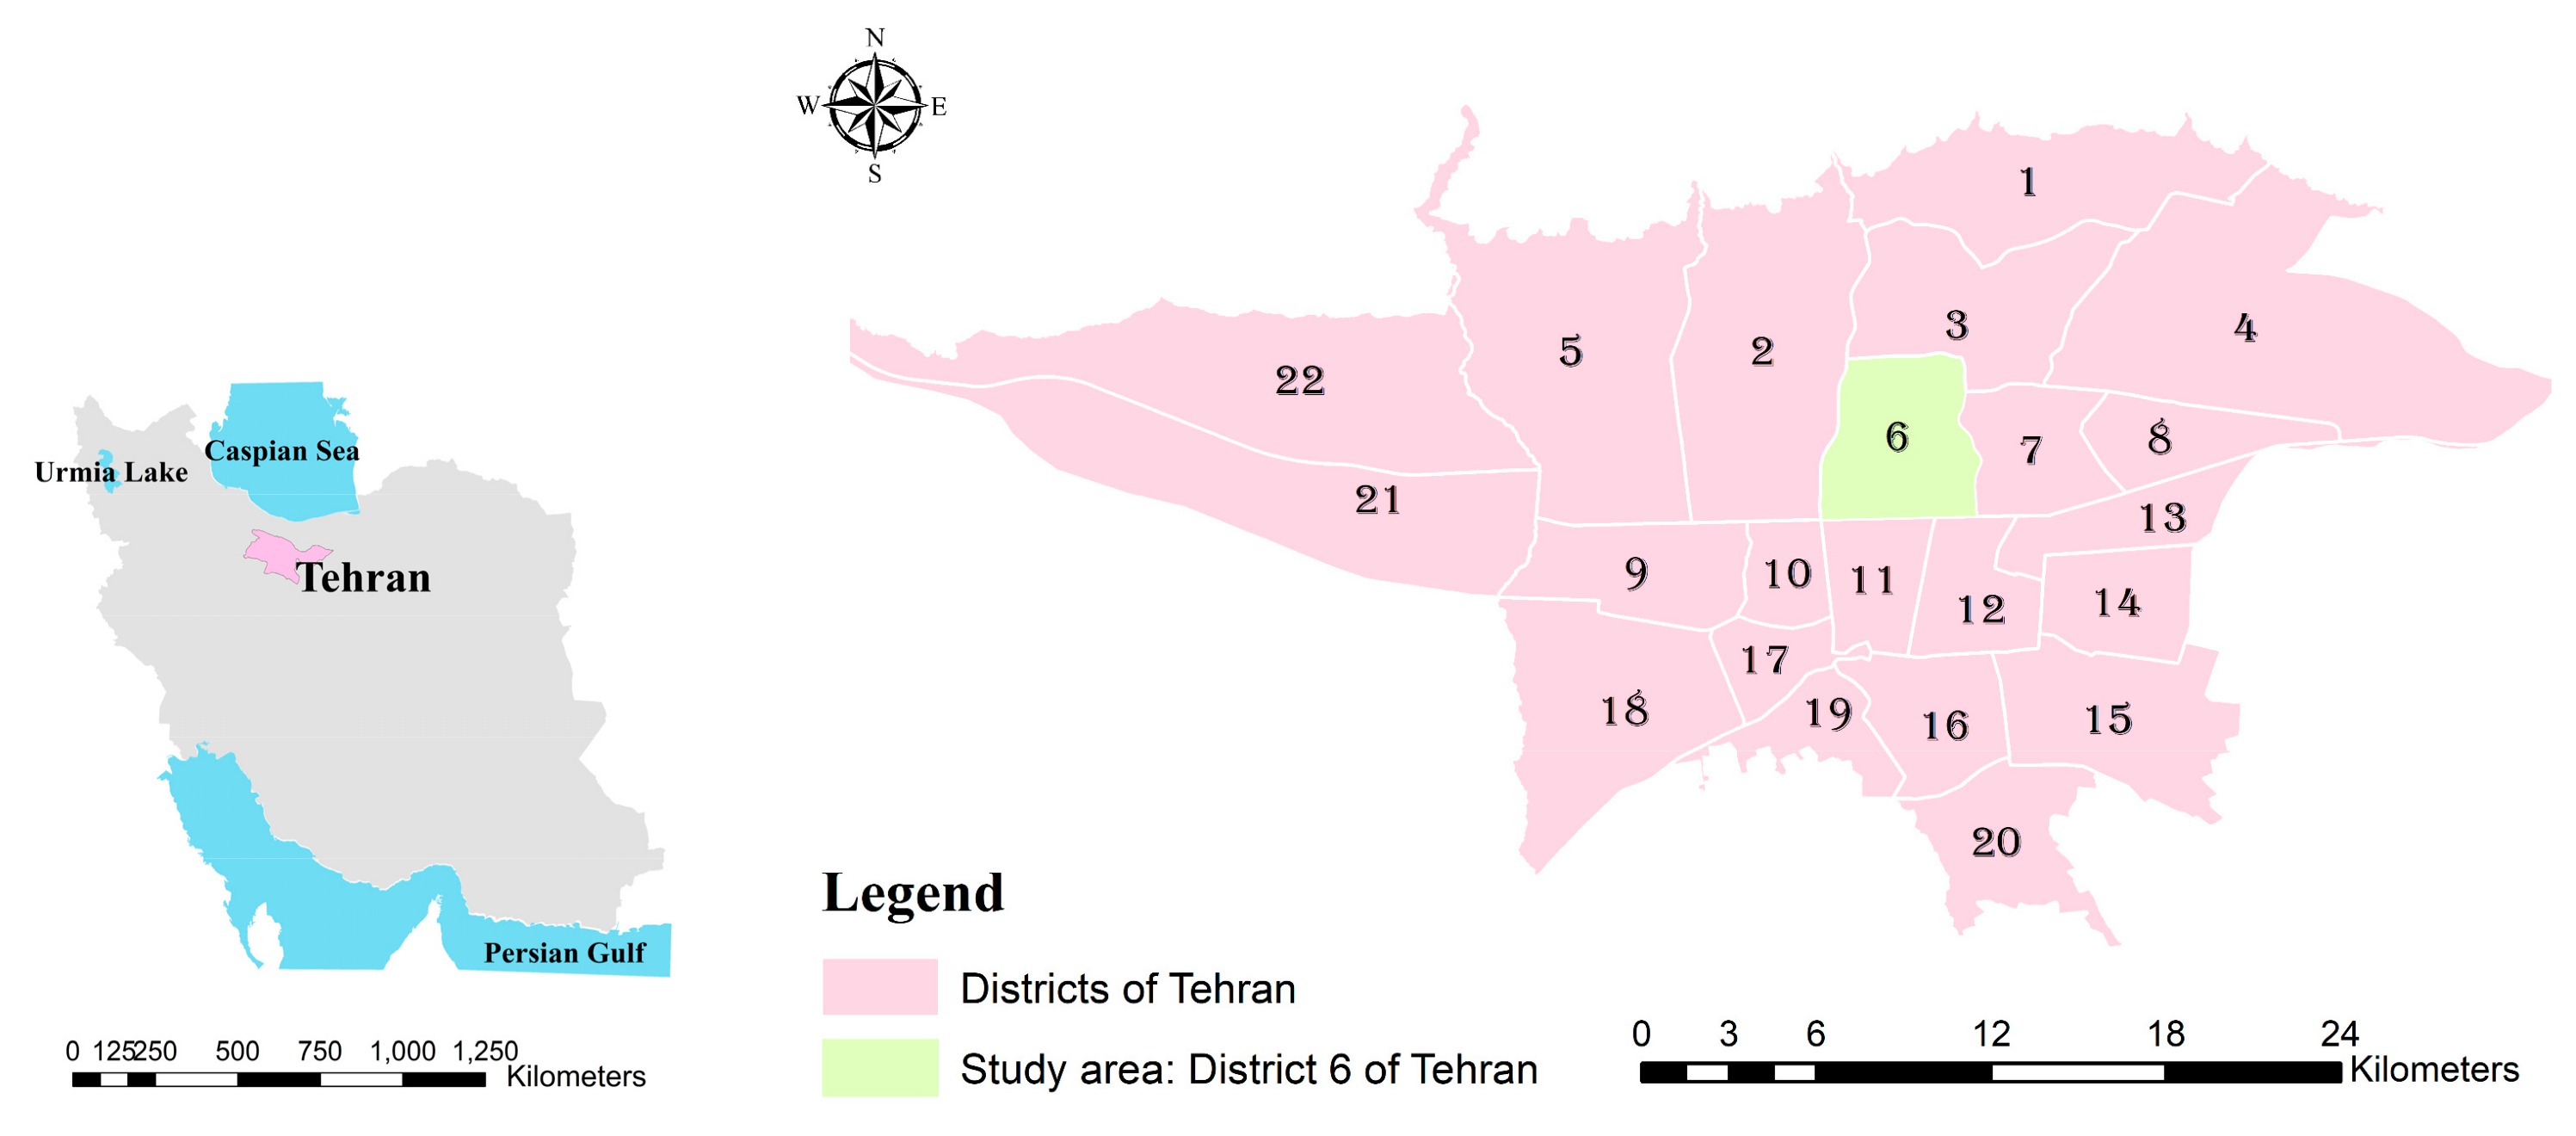
2.1. Study Area
2.2. Data
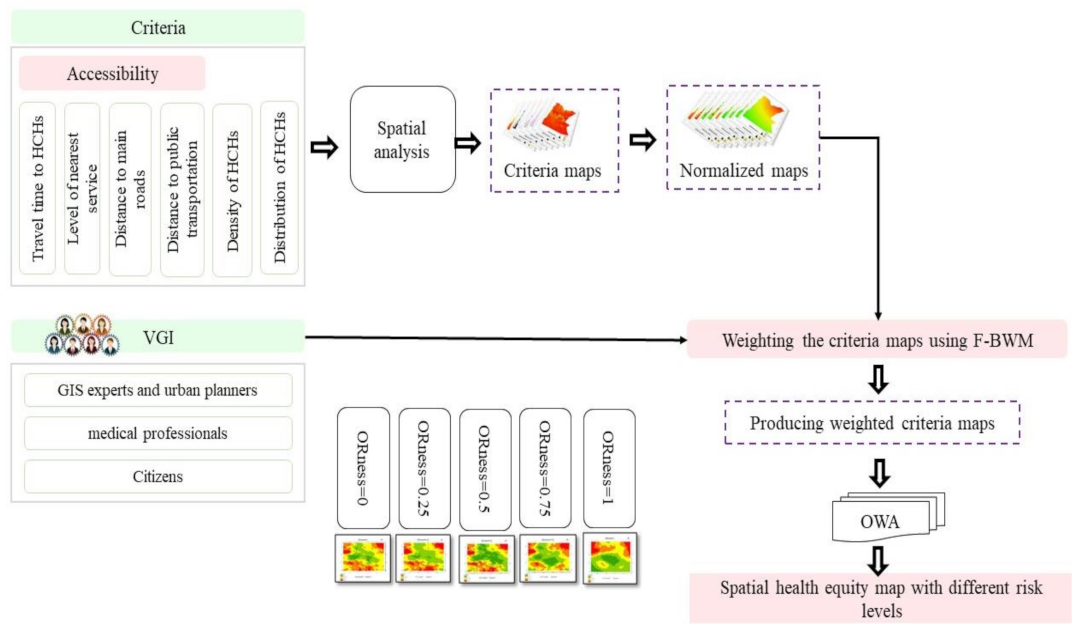
2.3. Methods
2.3.1. Determining the Criteria
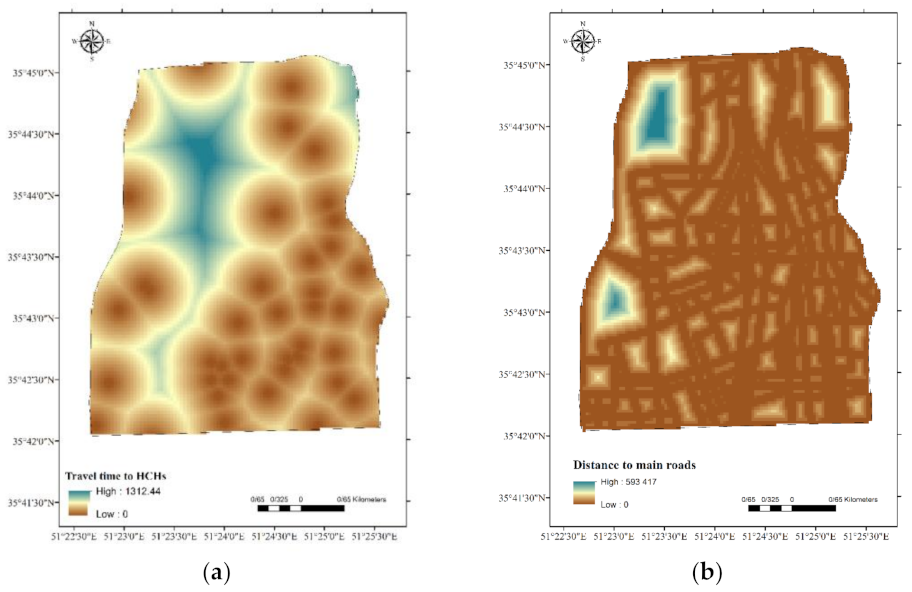
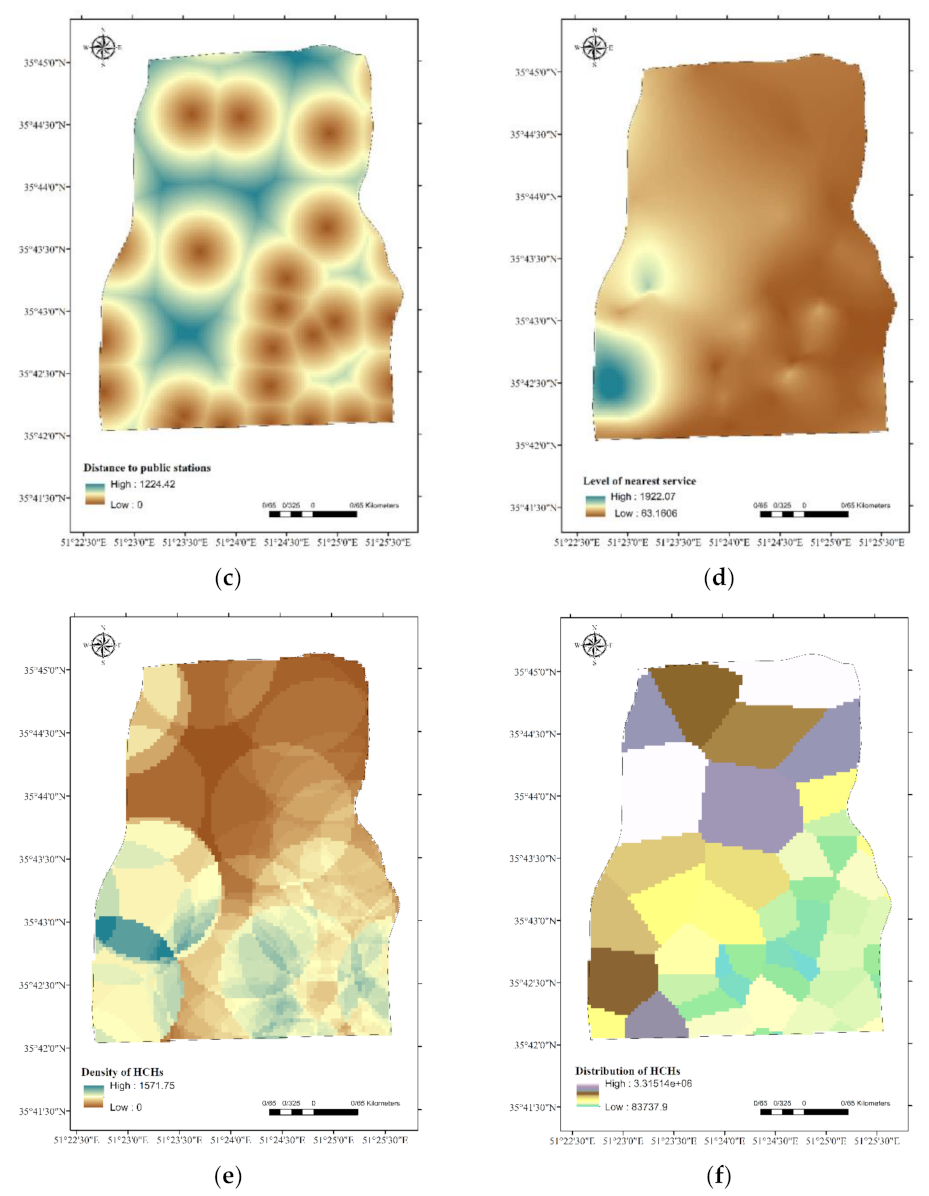
2.3.2. Spatial Analysis with the Generation of the Criteria Maps
2.3.3. Normalisation of the Criteria
2.3.4. Applying the F-BWM to Assign Weights to the Criteria
The Fuzzy Best–Worst Method

| Linguistic | Term | Triangular Fuzzy Number | |||
|---|---|---|---|---|---|
| Equally | Importance | (EI) | (1, | 1, | 1) |
| Weekly | Importance | (WI) | (2.3, | 1, | 1.5) |
| Fairly | Importance | (FI) | (1.5, | 2, | 2.5) |
| Very | Importance | (VI) | (2.5, | 3, | 3.5) |
| Absolutely | Importance | (AI) | (3.5, | 4, | 4.5) |
Aggregating the Criteria Weights and Normalised Criteria Maps with OWA
Procedures
3. Results
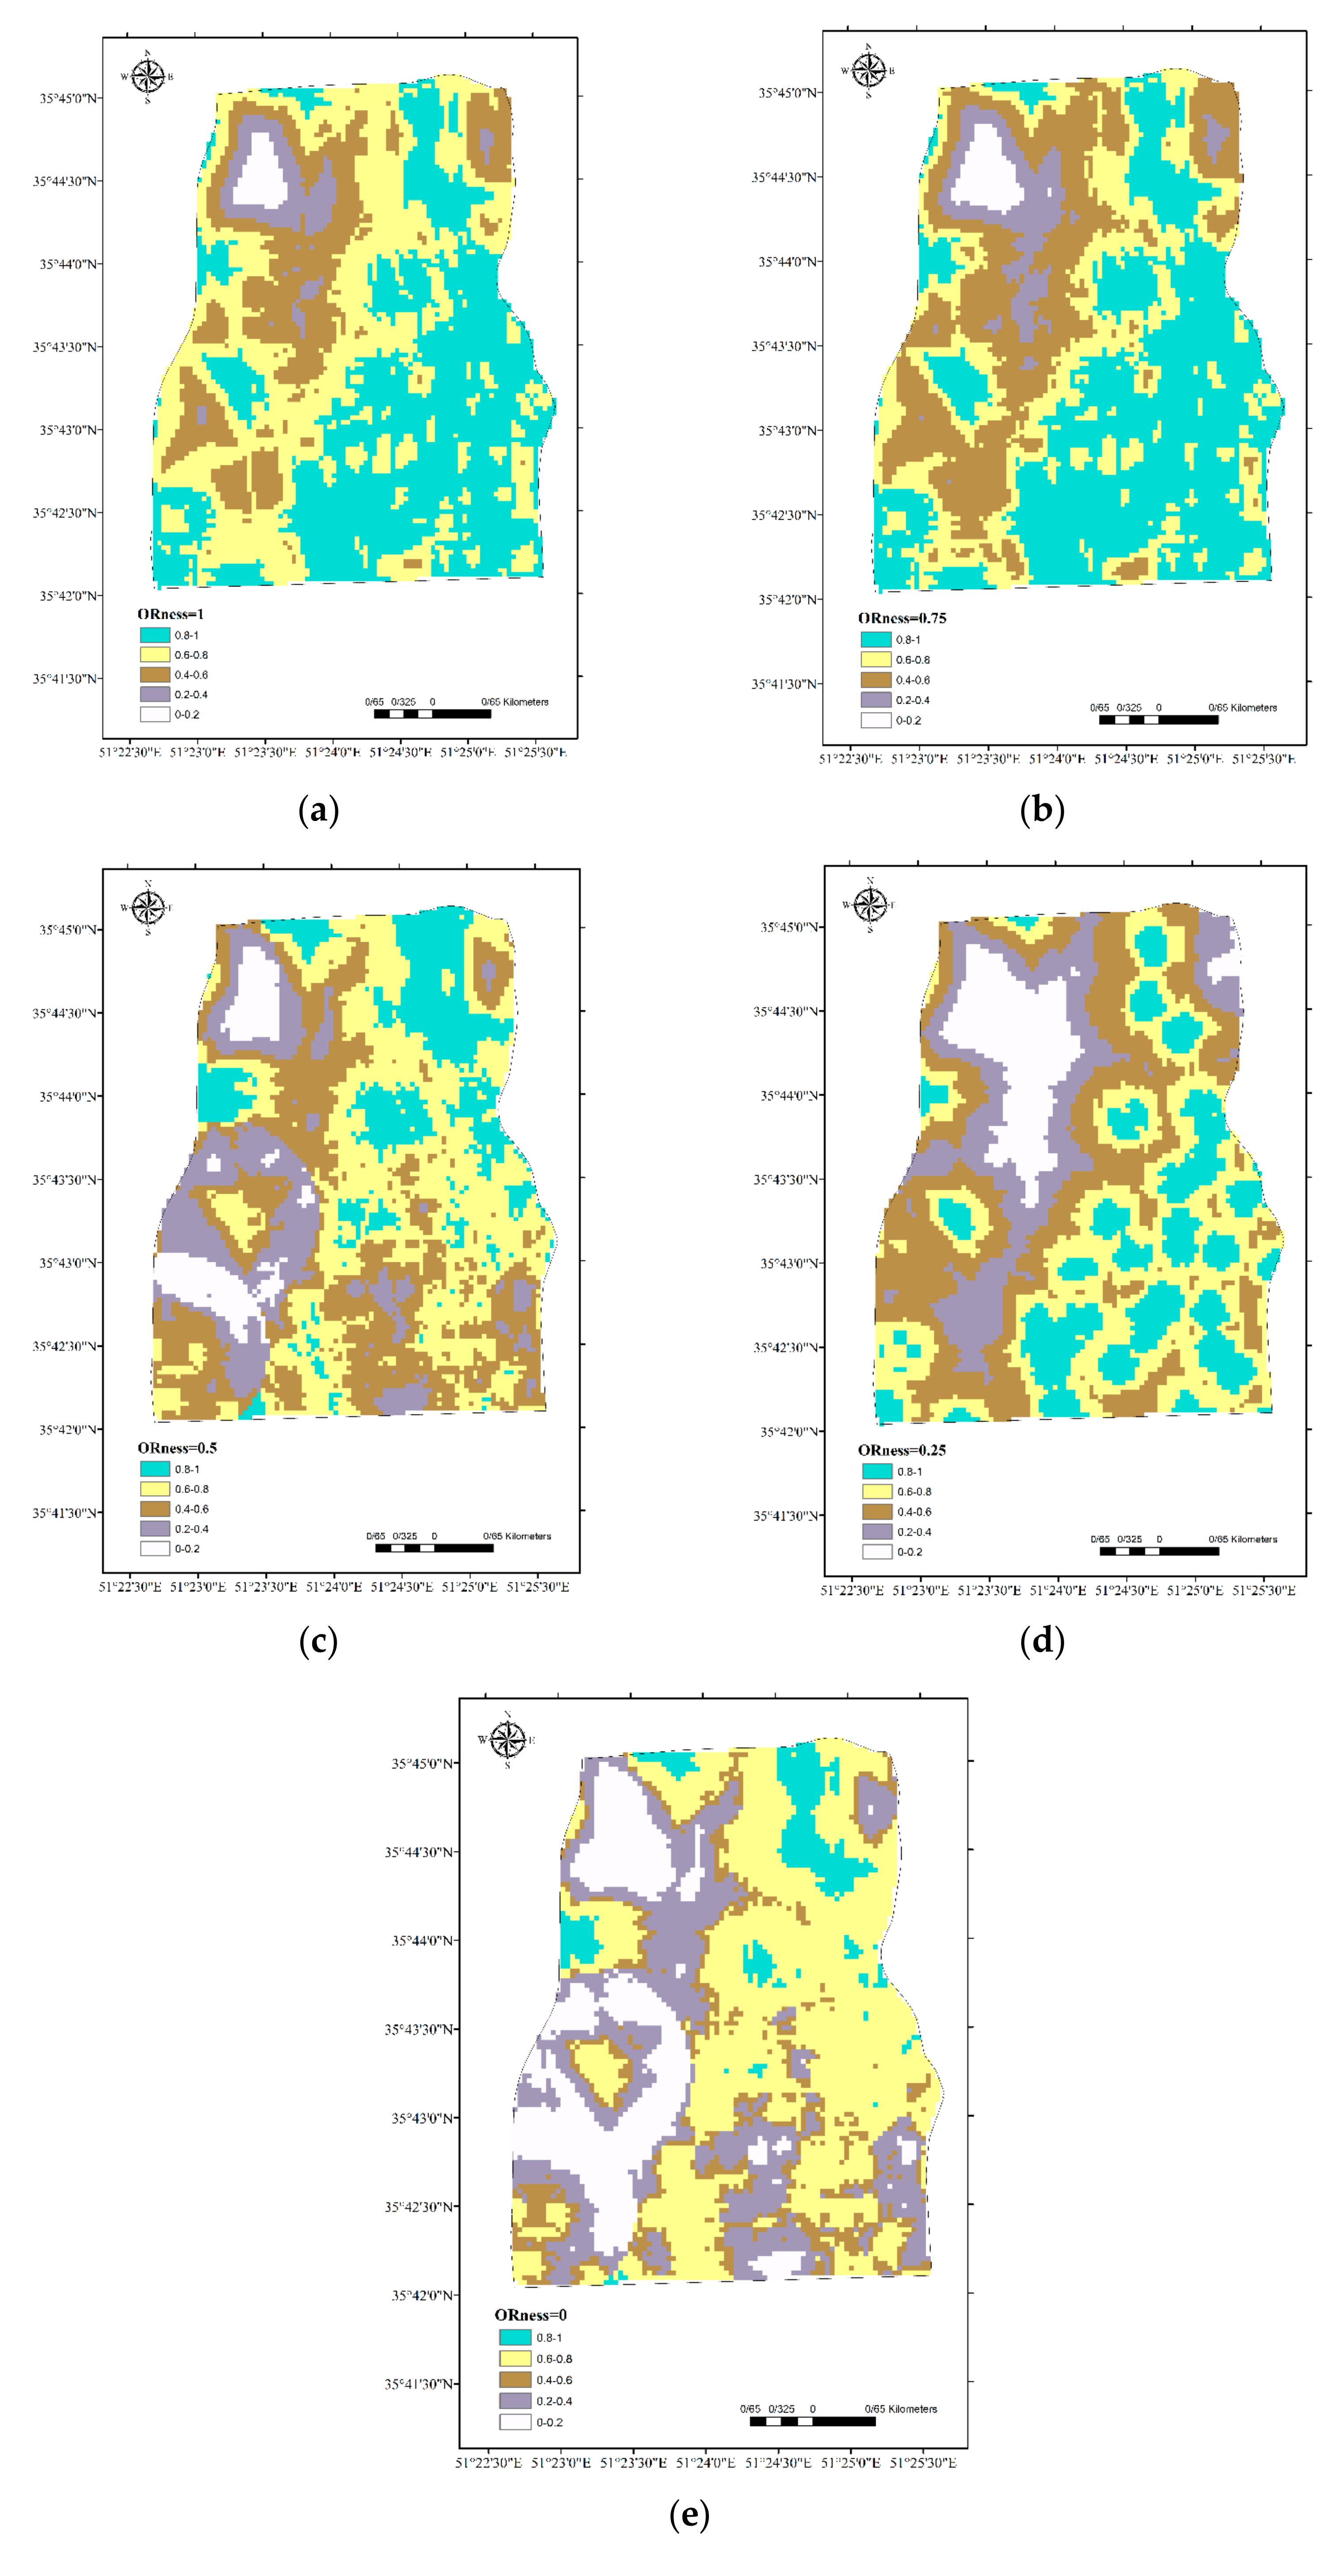
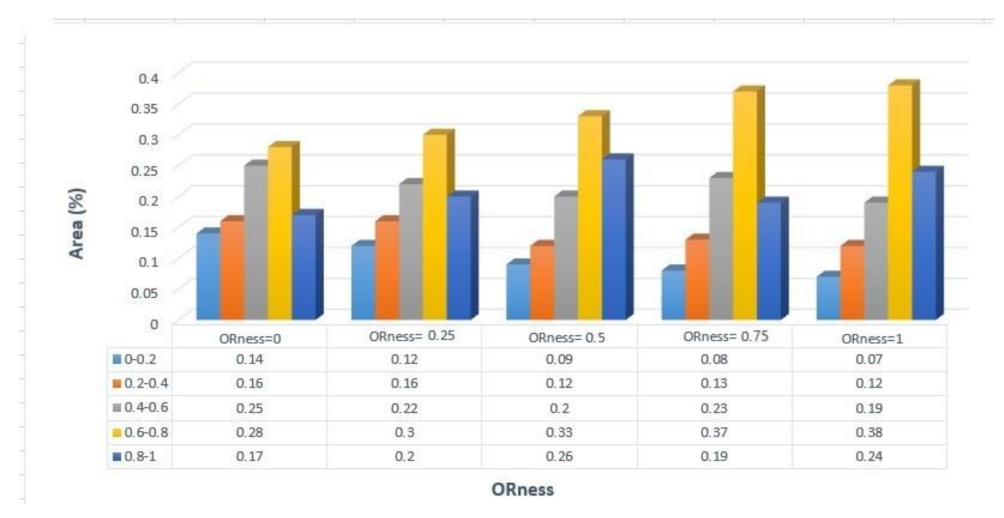
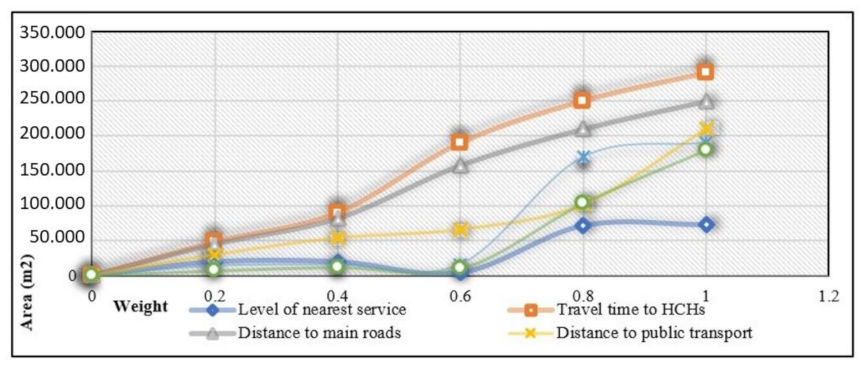
Sensitivity Analysis
4. Discussion
Limitations
5. Conclusions
Supplementary Materials
Author Contributions
Funding
Institutional Review Board Statement
Informed Consent Statement
Data Availability Statement
Conflicts of Interest
References
- Wood, S.M.; Alston, L.; Beks, H.; Mc Namara, K.; Coffee, N.T.; Clark, R.A.; Shee, A.W.; Versace, V.L. The application of spatial measures to analyse health service accessibility in Australia: A systematic review and recommendations for future practice. BMC Health Serv. Res. 2023, 23, 330. [Google Scholar] [CrossRef]
- Lu, C.; Zhang, Z.; Lan, X. Impact of China’s referral reform on the equity and spatial accessibility of healthcare resources: A case study of Beijing. Soc. Sci. Med. 2019, 235, 112386. [Google Scholar] [CrossRef]
- Neisani Samani, Z.; Alesheikh, A.A. Uncertainty Modelling of Citizen-Centered Group Decision Making Using Fuzzy-VIKOR Case Study: Site Selection of Healthcare Services. The International Archives of the Photogrammetry. Remote Sens. Spat. Inf. Sci. 2019, 42, 809–814. [Google Scholar]
- Whitehead, J.; Pearson, A.; Lawrenson, R.; Atatoa-Carr, P. Spatial equity and realised access to healthcare—A geospatial analysis of general practitioner enrolments in Waikato, New Zealand. Rural Remote. Health 2019, 19, 5349. [Google Scholar] [CrossRef] [PubMed]
- Zhang, S.; Song, X.; Wei, Y.; Deng, W. Spatial equity of multilevel healthcare in the metropolis of chengdu, china: A new assessment approach. Int. J. Environ. Res. Public Health 2019, 16, 493. [Google Scholar] [CrossRef] [PubMed]
- Solar, O.; Irwin, A. A Conceptual Framework for Action on the Social Determinants of Health; WHO Document Production Services: Geneva, Switzerland, 2010. [Google Scholar]
- Levesque, J.-F.; Harris, M.F.; Russell, G. Patient-centred access to health care: Conceptualising access at the interface of health systems and populations. Int. J. Equity Health 2013, 12, 18. [Google Scholar] [CrossRef] [PubMed]
- Pinna, F.; Garau, C.; Annunziata, A. A Literature Review on Urban Usability and Accessibility to Investigate the Related Criteria for Equality in the City. In International Conference on Computational Science and Its Applications; Springer International Publishing: Cham, Switzerland, 2021; pp. 525–541. [Google Scholar]
- Pellicelli, G.; Caselli, B.; Garau, C.; Torrisi, V.; Rossetti, S. Sustainable Mobility and Accessibility to Essential Services. An Assessment of the San Benedetto Neighbourhood in Cagliari (Italy). In International Conference on Computational Science and Its Applications; Springer International Publishing: Cham, Switzerland, 2022; pp. 423–438. [Google Scholar]
- Baazeem, M.; Kruger, E.; Tennant, M. Geospatial distribution of tertiary hospitals across Australian cities. Aust. Health Rev. 2023, 47, 379–385. [Google Scholar] [CrossRef] [PubMed]
- Rassu, N.; Maltinti, F.; Coni, M.; Garau, C.; Barabino, B.; Pinna, F.; Devoto, R. Accessibility to Local Public Transport in Cagliari with Focus on the Elderly. In International Conference on Computational Science and Its Applications; Springer International Publishing: Cham, Switzerland, 2020; pp. 690–705. [Google Scholar]
- Wang, F. Measurement, optimization, and impact of health care accessibility: A methodological review. Ann. Assoc. Am. Geogr. 2012, 102, 1104–1112. [Google Scholar] [CrossRef]
- Wan, N.; Zou, B.; Sternberg, T. A three-step floating catchment area method for analyzing spatial access to health services. Int. J. Geogr. Inf. Sci. 2012, 26, 1073–1089. [Google Scholar] [CrossRef]
- Ye, H.; Kim, H. Measuring spatial health disparity using a network-based accessibility index method in a GIS environment: A case study of Hillsborough County, Florida. Int. J. Geospat. Environ. Res. 2014, 1, 2. [Google Scholar]
- Mansour, S. Spatial analysis of public health facilities in Riyadh Governorate, Saudi Arabia: A GIS-based study to assess geographic variations of service provision and accessibility. Geo-Spat. Inf. Sci. 2016, 19, 26–38. [Google Scholar] [CrossRef]
- Ni, J.; Liang, M.; Lin, Y.; Wu, Y.; Wang, C. Multi-mode two-step floating catchment area (2sfca) method to measure the potential spatial accessibility of healthcare services. ISPRS Int. J. Geo-Inf. 2019, 8, 236. [Google Scholar] [CrossRef]
- Wang, J.; Su, Y.; Chen, Z.; Tang, L.; Wang, G.; Wang, J. Assessing the Spatial Accessibility of Urban Medical Facilities in Multi-Level and Multi-Period Scales Based on Web Mapping API and an Improved Potential Model. ISPRS Int. J. Geo-Inf. 2022, 11, 545. [Google Scholar] [CrossRef]
- Parvin, F.; Ali, S.A.; Hashmi, S.N.; Khatoon, A. Accessibility and site suitability for healthcare services using GIS-based hybrid decision-making approach: A study in Murshidabad, India. Spat. Inf. Res. 2021, 29, 1–8. [Google Scholar] [CrossRef]
- Xia, Y.; Chen, H.; Zuo, C.; Zhang, N. The impact of traffic on equality of urban healthcare service accessibility: A case study in Wuhan, China. Sustain. Cities Soc. 2022, 86, 104130. [Google Scholar] [CrossRef]
- Safi, E.; Amirfakhriyan, M.; Ameri, H.; Zare, H.; Ranjbar, M.; Assefa, Y. Spatial Accessibility to Primary Healthcare Facilities in Iran: A GIS-Based Approach. Évid. Based Health Policy Manag. Econ. 2023, 7, 38–50. [Google Scholar] [CrossRef]
- Auld, B.C.; Abell, B.; Venugopal, P.S.; McPhail, S. Geographical challenges and inequity of healthcare access for high-risk paediatric heart disease. Int. J. Equity Health 2023, 22, 229. [Google Scholar] [CrossRef] [PubMed]
- Moslem, S.; Gul, M.; Farooq, D.; Celik, E.; Ghorbanzadeh, O.; Blaschke, T. An integrated approach of best-worst method (bwm) and triangular fuzzy sets for evaluating driver behavior factors related to road safety. Mathematics 2020, 8, 414. [Google Scholar] [CrossRef]
- Mashunin, Y.K. Mathematical apparatus of optimal decision-making based on vector optimization. Appl. Syst. Innov. 2019, 2, 32. [Google Scholar] [CrossRef]
- Malczewski, J. Local weighted linear combination. Trans. GIS 2011, 15, 439–455. [Google Scholar] [CrossRef]
- Zhang, D.; Lee, I. Interpolation of sensory data in the presence of obstacles. Procedia Comput. Sci. 2014, 29, 2496–2506. [Google Scholar] [CrossRef]
- Mooney, P.; Corcoran, P.; Ciepluch, B. The potential for using volunteered geographic information in pervasive health computing applications. J. Ambient. Intell. Humaniz. Comput. 2012, 4, 731–745. [Google Scholar] [CrossRef]
- Libório, M.P.; Ekel, P.; Laudares, S.; Martins, C.A.P.d.S. A goal-based weighting for composite indicators constructed through Ordered Weighted Averaging (OWA) operator. MethodsX 2024, 12, 102575. [Google Scholar] [CrossRef] [PubMed]
- Rezaei, J. Best-worst multi-criteria decision-making method. Omega 2015, 53, 49–57. [Google Scholar] [CrossRef]
- Dehbarez, N.T.; Gyrd-Hansen, D.; Uldbjerg, N.; Søgaard, R. Does free choice of hospital conflict with equity of access to highly specialized hospitals? A case study from the Danish health care system. Health Policy 2018, 122, 722–727. [Google Scholar] [CrossRef] [PubMed]
- Wu, Q.; Liu, X.; Zhou, L.; Qin, J.; Rezaei, J. An analytical framework for the best–worst method. Omega 2024, 123, 102974. [Google Scholar] [CrossRef]
- Cheng, X.; Chen, C. Decision making with intuitionistic fuzzy best-worst method. Expert Syst. Appl. 2024, 237, 121215. [Google Scholar] [CrossRef]
- Malczewski, J.; Rinner, C. Multicriteria Decision Analysis in Geographic Information Science; Springer: New York, NY, USA, 2015. [Google Scholar]
- Guo, S.; Zhao, H. Fuzzy best-worst multi-criteria decision-making method and its applications. Knowledge-Based Syst. 2017, 121, 23–31. [Google Scholar] [CrossRef]
- Lilburne, L.; Tarantola, S. Sensitivity analysis of spatial models. Int. J. Geogr. Inf. Sci. 2009, 23, 151–168. [Google Scholar] [CrossRef]
- Malczewski, J.; Liu, X. Local ordered weighted averaging in GIS-based multicriteria analysis. Ann. GIS 2014, 20, 117–129. [Google Scholar] [CrossRef]
- Poleto, T.; de Carvalho, V.D.; de Oliveira, R.C. Applying spatial decision support for maternal mortality analysis in a Brazilian State. Socioecon. Anal. 2023, 1, 92–102. [Google Scholar] [CrossRef]
- Lopes, D.F.; Marques, J.L.; Castro, E.A. A MCDA/GIS-Based Approach for Evaluating Accessibility to Health Facilities. In International Conference on Computational Science and Its Applications; Springer International Publishing: Cham, Switzerland, 2021; pp. 311–322. [Google Scholar]


| Gender | Female | 59 |
| Male | 51 | |
| Age | 15–40 | 58 |
| 40–70 | 40 | |
| Older than 70 | 12 | |
| Education | High school | 4 |
| Undergraduate | 67 | |
| Postgraduate | 39 | |
| Field of Study | Specialists in GIS and urban planning | 24 |
| Medical practitioners | 18 | |
| Citizens | 68 |
| Criteria | Weights | Consistency Index |
|---|---|---|
| Level of nearest service | 0.11 | 0.08 |
| Travel time to HCHs | 0.26 | |
| Distance to main roads | 0.24 | |
| Distance to public transportation | 0.18 | |
| Density of HCHs | 0.12 | |
| Distribution of HCHs | 0.09 |
Disclaimer/Publisher’s Note: The statements, opinions and data contained in all publications are solely those of the individual author(s) and contributor(s) and not of MDPI and/or the editor(s). MDPI and/or the editor(s) disclaim responsibility for any injury to people or property resulting from any ideas, methods, instructions or products referred to in the content. |
© 2024 by the authors. Licensee MDPI, Basel, Switzerland. This article is an open access article distributed under the terms and conditions of the Creative Commons Attribution (CC BY) license (https://creativecommons.org/licenses/by/4.0/).
Share and Cite
Samani, Z.N.; Alesheikh, A.A.; Karimi, M.; Samany, N.N.; Bayat, S.; Lotfata, A.; Garau, C. Advancing Urban Healthcare Equity Analysis: Integrating Public Participation GIS with Fuzzy Best–Worst Decision-Making. Sustainability 2024, 16, 1745. https://doi.org/10.3390/su16051745
Samani ZN, Alesheikh AA, Karimi M, Samany NN, Bayat S, Lotfata A, Garau C. Advancing Urban Healthcare Equity Analysis: Integrating Public Participation GIS with Fuzzy Best–Worst Decision-Making. Sustainability. 2024; 16(5):1745. https://doi.org/10.3390/su16051745
Chicago/Turabian StyleSamani, Zeinab Neisani, Ali Asghar Alesheikh, Mohammad Karimi, Najmeh Neysani Samany, Sayeh Bayat, Aynaz Lotfata, and Chiara Garau. 2024. "Advancing Urban Healthcare Equity Analysis: Integrating Public Participation GIS with Fuzzy Best–Worst Decision-Making" Sustainability 16, no. 5: 1745. https://doi.org/10.3390/su16051745