
Method for Delivery Planning in Urban Areas with Environmental Aspects
by
 , , and
Michał Lasota
1,
Aleksandra Zabielska
1,
Marianna Jacyna
1,*,
Piotr Gołębiowski
1 ,
,
Renata Żochowska
2 and
Mariusz Wasiak
1 1
Faculty of Transport, Warsaw University of Technology, 00-662 Warsaw, Poland
2
Faculty of Transport and Aviation Engineering, Silesian University of Technology, Krasińskiego 8 Street, 40-019 Katowice, Poland
*
Author to whom correspondence should be addressed.
Sustainability 2024, 16(4), 1571; https://doi.org/10.3390/su16041571
Submission received: 4 January 2024
/
Revised: 6 February 2024
/
Accepted: 9 February 2024
/
Published: 13 February 2024
(This article belongs to the Collection Sustainable Public Transport in Urban Areas – Optimization, Management and Development)
Abstract
:This article presents research results on a multi-aspect assessment of delivery planning in the urban transport network. The distribution of goods and the operation of a network of small services in urban agglomerations is a very important decision-making problem. This is due, on one hand, to the dense development of urban areas and, on the other hand, to the increasing restrictions on minimizing harmful exhaust gases emitted by cars. Hence, many researchers are looking for decision support methods that take into account many partial points of view in the field of transport services for small service companies located in urban areas. The authors present a method of multi-criteria decision support in the planning of urban supplies, taking into account the minimization of emissions of harmful compounds (carbon dioxide, nitrogen oxides, and particulate matter), the cost, time, and amount of ecosystem exposure to these compounds. An important aspect of this research was to identify partial criteria of the decision support methodology and the definition of decision variants. The partial criteria included cost, time, and the amount of exposure of the ecosystem to harmful compounds. The Saaty method was used to determine the weights of the criteria.
1. Introduction
Transport services for manufacturing activities located in cities, also called urban transport logistics, play an increasingly important role and are the subject of many analyses. The increasing importance of urban logistics results from the need to provide goods and services in a more effective, sustainable, and environmentally friendly way [1]. Adapting urban logistics to these challenges is becoming more and more important for the development of cities and improving the quality of life of their inhabitants. Therefore, many problems arise that require scientific research to find effective solutions [2]. Urban areas often struggle with congestion, i.e., crowded roads, which leads to delays in deliveries, increased transport costs, and air pollution [3]. This also involves the safety of suppliers and other road users, which is a priority in the area of city logistics. Another challenge in urban logistics is the effective delivery of goods from the distribution point to the end customer because it is expensive and requires advanced delivery strategies [4,5]. In addition, cities are introducing more and more regulations and standards regarding deliveries and transport, which may affect the logistics concepts of suppliers. It should be taken into account that nowadays, it is important to reduce greenhouse gas emissions and carbon footprint and minimize the harmful impact on the natural environment. Therefore, one should choose electric or hybrid vehicles that emit less harmful compounds, especially carbon dioxide [6].
When analyzing the problems that arise, it is also worth taking into account vehicle fleet management [7]. In urban areas, it is complicated due to the limited number of parking spaces, delivery time constraints, and the need to adapt to city regulations. Research should take into account changes in purchasing behavior, including the growth of online commerce, which affects the type and frequency of urban deliveries [8]. Issues in the field of urban logistics also focus on the practical application of technological progress, such as autonomous vehicles, the Internet of Things (IoT), or artificial intelligence [3].
The aim of the article is to present a method of multi-criteria decision support in the planning of urban supplies, taking into account the minimization of emissions of harmful compounds. This research was conducted from the point of view of the negative impact on the ecosystem of urban areas. The following were analyzed: cost, time, and amount of exposure of the ecosystem to harmful compounds. This article proposes a multi-criteria decision support methodology, in particular, a set of criteria and method of calculating the evaluation values for the individual criteria.
This article is divided into three main parts. The first section presents an introduction to the research issues and a review of the literature. The second section is a general description of the research problem and a multi-criteria decision support method. A scheme of the method and its formal notation are presented. The third section is a solution to the research problem in the form of a case study. The best method of delivery in urban areas was selected, accounting for three partial criteria. The article ends with a discussion of the results and conclusions from the research.
2. Literature Review
Scientific research carried out in the field of urban logistics plays a very important role because it affects the quality of life of residents and the condition of the natural environment [9]. One of the research areas in this field is sustainable urban logistics, which refers to urban delivery and transportation activities and processes that minimize negative environmental, social, and economic impacts while ensuring delivery efficiency. One of the most important studies [10] focused on the use of life cycle sustainability assessment (LCSA) to analyze the impact of freight transport modes on the sustainable development of cities. The research also examines various aspects of bicycles in urban logistics, assessing their delivery efficiency, economy, and environmental benefits [11]. A very important aspect is also the study of the impact of crowdshipping based on public transport on urban logistics, with a particular emphasis on the impact on CO2 emissions and air quality in cities [12]. On the contrary, ref. [13] focused on optimizing intercity transport and deliveries within the city to minimize CO2 emissions and street congestion. Another area of research in the literature relating to urban logistics is the issue of last-mile deliveries. The term refers to the last stage of a delivery route in which goods are delivered from a distribution point or warehouse to their final destination, i.e., the customer or consignee. The last mile is often a critical and expensive part of the supply chain [14], especially in cities. The development of the presented area is very dynamic because technologies, regulations, and trends in the field of urban logistics are changing [15,16,17]. However, the use of drones in last-mile deliveries is described in the context of efficiency, availability, and sustainability [18,19]. Smart cities (smart cities) focus on research using modern technologies, such as the Internet of Things (IoT) and data analytics, to improve transportation and urban logistics management within smart cities. The topic of the efficiency and complexity of last-mile logistics in relation to supply chain operations is treated by [20]. Based on a topology analysis, three configurations of last-mile logistics in road transportation were analyzed, which were used to outline technology and infrastructure. In addition, the analyzed problem allows us to analyze issues related to management systems. Research on the topic of place logistics has a significant impact on the development of the field. A significant aspect is the analysis of the quantitative effects of consolidating shipments in urban centers [21] shows that higher customer density and greater distances between distribution areas and warehouses favor the delivery of cargo at the highest level using all-terrain trucks to micromarkets, followed by the final delivery to customers. The problem of identifying urban logistics schemes that headlight current approaches in smart cities was addressed in [22]. The study adopts a systematic approach based on a typology of distribution-consolidation schemes in urban logistics to analyze and reduce delivery costs and delivery time per parcel. The article [23] concludes that tram tracks significantly impact car speeds and noise emissions at urban intersections, with the presence of tracks leading to variability in vehicle speeds. This research is crucial for urban planning and traffic management, particularly in designing intersections and managing noise pollution in cities. City logistics also contributes to the development of smart cities, and challenges and opportunities arise in the capitals of EU Member States in this context [24].
The topic of safety and risk is also discussed in the research [25] on the risks associated with urban deliveries, such as theft, road accidents, and other incidents. Important issues also relate to the impact of e-commerce on city logistics [26]. The COVID-19 pandemic has accelerated the growth of e-commerce and increased demand for more sustainable urban logistics. In line with current trends of reducing internal combustion vehicle access to city centers, deliveries using electric vehicles have gained importance [27]. The issues of urban logistics in the context of e-commerce, with particular emphasis on the use of time windows and the concept of sliding time windows to optimize deliveries, are described in [28]. The study introduces a novel approach to synchronizing e-commerce city logistics using sliding time windows (STW), offering flexible delivery schedules. Their findings indicate that this method can significantly reduce transportation costs, potentially up to 50%, and includes sensitivity analyses on various influencing factors. This is an important topic in the face of the growing importance of e-commerce and the related logistics challenges in cities.
An important element in urban logistics is transshipment hubs, also known as distribution centers or transshipment centers. These are places where goods are transferred from one mode of transport to another to optimize delivery and distribution processes in urban areas. The topic of transshipment hubs appears in [29], which focuses on the use of genetic algorithms to solve the problem of locating transshipment hubs in urban areas, which aims at optimizing the supply of goods. An important source of information on the strategy of optimizing last-mile deliveries in the city via the effective location of central transshipment facilities is research [30]. This is an important issue in the context of urban logistics and urban deliveries, which is crucial to sustainable and effective supply management in large cities. Another important area of research is the use of new technological solutions in the field of urban logistics. The literature discusses the use of autonomous ground vehicles, i.e., vehicles that are able to move without the participation of a driver. These vehicles are often used to deliver goods and services in cities [31].
Improving the energy efficiency of vehicle fleets in urban areas is complex. Therefore, various methods and tools are used in the analyses, to a greater or lesser extent, considering the multi-aspect nature of this issue. The use of a system dynamics model that included four sub-models, socio-economic, new vehicle registrations, environmental impact, and political actions in the field of fuel savings and electromobility, is described by [32]. Based on three strategic intervention scenarios in the field of fuel consumption and electromobility policy, the projected fuel consumption was estimated, showing that when changing the fuel type of registered new hybrid and electric FWPV (Four-Wheeled Passenger Vehicles) vehicles, fuel consumption will be reduced by 13–39% to 2030.
In turn, ref. [33], in their study on the last-mile cargo distribution in large Latin American cities, used a route optimization model to assess the reduction in operating costs and greenhouse gas emissions in the case of replacing fuel-powered trucks or motorcycles for the transport of cargo with LEFV vehicles (i.e., e-bikes or electric bikes). The research results for a commercial area in Bogota showed that this strategy would reduce operating costs by more than 50% and greenhouse gas emissions by more than 95%. Route optimization in a multi-criteria approach was also included in the model developed to support decisions regarding the selection of the type of vehicles for cold chain distribution in Wuhan, Hubei Province, China [34]. The essential criteria were minimum cost, minimum carbon dioxide emissions, and minimum distance. Similarly, article [35] proposed a method for assessing alternative last-mile parcel delivery strategies in terms of the principles of sustainable development, i.e., social, environmental, and economic effects for a postal company located in Rio de Janeiro, Brazil. The work investigated two alternative scenarios: one using an electric LDV BEV and the other using electric tricycles. The results showed that the use of an electric tricycle is a more advantageous alternative in economic, environmental, and social terms and does not require public incentives.
In urban areas, in the context of developing sustainable mobility and reducing the negative impact on the natural environment, the role of electric vehicles is becoming more and more important [36]. Electric cars contribute to a significant reduction in CO2 emissions [19,37]. Electric vehicles are quieter than combustion vehicles, which positively affects the quality of life in areas affected by road infrastructure and reduces noise pollution [38]. They are also cheaper to operate than combustion vehicles, thanks to lower electricity costs and lower service costs. In many cities, electric vehicles have access to low-emission zones or are covered by tax breaks, which may be an additional motivating factor for companies to purchase such cars [39]. Despite the increasing popularity of electric vehicles, companies are still more likely to buy combustion cars more often. They offer more power and a longer range compared to electric vehicles, which may be important in some logistics applications. Many cities already have extensive infrastructure for operating combustion vehicles, which may facilitate their use. In the context of urban logistics, attempts are increasingly being made to replace combustion vehicles with electric ones, especially in short-distance deliveries, where electric vehicles are competitive and more economical.
Improving the accuracy of atmospheric ozone (O3) pollution prediction is addressed by [40]. The authors propose a VAR-XGBoost model, which integrates vector autoregression (VAR), the Kriging method, and XGBoost (Extreme Gradient Boosting). The model is used to simulate the spatial distribution of ozone in China, analyze its influencing factors, and predict ozone concentrations based on data from monitoring sites. The study finds that ozone concentration is most correlated with PM2.5 and least with SO2 and identifies wind speed, temperature, and precipitation as important factors affecting ozone pollution. The performance of the VAR-XGBoost model is evaluated and compared with other models, showing superior prediction accuracy. The research provides insights for managing regional O3 pollution in China.
A novel multidimensional optimal dispatching strategy for power systems that envelop the spatial and temporal distribution of multiple pollutants is presented in [41]. The study focuses on creating a spatial and temporal distribution model of pollutants specifically for thermal power plants. This model is applicable for power dispatch, offering a new perspective on managing power systems in relation to air pollution distribution.
Multiple criteria decision making (MCDM) is a research and methodological area that focuses on decision making in situations where there are multiple criteria or requirements that must be considered. This area is widely used in various fields such as management, engineering, economics, urban planning, and many others. One issue may be the selection of equipment for individual production preferences [42]. The study presents a dual MCDM approach, first involving DEX, the experience of decision experts, and the EDAS method, an evaluation based on distance from the average solution.
The issue of using electric vehicles for the distribution of goods is becoming more conspicuously noticed by decision makers dealing with fleet management and vehicle traffic in urban areas. Therefore, there is a need to conduct further research in this area, contemplating in an increasingly comprehensive way the economic and environmental impacts of distribution scenarios that differ not only in the route but also in the composition of the fleet.
3. General Description of the Research Problem
Research problems related to urban logistics require analysis and research to solve specific challenges. The article presents the optimization of delivery routes in order to shorten delivery time, minimize costs, and reduce the negative impact on the natural environment. The research focuses on optimizing the delivery plan in a complex distribution system in an urban area, implemented by a courier company. This task is known as the “traveling salesman problem” and involves finding the shortest route that connects all recipients along the route. The condition is that the traveling salesman starts and ends the journey at the same point. In practice, this means finding a Hamilton cycle in the graph, i.e., a cycle in which each point is visited exactly once.
The work also addresses the issue of selecting a vehicle to carry out a transport task to determine the optimal solution in terms of transport costs and impact on the natural environment. The parcels are transported using vehicles of various capacities, powered by diesel oil and electricity.
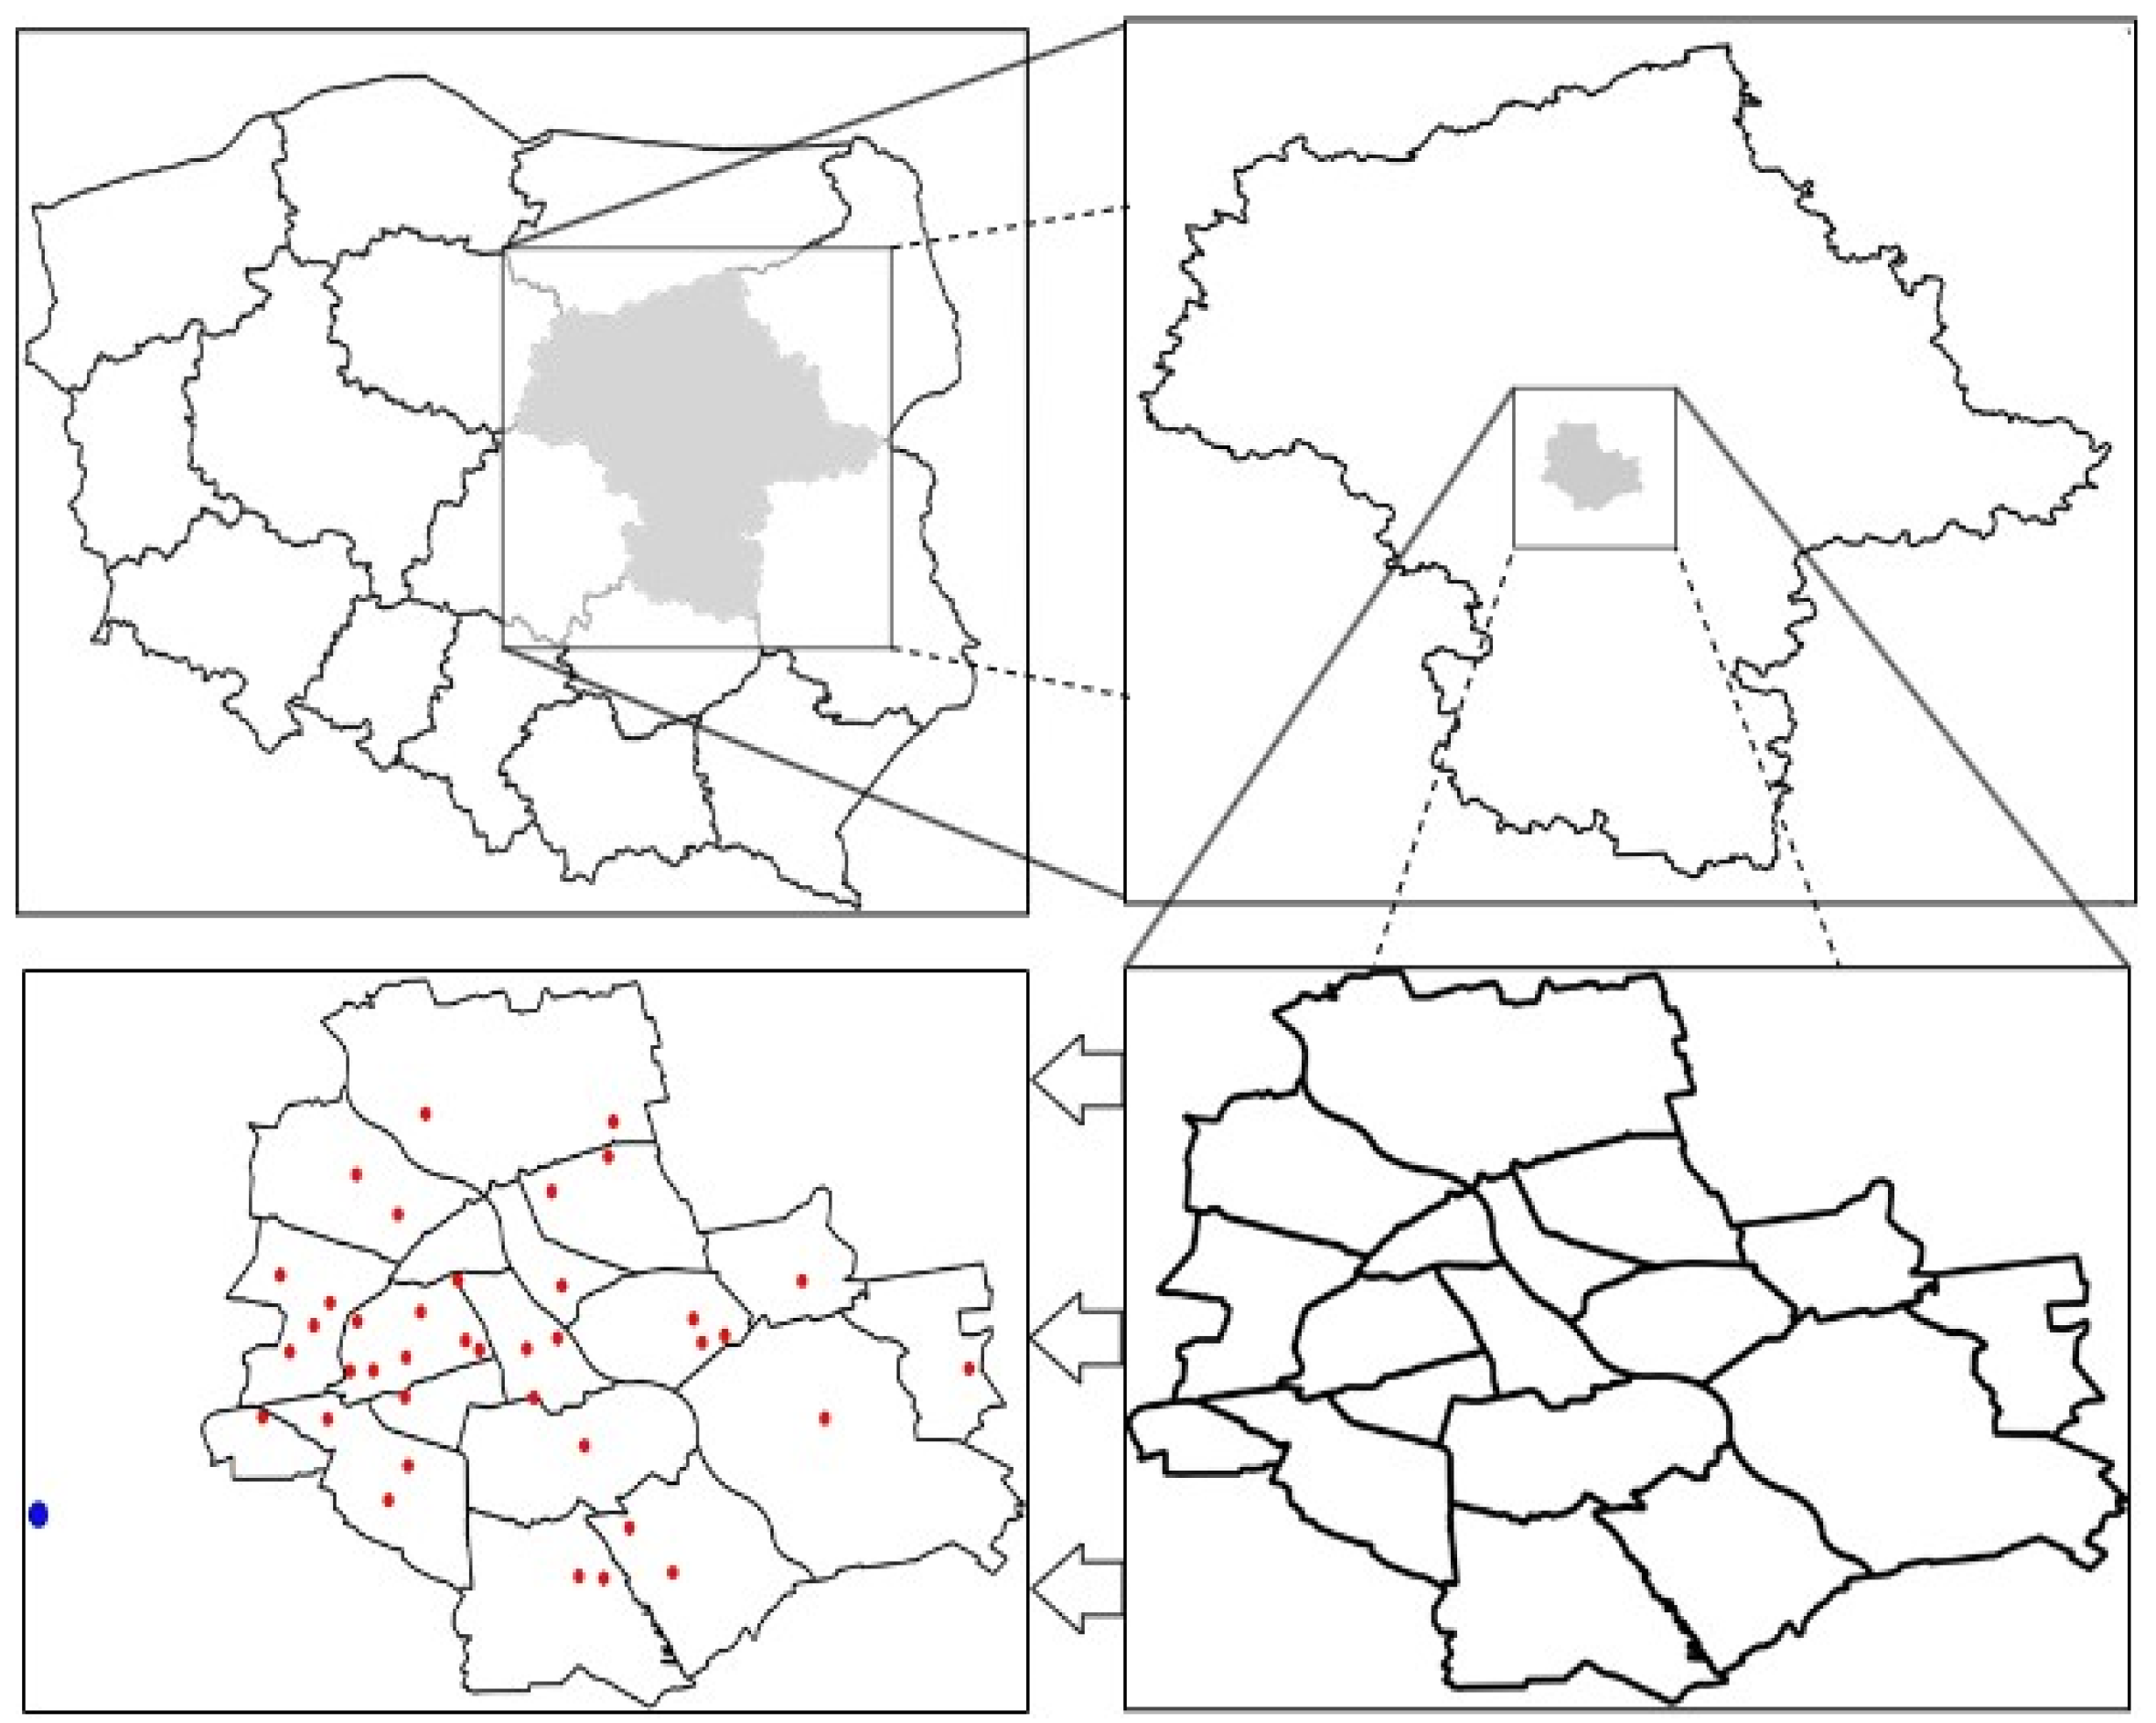
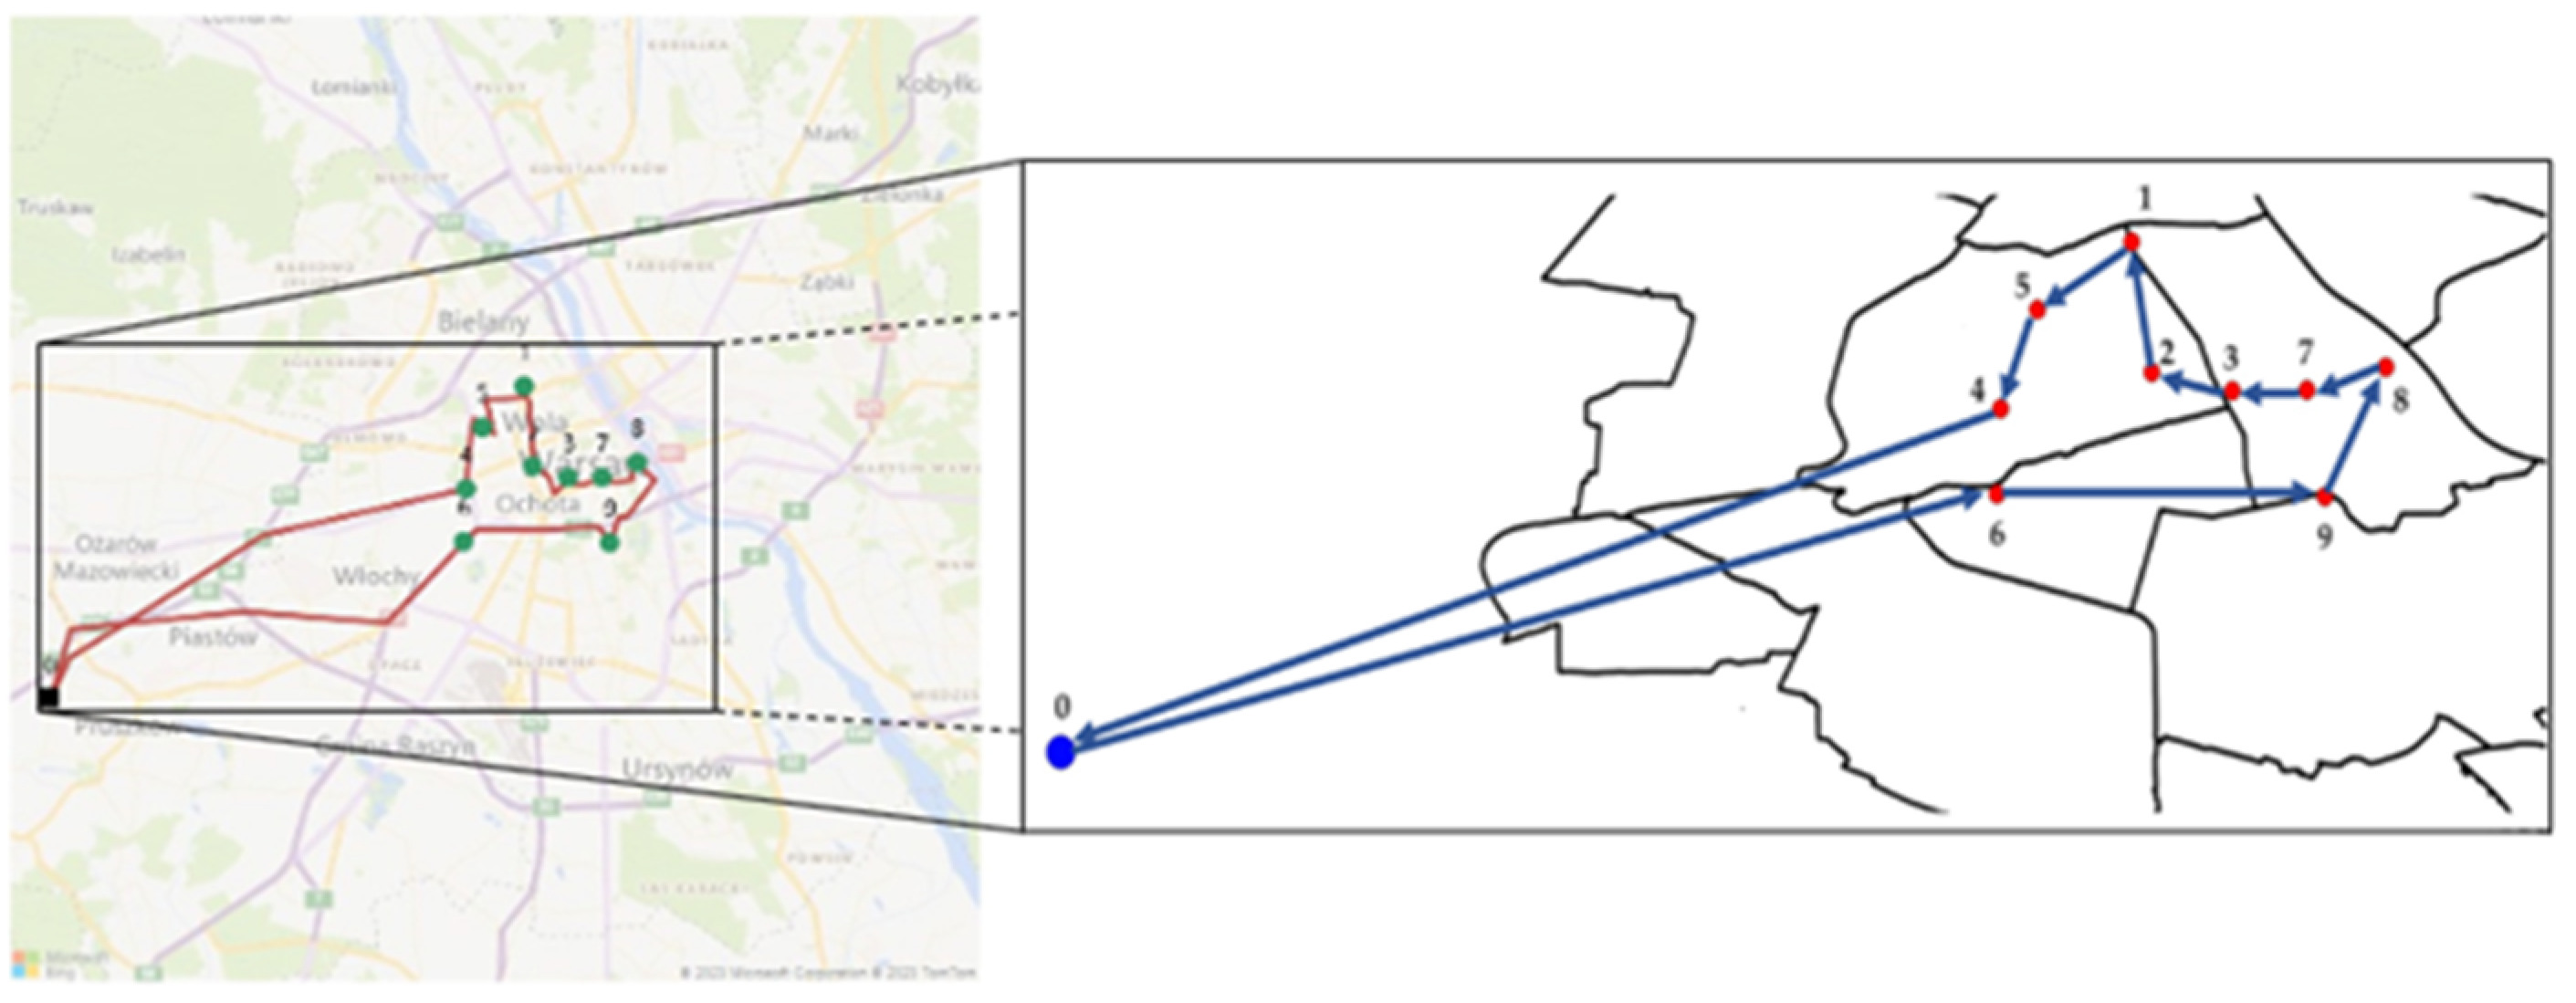
It is assumed that the courier activity is focused on delivering parcels to regular recipients in a timely and regular manner, in accordance with the “just in time” principle. Depending on the contracts and long-term agreements, the company provides transport services consisting of supplying a network of well-known drugstores operating in the cosmetics and pharmaceutical sector, whose distribution points are located, among others, in Warsaw. Determination of individual point locations in the structure was made using QGIS 3.32 software and Bing maps.
Figure 1 shows the area of Poland that was accepted for research. The map of Warsaw shows the location points of the analyzed drugstore chain in red, and the distribution center that distributes goods to individual locations is shown in navy blue.
The drugstore chain has sales points located throughout Warsaw. Due to the large number of collection points, a significant number of shipments, and the relatively long route in relation to the entire territory of Warsaw, the distribution of goods was divided into transport tasks covering selected areas of the city planned in accordance with the administrative division of Warsaw (divided into districts). Information on the destinations of shipment deliveries, including the number of individual parcels for each delivery point, the total weight of the shipment, the time of loading operations, and the time of document handling, was collected on the basis of an interview with a friendly transport company. It specializes in deliveries and performs regular transport of goods for a selected drugstore chain. These data were estimated based on a detailed interview with representatives of the transport company, which allowed us to obtain accurate information regarding logistics and delivery schedules.
The subject of the analyses was the transport service of a selected area of the city by a courier company. Route optimization studies, as well as service costs and the volume of emitted compounds harmful to the transport task, were determined for defined distribution variants diversified in terms of the vehicle fleet used.
In the article, the authors presented a solution to the route optimization problem using a Vehicle Routing Problem Spreadsheet Solver (VRP Spreadsheet Solver) [43], which is an IT tool for solving vehicle routing problems using spreadsheets such as Microsoft Excel or Google Sheets. This method is used to solve VRP problems, which aims to optimize delivery routes for a fleet of vehicles in order to minimize costs and increase delivery efficiency. The VRP Spreadsheet Solver is useful in solving logistical problems related to vehicle routing, especially in the context of urban deliveries [44].
In the research, when routing the vehicle, we took into account the existing road network with all its constraints. We performed this using Bing Maps, which is provided by Microsoft. Using this tool, we considered the following characteristics of the road network when routing:
- Road directionality;
- Number of lanes in one direction;
- Maximum speed on individual road sections;
- Road capacity;
- Prohibitions on particular types of traffic;
- Traffic volume at particular times of the day;
- Existence of traffic slowing devices.
Routing issues were handled by the algorithm implemented in Bing Maps, taking into account the aforementioned constraints imposed on the road network.
4. Research Method
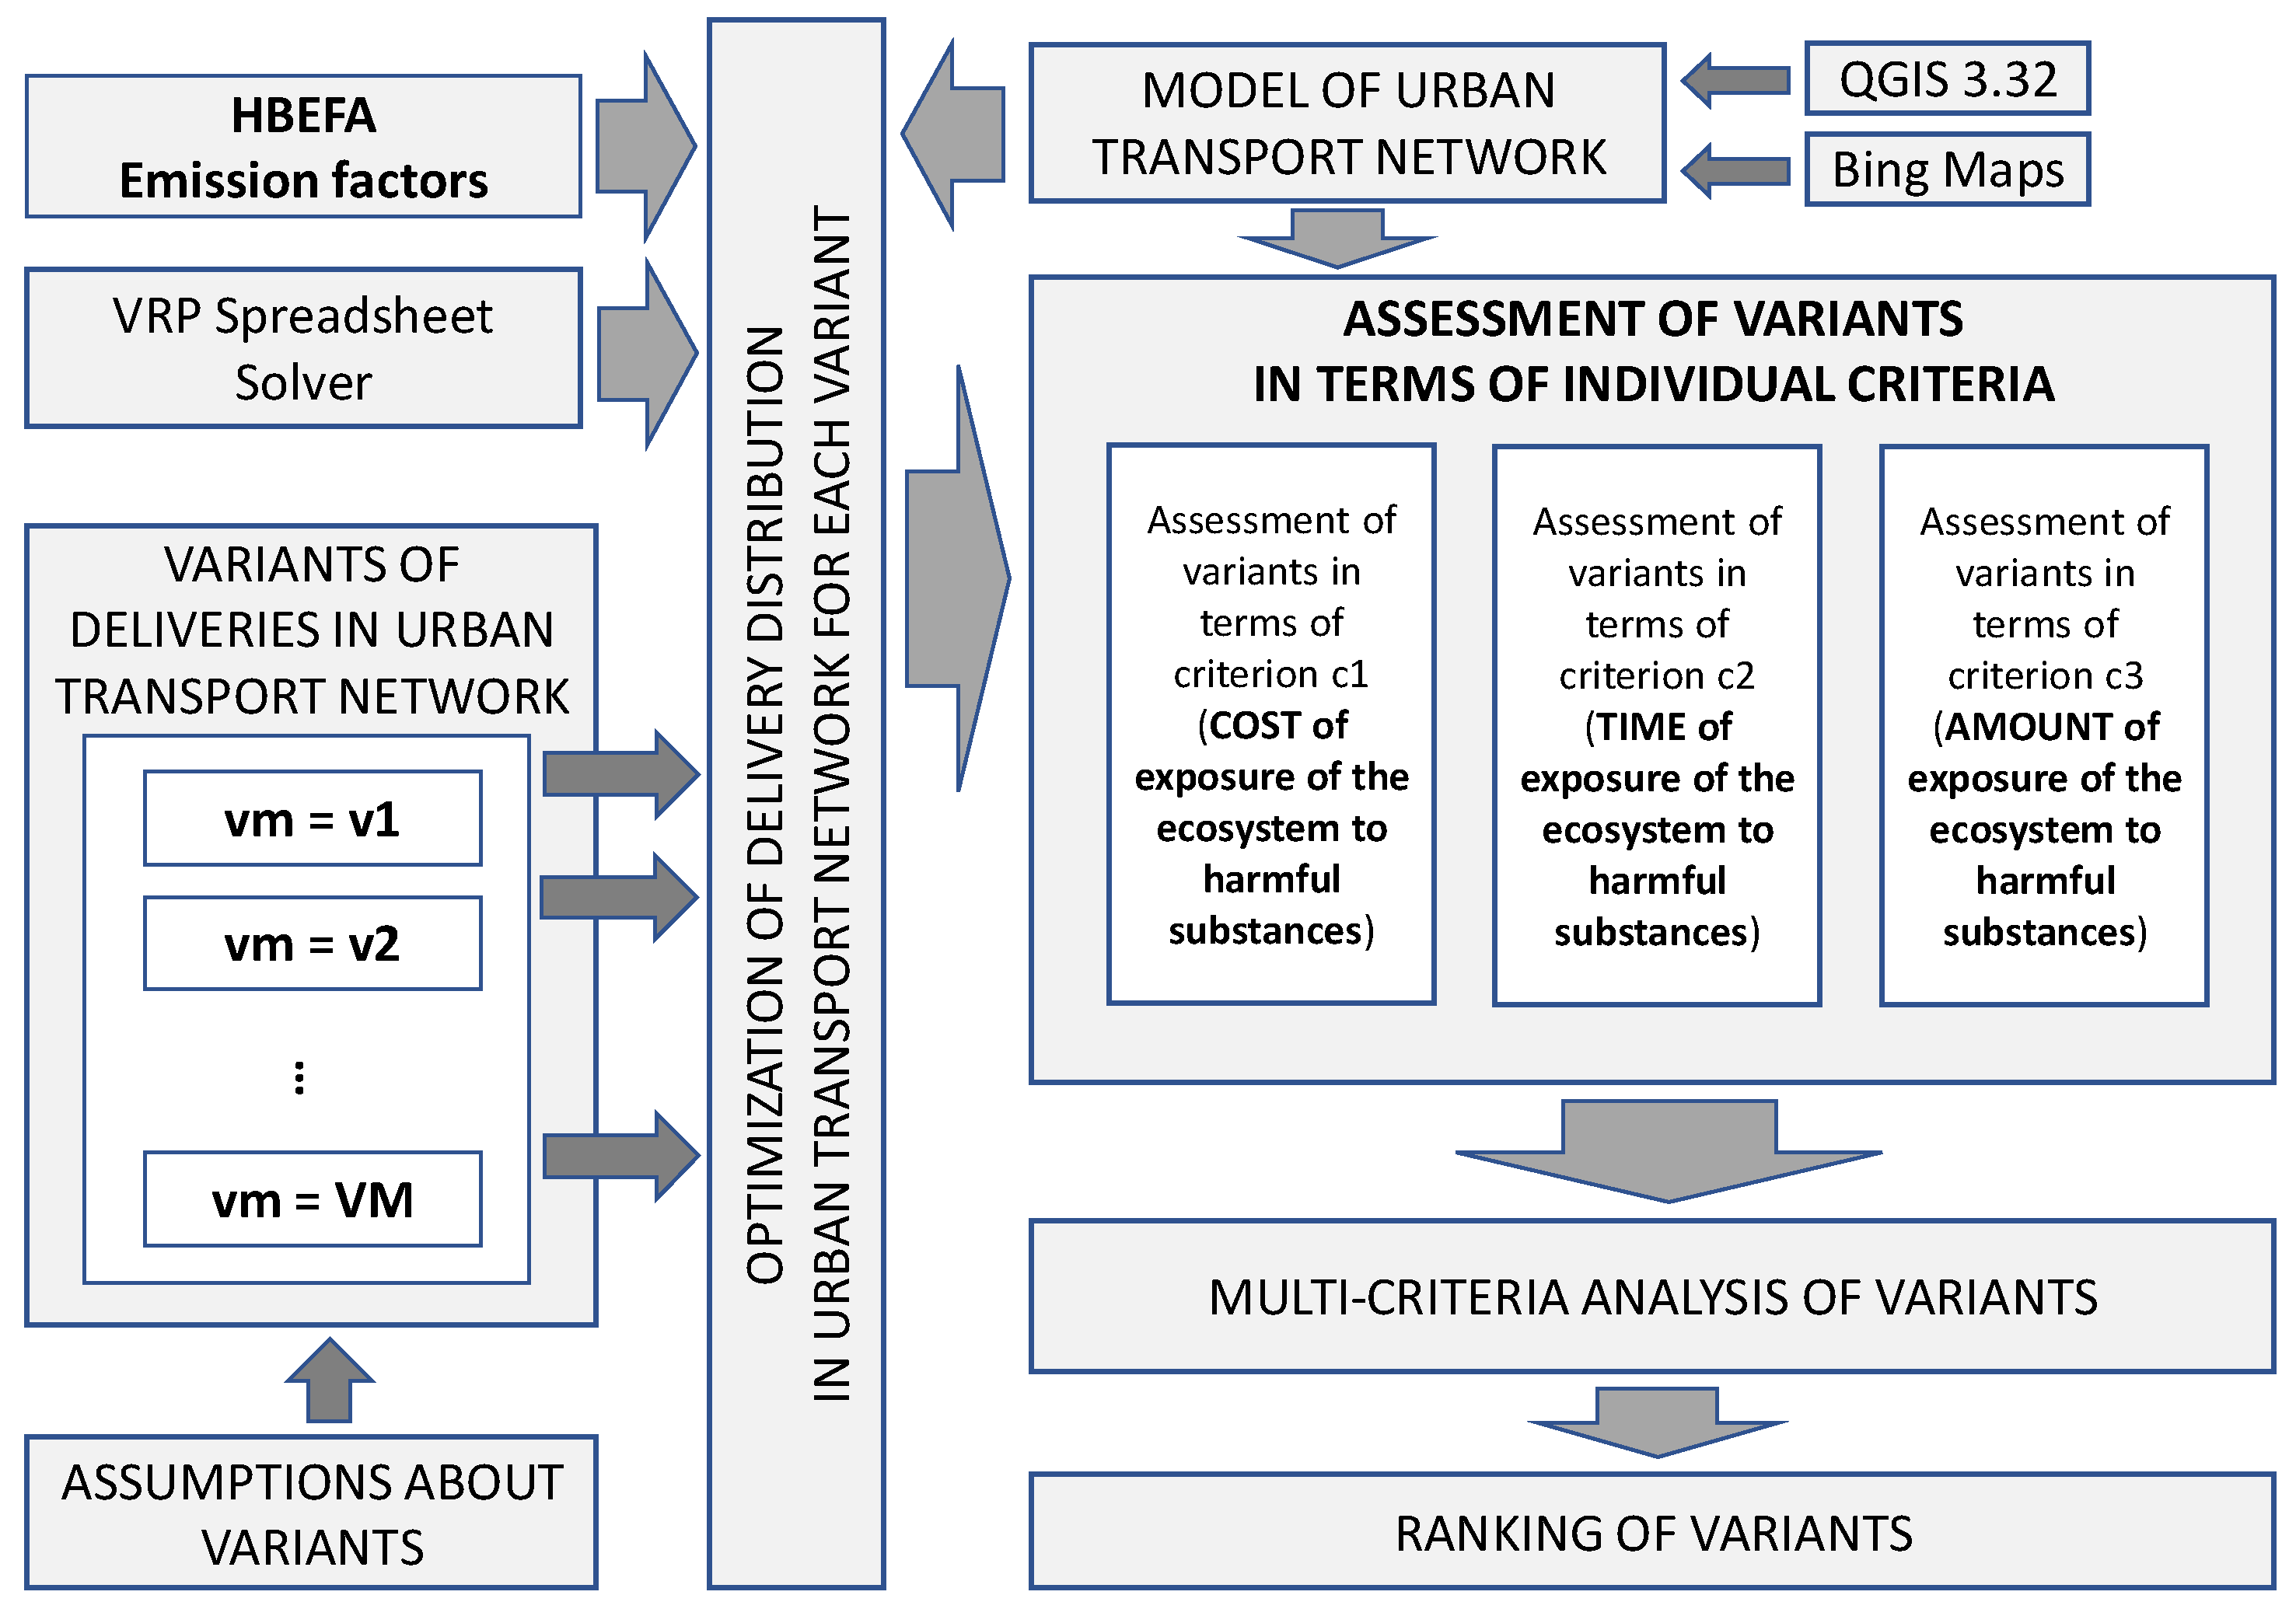
The general outline of the proposed approach is shown in Figure 2.
The main goal of the optimization problem in planning deliveries in the urban transport network was the minimization of harmful compound emissions. Therefore, in the adopted approach, special attention was paid to ecological issues [45], reflected in the adopted criteria for assessing variants. Multi-criteria decision support for planning deliveries in the urban network, taking into account the minimization of harmful compounds’ emissions, for this research work, was considered from the point of view of the following partial criteria:
- The cost of exposure of the ecosystem to harmful substances (c1), i.e., the cost associated with producing an appropriate amount of harmful compounds; for this article, it was assumed that the value of this criterion would be equal to the cost of fuel consumption necessary to perform a given transport task in individual variants,
- Time of exposure of the ecosystem to harmful substances (c2), i.e., the time during which the appropriate number of harmful compounds is produced. For this article, it was assumed that the value of this criterion would be equal to the time of implementation of a given transport task increased by 10% (the value of this parameter was established based on consultations with experts in the field of road transport and city logistics employed at the institutions represented by the co-authors (Warsaw and Silesian University of Technology (Poland)), which will be the equivalent of the time spent maneuvering at delivery points,
- The amount of exposure of the ecosystem to harmful substances (c3), i.e., the number of harmful compounds produced during the implementation of a given transport task in a given variant (the variant depends on the type of route, vehicle, fuel, and service to the area).
It should be noted that the developed method has a universal dimension. Its universality concerning the first criterion (c1) consists of the possibility of adopting the values of the parameters mentioned above for a specific geographic area. For the research carried out in this paper, fuel prices applicable in Poland were adopted.
The universality of the method concerning the second criterion (c2) consists of the possibility of adopting the values of the parameters mentioned above for a specific geographical area and situation. For the research carried out in this article, parameter values were adopted under the above specification (including data for Polish fuel producers).
The set of sub-criteria C is presented broadly as Equation (1):
where is the criterion number, and is the number of all partial criteria considered. Therefore, for the three partial criteria, the set can be written as Equation (2):
Variants of carrying out the transport task were assessed and were generally presented as a set V (see Equation (3)):
where is the number of the analyzed variant, and is the number of all variants taken into account.
For each variant in relation to the criterion, the evaluation value was determined. The set of assessments OVC is therefore presented as Equation (4):
The evaluation values of individual variants for the first partial criterion (c1), i.e., the cost of exposure of the ecosystem to harmful substances, were determined according to the Equation (5):
where
- —average fuel or electricity consumption when driving without a load in the variant, [l/100 km] or [kWh/100 km];
- —mileage without load of the vehicle in the variant, [km];
- —average fuel or electric energy consumption during loaded driving of the vehicle in the variant, [l/100 km] or [kWh/100 km];
- —loading mileage of the vehicle in the variant, [km];
- —the average unit net price of fuel or electricity in the variant, [PLN/l] or [PLN/kWh].
The evaluation values of individual variants for the second partial criterion (c2), i.e., the time of exposure of the ecosystem to harmful substances, were determined according to the Equation (6):
where means the time needed to complete the transport task in the vm variant [min] increased by 10%, corresponding to the equivalent of the time spent maneuvering at delivery points.
The assessment values of individual variants for the third partial criterion (c3), i.e., the amount of exposure of the ecosystem to harmful substances, were determined based on The Handbook of Emission Factors for Road Transport [46], and more precisely based on the online version HBEFA 4.2 developed by the organization INFRAS [47].
Due to the limited database version, the following assumptions were made:
- The data were read for the territory of Germany. Of the available countries, this one was chosen due to the significant traffic overlap between Poland and Germany.
- All variants used vehicles of the LGV category—light goods vehicles (LCV—Light Commercial Vehicle), for which data were available.
- The data were read for the year 2025 (data for 2020 were also available, which were considered too outdated due to the development of electromobility).
- For the sake of averaging, it was assumed that the coefficients for the operating engine, not the starting engine, would be considered.
- The following harmful compounds were selected for analysis: CO (carbon monoxide), CO2 (carbon dioxide), HC (hydrocarbon), NOx (nitrogen oxides), and PM (particulate matter—both PM fractions summed up).
The set of harmful compounds HS is written as Equation (7):
The assessment values of individual vm variants for the third partial criterion (c3), i.e., the amount of exposure of the ecosystem to the action of individual harmful substances hs were determined according to the Equation (8):
where corresponds to the specific emission coefficient of the harmful compound in the variant expressed in [g/vehkm], and the remaining designations are as in Equation (5).
It should be noted that in the case of electric traction cars, if only the place of energy consumption was taken into account, the value of the coef(vm,hs) coefficient was 0 g/vehkm in all cases. This value is because these cars do not emit harmful compounds at the energy consumption point; they only do so at the point of energy production. According to data from HBEFA, the amount of energy required to cover 1 km by an LCV electric vehicle is 1191 MJ/vehkm. The leading electricity supplier to the area of Warsaw, where the research was conducted, is PGE Polska Grupa Energetyczna S.A.from Warsaw. Based on the structure of fuels in 2022 [48], it was assumed that the emission levels of selected harmful compounds are as follows:
- CO2 = 0.73697 Mg/MWh;
- NOx = 0.00054 Mg/MWh;
- PM = 0.00002 Mg/MWh.
Assuming that 0.001 MWh is 3.6 MJ then en = 3.31∙10−4 MWh/vehkm. Therefore, the emissions are as follows:
- CO2 = 2.44∙10−4 Mg/vehkm;
- NOx = 1.79∙10−7 Mg/vehkm;
- PM = 6.62∙10−9 Mg/vehkm.
After conversion into grams, allows us to obtain the results presented in Table 1 (as “Electricity**”, i.e., the number of emissions taking into account the places of energy production. Due to the lack of coef(vm,hs) values for CO and HC substances, they will not be taken for further analysis.
5. Solution to the Research Problem
The following four delivery variants in urban transportation networks were taken into account in the analyses:
- Variant I:
- Driving along an optimized route;
- Delivery with a vehicle with a GVW of up to 3.5 t;
- Diesel-fueled vehicle;
- Handling all points of the logistics structure.
- Variant II:
- Driving along an optimized route;
- Delivery with a vehicle with a GVW of up to 3.5 t;
- Electric-powered vehicles;
- Handling all points of the logistics structure.
- Variant III:
- Driving along an optimized route;
- Delivery with two vehicles with a GVW of up to 2.35 t;
- Diesel-fueled vehicles;
- Servicing selected points of the logistics structure by a single vehicle.
- Variant IV:
- Driving along an optimized route;
- Delivery with two vehicles with a GVW of up to 2.35 t;
- Electric-powered vehicles;
- Servicing selected points of the logistics structure by a single vehicle.
Therefore, the set was defined as Equation (9):
The field of courier transport is very diverse and broad. Therefore, the focus was on a slightly narrower analysis of this transport area. The research was based on travel routes as part of one transport task related to servicing a selected city area. It was assumed that courier services include deliveries to points belonging to the analyzed drugstore network located in the following districts: Śródmieście, Wola, Włochy, Ursus, and Bemowo. With this assumption, the route includes 20 parcel delivery points.
Table 2 summarizes data on the locations of points in the analyzed area and their demand in terms of the number of packages transported.
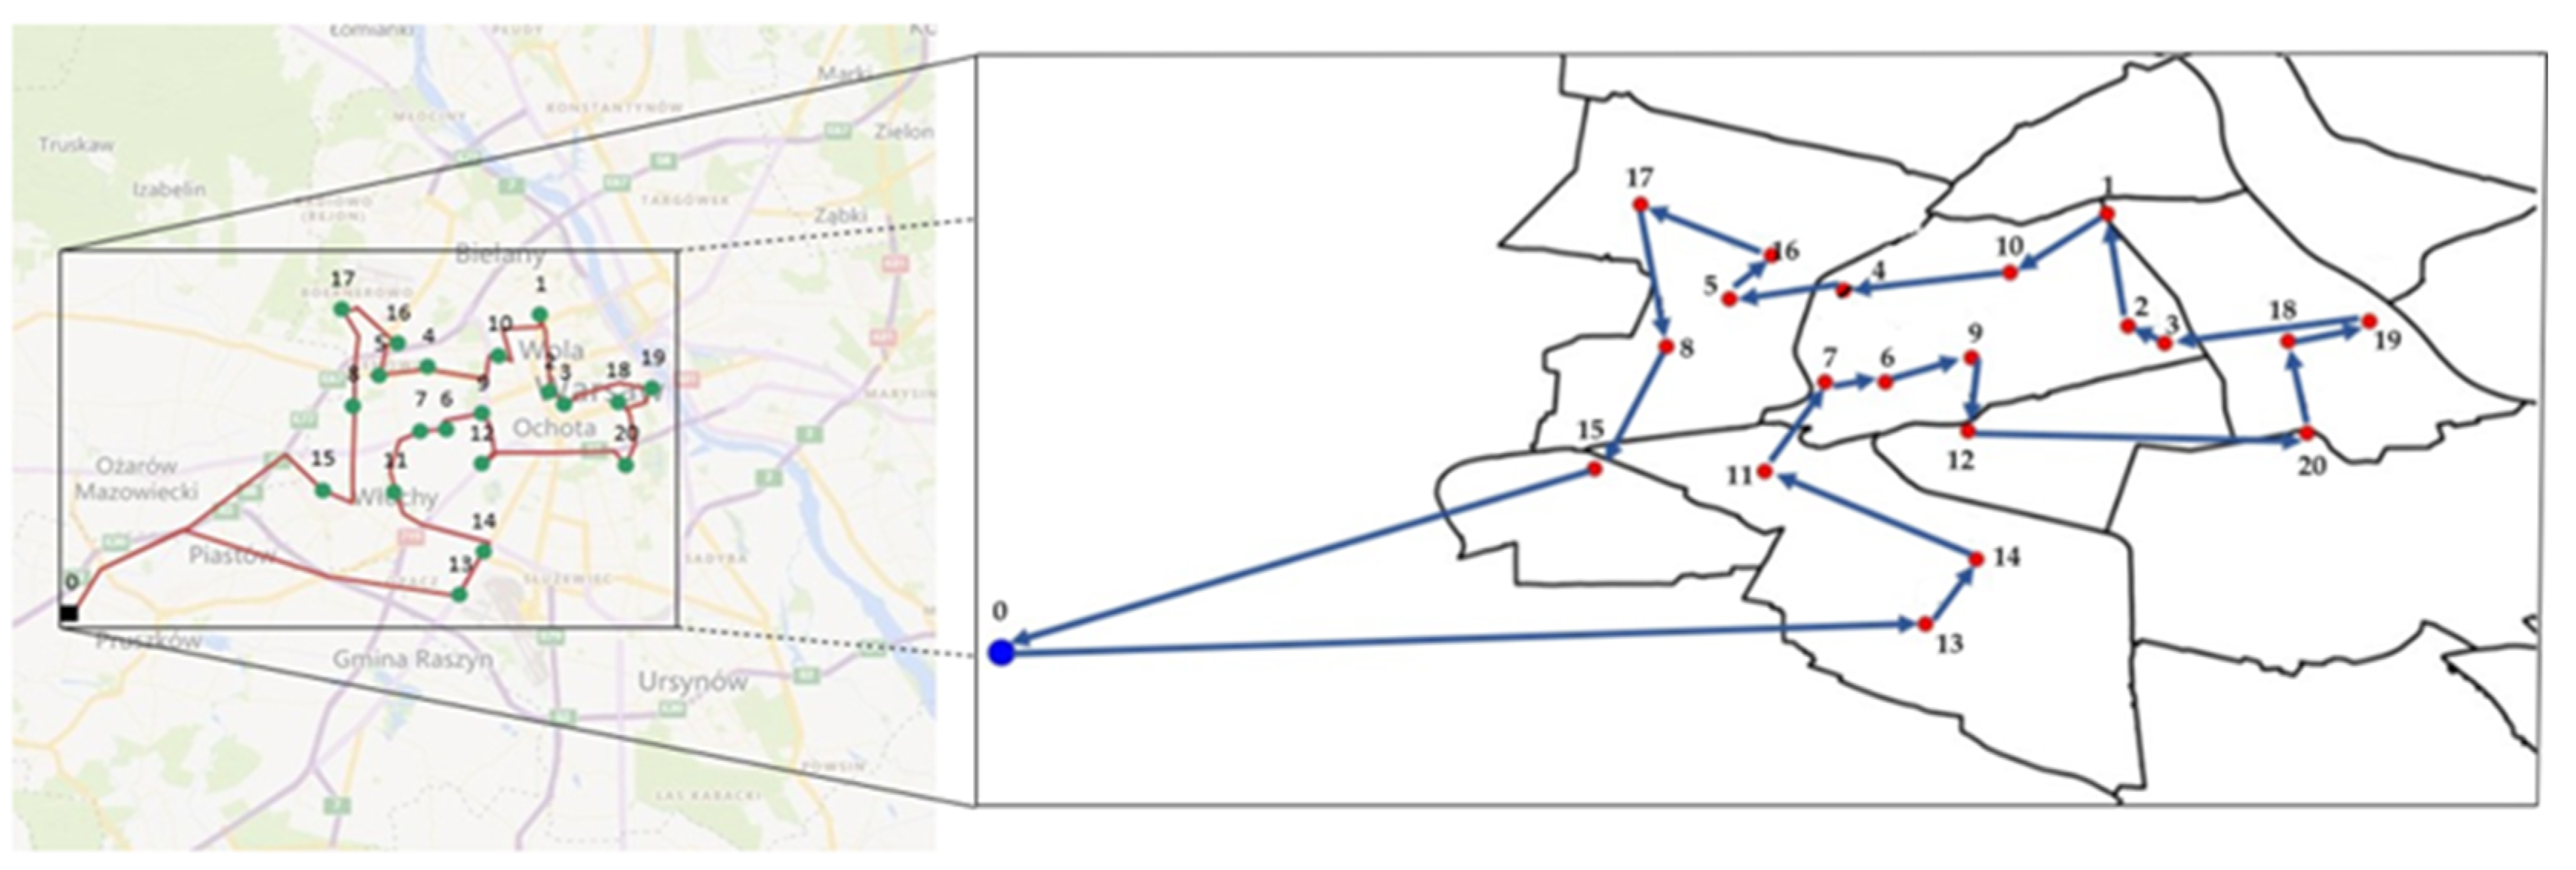
Figure 3 presents a diagram of transport needs in the analyzed region, which was generated using the VRP tool. Then, the optimal route for the given transport task was visualized for variants I and II.
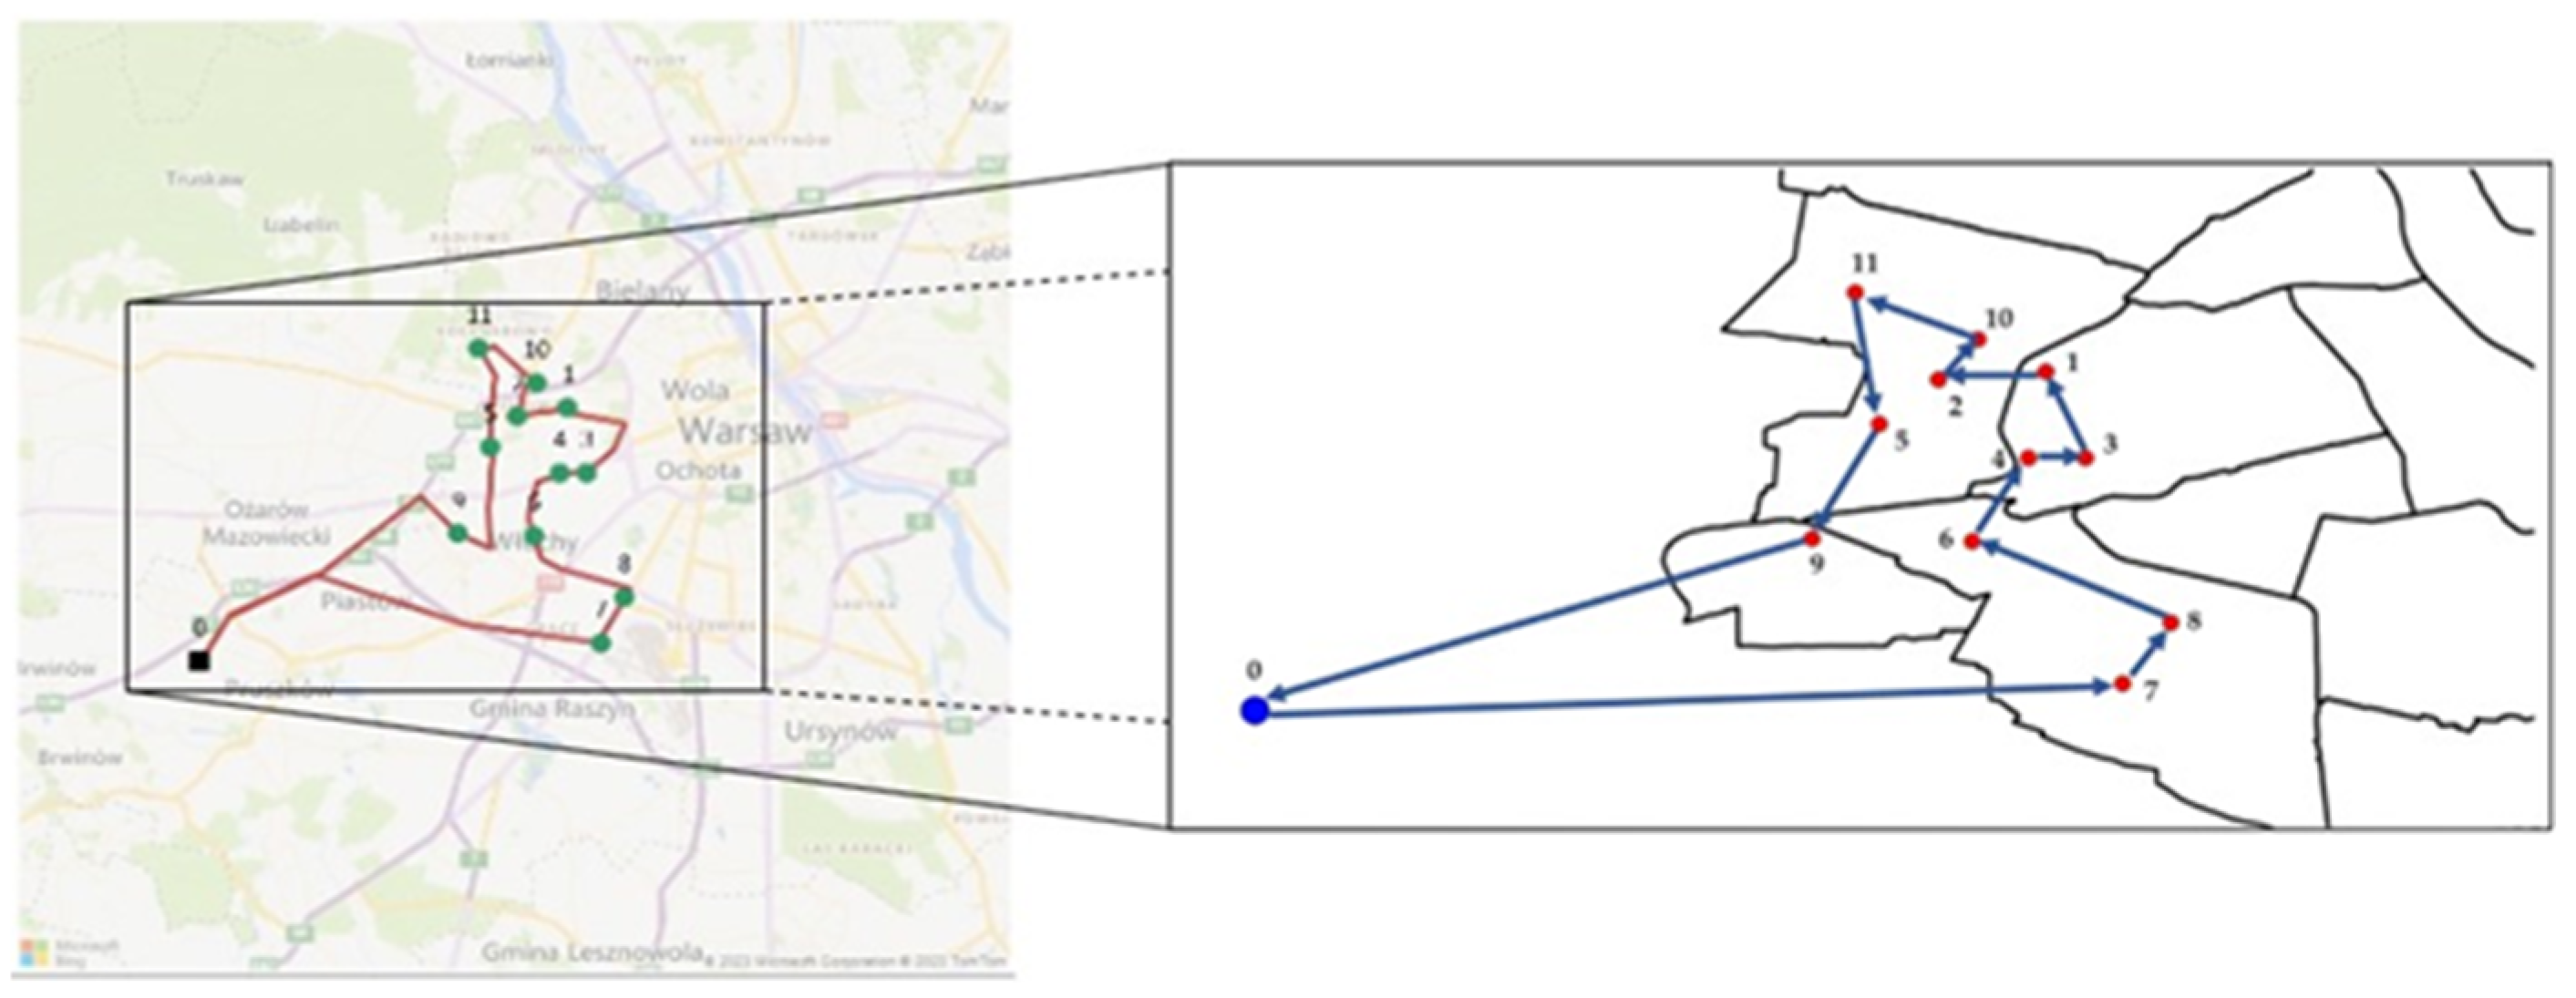
Figure 4 and Figure 5 show the optimal route for transport tasks in variant IV. The mentioned variants assume the distribution of loads using two vehicles with a GVW of up to 2.35 t powered by diesel fuel in variant III and two vehicles with a GVM of up to 2.35 t powered by electricity in variant IV. Delivery points were divided, considering traffic intensity in individual regions of Warsaw. The first vehicle makes deliveries in the western part of the analyzed area (Figure 4), while the second vehicle serves the central part of the city (Figure 5).
As a result, values corresponding to transport task time and route length were obtained for individual variants, presented in Table 3.
Based on the exact locations of parcel collection points, as presented in Table 2, the transport task’s exact route length and handling time were estimated. The route length and the exact travel time were estimated using the VRP Spreadsheet solver v3.8, which, thanks to the connection with “Bing” maps v3.8, allows the user to determine the exact route and travel time while considering the current road situation.
Analyzing the values presented in Table 3, the advantage of variants III and IV is clearly visible in terms of the transport task implementation time and the route length, owing to using two vehicles simultaneously to distribute goods in the urban transport network.
6. Choosing the Most Advantageous Variant
Table 4 contains the evaluation values of individual variants regarding the partial criteria described in Chapter 4. They were calculated based on relationships (5), (6), and (8).
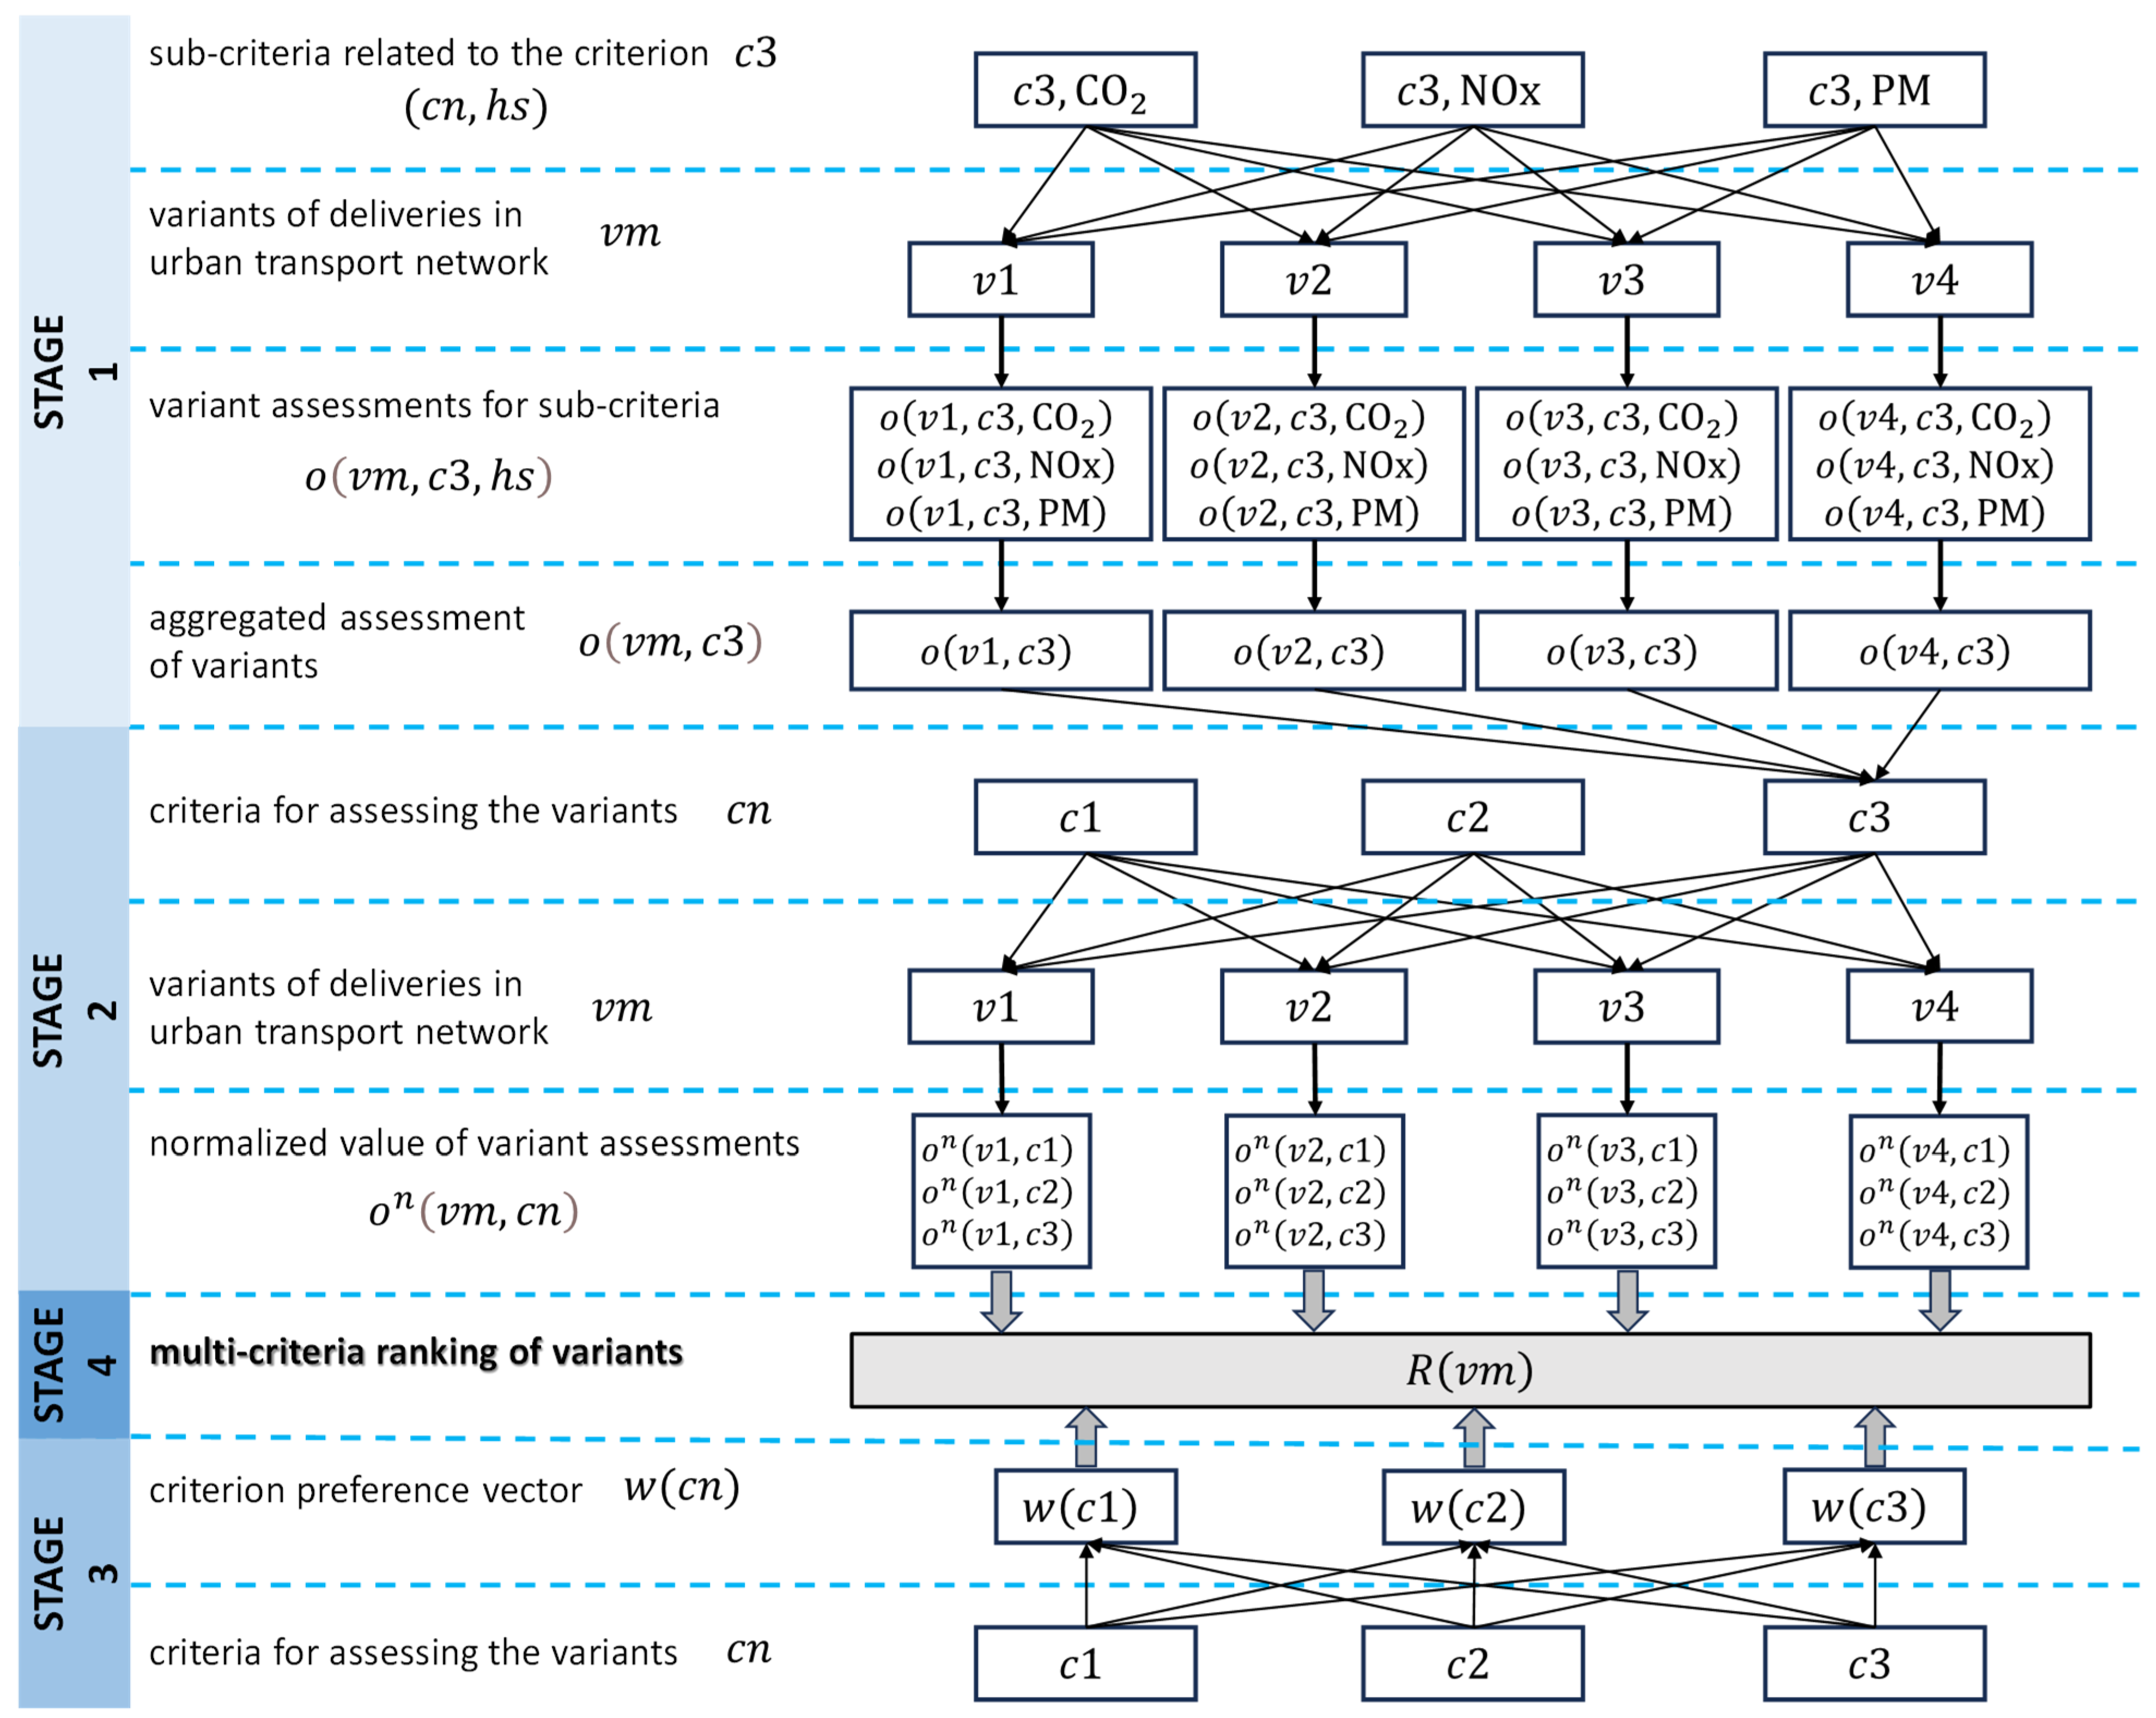
The multi-criteria analysis of variants was carried out in the following stages:
- Aggregation of variant assessments for sub-criteria related to the amount of ecosystem exposure to three harmful substances (CO2, NOx, PM) and obtaining a ranking of variants according to criterion c3.
- Normalizing the evaluation of variants for criteria c1, c2 and c3 using the zero-unitarization method.
- Determining the weights of criteria c1, c2 and c3 based on the Saaty scale.
- Determining the ranking of the analyzed variants based on a weighted aggregate variable.
The general scheme for building a ranking for multi-criteria evaluation of variants is shown in Figure 6.
In the first stage, the evaluations of the variants were considered destimulants and normalized according to the relationship in Equation (10):
The results of this process, along with the aggregated estimates are presented in Table 5.
Considering the exposure of the ecosystem to three harmful substances, i.e., CO2, NOx, and PM, the most favorable variant is variant IV.
In the next stage, the estimates of the variants presented in Table 4 were normalized, resulting in the values presented in Table 6.
In the third stage, the Saaty scale was used to determine the weights of individual criteria by comparing the criteria in pairs and determining the levels of superiority for each of such pairs. In this way, a pairwise comparison matrix was determined, which was then normalized, and, on this basis, a vector of criterion preferences was determined. The results are presented in Table 7. The element of the weight vector of individual criteria is marked as .
Based on the normalized assessments on(vm,cn) presented in Table 6 and the criterion preference vector w(cn) (Table 7), the values of the weighted aggregate variable , were obtained for individual variants, determined according to the Equation (11):
The aggregate variable takes the following values for individual variants:
- —for variant IV;
- —for variant III;
- —for variant II;
- —for variant I.
The higher the value of the aggregate variable , the higher the position in the ranking of a given variant. Therefore, variant IV is the most advantageous solution for transporting cargo from the distribution center to the service points of the analyzed drugstore chain located in a selected area of Warsaw.
7. Discussion of the Results and Summary
The article aimed to develop a method for multi-criteria decision support in planning urban supplies, taking into account the minimization of emissions of harmful compounds. First, the research problem of supply planning in urban areas was defined. The wholesaler searched for the best variant of the implementation of selected transport tasks related to the supply of retail outlets. Supplies carried out by cars powered by diesel oil and electricity were considered (each type of car was available in two variants. Then, using the traveling salesman problem, the optimal method of delivering deliveries in individual variants was determined, which allowed us to determine the length and time of carrying out transport tasks. A multi-criteria evaluation of the variants was carried out based on the results obtained parameters. The partial criteria included cost, time, and the amount of ecosystem exposure to harmful compounds. Carbon dioxide, nitrogen oxides, and particulate matter were taken into account.
Four distribution variants were considered in the study. In variant I, we considered one diesel-fueled vehicle with a GVW of up to 3.5 t driving along an optimized route and handling all points of the logistics structure. In variant II, we considered one vehicle powered by electricity with a GVW of up to 3.5 t driving along an optimized route and handling all points of the logistics structure. In variant III, we considered two diesel-fueled vehicles with a GVW of up to 2.35 t driving along an optimized route and servicing selected points of the logistics structure by a single vehicle. In variant IV, we considered two electric-powered vehicles with a GVW of up to 2.35 t driving along an optimized route and servicing selected points of the logistics structure by a single vehicle.
The cost of exposing the ecosystem to harmful compounds was selected as the first partial criterion. It was assumed that this cost would be calculated as the cost of fuel consumption needed to perform a specific transport task. This type best describes the monetary value of producing a specific number of harmful compounds, i.e., the expenditure of exposing the ecosystem to exhaust gases. The lower the exposure costs, the better for the issue. In determining the weights using the Saaty method, a low weight value was assigned to this criterion, i.e., 0.0738 (7.38%). The criterion values for variants I, II, III, and IV, respectively, were as follows: 61.60 PLN, 67.90 PLN, 68.56 PLN, and 100.37 PLN. Thus, the highest exposure cost was obtained for variant IV (two electric cars) and the lowest for variant I (one diesel car).
The second partial criterion was the time of ecosystem exposure to harmful compounds. This is when the ecosystem is exposed to the adverse effects of exhaust gases. It was assumed that this criterion is essential in assessing the problem, as efforts should be made to minimize this time. When determining the weights using the Saaty method, a weight value of 0.2828 (28.28%) was assigned to this criterion. The criterion values for variants I, II, III, and IV, respectively, were as follows: 510.4 min., 510.4 min., 320.1 min., and 269.5 min. Thus, the highest exposure time was obtained for variants I and II (one diesel and one electric car, respectively) and the lowest for variant IV (two electric cars).
The third partial criterion was the amount of exposure of the ecosystem to harmful compounds, i.e., the number of harmful compounds emitted by means of transport into the ecosystem. Theoretically, electric cars are considered zero-emission, but it should be noted that harmful compounds are produced not at the point of energy consumption but at the point of consumption. Considering this fact, the unit emissions can be obtained for comparative purposes on the basis of calculations. This was carried out for this research work. In determining the weights using the Saaty method, a high weight value of 0.6434 (64.34%) was assigned to this criterion. The criterion values for variants I, II, III, and IV, respectively, were as follows: for CO2—20,494.8 g/veh, 21,457.7 g/veh, 14,647.5 g/2 veh, and 16,618.1 g/2 veh; for NOx—49.8 g/veh, 15.8 g/veh, 35.6 g/2 veh, and 12.2 g/2 veh; and for PM—1.4 g/veh, 0.6 g/veh, 1.0 g/2 veh, and 0.4 g/2 veh. Thus, the highest exposure volume for CO2 was obtained for variant II (one electric car) and the lowest for variant III (two diesel cars). For other substances, the highest value was obtained for variant I (one diesel car) and the lowest for variant IV (two electric cars).
As a result of the application of the zero-unitarization method, the best variant of cargo distribution in Warsaw, from the point of view of minimizing the volume of harmful exhaust gas compounds, turned out to be variant IV, i.e., two trips on optimized (due to the traveling salesman problem) routes by two electric vehicles with a GVW of up to 2.35 t (aggregate value of the variable at 0.93). It confirms the previously obtained research results that two electric vehicles with reduced GVW carrying out two short delivery routes are more environmentally friendly than combustion vehicles and a large-tonnage vehicle carrying out a more extended transport task. Therefore, efforts should be made to implement such solutions for deliveries in urban areas.
In the future, the method can be developed to include results on an hourly basis and to analyze the impact of land use on the routing of vehicles on the network with an environmental aspect. It should be noted that the method presented above can be modified. One modification could be to conduct analyses related to hourly observations. Traffic is different for individual hourly intervals (mainly peak hours). Therefore, emissions of harmful compounds during peak hours will differ from other periods. Another modification of the method may be to include urban and land-use issues in the study. This mainly concerns the problem of routing vehicles between the different points visited. These issues will also be considered in the research group’s future work.
Based on the research carried out in this article, it is still necessary to refer to the promoted ideas of electromobility and autonomous vehicles. The research showed that in the area of deliveries in urban areas, the most favorable option was to use two small vehicles (GVW up to 2.35 t) powered by electric fuel. This is because the vehicle has the least possible negative environmental impact when carrying out transport tasks. Therefore, it makes sense to undertake promotional activities for using electric vehicles. One such action may be the use of political factors in the form of incentives (e.g., subsidizing the purchase of electric vehicles, designating routes available only for electric vehicles, and reducing obligatory charges, including insurance) or measures to discourage the purchase of internal combustion vehicles (e.g., increasing mandatory fees and restricting entry to certain zones in urban areas). Electric-powered means of transportation will undoubtedly contribute to reducing emissions in urban areas. Electric-powered vehicles used for the study were charged at dedicated charging stations at the company’s headquarters. One charge is enough to distribute a given batch of cargo. In the case of dedicated parking lots for electric vehicles in urban areas, the situation is a bit complicated since only electric-powered vehicles are allowed in these parking lots. In large metropolitan areas, despite the heavy congestion of internal combustion vehicles, the aforementioned parking spaces for electric vehicles stand empty, which generates high social tensions and numerous misunderstandings between drivers.
Author Contributions
Conceptualization, M.J., A.Z. and M.L.; methodology, A.Z., M.L., P.G. and R.Ż.; software, A.Z., M.L., P.G. and R.Ż.; validation, A.Z., M.L., P.G., R.Ż. and M.W.; formal analysis, A.Z., M.L., P.G. and R.Ż.; investigation, A.Z., M.L., M.J. and M.W.; resources, A.Z., M.L. and M.J.; data curation, A.Z., M.L., P.G., R.Ż. and M.W.; writing—original draft preparation, A.Z., M.L. and P.G.; writing—review and editing, P.G., M.W. and R.Ż.; visualization, A.Z. and M.L.; supervision, M.J. and M.W.; project administration, M.J.; funding acquisition, M.J. All authors have read and agreed to the published version of the manuscript.
Funding
This research was funded by the National Science Centre, Poland (project no. 2022/04/Y/ST8/00134). Project title: Energy optimal urban logistics as a service (E-Laas). Project implemented as part of the call ERA-NET Cofund Urban Accessibility and Connectivity (EN-UAC China Call) organized by JPI Urban Europe and the National Natural Science Foundation of China (NSFC) funded by the European Union’s Horizon 2020 research and innovation programme under grant agreement No 875022.
Institutional Review Board Statement
Not applicable.
Informed Consent Statement
Not applicable.
Data Availability Statement
Data are contained within the article.
Conflicts of Interest
The authors declare no conflicts of interest.
References
- Kiba-Janiak, M.; Cheba, K.; Witkowski, J.; Jagoda, A.; Skowrońska, A.; Kołakowski, T.; Baraniecka, A.; Marcinkowski, J.; Mucowska, M. Sustainable City Logistics of Last-Mile Delivery and Returns on the E-Commerce Market. Various Groups of Stakeholders’ Perspectives–Aims and Scope of the Project. ACC J. 2022, 28, 44–53. [Google Scholar] [CrossRef]
- Buldeo Rai, H.; Dablanc, L. Hunting for treasure: A systematic literature review on urban logistics and e-commerce data. Transp. Rev. 2023, 43, 204–233. [Google Scholar] [CrossRef]
- Aurambout, J.P.; Gkoumas, K.; Ciuffo, B. Last mile delivery by drones: An estimation of viable market potential and access to citizens across European cities. Eur. Transp. Res. Rev. 2019, 11, 30. [Google Scholar] [CrossRef]
- Cano, J.A.; Londoño-Pineda, A.; Rodas, C. Sustainable logistics for e-commerce: A literature review and bibliometric analysis. Sustainability 2022, 14, 12247. [Google Scholar] [CrossRef]
- Silvestri, F.; Coppola, P. Assessing the impacts of e-commerce on future urban logistics scenarios: Case study of the city of Rome. Int. J. Transp. Econ. 2021, 48, 339–358. [Google Scholar]
- Muñoz-Villamizar, A.; Santos, J.; Montoya-Torres, J.R.; Jaca, C. Using OEE to evaluate the effectiveness of urban freight transportation systems: A case study. Int. J. Prod. Econ. 2018, 197, 232–242. [Google Scholar] [CrossRef]
- Švadlenka, L.; Dobrodolac, M.; Blagojevic, M. Application of tracking technologies in the postal system. In ICTTE 2016: Proceedings of the 3rd International Conference on Traffic and Transport Engineering, Belgrade, Serbia, 24–25 November 2016; City Net Scientific Research Center: Belgrade, Serbia, 2016. [Google Scholar]
- Bates, O.; Friday, A.; Allen, J.; Cherrett, T.; McLeod, F.; Bektas, T.; Ngyuyen, T.; Piecyk, M.; Piotrowska, M.; Wise, S.; et al. Transforming last-mile logistics: Opportunities for more sustainable deliveries. In Proceedings of the 2018 CHI Conference on Human Factors in Computing Systems, Montreal, QC, Canada, 21–26 April 2018; Association for Computing Machinery: New York, NY, USA, 2018; pp. 1–14. [Google Scholar]
- Yan, Y.; Li, J. Transport carbon emissions reduction efficiency and economic growth: A perspective from nighttime lights remote sensing. Arch. Transp. 2023, 66, 21–32. [Google Scholar] [CrossRef]
- Nathanail, E.; Adamos, G.; Gogas, M. A novel approach for assessing sustainable city logistics. Transp. Res. Procedia 2017, 25, 1036–1045. [Google Scholar] [CrossRef]
- Schliwa, G.; Armitage, R.; Aziz, S.; Evans, J.; Rhoades, J. Sustainable city logistics—Making cargo cycles viable for urban freight transport. Res. Transp. Bus. Manag. 2015, 15, 50–57. [Google Scholar] [CrossRef]
- Mohri, S.S.; Ghaderi, H.; Nassir, N.; Thompson, R.G. Crowdshipping for sustainable urban logistics: A systematic review of the literature. Transp. Res. Part E Logist. Transp. Rev. 2023, 178, 103289. [Google Scholar] [CrossRef]
- Azari, M.; Jawab, F.; Arif, J.; Khaoua, Y.; El Jaouhari, A.; Moustabchir, H. From City Logistics to a Merger of Smart Cities and Smart Logistics. In Proceedings of the 14th International Colloquium of Logistics and Supply Chain Management LOGISTIQUA, El Jadida, Morocco, 25–27 May 2022; Volume 2022, pp. 1–5. [Google Scholar]
- Jacyna-Gołda, I.; Izdebski, M.; Szczepański, E.; Gołda, P. The assessment of supply chain effectiveness. Arch. Transp. 2018, 45, 43–52. [Google Scholar] [CrossRef]
- Lal, A.; Renaldy, T.; Breuning, L.; Hamacher, T.; You, F. Electrifying light commercial vehicles for last-mile deliveries: Environmental and economic perspectives. J. Clean. Prod. 2023, 416, 137933. [Google Scholar] [CrossRef]
- Liu, Y.; Ye, Q.; Escribano-Macias, J.; Feng, Y.; Candela, E.; Angeloudis, P. Route planning for last-mile deliveries using mobile parcel lockers: A hybrid q-learning network approach. Transp. Res. Part E Logist. Transp. Rev. 2023, 177, 103234. [Google Scholar] [CrossRef]
- Pourrahmani, E.; Jaller, M. Crowdshipping in last mile deliveries: Operational challenges and research opportunities. Socio Econ. Plan. Sci. 2021, 78, 101063. [Google Scholar] [CrossRef]
- Garg, V.; Niranjan, S.; Prybutok, V.; Pohlen, T.; Gligor, D. Drones in last-mile delivery: A systematic review on Efficiency, Accessibility, and Sustainability. Transp. Res. Part D Transp. Environ. 2023, 123, 103831. [Google Scholar] [CrossRef]
- Lasota, M.; Zabielska, A.; Jacyna, M.; Żak, J. Research and analysis of the operation of vehicles with various propulsion systems, including costs and CO2 emissions. Combust. Engines 2023, 195, 3–13. [Google Scholar]
- Bosona, T. Urban freight last mile logistics—Challenges and opportunities to improve sustainability: A literature review. Sustainability 2020, 12, 8769. [Google Scholar] [CrossRef]
- Fontaine, P.; Minner, S.; Schiffer, M. Smart and sustainable city logistics: Design, consolidation, and regulation. Eur. J. Oper. Res. 2023, 307, 1071–1084. [Google Scholar] [CrossRef]
- Özbekler, T.M.; Karaman Akgül, A. Last mile logistics in the framework of smart cities: A typology of city logistics schemes. Int. Arch. Photogramm. Remote Sens. Spat. Inf. Sci. 2020, 44, 335–337. [Google Scholar] [CrossRef]
- Sobota, A.; Żochowska, R.; Szczepański, E.; Gołda, P. The influence of tram tracks on car vehicle speed and noise emission at four-approach intersections located on multilane arteries in cities. J. Vibroengineering 2018, 20, 2453–2468. [Google Scholar] [CrossRef]
- Škultéty, F.; Beňová, D.; Gnap, J. City logistics as an imperative smart city mechanism: Scrutiny of clustered eu27 capitals. Sustainability 2021, 13, 3641. [Google Scholar] [CrossRef]
- Assiri, S.; Alyamani, M.; Mansour, A.; Fakieh, B.; Badri, S.; Babour, A. Current Shipment Tracking Technologies and Trends in Research. In Proceedings of the 2020 the 4th International Conference on Information System and Data Mining, Hawaii, HI, USA, 15–17 May 2020; Association for Computing Machinery: New York, NY, USA, 2020; pp. 113–117. [Google Scholar]
- Vo, T.M.N.; Wang, C.N.; Yang, F.C. Blockchain Security-Efficiency Analysis based on DEA-SBM Model. Eurasia Proc. Sci. Technol. Eng. Math. 2023, 23, 202–208. [Google Scholar] [CrossRef]
- Milewski, D.; Milewska, B. The energy efficiency of the last mile in the e-commerce distribution in the context the COVID-19 pandemic. Energies 2021, 14, 7863. [Google Scholar] [CrossRef]
- Shao, S.; Xu, G.; Li, M.; Huang, G.Q. Synchronizing e-commerce city logistics with sliding time windows. Transp. Res. Part E Logist. Transp. Rev. 2019, 123, 17–28. [Google Scholar] [CrossRef]
- Szczepański, E.; Jacyna-Gołda, I.; Murawski, J. Genetic algorithms based approach for transhipment HUB location in urban areas. Arch. Transp. 2014, 31, 73–83. [Google Scholar] [CrossRef]
- Aljohani, K.; Thompson, R.G. Optimizing the Establishment of a Central City Transshipment Facility to Ameliorate Last-Mile Delivery: A Case Study in Melbourne CBD. In City Logistics 3: Towards Sustainable and Liveable Cities; John Wiley & Sons: Hoboken, NJ, USA, 2018; pp. 23–46. [Google Scholar]
- Sonneberg, M.O.; Leyerer, M.; Kleinschmidt, A.; Knigge, F.; Breitner, M.H. Autonomous unmanned ground vehicles for urban logistics: Optimization of last mile delivery operations. In Proceedings of the 52nd Hawaii International Conference on System Sciences, Honolulu, HI, USA, 1 August 2019; pp. 1538–1547. [Google Scholar]
- De Silva, M.M.; Herath, O.K.; Nakayama, T.; Kumarage, A.S. A system dynamics model for vehicle fleet transformation towards energy efficiency and low-carbon development: A case study of Sri Lanka and its strategies. Transp. Policy 2024, 147, 244–258. [Google Scholar] [CrossRef]
- Díaz-Ramírez, J.; Zazueta-Nassif, S.; Galarza-Tamez, R.; Prato-Sánchez, D.; Huertas, J.I. Characterization of urban distribution networks with light electric freight vehicles. Transp. Res. Part D Transp. Environ. 2023, 119, 103719. [Google Scholar] [CrossRef]
- Zhang, S.; Guan, C.; Qiu, Y.; Wu, N. Multi-objective route optimization of urban cold chain distribution using electric and diesel powered vehicles. Res. Transp. Bus. Manag. 2023, 49, 100969. [Google Scholar] [CrossRef]
- De Mello Bandeira, R.A.; Goes, G.V.; Gonçalves, D.N.S.; Márcio de Almeida, D.A.; de Oliveira, C.M. Electric vehicles in the last mile of urban freight transportation: A sustainability assessment of postal deliveries in Rio de Janeiro-Brazil. Transp. Res. Part D Transp. Environ. 2019, 67, 491–502. [Google Scholar] [CrossRef]
- Sablin, O.; Bosyi, D.; Kuznetsov, V.; Lewczuk, K.; Kebal, I.; Myamlin, S.S. Efficiency of energy storage control in the electric transport systems. Arch. Transp. 2022, 62, 105–122. [Google Scholar] [CrossRef]
- Gołębiowski, P.; Żak, J.; Jacyna-Gołda, I. Approach to the Proecological Distribution of the Traffic Flow on the Transport Network from the Point of View of Carbon Dioxide. Sustainability 2020, 12, 6936. [Google Scholar] [CrossRef]
- Izdebski, M.; Jacyna-Gołda, I.; Nivette, M.; Szczepański, E. Selection of a fleet of vehicles for tasks based on the statistical characteristics of their operational parameters. Maint. Reliab. 2022, 24, 407–418. [Google Scholar] [CrossRef]
- Jacyna, M.; Żochowska, R.; Sobota, A.; Wasiak, M. Scenario Analyses of Exhaust Emissions Reduction through the Introduction of Electric Vehicles into the City. Energies 2021, 14, 2030. [Google Scholar] [CrossRef]
- Dai, H.; Huang, G.; Wang, J.; Zeng, H. VAR-tree model based spatio-temporal characterization and prediction of O3 concentration in China. Ecotoxicol. Environ. Saf. 2023, 257, 114960. [Google Scholar] [CrossRef]
- Dai, H.; Huang, G.; Zeng, H. Multi-objective optimal dispatch strategy for power systems with Spatio-temporal distribution of air pollutants. Sustain. Cities Soc. 2023, 98, 104801. [Google Scholar] [CrossRef]
- Wang, C.N.; Yang, F.C.; Vo, T.M.N.; Nguyen, V.T.T.; Singh, M. Enhancing efficiency and cost-effectiveness: A groundbreaking bi-algorithm MCDM approach. Appl. Sci. 2023, 13, 9105. [Google Scholar] [CrossRef]
- Erdoğan, G. An open source spreadsheet solver for vehicle routing problems. Comput. Oper. Res. 2017, 84, 62–72. [Google Scholar] [CrossRef]
- Leon, S.; Chen, C.; Ratcliffe, A. Consumers’ perceptions of last mile drone delivery. Int. J. Logist. Res. Appl. 2023, 26, 345–364. [Google Scholar] [CrossRef]
- Han, X.; Naeher, L.P. A review of traffic-related air pollution exposure assessment studies in the developing world. Environ. Int. 2006, 32, 106–120. [Google Scholar] [CrossRef] [PubMed]
- HBEFA—Handbook Emission Factors for Road Transport. Available online: https://www.hbefa.net/ (accessed on 15 December 2023).
- HBEFA Software. Available online: https://www.hbefa.net/en/software#online-version (accessed on 15 December 2023).
- PGE Polska Grupa Energetyczna—Struktura Paliw. Available online: https://www.gkpge.pl/bip/struktura-paliw (accessed on 15 December 2023).
Figure 1.
Location of parcel collection points (source: own work using the QGIS 3.32 tool).

Figure 2.
A flowchart of the applied approach methodology (source: own work).

Figure 3.
Determination of the route for variants I and II (source: own work based on the VRP Spreadsheet solver program; the numbers indicate the points from Table 2).
Figure 3.
Determination of the route for variants I and II (source: own work based on the VRP Spreadsheet solver program; the numbers indicate the points from Table 2).

Figure 4.
Determining the route of the first vehicle for variants III and IV (source: own work based on the VRP Spreadsheet solver program; the numbers indicate the points from Table 2).
Figure 4.
Determining the route of the first vehicle for variants III and IV (source: own work based on the VRP Spreadsheet solver program; the numbers indicate the points from Table 2).

Figure 5.
Determining the route of the second vehicle for variants III and IV (source: own work based on the VRP Spreadsheet solver program; the numbers indicate the points from Table 2).
Figure 5.
Determining the route of the second vehicle for variants III and IV (source: own work based on the VRP Spreadsheet solver program; the numbers indicate the points from Table 2).

Figure 6.
General scheme for building a ranking for the multi-criteria evaluation of variants (source: own work).
Figure 6.
General scheme for building a ranking for the multi-criteria evaluation of variants (source: own work).


Table 1.
Values of coef(vm,hs) [g/vehkm] for various types of vehicles used in the analysis.
| Harmful Compound (hs) | Diesel | Electricity * | Electricity ** |
|---|---|---|---|
| CO | 0.089 | 0 | 0 |
| CO2 | 232.869 | 0 | 243.81 |
| HC | 0.012 | 0 | 0 |
| NOx | 0.566 | 0 | 0.179 |
| PM | 0.016 | 0 | 0.0066 |
Table 2.
Data regarding the location and technical parameters of distributed shipments.
| No. | District | Delivery Address | The Number of Items | Total Weight [kg] |
|---|---|---|---|---|
| 1 | Distribution center | street Przejazdowa 58, 05-800 Pruszkow | - | - |
| 2 | Srodmiescie | al. Jana Pawla II 82, 00-175 Warsaw | 10 | 60 |
| 3 | street Grzybowska 62, 00-844 Warsaw | 5 | 30 | |
| 4 | street Zelazna 32, 00-832 Warsaw | 11 | 66 | |
| 5 | al. Jerozolimskie 11/19, 00-508 Warsaw | 11 | 66 | |
| 6 | street Solec 83, 00-382 Warsaw | 5 | 30 | |
| 7 | street Pulawska 2, 02-566 Warsaw | 12 | 72 | |
| 8 | Wola | street Gorczewska 124, 01-460 Warsaw | 7 | 42 |
| 9 | street Gorczewska 212, 01-355 Warsaw | 8 | 48 | |
| 10 | street J. Kazimierza 50, 01-248 Warsaw | 6 | 36 | |
| 11 | street Polczynska 4, 01-378 Warsaw | 11 | 66 | |
| 12 | street Lazurowa 71A, 01-314 Warsaw | 7 | 42 | |
| 13 | street M. Kasprzaka 29, 01-234 Warsaw | 12 | 72 | |
| 14 | street Banderii 4, 01-164 Warsaw | 9 | 54 | |
| 15 | Wlochy | street B. Chrobrego 4, 02-479 Warsaw | 10 | 60 |
| 16 | street al. Jerozolimskie 179, 02-222 Warsaw | 3 | 18 | |
| 17 | al. Krakowska 102, 02-180 Warsaw | 4 | 24 | |
| 18 | al. Krakowska 224, 02-219 Warsaw | 7 | 42 | |
| 19 | Ursus | street Herbu Oksza 22, 02-495 Warsaw | 3 | 18 |
| 20 | Bemowo | street Wroclawska 8, 01-493 Warsaw | 5 | 30 |
| 21 | street Pitagorasa 18, 01-483 Warsaw | 1 | 6 | |
| SUM | 119 | 714 | ||
Source: own work.
Table 3.
Characteristics of transport tasks.
| Variant | Transport Task Completion Time [min] | Length of Carrying out the Transport Task [km] |
|---|---|---|
| Variant I | 464 | 88.01 |
| Variant II | 464 | 88.01 |
| Variant III | 291 | 62.90 |
| Variant IV | 245 | 68.16 |
Source: own work.
Table 4.
Evaluation values of individual variants concerning partial criteria.
| Criteria (cn)\Variants (vm) | Variant I v1 | Variant II v2 | Variant III v3 | Variant IV v4 |
|---|---|---|---|---|
| The cost of exposing the ecosystem to harmful substances [PLN] c1 | 61.60 | 67.90 | 68.56 | 100.37 |
| Time of exposure of the ecosystem to harmful substances [min] c2 | 510.4 | 510.4 | 320.1 | 269.5 |
| The amount of exposure of the ecosystem to the harmful substance CO2 [g/veh] c3, CO2 | 20,494.8 | 21,457.7 | 14,647.5 * | 16,618.1 * |
| The amount of exposure of the ecosystem to a harmful substance NOx [g/veh] c3, NOx | 49.8 | 15.8 | 35.6 * | 12.2 * |
| The amount of exposure of the ecosystem to the harmful substance PM [g/veh] c3, PM | 1.4 | 0.6 | 1.0 * | 0.4 * |
* Values expressed in [g/2 veh] due to the implementation of the transport task with two vehicles. Source: own work.
Table 5.
Normalized evaluation for individual variants.
| Variant (vm) | Normalized Variant Rating Values | Aggregated Assessment of Variants | ||
|---|---|---|---|---|
| Variant I (v1) | 0.14 | 0.00 | 0.00 | 0.14 |
| Variant II (v2) | 0.00 | 0.90 | 0.80 | 1.70 |
| Variant III (v3) | 1.00 | 0.38 | 0.40 | 1.78 |
| Variant IV (v4) | 0.71 | 1.00 | 1.00 | 2.71 |
Source: own work.
Table 6.
Normalized evaluation values for individual variants.
| Variant (vm) | Normalized Variant Rating Values | ||
|---|---|---|---|
| Variant I | 1.00 | 0.00 | 0.00 |
| Variant II | 0.84 | 0.00 | 0.61 |
| Variant III | 0.82 | 0.79 | 0.64 |
| Variant IV | 0.00 | 1.00 | 1.00 |
Source: own work.
Table 7.
Normalized values of the pairwise comparison matrix of criteria.
| Criteria (cn) | ||||
|---|---|---|---|---|
| 0.0769 | 0.0476 | 0.0968 | 0.0738 | |
| 0.3846 | 0.2381 | 0.2258 | 0.2828 | |
| 0.5385 | 0.7143 | 0.6774 | 0.6434 |
Source: own work.
Disclaimer/Publisher’s Note: The statements, opinions and data contained in all publications are solely those of the individual author(s) and contributor(s) and not of MDPI and/or the editor(s). MDPI and/or the editor(s) disclaim responsibility for any injury to people or property resulting from any ideas, methods, instructions or products referred to in the content. |
© 2024 by the authors. Licensee MDPI, Basel, Switzerland. This article is an open access article distributed under the terms and conditions of the Creative Commons Attribution (CC BY) license (https://creativecommons.org/licenses/by/4.0/).
Share and Cite
MDPI and ACS Style
Lasota, M.; Zabielska, A.; Jacyna, M.; Gołębiowski, P.; Żochowska, R.; Wasiak, M. Method for Delivery Planning in Urban Areas with Environmental Aspects. Sustainability 2024, 16, 1571. https://doi.org/10.3390/su16041571
AMA Style
Lasota M, Zabielska A, Jacyna M, Gołębiowski P, Żochowska R, Wasiak M. Method for Delivery Planning in Urban Areas with Environmental Aspects. Sustainability. 2024; 16(4):1571. https://doi.org/10.3390/su16041571
Chicago/Turabian StyleLasota, Michał, Aleksandra Zabielska, Marianna Jacyna, Piotr Gołębiowski, Renata Żochowska, and Mariusz Wasiak. 2024. "Method for Delivery Planning in Urban Areas with Environmental Aspects" Sustainability 16, no. 4: 1571. https://doi.org/10.3390/su16041571
Note that from the first issue of 2016, this journal uses article numbers instead of page numbers. See further details here.