
Identification of Illegal Dumping and Community Views in Informal Settlements, Cape Town: South Africa
by
 , and
, and
Yamkela Jakeni
1,
Thabang Maphanga
1,
Benett Siyabonga Madonsela
1,* and
Karabo Concelia Malakane
2 1
Department of Environmental and Occupational Studies, Faculty of Applied Sciences, Cape Peninsula University of Technology, Comer of Hanover, and Tennant Street, Zonnebloem, Cape Town 7535, South Africa
2
Department of Biodiversity, Faculty of Science and Agriculture, School of Molecular and Life Sciences, University of Limpopo, Private Bag XI 106, Sovenga, Polokane 0727, South Africa
*
Author to whom correspondence should be addressed.
Sustainability 2024, 16(4), 1429; https://doi.org/10.3390/su16041429
Submission received: 20 December 2023
/
Revised: 23 January 2024
/
Accepted: 6 February 2024
/
Published: 8 February 2024
Abstract
:Municipalities face the greatest difficulty in implementing an efficient and effective waste collection system, especially in informal settlements with limited spatial planning. Illegal dumping is exacerbated by the proliferation of informal settlements and the lack of adequate waste management services provided by municipalities. A geographic information system (GIS) provides decision makers with a framework for analyzing and simulating a wide variety of spatial problems, including waste management issues. The purpose of this study is to map areas susceptible to illegal dumping and to determine why the community dumps there. The data were collected qualitatively via a questionnaire using a purposeful sampling technique, and SPSS 28.0 was used to analyze the data. The accessibility of streets and the availability of vacant land affected the location and concentration of illegal dumping in the test area. The lands within a buffer zone of 250 to 500 m of populated areas are the most vulnerable. The majority of residents have individual garbage receptacles, while a minority of 43.18% do not. A total of 52 dumpsites were identified inside the red zone of the model, suggesting a strong likelihood of illegal dumping activities. Hence, the community continues to have difficulties in effectively managing garbage disposal, compelling them to resort to alternative methods of waste disposal.
1. Introduction
Illegal waste disposal is a significant problem in several regions globally, particularly in townships and informal settlements, where garbage presents economic, social, and environmental hazards [1,2,3]. Waste collection is a crucial component of every nation’s waste management infrastructure. Therefore, the act of disposing of garbage without proper collection is considered illegal. Moreover, the primary factors contributing to illegal dumping are the expansion of the population and urbanization, which contribute to a rise in waste production and the establishment of unauthorized disposal locations [4,5,6]. South Africa is experiencing rapid development but is facing challenges related to illegal dumping due to inadequate waste management services provided by municipalities [7,8,9]. Therefore, it is crucial to identify the prevalence of illegal dumping locations in order to incentivize governments to offer waste management services to all residential areas and households, irrespective of their housing style, under their jurisdiction. Mutisya and Yarime [10] state that unlawful dumping is driven by various factors, with population growth being a significant contributor. This is further exacerbated by the increase in informal settlements, leading to a rapid expansion of these settlements. The South African government has made an integrated solid waste management strategy one of their priorities, seeking to identify a national environmental strategy to reduce costs from environmental degradation and health risks [11].
Furthermore, it should be noted that informal settlements in developing nations, such as Kenya, Uganda, and South Africa, are susceptible to the unlawful disposal of garbage in close proximity to access roads and walkways [12,13]. One of the primary causes of illegal dumping is population growth coupled with the rapid expansion of informal settlements [14]. Thus, urbanization leads to a lack of affordable and suitable housing options as a result of substantial migration. As a result, migrants are compelled to construct and reside in informal communities situated on unoccupied property, thus experiencing a dearth of essential facilities and services [15]. Zhou et al. [4] and Liu et al. [5] report that the majority of pollution in developing countries is a result of inadequate waste management systems and the proliferation of informal settlements. It is evident from the literature that low-income areas receive inferior services compared to affluent suburbs [14,16,17]. As a result, waste is observed piled up next to waste skips, which eventually becomes dispersed throughout the environment of poor communities [18]. Inadequate waste removal services, which are primarily caused by delays in the collection of waste by the mandated municipality; the lack of a formal waste removal system in informal settlements due to a lack of roads; an insufficient number of skips; and travel distance from houses to a designated disposal container, are the primary contributors to illegal refuse dumping [14,19].
The greatest challenge facing municipalities worldwide is how to have an effective and efficient waste collection service, especially in informal settlements which lack spatial planning. Irrespective of the waste management method being used, waste must first be collected. Waste collection must be planned in such a way as possible to minimize cost and time by considering socio-economic, environmental, and land use factors [20]. The use of technologies such as geographic information systems (GISs) and remote sensing has gained momentum as it has yielded successful results in parts of the world, including countries such as Australia, Japan, and Malaysia [21,22,23,24]. Nonetheless, a small but growing number of developing countries have started to make use of these technologies in an effort to solve some waste-related problems such as limited landfill space, irregular waste collection, and illegal dumping. Illegal dumping exists over a large range, particularly on the African continent, and the use of these technologies promises a pivotal and lasting waste management solution [25].
Consequently, many communities, including the Joe Slovo Park (Cape Town, South Africa) informal settlement, are left even more vulnerable to illegal dumping. Therefore, illegal dumping is a worldwide problem that needs to be addressed by implementing GISs and other technologies. A GIS is a multifunctional technology used for the purpose of gathering, organizing, examining, and retrieving both geographical and non-spatial data. GISs provide the capability to effectively assist in the resolution of waste management problems. GISs have the potential to address this knowledge gap through the use of existing analytical techniques to comprehensively monitor and map illegal dumping sites. However, GISs have not gained momentum in South Africa because of many limitations in municipalities. In addition, the resources needed for GISs are not aligned with the overall municipal objectives, and the solutions are not designed to fit the problems at hand. Furthermore, GISs being seen as an expensive luxury and technically difficult to use results in them becoming an isolated function rather than a fully integrated decision tool to be utilized to comply with government legislation regarding service delivery.
Informal settlements exhibit significant instances of illegal waste disposal and uncontrolled communal dumping. Despite several years of education and awareness initiatives, street litter remains a substantial contributor to the mismanagement of solid waste, especially in developing nations. Therefore, inadequate waste management strategies necessitate additional research. However, the majority of impoverished areas do not receive regular waste disposal services [26]. Hence, there is a need to promote innovation, especially in low-income countries, to effectively combat the proliferation of unlawful dumping [19,27]. The utilization of GISs in waste management planning and practices is severely restricted in South Africa, despite its potential to provide a diverse range of efficient management strategies, including route planning for waste collection and exercises for selecting sites for transfer stations, landfills, and waste collection points [28]. The initial stage in enhancing the effectiveness of waste management endeavors and perhaps discouraging the growth of illegal dumpsites is to accurately chart the geographical arrangement of illegal waste disposal locations.
Therefore, illegal dumping has become a major issue for the municipality of Cape Town, South Africa. This study seeks to map the areas that are vulnerable to illegal dumping and obtain the views of the community as to why they are dumping in those areas. Thus, the subsequent questions arise: (1) What is the geographical pattern of illegal dumping in Joe Slovo Park? (2) Which open spaces are prone to illegal disposal? The objective of this study is the identification of illegal dumping sites and areas that are susceptible to illegal waste disposal using ArcGIS. This research aims to enhance the knowledge of the geographical distribution of unlawful dumping in the Joe Slovo Park informal community in Cape Town, South Africa, by exploring the use of GISs in waste management.
2. Methodology
2.1. Study Area
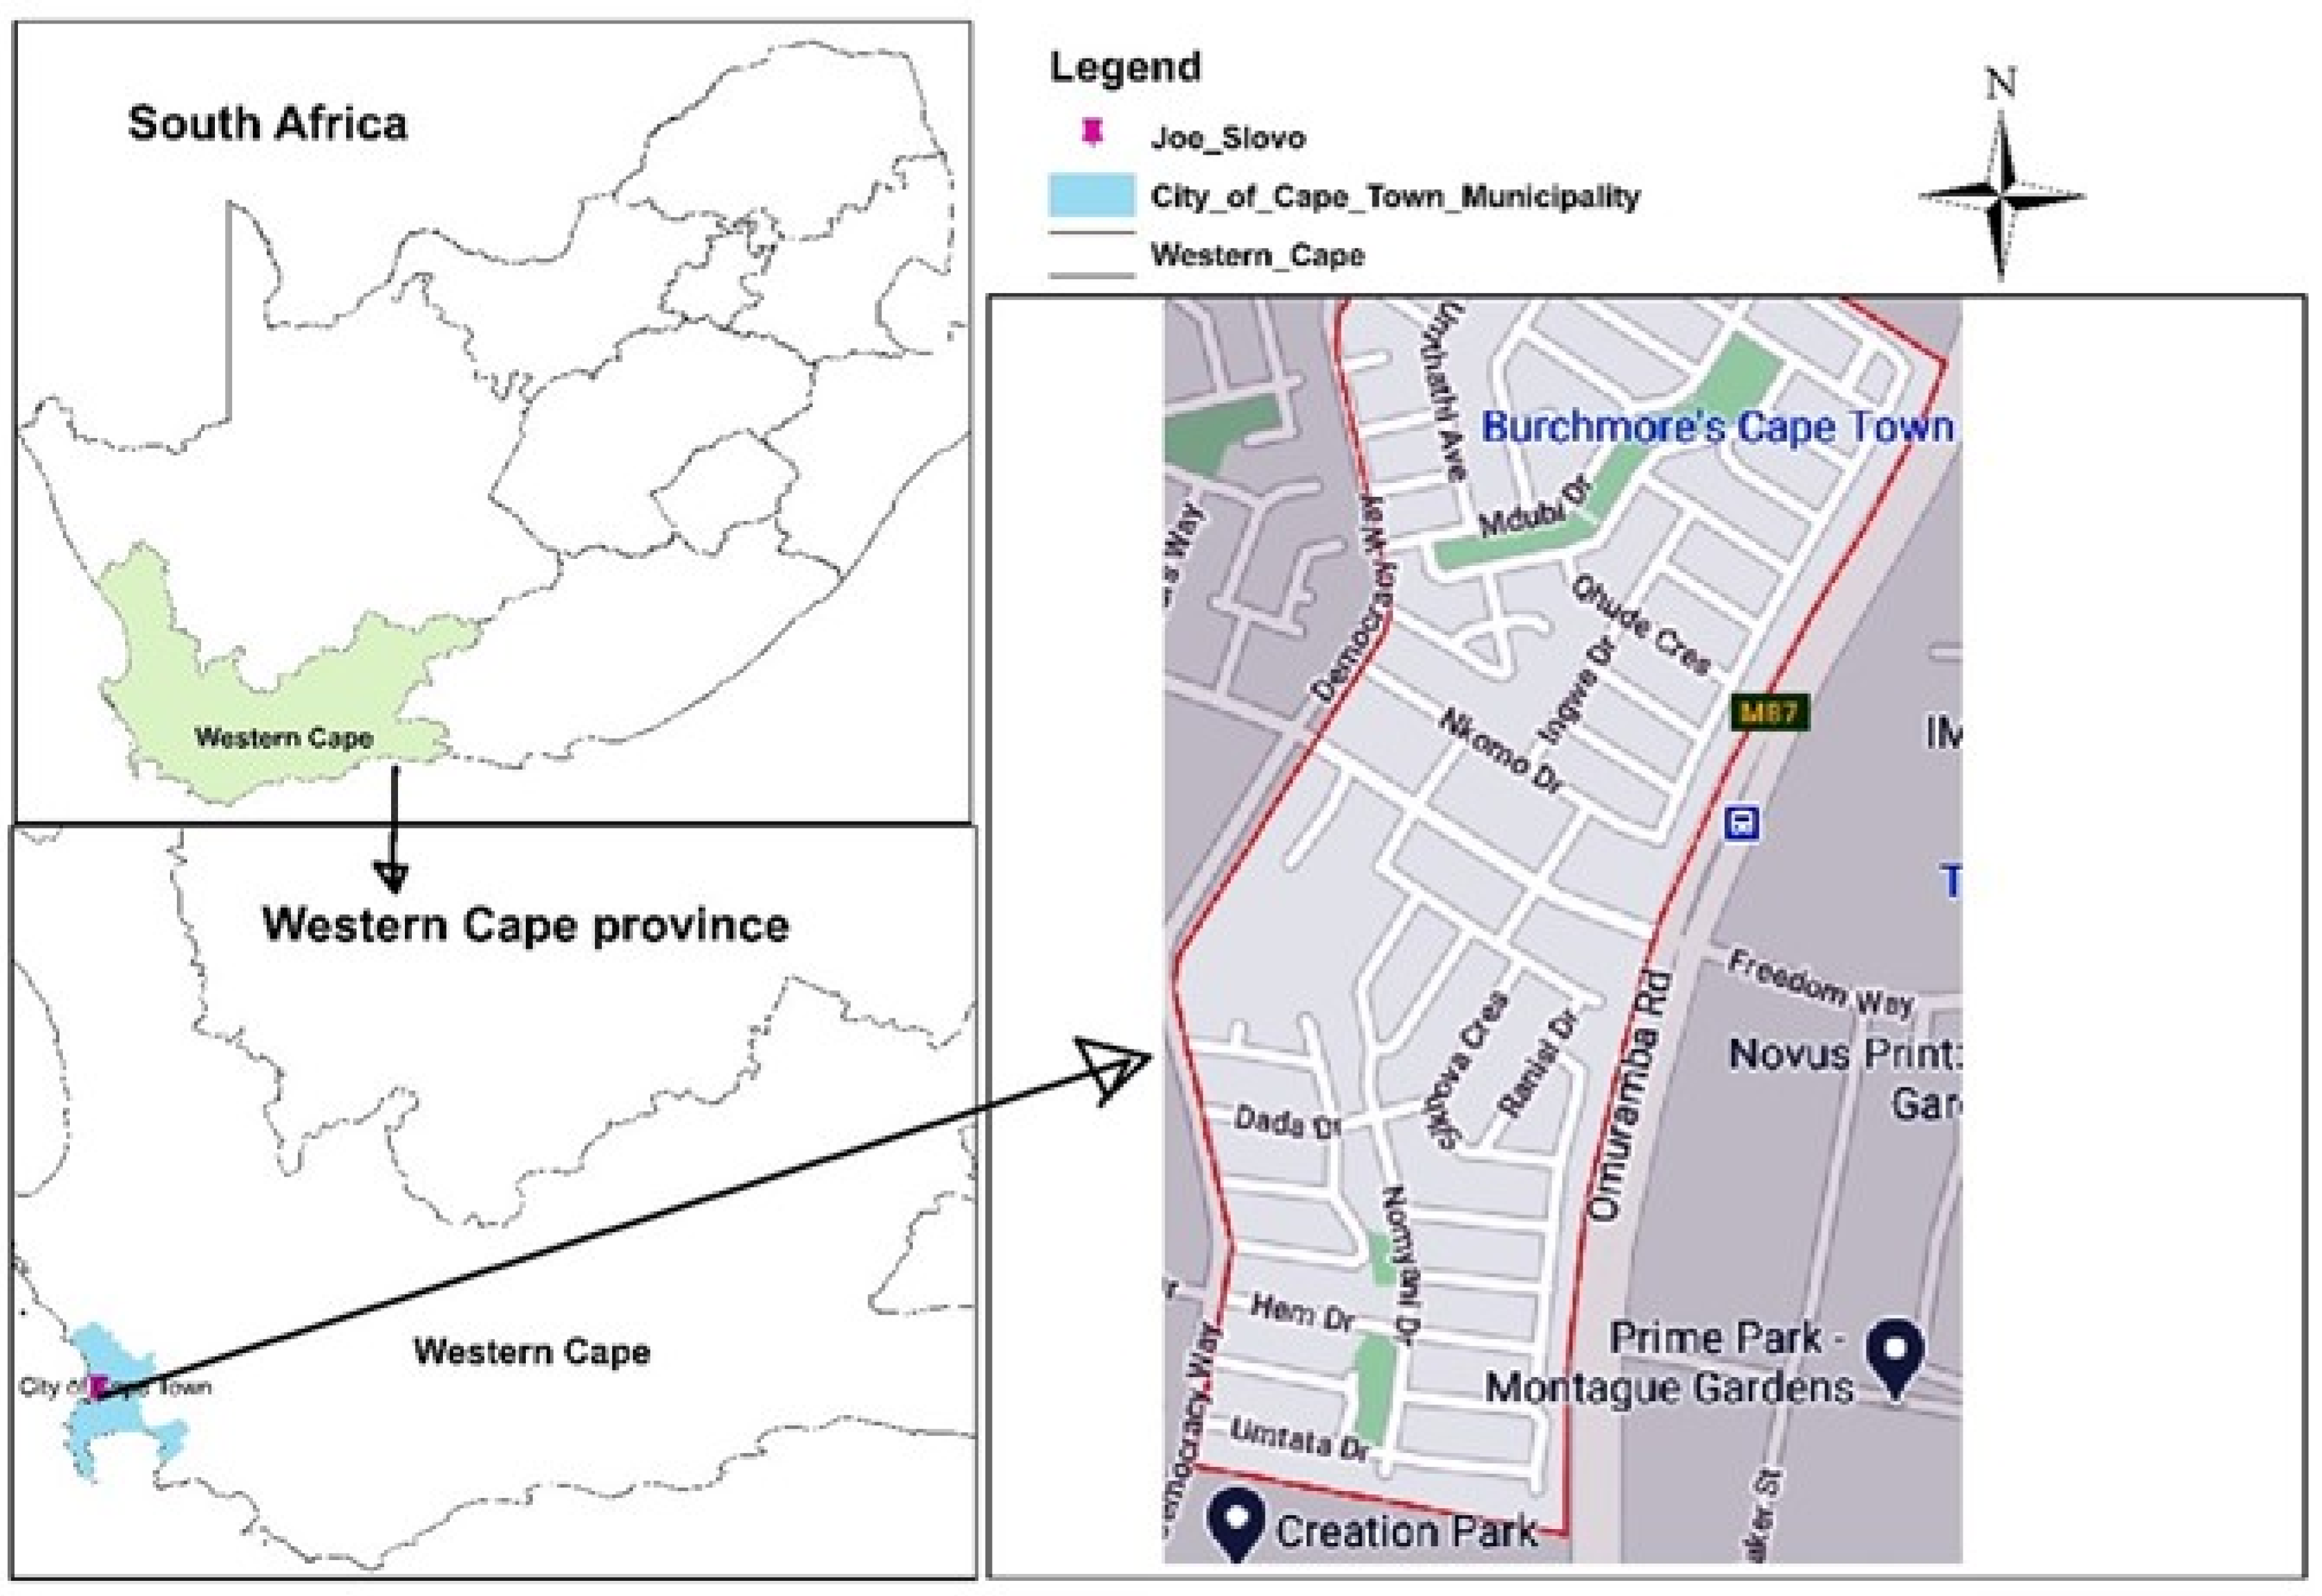
Joe Slovo Park is a large, dense informal settlement found in Joe Slovo in the Western Cape Province, located centrally in Philippi township in Cape Town, South Africa, with coordinates −34°1′5.57″ S and 18°35′9.03″ E (see Figure 1 below). Joe Slovo Park is bordered by a railway line and Philippi Station to the north, Parkway Drive to the west, the R300 to the south, and the Philippi Police Academy to the east. Joe Slovo Park is located 23 km southeast of Cape Town’s Central Commercial District and approximately 1.7 km away from the Philippi commercial core, which can be reached in about 20 min by walking. According to Drivdal [29], Joe Slovo Park consists of 6124 households that are made up of 15,011 people. The area comprises 99.17% Black African people, 52.7% men, and 47.25% women. The settlement was established in 1999, and the origin of its name comes from the Joe Slovo Park War that occurred in 1998–1999, which means that the Joe Slovo Park informal settlement is 20 years old today [29]. Moreover, this community is distinguished by substandard housing, restricted infrastructure, and demanding living circumstances. Illegal dumping is rampant in Joe Slovo Park to the extent that even when the government has service delivery challenges like overflowing sewage, they attribute it to illegal waste dumping.
2.2. Research Materials and Methods
The study used a quantitative tool and spatial analysis to determine the distribution and susceptibility of spatial areas in terms of illegal dumping. A quantitative approach was chosen because it is cost-effective and faster. However, the quantitative technique can be limited in its pursuit of concrete statistical relationships, which can lead to the study overlooking broader themes and relationships. Thus, through the use of quantitative data, the study uncovered the spatial dynamics of illegal dumping in the Joe Slovo Park informal settlement. Furthermore, it enables the study to uncover and conclude a phenomenon; for example, in this case, the study maps the spatial distribution of illegal dumping and models all the susceptible illegal dumping areas in the Joe Slovo Park informal settlement to assist in monitoring and managing illegal dumping.
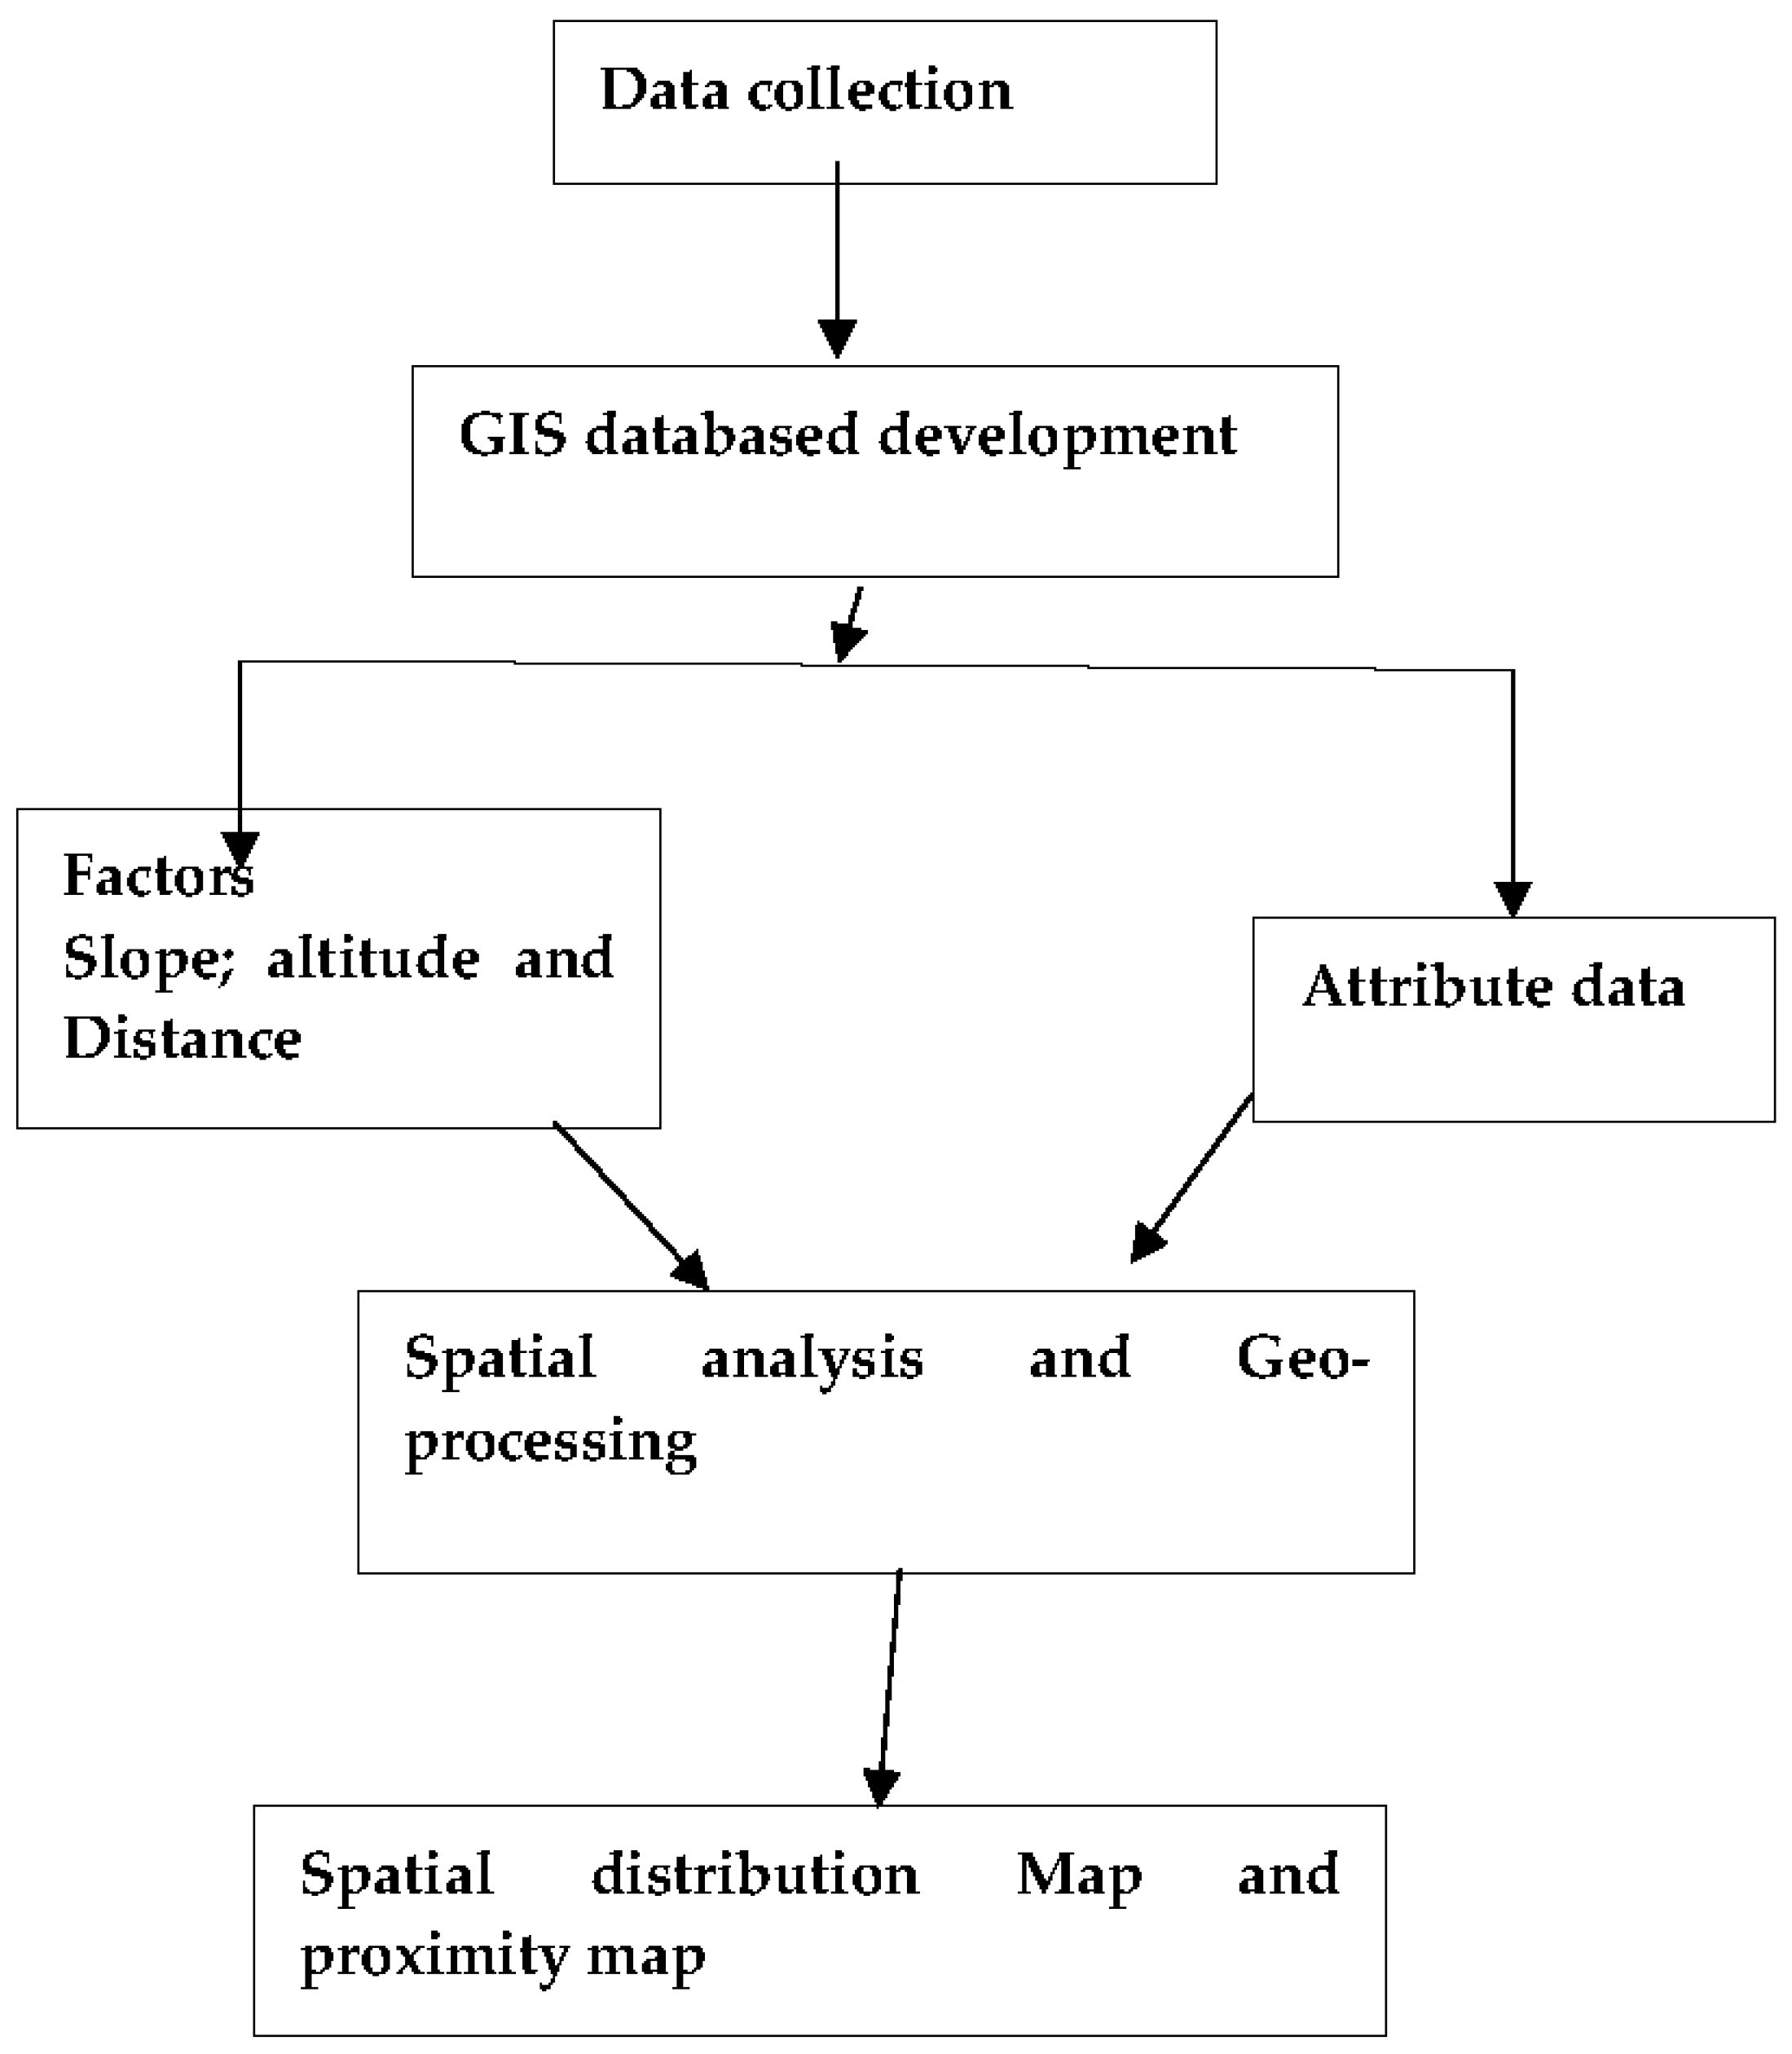
The utilization of a GIS enables the investigation to appreciate and derive inferences about a phenomenon; in this instance, it produces maps that show the spatial arrangement of illegal dumping areas. Jimoh et al. [30] developed a geodatabase conceptual model to outline the methodology used for the use of GISs in mapping the spatial distribution of illegal dumping to aid in the planning of illegal waste management. A conceptual model is a database created to combine various types of datasets that represent a real-world phenomenon, and it describes pertinent information and methods that can be implemented in a GIS, as shown in Figure 2. In addition, a conceptual modeling procedure facilitates a better comprehension of the methodology’s flow [31,32,33]. The coordinates of the dumping sites were obtained with the handheld global positioning system (GPS) receiver to provide the most accurate coordinates. Photographs were taken as evidence to reveal and illustrate the environmental and health impacts of illegal dumping in the study area.
2.2.1. Method of Data Collection
Primary Data
A field survey was carried out in order to identify the existing locations of the dumpsites within the study area. In addition, to confirm and observe the expansion and distribution of illegal dumping, a secondary dataset obtained from the City of Cape Town was used. The study area was demarcated using the main roads, Omuramba Road, Freedom Way, and Democracy Road, to create a cadastral boundary. Furthermore, both Freedom Way and Democracy Road were used as the main access roads in and out of the Joe Slovo Park informal settlement. Most of the streets run perpendicular to these roads, making them useful reference points. Photographs were taken as evidence to reveal and illustrate the environment and health impacts of illegal dumping in the study area. Furthermore, some of the streets were not easily accessible due to the streets being small and the clustering of shacks along the street; hence, a total of 52 illegal dumpsites were located, all varying in size and waste composition.
Questionnaire Survey
A qualitative technique was administered using a purposive sample methodology. A purposive sampling method involves selecting individuals or groups who possess information or expertise related to a specific phenomenon or units of interest for a particular goal. Therefore, the households of the Joe Slovo Park informal settlement were the key groups of interest when administering the surveys in the form of an open-ended questionnaire during March 2022. This was to help determine how much the residents know about the environmental impact caused by the illegal dumping of solid waste.
Sampling Size
The sample size for data collection was determined using Slovin’s formula.
with a 95% confidence interval. Therefore, the margin of error is 0.05%. According to Slovin’s formula, n = number of samples, N = total population, and = margin of error. Also, all the data collected during surveys were stored in a Microsoft Excel 2019 spreadsheet.
2.2.2. Data Analysis
ArcMap 10.8, which is one of the core applications in ArcGIS Desktop (ArcGIS Pro), was utilized to perform all GIS operations. ArcMap enables the display and exploration of GIS datasets for a specified region, as well as the assignment of symbols and the creation of map layouts for printing and publication. ArcMap is also used to create and edit datasets. It represents geographic data as a collection of layers and other map elements. In addition, ArcMap, along with ArcGIS Pro, is one of the two principal desktop GIS applications used to perform a vast array of common GIS tasks as well as user-specific tasks. Spatial analysis tools were used for the proximity analysis, e.g., using the Euclidean distance to determine the proximity of illegal dumping to roads and houses; a multi-criteria decision analysis (MCDA) and an analytical hierarchical process (AHP) were used to model predictions of potential areas prone to illegal dumping. The selection of these methods was based on the incorporation of various factors that can play a significant role in the process of analyzing spatial patterns and predicting illegal dumping.
Multi-Criteria Decision Analysis (MCDA) and Analytical Hierarchical Process (AHP)
The multi-criteria decision analysis (MCDA) approach used in this study is the analytical hierarchy process (AHP). The method of the AHP is one of the most used methods in decision-making processes, developed by numerous scholars [34,35,36]. Szabo [37] also notes that the AHP is undoubtedly among the most often applied multi-criteria decision models. The selection of these methods was based on the incorporation of various factors that can play a significant role in the process of analyzing spatial patterns and predicting illegal dumping. The AHP was used to model predictions of potential areas susceptible to illegal dumping in the Joe Slovo Park informal settlement. In addition, the advantage of the AHP is that it takes into account a decision maker’s intuitive knowledge in an analytical decision [34,35,38,39]. Likewise, Szabo [37] corroborates that, as an MCDA approach, applying the AHP allows for the exploration of different scenarios, an evaluation of the outcomes of prioritization, and a selection of the strategic objectives, for example, in sustainable waste management, the selection of a landfill site, optimum transport routes, and municipal collection points. Leal [40] reveals that, despite its wide applicability, the AHP has some limitations; it requires a very large number of comparisons to make a decision. This drawback hinders its application to important issues in making an informed decision. To overcome these limitations, a simplified version of the AHP was used, which was introduced by Leal [40] and called the express AHP (EAHP), in which a very low number of pairwise comparisons are required compared to the conventional AHP developed by Saaty [34]. The AHP-based methodology was carried out with the aim of identifying and modelling predictions of potential areas susceptible to illegal dumping. In this study, the hierarchy included the goal, categories, and factors, where the importance of all categories was compared pairwise against the goal, while the importance of all factors was compared pairwise against their respective categories.
At each level of the hierarchy, a comparison in pairs of structure elements is carried out, where the preferences of the decision maker are expressed using a Saaty scale of relative importance levels [34]. The scale contains 5 levels and 4 sub-levels in the range of 1 to 9 (Table 1), where 1 means “equally important”, 3 indicates “slightly more important”, 5 shows “significantly importantly more important”, 7 signifies “strongly more important”, and 9 means “extremely more important” [34,41].
The assessments of the relative importance of the elements from each level of the hierarchical structure are applied for the calculation of the local criteria, sub-criteria, and alternatives [38,41,42]. After that, the overall priorities of the alternatives are synthesized. The total priority of each alternative is calculated with the sum of local priorities, which are weighted with the weights of elements from higher levels. Thereafter, a pairwise comparison matrix, “A”, is developed using equation 1 below by means of computing.
Equation (1) calculates the criteria involved in the problem and the choice of the criteria [38].
Furthermore, Sasikumar et al. [38] and Taherdoos [43] state that in order to validate the results of the AHP, the consistency of each comparison matrix is computed by the consistency index (CI) and consistency ratio (CR), given in Equations (2) and (3):
where n and λmax denote the size of the matrix and its eigenvalue. The judgment consistency is tested by the CR, which is obtained by dividing the CI by the random index (RI), as given in Table 2. The CR is satisfactory if it is below 0.10 [34,41].
CR = CI/RI
Data Analysis for Questionnaire
In this research, the data collected were analyzed using the IBM Statistical Package for the Social Sciences (SPSS) Statistics 28.0 software and presented using pie charts, tables, and graphs, accompanied by a brief discussion of the visual presentation to reveal the nature of the problem of solid waste and the impact of illegal dumping on the overall environment. The findings gathered from the interviews are presented in a descriptive form.
3. Results and Discussion
3.1. Spatial Distribution of Illegal Dumping Areas
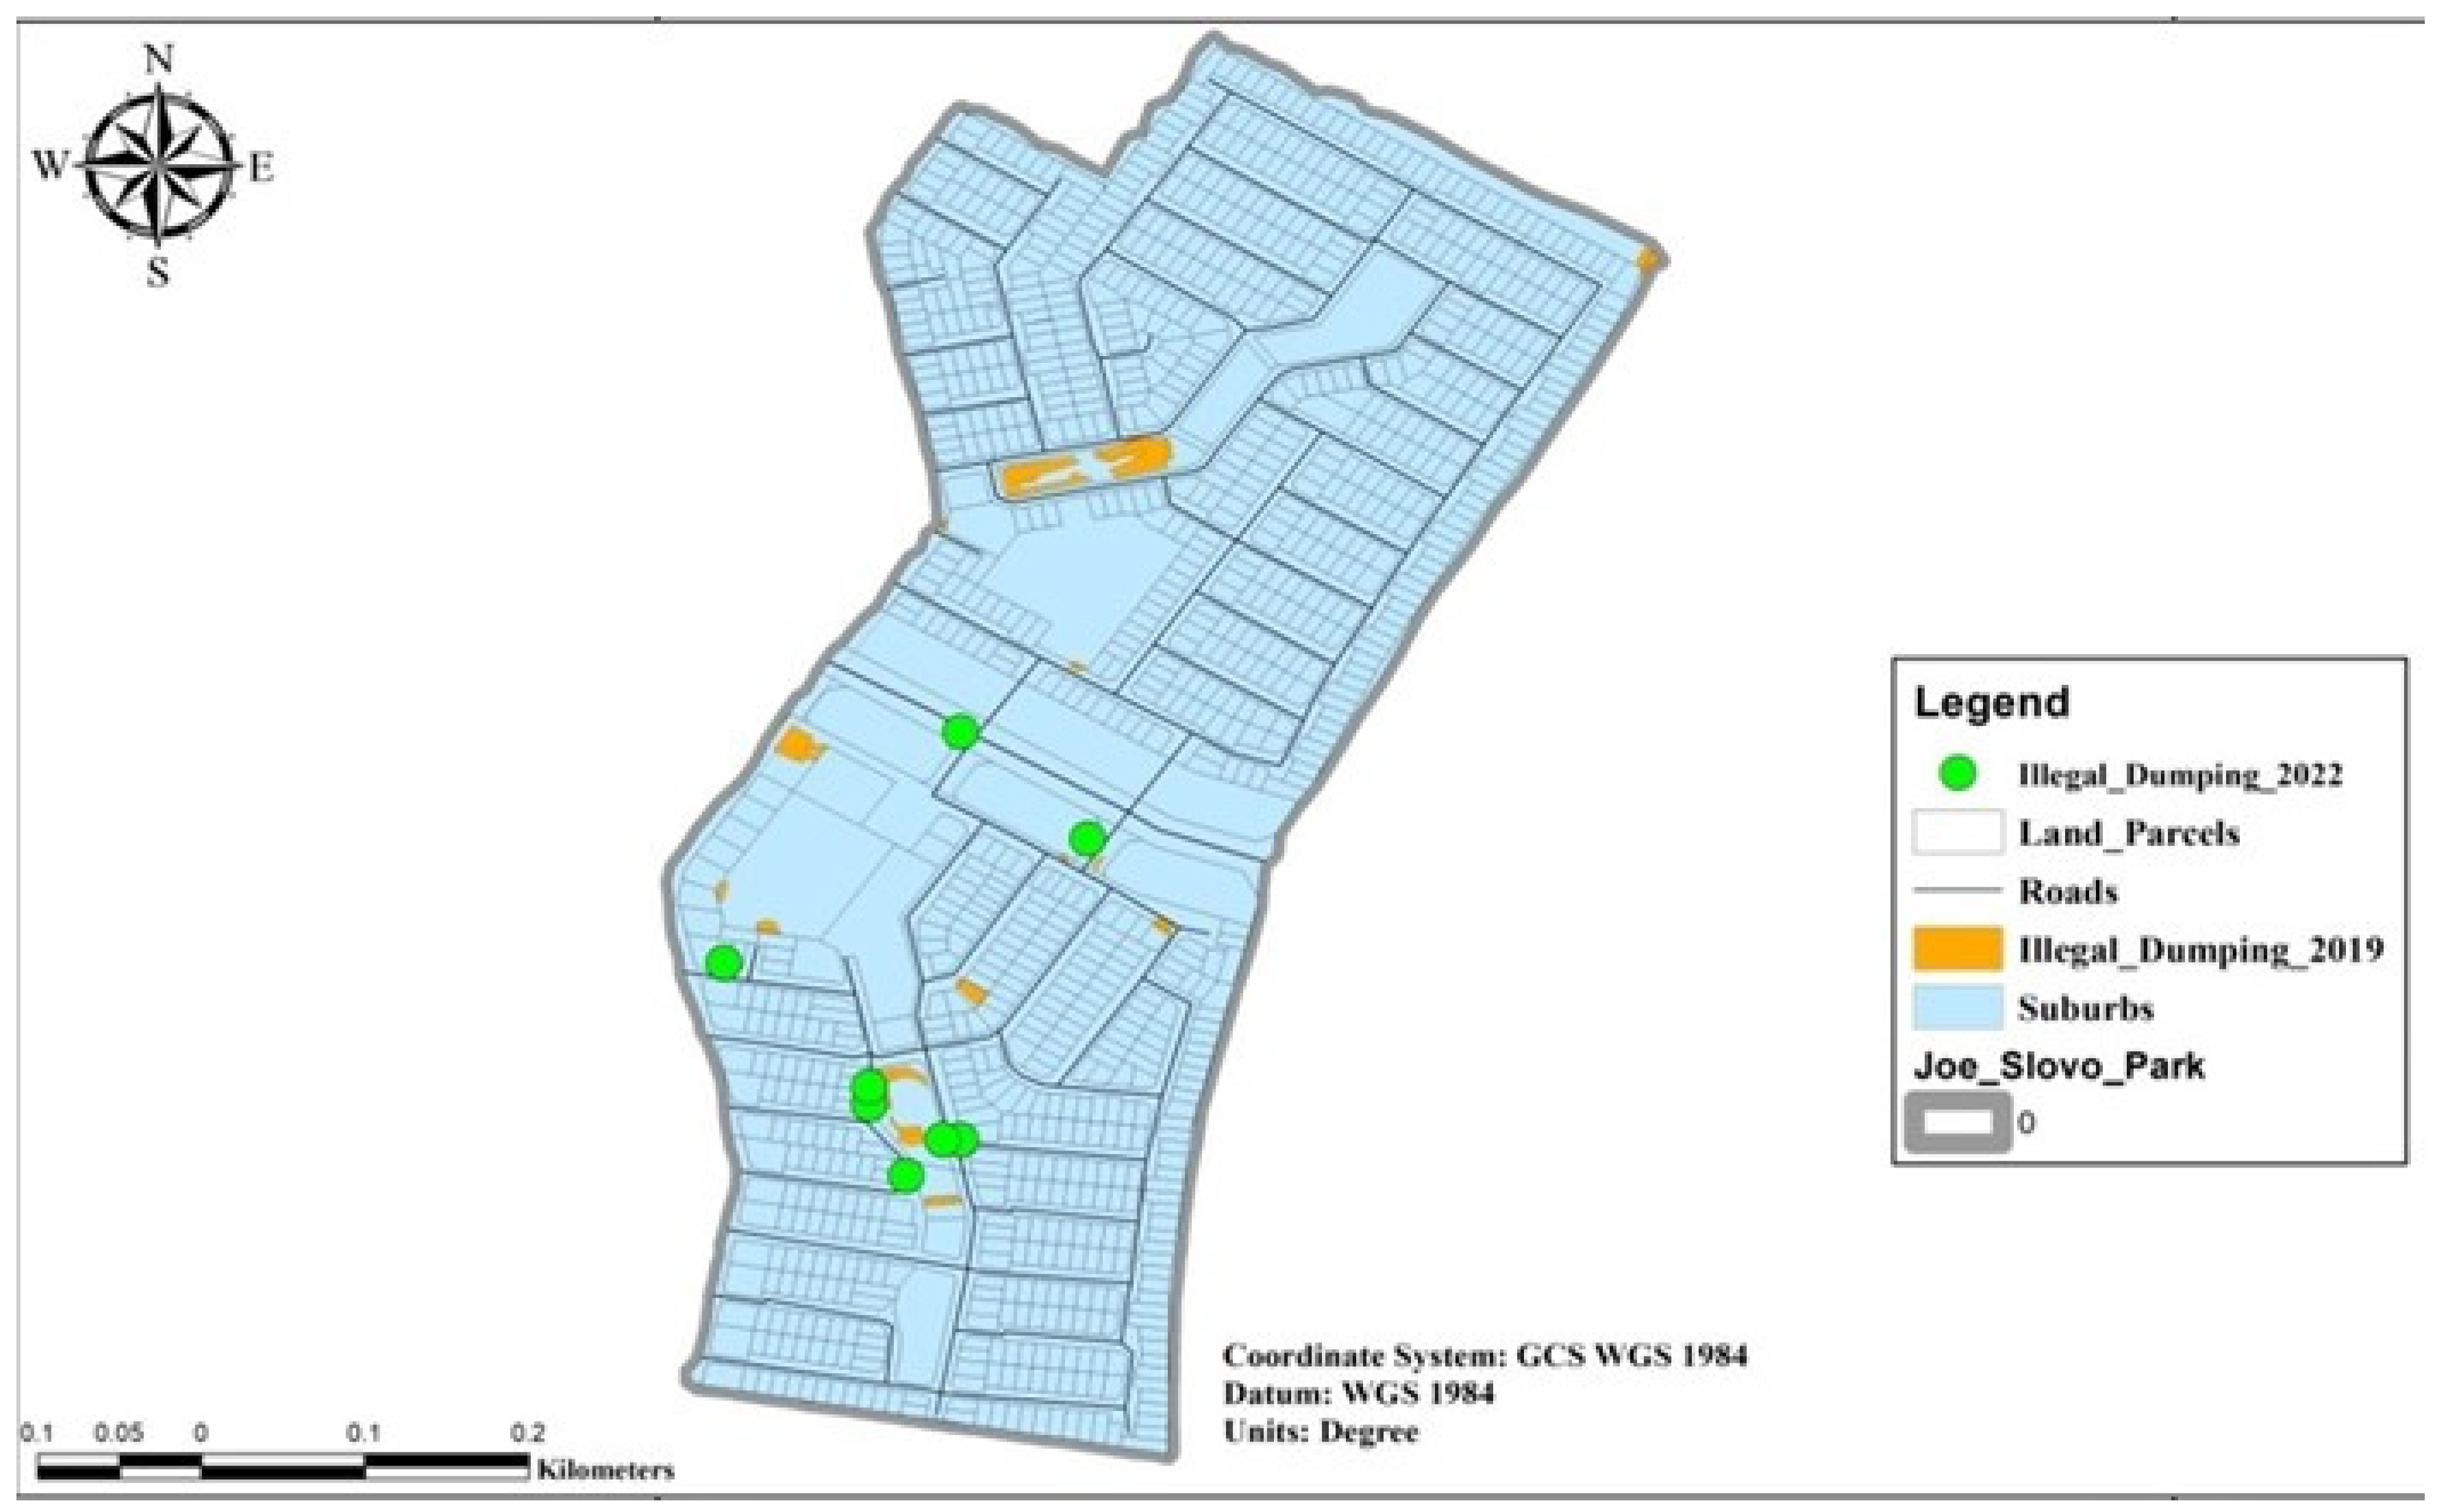
Figure 3 represents all the illegal dumpsites mapped for the years 2019 and 2022 in the Joe Slovo Park informal settlement. A total of 21 dumpsites were observed for both 2019 and 2022. The locations of the dumpsites for 2019 are represented by orange rectangles, while the green circles represent all the illegal dumpsites for 2022. Moreover, Figure 3 illustrates the spatial extent and distribution of illegal dumping in the Joe Slovo Park informal settlement. Figure 3 also demonstrates the density and clustering of illegal dumpsites in certain parts of the area as compared to other areas. It is also noted that most of the illegal dumpsites are situated along the roadside and behind the houses that are along the road; thus, proximity is a concern.
The map reveals that the vulnerability of these areas to informal settlements is generally high or significant, with dumpsites also visible in the field. Regarding factors that make areas susceptible to illegal dumping, the local context of spatial planning may play an important role. The map (Figure 3) depicts the changes in illegal dumping sites from 2019 to 2022; in 2019, there were more illegal dumping sites, but in 2022, the local government installed skips (bins) in those locations (green in Figure 3). Using the various criteria and constraints of the ArcGIS Network Analyst, various routing solutions were created. A heuristic approach (Dijkstra’s algorithm) was used to generate routing solutions. This method takes the location of large bins into account. The optimal solution (Figure 3) corresponds to a distance of 500 m traveled by the garbage truck, as opposed to the current distance of one kilometer. According to Karimi et al. [24], when evaluating the susceptibility of inhabitants to illegal dump sites, it is crucial to consider the spatial distributions of reserve areas and the maturity of the neighboring roadway network, since these factors may have more significance than the length of railways. The findings of the research revealed that the allocation of locations for irregular garbage disposal is not a random process but rather influenced by factors like the proximity of highways and buildings, land use patterns, and the physical characteristics of the area. The primary determinants that held the utmost importance were the ease of access and close proximity to a given location, along with the potential to effectively hide the dumping of waste materials. The presence of unlawful dumping is observable in areas situated behind shacks and along roadways. The observable alterations in the ecosystem and their consequential effects inside Joe Slovo Park are brought to light. Furthermore, in their study, Karimi et al. [24] suggest that the spatial distributions of reserve lands and the level of development of neighboring roads may have a greater impact when measuring the susceptibility of inhabitants to illegal dumping sites compared to the length of railways. The findings substantiate the notion that the process of delineating unlawfully disposed garbage may effectively aid the local government and the community in addressing the predicament of illicit dumping while also facilitating the monitoring of its recurrence in Joe Slovo Park. The observable alterations in the ecosystem and their consequential effects in Joe Slovo Park are brought to light.
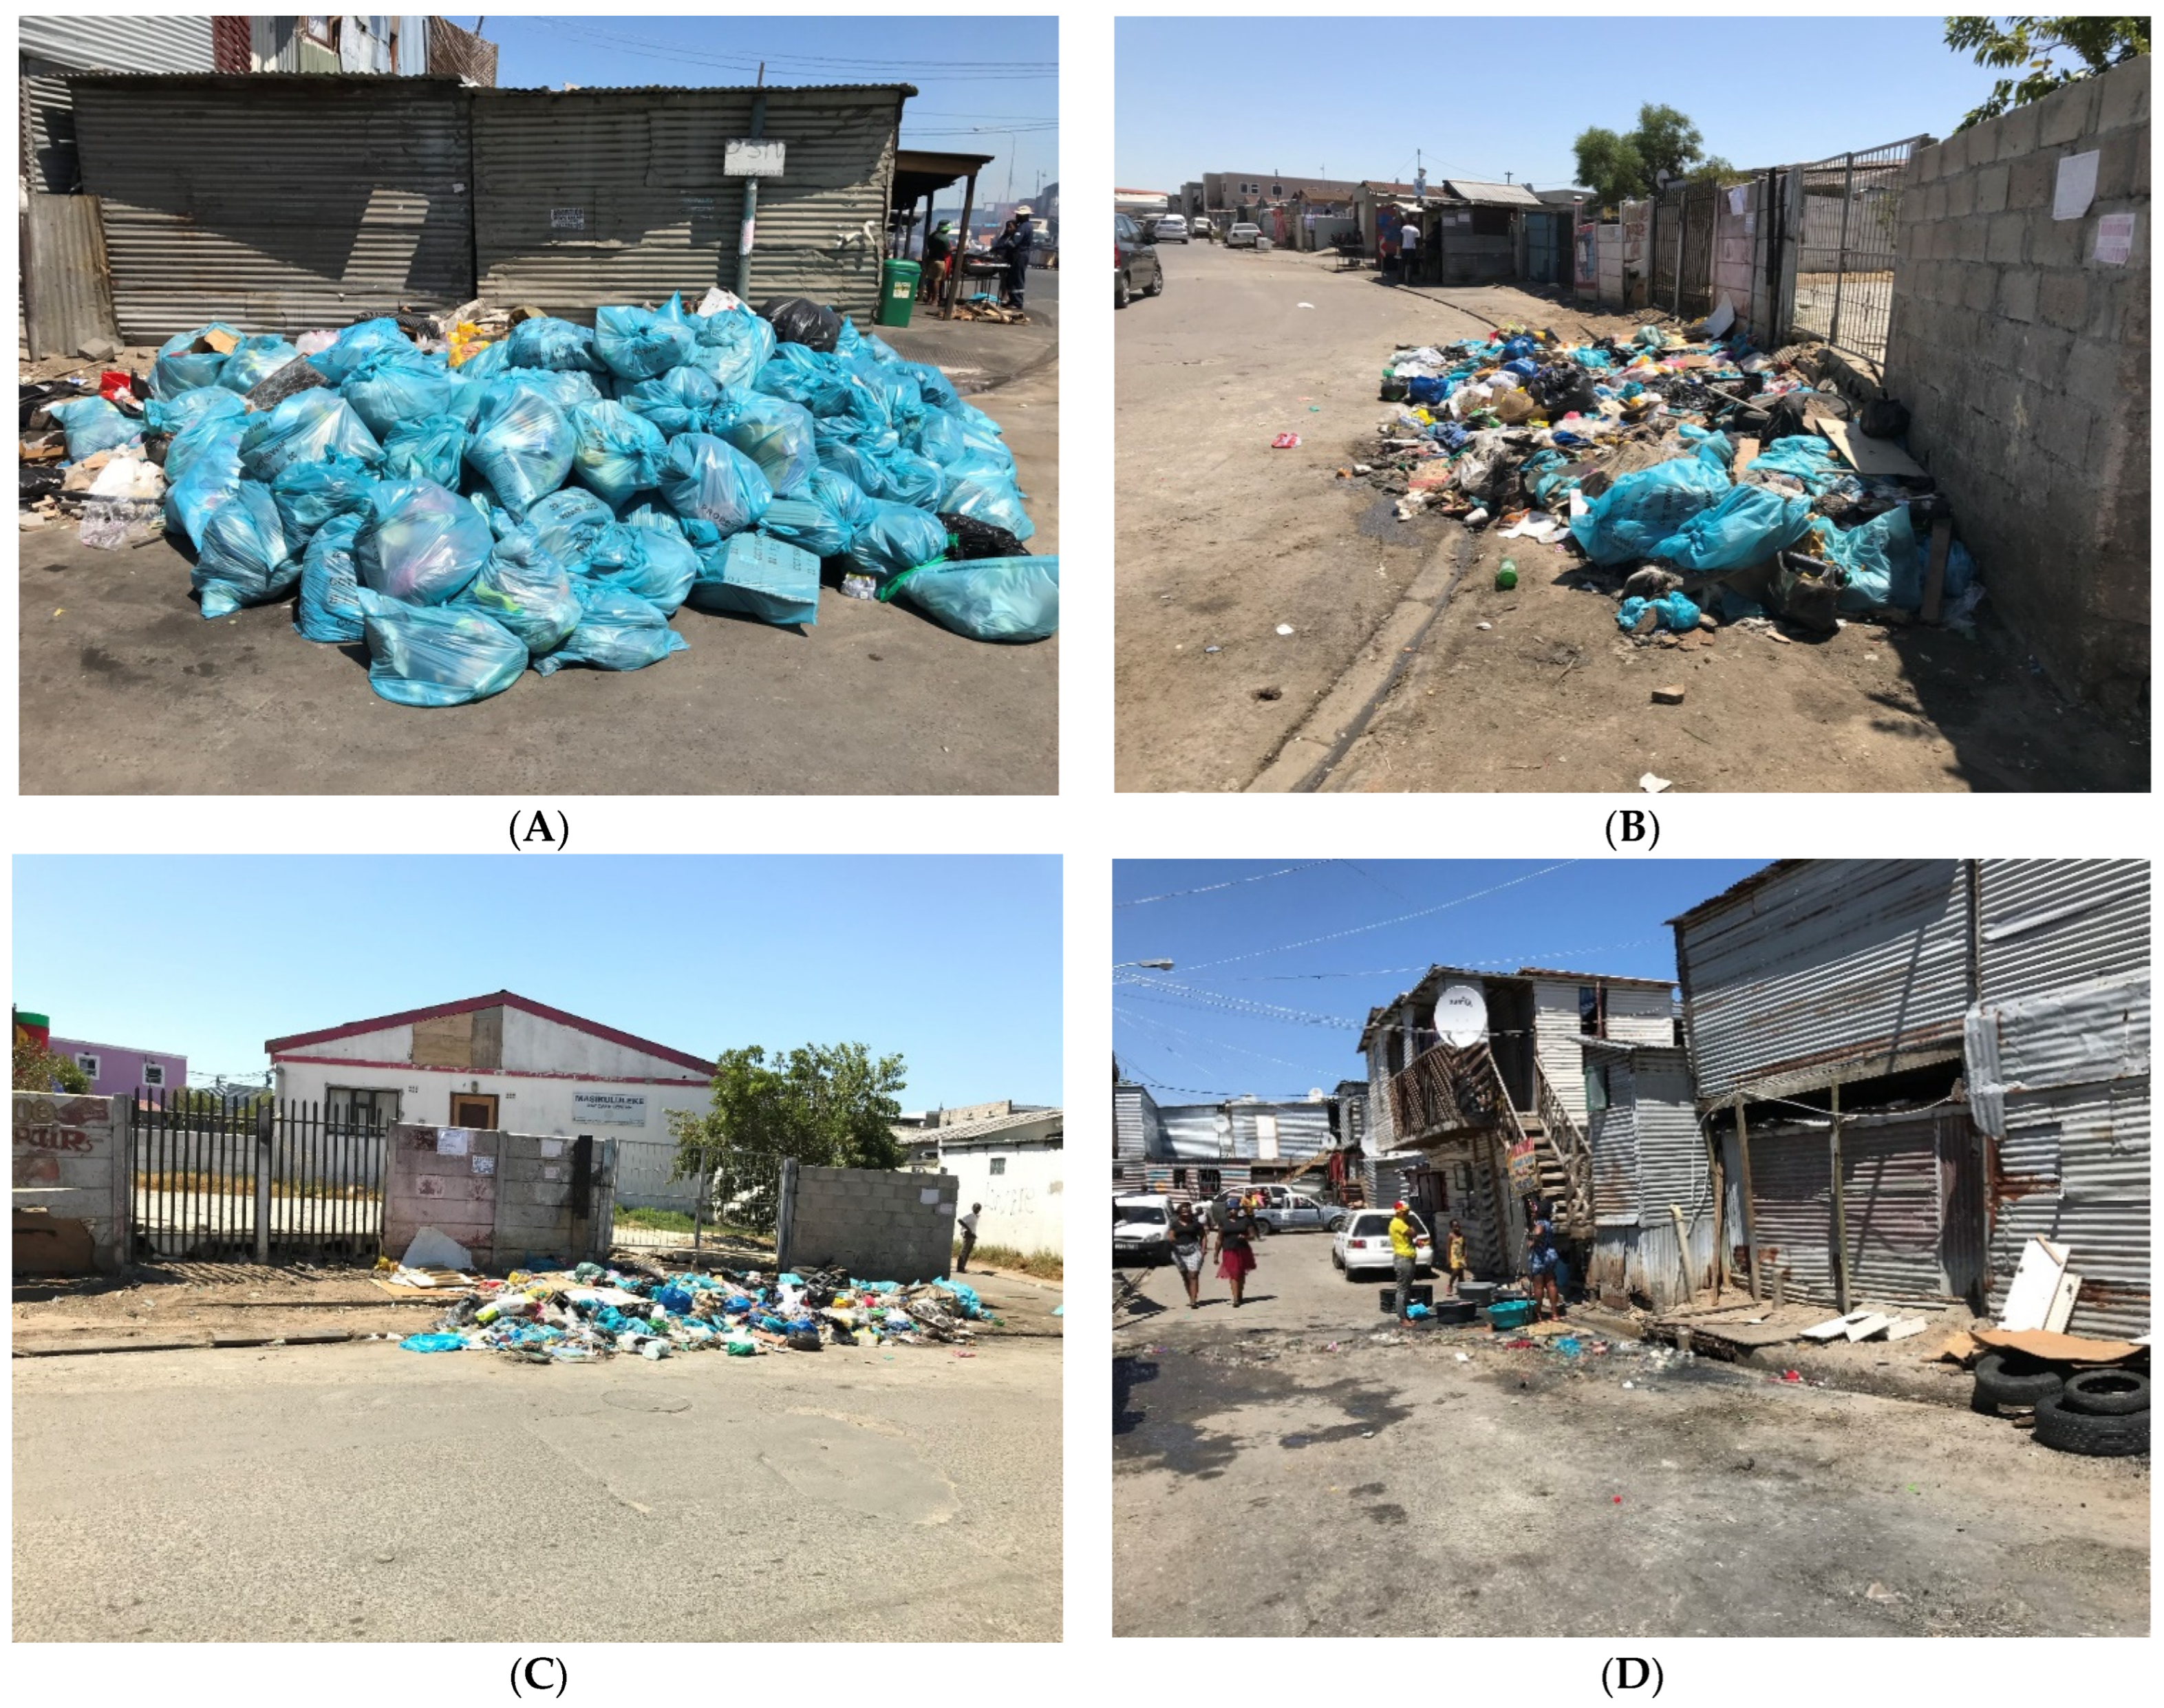
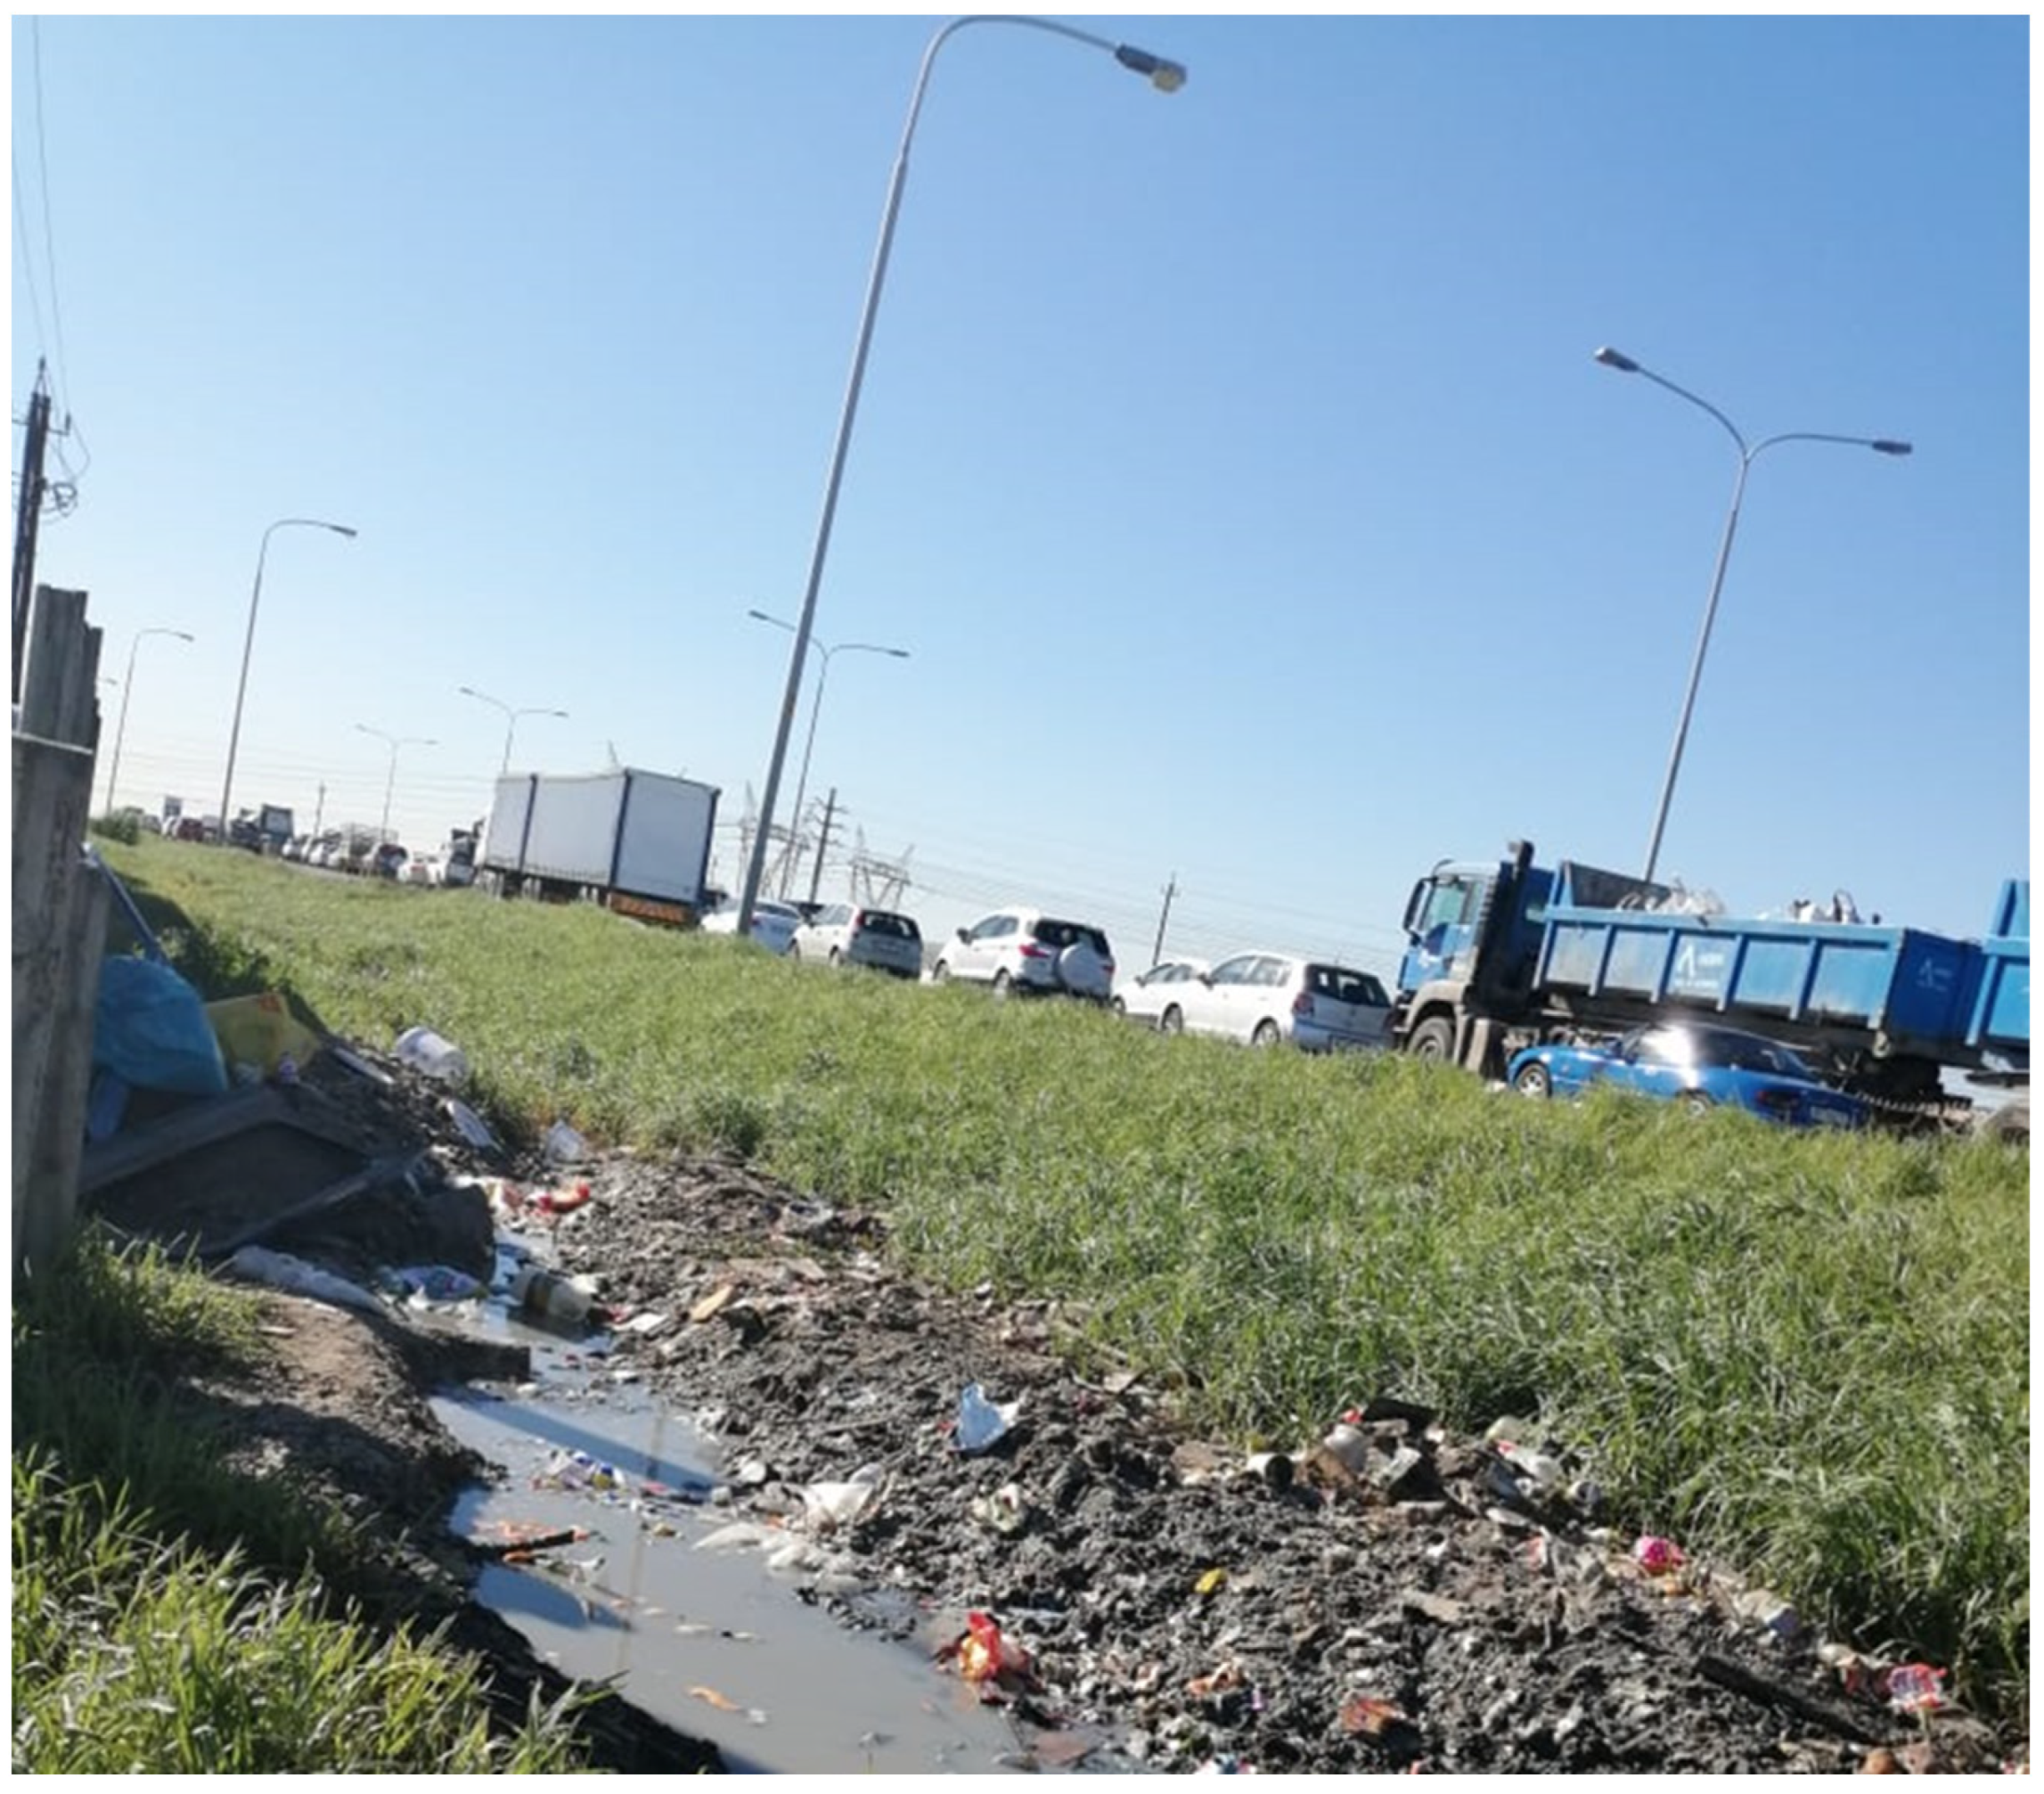
The photographs taken during the field research, as seen in Figure 4, demonstrate the widespread occurrence of illegal dumping next to roads and behind makeshift dwellings. This demonstrates the dynamic transformation of and impact on the ecosystem of Joe Slovo Park. According to Ichinose and Yamamoto [12], trash that is left unattended, particularly in open areas, leads to the buildup of waste, resulting in disease outbreaks and unpleasant smells. Considering the aforementioned, this leads to a decline in the environmental aesthetic and a lack of appeal.
The majority of inhabitants, accounting for 56.82%, own garbage cans that are supplied by the municipality, whilst 43.18% do not have access to such provisions. A follow-up question was posed regarding the disposal of waste by those without bins or garbage bags, as they lack the means for temporary storage (bins). In addition, those who have access to bins reside in informal settlements (RDP houses), whereas those who use plastic bags reside in unplanned settlements (shacks). Consequently, in the unplanned settlements, it was discovered that waste collection varies, and while residents must send their trash to waste containers, some opt to place their trash next to their homes for waste collectors to collect. In addition, some residents described the distribution of disposable domestic plastic bags, but only to those who are friends with trash collectors. Therefore, waste collection is a crucial component of every waste management system, as the lack of a collection system in Nepal’s informal settlements exacerbates the waste problem [44]. This is the situation in Joe Slovo Park’s unplanned settlement, where residents claim the municipality does not provide enough plastic bags for waste disposal, and waste pickers sell disposable domestic plastic bags. As a result, it has been observed that they dispose of trash along the street illegally. This information explains the occurrence of the orange-colored illegal dump sites depicted in Figure 3. The respondents stated that they do not have access to these waste containers, so they dump trash next to them for the waste collector to collect. According to Tadesse et al. [45], waste dumping in open spaces increases when there is an inadequate supply of waste containers in an area and a long distance to those containers. The respondent(s) further explained that the municipal plastics are not supplied regularly, and the people responsible for the distribution of the plastics sometimes decide to distribute them at an extra cost than usual, which becomes a problem since the majority of the residents are unemployed. Therefore, it remains a challenge for the community to dispose of waste in a suitable manner, which forces them to adopt other ways of disposing. In the absence of waste containers, this can be the leading cause of illegal dumping in unplanned communities.
3.2. Proximity Evaluation of Illegal Dumping
This study considered a number of variables, including distance from buildings, proximity to existing road networks, proximity to water sources, slope steepness, and elevation. According to Saaty [34], each criterion was broken down into sub-criteria and assigned a suitability rating value between one and nine. The study confirmed that the proximity of roads and buildings, land use, and topography affect the distribution of illegal waste disposal sites. Accessibility, proximity to a site, and the capacity to conceal waste disposal were the most important considerations.
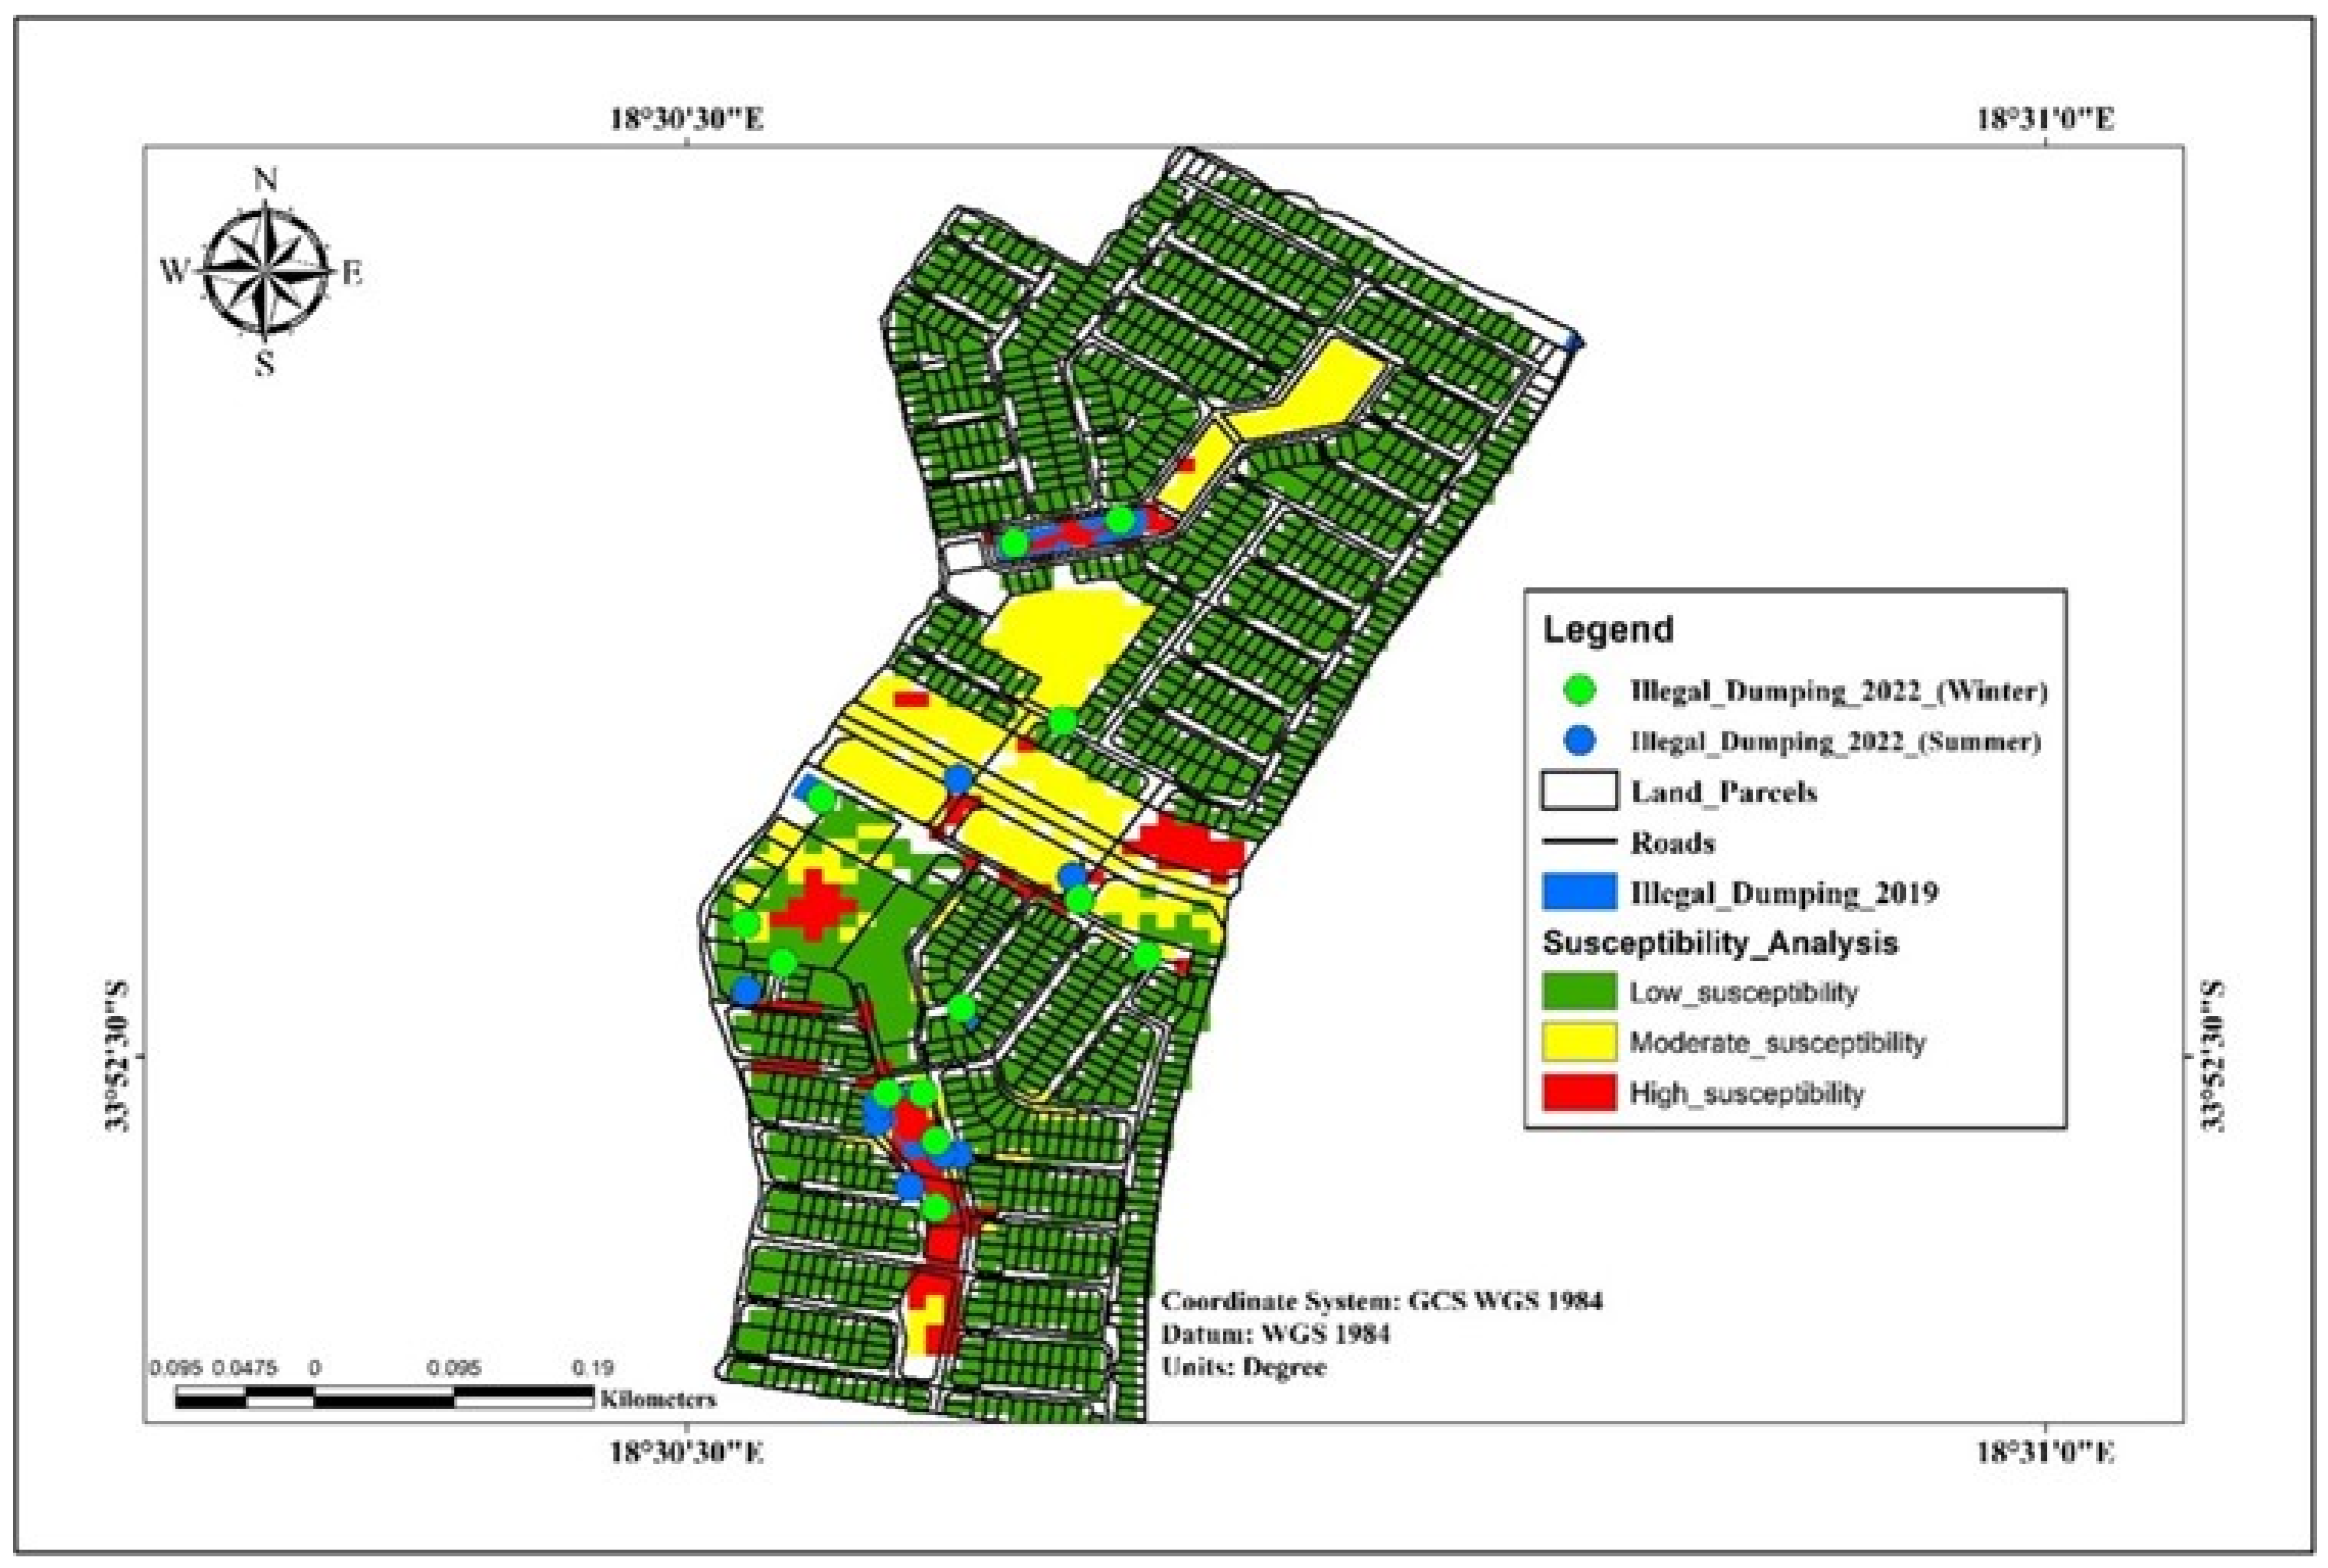
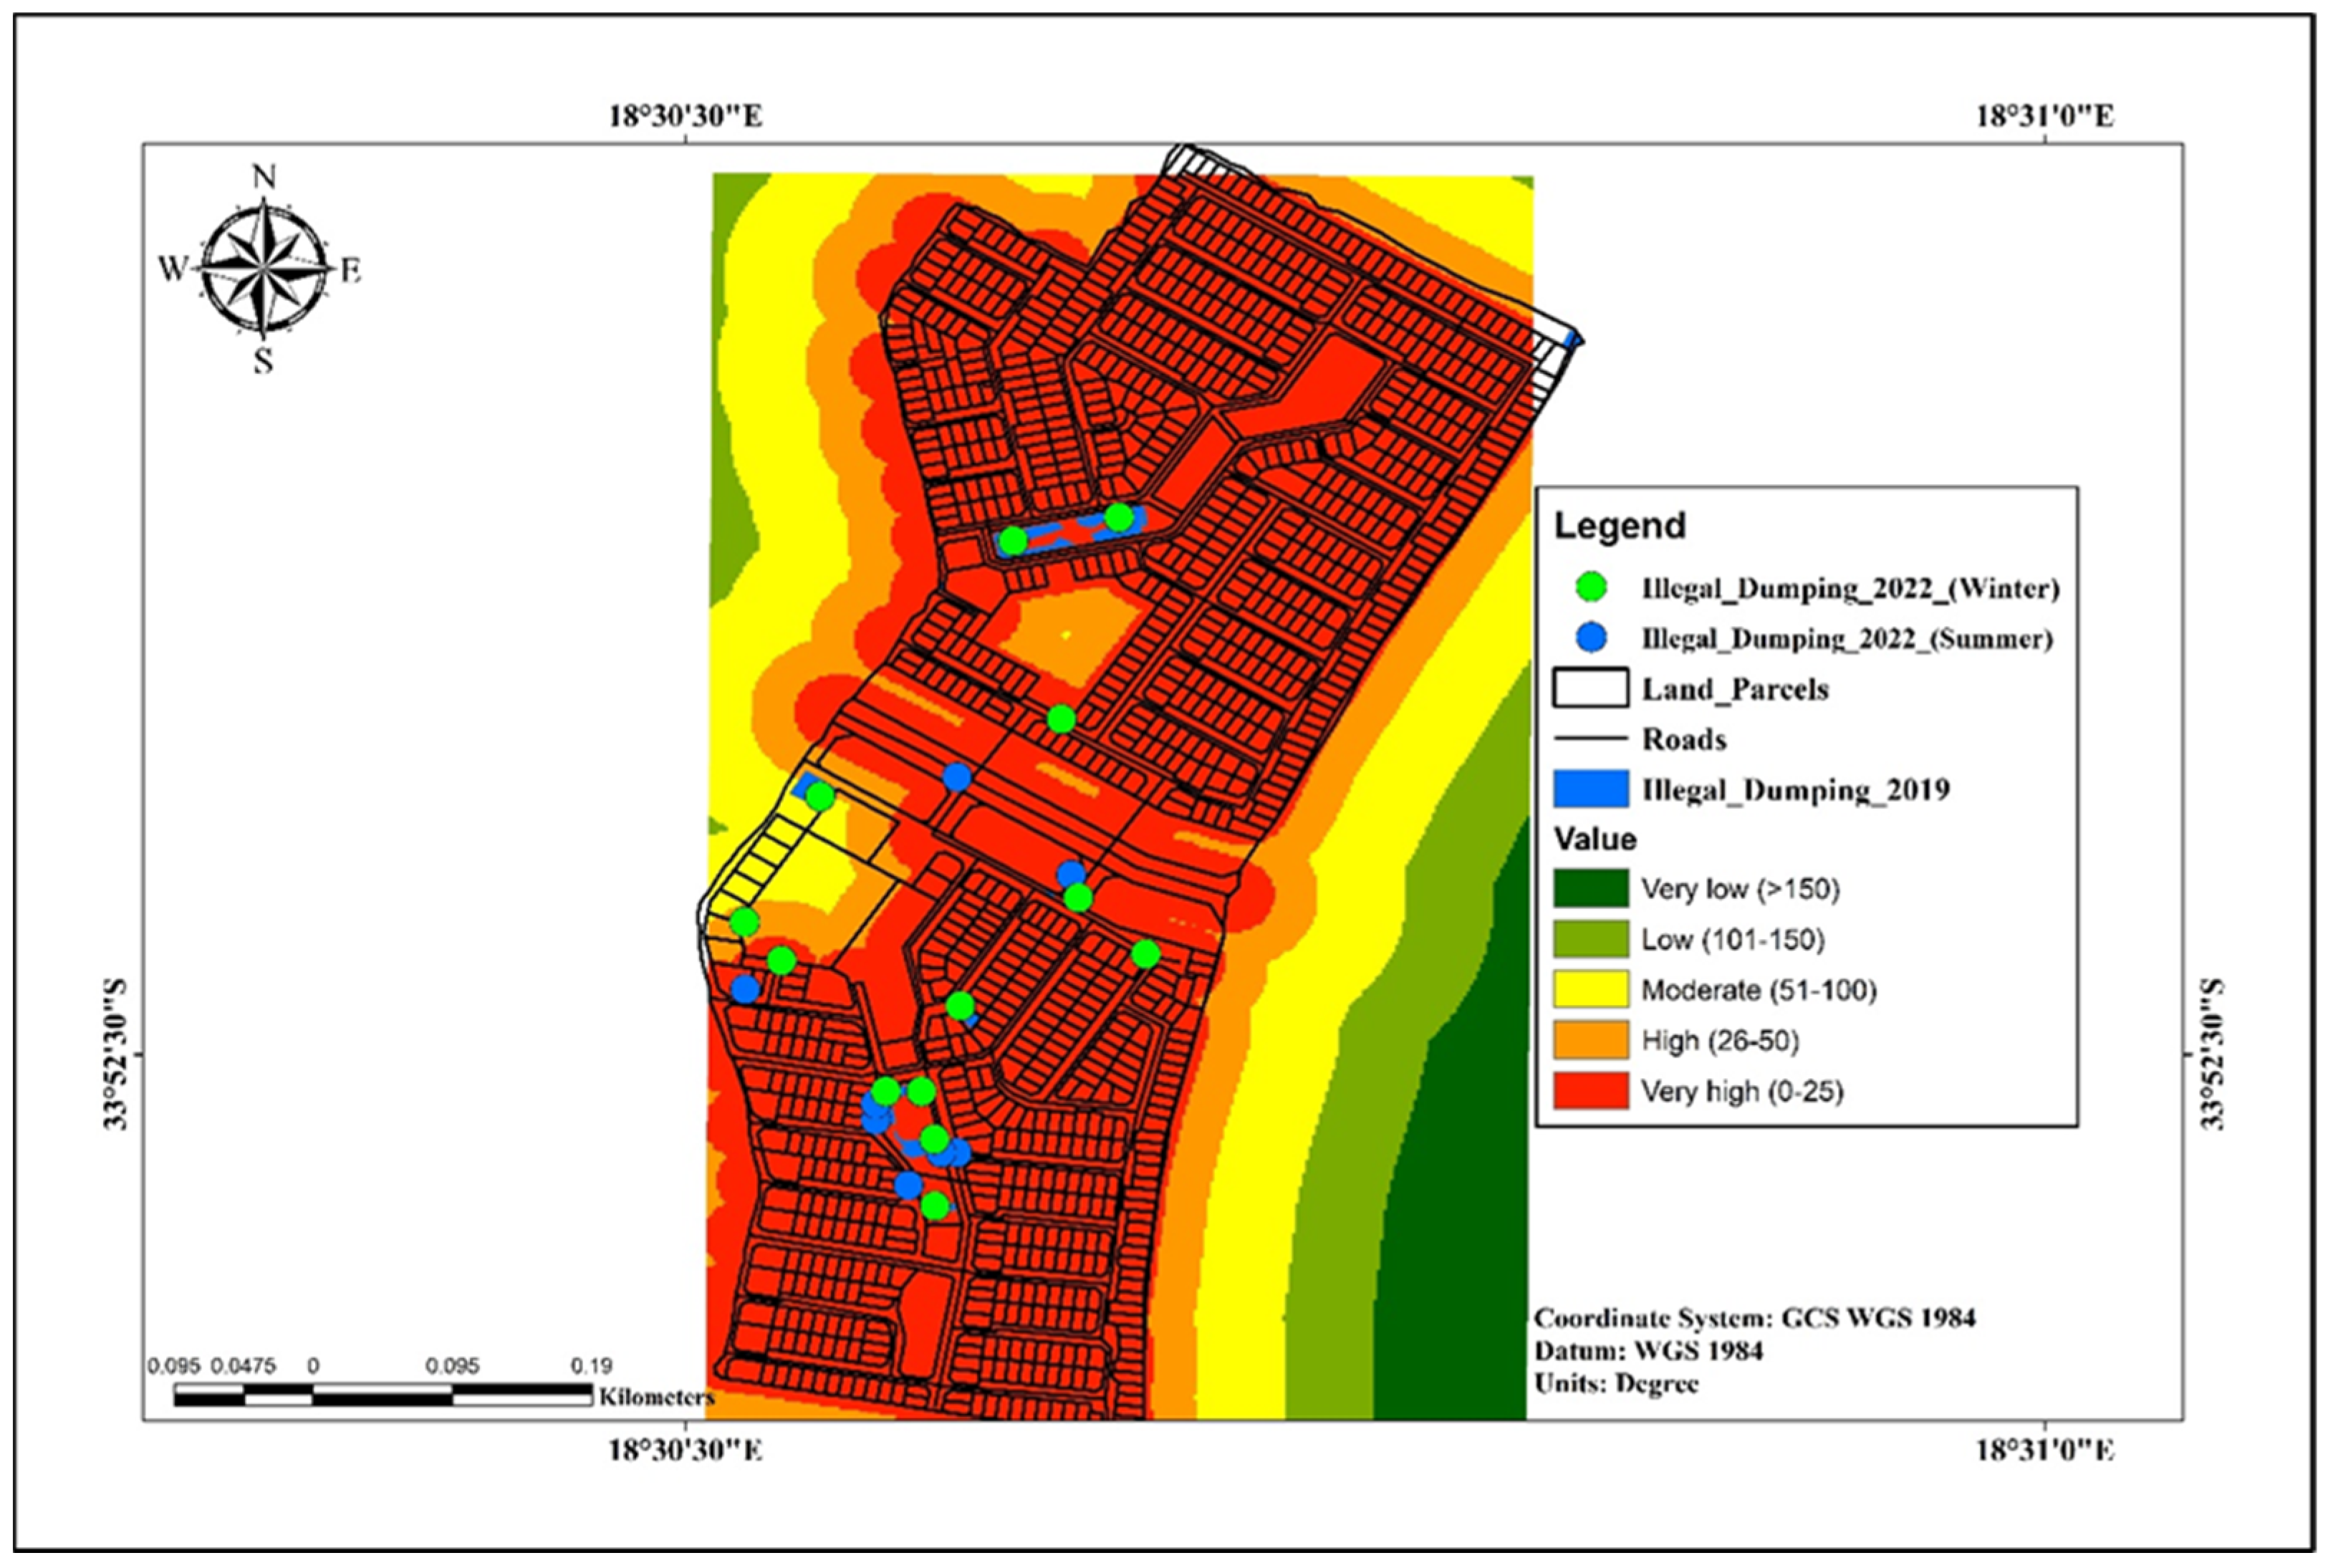
GIS techniques demonstrate how the local geographical conditions of the study area influence the gradient of waste dumping vulnerability. The most vulnerable lands are those within buffer zones of 250 to 500 m from built-up areas (Figure 5 and Figure 6). Additionally, from the results of the proximity study on regions exhibiting a high vulnerability to unlawful dumping, these regions are specifically situated inside the confines of the settlement. Moreover, the results from the proximity analysis show that areas that have a slope that is greater than 30% are less susceptible to illegal dumping compared to areas that have a slope of 0,8%, which are very susceptible (Table 3). This is in line with a study by Karimi et al. [24], whereby their results showed that the road density observed in the identified probable illegal disposal locations varied between 0.098 km/km2 and 0.251 km/km2. The data analysis revealed several significant characteristics. The location and density of illegal dumping in the test area were affected by the accessibility of streets and the availability of vacant land. It was discovered that the majority of individuals reside in formal settlements (RDP houses), while others reside in unplanned settlements (shacks). This is in contrast with Figure 6, which demonstrates that the areas most susceptible to illegal dumping are those on the settlement’s eastern side that lack spatial planning and are characterized by shacks. People without garbage bins reported dumping near the N7 freeway and, in some cases, behind their homes for waste collectors to collect (Figure 5 and Figure 7). This is in contrast to another study [46] that showed that French citizens do not use wastebaskets; rather, they empty their garbage into large municipal skips. The residents do not have access to municipal waste containers, and there are no nearby open skips.
Moreover, according to Polasi [18], the level of education correlates with the level of comprehension regarding the repercussions of illegally dumping waste in open spaces. Each point was labeled according to whether it fell within the predicted areas on the printed layout. The analysis revealed that 52 dumpsites were in the red zone of the model, indicating that illegal dumping is highly likely in this area. There were 27 sites in the yellow zone, indicating that dumpsites are probable in this region with moderate risk. The 14 open dump sites appear to be located relatively far from the outer settlement, indicating that the collection systems are concentrated primarily in the outer settlement. In addition, the twenty sites with containers and ground dumping suggest that these sites have insufficient containers and may need additional containers to eliminate or reduce ground dumping. Jakiel [27] examined the changes in the location and timing of irregular waste disposal sites in a natural reserve over a span of 22 years. The investigation revealed that the distribution of irregular waste disposal sites is not random but rather controlled by factors such as proximity to roads and buildings, land use, and topographic position. The primary factors of significance were the accessibility and proximity of a location, together with the capacity to conceal waste disposal. A more effective approach to evaluating the vulnerability of residents to unlawful dumping sites might include analyzing the spatial patterns of open areas and the surrounding road network.
3.3. The Demographic Profile of Joe Slovo Park Informal Settlement
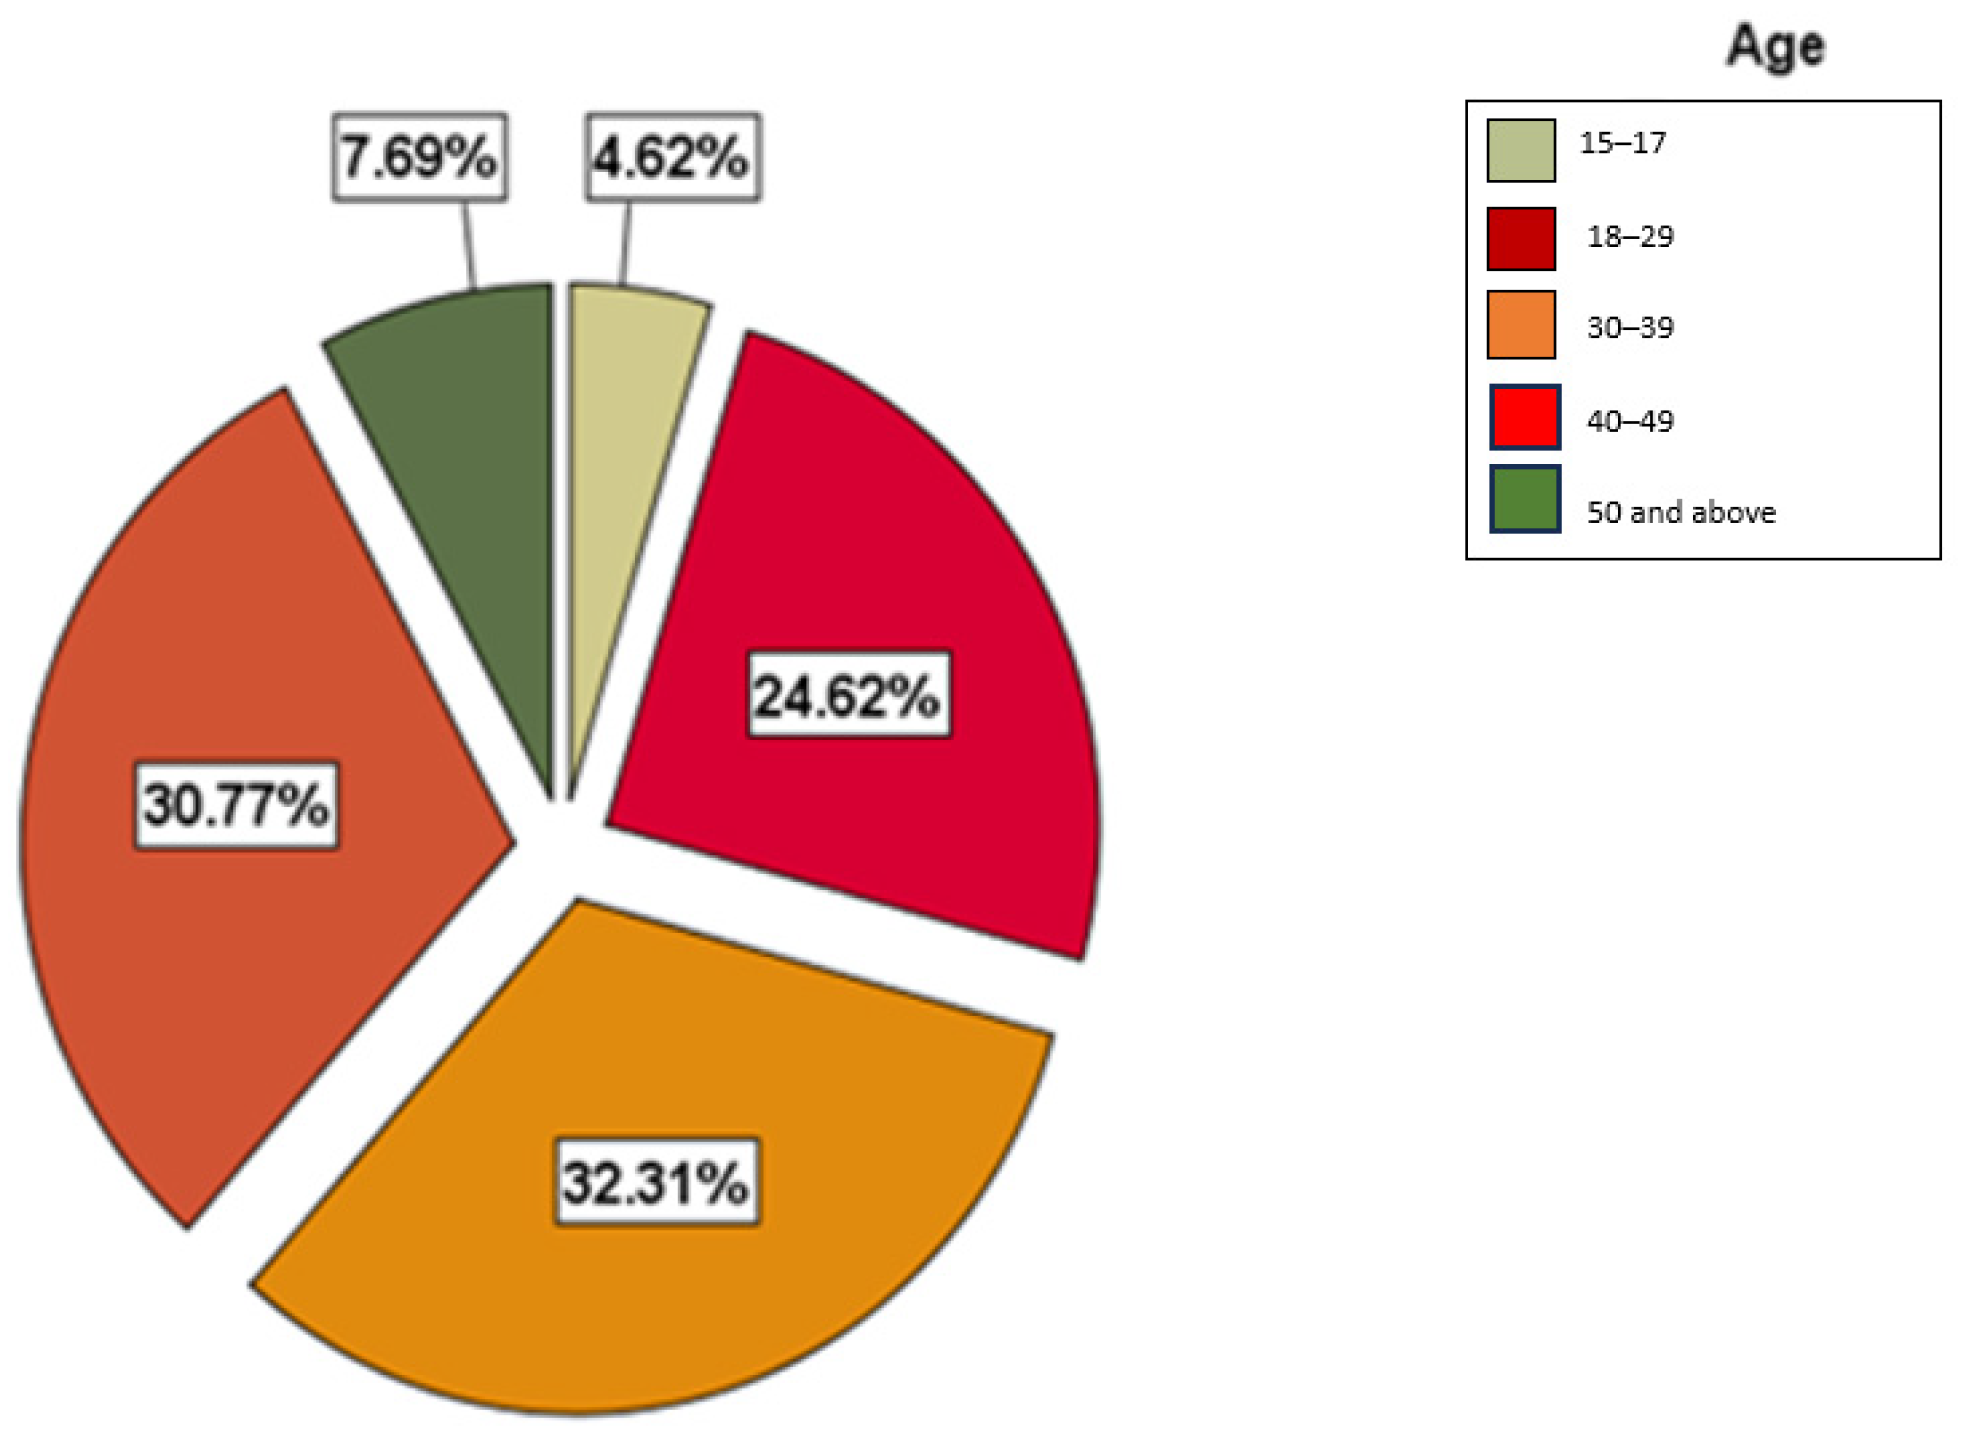
This study administered questionnaires to households in Joe Slovo Park’s informal settlement to find out the nature of their waste management issues at the level at which the community understands and identifies solid waste management in their area. The majority of the participants (32.31%) ranged between the ages of 30 and 39 years, as shown in Figure 8. This shows that most of the community members of Joe Slovo Park’s informal settlement are middle-aged. Therefore, it is safe to state that the Joe Slovo Park community is mostly dominated by respondents between the ages of 30 and 39, followed by respondents between the ages of 40 and 49. In addition, 56.92% of the participants in this study were females, whilst the other 43.08% were males. This basically means that there are more females than males in Joe Slovo Park’s informal settlement. Similarly, Mbonambi [47] indicates that the overall statistics of South Africa report more females than males. Therefore, as a result, most households are headed by females, with one of the reasons being that men generally migrate to work in other cities.
Research on illegal waste disposal has revealed that the occurrence of illegal dumping is primarily linked to the level of advancement in waste removal systems, the expenses associated with legal waste disposal, the efficacy of monitoring and penalties, and the overall public awareness and acceptance of illegal dumping within society. The information above correlates with what was found by Hanfman [48]: an insufficient supply of waste containers in an area and a long distance to those containers increase waste dumping in open spaces. Therefore, this can be a major cause of illegal dumping in unplanned settlements due to the lack of access to waste containers. Therefore, a crucial step in every waste management system is waste collection, as it was found in Nepal that a lack of collection systems throughout an informal settlement worsens the waste situation [49].
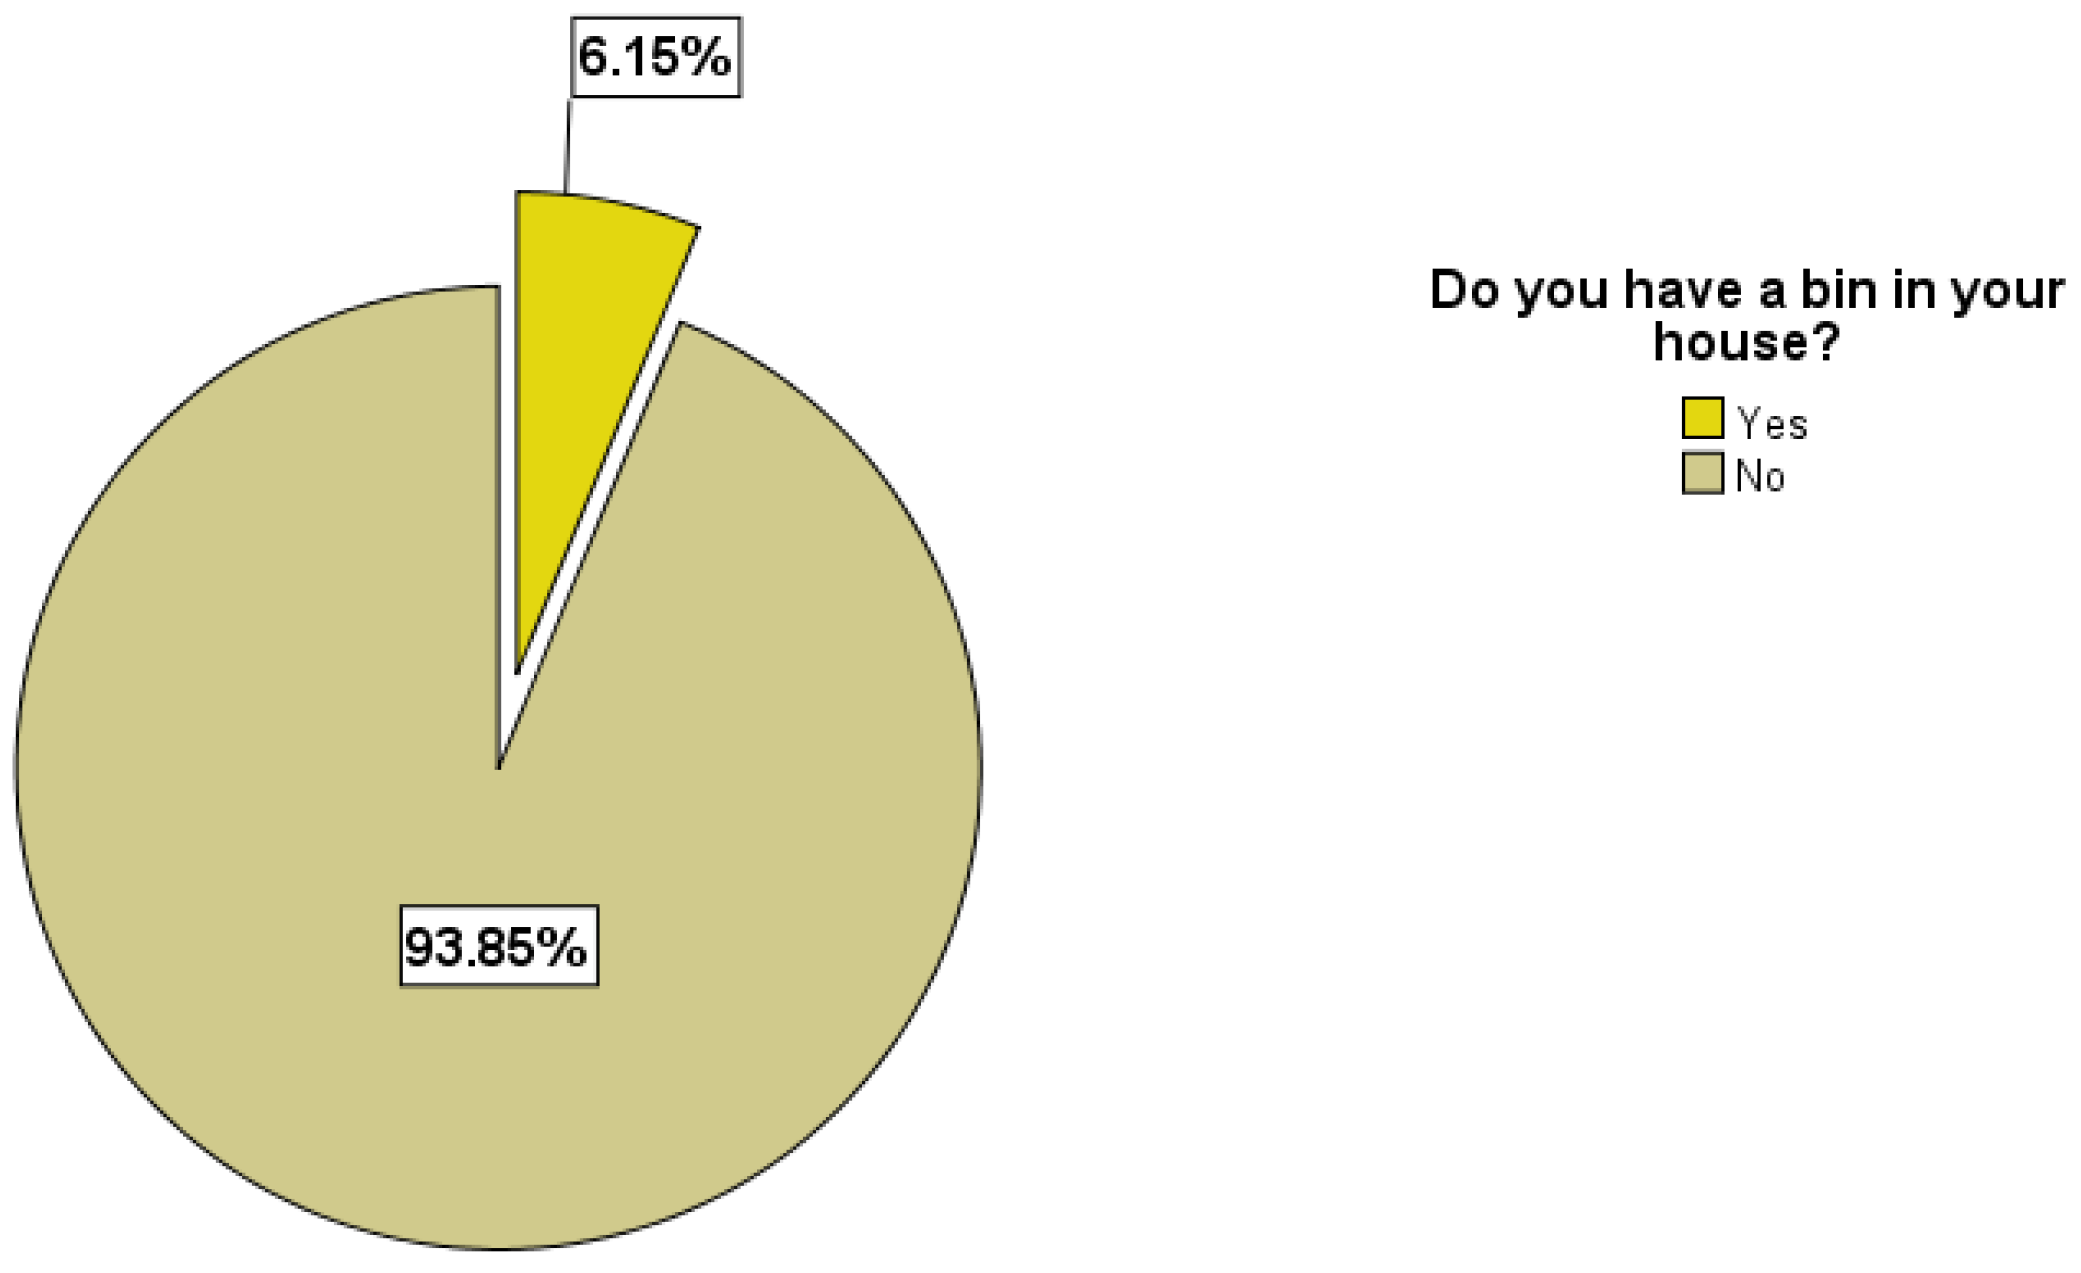
3.4. Residents Who Have Access to Waste Disposal (Bins)
The participants were asked whether they have bins for waste disposal. A significant 93.85% of the respondents reported not having bins in their homes, while the remaining 6.15% stated that they had purchased bins because the municipality only provides plastic bags (Figure 9). According to the observations collected in this study, it was discovered that Joe Slovo Park’s inadequate solid waste management is primarily due to improper disposal practices, including the absence of waste bins. According to Ichinose and Yamamoto [12] and UNEP [50], one of the main causes of the prevalence of illicit waste disposal is the absence of waste bins, which prompts individuals to seek alternative methods of disposal.
The participants were asked about their disposal method in the absence of a bin. Out of the households surveyed, a significant majority of 75.4% (Table 4) reported utilizing municipal plastic bags and depositing them in designated green municipal containers (refer to the photos in Figure 4). Conversely, a smaller proportion of 13.8% admitted to discarding their garbage in open spaces, as depicted in Table 4. The respondents elaborated that the municipal plastics are not consistently provided, and the individuals in charge of distributing them occasionally choose to distribute them at an additional expense compared to usual. This poses a problem as the majority of the residents are unemployed. Hence, the community continues to have difficulties effectively managing garbage disposal, compelling them to resort to alternative methods of waste disposal. However, 75.4% of the respondents who reported using a container stated that it becomes inaccessible over weekends due to being locked. The reason for the container being closed exclusively over weekends is still unclear.
3.5. The Perception of Illegal Dumping Impacts on the Environment and Health in Joe Slovo Park’s Informal Settlement
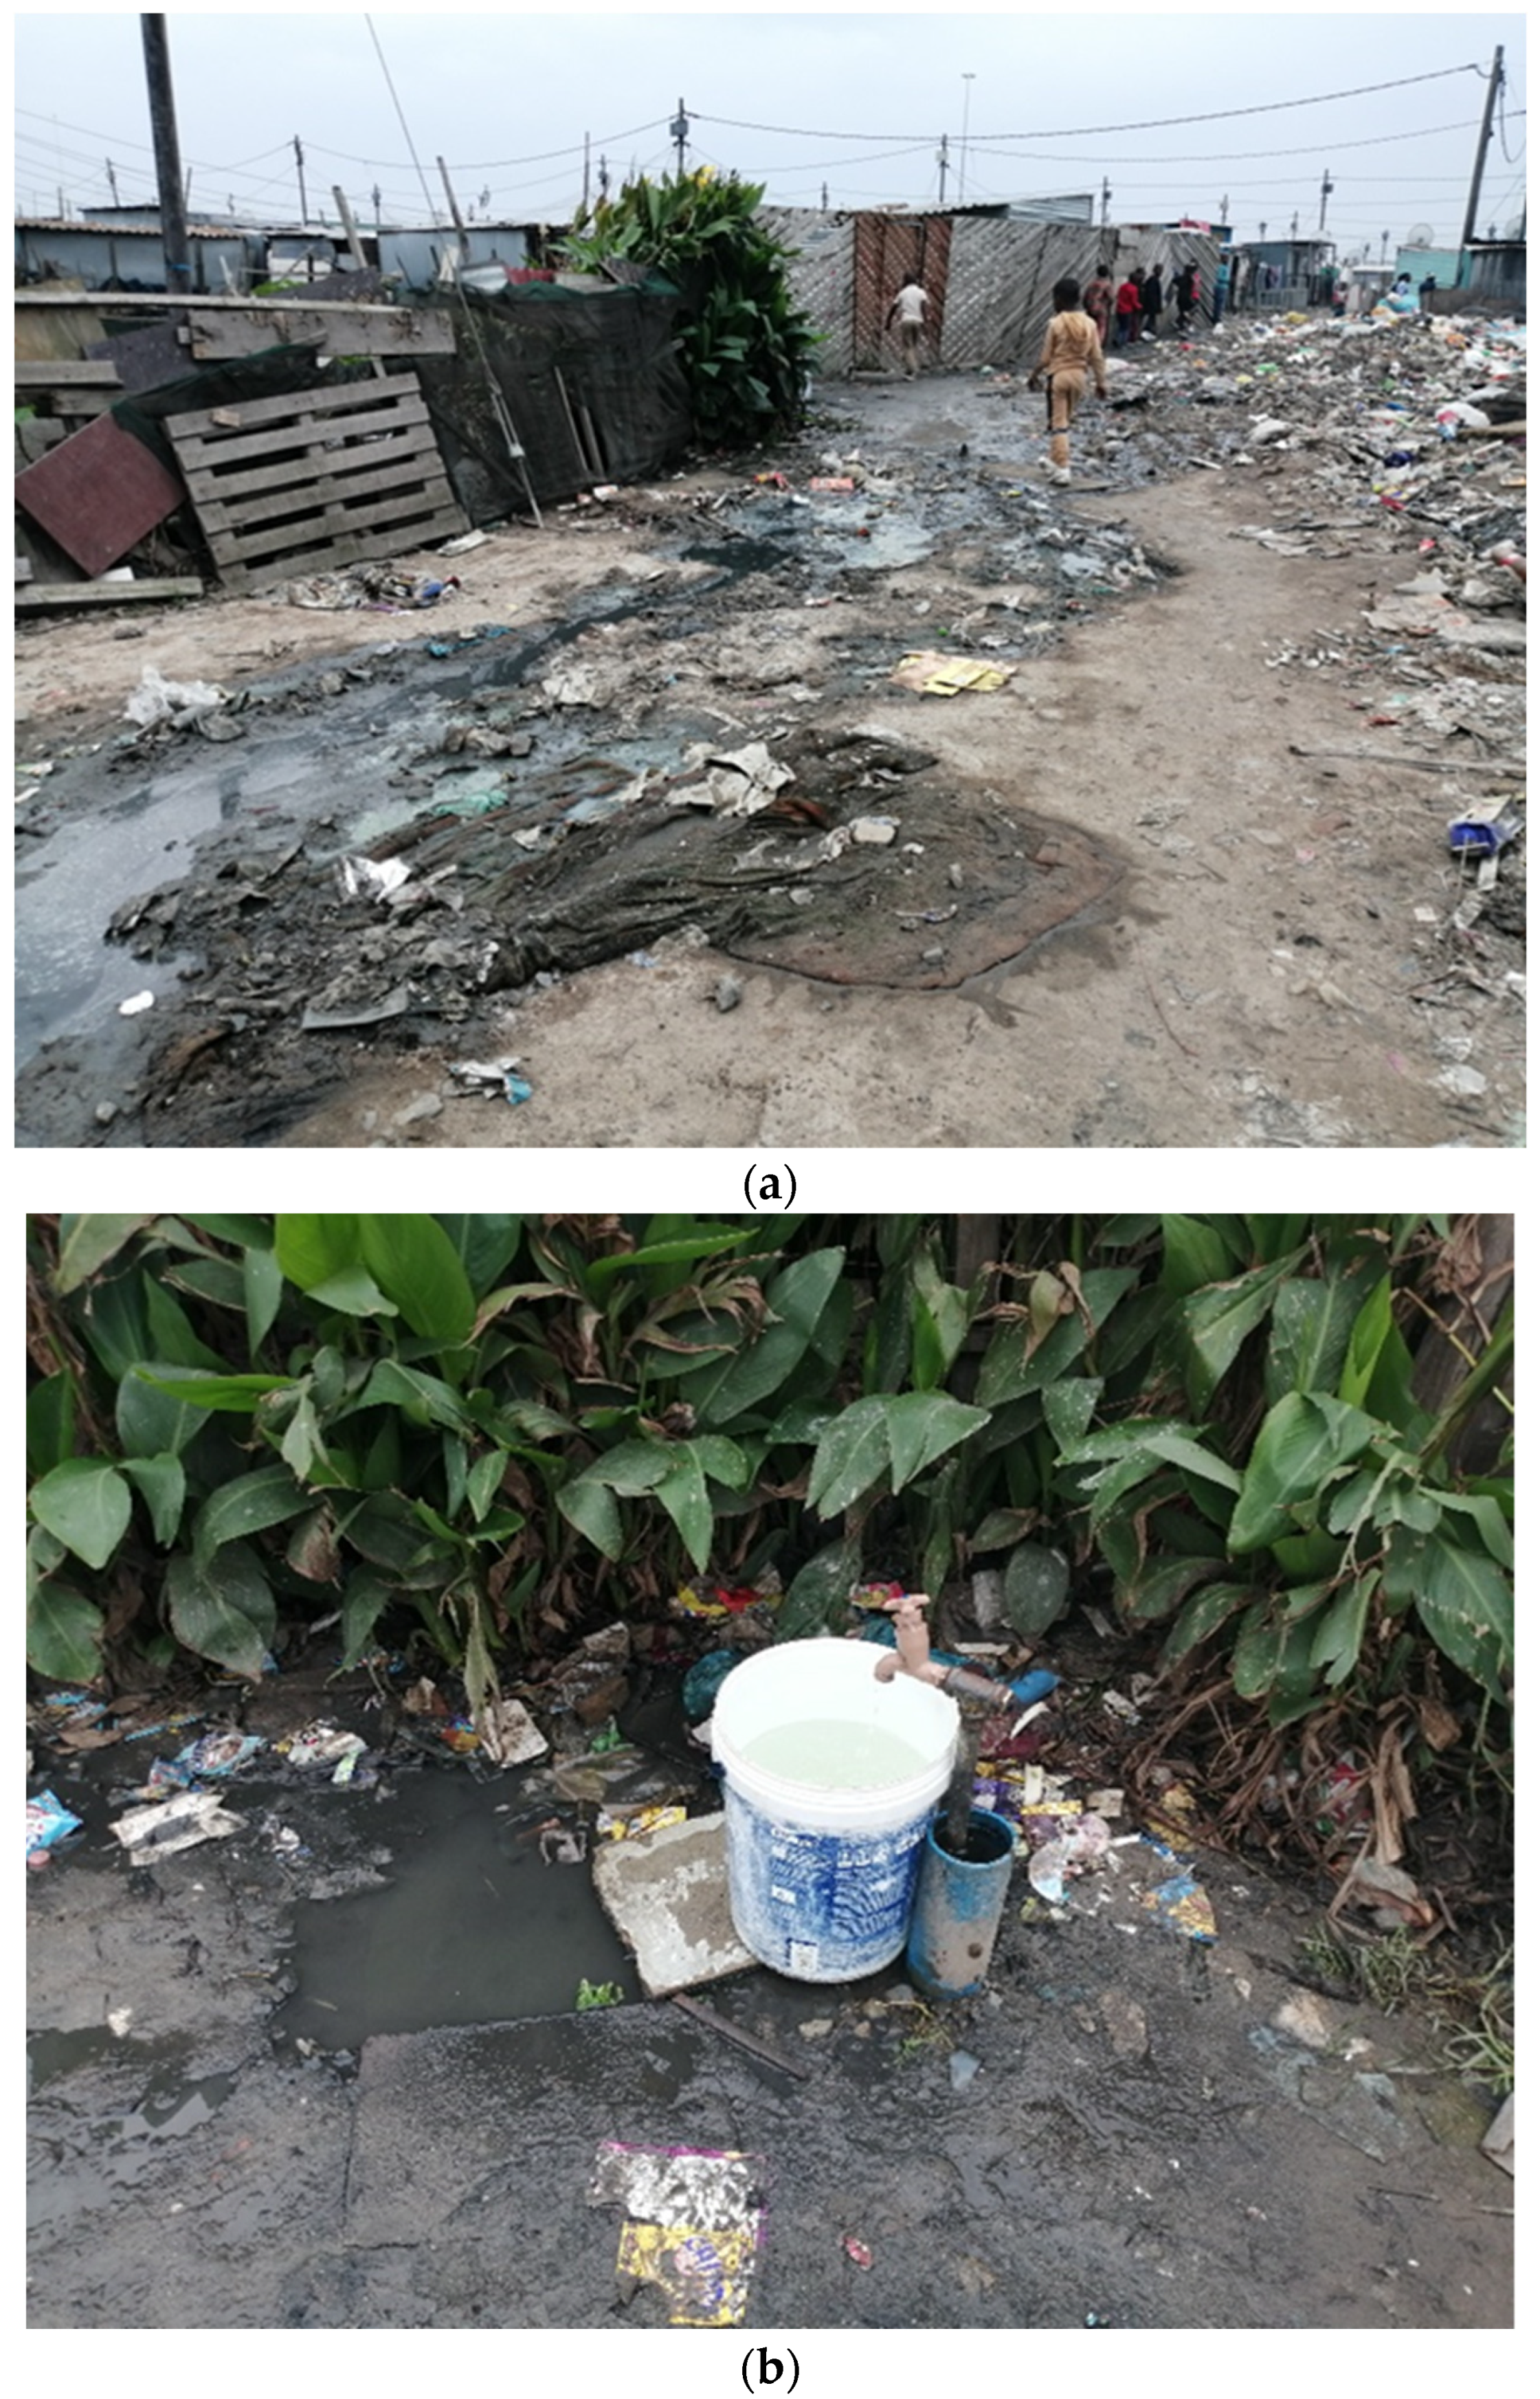
The key findings indicate that solid waste management in Joe Slovo Park’s informal settlement remains poor. This was observed after 98.46% of the respondents clearly stated that waste is lying all over the area and has the potential to affect the environment as well as health. According to the participants, they reported instances of unpleasant odors that have a negative impact on air quality, as well as incidents of rats entering households and the presence of flowing water in pedestrian walkways due to obstructed drainage systems (as shown in Figure 10a). These issues are believed to be caused by waste materials being carried by wind and then accumulating near water pipes, as illustrated in Figure 10b.
The respondents claimed to experience bad smells that affect the quality of air, rodents getting into houses, and gray water overflow in walking passages because of blocked drains as a result of indiscriminate solid waste disposal. Ichinose and Yamamoto [12] state that waste that is lying around, especially in open spaces, results in piles, causing outbreaks of diseases as well as a health nuisance in the form of bad odors. This observation is in line with a study conducted by Monroe and Krasny [51], who stated that the emergence of informal settlements may exaggerate social and environmental problems and impede sustainable development. An enhanced understanding of informal development may, therefore, be key to future success in its effective management.
4. Conclusions
In this study, the use of a GIS was applied to identify illegal dumping sites as well as areas that are susceptible to illegal waste disposal. Through the use of a GIS in waste management, this research explores the spatial distribution of illegal dumping in Joe Slovo Park’s informal community in Cape Town, South Africa. Significant numbers of illegal disposal sites are strategically positioned in close proximity to highways and behind residential properties situated along major thoroughfares, giving rise to concerns over their vicinity. This is interlinked with the questionnaire results, which revealed that about 93.85% of respondents reported that they did not have bins in their homes, and only 6.15 percent reported buying bins because the municipality only provided plastic bags. Among the factors that influence the prevalence of illegal dumping are the level of advancement in waste removal systems, the costs associated with legal waste disposal, the effectiveness of monitoring and sanctions, and the level of public acceptance and awareness of illegal dumping. By utilizing a GIS to manage waste in Joe Slovo Park’s informal community in Cape Town, South Africa, it is possible to discover the geographical distribution of unlawful dumping.
Author Contributions
Conceptualization, Y.J. and T.M.; Software, K.C.M.; Validation, B.S.M. and K.C.M.; Formal analysis, K.C.M.; Writing—original draft, Y.J.; Writing—review & editing, B.S.M. All authors have read and agreed to the published version of the manuscript.
Funding
This research received no external funding.
Institutional Review Board Statement
The study was conducted in accordance with the Declaration of Helsinki, and approved by the Institutional Review Board (or Ethics Committee) of Cape Peninsula University of Technology (214145778/04/2021).
Informed Consent Statement
Informed consent was obtained from all subjects involved in the study.
Data Availability Statement
The data presented in this study are available on request from the corresponding authors.
Conflicts of Interest
The authors declare that they have no known competing financial interests or personal relationships that could be perceived as having influenced the work described in this paper.
References
- Chalkias, C.; Lasaridi, K. Benefits from GIS Based Modelling for Municipal Solid Waste Management; Intech Open Access Publisher: London, UK, 2011. [Google Scholar]
- O’Connor, D.L. Solid Waste Collection Vehicle Route Optimization for the City of Redlands. Master’s Thesis, University of Redlands, Redlands, CA, USA, 2013. [Google Scholar]
- Roy, H.; Alam, S.R.; Bin-Masud, R.; Prantika, T.R.; Pervez, M.N.; Islam, M.S.; Naddeo, V. A Review on Characteristics, Techniques, and Waste-to-Energy Aspects of Municipal Solid Waste Management: Bangladesh Perspective. Sustainability 2022, 14, 10265. [Google Scholar] [CrossRef]
- Zhou, B.; Sun, C.; Yi, H. Solid waste disposal in Chinese cities: An evaluation of local performance. Sustainability 2017, 9, 2234. [Google Scholar] [CrossRef]
- Wang, F.; Cheng, Z.; Reisner, A.; Liu, Y. Compliance with household solid waste management in rural villages in developing countries. J. Clean. Prod. 2018, 202, 293–298. [Google Scholar] [CrossRef]
- Grangxabe, X.S.; Maphanga, T.; Madonsela, B.S. Public participation on waste management between nature reserves and surrounding informal settlement: A review. J. Air Waste Manag. Assoc. 2023, 73, 589–599. [Google Scholar] [CrossRef] [PubMed]
- Kallel, A.; Serbaji, M.M.; Zairi, M. Using GIS-based tools for the optimization of solid waste collection and transport: Case study of Sfax City, Tunisia. J. Eng. 2016, 2016, 4596849. [Google Scholar] [CrossRef]
- Nguyen, T.T.; Zhu, D.; Le, N.P. Factors influencing waste separation intention of residential households in a developing country: Evidence from Hanoi, Vietnam. Habitat Int. 2015, 48, 169–176. [Google Scholar] [CrossRef]
- Dutta, D.; Goel, S. Applications of remote sensing and GIS in solid waste management—A review. In Advances in Solid and Hazardous Waste Management; Springer: Cham, Switzerland, 2017; pp. 133–151. [Google Scholar]
- Mutisya, E.; Yarime, M. Understanding the grassroots dynamics of slums in Nairobi: The dilemma of Kibera informal settlements. Int. Trans. J. Eng. Manag. Appl. Sci. Technol. 2011, 2, 197–213. [Google Scholar]
- Department of Environmental Affairs. National Waste Strategy; Government Gazette Notice, No. 35306; Department of Environmental Affairs: Pretoria, South Africa, 2012; Available online: https://cer.org.za/wp-content/uploads/2012/06/National-Waste-Management-Strategy-as-implemented.pdf (accessed on 20 September 2023).
- Ichinose, D.; Yamamoto, M. On the relationship between the provision of waste management service and illegal dumping. Resour. Energy Econ. 2011, 33, 79–93. [Google Scholar] [CrossRef]
- Grangxabe, X.S.; Maphanga, T.; Madonsela, B.S.; Gqomfa, B.; Phungela, T.T.; Malakane, K.C.; Thamaga, K.H.; Angwenyi, D. The Escalation of Informal Settlement and the High Levels of Illegal Dumping Post-Apartheid: Systematic Review. Challenges 2023, 14, 38. [Google Scholar] [CrossRef]
- Zandamela, T.S. An Assessment of Municipal Solid Waste Management (MSWM) in Informal Settlements in eThekwini Municipality: A Case Study of Cato Crest Informal Settlemen. Doctoral Dissertation, University of Kwazulu-Natal, Durban, South Africa, 2016. [Google Scholar]
- Marutlulle, N. Causes of informal settlements in Ekurhuleni Metropolitan Municipality: An exploration. Afr. Public Serv. Deliv. Perform. Rev. 2017, 5, a131. [Google Scholar] [CrossRef]
- Antwi, E.D. Seeing the House from the Environment: Environmental Concerns of Informal/Slum Settlement in Accra Ghana. Doctoral Dissertation, Aalborg University, Accra, Ghana, 2008. [Google Scholar]
- Triassi, M.; Alfano, R.; Illario, M.; Nardone, A.; Caporale, O.; Montuori, P. Environmental pollution from illegal waste disposal and health effects: A review on the “Triangle of Death”. Int. J. Environ. Res. Public Health 2015, 12, 1216–1236. [Google Scholar] [CrossRef] [PubMed]
- Polasi, L.T. Factors Associated with Illegal Dumping in the Zondi Area, City of Johannesburg, South Africa. 2018. Available online: https://researchspace.csir.co.za/dspace/handle/10204/10511 (accessed on 22 June 2023).
- Selani, L. Mapping Illegal Dumping Using a High Resolution Remote Sensing Image Case Study: Soweto Township in South Africa. Doctoral Dissertation, University of the Witwatersrand, Johhanesburg, South Africa, 2017. [Google Scholar]
- Louati, A. Modeling municipal solid waste collection: A generalized vehicle routing model with multiple transfer stations, gather sites and inhomogeneous vehicles in time windows. Waste Manag. 2016, 52, 34–49. [Google Scholar]
- Glanville, K.; Chang, H.C. Mapping illegal domestic waste disposal potential to support waste management efforts in Queensland, Australia. Int. J. Geogr. Inf. Sci. 2015, 29, 1042–1058. [Google Scholar] [CrossRef]
- Jagila, J.; Adebowale Rasheed, K.; Fagbemiro Olayinka, A.; Agu Nnemeka, V. A Geo-Spatial Approach for Solid Waste Dumpsites for Sustainable Development in Minna. IOSR J. Environ. Sci. Toxicol. Food Technol. 2014, 8, 16–28. [Google Scholar]
- Zainun, N.Y.; Rahman, I.A.; Rothman, R.A. Mapping of construction waste illegal dumping using geographical information system (gis). IOP Conf. Ser. Mater. Sci. Eng. 2016, 160, 012049. [Google Scholar] [CrossRef]
- Karimi, N.; Ng, K.T.; Richter, A. Development and application of an analytical framework for mapping probable illegal dumping sites using nighttime light imagery and various remote sensing indices. Waste Manag. 2022, 143, 195–205. [Google Scholar] [CrossRef]
- Moyo, A. Africa Fights Illegal Dumping of E-Waste. 2012. Available online: https://www.itweb.co.za/content/Olx4zMkgAk4M56km (accessed on 15 October 2023).
- Afrika, M. Role of District Municipalities in Waste Management in South Africa; Council for Scientific and Industrial Research: Pretoria, South Africa, 2010. [Google Scholar]
- Jakiel, M.; Bernatek-Jakiel, A.; Gajda, A.; Filiks, M.; Pufelska, M. Spatial and temporal distribution of illegal dumping sites in the nature protected area: The Ojców National Park, Poland. J. Environ. Plan. Manag. 2019, 62, 286–305. [Google Scholar] [CrossRef]
- Nishanth, T.; Prakash, M.N.; Vijith, H. Suitable site determination for urban solid waste disposal using GIS and Remote sensing techniques in Kottayam Municipality, India. Int. J. Geomat. Geosci. 2010, 1, 197. [Google Scholar]
- Drivdal, L. Flooding in Cape Town’s informal settlements: Conditions for community leaders to work towards adaptation. S. Afr. Geogr. J. Suid Afr. Geogr. Tydskr. 2016, 98, 21–36. [Google Scholar] [CrossRef]
- Jimoh, R.; Moradeyo, A.; Chuma, V.; Olubukola, O.; Afonja, Y.O. GIS based appraisal of waste disposal for environmental assessment management in Mainland area of Lagos state, N.G. Int. J. Environ. Geoinformatics 2019, 6, 76–82. [Google Scholar] [CrossRef]
- Demirel, H. An Integrated Approach to the Conceptual Data Modeling of an Entire Highway Agency Geographic Information System (GIS). 2002. Available online: https://api-depositonce.tu-berlin.de/server/api/core/bitstreams/b1a28c54-2e67-489d-b20f-53b410afa68f/content (accessed on 12 June 2023).
- Gordillo, S.; Laurini, R. Conceptual Modeling of Geographic Applications. Adv. Geogr. Inf. Syst. 2009, 19, 87. [Google Scholar]
- Lisboa-Filho, J.; Sampaio, G.B.; Nalon, F.R.; Borges, K.A. A uml profile for conceptual modeling in gis domain. In Proceedings of the International Workshop on Domain Engineering at CAiSE, Hammamet, Tunisia, 8 June 2010; pp. 18–31. [Google Scholar]
- Saaty, T.L.; Vargas, L.G. The Analytic Hierarchy Process: Wash criteria should not be ignored. Int. J. Manag. Decis. Mak. 2006, 7, 180–188. [Google Scholar] [CrossRef]
- Atanasova-Pacemska, T.; Lapevski, M.; Timovski, R. Analytical Hierarchical Process (AHP) Method Application in the Process of Selection and Evaluation. 2014. Available online: https://eprints.ugd.edu.mk/11494/ (accessed on 11 May 2022).
- Carrilho, M.A. The Use of Analytical Hierarchy Process in Spatial Decision Support System for Land Use Management. Doctoral Dissertation, Universidade Nova de Lisboa, Lisbon, Portugal, 2015. [Google Scholar]
- Szabo, Z.K.; Szádoczki, Z.; Bozóki, S.; Stănciulescu, G.C.; Szabo, D. An analytic hierarchy process approach for prioritisation of strategic objectives of sustainable development. Sustainability 2021, 13, 2254. [Google Scholar] [CrossRef]
- Sasikumar, G.; Sivasangari, A.; Venkatachalam, N. Application of Analytical Hierarchy Process (AHP) for Assessment of Collection and Transportation of Solid Waste: An Empirical Study. Nat. Environ. Pollut. Technol. 2022, 21, 283–288. [Google Scholar] [CrossRef]
- Mohammed, A.; Zubair, Z.L. Land Suitability Analysis for Solid Waste Landfills in Kano Metropolis Using Multi-Criteria Evaluation Techniques. Afrigist J. Land Adm. Environ. Manag. 2022, 2, 52–68. [Google Scholar] [CrossRef]
- Leal, J.E. AHP-express: A simplified version of the analytical hierarchy process method. MethodsX 2020, 7, 100748. [Google Scholar] [CrossRef] [PubMed]
- Forman, E.H.; Gass, S.I. The analytic hierarchy process—An exposition. Oper. Res. 2001, 49, 469–486. [Google Scholar] [CrossRef]
- Ghafourian, K.; Kabirifar, K.; Mahdiyar, A.; Yazdani, M.; Ismail, S.; Tam, V.W. A synthesis of express analytic hierarchy process (EAHP) and partial least squares-structural equations modeling (PLS-SEM) for sustainable construction and demolition waste management assessment: The case of Malaysia. Recycling 2021, 6, 73. [Google Scholar] [CrossRef]
- Taherdoost, H. Decision making using the analytic hierarchy process (AHP); A step by step approach. Int. J. Econ. Manag. Syst. 2017, 2, 244–246. [Google Scholar]
- Kimani, S.K. Exposure to Pollutants and Health of Women Waste Pickers at Dandora Dumpsite in Nairobi, Kenya. Int. J. Innov. Res. Dev. 2021, 10, 94–103. [Google Scholar] [CrossRef]
- Tadesse, T.; Ruijs, A.; Hagos, F. Household waste disposal in Mekelle city, Northern Ethiopia. Waste Manag. 2008, 28, 2003–2012. [Google Scholar] [CrossRef] [PubMed]
- Lucas, H. ‘Out of Sight, Out of Mind: The Unsustainable Production of Waste’. France: New-Mine EU Training Network Resources Recovery through Enhanced Landfill Mining. 2018. Available online: https://new-mine.eu/out-of-sight-out-of-mind-the-unsustainable-production-of-waste/ (accessed on 16 April 2023).
- Mbonambi, Z. An Investigation into the Environmental Impacts of Informal Settlements on Water: A Case of Kennedy Road Informal Settlement in Durban. Doctoral Dissertation, University of KwaZulu-Natal, Durban, South Africa, 2016. [Google Scholar]
- Hanfman, E. A Comprehensive Assessment of Illegal Waste Dumping. 2018. Available online: https://pdfs.semanticscholar.org/0315/ce4ba940ec4d63e5685ad9a0d1ab75058867.pdf (accessed on 3 July 2023).
- Singh, R.; Yabar, H.; Nozaki, N.; Rakwal, R. Analyzing waste problems in developing countries: Lessons for Kathmandu, Nepal through analysis of the waste system in Tsukuba City, Japan. J. Sci. Res. Rep. 2015, 8, 1–13. [Google Scholar] [CrossRef]
- United Nations Environment Programme. Africa Waste Management Outlook. 2018. Available online: https://www.unep.org/ietc/resources/publication/africa-waste-management-outlook (accessed on 16 January 2024).
- Monroe, M.C.; Krasny, M.E. Across the Spectrum: Resources for Environmental Educators, 3rd ed.; North American Association for Environmental Education: Washington, DC, USA, 2016. [Google Scholar]
Figure 1.
The study area of Joe Slovo Park informal settlement.

Figure 2.
Flow chart and methodology adopted.

Figure 3.
Distribution of illegal dumping sites in Joe Slovo Park.

Figure 4.
An example of illegal dumping sites located in the study area: (A) behind a shack, (B) along a road, (C) in front of a house, and (D) behind shacks and next to a drainage system (authors).
Figure 4.
An example of illegal dumping sites located in the study area: (A) behind a shack, (B) along a road, (C) in front of a house, and (D) behind shacks and next to a drainage system (authors).

Figure 5.
The areas that are susceptible to illegal dumping and all the illegal dumping sites found during the field work.
Figure 5.
The areas that are susceptible to illegal dumping and all the illegal dumping sites found during the field work.

Figure 6.
Proximity analysis of illegal dumping in Joe Slovo Park.

Figure 7.
Illegal dumping taking place near a highway (authors).

Figure 8.
The age group distribution in Joe Slovo Park’s informal settlement.

Figure 9.
The proportion of participants who have bins in their house.

Figure 10.
(a) Illegal dumping sites with leachate runoff (author(s)). (b) Some waste disposed of illegally near water pipe (author(s)).
Figure 10.
(a) Illegal dumping sites with leachate runoff (author(s)). (b) Some waste disposed of illegally near water pipe (author(s)).


Table 1.
Saaty Scale. Source: Leal [40].
Table 1.
Saaty Scale. Source: Leal [40].
| Intensity of Importance | Definition |
|---|---|
| 1 | Equal importance |
| 3 | Moderate importance |
| 5 | Strong importance |
| 7 | Very strong importance |
| 9 | Extreme importance |
Table 2.
RI values based on matrix size. Source: Sasikumar et al. [38].
Table 2.
RI values based on matrix size. Source: Sasikumar et al. [38].
| n | 1 | 2 | 3 | 4 | 5 | 6 | 7 | 8 | 9 | 10 |
|---|---|---|---|---|---|---|---|---|---|---|
| RI | 0 | 0 | 0.58 | 0.9 | 1.12 | 1.24 | 1.32 | 1.41 | 1.45 | 1.49 |
Table 3.
Shows the Joe Slovo Park informal settlement’s slope of area and suitability.
| S.No | Slope | Suitability | New Values | Remark |
|---|---|---|---|---|
| 1 | 0–8% | S5 | 5 | Very highly suitable |
| 2 | 8–15% | S4 | 4 | Highly suitable |
| 3 | 15–22% | S3 | 3 | Suitable |
| 4 | 22–30% | S2 | 2 | Low suitability |
| 5 | >30% | S1 | 1 | Not suitable |
Table 4.
If no, where do you dispose of your waste?
| Frequency | Percent | Valid Percent | Cumulative Percent | ||
|---|---|---|---|---|---|
| Valid | 3 | 4.6 | 4.6 | 4.6 | |
| Open space | 9 | 13.8 | 13.8 | 18.5 | |
| Plastic and burn waste | 1 | 1.5 | 1.5 | 20.0 | |
| Plastic and container | 49 | 75.4 | 75.4 | 95.4 | |
| Plastic and open space | 2 | 3.1 | 3.1 | 98.5 | |
| Use my own plastic and throw it in an open space | 1 | 1.5 | 1.5 | 100.0 | |
| Total | 65 | 100.0 | 100.0 | ||
Disclaimer/Publisher’s Note: The statements, opinions and data contained in all publications are solely those of the individual author(s) and contributor(s) and not of MDPI and/or the editor(s). MDPI and/or the editor(s) disclaim responsibility for any injury to people or property resulting from any ideas, methods, instructions or products referred to in the content. |
© 2024 by the authors. Licensee MDPI, Basel, Switzerland. This article is an open access article distributed under the terms and conditions of the Creative Commons Attribution (CC BY) license (https://creativecommons.org/licenses/by/4.0/).
Share and Cite
MDPI and ACS Style
Jakeni, Y.; Maphanga, T.; Madonsela, B.S.; Malakane, K.C. Identification of Illegal Dumping and Community Views in Informal Settlements, Cape Town: South Africa. Sustainability 2024, 16, 1429. https://doi.org/10.3390/su16041429
AMA Style
Jakeni Y, Maphanga T, Madonsela BS, Malakane KC. Identification of Illegal Dumping and Community Views in Informal Settlements, Cape Town: South Africa. Sustainability. 2024; 16(4):1429. https://doi.org/10.3390/su16041429
Chicago/Turabian StyleJakeni, Yamkela, Thabang Maphanga, Benett Siyabonga Madonsela, and Karabo Concelia Malakane. 2024. "Identification of Illegal Dumping and Community Views in Informal Settlements, Cape Town: South Africa" Sustainability 16, no. 4: 1429. https://doi.org/10.3390/su16041429
Note that from the first issue of 2016, this journal uses article numbers instead of page numbers. See further details here.