Article

Chlorine Gas Removal by H2 Treated Red Mud for the Potential Application in Waste Plastic Pyrolysis Process

1
Research Institute of Advanced Energy Technology, Kyungpook National University, Daegu 41566, Republic of Korea
2
Department of Chemical Engineering, Kyungpook National University, Daegu 41566, Republic of Korea
3
Institute for Advanced Engineering, Yongin 41718, Republic of Korea
*
Authors to whom correspondence should be addressed.
These authors contributed equally to this work.
Sustainability 2024, 16(3), 1137; https://doi.org/10.3390/su16031137
Submission received: 19 December 2023 / Revised: 15 January 2024 / Accepted: 24 January 2024 / Published: 29 January 2024

Abstract

:
In the process of pyrolyzing waste plastics, the generation of Cl2 gas can pose a problem. During the pyrolysis processing, incomplete combustion of organic compounds containing chlorine can lead to the formation of toxic chemicals, which can cause issues in subsequent processing stages. Therefore, an adsorbent plays an important role in removing Cl2 in the dechlorination process, and alkaline adsorbents and metal oxides are generally used. Waste red mud is composed of Fe metal oxide and alkaline components, so it is intended to be used as a Cl2 adsorbent. The Cl2 removal ability of red mud with different redox status of iron oxides was assessed. Hydrogen treatment was performed at various temperatures to control the reduction potential of the Fe in the metal oxides, and phase changes in the Fe oxide component of red mud were confirmed. In the case of red mud hydrogenated at 700 °C, most of the Fe2O3 structure could be converted to the Fe3O4 structure, and the Fe3O4 structure showed superior results in Cl2 adsorption compared to the Fe2O3 structure. As a result, red mud at an H2 treatment temperature of 700 °C showed about three times higher Cl2 adsorption compared to red mud without H2 treatment.

1. Introduction

In 2020, 367 million tons of plastic were produced worldwide, and demand for use is expected to quadruple by 2050 due to its lightweight, affordability, and versatility [1,2,3,4]. According to European Plastics, most of the plastics in 2020 were used for packaging (40.5%), which generally has a short life span and rapidly enters the waste stream. These are mainly used in various forms of polyethylene (Low Density Polyethylene; LDPE and High Density Polyethylene; HDPE), Polypropylene (PP), Polystyrene (PS), Polyvinyl Chloride (PVC), and Polyethylene Terephthalate (PET). The main components of these plastics were PP (19.7%), LDPE (17.4%), HDPE (12.9%), PVC (9.6%) PET (8.4%), and Polyurethane (PUR) (7.8%). Plastics have been used in large quantities since 1950, and the current global plastic waste is estimated at 6.3 billion tons, of which 79% accumulates in landfills and the environment, causing environmental pollution and resource waste [5,6]. Landfill or incineration to dispose of waste plastic affects air, water, and soil due to the release of chlorine and dioxin. To alleviate these problems, many countries are trying to recycle waste plastic in various ways.
Common recycling methods include mechanical recycling, thermal recycling, and chemical recycling [7,8]. Mechanical recycling involves physical processes like washing, shredding, melting, and blending to recycle plastics into solid fuels or fibers. While it’s widely used, accounting for over 90% of recycling, it has economic drawbacks and limitations due to contamination and degradation of material properties [9,10]. Thermal recycling leverages the heat generated from incinerating waste plastics, but the harmful emissions contribute to environmental pollution. Chemical recycling, on the other hand, involves breaking down plastics through chemical processes to revert them back to their raw or polymer forms. Pyrolysis oil produced from high-temperature decomposition of waste plastics is a prime example of chemical recycling [11,12]. It is seen as a key recycling method for its ability to recycle plastics without quality or functionality loss, and for its ability to handle a variety of plastics, reducing recycling costs and increasing the volume of recyclable materials. Among waste plastic recycling methods, the waste plastic treatment process using pyrolysis can reduce CO2 emitted from the process compared to other recycling methods [13].
The liquid produced by the thermal decomposition of waste plastic represents a complex mixture of various types of aromatic compounds, alkanes, and alkenes [14,15,16]. However, waste plastic, which is the feedstock for the pyrolysis oil process, also contains PVC, so the pyrolysis oil produced in the process contains both inorganic and organic chlorinated compounds. Challenges in the industrial application of pyrolysis oil include its high chlorine content and waxy, semi-solid characteristics, necessitating complex physicochemical treatments. PVC releases various chemicals during the pyrolysis process, one of which is chlorine gas. When PVC is heated at high temperatures during the thermal decomposition process, the chlorine present in PVC can form chlorine gas Cl2 through various chemical reactions, a highly toxic and corrosive oxidizer that needs to be removed [17,18,19,20]. Therefore, Cl must be treated in the waste plastic pyrolysis process.
Typically, it has been reported that chlorine is adsorbed by using alkaline adsorbents and metal oxides, which immobilize chlorine in the form of metal chlorides. These include substances such as CaO, Ca(OH)2, CaCO3, and Fe3O4 [21,22,23,24]. These materials effectively capture chlorine, preventing it from being released into the environment. Red mud, an industrial waste generated during aluminum production, poses significant environmental and disposal challenges. Millions of tons of red mud are produced globally each year, with most being landfilled due to a lack of proper disposal methods. In South Korea, KC Co., Ltd. (Seoul, Republic of Korea) produces over 300,000 tons annually [25]. Red mud consists of various metal ions and inorganic contents such as Fe, Al, Na, Ca, Ti, and Si. It has a high surface it suitable adsorption properties, making it a potential candidate for use in adsorbents, ion-exchangers, catalysts, and cement materials [26]. Red mud as an adsorbent can offer both environmental and economic benefits. However, its actual application in commercial settings is limited, necessitating further research in utilizing various industrial by-products for the removal of atmospheric and water pollutants.
Many Studies have been conducted to remove Cl components generated from waste plastic pyrolysis oil using Fe-based adsorbents, and have been found to have an excellent effect on Cl removal [27,28]. Red mud, which is discarded as a waste resource every year, mainly consists of Fe, so it can be used to remove Cl generated from waste plastic pyrolysis oil, and we aim to use it more effectively. Red mud is suitable to be used as an adsorbent, but there is little research on Cl2 gas adsorption performance depending on the reduction state of red mud. In this study, we examine the use of red mud as an adsorbent for Cl2 gas from the pyrolysis of waste plastics. For the utilization of red mud as a Cl2 adsorbent, it was subjected to hydrogen treatment at various temperatures. It was designed to alter the degree of reduction in iron oxide within the red mud based on the temperature of the hydrogen treatment. Additionally, this study compared the Cl2 adsorption capacity of the red mud adsorbents used. Most papers compare the Cl content in pyrolysis oil and do not compare the adsorption capacity of the adsorbent used, so the adsorption capacity is checked to suggest the optimal amount of adsorbent used. We examined the Cl2 adsorption performance in relation to the different reduction states of iron oxide in red mud. The H2-treated red mud was analyzed using X-ray Diffraction (XRD), Brunauer–Emmett–Teller method (BET) analysis, scanning electron microscopy (SEM) with energy-dispersive X-ray spectroscopy (EDS), and X-ray Fluorescence (XRF).

2. Materials and Methods

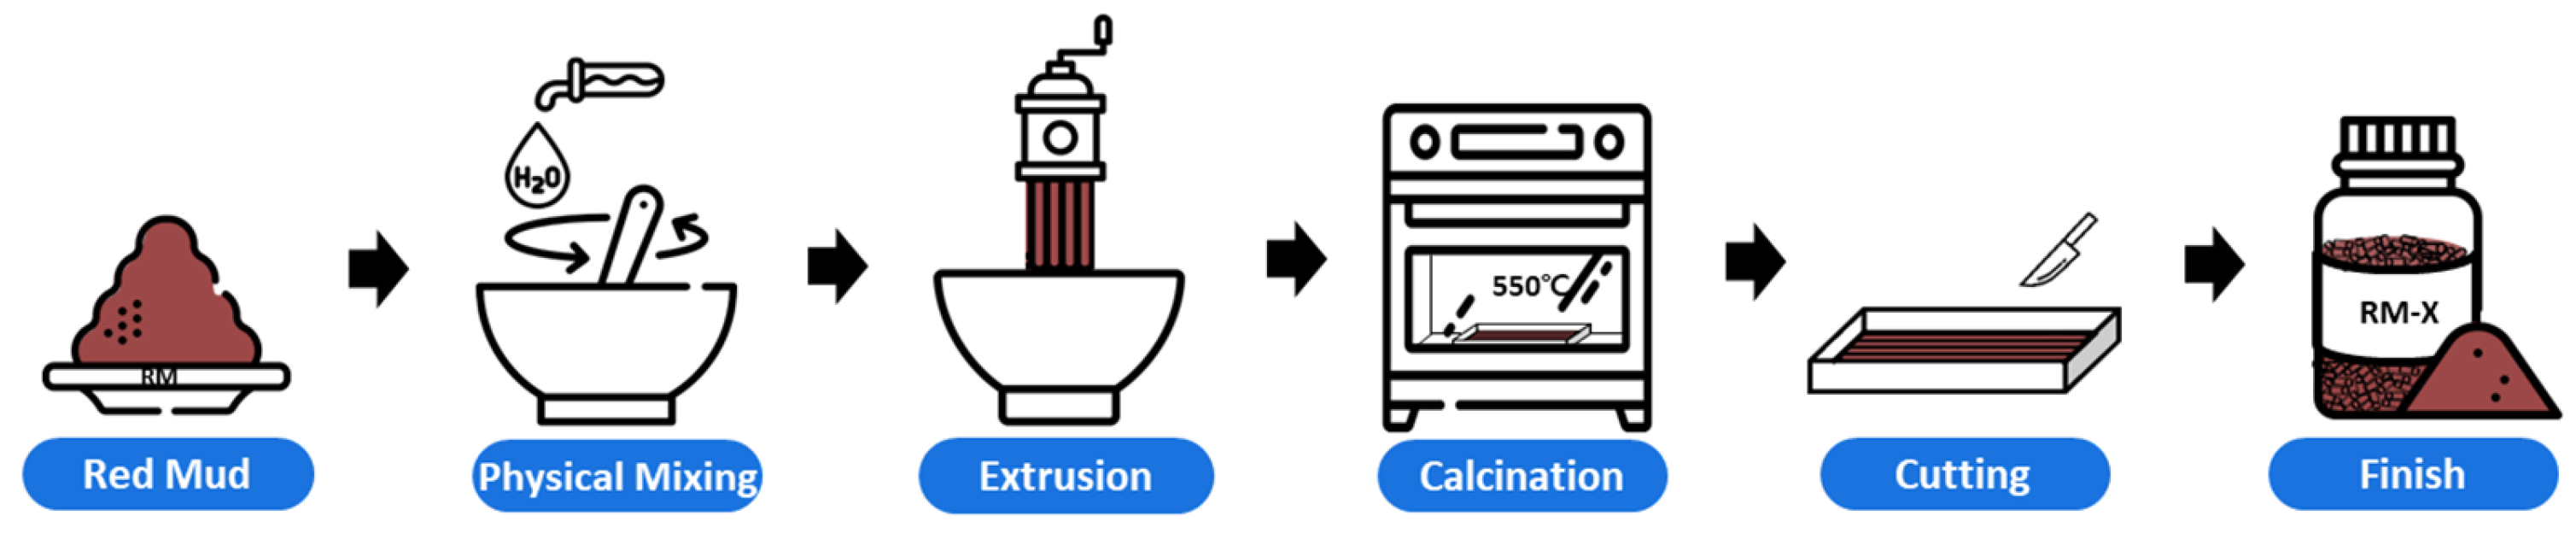
2.1. Material Synthesis

Figure 1 shows the process of extrusion molding red mud to fabricate adsorbent. The basis for each adsorbent sample is 10 g. Distilled water is added to the red mud for physical mixing to create a slurry. The adsorbent is then formed into a 0.1 mm diameter using an extrusion technique via a syringe. The calcined adsorbent is cut into 5 mm particle sizes, resembling pellets, to complete the RM adsorbent. The adsorbent is calcined at 550 °C for 5 h in an air atmosphere, with a heating rate of 10 °C/min. The H2-treatment step is carried out at a rate of 5 °C/min to temperatures of 400 °C, 550 °C, and 700 °C for 2 h under a flow of 100 mL/min (H2 10 vol%, N2 balanced). The samples are named RM_X, where X denotes the temperature of the H2-treatment.

2.2. Material Characterization

X-ray Fluorescence (XRF, SHIMADZU, XRF-1700, Kyoto, Japan) was conducted for basic component analysis of red mud. N2 adsorption-desorption at −196 °C experiments were performed using a Micromeritics ASAP 2020 apparatus (Norcross, GA, USA) prior to the adsorption measurements, the samples were purged at 300 °C for 5 h to measure textural properties such as specific surface area, pore volume, and average pore size. The average pore size was determined using the Barrett–Joyner–Halenda (BJH) method. The crystal structure of red mud was analyzed using a Cu Kα radiation source (λ = 1.5406 Å) in a Phillips X’PERT X-ray diffractometer (XRD) at the Korea Basic Institute in Daegu. The morphology and crystalline phase of red mud, as well as Cl-adsorbed on the surface, were examined using Field-emission scanning electron microscopy (FE-SEM, Hitachi, S-4800, Tokyo, Japan) with EDS (Oxford Instruments, Oxford, UK). H2-TPR analysis was performed to confirm the reduction characteristics of RM. RM samples (~17 mg) were heated in an alumina crucible from 30 °C to 900 °C at a rate of 10 °C/min. A total of 10% H2 was used as a carrier gas at a flow rate of 30 mL/min.

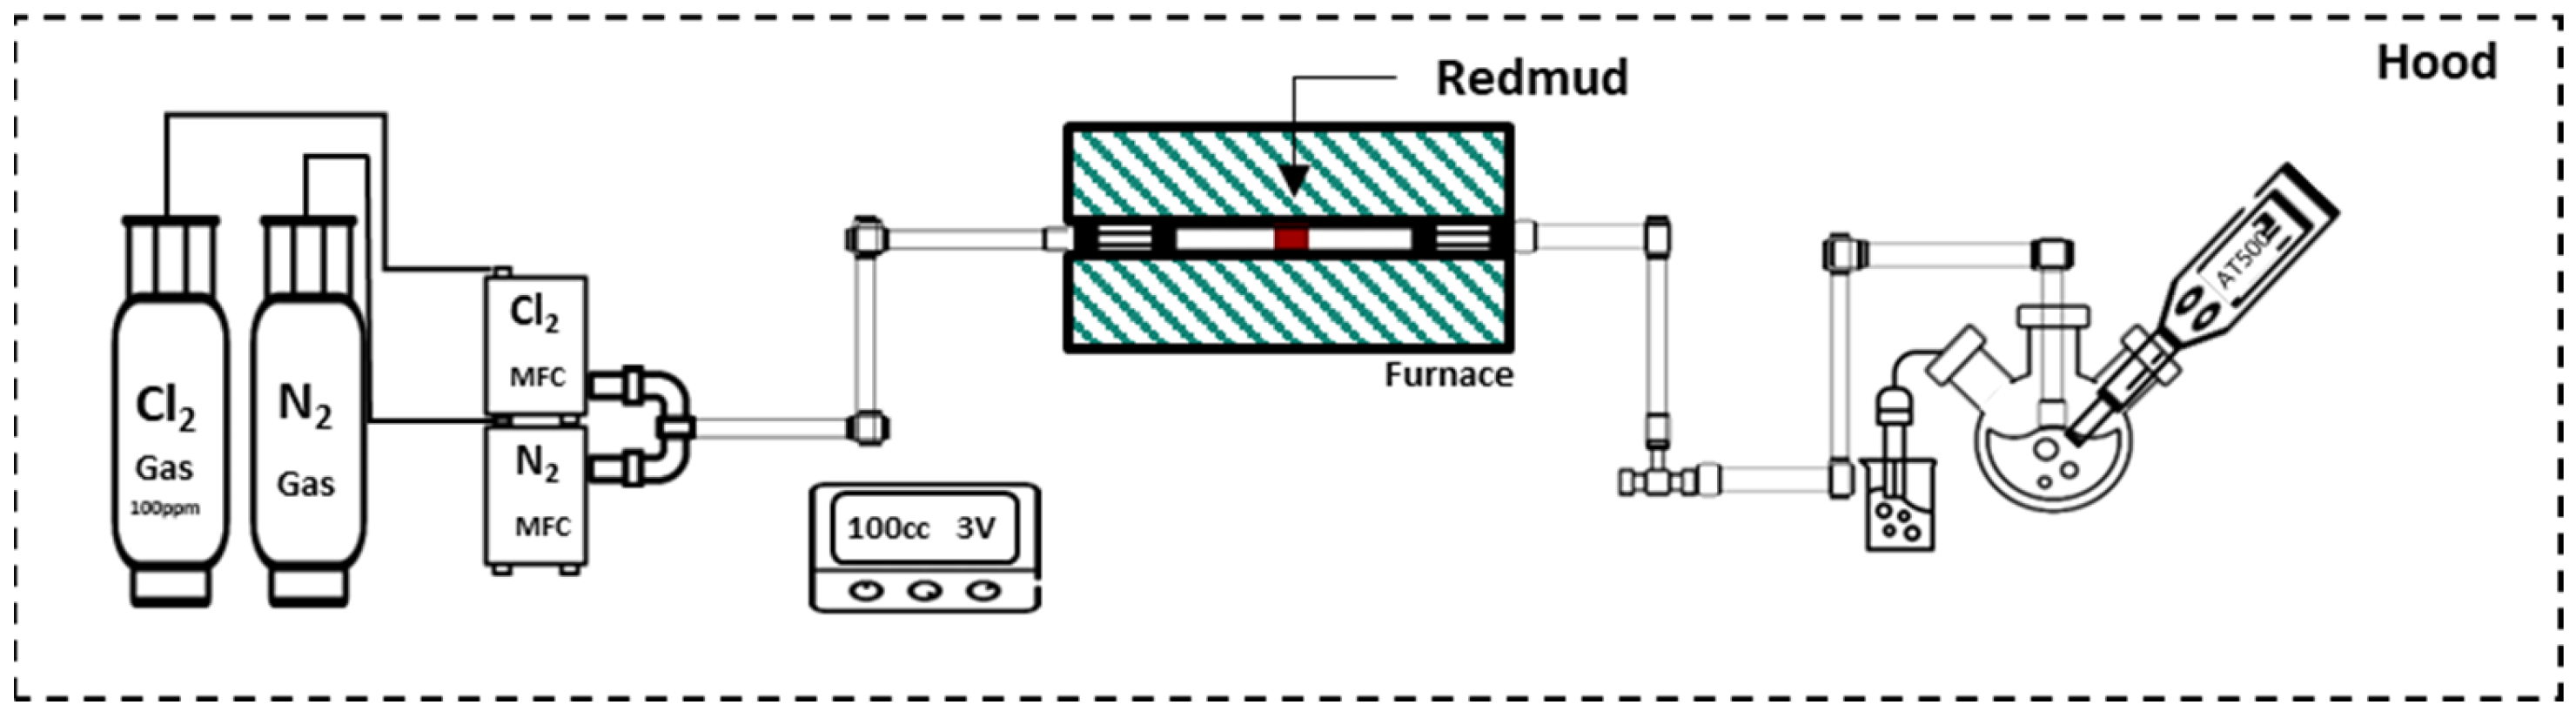
2.3. Cl2 Adsorption Test

In this study, a fixed-bed reactor was used for the Cl2 adsorption experiments. A schematic of the apparatus is shown in Figure 2. The reactor utilized a 1/2-inch diameter quartz tube, and the temperature inside the reactor was controlled using a Proportional–integral–derivative (PID) controller and a Chromel–Alumel thermocouple sensor. The reactor was placed in an electric furnace at atmospheric pressure. The Cl2 adsorption reaction was conducted at a furnace temperature of 350 °C until the breakthrough point, using a gas flow of 100 mL/min (Cl2 100 ppm and N2 balance). The flow was regulated using a Mass Flow Controller (MFC, Brooks, AB, Canada, 5859E). All experiments used 0.3 g of red mud adsorbent, and ceramic wool was used to fix the catalyst layer within the reactor. During the experiments, any Cl2 gas that passed through the sorbent was dissolved in 500 mL of distilled water. The amount of Cl2 dissolved in distilled water was measured to compare the Cl2 adsorption performance of the adsorbents. Ion Chromatography (IC) is a type of liquid chromatography that separates ionizable samples dissolved in water using an ion exchange column. However, IC is costly due to its inability for real-time measurement and the need for manual sample collection with a per-sample analysis fee. To overcome these drawbacks, an ion sensor (AT-500) was used for real-time measurement of Cl content in the solution. This was five times cheaper than IC equipment, allowing for more economical experiments. The outlet gases from the reactor were analyzed automatically every 1 min using an ion sensor equipped with an autosampler. Figure S1 presents the results of a blank experiment conducted to verify the correlation between the Ion Chromatograph analysis and the real-time measurement device.
As a result of the chromatographic analysis and the calibration curve of the real-time device, the same Cl ion concentration was detected.
The dechlorination efficiency at each time interval of inlet gas is given by Equation (1)
Dechlorination   efficiency   ( % ) = 1 M C l , t M C l , b l a n k × 100
where MCl,t is the total molar amount of chlorine in the outlet gas and MCl,blank is the total molar amount of chlorine in the blank experiment

3. Results

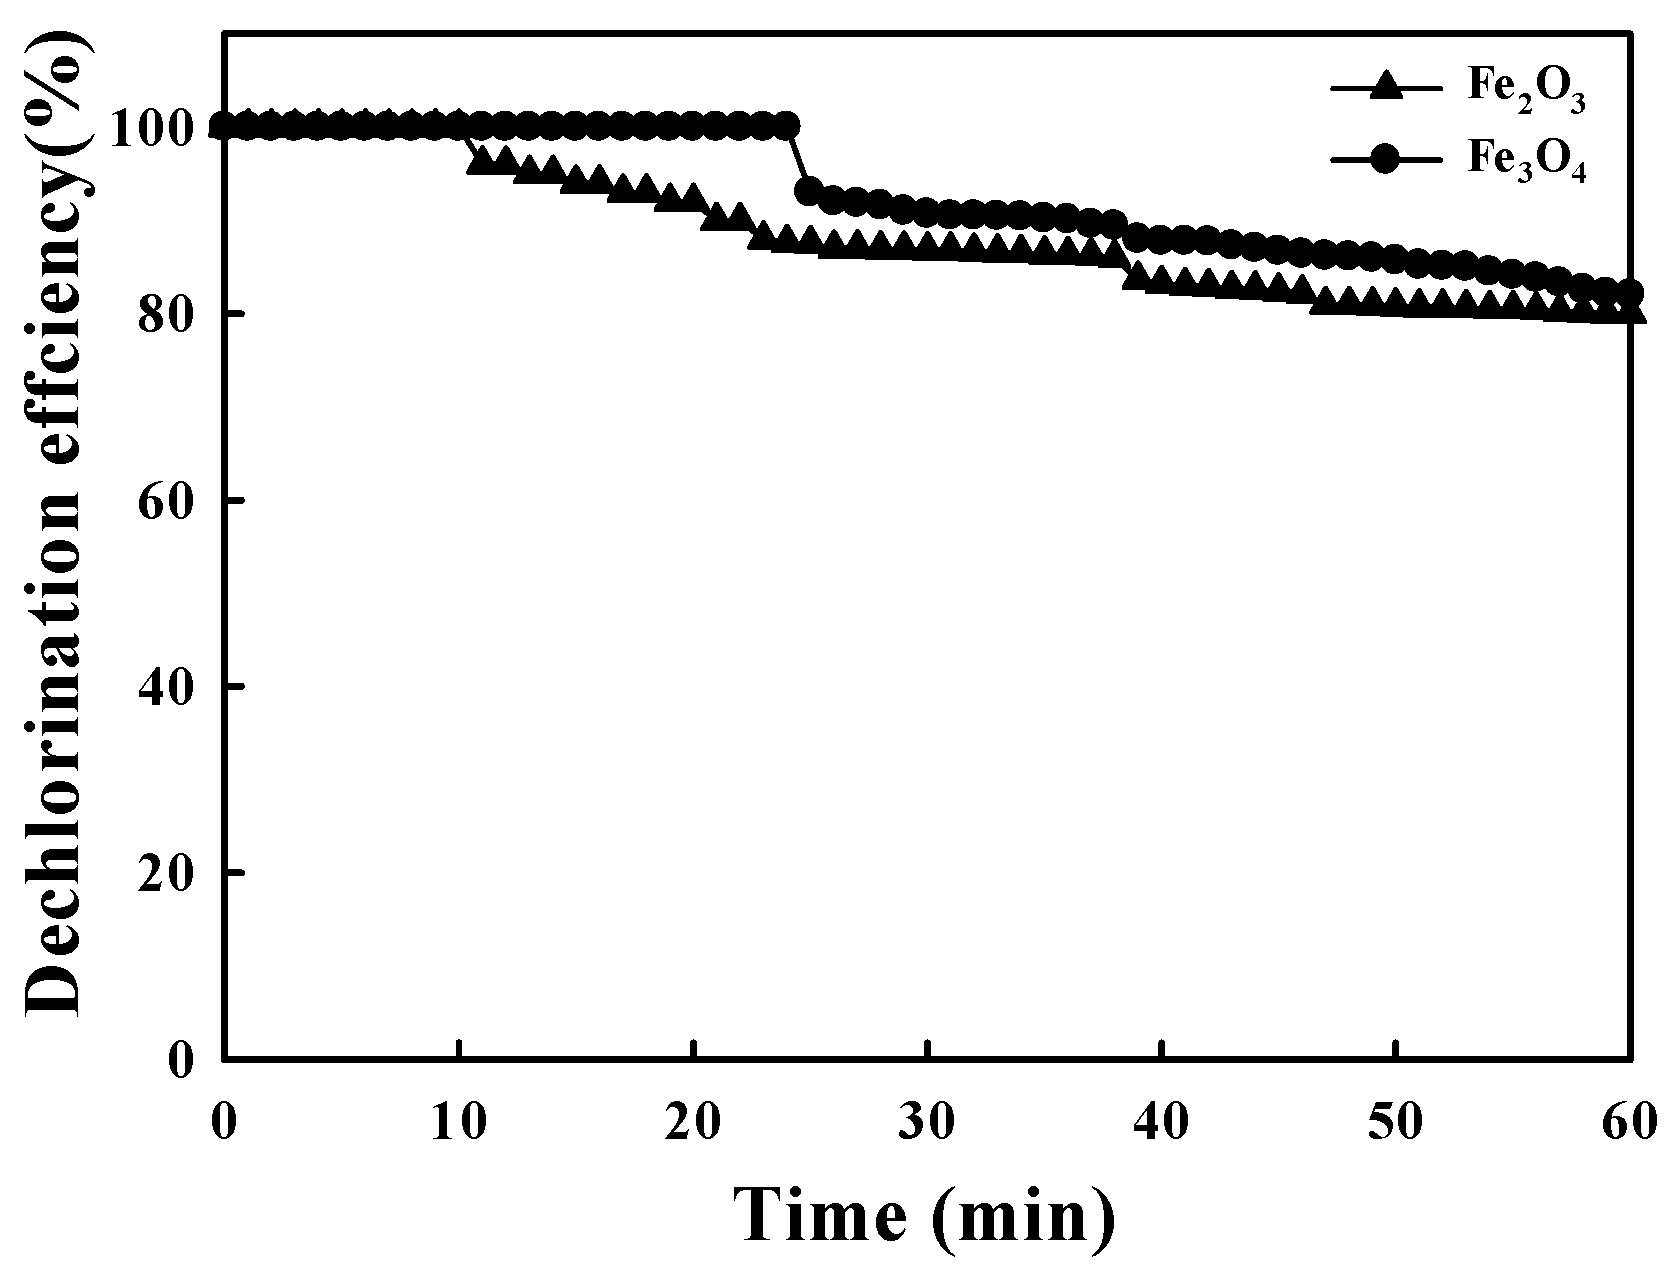
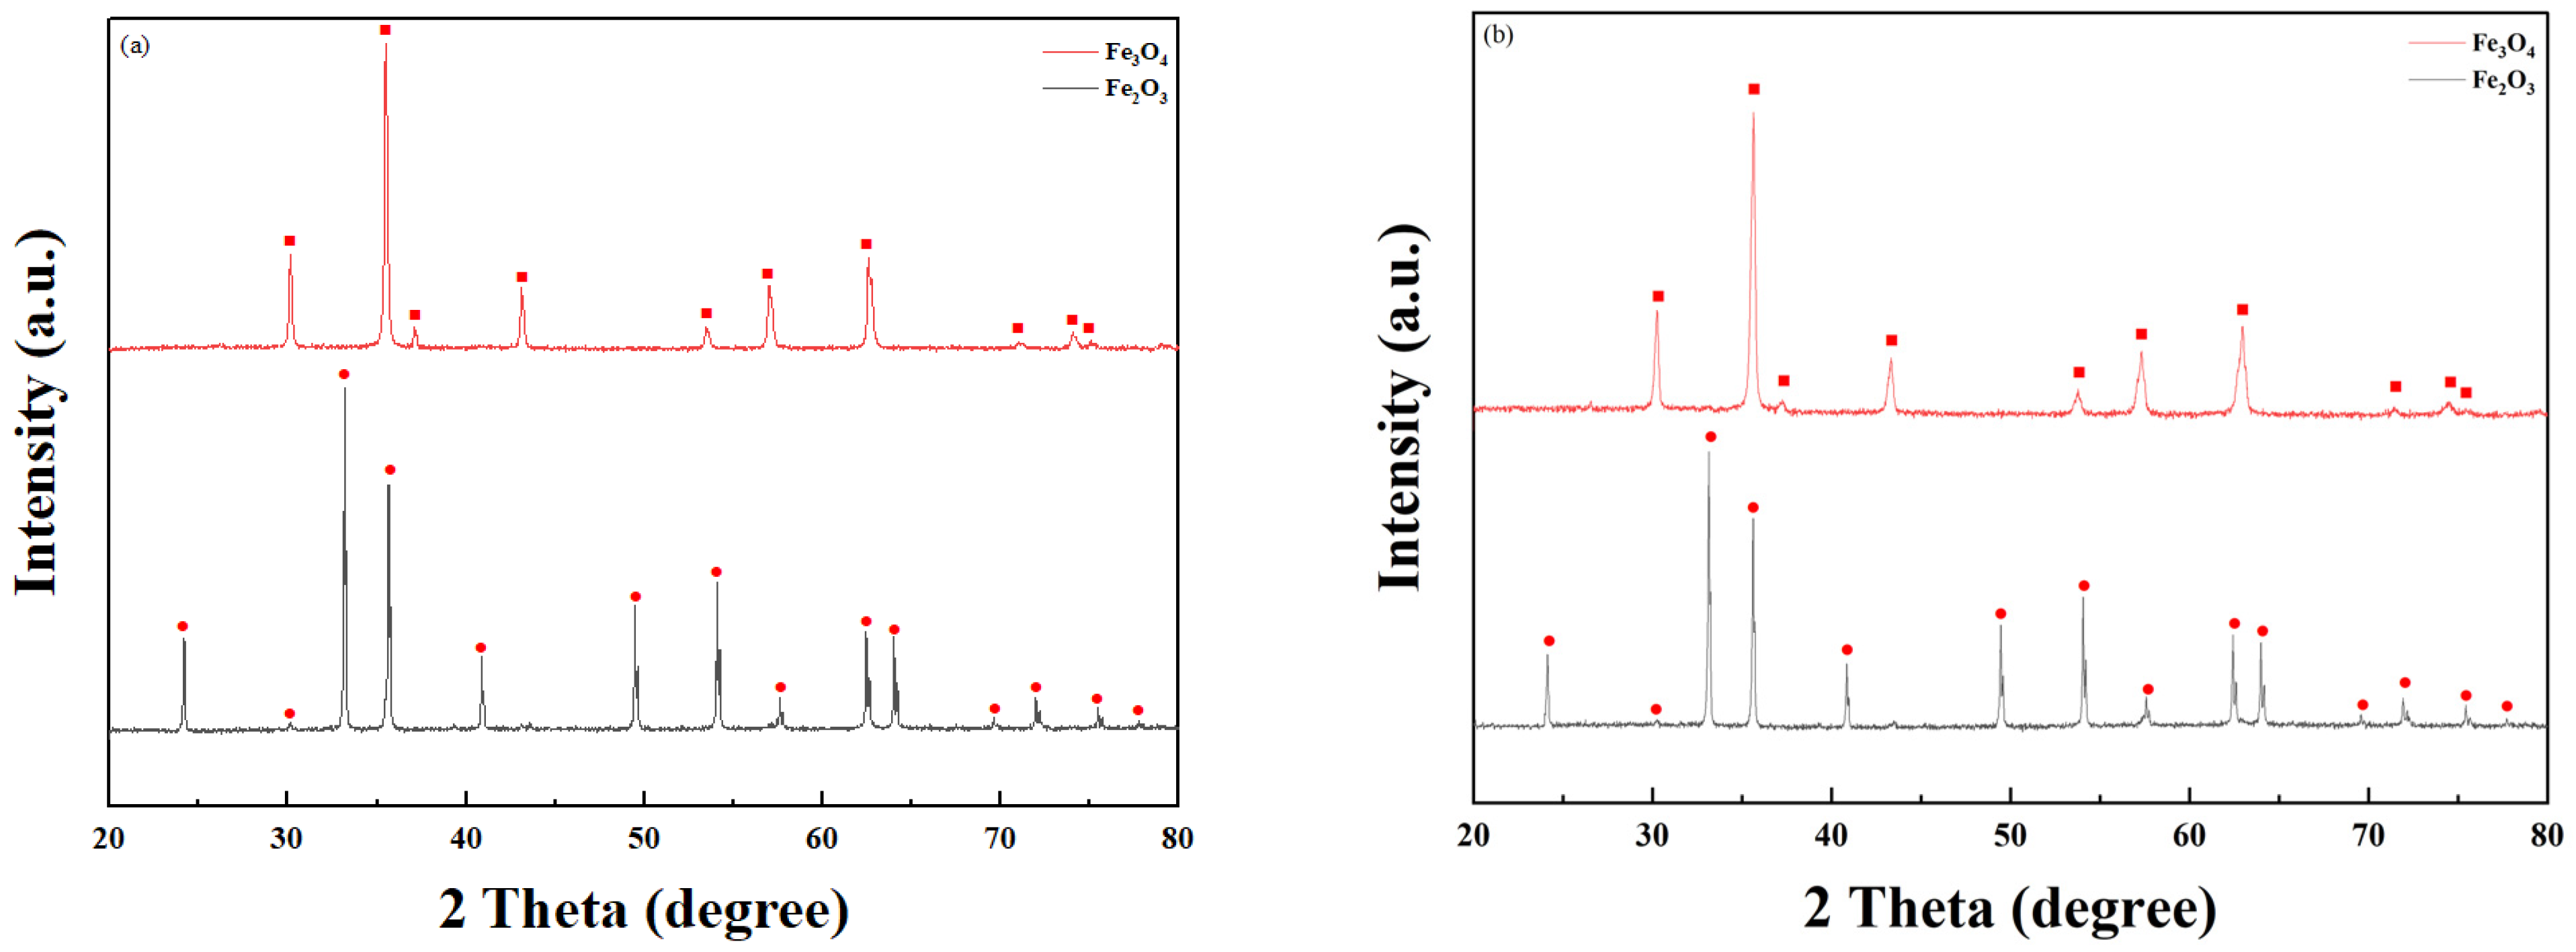
3.1. Screening of Iron Oxide Phases for Dechlorination Capacity

The dechlorination capacity was conducted to compare the Cl2 adsorption performance depending on the iron oxide phases. Figure 3 exhibits the dechlorination capacity of Fe2O3 and Fe3O4 in the presence of 100 ppm Cl2 at 350 °C for 60 min. The dechlorination efficiency of Fe2O3 is almost 100% during the 11 min with an adsorption capacity of 1.06 mgCl2/g and then slowly decreases to 81% at the time of 11–60 min. In contrast, the dechlorination efficiency of Fe3O4 shows 100% for the 25 min with an adsorption capacity of 2.65 mgCl2/g and decreases to 82% in the time range of 25–60 min. The Fe3O4 phase showed more than twice the Cl2 adsorption capacity compared to the Fe2O3 phase. These results suggest that the Fe3O4 phase has a more critical influence on the dechlorination capacity than the Fe2O3 phase.
Figure 4 shows the XRD patterns of iron oxide in fresh and after Cl2 adsorption. The peaks of Fe2O3 (JCPDS No. 89–8103) and Fe3O4 (JCPDS No. 75–0449) were observed in the fresh state. After Cl2 adsorption, the peak of iron oxide remained and the iron chloride phase did not appear. It might be difficult to observe the phase change of iron oxide after Cl2 adsorption under the conditions of this experiment. In addition, the dechlorination effects of the iron oxide phases are confirmed by the SEM−EDS results in Figure 5. It revealed that while no Cl ions were adsorbed on Fe2O3, 0.3 wt% of Cl ions were observed on Fe3O4. This confirms that the Cl2 adsorption capacity varies with the structural form of iron oxide. Since the red mud component is mainly formed in the Fe2O3 structure, it is necessary to investigate the effect of Cl2 gas adsorption capacity according to H2 treatment.

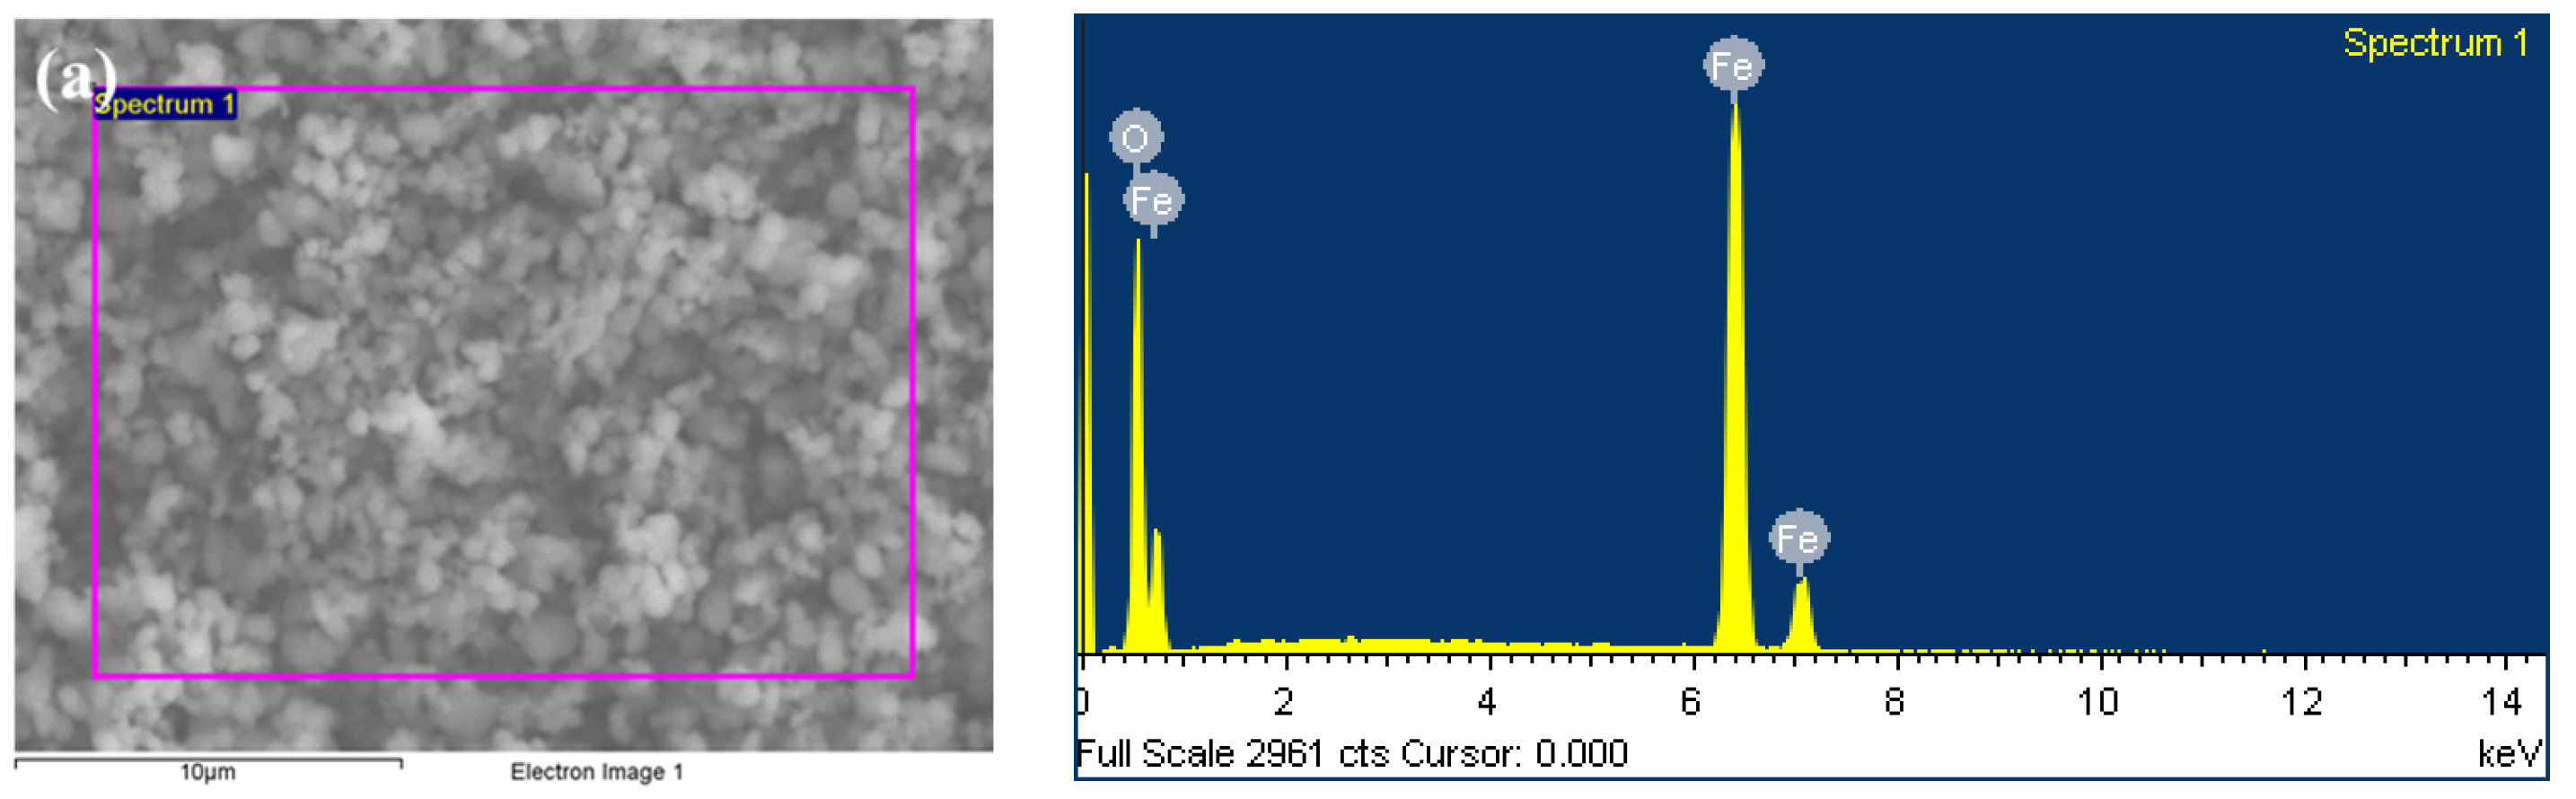
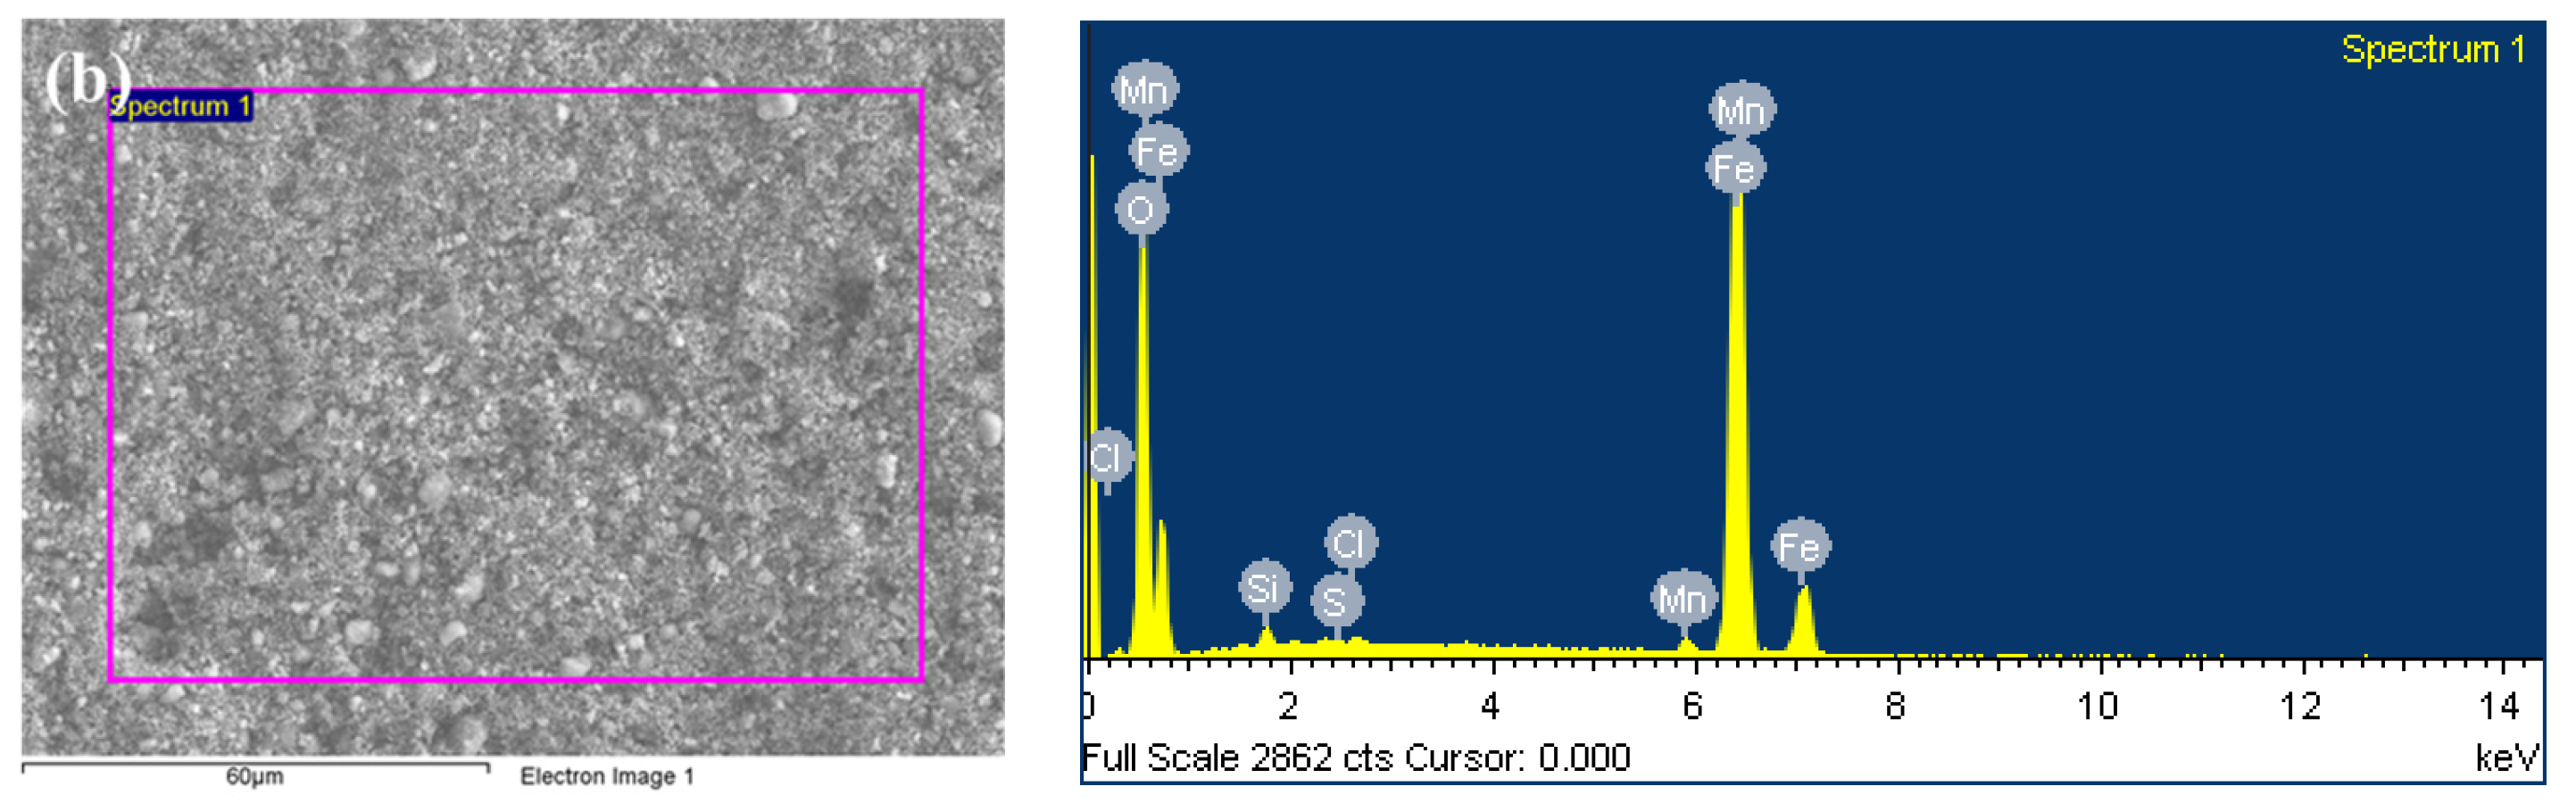
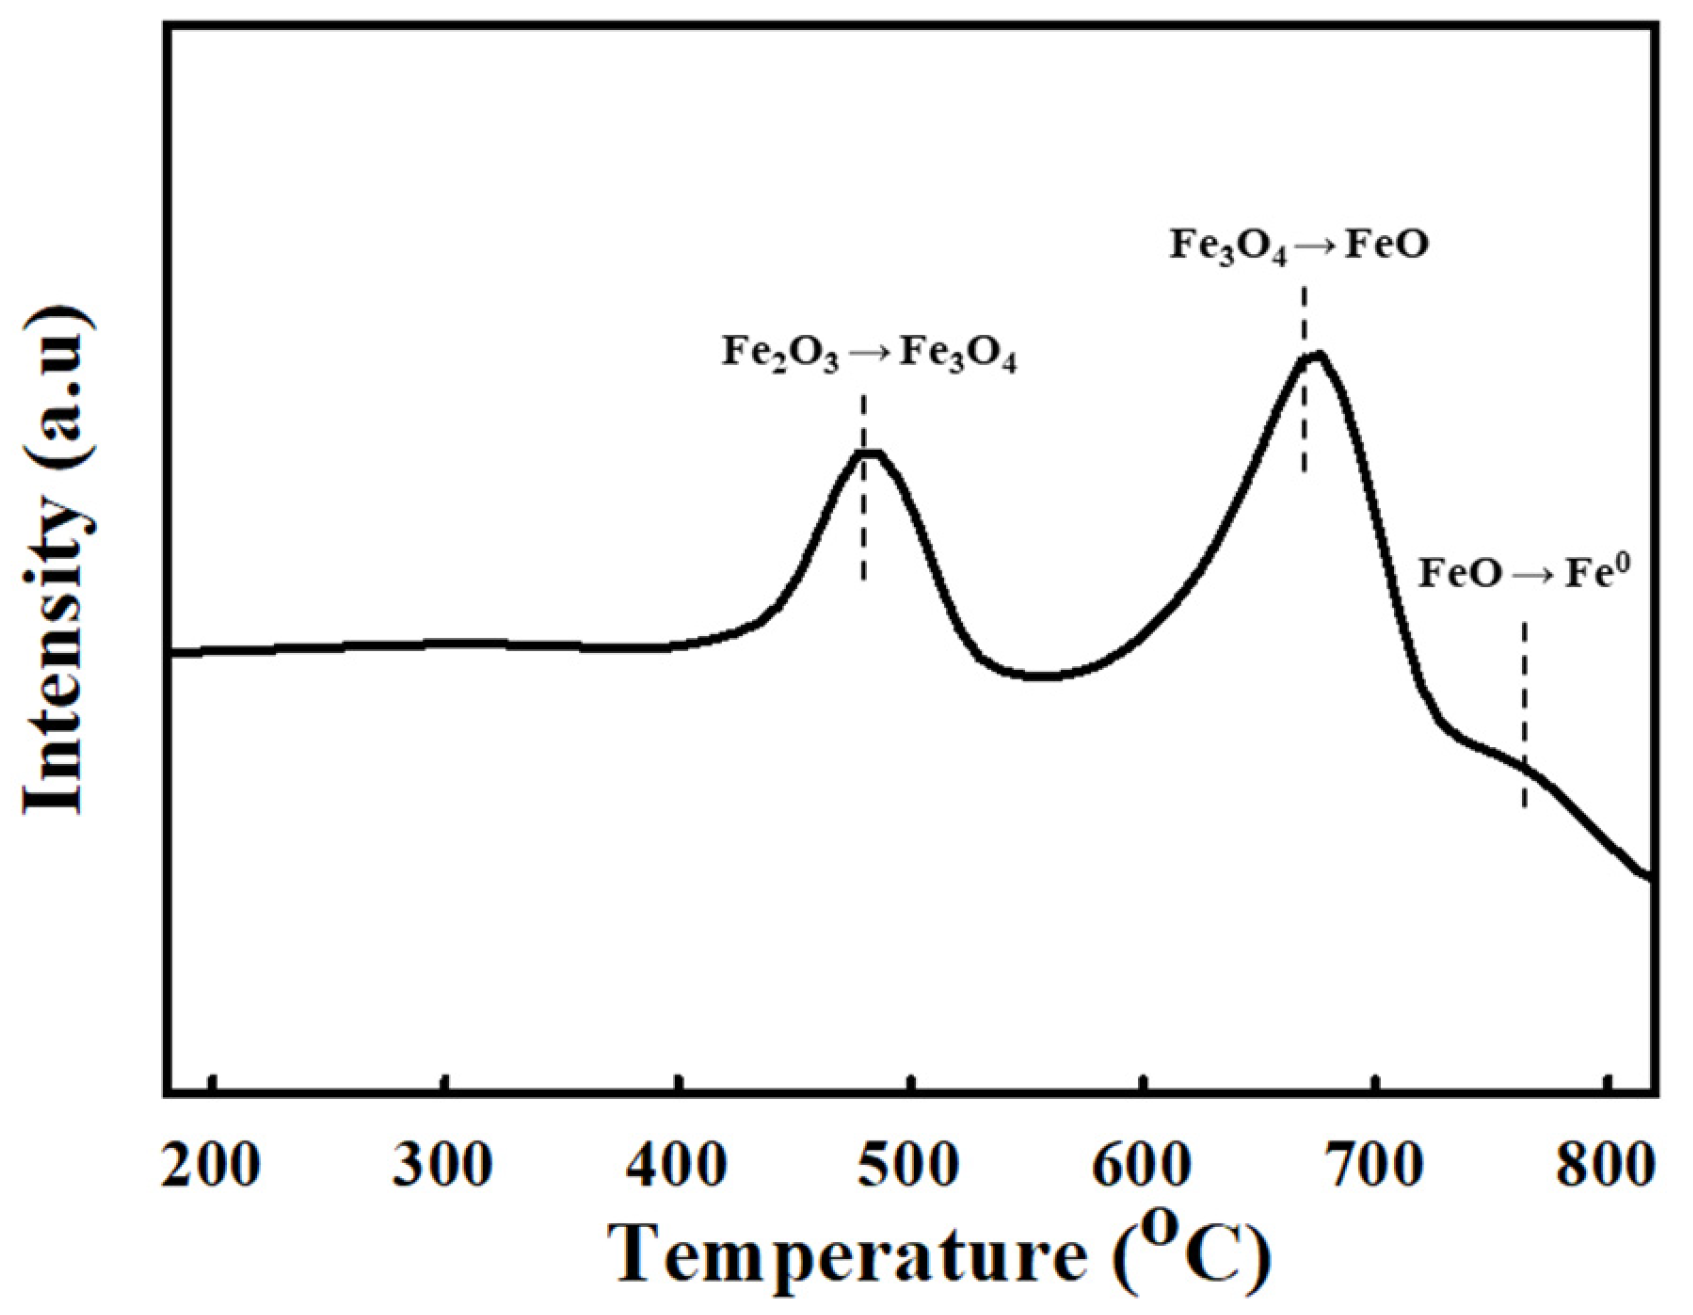
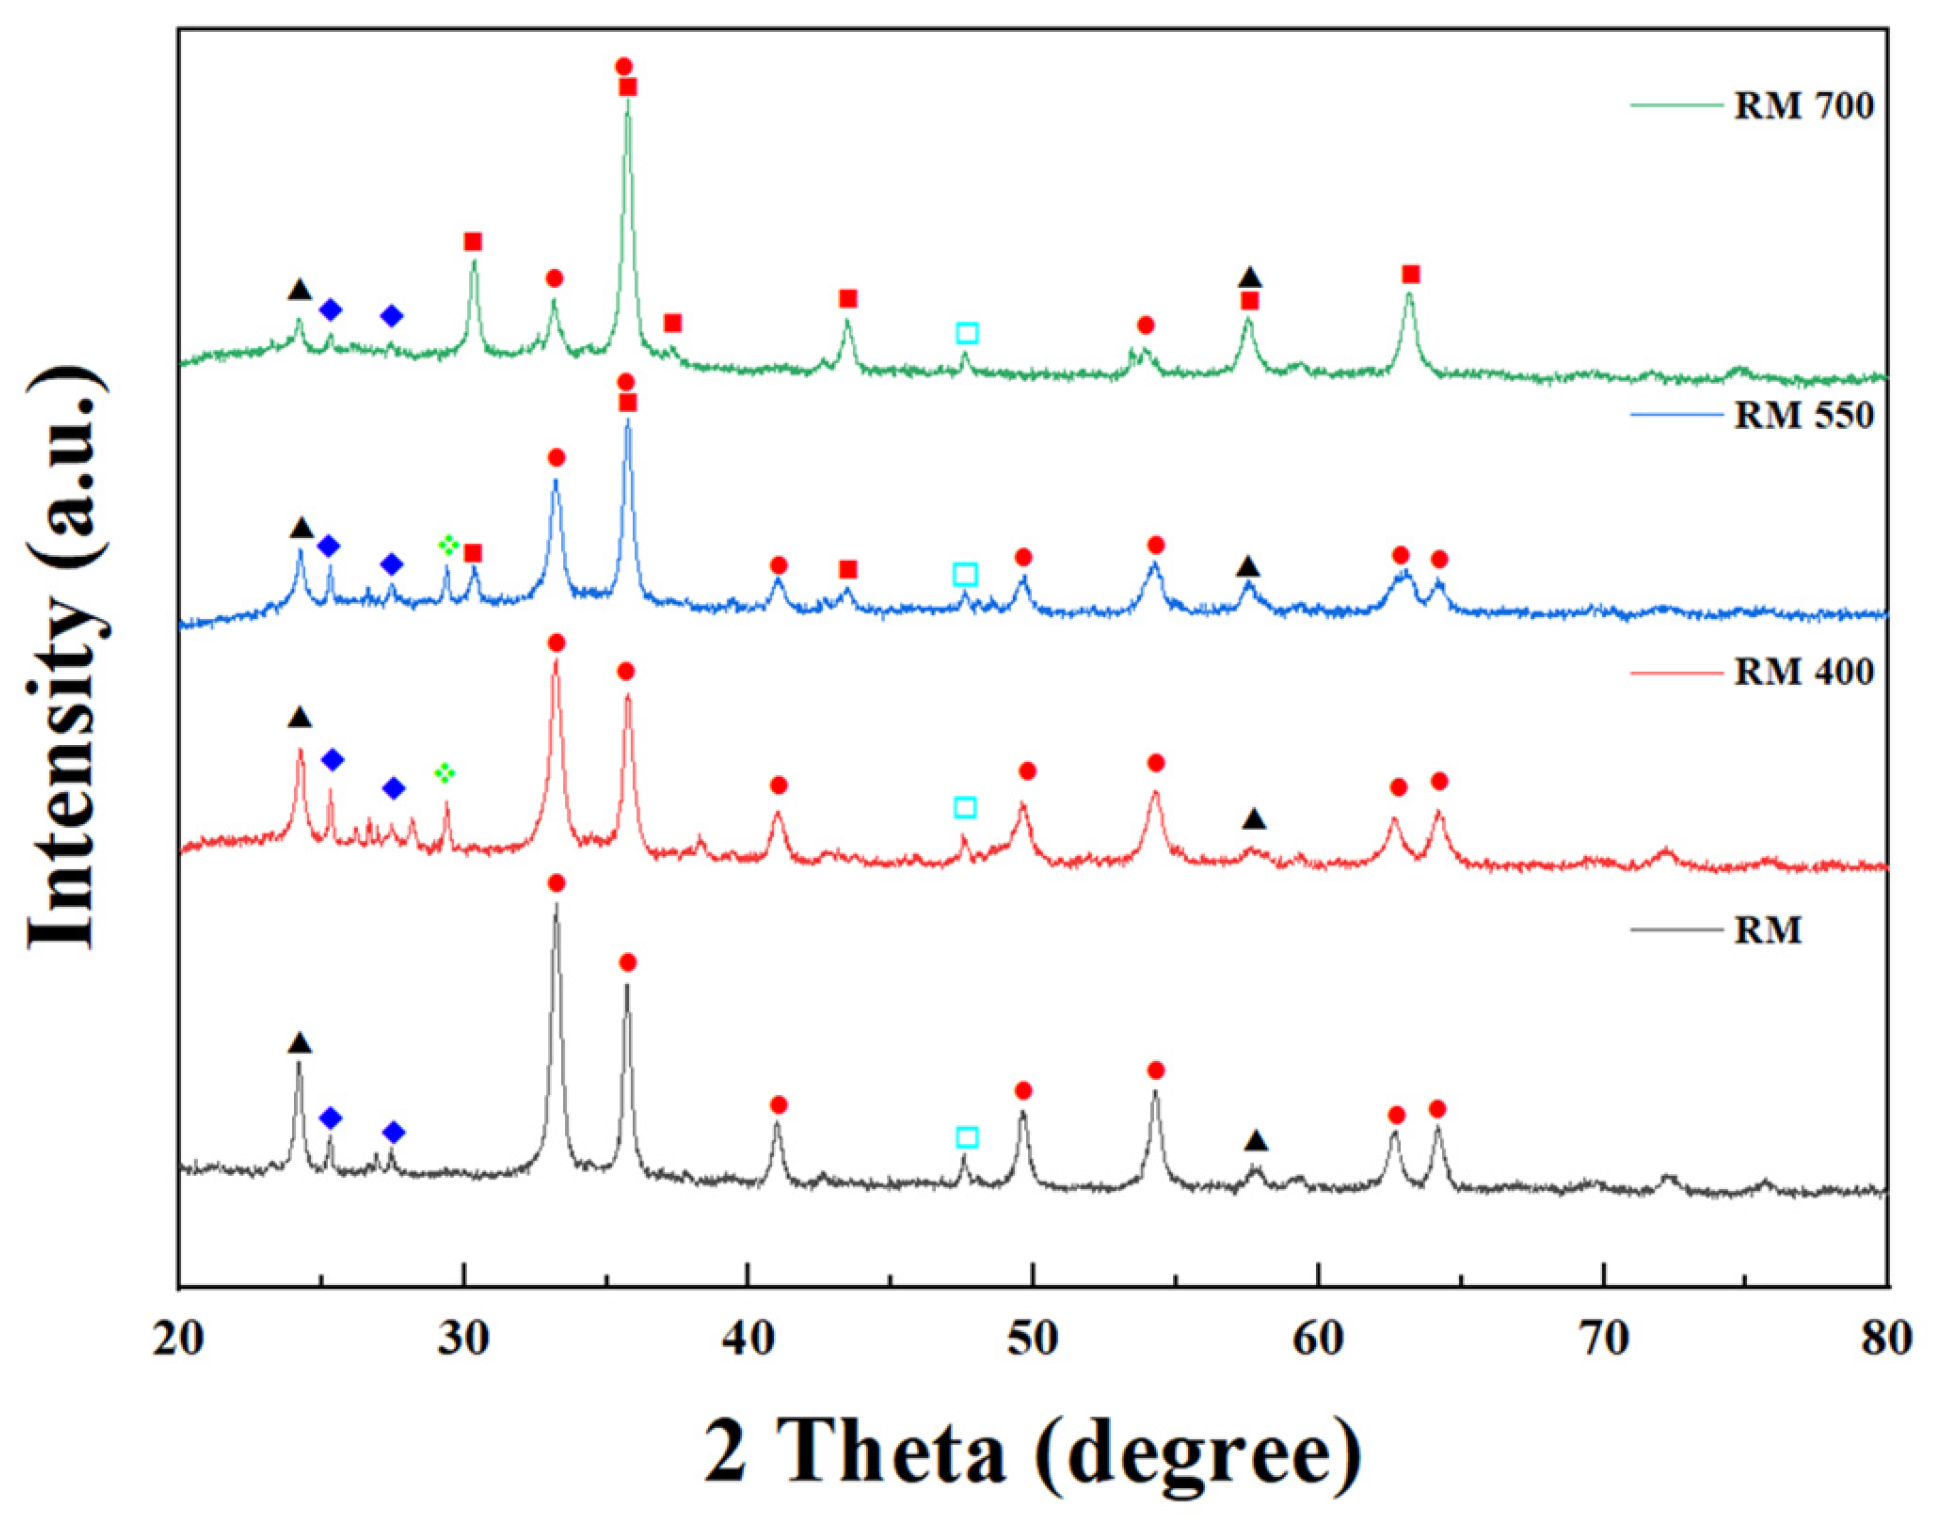
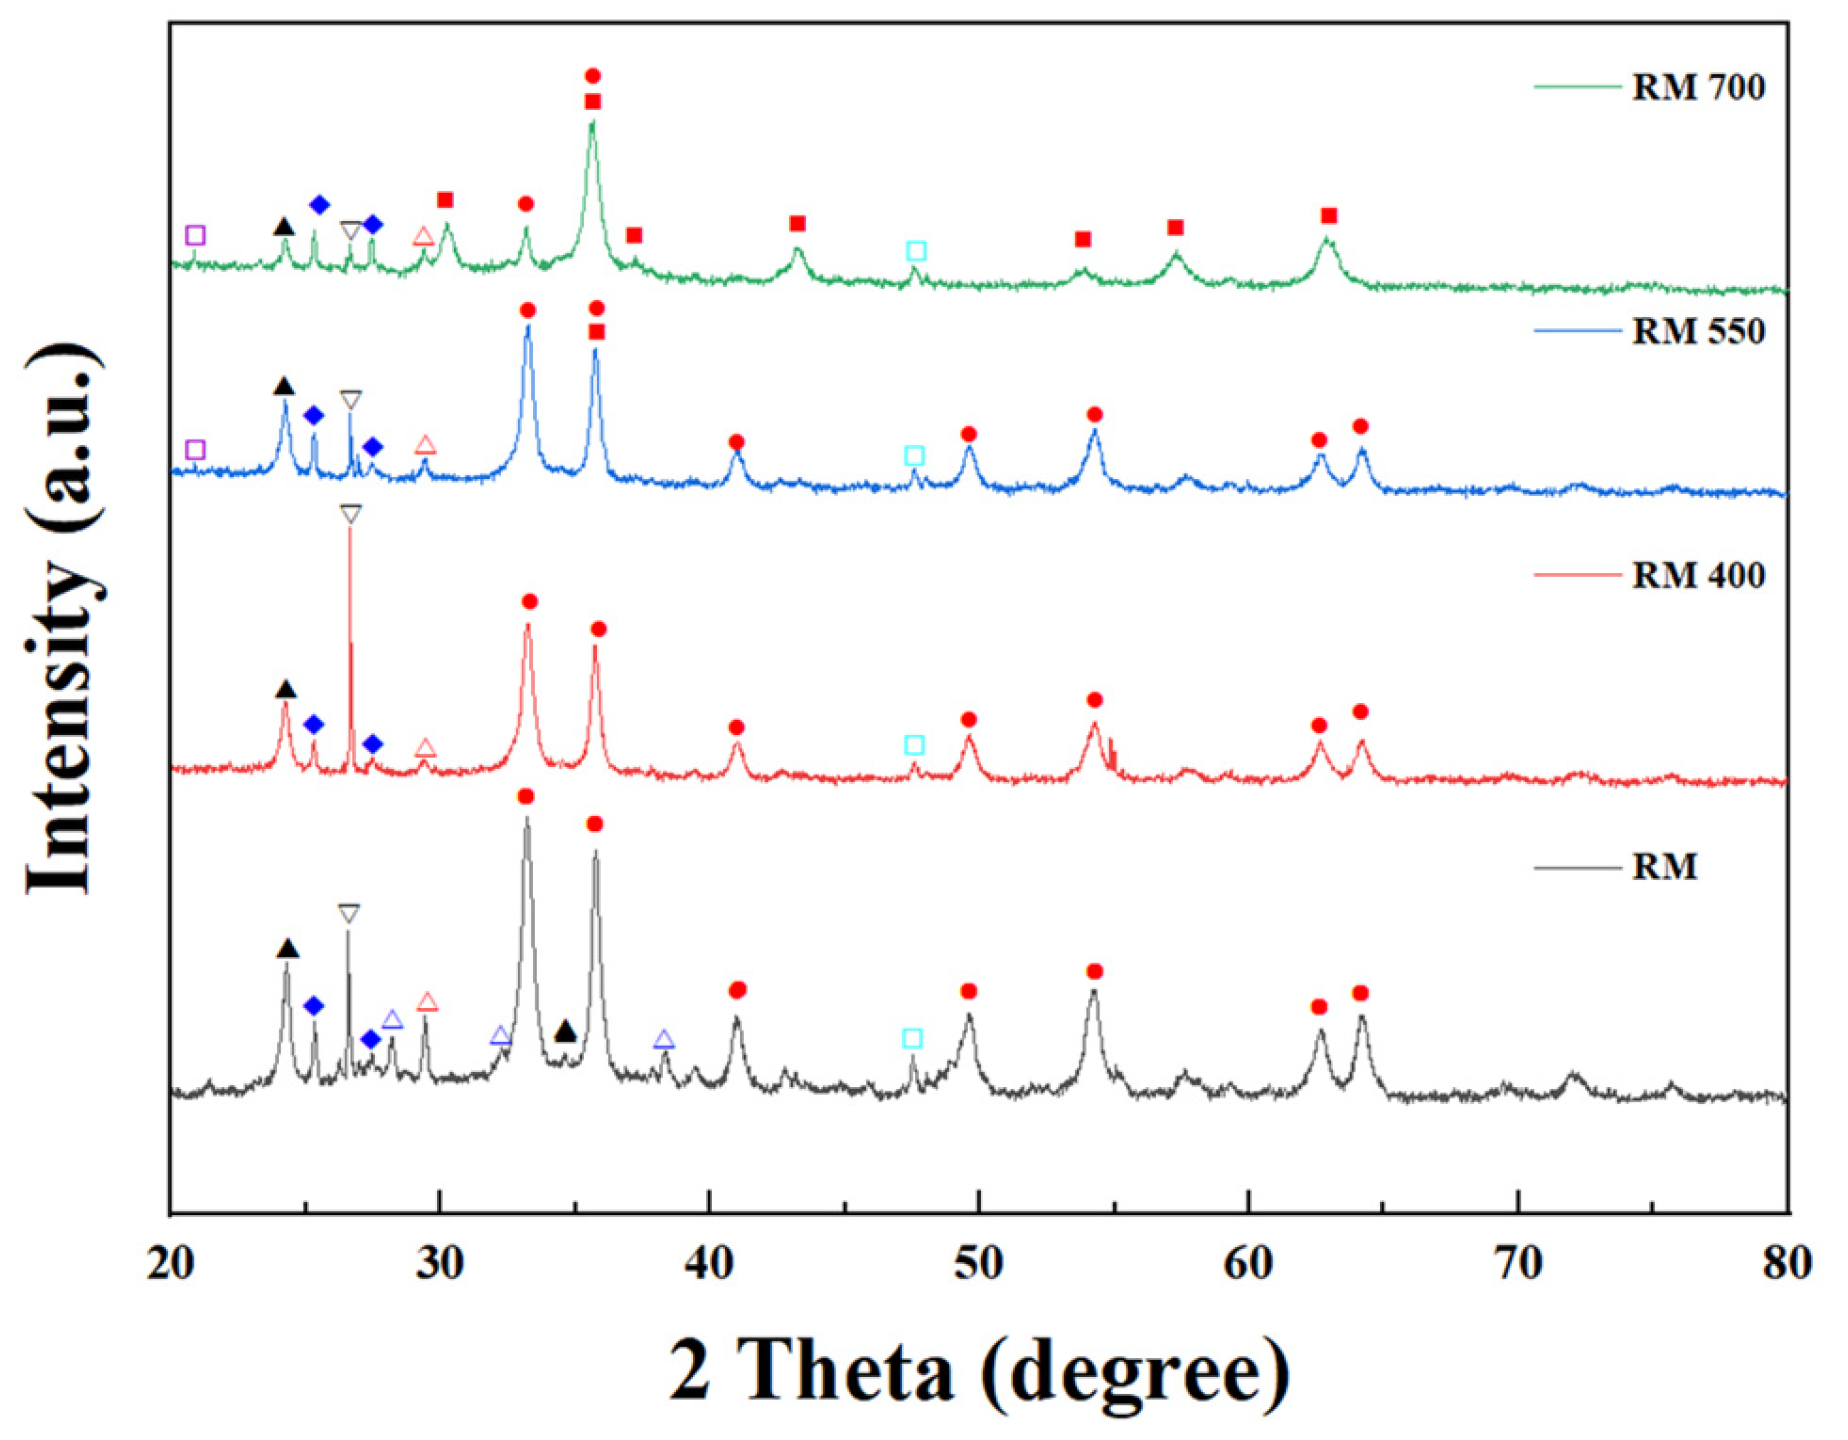
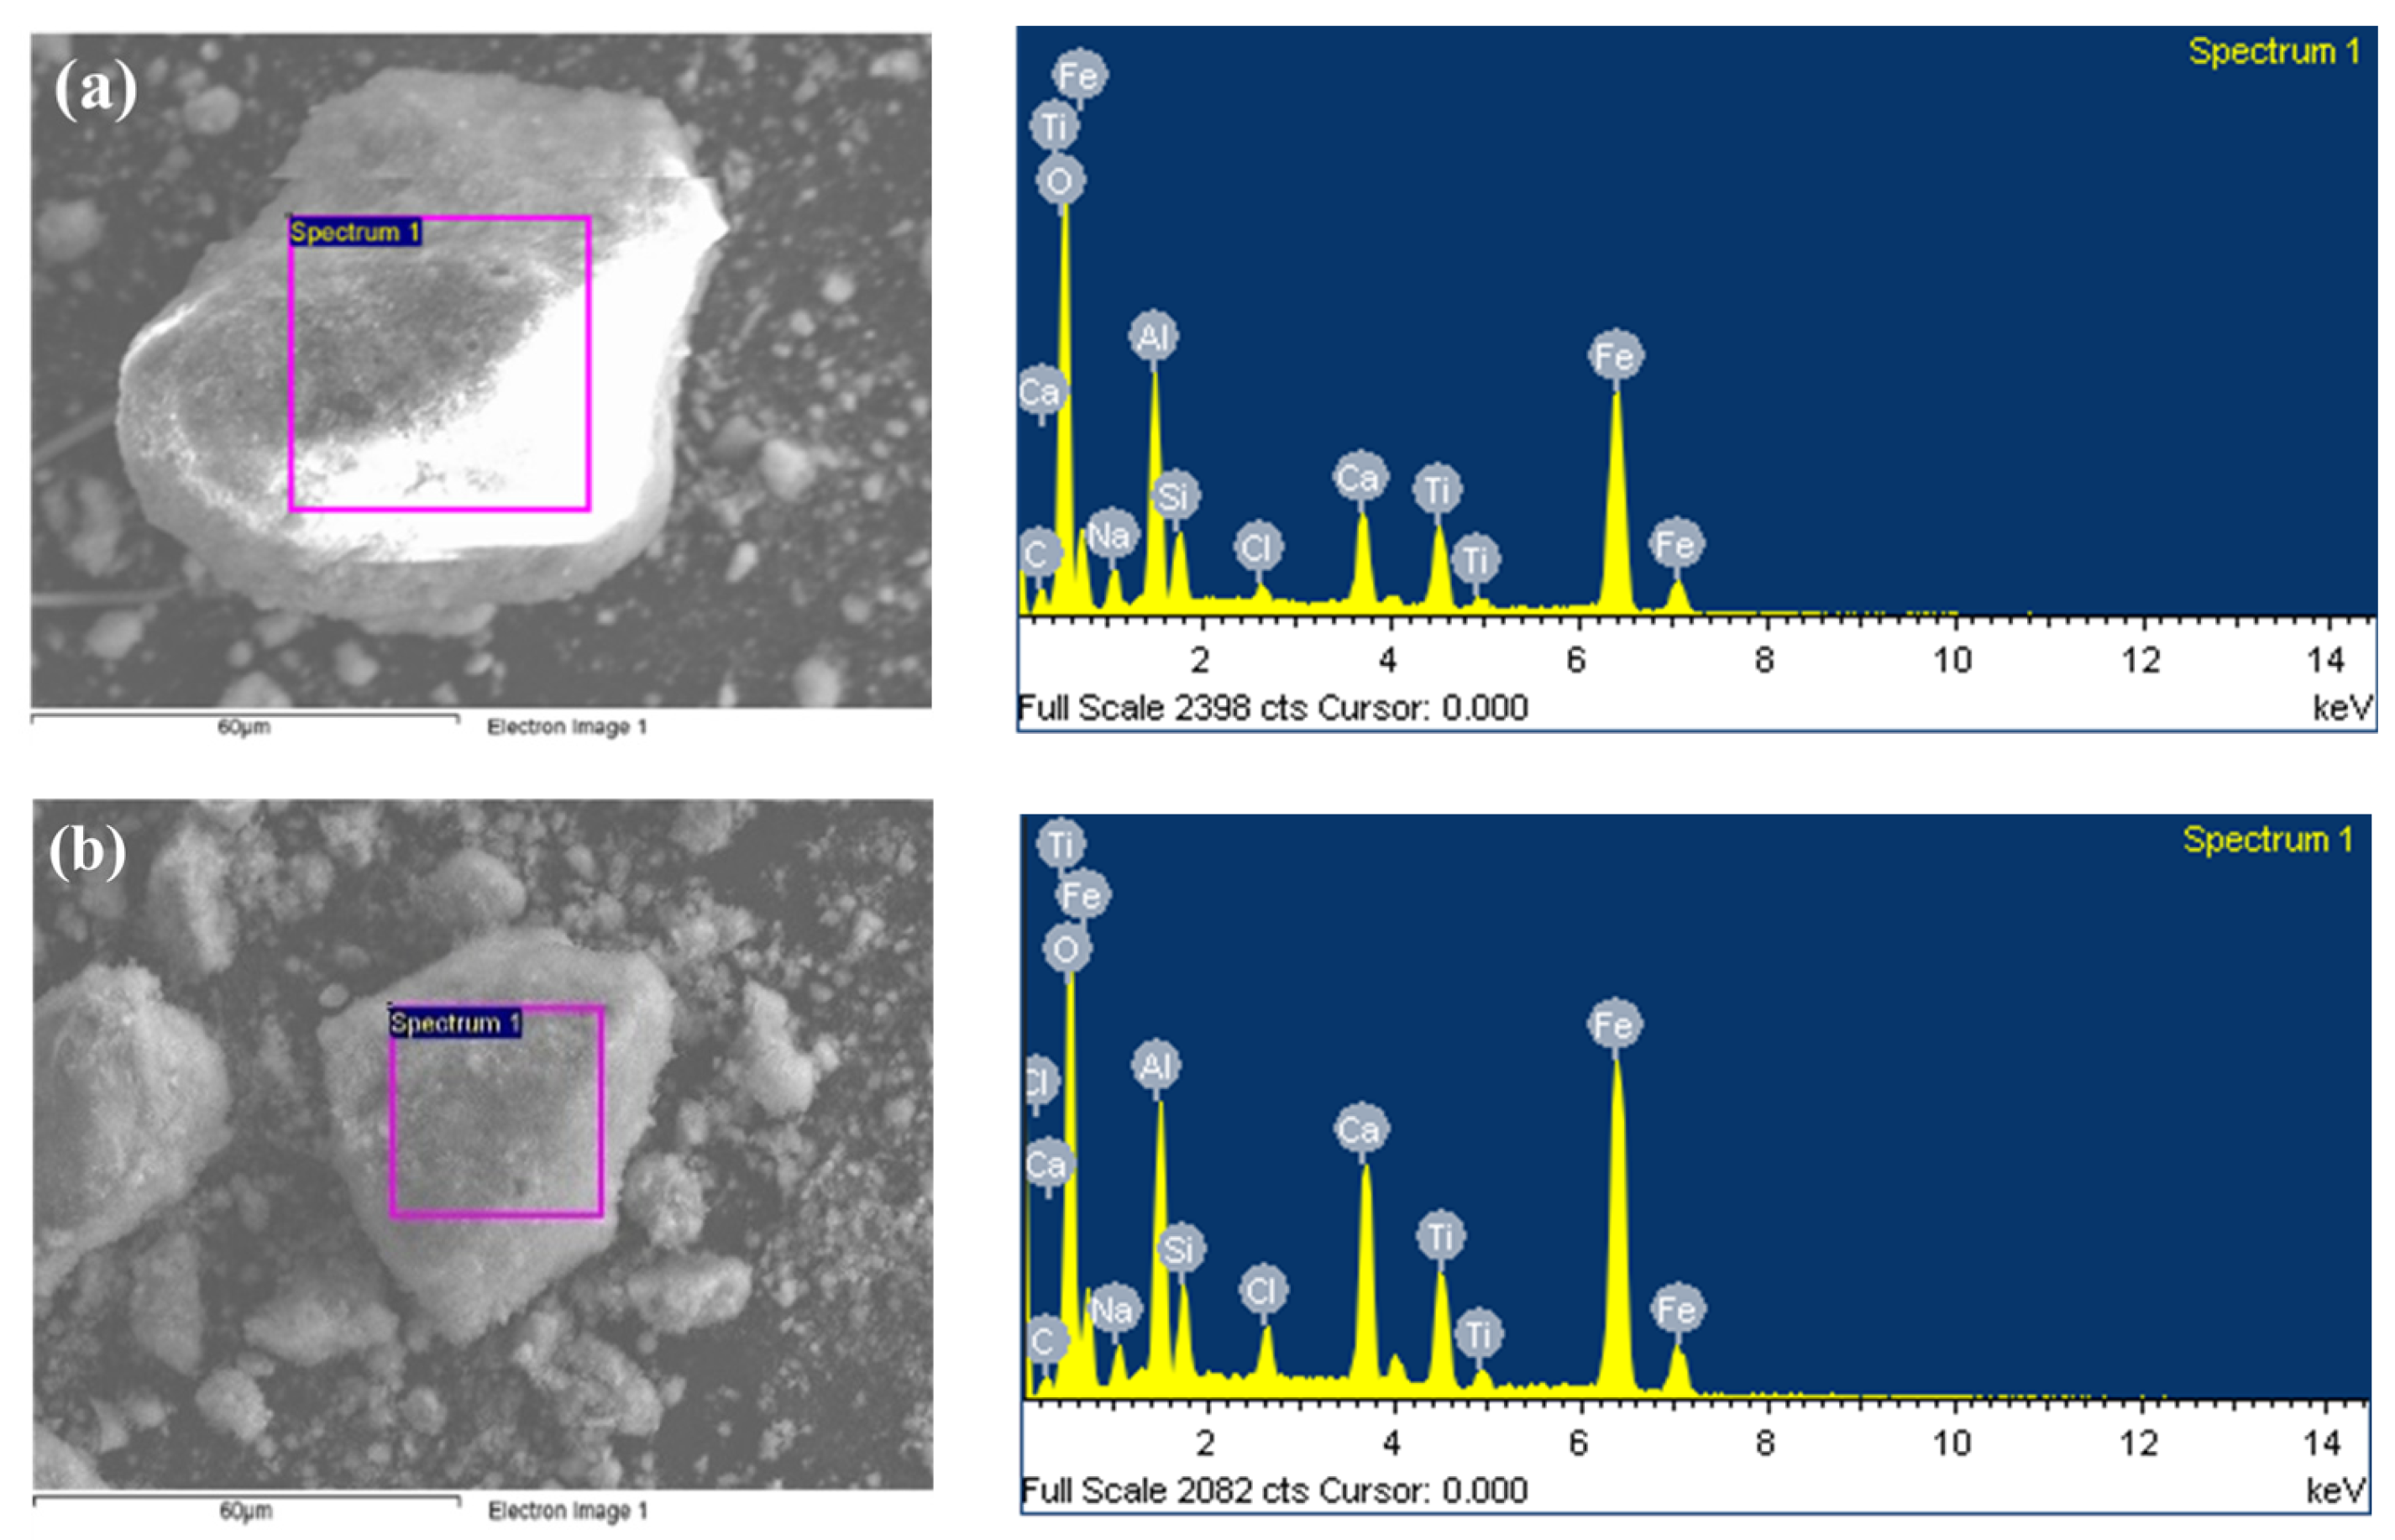
3.2. Characterization of the H2-Treated Red Mud

The chemical compositions of red mud were analyzed by X-ray fluorescence , as listed in Table S1. Here, it can be seen that the main components of red mud include Fe, Al, Na, Ca, Si, and Ti. Among the components, Fe has the highest content at 73.75%. The red mud used in this study had a high Fe ratio, and the alkaline components Na and Ca were found to be distributed in small amounts at 5.63 and 3.74%, respectively.
Figure 6 shows the H2-TPR profiles of the red mud under 10% H2 at a temperature range from 30 °C to 850 °C with a temperature ramp rate of 10 °C/min after pretreatment with N2 at 200 °C for 1 h. The H2-TPR curve of the red mud displayed two peaks at 430–520 °C and 630–800 °C, which are ascribed to the reduction in different iron oxides. The peak between 430 °C and 520 °C can be assigned to the reduction from Fe2O3 to Fe3O4, and the high-temperature peaks at 630–800 °C correspond to the reduction from Fe3O4 to FeO and included FeO to Fe metal [29,30,31]. Based on H2-TPR analysis, the H2 treatment temperature was set to 400 °C, 550 °C, and 700 °C to control the Fe oxide phase on red mud.
The physicochemical properties of H2-treated red muds were analyzed. As listed in Table 1, the BET surface area, pore volume, and average pore size of RM were 37.8 m2/g, 0.22 cm3/g, and 3.82 nm, respectively. In general, heat treatment reduces the specific surface area of red mud [32]. However, in the case of heat treatment using H2, there is no significant change in specific surface area, pore volume, and average pore size. It might be that the specific surface area is maintained as some of the Fe2O3 is reduced during the H2 treatment process.
Figure 7 shows the XRD patterns of red mud in fresh and H2-treatment with various temperatures. For the red mud, the peak of Fe2O3, TiO2 (JCPDS No. 65–5714), CaTiO3 (JCPDS No. 02–0907), and Na8(AlSiO4)6(CO3) (JCPDS No. 89–8103) were observed in the fresh state. After H2 treatment at 400 °C, there was no phase change in the Fe2O3 peak and CaCO3 (JCPDS No. 86–2334) was observed as Ca in the red mud reacted with the release of CO2 from the decomposition of some Na8(AlSiO4)6(CO3). The amount of Na8(AlSiO4)6(CO3) gradually decreased as the H2 treatment temperature increased. After the H2 treatment at 550 °C, it was confirmed that Fe2O3 and Fe3O4 structures were formed together. In the case of H2 treatment at 550 °C, unlike the H2-TPR results, it is difficult to completely reduce the Fe2O3 structure to the Fe3O4 structure. Finally, when the H2 treatment temperature reaches 700 °C, the peak of Fe2O3 decreased significantly, while the peak of Fe3O4 was exhibited. Therefore, in order to convert the Fe2O3 of red mud into the Fe3O4 structure, it is judged that hydrogen treatment must be performed at a temperature range of at least 700 °C. The peak of CaCO3 was not confirmed due to the release of CO2 from the decomposition of CaCO3 at 700 °C.

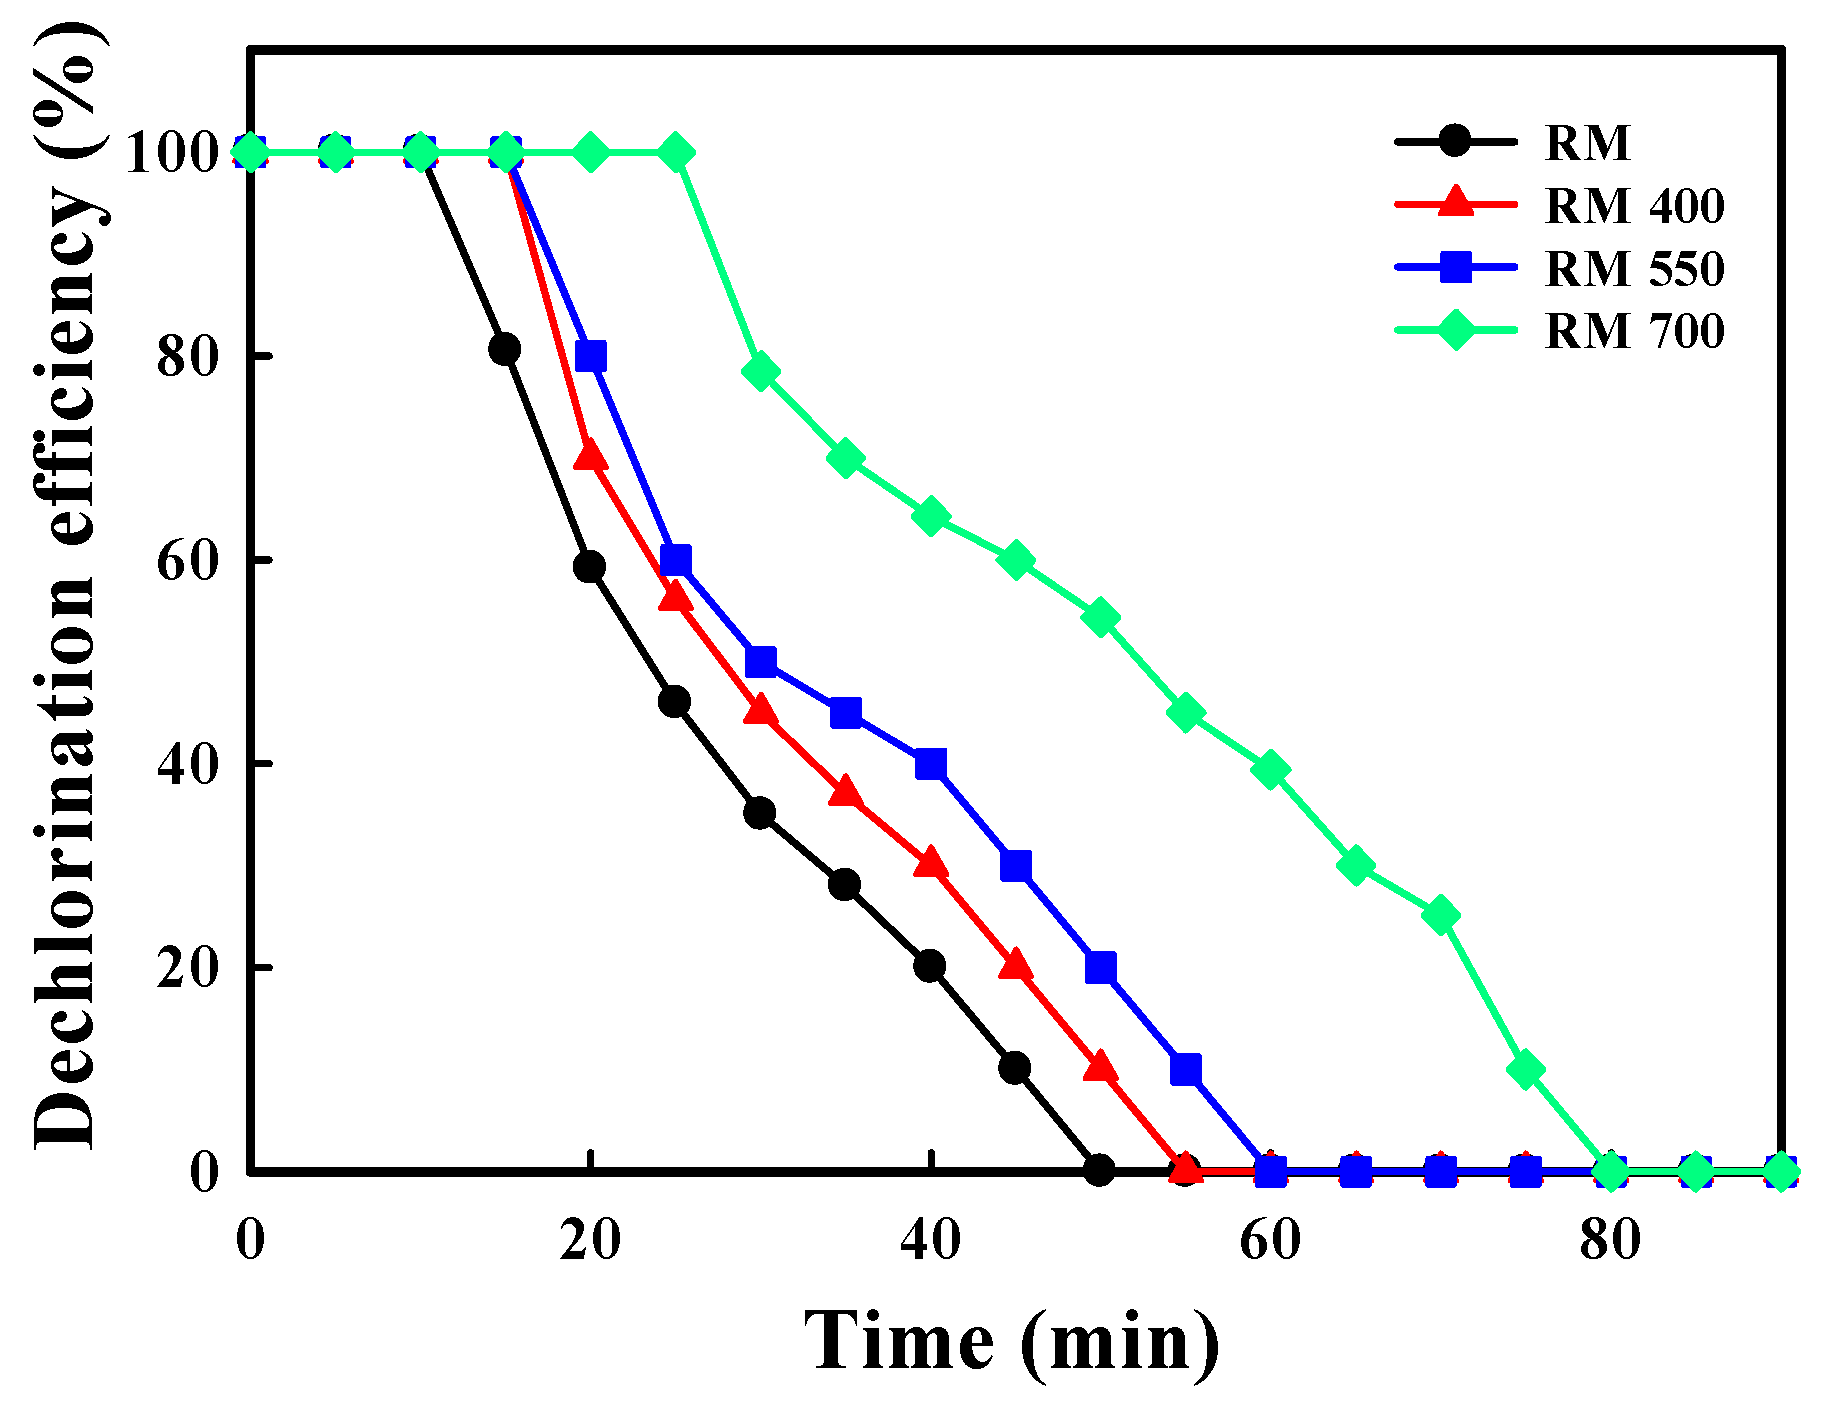
3.3. Dechlorination Capacity of the H2-Treated Red Mud

Figure 8 shows the dechlorination capacity of red mud with various H2 treatment temperatures. The dechlorination performances of the H2-treated red mud increase in the order of RM (10 min) < RM 400 and RM 550 (15 min) < RM 700 (29 min). In the 100% Dechlorination capacity range, the Cl2 adsorption capacity of RM, RM 400, RM 550, and RM 700 was 1.06, 1.58, 1.58, and 3.06 mgCl2/g, respectively. There is a significant difference between the dechlorination performances of RM without H2 treatment and RM with H2 treatment, indicating that the changes in phase of iron oxide on red mud by H2 treatment affect the reaction of the red mud with Cl2. Especially, the dechlorination performances change significantly when the treatment temperature is further increased from 550 to 700 °C. When comparing the treatment temperature in the XRD results, it is believed that this is because most of the Fe2O3 structure was transferred to the Fe3O4 structure under 700 °C. During the chlorination of hematite (Fe2O3 + 3Cl2 = 2FeCl3 + 3/2O2) or magnetite (3Fe3O4 + 3/2Cl2 = FeCl3 + 4Fe2O3), the oxygen may be consumed to produce higher oxides, thus affecting the subsequent chlorination behavior. As demonstrated in Section 3.1, the Fe3O4 phase has a critical influence on the dechlorination capacity rather than the Fe2O3 phase. Consequently, it was observed that the Cl2 gas adsorption capacity of red mud varies depending on the H2 pretreatment conditions. Accordingly, red mud at H2 treatment temperature of 700 °C showed about three times higher Cl2 adsorption compared to red mud without H2 treatment.
Figure 9 shows the XRD patterns of red mud with various H2 treatment temperatures after Cl2 adsorption. In the case of TiO2 and SiO2 peaks in all samples, no change was observed even after the Cl2 adsorption experiment. Therefore, it is judged that the TiO2 and SiO2 structures have no effect on Cl2 adsorption. The peak of Ca2Al2SiO7 (JCPDS No. 35–0755), Ca(ClO3)2 (JCPDS No. 01–0716), and NaClO3 (JCPDS No. 73–0145) was observed in red mud without H2 treatment after Cl2 adsorption. In the case of H2-treated red mud, the NaClO3 peak was relatively small after the Cl2 adsorption reaction, and it was confirmed that the Ca(ClO3)2 peak mainly increased. As the temperature of the H2 treatment process increases, the Na2CO3 structure relatively decreases because CO2 is desorbed, and the stable CaCO3 structure increases at high temperatures, so it is assumed that the Ca(ClO3)2 peak relatively increases after Cl2 adsorption. However, as shown in Figure 7, at the H2 treatment temperature of 700 °C, CO2 in the CaCO3 structure was desorbed and the CaCO3 peak almost disappeared, resulting in a tendency for the Ca(ClO3)2 peak to decrease after Cl2 adsorption. These results indicate that the presence of Na and Ca in the elemental composition has a decisive influence on the dechlorination capacity of the red mud. For the H2-treated red mud above 550 °C, the Fe3O4 peak relatively decreased and the FeCl3 peak was confirmed after the Cl2 adsorption, which is believed to have changed the Fe3O4 structure to the FeCl3 structure during the Cl2 adsorption. After Cl2 adsorption (Figure 10), the SEM-EDS analysis results showed that the Cl ion concentration was approximately 0.26% for the red mud without H2 treatment, and for the red mud with H2 treatment at 700 °C, the Cl ion concentration was confirmed to be 0.61%. Although the Na8(AlSiO4)6(CO3) structure was relatively reduced by the H2 treatment, when the Fe2O3 structure was converted to the Fe3O4 structure, it was relatively suitable for adsorbing Cl2.
Previously, authors have used adsorbents either in-situ or ex-situ and reported a decrease in Cl content in pyrolysis oil when using adsorbents [18,21,22,23,24]. This study used red mud containing Fe3O4, which is used as a Cl adsorbent, to confirm the Cl adsorption capacity of red mud. Red mud components with dechlorination activity include Na in the form of Na8(AlSiO4)6(CO3) and Ca in the form of CaCO3. During the H2 treatment of red mud, the forms of Na8(AlSiO4)6(CO3) and CaCO3, which have dechlorination activity, are reduced. However, the Cl adsorption capacity improved as the Fe3O4 form with high dechlorination activity increased from the Fe2O3 form with low dechlorination activity.

4. Conclusions

This study demonstrates that the development of a red mud-based adsorbent can play a significant role in both removing Cl2 gas generated during the pyrolysis of waste plastics and in addressing the environmental issues associated with red mud. Furthermore, recycling red mud in this study can reduce the post-processing costs of plastic pyrolysis technology and help preserve the environment. We intend to use Fe oxide, the main component of red mud, as a Cl2 adsorption source. Cl2 adsorption experiments according to the Fe oxide structure were investigated, and it was confirmed that the Fe3O4 structure had higher Cl2 adsorption than the Fe2O3 structure. In the case of Fe oxide in red mud, it has a Fe2O3 structure, so we tried to change the structure through the H2 treatment process to change it to a Fe3O4 structure. At an H2 treatment temperature of 700 °C, most Fe2O3 structures in red mud can be converted to Fe3O4 structure. After the Cl2 adsorption experiment, the Ca(ClO3)2, NaClO3, and FeCl3 structures were confirmed. In the case of red mud at an H2 treatment temperature of 700 °C, the ratio of Ca(ClO3)2 and NaClO3 structures was relatively reduced, but it was confirmed to have higher Cl2 adsorption performance. Converting the Fe2O3 structure to the Fe3O4 structure through the H2 treatment process appears to have a higher Cl2 absorption capacity compared to the alkaline structure without the H2 treatment state. As a result, through the H2 treatment process, we were able to obtain a Cl2 adsorption capacity that was about three times higher than that of red mud that was not H2 treated.
Although H2-treated red mud exhibits higher Cl2 adsorption performance than red mud without H2 treatment, the manufacturing cost increases relatively as high calcination temperature is required. To improve this, future research will be conducted to enable the reduction in iron oxide in red mud at lower temperatures.

Supplementary Materials

The following supporting information can be downloaded at: https://www.mdpi.com/article/10.3390/su16031137/s1, Figure S1: Calibration curve for Cl2 between the Ion Chromatograph analysis and the real-time measurement; Table S1: Chemical Compositions of the red mud, as analyzed by XRF.

Author Contributions

Conceptualization, T.-Y.K. and S.-H.H.; formal analysis, S.-H.H. and H.-W.J.; Funding acquisition, S.-H.K.; investigation, T.-Y.K., S.-H.H., H.-W.J., Y.L., S.-H.K. and H.-J.K.; supervision, S.-C.L., J.-C.K. and S.-H.K.; writing—original draft, T.-Y.K. and S.-H.H.; writing—review and editing, T.-Y.K. and S.-C.L. All authors have read and agreed to the published version of the manuscript.

Funding

This study was supported by Korea Environmental Industry & Technology Institute (KEITI), funded by the Ministry of Environment (MOE), Republic of Korea. (No. 2022003490004).

Institutional Review Board Statement

Not applicable.

Informed Consent Statement

Not applicable.

Data Availability Statement

The data presented in this study are available on request from the corresponding author. Data are contained within the article or Supplementary Material.

Acknowledgments

The financial support mentioned in the Funding part is gratefully acknowledged.

Conflicts of Interest

The authors declare no conflict of interest.

References

  1. Jiang, J.; Shi, K.; Zhang, X.; Yu, K.; Zhang, H.; He, J.; Ju, Y.; Liu, J. From plastic waste to wealth using chemical recycling: A review. J. Environ. Chem. Eng. 2022, 10, 106867. [Google Scholar] [CrossRef]
  2. Europe, P. Plastics—The Facts 2021. 2021. Available online: https://plasticseurope.org/knowledge-hub/plastics-the-fast-facts-2023 (accessed on 18 December 2023).
  3. Barnes, D.K.; Galgani, F.; Thompson, R.C.; Barlaz, M. Accumulation and fragmentation of plastic debris in global environments. Philos. Trans. R. Soc. Lond. B Biol. Sci. 2009, 364, 1985–1998. [Google Scholar] [CrossRef]
  4. Geyer, R.; Jambeck, J.R.; Law, K.L. Production, use, and fate of all plastics ever made. Sci. Adv. 2017, 3, e1700782. [Google Scholar] [CrossRef] [PubMed]
  5. Uddin, M.A.; Sakata, Y.; Shiraga, Y.; Muto, A.; Murata, K. Dechlorination of chlorine compounds in poly (vinyl chloride) mixed plastics derived oil by solid sorbents. Ind. Eng. Chem. Res. 1999, 38, 1406–1410. [Google Scholar] [CrossRef]
  6. Baca, D.; Monroy, R.; Castillo, M.; Elkhazraji, A.; Farooq, A.; Ahmad, R. Dioxins and plastic waste: A scientometric analysis and systematic literature review of the detection methods. Environ. Adv. 2023, 13, 100439. [Google Scholar] [CrossRef]
  7. Kijo-Kleczkowska, A.; Gnatowski, A. Recycling of Plastic Waste, with Particular Emphasis on Thermal Methods—Review. Energies 2022, 15, 2114. [Google Scholar] [CrossRef]
  8. Naderi Kalali, E.; Lotfian, S.; Entezar Shabestari, M.; Khayatzadeh, S.; Zhao, C.; Yazdani Nezhad, H. A critical review of the current progress of plastic waste recycling technology in structural materials. Curr. Opin. Green Sustain. 2023, 40, 100763. [Google Scholar] [CrossRef]
  9. Al-Salem, S.M.; Lettieri, P.; Baeyens, J. Recycling and recovery routes of plastic solid waste (PSW): A review. J. Waste Manag. 2009, 29, 2625–2643. [Google Scholar] [CrossRef]
  10. Lopez, A.; de Marco, I.; Caballero, B.M.; Laresgoiti, M.F.; Adrados, A. Pyrolysis of municipal plastic wastes: Influence of raw material composition. J. Mater. Cycles Waste Manag. 2010, 30, 620–627. [Google Scholar] [CrossRef]
  11. Kunwar, B.; Cheng, H.N.; Chandrashekaran, S.R.; Sharma, B.K. Plastics to fuel: A review. Renew. Sust. Energ. Rev. 2016, 54, 421–428. [Google Scholar] [CrossRef]
  12. Khoo, H.H. LCA of plastic waste recovery into recycled materials, energy and fuels in Singapore. Resour. Conserv. Recycl. 2019, 145, 67–77. [Google Scholar] [CrossRef]
  13. Gear, M.; Sadhukhan, J.; Thorpe, R.; Clift, R.; Seville, J.; Keast, M. A life cycle assessment data analysis toolkit for the design of novel processes—A case study for a thermal cracking process for mixed plastic waste. J. Clean. Prod. 2018, 180, 735–747. [Google Scholar] [CrossRef]
  14. Blazsó, M.; Zelei, B.; Jakab, E. Thermal decomposition of low-density polyethylene in the presence of chlorine-containing polymers. JAAP 1995, 35, 221–235. [Google Scholar] [CrossRef]
  15. Sakata, Y.; Uddin, M.A.; Koizumi, K.; Murata, K. Thermal degradation of polyethylene mixed with poly (vinyl chloride) and poly (ethyleneterephthalate). Polym. Degrad. Stab. 1996, 53, 111–117. [Google Scholar] [CrossRef]
  16. Kasar, P.; Sharma, D.; Ahmaruzzaman, M. Thermal and catalytic decomposition of waste plastics and its co-processing with petroleum residue through pyrolysis process. J. Clean. Prod. 2020, 265, 121639. [Google Scholar] [CrossRef]
  17. Horikawa, S.; Takai, Y.; Ukei, H.; Azuma, N.; Ueno, A. Chlorine gas recovery from polyvinyl chloride. JAAP 1999, 51, 167–179. [Google Scholar] [CrossRef]
  18. Bhaskar, T.; Kaneko, J.; Muto, A.; Sakata, Y.; Jakab, E.; Matsui, T.; Uddin, M.A. Pyrolysis studies of PP/PE/PS/PVC/HIPS-Br plastics mixed with PET and dehalogenation (Br, Cl) of the liquid products. JAPP 2004, 72, 27–33. [Google Scholar] [CrossRef]
  19. Wood, M.H.; Arellano, A.V.; Van Wijk, L. Corrosion Related Accidents in Petroleum Refineries; JRC, Report no. EUR 2013, 26331; Publications Office of the European Union: Luxembourg, 2013. [Google Scholar]
  20. Alanazi, N.; Adam, F.; Nagu, M. Organochloride contamination in a refinery naphtha hydrotreater unit. Mater. Perform 2017, 56, 1–5. [Google Scholar]
  21. Yanik, J.; Uddin, M.A.; Ikeuchi, K.; Sakata, Y. The catalytic effect of Red Mud on the degradation of poly (vinyl chloride) containing polymer mixture into fuel oil. Polym. Degrad. Stab. 2001, 73, 335–346. [Google Scholar] [CrossRef]
  22. Sakata, Y.; Bhaskar, T.; Uddin, M.A.; Muto, A.; Matsui, T. Development of a catalytic dehalogenation (Cl, Br) process for municipal waste plastic-derived oil. J. Mater. Cycles Waste Manag. 2003, 5, 113–124. [Google Scholar] [CrossRef]
  23. Ahmed, O.H.; Altarawneh, M.; Al-Harahsheh, M.; Jiang, Z.-T.; Dlugogorski, B.Z. Catalytic de-chlorination of products from PVC degradation by magnetite (Fe3O4). Appl. Surf. Sci. 2019, 480, 792–801. [Google Scholar] [CrossRef]
  24. Ye, L.; Li, T.; Hong, L. Co-pyrolysis of Fe3O4-poly(vinyl chloride) (PVC) mixtures: Mitigation of chlorine emissions during PVC recycling. J. Mater. Cycles Waste Manag. 2021, 126, 832–842. [Google Scholar] [CrossRef] [PubMed]
  25. Hong, H.S.; Kim, Y.L.; Cho, H.J.; Kim, D.W.; Kim, D.W.; Kim, H.J.; Kim, S.P. Overview and Future Concerns for Red Mud Recycling Technology and Industry. J. Korean Inst. Resour. Recycl. 2017, 26, 12–21. [Google Scholar]
  26. Bhatnagar, A.; Vilar, V.J.; Botelho, C.M.; Boaventura, R.A. A review of the use of red mud as adsorbent for the removal of toxic pollutants from water and wastewater. Environ. Technol. 2011, 32, 231–249. [Google Scholar] [CrossRef] [PubMed]
  27. Hubáček, J.; Lederer, J.; Kuráň, P.; Koutník, P.; Gholami, Z.; Zbuzek, M.; Bačiak, M. Dechlorination during pyrolysis of plastics: The potential of stepwise pyrolysis in combination with metal sorbents. Fuel Process. Technol. 2022, 231, 107226. [Google Scholar] [CrossRef]
  28. López, A.; De Marco, I.; Caballero, B.; Laresgoiti, M.; Adrados, A.; Aranzabal, A. Catalytic pyrolysis of plastic wastes with two different types of catalysts: ZSM-5 zeolite and Red Mud. Appl. Catal. B Environ. 2011, 104, 211–219. [Google Scholar] [CrossRef]
  29. Jozwiak, W.K.; Kaczmarek, E.; Maniecki, T.P.; Ignaczak, W.; Maniukiewicz, W. Reduction behavior of iron oxides in hydrogen and carbon monoxide atmospheres. Appl. Catal. A Gen. 2007, 326, 17–27. [Google Scholar] [CrossRef]
  30. Sirikulbodee, P.; Phongaksorn, M.; Sornchamni, T.; Ratana, T.; Tungkamani, S. Effect of Different Iron Phases of Fe/SiO2 Catalyst in CO2 Hydrogenation under Mild Conditions. Catalysts 2022, 12, 698. [Google Scholar] [CrossRef]
  31. Abu Tahari, M.N.; Salleh, F.; Tengku Saharuddin, T.S.; Dzakaria, N.; Samsuri, A.; Mohamed Hisham, M.W.; Yarmo, M.A. Influence of hydrogen and various carbon monoxide concentrations on reduction behavior of iron oxide at low temperature. Int. J. Hydrogen Energy. 2019, 44, 20751–20759. [Google Scholar] [CrossRef]
  32. Joseph, C.G.; Yap, Y.H.T.; Krishnan, V.; Puma, G.L. Application of modified red mud in environmentally-benign applications: A review. Environ. Eng. Res. 2020, 25, 795–806. [Google Scholar] [CrossRef]
Figure 1. The schematic diagram of extrusion molding red mud samples.
Sustainability 16 01137 g001
Figure 2. The schematic diagram of experimental apparatus.
Sustainability 16 01137 g002
Figure 3. The dechlorination capacity of Fe2O3 and Fe3O4 in the presence of 100 ppm Cl2 at 350 °C.
Sustainability 16 01137 g003
Figure 4. XRD patterns of iron oxide (a) fresh and (b) after Cl2 adsorption at 350 °C: () Fe2O3, () Fe3O4.
Sustainability 16 01137 g004
Figure 5. SEM images and corresponding EDS analyses of the (a) Fe2O3 and (b) Fe3O4 after Cl2 adsorption at 350 °C.
Sustainability 16 01137 g005aSustainability 16 01137 g005b
Figure 6. H2-TPR profile of red mud under 10% H2 conditions from 30 °C to 850 °C at a temperature ramp rate of 10 °C/min.
Sustainability 16 01137 g006
Figure 7. XRD patterns of RM, RM 400, RM 550 and RM 700: () Fe2O3, () Fe3O4, () CaCO3, () TiO2, () SiO2, (▲) Na8(AlSiO4)6(CO3).
Sustainability 16 01137 g007
Figure 8. The dechlorination capacity of RM, RM 400, RM 550, and RM 700 in the presence of 100 ppm Cl2 at 350 °C.
Sustainability 16 01137 g008
Figure 9. XRD patterns of RM, RM 400, RM 550 and RM 700 after Cl2 adsorption at 350 °C: () Fe2O3, () Fe3O4, () TiO2, () SiO2, (▲) Na8(AlSiO4)6(CO3), () NaClO3, () Na4Al3Si9O24Cl, (▽) Ca(ClO3)2, () FeCl3.
Sustainability 16 01137 g009
Figure 10. SEM images and corresponding EDS analyses of the (a) RM and (b) RM 700 after Cl2 adsorption at 350 °C.
Sustainability 16 01137 g010
Table 1. Texture properties of RM, RM 400, RM 550, and RM 700.
SampleBET Surface Area
(m2/g)
Pore Volume
(cm3/g)
Average Pore Size
(nm)
RM37.80.223.82
RM 40042.80.213.41
RM 55032.00.183.05
RM 70036.50.183.14
Disclaimer/Publisher’s Note: The statements, opinions and data contained in all publications are solely those of the individual author(s) and contributor(s) and not of MDPI and/or the editor(s). MDPI and/or the editor(s) disclaim responsibility for any injury to people or property resulting from any ideas, methods, instructions or products referred to in the content.

