
Promoting Emergency Medical Service Infrastructure Equality to Reduce Road Crash Fatalities
1
School of Smart Safety System, Dongyang University, 2741 Pyeonghwaro, Dongducheon 11307, Gyeonggido, Republic of Korea
2
Department of Civil and Environmental Engineering, University of Wisconsin-Milwaukee, NWQ 4414, P.O. Box 784, Milwaukee, WI 53201, USA
*
Author to whom correspondence should be addressed.
Sustainability 2024, 16(3), 1000; https://doi.org/10.3390/su16031000
Submission received: 13 December 2023
/
Revised: 19 January 2024
/
Accepted: 22 January 2024
/
Published: 24 January 2024
(This article belongs to the Special Issue Sustainable Transportation and Urban Planning)
Abstract
:Timely emergency medical service (EMS) is critical to mitigate outcomes of severe traffic crashes, especially in rural areas. The urban–rural inequality of the EMS infrastructure has been one of the factors contributing to a higher death rate for patients in rural road crashes. To address the spatial imbalance of EMS infrastructure, this study aimed to provide a methodological framework for evaluating the existing EMS infrastructure by taking South Korea’s EMS infrastructure expansion plans as the case study. Specifically, this study developed a road crash data-driven methodology to promote spatial balance and economical expansion of EMS infrastructure of all types, including EMS stations, hospitals, the helicopter fleet, and landing spots. Geographically weighted binary logit regression and spatial analysis identified strategic locations for prioritizing the EMS infrastructure expansion using crash victim data and road networks to close the gap between urban and rural areas. The analysis of access to existing EMS infrastructure showed that the 16 to 20 min EMS response time, including on-scene time and transport time ranging from 11 to 15 min, are significantly associated with higher crash fatalities. The results also suggested that EMS stations and heliports are inadequate to meet the EMS time thresholds in the central province of Korea. The findings of this research could inform policymakers as they are working toward expanding the EMS infrastructure and creating a more equitable EMS response when it comes to transporting rural road crash patients.
1. Introduction
Access inequality in emergency medical services (EMS) can significantly contribute to disparities in the provision of timely and effective emergency care. This inequality is manifested through the distribution of EMS resources, and disparities in technology and infrastructure such as access to reliable communication networks. Rural and remote areas with poor infrastructure suffer from difficulties in connecting with EMS in a timely manner, which results in an overall higher traffic crash fatality rate when compared to their urban counterparts. It is evident that significant EMS resource inequality leads to regionally pronounced service disparities [1,2,3,4,5,6,7,8,9]. To address the imbalance of EMS response induced by EMS resource disparities, previous research has proposed methodologies such as stable traffic crash prediction, crash detection equipment reallocation, and hospital accessibility measurement [8,9].
The spatial disparities for road crashes and EMS resources are prominent in South Korea (Korea, hereafter) where approximately 64% of the entire road network in 2022 was classified as rural [10]. In Korea, the average prehospital EMS times in urban and rural areas are 36 and 42 min, respectively, showing a significant gap when considering the “golden hour” after a trauma injury [11]. Note that prehospital EMS time is defined as the time between the emergency call being received and a patient’s arrival at the hospital [12]. From 2018 to 2022, the fatalities per crash on Korean urban roads were one-third of those on rural roads [10]. Korea has nine provinces with seven metropolitan cities and the capital province alone is home to 35.3% of total EMS hospitals in Korea because of its high population density. More than 30% of severely injured patients are transported to EMS hospitals in nearby metropolitan cities [13]. The coefficient of variance for the number of EMS hospitals per million people is approximately 46% across the nine provinces, implying huge provincial disparities in the EMS infrastructure [14]. This has led to the fact that only 49.6% of severe emergency patients are transported to an appropriate EMS hospital in a timely manner [14]. For the death rate of patients transported from traffic crashes, the coefficient of variance is approximately 30% across the nine provinces, while the average death rate is 1.4%. Specifically, the death rates of patients transported from traffic crashes are comparatively high in the southwestern (2.2%), northeastern (1.9%), and central (1.7%) Korean provinces, which are the more rural areas in Korea. Moreover, many EMS hospitals in rural areas of Korea have suffered from a lack of medical resources, including medical specialists, equipment and number of rooms [14]. For example, the average number of medical specialists per EMS hospital is 2.5 in the southwestern, northeastern, and central provinces (rural areas), while it is 5.2 in the capital province (a typical urban area) [14].
To address the regional imbalance of the EMS infrastructure, the Korea Ministry of Health and Welfare (KMHW) announced the fourth emergency medical master plan in 2023. The KMHW plan emphasized an EMS infrastructure expansion particularly for transporting severe emergency patients. The plan includes a gradual incremental increase of air ambulance helicopters and an additional designation of EMS centers over the next five years. The Korea National Fire Agency (KNFA) has also provided major work plans over the past two years [10,15]. The KNFA plans specify increasing the number of EMS stations in rural areas and operating EMS vehicle units and helicopters with specialized medical doctors on board. Note that the air ambulance service in Korea is the KMHW-affiliated helicopter service that is used exclusively for EMS with specialized medical doctors on board.
Although a Korean analysis report showed that rescues from severe traffic crashes are the most economically effective among all disease outbreaks or incidents [16], few road crash data-driven studies have been conducted. Moreover, there have been no studies that quantitatively and comprehensively investigated the state of the traditional EMS infrastructure leveraged with EMS helicopters, heliports, and school playgrounds as sub-heliports. In addition, there are no strategies developed on where and how EMS infrastructure expansion should be implemented to gradually minimize the inequality of EMS access by using casualties from road crash data.
The strategic expansion of the existing EMS infrastructure will be a critical step toward improving regional equality of EMS access. To address the spatial disparity of EMS infrastructure, this study aimed to provide methodologies for the cost-effective progression of EMS infrastructure expansion by taking the KMHW and KNFA plans as the adopted case study. The study’s goals were to: (1) identify the locations for high-priority EMS infrastructure expansion; (2) quantify spatial coverage of the existing EMS infrastructure; and (3) recommend the extent to which the EMS infrastructure should be expanded.
2. Literature Review
Timely EMS access in the post-crash stage plays a critical role in reducing the patient mortality rate. The spatial allocation of EMS resources, such as stations, air ambulance bases (hospitals), and heliports, is strongly associated with EMS accessibility. The focus of this literature review was the accessibility of the EMS infrastructure as it relates to road crashes and examining the methods for measuring accessibility.
Several previous studies have examined the demand for ground ambulances in EMS response. Habib et al. investigated the relationships between the emergency health care vehicle demand and accessibility measures in Halifax, Canada, and found that the ground ambulance demand was higher in areas with a higher population density [17]. Similarly, Amorim et al.’s study [18] examined EMS vehicle coverage based on urban road crashes, finding that EMS stations should be located closer to high-speed roads.
When examining the stage of patient transport via EMS to a definitive hospital, a Korean study showed that transport time from the crash scene to the trauma center resulted in a 0.51 percentage point increase in mortality for every 5 min increase in transport time [19]. Several other studies have found that the air ambulance service has advantages in providing timely medical access to patients suffering from a heart attack, respiratory arrest or massive bleeding due to severe injuries, therefore improving the survival rate of these patients [20,21,22]. Shahriari et al. designed a system that locates ground/air ambulance services, aerial bases, and helipads to take casualties from the car accident location to a hospital [1]. Their study showed that helicopters improved the patient transport system, in contrast to when there was no system applied. A recent study measured EMS accessibility during urban flood event scenarios, recommending EMS helicopters for areas totally isolated from the surrounding EMS stations [2].
A typical approach to measuring EMS accessibility is geographical information system (GIS) analysis. Several GIS-based methods have been proposed to measure EMS accessibility, such as provider-to-population ratios [23,24], spatial coverage based on straight line buffers [25,26], network-based catchment area [27,28,29], or decaying density functions modeling the decrease in availability with distance [30].
Recent studies have employed GIS-based techniques that model the impact of distance on EMS accessibility [3,4,5,18,27,31,32,33,34]. Most recent studies using these techniques consider road network-based temporal distance, as prehospital EMS time is affected by traffic conditions on roads and the relevant EMS vehicle speed [3,4,5,27,31].
A Korean study introduced the response time variability (RTV) index, time-varying speeds defined for each street segment within a road network based on historic traffic speed data [27]. The RTV index implies that a higher RTV equals more vulnerability to the traffic conditions, while a lower RTV means the region is less prone to the travel time uncertainty. This study generated a 5 min travel time contour for each ambulance dispatch center in Seoul and calculated the RTV index for morning peak, afternoon, and evening peak hours on each day of week. Similarly, Xiong et al. obtained dynamic traffic conditions and realistic EMS demand from online map services and historical emergency callout data and developed three location-based spatiotemporal EMS accessibility measurements [3]. To measure potential EMS accessibility for location x during time T from different perspectives, their study developed three spatiotemporal accessibility measurements including the minimum response time for the ambulance to arrive at the scene, the average response time for k-nearest accessible EMS stations to arrive the scene, and the spatiotemporal accessibility with dynamic potential EMS demand, dynamic response time, practical EMS supply capacity, and travel impedance function.
Previous studies also quantified spatial coverage of EMS infrastructure using a GIS-based analysis such as service area, closest facility, or shortest path methods. Two flood event studies employed service area and closest facility tools in ArcGIS to measure the EMS vehicle accessibility within specific response times [4,5]. Cheng et al.’s study used the shortest path tool to quantify spatial accessibility to residential care resources from the population cell [31]. In their study, the standard speeds were set according to the road network and class of road within each 10 m by 10 m cell. Then, they calculated the time cost of the shortest path from each cell to the closest residential care facility (RCF) based on standard speeds. This tool is used to measure the travel time to the closest RCF and the service area of each RCF based on the shortest time distance.
In the process of measuring EMS infrastructure coverages, some studies used a traditional count response model, local spatiotemporal weighted regression, or random forest algorithm to identify high-priority locations for EMS access or precisely select vehicle speed data that affected patient transport time [18,32,33]. Specifically, for helicopter EMS accessibility, a Norwegian study aimed to incorporate fairness in determining optimal air ambulance base locations [34]. In the study, multiple advanced mathematical optimization models were developed to determine optimal helicopter base locations, with different optimization criteria related to the level of aversion to inequality.
Considering the study purpose, the current study also utilized GIS-based techniques. However, few road crash-driven studies have examined the context and extent of EMS infrastructure as it relates to EMS vehicles with air ambulance and provided recommendations to improve the equality of EMS access. This study contributes to the development of a road crash data-driven methodology for promoting spatial balance and economical expansion of all types of EMS infrastructure, including EMS stations, hospitals, helicopter flights, and suitable landing spots.
3. Data Collection and Processing
3.1. Crash Victim Data
This study used a six-year (2011 to 2016) dataset of crash victims transported to the Konkuk University hospital in the Choongcheongbukdo (CB) province of Korea. CB is in the center of the country, and it includes the highest ratio of rural areas (73%) among Korea’s nine provinces [10]. EMS response time (13 min) and prehospital EMS time (42 min) in CB are the longest among all Korean provinces [11].
The crash victim dataset for this study included the following fields: the victim’s personal information, the consequence of medical treatments, vehicle, collision, roadway, weather, and EMS time stamps. Cases of instantaneous death at the scene of the crash have been excluded from the study because they were not affected by any temporal components of prehospital EMS time. The consequence of medical treatments provided to victims was determined by death or survival within 30 days of the victim was transported. A total of 568 crash victim cases, including 32 fatality and 536 survival cases, were utilized in this study. All crashes took place in the CB province. The response variable of the outcome of medical treatments was divided into two categories, fatality and survival, so that specific EMS time periods resulting in either death or survival could be identified.
Generally, prehospital EMS time considers three periods of time: (1) EMS response time, which is the time from which an emergency call is received to the EMS vehicle arriving at the crash scene; (2) on-scene time, which is the time from which the EMS vehicle arrives at the scene to the time that it leaves the scene; and (3) transport time, which covers the time that it takes for the EMS vehicle to arrive at a specific hospital after leaving the crash scene [12]. The dataset for the current study was missing many time-stamp records for when an EMS vehicle arrived at the crash scene; therefore, this study considered prehospital EMS time as the EMS response time aggregated by on-scene time (aggregated EMS response time, hereafter), and transport time.
All variables are listed in Table 1.
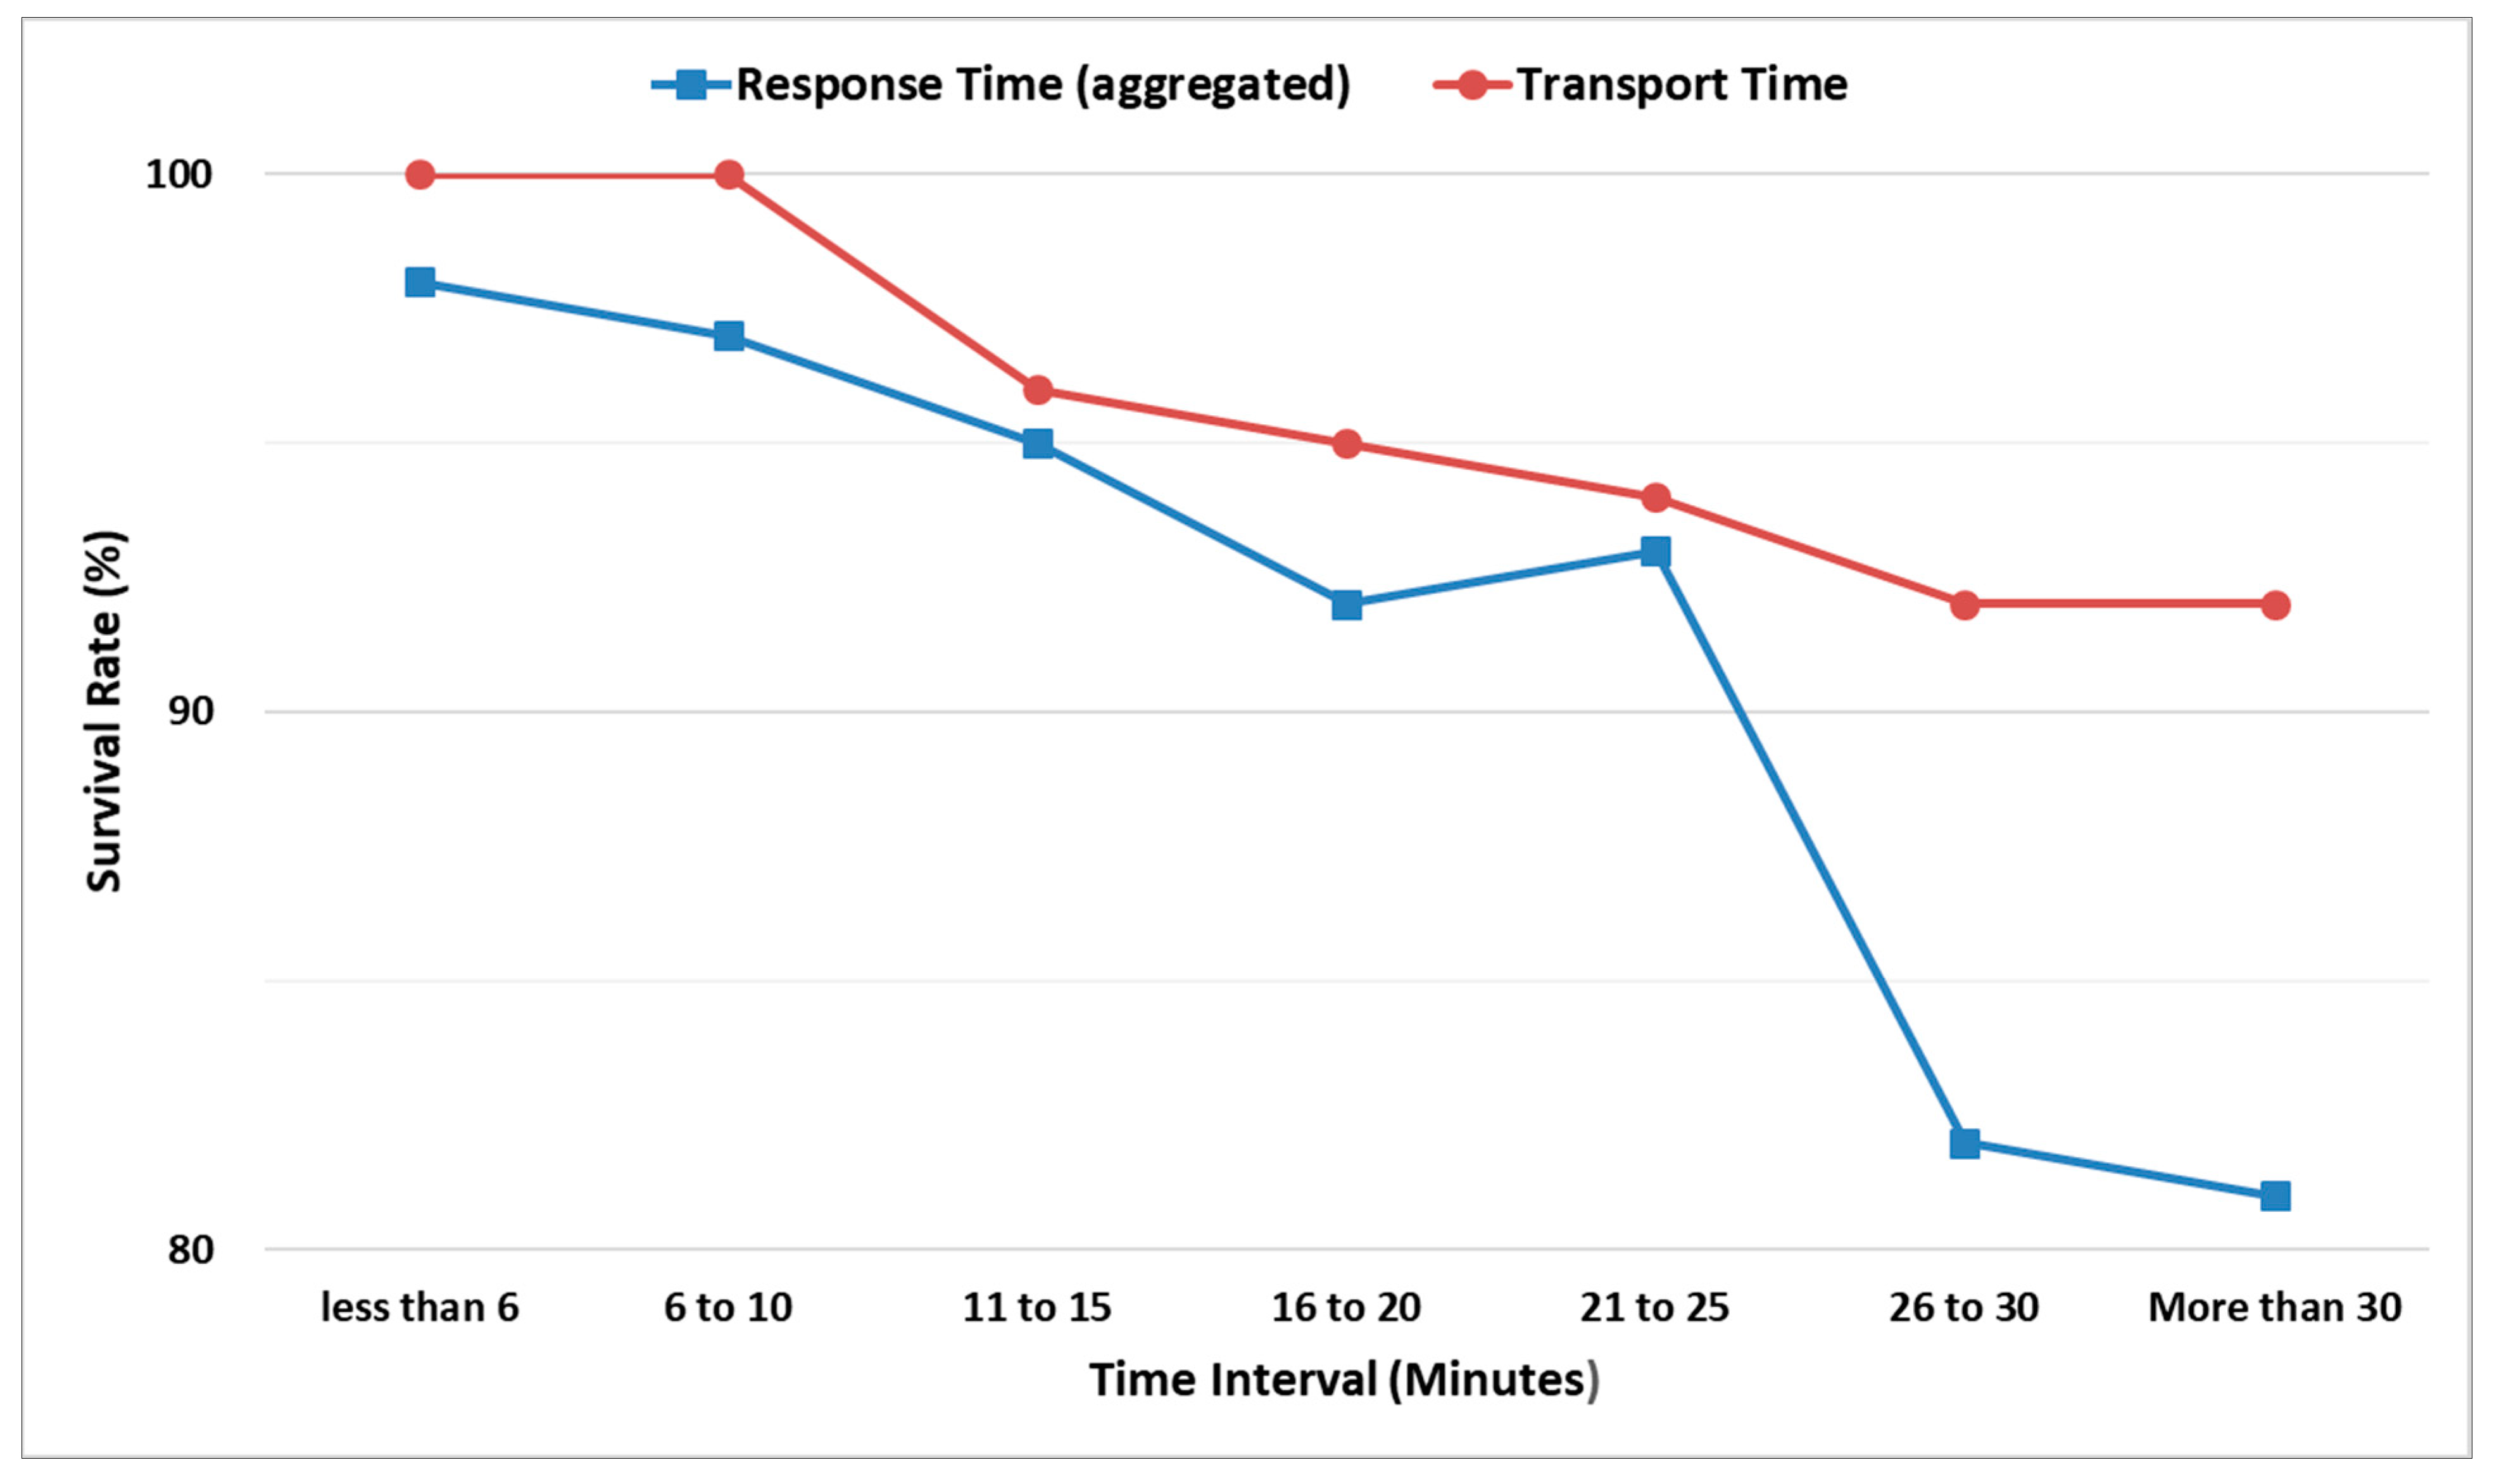
Figure 1 presents survival rates (the number of survival cases divided by the total number of cases at each time interval) by EMS time intervals. The survival rate decreases as EMS time (both aggregated EMS response and transport) increases, except for the time interval of 21 to 25 min.
Exceptionally, the survival rate (92.7%) in the time interval of 21 to 25 min for aggregated EMS response time was slightly higher than that (92.0%) for the time interval of 16 to 20 min. Fifty-five cases were observed in the time interval of 21 to 25 min, and for most of these cases (49 out of 55), the injury severity scores (ISS) were less than 15, which implies patients were not severely injured at the crash moment.
3.2. Road Network and Travel Time
To quantify the spatial coverage of EMS vehicles, this study utilized road network data (2021) provided by the Korea National Transportation Information Center (KNTIC) [35]. The KNTIC dataset includes the entire Korean road network, consisting of 543,481 road links that are approximately 213 million kilometers in length. The dataset contained several attributes for each road link, including link ID, name, direction, lanes, road rank (expressway, national highway, rural principal road, or urban road), road type (standard road, overpass, underpass, bridge, tunnel), maximum speed limit, length, restricted vehicle type/weight/height, and remarks.
Prehospital EMS time is significantly affected by real-time traffic conditions. To reflect real-time traffic conditions from EMS vehicle dispatch to arrival at a definitive hospital, the current study employed average taxi speed data at each road link from the Public Data Portal, including link ID, average taxi speed, name, and administrative district [36]. The average taxi speed data was combined with the KNTIC road network dataset based on the link ID and employed to identify service areas covered by EMS vehicle units within specific EMS time thresholds.
3.3. EMS Infrastructure
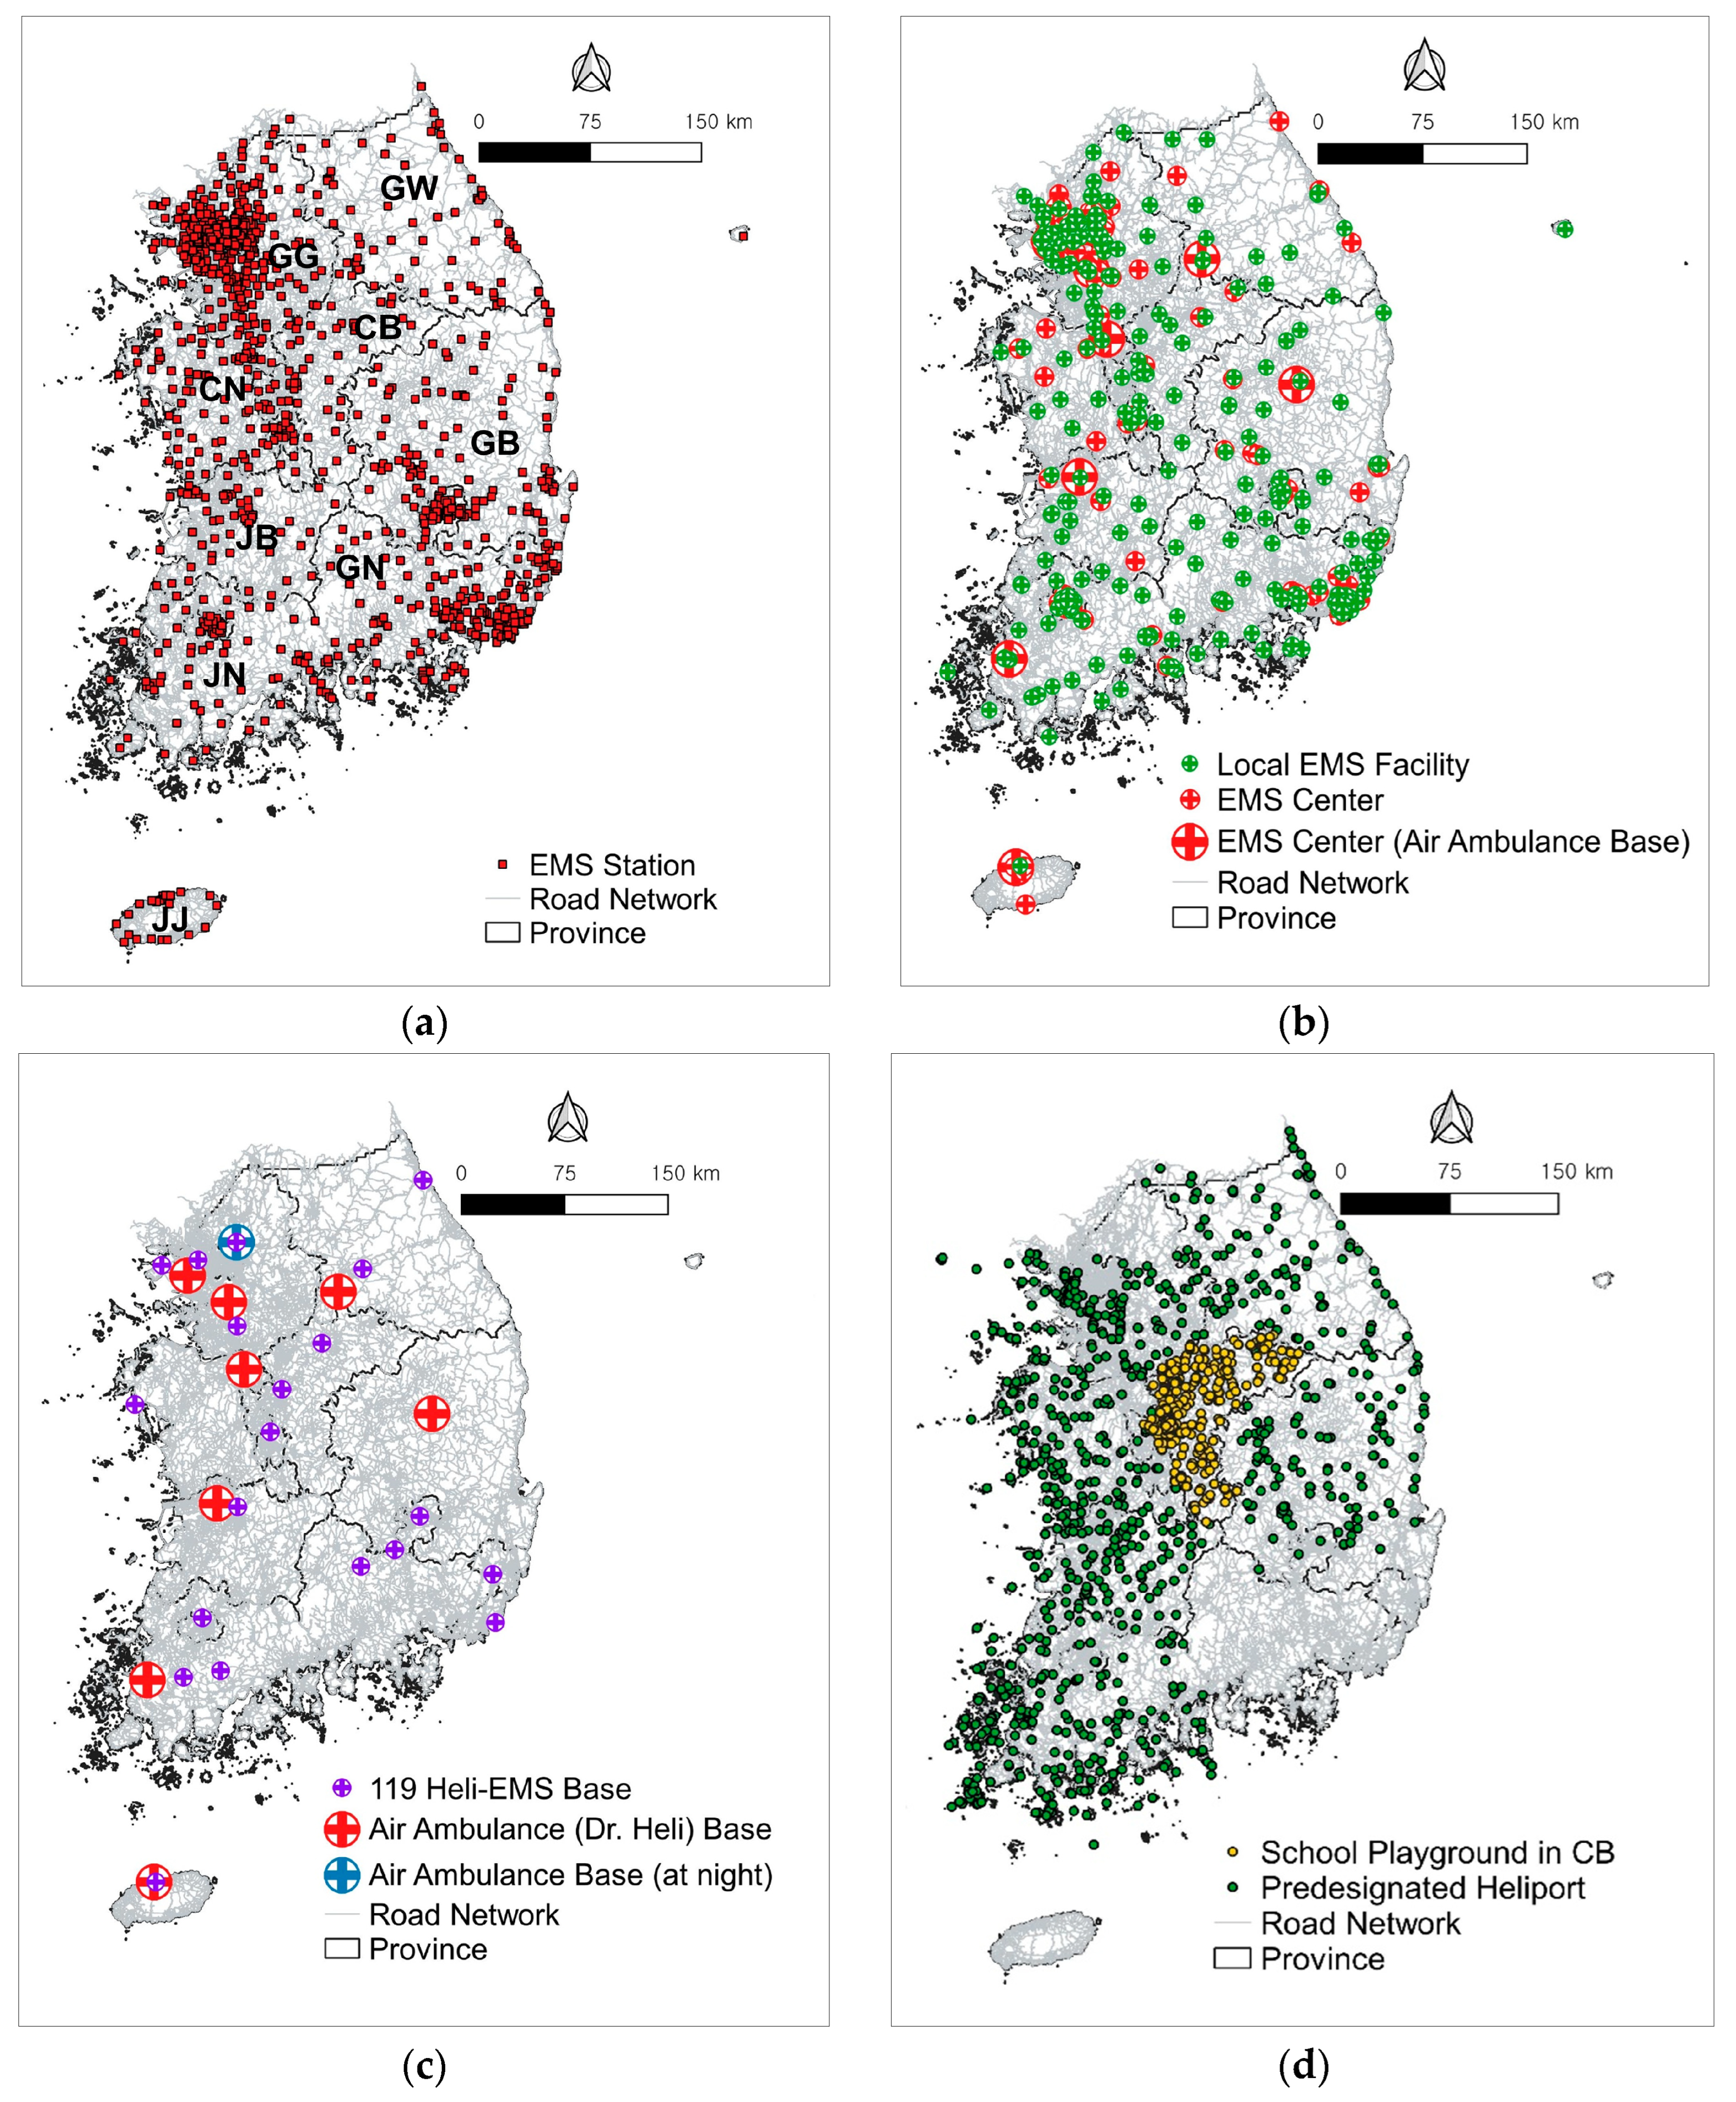
The EMS infrastructure typically involves an EMS station that operate EMS vehicle units, EMS helicopters (air ambulance), heliports, and high-level hospitals that can provide proper emergency medical treatment. The existing EMS infrastructure in Korea, shown in Figure 2, is described in the following sections.
3.3.1. EMS Stations
In Korea, EMS stations are a suborganization under fire stations. An EMS station possesses at least one EMS vehicle unit and dispatches it to the crash scene. Based on the latest KNFA information, there is a total of 1100 EMS stations distributed throughout all nine provinces of Korea [37]. Nearly 28% of these EMS stations (the highest rate in Korea), are located in the Gyeonggido (GG) province (capital province of Korea). On the other hand, only 4% of the total EMS stations (the lowest rate except for Jeju Island) are located in the CB province.
3.3.2. EMS Hospitals
According to the National Emergency Medical Portal (NEMP), 400 Korean hospitals (2021) can provide emergency medical treatments, and these are classified as either EMS centers or local EMS facilities [38]. The EMS centers are high-level hospitals that can provide appropriate emergency medical treatment for severe crash victims. There are 167 EMS centers in Korea. The remaining 233 local EMS facilities are the hospitals that can provide standard emergency medical treatment. The aforementioned KMHW plan included the additional designation of EMS centers. Correspondingly, this study also considered local EMS facilities as definitive hospital candidates for severe crash victims.
The GG province contains the highest number of EMS centers (78), while CB contains the lowest number (six). Currently, eight EMS centers operate KMHW-affiliated air ambulance helicopters. The air ambulance bases are located in seven of the nine provinces: two in GG, and one each in Gangwondo (GW) province, Gyeongsangbukdo (GB) province, Chooncheongnamdo (CN) province, Jeonrabukdo (JB) province, Jeonranamdo (JN) province, and Jeju (JJ) Island. CB and Gyeongsangnamdo (GN) do not have air ambulance bases.
3.3.3. EMS Helicopters
In the case of serious emergency patients with severe external injuries, cardiac arrest, or stroke, the EMS vehicle unit preferentially requests a KMHW-affiliated air ambulance (Dr. Heli). An air ambulance is dispatched and transports the patients to a nearby definitive hospital. However, KMHW-affiliated air ambulance helicopters are not available at night due to equipment shortages and legal conflicts. Since 2023, one KNFA-affiliated helicopter has been available for night operations. In total, nine helicopters are currently operated in Korea as air ambulances.
KNFA started to promote a helicopter EMS (HEMS) project in 2023 because the existing KMHW-affiliated air ambulance helicopters do not adequately cover all areas of Korea at all times. The KNFA project aims to increase the number of KNFA-affiliated EMS helicopters (119 heli-EMS) so that proper EMS can be provided to severe emergency patients by specialized medical doctors. Note that the standard KNFA-affiliated helicopters are generally dispatched for firefighting or mountain rescues, but doctors are not on board. Currently, there is a total of 30 KNFA-affiliated helicopters with 19 bases in Korea, and they can be candidates for the 119 heli-EMS helicopters. Technical information for Korean EMS helicopters is presented in Table 2.
3.3.4. Heliports for Helicopter EMS
In Korea, air ambulances can land only at predesignated heliports, and EMS vehicle units must transfer patients to the predesignated heliports [39]. Currently, there is a total of 882 predesignated heliports throughout six provinces (GG, GW, CN, GB, JB, and JN) in Korea. The longitude/latitude data for all predesignated heliports were obtained from the National Medical Center. Note that two provinces, GN and JJ Island, do not have any predesignated heliports. Due to budgetary deficits and residents’ complaints regarding noise from helicopter landings, heliports for EMS have not been constructed and predesignated in sufficient numbers in Korea, resulting in longer patient transport times [40]. Some local governments have started to consider alternative locations for landing a helicopter, such as a school playground. For example, the capital province of Korea recently signed a memorandum of understanding on utilizing school playgrounds as sub-heliports with air ambulance base hospitals. The authors in one previous study estimated that air medical transport time using only heliports was approximately five times more than the time it would take if landing options included school playgrounds [40]. Accordingly, this study considered existing school playgrounds as sub-heliports for HEMS.
The cross-ministerial regulation for the joint operation of EMS helicopters in Korea states that the size of the landing pad in the predesignated heliport should be 25 m by 25 m [41]. This study identified and selected 819 school playgrounds in the CB province that are larger than the standard helipad size. A dataset including each school’s name, address, and playground size was obtained from the Korean Educational Statistics Service website [42].
4. Methodologies
Based on the aforementioned study objective, six major tasks were conducted as follows:
- Select key indicators affecting crash fatalities using the random forest technique;
- Identify statistically significant variables from a geographically weighted binary logit regression model;
- Quantify the impacts of EMS predictors on crash fatalities and the time thresholds;
- Select the locations affected by EMS time-related predictors on crash fatalities;
- Determine the accessibility of the EMS infrastructure within the EMS time thresholds using network-based service area analysis;
- Perform an equality analysis for the existing EMS infrastructure and make recommendations.
4.1. Selection of Key Predictors
The random forest (RF) model is known to be an effective approach to address the multicollinearity between many variables and to identify the importance of variables [40,43,44]. This study used the RF approach to select key predictors that significantly affected crash fatality occurrences among numerous variables. The RF approach is conducted by an ensemble of randomized classification and regression trees. The mean decrease Gini (MDG), the most popular measure in the RF approach, was employed to measure the contribution of a variable to the homogeneity of each node in a particular tree. A larger value in the MDG indicates a more important variable. The MDG is computed by:
where MDGk (Xi) is the Gini impurity coefficient of variable Xi at node k; p(j|k) is the probability of class j at node k; and J is the number of classes.
4.2. Geographically Weighted Binary Logit Regression
Geographically weighted binary logit regression (GWBLR) was used in this study for the following reasons: the response variable (fatality vs. survival) is dichotomous; GWBLR addresses spatial nonstationary issues, allowing for local coefficients of explanatory variables that vary in space [45]; and diverse temporal factors were not included in the RF result. The GWBLR model extends the concept of the traditional binary logit regression (BLR) model to a locally estimated model, which is written by:
where Pi (Y) is the probability of outcome Y (1 = fatality vs. 0 = survival) at location i; (ui, vi) are the two-dimensional coordinates of location i; α (ui, vi) and β (ui,vi) are vectors of constant and local coefficients at location i, respectively; and X is a set of explanatory variables.
In the GWBLR model, the weighted least squares approach estimated all the regression coefficients. The matrix expression can be denoted by [44]:
where W(ui,vi) is the weighting matrix whose diagonal elements are the geographical weights of each observation for the regression point and whose off-diagonal elements are zero.
β (ui, vi) = [XT W(ui, vi)X]−1XT W(ui,vi)Y
In this study, a traditional BLR model was developed as the benchmark. For the model comparison, this study utilized deviance, the Akaike information criterion (AIC), and pseudo R2 for the overall model’s goodness of fit. Deviance is defined as −2 times the log likelihood of the fitted model. Note that a smaller deviance and AIC along with a greater pseudo R2 implies a better goodness of fit. Additionally, a conventional p-value of 0.05 was considered in this study for determining the significance level for local coefficients estimated by GWBLR. The z-value at 95% confidence interval was employed for the local coefficient estimates. This indicates that an explanatory variable is significantly related to the response variable if the maximum absolute z-value of the local coefficient estimated by GWBLR is greater than 1.96 [45].
4.3. Network Analysis
The road network dataset and the locations were loaded into QGIS. Then, the service area tool of network analysis in QGIS was employed to generate the extent of the road network covered by a specific EMS infrastructure (e.g., EMS station) within the thresholds of aggregated EMS response and transport times. The extent of the road network covered within aggregated EMS response and transport time thresholds was produced using each road link length and average taxi speed data at the road link, which can more accurately reflect real-time traffic conditions when compared to using maximum posted speed limit data. Note that the two-way traffic direction was employed for the road network-based service area analysis.
5. Model Results
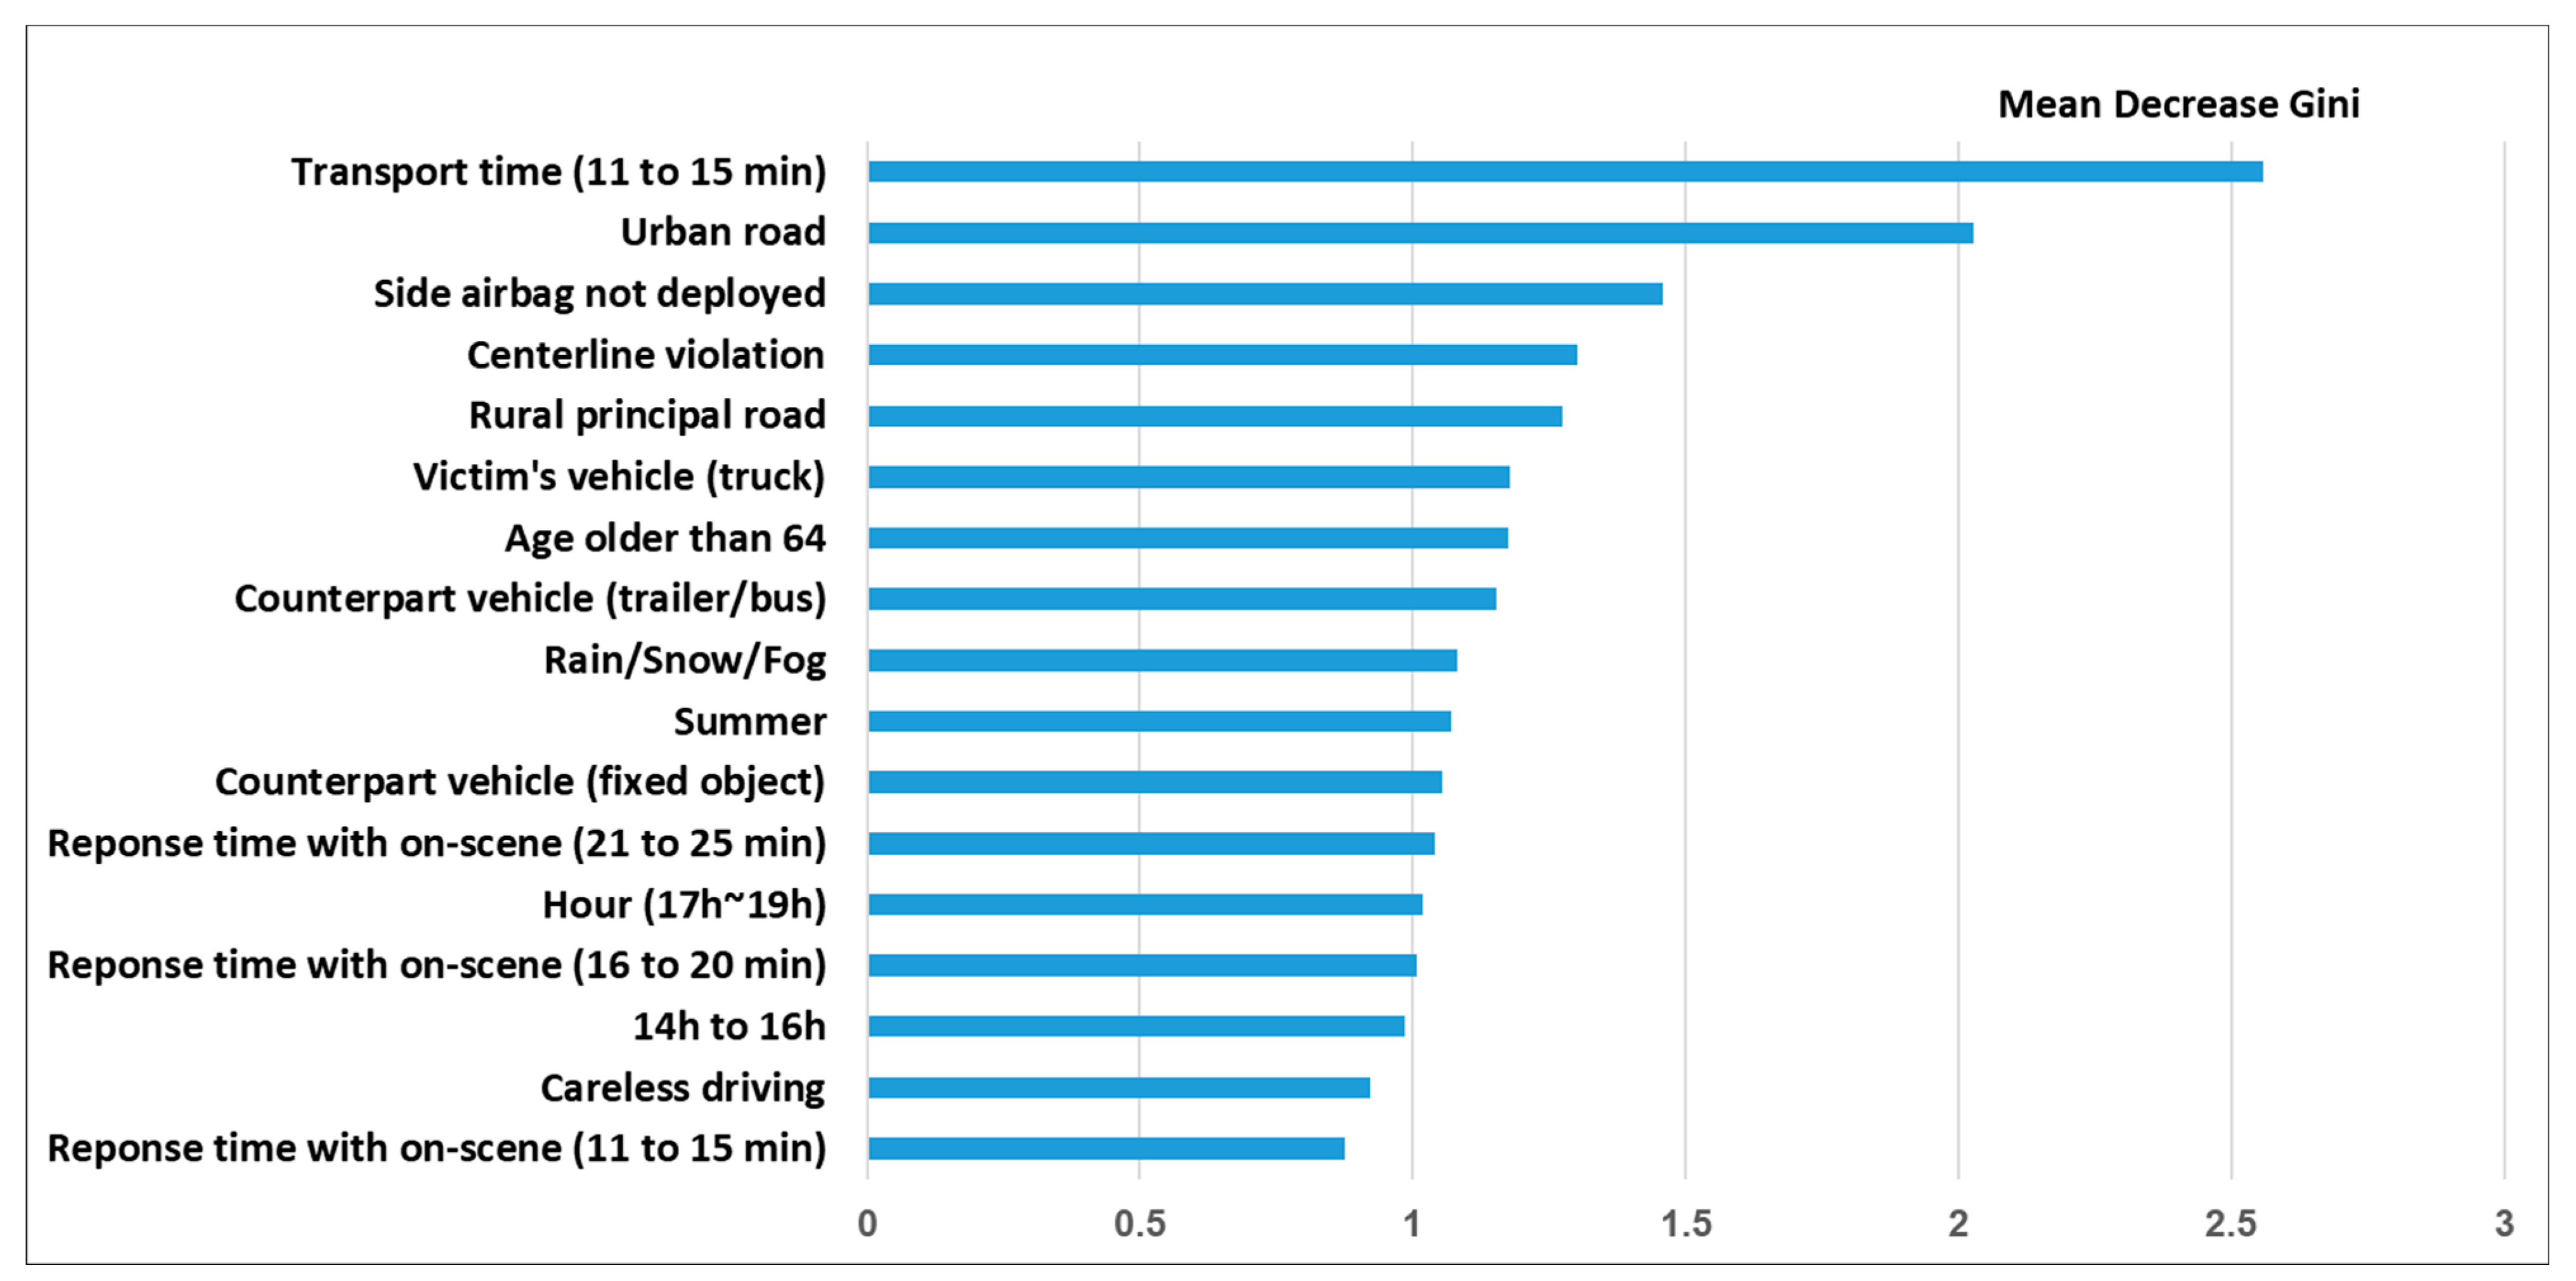
Crash victim data were split into a training set (60%) to train the RF algorithms and a test set (40%) to measure the model classification performance. The RF process generated 500 trees and reached the minimum stable error rate (9.3%). Based on the proportion of fatality cases to total sample cases observed in the crash victim dataset as the cutoff value of event classification [46], the RF achieved reasonable prediction accuracies for fatality (68%, 77%), survival (81%, 85%), and total cases (78%, 84%) in the dataset (training and test sets, respectively). The RF also produced variable importance rankings for all explanatory variables using MDG. The resulting 17 key variables are listed in Figure 3 and used later as model inputs.
Classic geographic kernel types such as Gaussian fixed kernels and bi-square adaptive kernels [45,47] were used to generate a weighting matrix in GWR. The Gaussian kernel weight continuously and gradually decreases from the center of the kernel but never reaches zero, while the bi-square kernel has a clear-cut range where kernel weighting is nonzero [47]. More specifically, for the fixed kernel, the geographic extent for local model fitting to estimate geographically local coefficients is constant over space, while the adaptive kernel changes to a local extent. In the case of GWBLR, where the outcome distribution is unbalanced, the Gaussian adaptive kernel (instead of the bi-square adaptive kernel) could be a secure option [47]. Accordingly, this study accepted the Gaussian adaptive kernel function to determine weights in GWBLR model building. The resulting models are presented in Table 3.
Table 3 presents the model results for GWBLR and BLR. The GWBLR model produced smaller deviance and AIC values than the comparative traditional BLR model. As expected, the pseudo R2 from the GWBLR model was found to be higher than that from the BLR model. These results imply that the GWBLR model outperformed the BLR model in terms of overall model goodness of fit, which will be further emphasized in the following discussion.
In the GWBLR model, the maximum absolute z value of the coefficient estimate for every explanatory variable was greater than 1.96, implying that all four explanatory variables were statistically significant in affecting the probability of crash fatalities at a 95% confidence interval. The study objective was to provide a methodological framework for strategically expanding the existing EMS infrastructure and improving regional equality of EMS access. Accordingly, one of major tasks toward accomplishing the study objective was to identify spatial inequalities among the impacts of EMS-related variables that lead to fatalities. The conventional LR model does not address the spatial nature of the data [40]. As shown in Table 3, therefore, the real benefit of using a GWBLR model in this study was that it showed that the estimated coefficients of the four explanatory variables vary in space. The variation can be represented by the mean, minimum, lower quartile (Q1), median (Q2), upper quartile (Q3), and maximum values.
In the GWBLR model, two EMS time-related variables and a driver’s centerline violation were likely to significantly increase the probabilities of crash fatalities. Specifically, 11 to 15 min patient transport time and 16 to 20 min aggregated EMS response time, consistent with the results in previous studies [48,49], were significantly identified to increase the probabilities of crash fatalities. This result implies that crash victims are more likely to survive if first medical aids after the crash occurrence are served by an EMS vehicle within 15 min and crash victims are transported from the scene of crash to a definitive hospital within 10 min. Additionally, an urban road was likely to significantly decrease the probabilities of crash fatalities. The resultant impact of urban roads on crash fatalities implies that rural areas containing an expressway, national highway or rural principal roads further improve EMS access. The coefficient estimates of all explanatory variables in the BLR model are within the range of GWBLR estimates, and their effects on crash victim fatalities were similar to the mean estimates of GWBLR.
A long EMS response or patient transport time is well known to affect the crash victim’s survival rate in a negative way. Additionally, Figure 1 shows that, generally, the survival rate at each time interval decreases as both aggregated EMS response and transport times increase. Among all time interval classes shown in Figure 1, this study used only the statistically significant time intervals as EMS time threshold values. Therefore, 15 and 10 min time periods were selected as temporal thresholds of aggregated EMS response and patient transport times, respectively, to produce geographic EMS infrastructure accessibility values.
6. Discussion
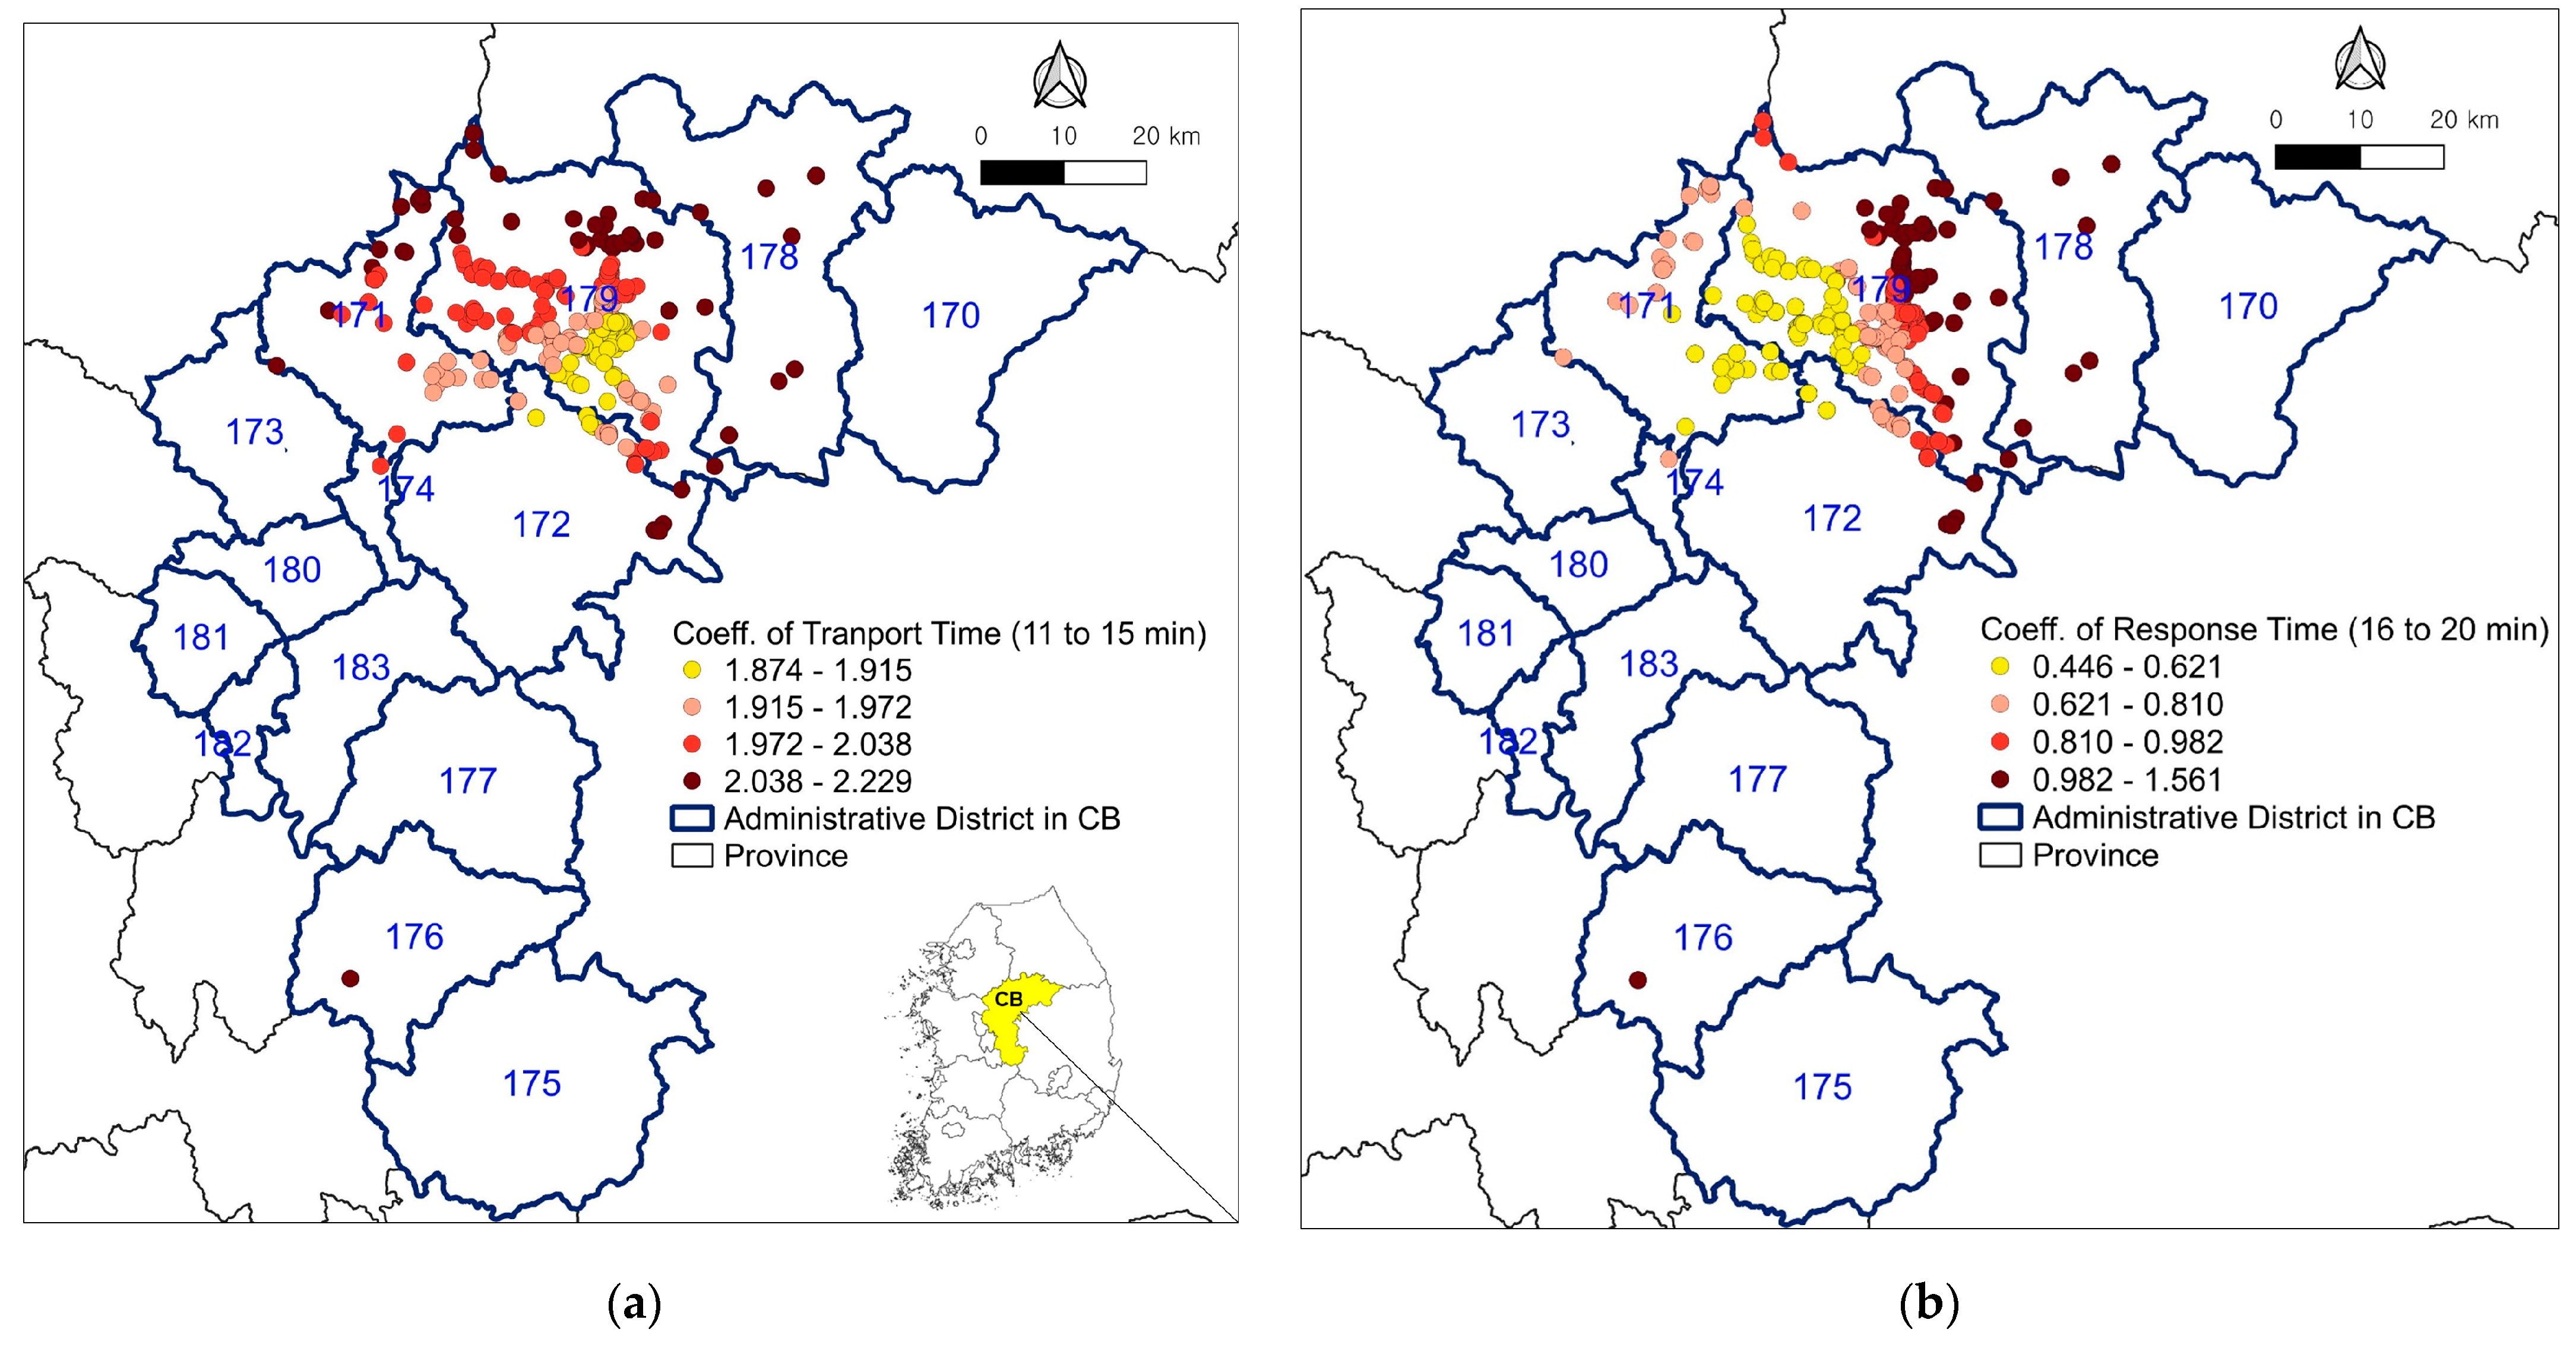
The study objective was to identify locations for high-priority EMS infrastructure expansion to promote equal access to EMS. Hence, EMS time-related variables were of particular interest. Figure 4 illustrates the spatial variations in the coefficient estimates for two time-related variables that affect crash fatalities: aggregated EMS response time and patient transport time. The coefficient estimates of the two time-related variables were divided into four classes using their minimum, lower quartile, median, upper quartile, and maximum values. Only the locations of significant coefficients at a 95% confidence level are shown in the figure. Figure 4a depicts the CB province (colored yellow) and the relevant administrative districts, including three cities and eight counties. Figure 4a,b exhibit the fatality-prone locations that are significantly affected by a 16 to 20 min aggregated EMS response and an 11 to 15 min patient transport time, respectively. The coefficient estimates that were greater than their upper quartile values (Q3) were considered to have locally strong impacts on crash fatality occurrences. Dark red circles in Figure 4a,b denote the fatality-prone locations that are strongly impacted by EMS time-related variables.
The analysis shows that 69 fatality-prone locations strongly affected by an 11 to 15 min patient transport time were concentrated in the northeastern and southwestern areas (districts No. 171, 172, 176, 178, and 179) of the CB province. Sixty-eight fatality-prone locations strongly affected by a 16 to 20 min aggregated EMS response time were distributed in the same areas, except for district No. 171 (Umseong County).
The research could be used to inform decision-making regarding locations where crash consequence should be preferentially mitigated by EMS infrastructure expansion. If fatality-prone locations strongly affected by two EMS time-related variables overlapped, the overlapping fatality-prone locations were considered as high-priority locations for EMS infrastructure expansion, hereafter called targeted locations. The targeted locations (marked by stars) are provided in Figure 5. Note that some targeted locations may be too close to be shown as separate locations.
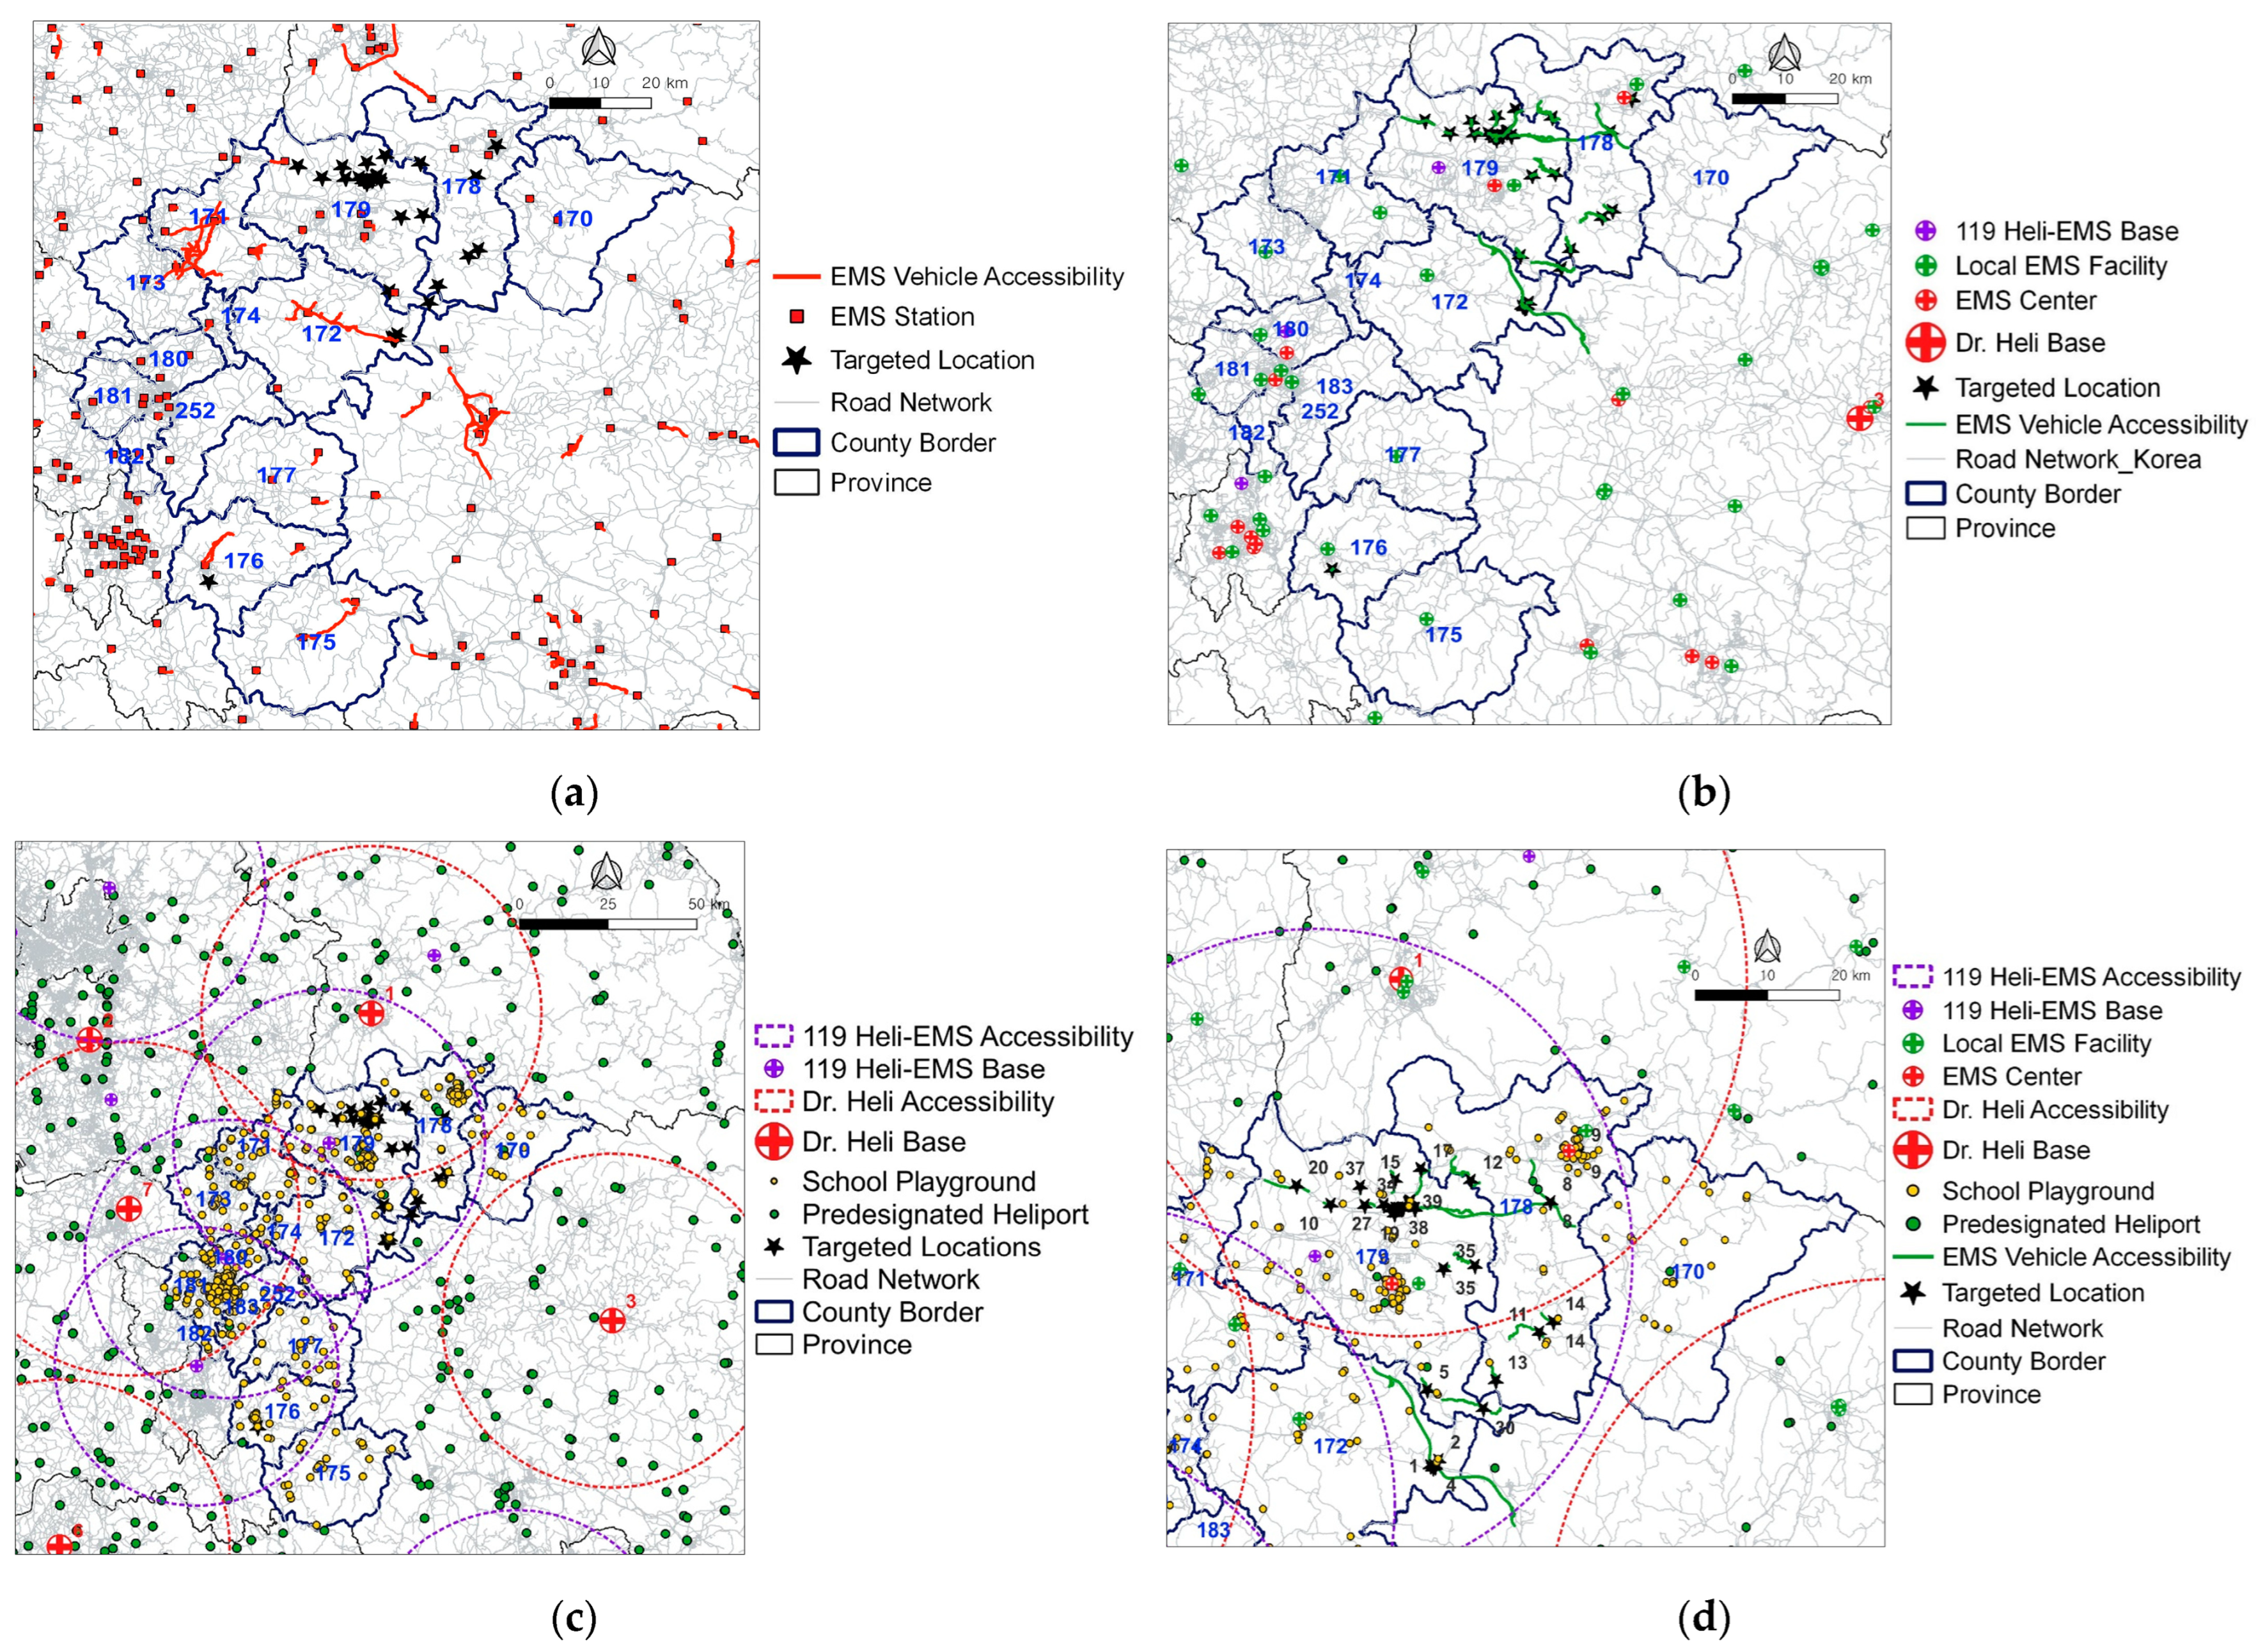
Forty targeted locations were identified, mainly in the northeastern and southwestern areas of the CB province (i.e., 26 locations in the City of Choongju, or district No. 179, seven locations in the City of Jecheon, or district 178, six locations in the County of Goesan, or district 172, and one location in the County of Okcheon, which is district 176). Figure 5a,b show the extent of the road network covered by the 15 min aggregated EMS response time from EMS stations (denoted by the red line) and the 10 min patient transport time from targeted locations (denoted by a green line), respectively.
Figure 5a shows that 36 out of the 40 targeted locations were not included in the 15 min accessibility coverage of EMS stations. The four included locations were in Geosan County. Among the targeted locations beyond the 15 min accessibility coverage, 33 were in the northern areas of the CB province (Cities of Choongju and Jecheon). In the City of Choongju, the average distance between each targeted location and a definitive hospital was 16 km, and the corresponding standard deviation compared to the average aggregated EMS response time was approximately 70%. This indicates large disparities in aggregated EMS response times. In both cities (Choongju and Jecheon), the current EMS stations are spatially concentrated in city centers; however, nearly 36% of targeted locations beyond the 15 min accessibility coverage were placed on rural principal roads. At the locations beyond the 15 min accessibility coverage, 40% of all crash victim cases occurred in adverse weather conditions. Topographic features are comparatively bad on rural roads, and it is not easy to predict traffic conditions in adverse weather conditions. This could be one of reasons for the large differences in aggregated EMS response time, even in cases of the same distances between targeted locations and a specific hospital. The results in Figure 5a imply that additional EMS stations could support the rural principal road network in the northern areas of the CB province. The findings also indicate that the KNFA’s plan for increasing the number of EMS stations in rural areas is appropriate.
Similarly, in Figure 5b, there were no existing EMS centers or local EMS facilities identified within the 10 min EMS vehicle accessibility coverage for patient transport from any of the 40 targeted locations. This result is consistent with the fact that the average transport time over all targeted locations was approximately 28 min, which is a long period of time for a patient suffering from severe crash injuries [50]. For timely patient transport, this study initially investigated whether existing EMS helicopters could access all targeted locations within a 10 min threshold of patient transport. The 10 min accessibility coverage for HEMS was created in the form of a ring buffer from each EMS helicopter base, which is depicted in Figure 5c. The average cruise speed of each EMS helicopter provided in Table 2 was utilized to produce the ring buffer of 10 min HEMS accessibility, which is more realistic than the use of the maximum cruise speed.
In Figure 5c, approximately 78% of the targeted locations distributed in the northern areas of the CB province were included in the 10 min HEMS accessibility coverage (marked by a red dotted ring) of two Dr. Heli bases (base No. 1 and No. 7). However, there were nine targeted locations beyond the HEMS accessibility coverage that were distributed in the eastern part of Goesan County, southern part of the Choongju and Jecheon cities, and western part of Okcheon County. Considering additional KNFA-affiliated helicopters for EMS (119 heli-EMS), the nine targeted locations were included in 10 min accessibility extents (marked by a purple dotted ring) covered by three nearby 119 heli-EMS bases. The KNFA is currently promoting the HEMS plan. The result in Figure 5c implies that the use of existing KNFA-affiliated helicopters for EMS is a cost-effective strategy for timely patient transport.
Figure 5d shows all predesignated heliports and school playgrounds as sub-heliports for future use in or around the CB province. When an EMS vehicle unit calls HEMS for further speedy and specialized EMS, helicopters should be dispatched and land at predesignated heliports in Korea. An EMS helicopter is a sort of movable EMS hospital. When EMS helicopters are accessing targeted locations, EMS vehicles should transport patients to nearby designated heliports within the 10 min threshold for patient transport time. Accordingly, the 10 min accessibility covered by EMS vehicles from each targeted location is marked by the sold green line in Figure 5d. In the case of using existing predesignated heliports (denoted by the green circle), only 2.5% of all targeted locations (location No. 8 in the central part of Jecheon City) were included within the 10 min EMS vehicle accessibility coverage.
When using school playgrounds (denoted by yellow circles) as sub-heliports in addition to predesignated heliports, 77.5% of all targeted locations (excluding the nine targeted locations in the northeastern part of Choongju City) were covered by the 10 min EMS vehicle accessibility. This result in Figure 5d implies that the use of existing school playgrounds could be a cost-effective alternative to new heliport construction. The result also implies that augmenting predesignated heliports is still necessary for operating EMS helicopters for timely patient transport. New heliports are recommended, especially in the northeastern part of Choongju City.
This study considered a specific province of Korea as the study area to accomplish the research purpose. The methodological steps demonstrated in the current study can be conveniently expanded to other areas to generate the corresponding results if EMS infrastructure related information is available.
7. Conclusions
In Korea, more than 90% of the total population lives in urban areas, which enjoy a higher concentration of EMS infrastructure when compared to their rural counterparts [51]. However, severe crashes occur frequently in rural areas, and the consequences are highly likely to be fatal due to the absence of timely medical attention. To address the EMS infrastructure inequality, the KNFA and KMHW have recently promoted their respective plans of EMS infrastructure expansion. Focusing on EMS related to severe road crashes rather than any other diseases or incidents in Korea is the most economically effective solution [16]. However, the plans’ effectiveness in expanding the EMS infrastructure and mitigating severe crashes to achieve regionally equitable EMS has not been quantified or verified. This study intended to develop a method that can quantitatively inform the policymaking based on crash victim and existing EMS infrastructure data.
The study identified fatality-prone locations strongly affected by both aggregated EMS response and transport times and investigated the extent of accessibility for existing EMS infrastructure based on the fatality-prone locations. The key findings regarding the recommendations for regionally balanced EMS infrastructure expansion and EMS access creation are summarized as follows:
- (1)
- The GWBLR outperformed a traditional BLR to identify the local impacts of risk factors on crash fatalities;
- (2)
- Aggregated EMS response time ranging from 16 to 20 min and transport time ranging from 11 to 15 min were likely to significantly increase the probabilities of crash fatalities;
- (3)
- The fatality-prone locations targeted for EMS infrastructure expansion were distributed in the northeastern and western areas of the CB province;
- (4)
- EMS stations should be further supported for particularly rural principal roads in the northern areas of CB province;
- (5)
- The KNFA plan for 119 heli-EMS to support KMHW-affiliated EMS helicopters is proper for severe emergency patient transport;
- (6)
- The use of school playground as sub-heliports is a cost-effective alternative for transporting severe emergency patients;
- (7)
- More heliports are recommended, especially in the northeastern districts of Choongju City.
Seven recommendations have been made based on a safety data-driven analysis to help promote equitable EMS through strategic EMS infrastructure expansion. The research finding supports that adding 119 heli-EMS and including school playgrounds as sub-EMS helicopters and heliports can be an effective strategy to transport patients in a timely manner. The methodology could be used to inform the future investment in EMS infrastructure to create regionally equitable EMS and achieve the goal of Vision Zero.
Even though this study provided a methodological process to economically expand EMS infrastructure, a limitation of the current study is that the comparative cost of reallocating existing EMS infrastructure and constructing new infrastructure was not directly measured. Correspondingly, quantitative cost and trade-offs between existing EMS infrastructure reallocation and new construction would be our future research. Another limitation in this study is that only 32 fatalities were used for developing the models. The uncertainty due to the low number of road crash fatalities and their random nature may induce substantial engineering costs for reallocating road equipment or infrastructure [9]. This limitation can be addressed through continuous crash data collection and model calibration in the future research.
Author Contributions
Conceptualization, S.J.; methodology, S.J. and X.Q.; software, S.J.; formal analysis, S.J.; investigation, S.J.; resources, S.J.; data curation, S.J.; writing—original draft, S.J.; writing—review and editing, X.Q.; visualization, S.J. All authors have read and agreed to the published version of the manuscript.
Funding
This research was supported by The National Research Foundation of Korea (NRF) grant funded by the Korea government (MSIT) (No. NRF-2022R1A2C1092941).
Institutional Review Board Statement
Not applicable.
Informed Consent Statement
Not applicable.
Data Availability Statement
It is not possible to share data used in this research because the Konkuk University hospital provided the crash victim data for the purpose of academic analysis on condition that the data will not be made public.
Conflicts of Interest
The authors declare no conflict of interest.
References
- Shahriari, M.; Bozorgi-Amiri, A.; Tavakoli, S.; Yousefi-Babadi, A. Bi-objective approach for placing ground and air ambulance base and helipad locations in order to optimize EMS response. Am. J. Emerg. Med. 2017, 35, 1873–1881. [Google Scholar] [CrossRef]
- Li, M.; Kwan, M.; Chen, J.; Wang, J.; Yin, J.; Yu, D. Measuring emergency medical service (EMS) accessibility with the effect of city dynamics in a 100-year pluvial flood scenario. Cities 2021, 117, 103314. [Google Scholar] [CrossRef]
- Xiong, Q.; Liu, Y.; Xing, L.; Wang, L.; Ding, Y.; Liu, Y. Measuring spatio-temporal disparity of location-based accessibility to emergency medical services. Health Place 2022, 74, 102766. [Google Scholar] [CrossRef] [PubMed]
- Shi, Y.; Yao, Y.; Wen, Q.; Xi, J.; Li, H.; Wang, Q. A spatial accessibility assessment of urban tourist attractions emergency response in Shanghai. Int. J. Disaster Risk Reduct. 2022, 74, 102919. [Google Scholar] [CrossRef]
- Tsang, M.; Scott, D. An integrated approach to modeling the impact of floods on emergency services: A case study of Calgary, Alberta. J. Transp. Geogr. 2020, 86, 102774. [Google Scholar] [CrossRef]
- Wu, Y.; Chen, S. Traffic resilience modeling for post-earthquake emergency medical response and planning considering disrupted infrastructure and dislocated residents. Int. J. Disaster Risk Reduct. 2023, 93, 103754. [Google Scholar] [CrossRef]
- Noda, Y.; Hagiwara, T.; Hirasawa, M.; Hara, H. Influence of accessibility to emergency medical services on fatality rate in Hokkaido, Japan. Transp. Res. Rec. 2014, 2451, 28–35. [Google Scholar] [CrossRef]
- Wang, J.; Du, F.; Huang, J.; Liu, Y. Access to hospitals: Potential vs. observed. Cities 2020, 100, 102671. [Google Scholar] [CrossRef]
- Cao, Q.; Li, Z.; Tao, P.; Zhao, Y. Reallocation of Heterogeneous Sensors on Road Networks for Traffic Accident Detection. IEEE Trans. Instrum. Meas. 2023, 72, 1006911. [Google Scholar] [CrossRef]
- Status of Korean Road Network in 2022, Korean Statistical Information Service (KOSIS). Available online: https://kosis.kr/statHtml/statHtml.do?orgId=116&tblId=DT_MLTM_962&conn_path=I3 (accessed on 14 July 2023).
- 2022 Statistical Year Book of Emergency Services, Korea National Fire Agency (KNFA). Available online: https://www.nfa.go.kr/nfa/releaseinformation/statisticalinformation/main/?boardId=bbs_0000000000000019&mode=view&cntId=45&category=&pageIdx=1&searchCondition=all&searchKeyword=%ED%86%B5%EA%B3%84%EC%97%B0%EB%B3%B4 (accessed on 14 July 2023).
- Jung, S.; Qin, X.; Oh, C. Systemwide Impacts of Emergency Medical Services Resources on Freeway Crash Severity. Transp. Res. Rec. 2016, 2582, 51–60. [Google Scholar] [CrossRef]
- The Fourth Emergency Medical Master Plan: 2023 to 2027, Korea Ministry of Health and Welfare (KMHW). Available online: https://eiec.kdi.re.kr/policy/callDownload.do?num=235274&filenum=2&dtime=20230208171245 (accessed on 14 July 2023).
- 2022 Statistical Yearbook of Emergency Medical Service, Korea Ministry of Health and Welfare (KMHW). Available online: https://e-medis.nemc.or.kr/portal/compose/publicationPage.do (accessed on 8 December 2023).
- 2021 Statistical Year Book of Emergency Services, Korea National Fire Agency (KNFA). Available online: https://www.nfa.go.kr/nfa/releaseinformation/statisticalinformation/main/?boardId=bbs_0000000000000019&mode=view&cntId=34&category=&pageIdx=1&searchCondition=all&searchKeyword=%ED%86%B5%EA%B3%84%EC%97%B0%EB%B3%B4 (accessed on 14 July 2023).
- Policy Issue Report 2020: Social-Economical Analysis of Fire Fighting Activities, Korea Research Institute for Local Administration (KRILA). Available online: https://www.krila.re.kr/download/report/kor/1566 (accessed on 14 July 2023).
- Habib, M.; Olajide, B.; Terashima, M.; Campbell, S. Relationship between Neighborhood. Characteristics and Demand for Emergency Health Service Vehicles: A Poisson Hurdle Regression Modeling Approach. Transp. Res. Rec. 2018, 2672, 80–91. [Google Scholar] [CrossRef]
- Amorim, M.; Ferreira, S.; Couto, A. Road safety and the urban emergency medical service (uEMS): Strategy station location. J. Transp. Health 2017, 6, 60–72. [Google Scholar] [CrossRef]
- Karrison, T.; Schumm, P.; Kocherginsky, M.; Thisted, R.; Dirschl, D.; Rogers, S. Effects of driving distance and transport time on mortality among Level I and II traumas occurring in a metropolitan area. J. Trauma Acute Care Surg. 2018, 85, 756–765. [Google Scholar] [CrossRef] [PubMed]
- Brown, J.B.; Leeper, C.M.; Sperry, J.L.; Peitzman, A.B.; Billiar, T.R.; Gaines, B.A.; Gestring, M.L. Helicopters and injured kids: Improved survival with scene air medical transport in the pediatric trauma population. J. Trauma Acute Care Surg. 2016, 80, 702–710. [Google Scholar] [CrossRef] [PubMed]
- Chang, J.C.; Huang, H.H.; Chang, S.H.; Chen, Y.R.; Fan, J.S.; Chen, Y.C.; Yen, D.H.T. Clinical predictors of outcomes in patients undergoing emergency air medical transport from Kinmen to Taiwan. Medicine 2017, 96, e8440. [Google Scholar] [CrossRef] [PubMed]
- Chen, X.; Gestring, M.; Rosengart, M.; Peitzman, A.; Billiar, T.; Sperry, J.; Brown, J. Logistics of air medical transport: When and where does helicopter transport reduce prehospital time for trauma? J. Trauma Acute Care Surg. 2018, 85, 174–181. [Google Scholar] [CrossRef] [PubMed]
- Connor, R.; Hillson, S.; Krawelski, J. Competition, professional synergism, and the geographic distribution of rural physicians. Med. Care 1995, 33, 1067–1078. [Google Scholar] [CrossRef]
- Amed, S.; Adams, A.; Islam, R.; Hasan, H.; Panciera, R. Impact of traffic variability on geographic accessibility to 24/7 emergency healthcare for the urban poor: A GIS study in Dhaka, Bangladesh. PLoS ONE 2019, 14, e0222488. [Google Scholar] [CrossRef]
- Haynes, R.; Bentham, G.; Lovett, A.; Gale, S. Effects of distances to hospital and GP surgery on hospital inpatient episodes, controlling for needs and provision. Soc. Sci. Med. 1999, 49, 425–433. [Google Scholar] [CrossRef]
- Gyimah, S.; Takyi, B.; Addai, I. Challenges to the reproductive health needs of African women: On religion and maternal health utilization in Ghana. Soc. Sci. Med. 2006, 62, 2930–2944. [Google Scholar] [CrossRef]
- Cho, J.; Yoon, Y. GIS-based Analysis on Vulnerability of Ambulance Response Coverage to Traffic Condition: A Case Study of Seoul. In Proceedings of the IEEE 18th International Conference on Intelligent Transportation Systems 2015, Gran Canaria, Spain, 15–18 September 2015; INSPEC Accession Number 15572801. pp. 1402–1407. [Google Scholar]
- Schuurman, N.; Fiedler, R.; Grzybowski, S.; Grund, D. Defining rational hospital catchments for non-urban areas based on travel-time. Int. J. Health Geogr. 2006, 5, 5. [Google Scholar] [CrossRef] [PubMed]
- Ye, H.; Kim, H. Measuring Spatial Health Disparity Using a Network-Based Accessibility Index Method in a GIS Environment: A Case Study of Hillsborough County, Florida. Int. J. Geospat. Environ. Res. 2014, 1, 2. [Google Scholar]
- Guagliardo, M.; Ronzio, C.; Cheung, I.; Chacko, E.; Joseph, J. Physician accessibility: An urban case study of pediatric providers. Health Place 2004, 10, 273–283. [Google Scholar] [CrossRef]
- Cheng, Y.; Wang, J.; Rosenberg, M. Spatial access to residential care resources in Beijing, China. Int. J. Health Geogr. 2012, 11, 32. [Google Scholar] [CrossRef]
- Dolejš, M.; Purchard, J.; Javořć, A. Generating a spatial coverage plan for the emergency medical service on a regional scale: Empirical versus random forest modelling approach. J. Transp. Geogr. 2020, 89, 102889. [Google Scholar] [CrossRef]
- Li, X.; Hu, Q.; Gregg, A. An integrated spatio-temporal analysis of emergency medical service response characteristics for stroke events across Alabama. J. Transp. Health 2021, 20, 101018. [Google Scholar] [CrossRef]
- Jagtenberg, C.; Vollebergh, M.; Uleberg, O.; Røislien, J. Introducing fairness in Norwegian air ambulance base location planning. Scand. J. Trauma Resusc. Emerg. Med. 2021, 29, 50. [Google Scholar] [CrossRef]
- Standard Road Network in 2021, Korea National Transportation Information Center (KNTIC). Available online: https://www.its.go.kr/nodelink/nodelinkRef (accessed on 1 July 2023).
- Public Data Portal (PDP) Average Taxi Speed Data in 2021. Available online: https://www.data.go.kr/en/index.do (accessed on 1 July 2023).
- The Status of 119 Safety Centers in 2021, KNFA. Available online: https://www.nfa.go.kr/nfa/releaseinformation/0011/0001/ (accessed on 1 July 2023).
- National Emergency Medical Portal (NEMP): EMS Hospital Data in 2021. Available online: https://www.e-gen.or.kr/intro/intro.do;jsessionid=F2F11070D9F0E4EC93674D860DAD0C8E.egenlb (accessed on 1 July 2023).
- KMHW Air Ambulance Operation Guideline. 2016. Available online: https://www.mohw.go.kr/ (accessed on 14 July 2023).
- Jung, S.; Qin, X. Impacts of augmenting heliports with school playgrounds on air medical transport time. J. Transp. Saf. Secur. 2022, 14, 46–66. [Google Scholar] [CrossRef]
- KMHW The cross-ministerial regulation for joint operation of EMS helicopter. 2019. Available online: https://www.law.go.kr/LSW/admRulLsInfoP.do?admRulSeq=2200000076777 (accessed on 1 July 2023).
- Korean Educational Statistics Service (KESS): List of Educational Facilities in 2021. Available online: https://kess.kedi.re.kr/index (accessed on 1 July 2023).
- Zhai, X.; Huang, H.; Sze, H.; Song, Z.; Hon, K. Diagnostic analysis of the effects of weather condition on pedestrian crash severity. Accid. Anal. Prev. 2019, 122, 318–324. [Google Scholar] [CrossRef]
- Jung, S.; Qin, X. Identifying the Local Impacts of Speed-Related Factors on Tunnel Entrance Crash Severity. Transp. Res. Rec. 2023, 2679, 730–742. [Google Scholar] [CrossRef]
- Liu, J.; Khattak, A.; Chen, C.; Wan, D.; Ma, J.; Hu, J. Revisiting Hit-and-Run Crashes: A Geo-Spatial Modeling Method. Transp. Res. Rec. 2018, 2672, 81–92. [Google Scholar] [CrossRef]
- Jung, S.; Qin, X.; Noyce, D. Rainfall effect on single-vehicle crash severities using polychotomous response models. Accid. Anal. Prev. 2010, 42, 213–224. [Google Scholar] [CrossRef] [PubMed]
- Nakaya, T.; Charlton, M.; Yao, J. GWR4.09 User Manual; GWR 4 Development Team. 2016. Available online: https://gwr.maynoothuniversity.ie/wp-content/uploads/2013/04/GWR4_Manual.pdf (accessed on 12 December 2023).
- Brodsky, H. Emergency medical service rescue time in fatal road accidents. Transp. Res. Rec. 1990, 1270, 89–96. [Google Scholar]
- Shang, Q.; Guo, X.; Li, J.; Wang, T. Post-earthquake health care service accessibility assessment framework and its application in a medium-sized city. Reliab. Eng. Syst. Saf. 2022, 228, 108782. [Google Scholar] [CrossRef]
- Campbell, J. International Trauma Life Support for Emergency Care Providers, 8th ed.; Pearson: New York, NY, USA, 2018. [Google Scholar]
- Ministry of Land, Infrastructure and Transportation (MLIT) E-National Index: Population Trends in Urban Areas in 2022. Available online: https://www.index.go.kr/unity/potal/main/EachDtlPageDetail.do?idx_cd=1200 (accessed on 1 July 2023).
Figure 1.
Survival rates by EMS time intervals.

Figure 2.
Spatial distribution of existing EMS infrastructure in Korea: (a) EMS stations; (b) EMS hospitals; (c) EMS helicopter bases; (d) heliports.
Figure 2.
Spatial distribution of existing EMS infrastructure in Korea: (a) EMS stations; (b) EMS hospitals; (c) EMS helicopter bases; (d) heliports.

Figure 3.
Seventeen key variables by RF.

Figure 4.
Distribution of significant coefficients for EMS time-related variables in the CB province of Korea: (a) coefficient values for 11 to 15 min transport time; (b) coefficient values for 16 to 20 min aggregated EMS response time.
Figure 4.
Distribution of significant coefficients for EMS time-related variables in the CB province of Korea: (a) coefficient values for 11 to 15 min transport time; (b) coefficient values for 16 to 20 min aggregated EMS response time.

Figure 5.
Accessibility of existing EMS infrastructure in CB: (a) 15 min accessibility by EMS vehicles from EMS stations; (b) 10 min accessibility by EMS vehicles from targeted crash locations; (c) 10 min accessibility by EMS helicopters; (d) 10 min accessibility by EMS vehicles from targeted crash locations.


Table 1.
Descriptive statistics of variables.
| Variable (Unit) | Variable Categories | % of Total Sample Size N (N = 568) |
|---|---|---|
| Response variable | ||
| Medical treatment consequence | Fatality | 5.6 |
| Survival | 94.4 | |
| Explanatory variable | ||
| Victim | ||
| Age (years) | Younger than 25 | 16.0 |
| 25 to 64 | 71.1 | |
| Older than 64 | 12.9 | |
| Gender | Male | 59.3 |
| Female | 40.7 | |
| Position seated | Driver | 56.7 |
| Front passenger | 21.5 | |
| Back | 21.8 | |
| Seatbelt | Worn | 70.0 |
| Not worn | 30.0 | |
| Vehicle | ||
| Victim’s vehicle type | Passenger car | 52.6 |
| SUV/van | 30.6 | |
| Truck | 16.8 | |
| Counterpart vehicle | Passenger car | 29.8 |
| SUV/Van | 13.0 | |
| Truck | 13.6 | |
| Trailer/bus | 13.6 | |
| Fixed objects | 18.5 | |
| Rollover | 11.5 | |
| Front airbag | Deployed | 19.4 |
| Not deployed | 80.6 | |
| Side airbag | Deployed | 5.3 |
| Not deployed | 94.7 | |
| Roadway and Crash | ||
| Functional class of road | Expressway | 17.6 |
| National highway | 13.4 | |
| Rural principal road | 13.6 | |
| Urban road | 55.4 | |
| Collision type | Single vehicle involved | 12.5 |
| Head-on | 25.9 | |
| Angle | 47.9 | |
| Rear-end | 13.7 | |
| Primary cause of crash | Driving under alcohol effect | 11.6 |
| Drowsy driving | 6.2 | |
| Centerline violation | 6.3 | |
| Signal/speed/parking violations | 12.4 | |
| Careless driving | 53.2 | |
| Vehicle defects | 3.3 | |
| Roadway conditions | 7.0 | |
| Weather | Clear | 72.4 |
| Cloudy | 6.3 | |
| Rain/snow/fog | 21.3 | |
| Temporal factors | ||
| Season | Spring (March to May) | 28.5 |
| Summer (June to August) | 27.6 | |
| Autumn (September to November) | 23.6 | |
| Winter (December to February) | 20.3 | |
| Sunlight | Night | 33.5 |
| Daytime | 66.5 | |
| Hour of the day | 20:00 to 05:59 | 27.1 |
| 6:00 to 8:59 | 18.1 | |
| 9:00 to 13:59 | 23.8 | |
| 14:00 to 16:59 | 17.6 | |
| 17:00 to 19:59 | 13.4 | |
| EMS time | ||
| EMS vehicle’s response time aggregated by the on-scene time (min) | Less than 6 | 7.9 |
| 6 to 10 | 35.2 | |
| 11 to 15 | 22.4 | |
| 16 to 20 | 19.0 | |
| 21 to 25 | 9.7 | |
| More than 25 | 5.8 | |
| EMS vehicle’s transport time (min) | Less than 11 | 8.1 |
| 11 to 15 | 21.8 | |
| 16 to 20 | 14.8 | |
| 21 to 25 | 12.0 | |
| 26 to 30 | 12.9 | |
| More than 30 | 30.5 | |
Each variable category was transformed to indicator variable; sample size in each variable category is 30 or more than 30.
Table 2.
Technical description for EMS helicopters in Korea.
| Category of HEMS (Affiliation) | Helicopter Base (City) | Model (Manufacturer) | Overall Length 1 (m) | Ave./Max. 2 Cruise Speed (km/h) | Operation Radius (km) | Night Operation Applicable |
|---|---|---|---|---|---|---|
| Dr. Heli (KMHW) | CN (Cheonan) | AW109 (Leonardo) | 11.5 | 285/311 | 70~250 | n.a. |
| GB (Andong) | AW109 | 11.5 | 285/311 | |||
| GW (Wonju) | AW109 | 11.5 | 285/311 | |||
| JB (Iksan) | AW109 | 11.5 | 285/311 | |||
| GG (Suwon) | AW169 (Leonardo) | 11.5 | 268/297 | |||
| GG (Incheon) | AW169 | 12.2 | 268/297 | |||
| JN (Mokpo) | AW169 | 12.2 | 268/297 | |||
| JJ (Jeju) | Light Civil Helicopter (KAI) | 12.7 | 265/265 | |||
| Dr. Heli (KNFA) | GG (Namyangju) | H225 (Airbus) | 19.5 | 262/324 | 250~400 | applicable |
| 119 Heli-EMS (KNFA) | CB (Choongju) | H225 | 19.5 | 262/324 | ||
| GB (Daegu) | H225 | 19.5 | 262/324 | |||
| GG (Seoul) | AW189 (Leonardo) | 14.6 | 287/313 | |||
| GW (Yangyang) | AW139 (Leonardo) | 16.6 | 277/310 | |||
| GW (Hwingsung) | AW139 | 16.6 | 277/310 | |||
| GG (Incheon) | AW139 | 16.6 | 277/310 | |||
| GG (Yongin) | AW139 | 16.6 | 277/310 | |||
| CN (Taean) | AW139 | 16.6 | 277/310 | |||
| GN (Busan) | AW139 | 16.6 | 277/310 | |||
| JN (Youngam) | AW139 | 16.6 | 277/310 | |||
| CB (Cheongju) | BK117C (Kawasaki) | 13.3 | 240/276 | |||
| CN (Daejeon) | BK117C | 13.3 | 240/276 | |||
| JB (Wanju) | BK117B2 (Kawasaki) | 13.0 | 267/278 | |||
| JN (Gwangju) | BK117B2 | 13.0 | 267/278 | |||
| GB (Daegu) | AW169 (Leonardo) | 14.6 | 268/297 | |||
| GN (Ulsan) | KA-32T (KumAPE) | 15.9 | 200/230 | |||
| GN (Hapcheon) | KUH-1EM (KAI 3) | 19.0 | 278/290 | |||
| JN (Hwasoon) | KUH-1EM | 19.0 | 278/290 | |||
| JJ (Jeju) | KUH-1EM | 19.0 | 278/290 |
1 Total length of helicopter when turning rotor; 2 average/maximum; 3 Korea Aerospace Industries, LTD. Max. cruise speed for 119 heli-EMS is the maximum cruise speed of the fastest helicopter among all helicopters that each base hosts.
Table 3.
Multiple GWBLR and BLR models.
| GWBLR | BLR | ||||||||
|---|---|---|---|---|---|---|---|---|---|
| Parameter | Mean β | Min. β | Q1. β | Q2. β | Q3. β | Max. β | Max. |z| | Β (SE) | p-Value |
| Intercept | −3.461 | −3.932 | −3.565 | −3.453 | −3.311 | −3.186 | 9.908 | −3.727 (0.368) | 0.001 |
| Transport time (11 to 15 min) | 1.987 | 1.874 | 1.915 | 1.972 | 2.038 | 2.228 | 5.191 | 2.222 (0.427) | 0.001 |
| Response time aggregated by on-scene time (16 to 20 min) | 0.840 | 0.446 | 0.621 | 0.810 | 0.982 | 1.561 | 3.777 | 1.230 (0.399) | 0.002 |
| Centerline violation | 1.513 | 1.463 | 1.500 | 1.515 | 1.525 | 1.563 | 2.450 | 1.536 (0.628) | 0.014 |
| Urban road | −1.465 | −1.823 | −1.671 | −1.501 | −1.322 | −0.837 | 3.352 | −0.972 (0.421) | 0.021 |
| Deviance (intercept-only) | 246.251 | 246.251 | |||||||
| Deviance (fitted) | 195.293 | 204.463 | |||||||
| AIC | 210.088 | 214.570 | |||||||
| Pseudo R2 | 0.207 | 0.170 | |||||||
Min., Q1, Q2, Q3, and max. indicate the minimum, lower quartile, median, upper quartile, and maximum values of local coefficient estimates, respectively.; β is the coefficient estimate of the predictor; and SE is the standard error of β.
Disclaimer/Publisher’s Note: The statements, opinions and data contained in all publications are solely those of the individual author(s) and contributor(s) and not of MDPI and/or the editor(s). MDPI and/or the editor(s) disclaim responsibility for any injury to people or property resulting from any ideas, methods, instructions or products referred to in the content. |
© 2024 by the authors. Licensee MDPI, Basel, Switzerland. This article is an open access article distributed under the terms and conditions of the Creative Commons Attribution (CC BY) license (https://creativecommons.org/licenses/by/4.0/).
Share and Cite
MDPI and ACS Style
Jung, S.; Qin, X. Promoting Emergency Medical Service Infrastructure Equality to Reduce Road Crash Fatalities. Sustainability 2024, 16, 1000. https://doi.org/10.3390/su16031000
AMA Style
Jung S, Qin X. Promoting Emergency Medical Service Infrastructure Equality to Reduce Road Crash Fatalities. Sustainability. 2024; 16(3):1000. https://doi.org/10.3390/su16031000
Chicago/Turabian StyleJung, Soyoung, and Xiao Qin. 2024. "Promoting Emergency Medical Service Infrastructure Equality to Reduce Road Crash Fatalities" Sustainability 16, no. 3: 1000. https://doi.org/10.3390/su16031000
Note that from the first issue of 2016, this journal uses article numbers instead of page numbers. See further details here.