
Enterprise Digital Transformation and Compliance in Cross-Regional Development: A Dynamic Capabilities Perspective
1
School of Business, Sun Yat-sen University, Guangzhou 510006, China
2
Antai College of Economics & Management, Shanghai Jiao Tong University, Shanghai 200030, China
*
Author to whom correspondence should be addressed.
Sustainability 2024, 16(2), 844; https://doi.org/10.3390/su16020844
Submission received: 21 December 2023
/
Revised: 14 January 2024
/
Accepted: 16 January 2024
/
Published: 18 January 2024
(This article belongs to the Special Issue Emerging Research in Digital Economy and Carbon Emissions)
Abstract
:The cross-regional development of enterprises has comparative advantages, but it also brings a new challenge to internal control. To address this challenge, this study suggests enterprise digital transformation as a solution and empirically tests the effect of enterprise digital transformation on the violation of nonlocal subsidiaries as a proxy of compliance in cross-regional development. Using the unique data from the internal control survey questionnaire of Chinese listed companies, this study measures the level of enterprise digital transformation. The empirical results reveal a significant negative correlation between the level of enterprise digital transformation and the degree of violation of nonlocal subsidiaries. The findings remain robust after a series of heterogeneity tests. The mechanism test reveals that enterprise digital transformation strengthens the governance over the violation of nonlocal subsidiaries by alleviating information asymmetry and improving internal control quality. The heterogeneity analysis addresses the issues regarding the factors influencing the effect of enterprise digital transformation including strategic focus, technical input-efficiency balance, and the role of organizational culture. And the results of heterogeneity analysis indicate that the governance effect of enterprise digital transformation is more pronounced at the business level rather than the functional level and at the transformation stage where technical investment and efficiency are balanced. Additional analysis indicates that the governance effect of enterprise digital transformation is more pronounced in nonlocal subsidiaries established through autonomous investment. Furthermore, economic benefit analysis reveals that enterprise digital transformation promotes cost reduction and the increase in efficiency in nonlocal subsidiaries. This study enriches the quantification and economic consequences of enterprise digital transformation, and it also offers valuable implications for promoting digital transformation in traditional enterprises and strengthening internal control and compliance in the context of cross-regional development.
1. Introduction
China’s unified market provides basic institutional conditions for regional economic exchanges. At the micro-level, enterprises adopting cross-regional development strategies can effectively leverage the diverse strengths of various regions [1,2,3]. An analysis of annual reports from Chinese listed companies reveals that more than half of the subsidiaries of listed companies are registered in different provinces. However, this expansion also presents fresh obstacles to the internal control of these enterprises.
This study explores the methods to address internal control issues in the context of cross-regional development. The increasing information asymmetry between parents and subsidiaries during cross-regional development poses challenges to effective internal control and monitoring. Existing research has found that greater geographical distances weaken the oversight role of independent directors [4], increase borrowing costs [5], and reduce audit quality [6]. Statistical data disclosed by Chinese listed companies reveal a fluctuating upward trend in disclosing internal control weaknesses related to subsidiaries. Additionally, the open data further indicate that the average degree of violation of nonlocal subsidiaries is significantly higher than that of local subsidiaries. This weakness not only results in fraud but also leads to the violations of civil contracts and laws, causing economic loss and reputation damage to the parent enterprises. Therefore, it is crucial to strengthen internal control and governance over nonlocal subsidiaries in order to mitigate these risks in cross-regional development.
However, implementing such internal control over nonlocal subsidiaries is challenging due to variations in property rights protection in China. State-owned enterprises (SOEs) have self-contained internal and external monitoring resources for their nonlocal subsidiaries. The internal audit function of SOEs is well equipped, and nonlocal regulatory departments can also participate in the monitoring of state-owned assets. However, non-SOEs lack such monitoring resources. Although some scholars have examined the positive effect of nonlocal chambers of commerce on cross-regional investment [7], these social networks, like nonlocal chambers of commerce, lack the legal authority to collect evidence on violations or to ensure compliance.
New technologies may offer a promising solution for enterprises, particularly non-SOEs, to tackle the internal control challenges arising from cross-regional development. Digital transformation is defined as a process that aims to improve an entity by triggering significant changes to its properties through combinations of information, computing, communication, and connectivity technologies [8,9]. The literature has found that enterprise digital transformation promotes operation efficiency by, for example, implementing production automation [10], improving the business process [11], saving costs [12], and improving the process and quality of decision making [13]. However, another line of the literature has highlighted the potential risks associated with digital development, including the adverse effect on the stability of financial markets [14,15] and on the material misstatement risk and audit fees in auditing markets [16,17]. Consequently, there is a lack of consensus among the literature on enterprise digital transformation.
Furthermore, it remains a question as to how digital technology impacts internal control monitoring [18], including its role in deterring the violation of nonlocal subsidiaries. Cressey proposed a triangular model, suggesting that the roots of violations lie in motivation, chance, and rationalization [19]. Digital technologies may facilitate the detection of violation-related indicators, thereby reducing the likelihood of nonlocal subsidiaries engaging in violations. Nonetheless, it may also enable the parent company to hide its own misconduct from its subsidiaries. To answer this question, this study aims to investigate whether enterprise digital transformation can effectively address the risk of violation of nonlocal subsidiaries.
This study quantifies the level index of enterprise digital transformation based on a specially designed evaluation system of enterprise digital transformation and the unique data from the internal control survey questionnaire of Chinese listed companies. This study empirically examines the impact and pathway of enterprise digital transformation on the violations of nonlocal subsidiaries from the theoretical perspective of the agency problem between listed companies and their nonlocal subsidiaries.
The empirical results indicate that the level of enterprise digital transformation is significantly negatively associated with the degree of violation of nonlocal subsidiaries. The findings still hold after conducting several robustness tests, including the entropy balance method, Heckman’s two-stage method, and the instrumental variable test, by controlling individual fixed effects, using alternative variables for independent and dependent variables, and excluding the impact of subsidiary digital transformation, subsidiary internal control, and regional institution. The mechanism test reveals that enterprise digital transformation deters the violation of nonlocal subsidiaries by alleviating information asymmetry and improving internal control quality. The heterogeneity analysis addresses the issues regarding the factors influencing the effect of enterprise digital transformation including strategic focus, technical input-efficiency balance, and the role of organizational culture. And the results of heterogeneity analysis illustrate that the governance effect of enterprise digital transformation is mainly observed at the business level rather than the functional level of the value chain and at the transformation stage of balance between the investment and efficiency of digital technologies. Additional analysis indicates that the governance effect is more pronounced in nonlocal subsidiaries established through autonomous investment which share an identical or similar institution and culture with their parent company. Furthermore, economic benefit analysis reveals that enterprise digital transformation promotes cost reduction and an increase in efficiency in nonlocal subsidiaries.
Compared with the literature, the academic and practical contribution of this study are as follows. Firstly, this study offers a new measurement indicator and enriches the research on the economic consequence of enterprise digital transformation. Currently, the word frequency method [20], the intangible assets method [21], and the pilot enterprises method [22] are commonly used to measure enterprise digital transformation. Based on the evaluation system and the questionnaire method, our measurement describes the cognition of enterprise leaders and top management teams regarding enterprise digital transformation, and also obtains the investment and efficiency of transformation. And this study provides empirical evidence for the governance effect of enterprise digital transformation.
Secondly, we contribute to the literature on compliance and internal control in the setting of nonlocal subsidiaries. Subsidiaries, especially those located in other regions, are the focus and difficulty of internal control. However, previous studies primarily examine the effectiveness of internal control, including its digitization, using listed companies as a sample [1,23,24]. This study combines both listed companies and their subsidiaries as the business group, which better reflects the hierarchical structure rather than a loosely connected equity consortium. The setting introduces new perspectives and insights into the research on internal control and corporate governance [25].
Furthermore, this study offers valuable practical implications. Although there are various findings on the focus, methods, and expected outcomes of digital transformation, there is still a lack of effective solutions to address these challenges both theoretically and practically. To address this dilemma, this study indicates that a feasible transformation plan should focus on the business-level transformation, the transformation stage of the balance between investment and efficiency, as well as the integration of internal institutions and organizational culture.
The remainder of this paper is organized as follows: the second part provides the literature review and research hypotheses; the third part presents the research design; the fourth part analyzes the empirical results and conducts a robustness test; the fifth part explores the mechanism; the sixth part conducts heterogeneity analysis; and the seventh part analyzes the economic benefits. The final section summarizes the conclusions and implications.
2. Literature Review and Research Hypothesis
2.1. Enterprise Digital Transformation: Measurement and Economic Consequence
The measurement of the level of enterprise digital transformation mainly includes four methods. The first is the word frequency method, which is measured by counting the number of keywords related to digital technology in the annual report [20,26,27]. The second is the intangible assets method, which involves calculating the proportion of intangible assets related to digital technology disclosed in the footnotes of the annual report [21]. The third is the pilot enterprise method, which measures the level of digitalization through whether enterprises are included in the development policy of a digital economy [22,28,29]. However, all of the above can hardly reflect the strategic intention and planning of the company’s management of digitalization, nor the step and stage of digital transformation. Therefore, the quantification of enterprise digital transformation still needs to be studied.
The literature review in this study focuses on the evaluation index method, which attempts to construct an evaluation index system of enterprise digital transformation [30] and combine the questionnaire or public data into an index [1]. This study provides an overview of the key components of an evaluation framework for enterprise digital transformation, as outlined in Table 1. The evaluation framework tends to encompass at least five essential elements, namely strategy, resource base, technical infrastructure, data, and effectiveness. The primary data are mainly derived from questionnaire surveys. Notably, Gill and VanBoskirk conducted their research using a sample of 1039 corporate marketing decision-makers from 10 countries/regions [30], while Diller et al. utilized a sample of 968 members from the Munich Tax Advisory Association in Germany [31].
The economic consequences of enterprise digital transformation have been widely studied in academia and tested from different perspectives. From the perspective of the capital market, enterprise digital transformation improves stock liquidity [20]. However, Nguyen et al. finds that the introduction of financial digital technology has adverse effects on the stability of financial markets, especially with a weak market discipline [1]. Meanwhile, it also poses new challenges to the external auditors [16,36], which will lead to an increase in the audit fee [17]. Another line of the literature, from the perspective of the company’s insiders, finds that enterprise digital transformation promotes operation efficiency by, for example, implementing production automation [10], improving the business process [11], saving costs [12], and improving the process and quality of decision making [13,37]. It also improves the organizational performance by improving the human capital structure and salary distribution [38], alleviating tax stickiness [39], improving the cash holding level [28] and the input–output efficiency [40], and improving the quality of accounting information [41]. Based on the literature review, there is a lack of consensus among the literature on digital development, and the economic consequences of enterprise digital transformation still need to be expanded, especially the role of enterprise digital transformation in governance and control, which still needs further research [8,42]. It remains an open question as to how digital technology impacts internal control monitoring [18].
2.2. Compliance over Nonlocal Subsidiaries
Compliance literally means acting according to certain accepted standards. The so-called standards generally include three categories: law, industry conventions, and civil contracts. According to the definition of compliance, the literature constructs violation variables from the perspectives of compliance programs or violation outcomes [43,44,45].
Cressey proposed a triangular model, suggesting that the roots of violations lie in motivation, chance, and rationalization [19]. The SOX Act and COSO framework both emphasize compliance as a fundamental objective of internal control. Enhancing the internal control quality can effectively curtail violations [46]. Specific measures include standardizing management performance, improving the quality of internal auditing, and implementing internal reporting [47].
However, the execution of internal control mechanisms for subsidiaries presently encounters difficulties. Figure 1 illustrates the changes in the proportion of internal control weakness related to subsidiaries. The findings reveal that Chinese listed firms have experienced a fluctuating upward trend in disclosing internal control weaknesses related to subsidiaries from 2007 to 2019. The average proportion has risen from less than 10% to approximately 20%. A more detailed analysis indicates that the main source of these weaknesses is the supervision and control of subsidiaries, accounting for 19.8%. This is followed by issues related to process management (7.5%), corporate governance (4.7%), and authorization and approval (4.4%). These findings suggest that there is a widespread agency conflict between listed companies and their subsidiaries.
The difficulty of internal monitoring has been further exacerbated by the geographical distance of nonlocal subsidiaries. Companies often establish subsidiaries in different regions to take advantage of regional comparative advantages, but this also leads to an increase in information asymmetry, which is a major hurdle in internal control practices. Existing research has found that greater geographical distances weaken the oversight role of independent directors [4], increase borrowing costs [5], and reduce audit quality [6]. The extensive evidence provided by the literature indicates that increasing geographical distance results in higher levels of information asymmetry among trading parties. Additionally, an analysis of violation records from public credit platforms such as “Credit China” and the “Judgment Document Network” reveals that nonlocal subsidiaries of Chinese listed companies have significantly higher violation rates compared to local subsidiaries. Therefore, it is crucial for enterprises to address information asymmetry and effectively implement internal control in cross-regional development.
Thus, advancing the level of enterprise compliance program and internal control quality constitutes a vital factor for corporations to facilitate digital transformation [48]. The literature primarily examines the economic impacts of elevating the level of internal control digitization. Listed companies in the United States with a higher degree of digitization can adapt more quickly to SOX compliance [49], resulting in enhanced audit efficiency and timeliness [18]. Nonetheless, in the digital era, it remains an open question as to how technology impacts other areas of internal control monitoring. COSO asserts that the role of monitoring not only aids the financial reporting process but also ultimately the organization’s overall system of governance. Therefore, the question of whether enterprises can improve their digital capabilities to enhance compliance and internal control over nonlocal subsidiaries in the face of internal governance challenges posed by cross-regional development remains an important and understudied issue in both theory and practice.
2.3. Hypothesis Development
2.3.1. Enterprise Digital Transformation and Violation of Nonlocal Subsidiaries
In this study, we propose and elaborate on the managerial agency theory and the dynamic capabilities theory as a theoretical basis for the relationship between enterprise digital transformation and the violation of nonlocal subsidiaries.
The managerial agency theory offers a theoretical explanation for the nature and consequences of the violation of nonlocal subsidiaries. In the context of the current framework proposed by Jensen and Meckling on shareholders and managers [50], as well as the concept of controlling and minority shareholders introduced by Shleifer and Vishny [51], this study aims to explore the potential issue of opportunistic behavior by subsidiaries, which may act against the interests and objectives of listed companies. It recognizes the challenges posed by the information asymmetry between parent companies and their subsidiaries, which increases the difficulty of implementing internal control of the parent companies over their nonlocal subsidiaries. This information asymmetry provides the nonlocal subsidiaries with institutional conditions, resulting in violation behavior.
The dynamic capabilities theory provides a theoretical explanation on how to address internal control issues in the context of cross-regional development. The ability to adapt to changes, seize opportunities, and mitigate risks is crucial for sustainable development in an uncertain and changing business environment [52,53]. Dynamic capabilities are demonstrated through three key mechanisms. Firstly, it involves perceiving changes in the environment. Secondly, it requires a deep understanding of the impact and direction of these changes. Lastly, it necessitates the effective coordination of resources to facilitate transformation and effectively respond to these changes.
Enterprise digital transformation is a strategic response to changing environmental conditions [54], utilizing both technical and management efficiency [55]. Technical efficiency is mainly reflected in the use of digital technology to promote the transparency and traceability of organizational information, breaking down temporal and spatial limitations and enabling rapid transmission [56,57]. This information infrastructure allows enterprises to effectively perceive changes in the business environment. Management efficiency is demonstrated through the integration of best practices in digital technology, the solidification of IT and the internal control procedure, and the accumulation of experience and knowledge assets [58]. These factors enable enterprises to effectively control and respond to environmental changes. To effectively address the risk of violations of nonlocal subsidiaries, it is crucial for organizations to enhance their dynamic ability to perceive, control, and respond to such risks. This can be achieved through enterprise digital transformation, which fosters the improvement in the internal information environment and internal control within the organization [9,59].
Enterprise digital transformation enhances the perception of the risk of violations of nonlocal subsidiaries by reducing information asymmetry. The increase in geographic distance between nonlocal subsidiaries and their parent companies leads to an increase in the cost of information transmission. However, enterprise digital transformation enables the transparency, traceability, and rapid transmission of organizational information, relying on the combined application of information, communication, computing, and connectivity technologies [56,57]. This technologically groundbreaking advancement overcomes limitations in time and space, facilitating the seamless flow of information within the organization. It enables real-time access to the operational status of nonlocal subsidiaries, thereby enhancing the perception of changes in the business environment [22,41].
Enterprise digital transformation enhances the monitoring and control over the risk of violation of the nonlocal subsidiaries by improving internal control quality. Ensuring legal and compliant operations is a crucial objective of internal control, and effective internal control serves as a vital safeguard for enterprise compliance. However, effectively managing the risk of violations of nonlocal subsidiaries poses a challenge for internal control. Enterprise digital transformation is a process that integrates business procedures and leverages the implicit experiences and industry knowledge accumulated within the enterprise. This integration is aimed at creating a comprehensive management database and leveraging knowledge assets to enhance the control environment [58]. Digital technology achieves the quantification and analysis of business information, and then generates risk prediction models based on the massive amounts of business information [60]. These models provide a more accurate assessment of the nature and impact of violation, enabling enterprises to propose more effective measures for the risk response. Furthermore, enterprise digital transformation promotes the integration of IT systems and internal control procedures, reducing the reliance on human manipulation and enabling more intelligent control activities [22]. Last but not least, enterprise digital transformation also allows for the comprehensive tracking of business processes, making it possible for internal monitoring to achieve full coverage over all businesses regardless of time or location constraints. Therefore, enterprise digital transformation improves the quality of internal control through various elements, and it provides technical support and institutional guarantees for the effective monitoring and control over the risk of violation of nonlocal subsidiaries. In summary, this study proposes the following hypothesis:
Hypothesis 1 (H1).
Enterprise digital transformation reduces the risk of violation of nonlocal subsidiaries by alleviating information asymmetry and improving internal control quality.
2.3.2. Levels of Enterprise Digital Transformation and Violation of Nonlocal Subsidiaries
Enterprise digital transformation is the overall reshaping of business processes and organization management functions. The literature has regarded digitalization as a strategy at the functional level. However, as digital technologies facilitate the interconnectivity of products, processes, and services, digital transformation is increasingly being integrated into business-level strategies [13].
A digital transformation strategy implemented at the business or management level may result in varying investment priorities and expected outcomes. If the digital transformation were implemented at the management level, it would not be confined to a specific business process, instead serving as a management support platform. For example, a suite of information systems implemented in the administrative, human resources management, financial, and auditing departments are designed to deal with the entire organization’s scope and enhance the efficiency of management decision making and monitoring [61]. However, the objective of implementing digital transformation at the business level is to utilize digital technology to support businesses, optimize business models, and ultimately enhance competitive advantages [62,63,64]. In the measurement of enterprise digital transformation, researchers have likewise considered and categorized these levels. McAfee et al. classify the degree of digital transformation into two dimensions: digital intensity and transformation management intensity [65]. Diller et al. distinguish between the business level and the overall organizational level when evaluating digital maturity indicators [1].
Enterprise digital transformation can be partitioned into two levels in the context of the firm’s value chain: digital transformation at the business level and digital transformation at the functional level [1,65,66]. The former pertains to the fundamental links of the value chain, encompassing product design, procurement, production, and marketing. In contrast, the latter refers to the supporting functions of the value chain, including administrative affairs, human resources management, financial accounting, and internal auditing. The subsidiaries are specifically engaged in business operations and serve as the platform for value creation. Therefore, this study proposes the following hypothesis:
Hypothesis 2 (H2).
The governance effect of enterprise digital transformation on the risk of violation of nonlocal subsidiaries is more pronounced at the business level.
2.3.3. Stages of Enterprise Digital Transformation and Violation of Nonlocal Subsidiaries
Enterprise digital transformation is a multifaceted and ongoing process that may not produce instantaneous outcomes. It is challenging to achieve optimal results solely through strategic planning or technical investment. This disparity between the transformation process and its efficiency can influence the expected performance. Therefore, it is crucial to investigate the relationship between the investment and efficiency of digital transformation when analyzing the governance effect on the risk of violation of nonlocal subsidiaries.
Efficiency represents how effectively the final mix of inputs has affected production. A higher technical efficiency requires a greater amount of IT capital investment. However, an increase in IT investment does not necessarily guarantee the achievement of expected performance [67]. The relationship between investment and efficiency may also be influenced by factors such as resource allocation efficiency, management rationality, and organizational controls [68]. The complexities of IT projects along with the effect of project interdependencies raise challenges in the prioritization of IT investments [69]. Therefore, it is crucial to investigate the relationship between the investment and efficiency of digital transformation when analyzing the effect of governance on the risk of violation of nonlocal subsidiaries.
According to the “Three Line Model” developed by The Institute of Internal Auditors (IIA), business units such as procurement, production, sales, and services constitute the “first line of defense” for risk prevention and the control of violations. As the second and third lines, the finance and audit departments are dependent on the business units. In the context of digital transformation, the level of digitalization in business determines the level of digitalization in financial and auditing functions. The prevention and control of the risks of violation of nonlocal subsidiaries assess the effectiveness of internal audit functions and place higher requirements on the level of digitalization in internal auditing. From another perspective, the improvement in IT performance in internal processes will lead to improvements in customer service and company performance [67]. Companies demonstrating strong intensity in both technical investment and transformation management tend to achieve superior financial performance [65]. The prevention and control of the risks of violation of nonlocal subsidiaries also examine digital technical efficiency and explore the role of digital transformation in improving the internal governance of organizations [70]. Therefore, this study predicts that the governance effect of digital transformation on the violation of nonlocal subsidiaries will achieve the expected performance when digital transformation investment is matched with its efficiency.
Hypothesis 3 (H3).
The governance effect of enterprise digital transformation on the risk of violation of nonlocal subsidiaries is more pronounced at the transformation stage where investment and efficiency are balanced.
2.3.4. Enterprise Digital Transformation and Violation of Nonlocal Subsidiaries: An Organizational Culture Perspective
Organizational culture plays a pivotal role in the successful execution of digital transformation strategies within enterprises [71]. The alignment of values embedded in information systems with the organizational culture increases the likelihood of enterprises adopting these systems [72]. The varying origins of subsidiaries result in distinct systems and cultures between parent companies and their subsidiaries. The origins of subsidiaries incorporated in the consolidated financial statements typically comprise the autonomous investment of the parent company, a business combination under the same control, and a business combination not under the same control. Subsidiaries established through autonomous investment typically exhibit a higher capacity to inherit the institutions and culture of their parent companies [73]. In contrast, subsidiaries merged through business combinations not under the same control display a greater differentiation from their parent company in terms of historical origin, development process, and corporate culture [74,75,76]. The control effect of enterprise digital transformation may be restrained by different institutions and cultures. Therefore, this study proposes the following hypothesis:
Hypothesis 4 (H4).
The governance effect of enterprise digital transformation on the risk of violation of nonlocal subsidiaries is more pronounced in the autonomously invested nonlocal subsidiaries.
In summary, this study explores the relationship between enterprise digital transformation and the violation of nonlocal subsidiaries. Figure 2 presents an overview of the research framework. We initially examine the possible correlation and delve into the underlying mechanism. Additionally, we conduct a heterogeneous analysis of the effect of digital transformation on the violation of nonlocal subsidiaries by differentiating the levels and stages of digital transformation and the origins of nonlocal subsidiaries, providing insights into how enterprise digital transformation influences the violation of nonlocal subsidiaries. Finally, we conduct an economic benefits analysis regarding the influence of enterprise digital transformation on the operating costs and efficiency of nonlocal subsidiaries.
3. Research Design
3.1. Methods
The research methods involve the construction of an evaluation system of enterprise digital transformation and the utilization of unique data from the internal control survey of Chinese listed companies to measure the level index of enterprise digital transformation. This study uses factor analysis to test the reliability and validity of the index.
To estimate the relationship between enterprise digital transformation and the violation of nonlocal subsidiaries, this study adopts ordinary least-squares (OLS) regression analysis. Furthermore, to address potential endogeneity issues and further validate the robustness of the findings, this study employs a series of endogenous treatment methods, including the entropy balance method, Heckman’s two-stage method, and the instrumental variable test, by controlling individual fixed effects, using alternative variables for independent and dependent variables, and excluding the impact of subsidiary digital transformation, subsidiary internal control, and regional institution.
The OLS regression estimation method is also used in the mechanism test, heterogeneity analysis, and economic benefits analysis to further expand the research on the governance effect of enterprise digital transformation on the violation of nonlocal subsidiaries.
The following subsections specifically explain the sample selection, data sources, variable definition, and regression model.
3.2. Sample Selection and Data Sources
The initial sample for this study was derived from the internal control questionnaire of listed companies in China. The internal control survey working group was led by the Listing Department of China Securities Regulatory Commission (CSRC), with members including the Accounting Department of CSRC, China Association of Listed Companies, Shanghai Stock Exchange, and Shenzhen Stock Exchange. On 5 September 2014, the working group distributed questionnaires to A-share listed firms, accounting firms, and institutional investors.
The sample period was set from 2013 to 2015, which is feasible and reasonable. Firstly, although the questionnaire survey occurred in 2014, some items of the questionnaire cover the years 2013 to 2015. This ensures that we capture a comprehensive view of the digital transformation during the study period. Secondly, digital transformation is a long-term strategy, and therefore, the level of transformation is relatively stable in the short term. It is acceptable to extend our sample before and after the survey year in 2014. Thirdly, the time of occurrence of a violation often precedes the time of disclosure of a violation. To accurately document the statistics, it is necessary to use a panel data model rather than a cross-sectional model. This approach allows us to account for the time lag between violation occurrence and disclosure. Furthermore, given that state-owned enterprises (SOEs) have relatively self-contained internal and external monitoring resources for their nonlocal subsidiaries, we specifically focus on the sample of non-SOEs. This enables us to test the governance effect of digital transformation on the violation of nonlocal subsidiaries of non-SOEs, where the impact may be more pronounced.
The initial sample was selected according to the following procedures: (1) Observations from financial companies are excluded, as they have significant differences from non-financial companies in terms of financial statements, legal norms, and transaction objects. (2) Listed companies in the information transmission, software, and information technology services industry are excluded, as they differ from manufacturing companies in terms of the purpose of digital transformation and technical investment. (3) State-owned listed companies are excluded, as they have abundant internal and external supervision resources for nonlocal subsidiaries. (4) ST and PT companies are excluded. (5) Annual observations of companies with missing data for the relevant empirical variables are excluded. After the above selection, a total of 4723 firm–year–province observations were obtained, resulting in a sample of 445 listed firms.
We obtained subsidiary lists from the CSMAR database “https://data.csmar.com/ (accessed on 10 January 2023)” of financial statement footnotes. Then, we inputted the names of subsidiaries one by one into the Credit Chinese website “https://www.creditchina.gov.cn/ (accessed on 11 January 2023)” to obtain their unified social credit codes and administrative penalty records. Additionally, we collected litigant records including court announcements, judgment documents, and lost cases from the China Judicial Documents website https://wenshu.court.gov.cn (accessed on 5 April 2023)”. Furthermore, we retrieved records of trust-breaking individuals subjected to enforcement, known as defaulters, from the China Executive Information Disclosure website “http://zxgk.court.gov.cn/ (accessed on 25 May 2023)”. The regional GDP data were sourced from the China Economic Information (CEI) website’s statistical database. Moreover, the listed firms’ internal control index and information disclosure of internal control weaknesses were downloaded from the DIB database “https://www.dibcn.com/ (accessed on 10 January 2023)”. Lastly, corporate governance data, financial data, and other relevant data at the regional level were collected from the CSMAR database. To minimize the influence of extreme values, all continuous variables in the empirical model were winsorized at the 1% level.
3.3. Variable Definition
The explanatory variable in this study is the index of enterprise digital transformation. To measure the index, this study constructs a comprehensive evaluation system for enterprise digital transformation based upon the previously mentioned concept definition, basic elements, and evaluation framework [30,31,32,33,34,35].
The system encompasses five key aspects: strategy, resource base, technological infrastructure, data, and effectiveness. Within each aspect, five primary indicators are identified: Strategy and development, Organization and human resources, Technology and platform, Data and application, and Business and effect.
The first indicator, Strategy and development, aligns with the attributes of the target entity, mainly considering the strategic value of digital transformation, the degree of consistency between digital transformation and current company strategies, and the assessment of the expected impact of digital transformation on business development. Strategy and planning are the foundation of enterprise digital transformation [77]. The second indicator, Organization and human resources, mainly considers IT human resources, the organizational power allocation towards the CIO, and the budget for digital transformation. These elements play a crucial role in ensuring the effective implementation of enterprise digital transformation [78]. The third indicator, Technology and platform, indicates the core content of enterprise digital transformation, as digital transformation is dependent on the availability of technical resources and involves selecting the right technical routes. It requires both introducing digital technologies and upgrading traditional IT technologies [1,30]. The fourth indicator, Data and application, encompasses data application capabilities and data security guarantees. Data have become a new production element in the digital economy era, driving business model transformations [79]. Meanwhile, the increasing volume of data has made data security an imperative concern. The last indicator, Business and effect, evaluates the transformation effects of various aspects of the value chain and offers evaluation outcomes that cater to the viewpoints of decision makers and technical managers. Enterprise digital transformation constitutes a profound transformation process with the ultimate aim of enhancing value creation capabilities [80].
In summary, the scale of enterprise digital transformation includes 5 first-level indicators, 18 second-level indicators, and 56 third-level indicators, as shown in Table 2. This study ascertains the weights of each indicator using factor analysis methods and SPSS 20 software. The index of enterprise digital transformation is calculated by taking the weighted sum of multiple indicators.
The dependent variable is the violation degree of nonlocal subsidiaries, as a proxy for the enterprise cross-regional compliance development. The subsidiaries refer to the wholly owned or holding subsidiaries by listed companies outside the province where their headquarters are located within the Chinese mainland. To construct a violation variable, this study follows the definition of compliance. Compliance literally means acting according to certain accepted standards. The so-called standards generally include three categories: law, industry conventions, and civil contracts. According to the definition of compliance, the literature constructs violation variables from the perspective of compliance programs or violation outcomes [43,44,45].
This study constructs the violation variable from the perspective of violation outcomes, utilizing the actual occurrence of violations. The index used to measure the violation degree of nonlocal subsidiaries comprises eight key indicators of violation outcomes, namely, administrative penalty, environmental penalty, tax penalty, court announcement, judgment document, number of lost cases, persons subject to enforcement, and trust-breaking persons subject to enforcement. These indicators cover as many aspects of the compliance standards as possible. To calculate the violation degree, the scores of these eight violation records are summed up and converted into a percentage as the original values. Given that the listed firms belong to different industries and operate in different regulatory and litigation environments, and considering the varying number of nonlocal subsidiaries, the original values are adjusted based on the industry and the number of nonlocal subsidiaries. This adjustment allows for the normalization of the values, resulting in the final values, that is, the violation degree of nonlocal subsidiaries (VIOLA). A higher VIOLA indicates a more severe violation of nonlocal subsidiaries, and vice versa.
Drawing from established theories [21,81], this study controls for firm characteristics, including the size of the parent (SIZE_PAR), solvency (IBDEBT), profitability (ROE), sales growth (GROWTH), and merger and acquisition activity (MA). This study also controls for corporate governance characteristics, including the ownership proportion of the largest shareholder (SHRCR1), ownership balance (BALANCE), the proportion of independent directors (INDEP), the “Big Four” audit (BIG4), CEO duality (DUAL), and the political background of top management (PC), as these factors can influence the first and second kinds of agency problems. Additionally, this study accounts for the presence of the risk control department (RC) and the independence of the internal audit department (IA) to control for the impact of the existing internal monitoring mechanisms on nonlocal subsidiaries. Furthermore, given that regional economic development (PROVGDPG), regional public service (SEREXPR), punishment severity (CONFISREVR), and marketization (MARKET) may have potential influence on the violation of nonlocal subsidiaries, this study controls for the regional institutional environment variables mentioned above. Finally, we control for the geographical distance (DISTPC) between the parent and its nonlocal subsidiaries to alleviate the effect of cost differences caused by geographical distance on internal control. The variable names and measurements are detailed in Table 3.
3.4. Model Design
To verify the hypothesis, the following model (1) is constructed:
This study constructs the firm–year–province three-dimensional panel data. The provinces refer to the place where the nonlocal subsidiary is located, to alleviate the impact of regional institutional characteristics on the degree of nonlocal subsidiary violations. In Model (1), the independent variable DGTijt represents the enterprise digital transformation level and the dependent variable VIOLAijt represents the nonlocal subsidiaries’ violation degree. CONTROLijt are the control variables. If β1 is significantly negative, it indicates that enterprise digital transformation reduces the degree of violation of nonlocal subsidiaries, supporting hypothesis H1. This study uses industry dummy variables δΙ, year dummy variables λΥ, and province dummy variables μΡ to control industry, year, and province fixed effects. Additionally, to address heteroscedasticity and time series issues that could impact the estimation coefficient’s standard error, this study adopts a robust standard error and clusters the errors at the company level.
VIOLAijt = β0 + β1DGTijt + βjCONTROLijt + δΙ + λΥ + μΡ + εit
4. Empirical Results and Analysis
4.1. Descriptive Statistics
Table 4 reports the results of descriptive statistics. The degree of violation of nonlocal subsidiaries (VIOLA) exhibits a maximum value of 0.289, a minimum value of 0.024, and a mean value of 0.175. Enterprise digital transformation level (DGT) demonstrates a maximum value of 0.886, a minimum value of 0.038, and a mean value of 0.423. In the unlisted results, the skewness of DGT is −0.101 and its kurtosis is 3.854, which closely aligns with the standard normal distribution. Additionally, the distributions of the control variables fall within a reasonable range.
Table 5 presents the correlation results. The correlation coefficient between enterprise digital transformation (DGT) and the violation of nonlocal subsidiaries (VIOLA) is −0.049, indicating a negative relationship at a significance level of 1%. This finding provides initial support for hypothesis 1.
Table 6 reports the differences in the degree of violations between nonlocal and local subsidiaries. This study also quantifies the degree of violation of local subsidiaries utilizing the same indicators and measurement approach. The findings reveal that the average degree of violation of nonlocal subsidiaries is significantly higher than that of local subsidiaries at the significance level of 1% during the period from 2013 to 2019, accounting for a difference of 9.26%, calculated as (0.059 − 0.054)/0.054.
The result above is meaningful, because subsidiaries have become essential business segments of listed companies in China. Over 80% of listed companies possess more than five subsidiaries. Additionally, a substantial 56.43% of these subsidiaries are registered in different provinces compared to their parent listed companies. Consequently, it is imperative to enhance the governance towards the nonlocal subsidiaries.
4.2. Reliability and Validity Test of the Evaluation System and Index of Enterprise Digital Transformation
Exploratory factor analysis (EFA) is utilized to assess the validity of the evaluation system of enterprise digital transformation and the appropriateness for factor analysis in this study. Specifically, this study conducts the KMO test and Bartlett’s test of sphericity. Typically, a KMO statistic above 0.7 indicates acceptability for factor analysis. If the statistic falls below 0.5, it suggests that the original data are unsuitable for factor analysis. Additionally, factor analysis necessitates a correlation between the original variables, demonstrated by a p-value of Bartlett’s test of sphericity less than 0.01. Moreover, the null hypothesis that the correlation coefficient matrix of the scale is the identity matrix should be rejected at the 1% level of significance. Table 7 presents the result of the KMO test and Bartlett’s test. The KMO statistic is 0.786, and the p-value of Bartlett’s test of sphericity is 0.000, indicating that the evaluation system is valid and meets the requirements for factor analysis.
This study conducts an iterative multi-rounds exploratory factor analysis (EFA) on the evaluation system. The analysis involved using principal component analysis (PCA) and the Kaiser standardized orthogonal rotation method to extract 18 factors with eigenvalues greater than 1 after rotation. These 18 factors represent the second-level indicators of the scale, as shown in Table 2.
To assess the convergent validity, we consider the standardized factor loadings. It is generally accepted that all standardized factor loadings should be greater than 0.5 to demonstrate convergent validity. In our analysis, all factor loadings exceeded this threshold, indicating strong convergent validity. We also assess the discriminant validity, which requires the factor loading of a specific item to be greater than that with all other factors. Our analysis confirms that the factor loadings meet this criterion, further confirming the discriminant validity of the evaluation system.
Additionally, this study performs an orthogonal rotation of Kaiser standardization, which converges after 22 iterations. The results are presented in Appendix A. This rotation accounts for almost 69.975% of the variability, suggesting good construct validity.
Confirmatory factor analysis (CFA) is conducted after EFA. To assess the reliability of the scale, this study employs Cronbach’s alpha coefficient. Generally, a minimum alpha coefficient of 0.70 is desired, while an alpha coefficient exceeding 0.80 is considered highly favorable. The reliability of the first- and second-level indicators in the evaluation system, as depicted in Appendix B, meets the required standards. And the alpha coefficient for the comprehensive index level of enterprise digital transformation is 0.875. The results above indicate a high level of internal consistency reliability among indicators at all levels and comprehensive indices.
4.3. Benchmark Regression
Table 8 reports the regression results for the relationship between enterprise digital transformation and the violation of nonlocal subsidiaries. The regression coefficient provided in column (1) shows that the level of enterprise digital transformation (DGT) is significantly negatively associated with the degree of violation of nonlocal subsidiaries (VIOLA) at the 1% level, indicating that the higher the level of enterprise digital transformation of the listed firm, the lower the degree of violation of their nonlocal subsidiaries. The VIF is 2.25 in model (1), which is below the threshold of 10, implying that the degree of collinearity is acceptable and the chosen control variables are appropriate for the empirical analysis. Moving to column (2), where the dependent variable is replaced with the degree of violation of nonlocal subsidiaries in the t + 1 year (F1_VIOLA), the coefficient remains significantly negative at the 1% level. Additionally, a substantial disparity in coefficients is observed between columns (1) and (2). Hence, hypothesis 1 (H1) is verified.
4.4. Endogeneity Tests
4.4.1. Entropy Balance
Considering the potential non-randomness of the independent variables, the entropy balance matching method is used in this study following Chahine et al. [82]. A binary virtual variable, DGT_GROUP, is set in advance. When enterprise digital transformation is higher than the median within the same industry and year, DGT_GROUP is 1; otherwise, the value is 0. Thus, the whole sample is divided into the treatment group and control group. Additionally, the matching variables are included in all the control variables in model (1). Entropy balance matching involves matching the first and second order, as well as the third order, of the continuous variables as constraints. Through optimization under these constraints, each observation in the control group is assigned a continuous weight, which helps eliminate any differences in the mean, variance, and covariate between the treatment and control groups. Table 9 reports the estimated results based on entropy balance matching. It reveals a strong and statistically significant negative correlation between enterprise digital transformation (DGT) and both the degree of violation of nonlocal subsidiaries in the current year (VIOLA) and in the t + 1 year (F1_VIOLA) at the 1% level. This result indicates that the findings of this study are not influenced by sample selection bias.
4.4.2. Instrumental Variable Test
The initiation and implementation of enterprise digital transformation may be influenced by the violation of nonlocal subsidiaries. In order to mitigate the potential endogeneity caused by the reverse causality issue, this study employs the digital economy development index at the provincial level where the listed firms are registered (PROVDGT) as an instrumental variable (IV). The IV meets the relevance condition, as indicated by the correlation test with a Cragg–Donald Wald F statistic of 71.180, surpassing the critical value of 10. Additionally, the maximum rejectable expectation size exceeds 10%. Consequently, the null hypothesis of weak IV is rejected. The instrumental variable regression results are presented in Table 10. In column (1), the first-stage regression reveals a significant positive association between the digital economy development index at the provincial level (PROVDGT) and enterprise digital transformation (DGT) at the 1% level. In column (2), the second-stage regression demonstrates a persistently negative association between enterprise digital transformation (DGT) and the violation of nonlocal subsidiaries (VIOLA) at the 10% level of significance. These findings provide further support that the endogeneity caused by reverse causality or omitted variables is minimal.
4.4.3. Heckman’s Two-Stage Approach
The sample of this study is obtained through the questionnaire survey. However, it is important to note that the participation of listed companies in the survey may be influenced by their awareness of importance placed on digital transformation. As a result, the sample obtained may not be fully representative of the entire population, leading to a potential self-selection bias. To address this concern, this study employs Heckman’s two-stage method. In the first stage, a probit regression is conducted, including all control variables in the main test. This regression utilizes a dummy variable (DUM) as the dependent variable to determine if listed companies participate in the questionnaire survey. The probit regression results in an inverse Mills ratio (MILLS). In the second stage, the inverse Mills ratio (MILLS) is put into the main test model to correct for sample self-selection bias. Table 11 reports the test results. The regression results demonstrate that the relationship between enterprise digital transformation (DGT) and the violation of nonlocal subsidiaries (VIOLA, F1_VIOLA) remains significantly negative. This indicates that the findings remain robust after accounting for the self-selection bias.
4.4.4. Controlling the Fixed Effects
To mitigate the impact of unobserved firm characteristics that do not vary over time, this study employs a two-way fixed-effects model, considering both firm and year fixed effects. The regression results presented in Table 12 demonstrate a significantly negative relationship between digital transformation (DGT) and the violation of nonlocal subsidiaries (VIOLA, F1_VIOLA). Therefore, the research findings remain robust.
4.4.5. Exclusion of the Impact of Subsidiaries’ Digital Transformation
The digital transformation at the subsidiary level may also promote its own compliance behaviors. To exclude the impact of subsidiaries’ digital transformation, we drop the sample of subsidiaries with digital transformation. Since the questionnaire data pertain to listed companies, if a holding company (a holding company is defined in this study as having a higher proportion of long-term equity investment to total assets than the median of the sample in the same industry and year) has a high level of digital transformation at the business level (instead of functional level) (a high level of digital transformation at the business level means that it is higher than the median in the same industry and year; the definition and measurement of digital transformation at the business level and the functional level are presented in Table 13), it is assumed that its subsidiaries have a high level of digital transformation. After removing the sample as a proxy for subsidiaries with a high level of digital transformation, we rerun the regression. As shown in Table 13, the results still indicate a negative association between the listed firm’s enterprise digital transformation (DGT) and the violation of nonlocal subsidiaries (VIOLA). Therefore, the presence of digital transformation at the subsidiary level does not affect our findings.
4.4.6. Exclusion of the Impact of Subsidiaries’ Internal Control
The internal control in a subsidiary may also influence its own compliance behaviors. To exclude the impact of subsidiaries’ internal control level, we control the internal control in subsidiaries. In order to assess the level of internal control in subsidiaries (ICW_SUB), this study uses the number of internal control weakness disclosed by listed companies as a proxy variable. The results presented in Table 14 indicate that the research findings remain robust, even after accounting for the impact of internal control in subsidiaries.
4.4.7. Controlling the Impact of Regional Institution
The institutional and cultural customs can influence individual behavior [83]. The literature finds that regions with higher levels of social credit can encourage local managers to report information, foster trust between superiors and subordinates [84,85], and decrease managerial agency costs [86]. Therefore, this study conducts a regression analysis, considering factors such as the rule of law, political and business relations, and social credit level in the region where the nonlocal subsidiary is located, to control the impact of regional institution on the violation of nonlocal subsidiaries (VIOLA). The residual term results from the regression and is used as the dependent variable (VIOLA_resid, F1_VIOLA_resid) in model (1). The regression results in Table 15 indicate that the coefficients are significantly negative at the 5% level, confirming the robustness of the findings.
4.4.8. Using the Violation of Newly Registered Nonlocal Subsidiaries as the Dependent Variable
To address the concern about reverse causality, this study utilizes the degree of violation of newly registered nonlocal subsidiaries in the consolidation as the dependent variable. Newly registered nonlocal subsidiaries refer to those registered after the survey year of 2014. By examining the relationship between enterprise digital transformation and the violation of newly registered nonlocal subsidiaries, it can rule out the alternative explanation that the initiation and implementation of enterprise digital transformation are influenced by the violation of nonlocal subsidiaries. The violation of newly registered nonlocal subsidiaries is measured by the average degree of violation over a rolling two-year period (VIOLA_mean2) and a rolling four-year period (VIOLA_mean4) with 2015 as the base year. Additionally, a grouping variable (DGT_group) is created based on the median level of enterprise digitalization. Table 16 presents the regression results. The findings indicate a significantly negative relationship between the level of enterprise digital transformation and the degree of violation of newly registered nonlocal subsidiaries. This means that higher levels of enterprise digital transformation are associated with lower degrees of violation in subsequent years. These results suggest that reverse causality does not significantly impact the research findings.
4.4.9. Alternative Independent Variables
The independent variable in this study is derived from questionnaire data, which may introduce subjectivity. To address this issue, an alternative variable based on open data is used as an alternative independent variable. CSMAR and the “Intelligent and Scientific Innovation Business Management” research team collaborate to develop an index of enterprise digital transformation using open data. To validate our findings, this study uses the index as a substitute (DGT_ALTERN) in model (1) and retests during the same sample period (2013–2015). The regression results presented in Table 17 indicate a significantly negative association between enterprise digital transformation (DGT) and the violation of nonlocal subsidiaries (VIOLA, F1_VIOLA), confirming that the findings are not affected by the measurement error of independent variables.
5. Mechanism Test
The results of model (1) reveal a significant negative correlation between enterprise digital transformation and the violation of nonlocal subsidiaries. However, the specific mechanism through which this correlation operates remains unclear. Building upon the theoretical analysis presented in previous sections, enterprise digital transformation has dual effects. Firstly, it alleviates information asymmetry. Secondly, it improves internal control quality. The empirical evidence from the mechanism test supports the aforementioned theoretical logic. In line with Bauer et al., we construct mechanism models (2) and (3) [87].
In model (2), variable Mijt represents the mechanism variables related to information asymmetry and internal control quality, and coefficients β1 and β2 quantify the influence of enterprise digital transformation and mechanism variables on the violation of nonlocal subsidiaries, respectively. In model (3), coefficient α1 signifies the impact of enterprise digital transformation on the mechanism variables. Following Nie et al., the degree of information asymmetry is measured by the stock illiquidity indicator (ILL), and the internal control quality is measured by the presence of internal control weaknesses (ICW) [41].
VIOLAijt = β0 + β1 DGTijt + β2Mijt + βjCONTROLijt + δΙ + λΥ + μΡ + εit
Mijt = α0 + α1DGTijt + αjCONTROLijt + δΙ + λΥ + μΡ + εit
Table 18 reports the results of the mechanism test that examines the impact of enterprise digital transformation on the violation of nonlocal subsidiaries. The results in column (1) indicate a significantly negative relationship between enterprise digital transformation (DGT) and the stock illiquidity indicator (ILL), suggesting that enterprise digital transformation alleviates information asymmetry. Column (2) reveals a significant positive association between the stock illiquidity indicator (ILL) and the violation of nonlocal subsidiaries (VIOLA), implying that information asymmetry leads to a violation of nonlocal subsidiaries. Simultaneously, DGT remains significantly negatively related to VIOLA.
Similarly, the empirical results in columns (4) to (6) support the mechanism when the mediating variable is substituted with the presence of internal control weaknesses (ICW). The results in column (3) indicate a significantly negative relationship between enterprise digital transformation (DGT) and the presence of internal control weaknesses (ICW), suggesting that enterprise digital transformation improves internal control quality. Column (4) reveals a significant positive association between the presence of internal control weaknesses (ICW) and the violation of nonlocal subsidiaries (VIOLA), implying that a low level of internal control quality exacerbates the violation of nonlocal subsidiaries. Simultaneously, DGT remains significantly negatively related to VIOLA. This implies that enterprise digital transformation can violate nonlocal subsidiaries by improving the internal control quality.
6. Heterogeneity Analysis
This study conducts the heterogeneous analysis of the effect of digital transformation on the violation of nonlocal subsidiaries by differentiating the levels and stages of digital transformation and the origins of nonlocal subsidiaries.
6.1. Heterogeneous Analysis of the Levels of Enterprise Digital Transformation
This study investigates the impact of enterprise digital transformation on the violation of nonlocal subsidiaries by differentiating the levels of digital transformation. Enterprise digital transformation can be partitioned into two levels within the firm’s value chain: digital transformation at the business level and digital transformation at the functional level [1,65,66]. According to the above classification, this study incorporates the corresponding indicators in the evaluation system of enterprise digital transformation into the two dimensions, as shown in Table 19. To examine the effect of the two levels, this study uses principal component analysis (PCA) to construct two variables: digital transformation at the business level (BUSIDGT) and digital transformation at the functional level (FUNCDGT). These variables are considered as the dependent variables and are replaced in model (1) for further testing. However, the regression results are presented in Table 20, indicating that enterprise digital transformation at the business level (BUSIDGT) shows a significantly negative correlation with the violation of nonlocal subsidiaries (VIOLA). However, the regression coefficient for enterprise digital transformation at the functional level (FUNCDGT) is negative but not significant. The regression results in columns (3) and (4) show that the empirical results remain constant when the lagged violation of nonlocal subsidiaries (F1_VIOLA) is substituted as the dependent variable. The results validate hypothesis 2 (H2) and indicate that digital transformation should prioritize the business level to enhance internal control over the nonlocal subsidiaries.
6.2. Heterogeneous Analysis of the Stages of Enterprise Digital Transformation
This study investigates the impact of enterprise digital transformation on the violation of nonlocal subsidiaries by differentiating the stages of digital transformation. The stages of digital transformation are categorized based on the matching between the transformation process and efficiency. The transformation process is composed of four first-level indicators: Strategy and development (S), Organization and human resources (O), Technology and platform (T), and Data and application (D). The degree of transformation efficiency is measured by one first-level indicator, Business and effect (E). Subsequently, we group the transformation process and transformation efficiency by median into two sets of binary variables: PROGRESS_GROUP and EFFECT_GROUP. If the original value is larger than the median, the binary variables above are assigned a value of 1; otherwise, they are 0. Based on the matching between the transformation process and efficiency, we categorize four stages of digital transformation, balanced achievement, initial achievement, potential achievement, and insufficient achievement, as shown in Table 21. After categorizing the samples into the four transformation stages, each group undergoes the regression in model (1). The results presented in Table 22 indicate that the governance effect of enterprise digital transformation on the violation of nonlocal subsidiaries exist across all transformation stages. However, the regression coefficient estimates only show significance in the balanced achievement group (significance at 1%, t = −3.069) and the initial achievement group (significance at 5%, t = −2.280), while not being significant in both the potential achievement group and insufficient achievement group. Furthermore, the governance effect of digital transformation on the nonlocal violation is strongest as the transformation enters the stage of balanced development (β = −0.111), followed by the stage of initial achievement (β = −0.058). Additionally, using the Bootstrap-based inter-group coefficient difference test, we observe a significant difference between these two coefficients (significance at 5%, p = 0.026). The results validate hypothesis 3 (H3) and highlights the importance of efficiency of digital transformation.
6.3. Heterogeneous Analysis of the Origins of Nonlocal Subsidiaries
This study investigates the impact of digital transformation on the violation of nonlocal subsidiaries by analyzing their origins. Three variables are used as proxies for the violation of nonlocal subsidiaries based on their origins: (1) autonomous investment (VIOLA_SIE), (2) business combinations under the same control (VIOLA_UCC), and (3) business combinations not under the same control (VIOLA_NUCC). These variables are considered as the dependent variables and are replaced in model (1) for further testing. The regression results in Table 23 reveal that enterprise digital transformation (DGT) exhibits a significant negative correlation only with the violation of nonlocal subsidiaries established through autonomous investment (VIOLA_SIE). However, the relationship between DGT and the violation of nonlocal subsidiaries merged through business combinations is not statistically significant, irrespective of whether they are under the same control (VIOLA_UCC) or different control (VIOLA_NUCC). This study highlights that enterprise digital transformation (DGT) exhibits a conditional influence on the violation of nonlocal subsidiaries, depending on the disparities in institutional and cultural aspects between parent companies and their subsidiaries. The findings validate hypothesis 4 (H4) and support the conclusions drawn from the literature, which emphasize the importance of consistency in enterprise institutions and culture for driving a successful enterprise digital transformation [71,72].
7. Economic Benefits Analysis
The analysis of the performance of enterprise digital transformation is an important theoretical and practical concern. Conventionally, it is perceived that compliance supervision necessitates companies to relinquish certain profitable orders, whereas promoting sales performance necessitates loosening managerial supervision. Recent literature indicates that big data can mitigate the inverse relationship between authorization and control, as well as the timeliness and reliability of accounting information [88], thereby offering solutions to the paradox between compliance and performance. Investigating from the standpoint of cost reduction and operational efficiency, this study evaluates whether enterprise digital transformation enhances the economic benefits of nonlocal subsidiaries while fortifying compliance.
Agency theory suggests that digital technology has significantly enhanced the internal information transparency within organizations, diminished managers’ incentives to pursue personal benefits, and curtailed unnecessary resource wastage [89]. Consequently, this study calculates the average administrative expense rate (SUBADMEX) and average operating expense rate (SUBASAEX) for the nonlocal subsidiary located in province j controlled by listed company i in year t as proxies for the agency cost of nonlocal subsidiaries. The findings presented in columns (1) and (2) of Table 24 indicate that enterprise digital transformation (DGT) exhibits a significantly negative correlation with both the average administrative expenses ratio (SUBADMEX) and the average operating expenses ratio (SUBASAEX). This suggests that enterprise digital transformation can restrain opportunistic behaviors of nonlocal subsidiaries, thereby mitigating agency costs.
On the other hand, enterprise digital transformation has the capacity to reconstruct business processes and models, adapt effectively to fast-paced changing environments, and maximize enterprise resource benefits. This study calculates the average asset turnover rate of nonlocal subsidiaries located in province j controlled by listed company i in year t (SUBTURN) as a proxy for the operational efficiency of nonlocal subsidiaries. The regression results displayed in column (3) of Table 24 reveal that enterprise digital transformation (DGT) is significantly positively correlated with the average asset turnover rate (SUBTURN).
8. Conclusions and Implications
8.1. Research Conclusions
In the context of cross-regional development, how to prevent and control the risk of violation of nonlocal subsidiaries has become a crucial theoretical and practical concern. To address this challenge, this study suggests enterprise digital transformation as a solution. Using the unique data from the internal control survey questionnaire of Chinese listed companies, this study measures the level of enterprise digital transformation and empirically tests the effect of enterprise digital transformation on the violation of the nonlocal subsidiaries as a proxy of compliance in cross-regional development. The research findings can be summarized as follows:
Enterprise digital transformation plays a crucial role in enhancing the monitoring and control of nonlocal subsidiaries. When strategically expanding across regions, enterprises are advised to prioritize digital transformation as a strategic measure. By leveraging digital technologies, enterprises can effectively monitor nonlocal subsidiaries and mitigate the risks associated with opportunistic behavior and information asymmetry.
Moreover, the governance effect of enterprise digital transformation on the risk of violation of nonlocal subsidiaries is more pronounced at the business level and at the transformation stage where investment and efficiency are balanced. Therefore, it is crucial to prioritize both business-level transformation and technical efficiency.
Furthermore, the governance effect of enterprise digital transformation on the risk of violation of nonlocal subsidiaries is more pronounced when organizational culture is more homogeneous. Given that subsidiaries may come from diverse sources and regions, cultural disparities are likely to arise, especially in cases where business combinations are not under the same control. Thus, the governance effect is more pronounced in autonomously invested nonlocal subsidiaries.
Lastly, enterprise digital transformation brings about economic benefits by reducing costs and enhancing the efficiency of nonlocal subsidiaries. This effectively aligns cross-regional compliance with sustainable development.
The findings of this study make significant theoretical contributions. Compared to the measurement methods used in the extant literature [20,21,22], this study offers a new measurement indicator of enterprise digital transformation based on the practice-oriented evaluation system and the questionnaire method to capture the comprehensive attributes of enterprise digital transformation and provides a solid foundation for further analysis. Although extensive literature has examined the economic consequences of enterprise digital transformation and has also considered its adverse effects, how digital technology impacts corporate governance and internal control monitoring remains an open question [18]. This study provides empirical evidence for the governance effect of enterprise digital transformation on the violation of nonlocal subsidiaries. And the findings regarding compliance in the context of cross-regional development above also contribute to the literature on compliance and internal control, as previous studies have primarily examined compliance by taking listed companies as a sample, neglecting the importance of subsidiaries that are invested in or merged with these listed firms [1,23,24].
8.2. Implications
Achieving a successful enterprise digital transformation demands motivation, capability, and unwavering determination. However, several common issues in reality hinder progress. These obstacles include a lack of a well-defined transformation strategy, an inadequate foundation of digital technologies, and a short-sighted approach to technical investments. Furthermore, some enterprises tend to prioritize the information system compatibility while neglecting the crucial aspect of aligning organizational culture and value, which is an actually deeper factor influencing the sustainable progress of transformation.
This study proposes the following policy implications based on the aforementioned research findings and practical issues. Firstly, there should be a greater emphasis on digital transformation strategies at the business level. This involves consolidating the information infrastructure with daily business processes. Secondly, it is imperative to prioritize technical efficiency and promptly address any technical shortcomings that may arise during the digital transformation process. Meanwhile, it is crucial to avoid excessive or impulsive investment while tackling any challenges related to underinvestment. Lastly, it becomes imperative to prioritize cultural promotion with the aim of fostering a shared organizational culture.
8.3. Limitations and Future Research
This study is based on the listed firms in China. Further research might be conducted in the context of other organizations with different sizes in other countries. The results might differ due to the size, industry, or market competition of nonlocal subsidiaries. And the research findings of this study are derived from empirical results. We encourage future research to conduct practical case studies to deeply analyze the more specific experiences and challenges encountered during enterprise digital transformation. Though this study documents the positive outcomes of enterprise digital transformation, this research area remains fruitful with respect to the impact of digital technology including its potential adverse influence.
Author Contributions
Conceptualization, S.Y. and Y.X.; methodology, S.Y.; software, S.Y.; validation, S.Y., Y.X. and Z.W.; formal analysis, S.Y.; investigation, S.Y.; resources, S.Y.; data curation, S.Y.; writing—original draft preparation, S.Y. and Y.X.; writing—review and editing, S.Y. and Y.X.; visualization, Z.W.; supervision, S.Y.; project administration, Z.W.; funding acquisition, S.Y. All authors have read and agreed to the published version of the manuscript.
Funding
This research was funded by the Major Project of National Planning Office of Philosophy and Social Science (NPOPSS) of China, grant number 18VSJ082, and by the Key Projects of Philosophy and Social Sciences Planning of Guangdong Province, grant number GD21TW07-01.
Institutional Review Board Statement
Not applicable.
Informed Consent Statement
Not applicable.
Data Availability Statement
The data can be found at DIB database “https://www.dibcn.com/ (accessed on 10 January 2023)”, the Credit Chinese website “https://www.creditchina.gov.cn/ (accessed on 11 January 2023)”, the China Judicial Documents website https://wenshu.court.gov.cn (accessed on 5 April 2023)”, and the China Executive Information Disclosure website “http://zxgk.court.gov.cn/ (accessed on 25 May 2023)”, or you may contact the author for more information about data.
Acknowledgments
We would like to thank the helpful comments from editors and anonymous reviewers.
Conflicts of Interest
The authors declare no conflicts of interest.
Appendix A
This study conducts an iterative multi-round exploratory factor analysis (EFA) on the evaluation system. The analysis involved using principal component analysis (PCA) and the Kaiser standardized orthogonal rotation method to extract 18 factors with eigenvalues greater than 1 after rotation, which converge after 22 iterations. This rotation accounts for almost 69.975% of the variability, suggesting good construct validity.
The results of orthogonal rotation with Kaiser normalization are presented in Table A1.

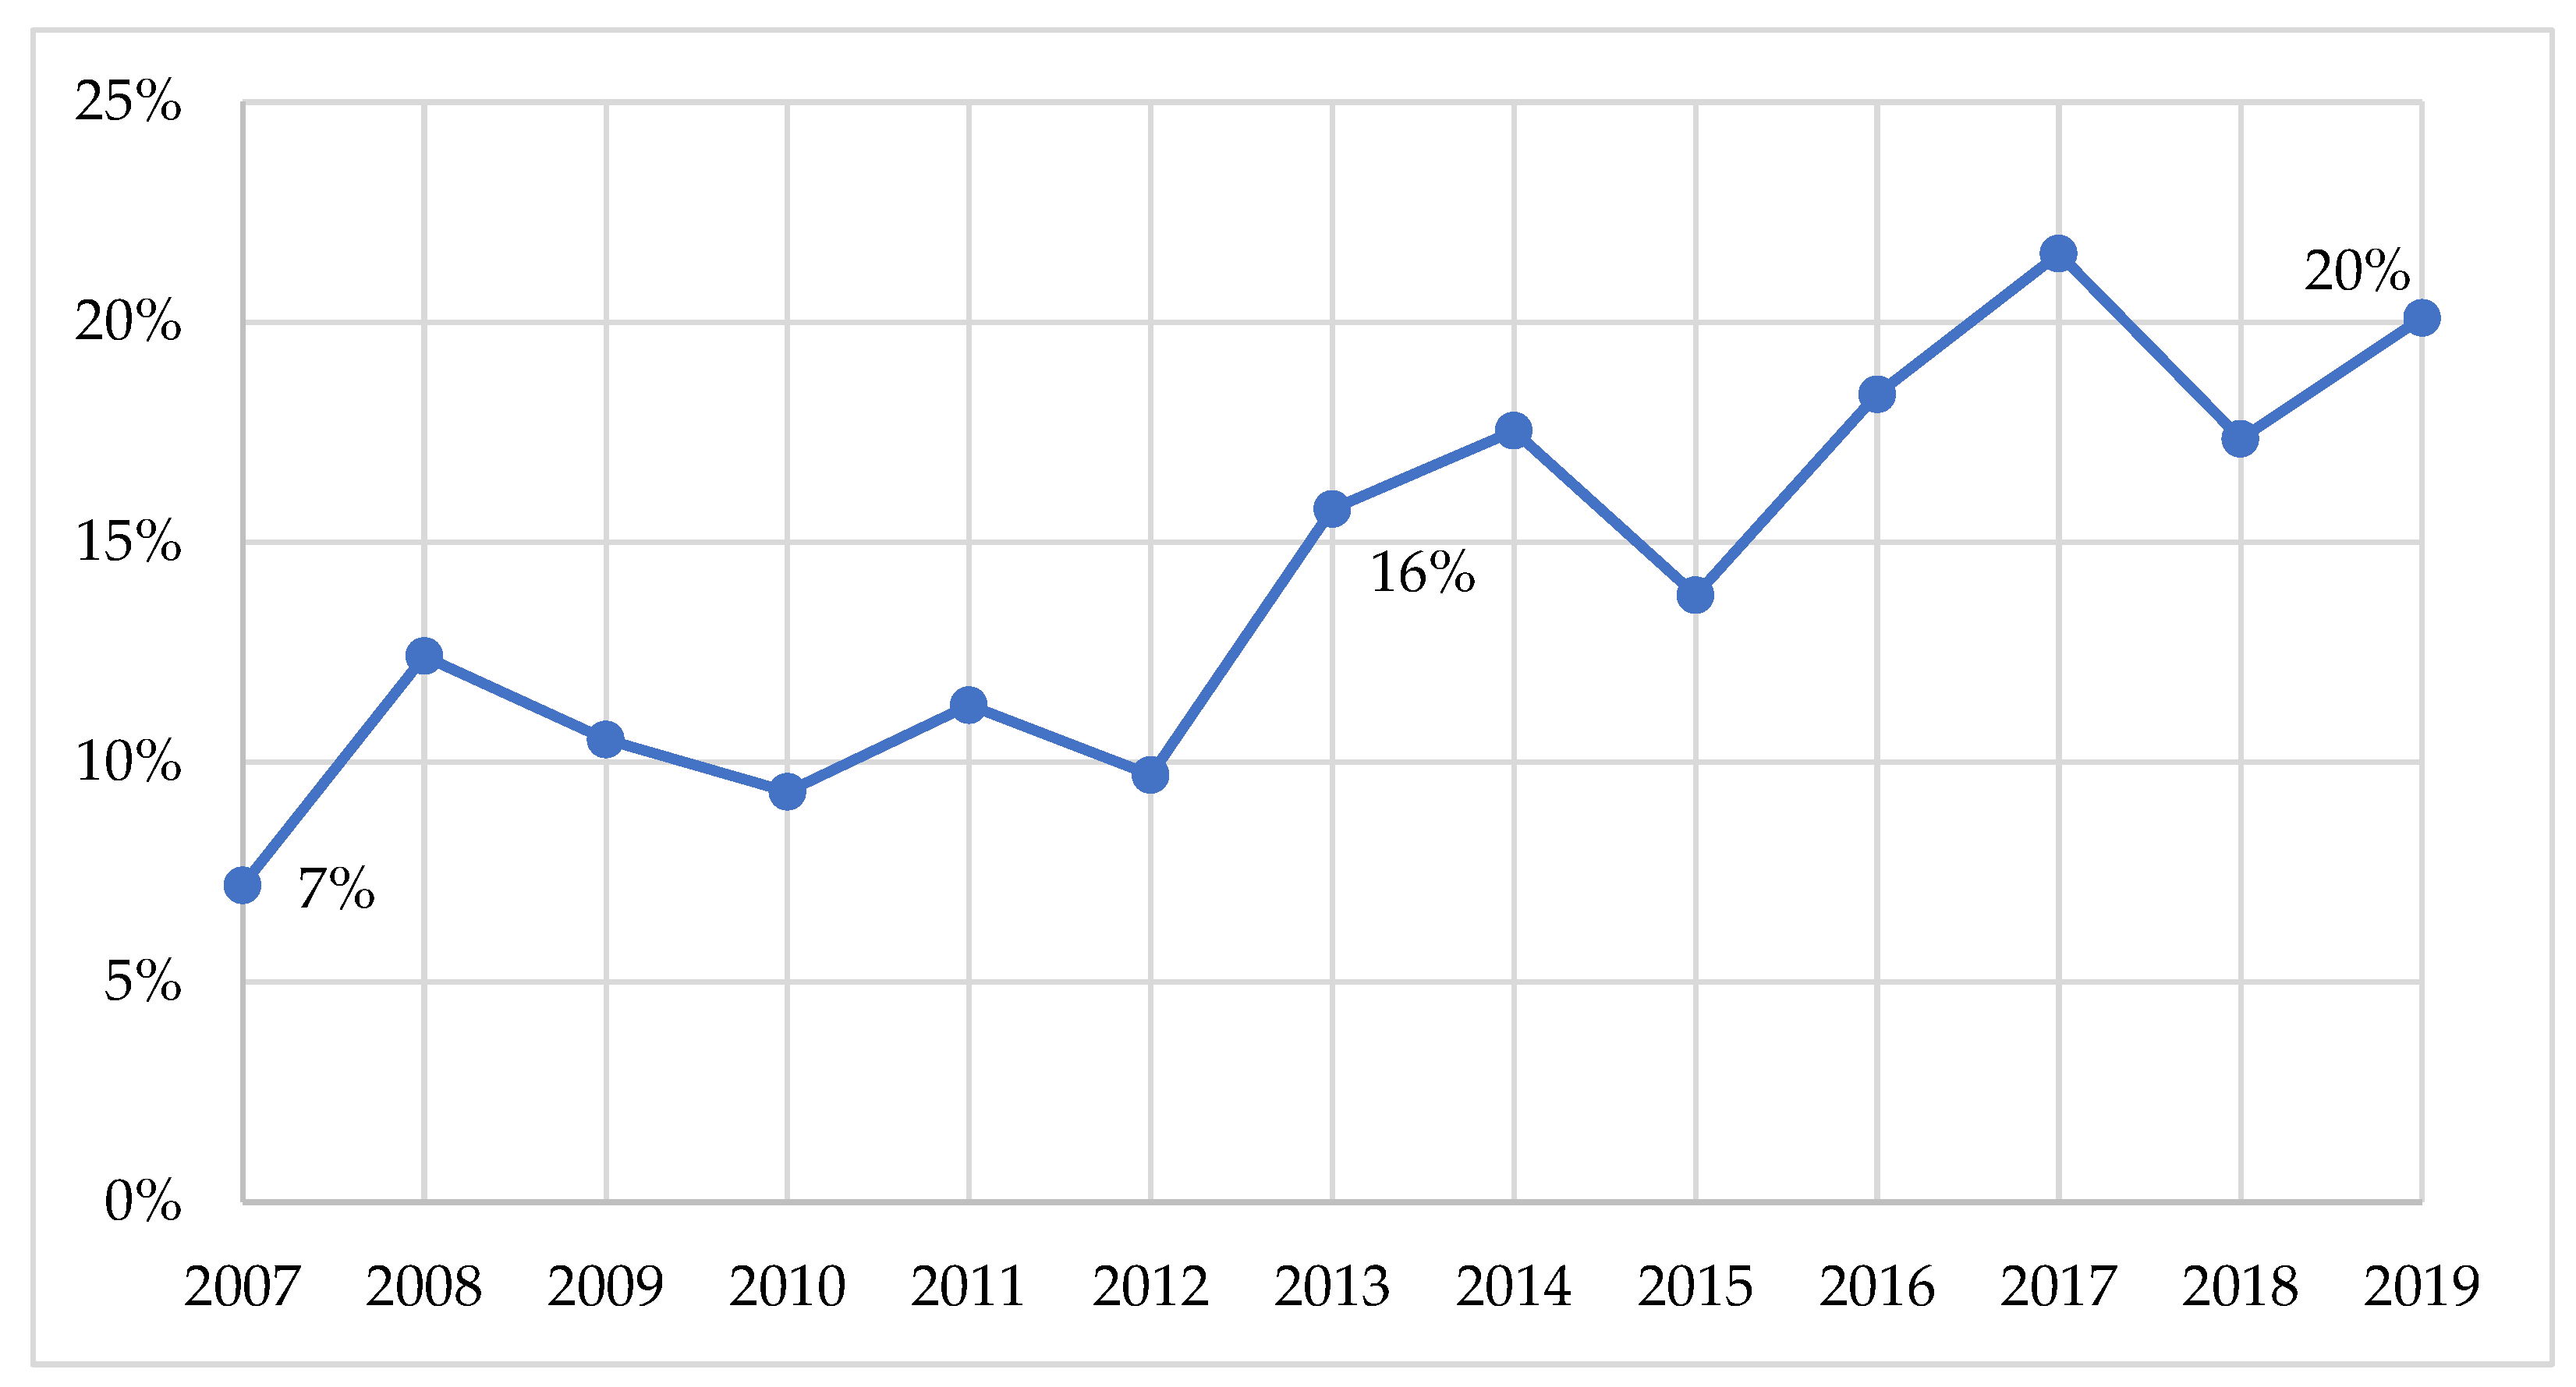
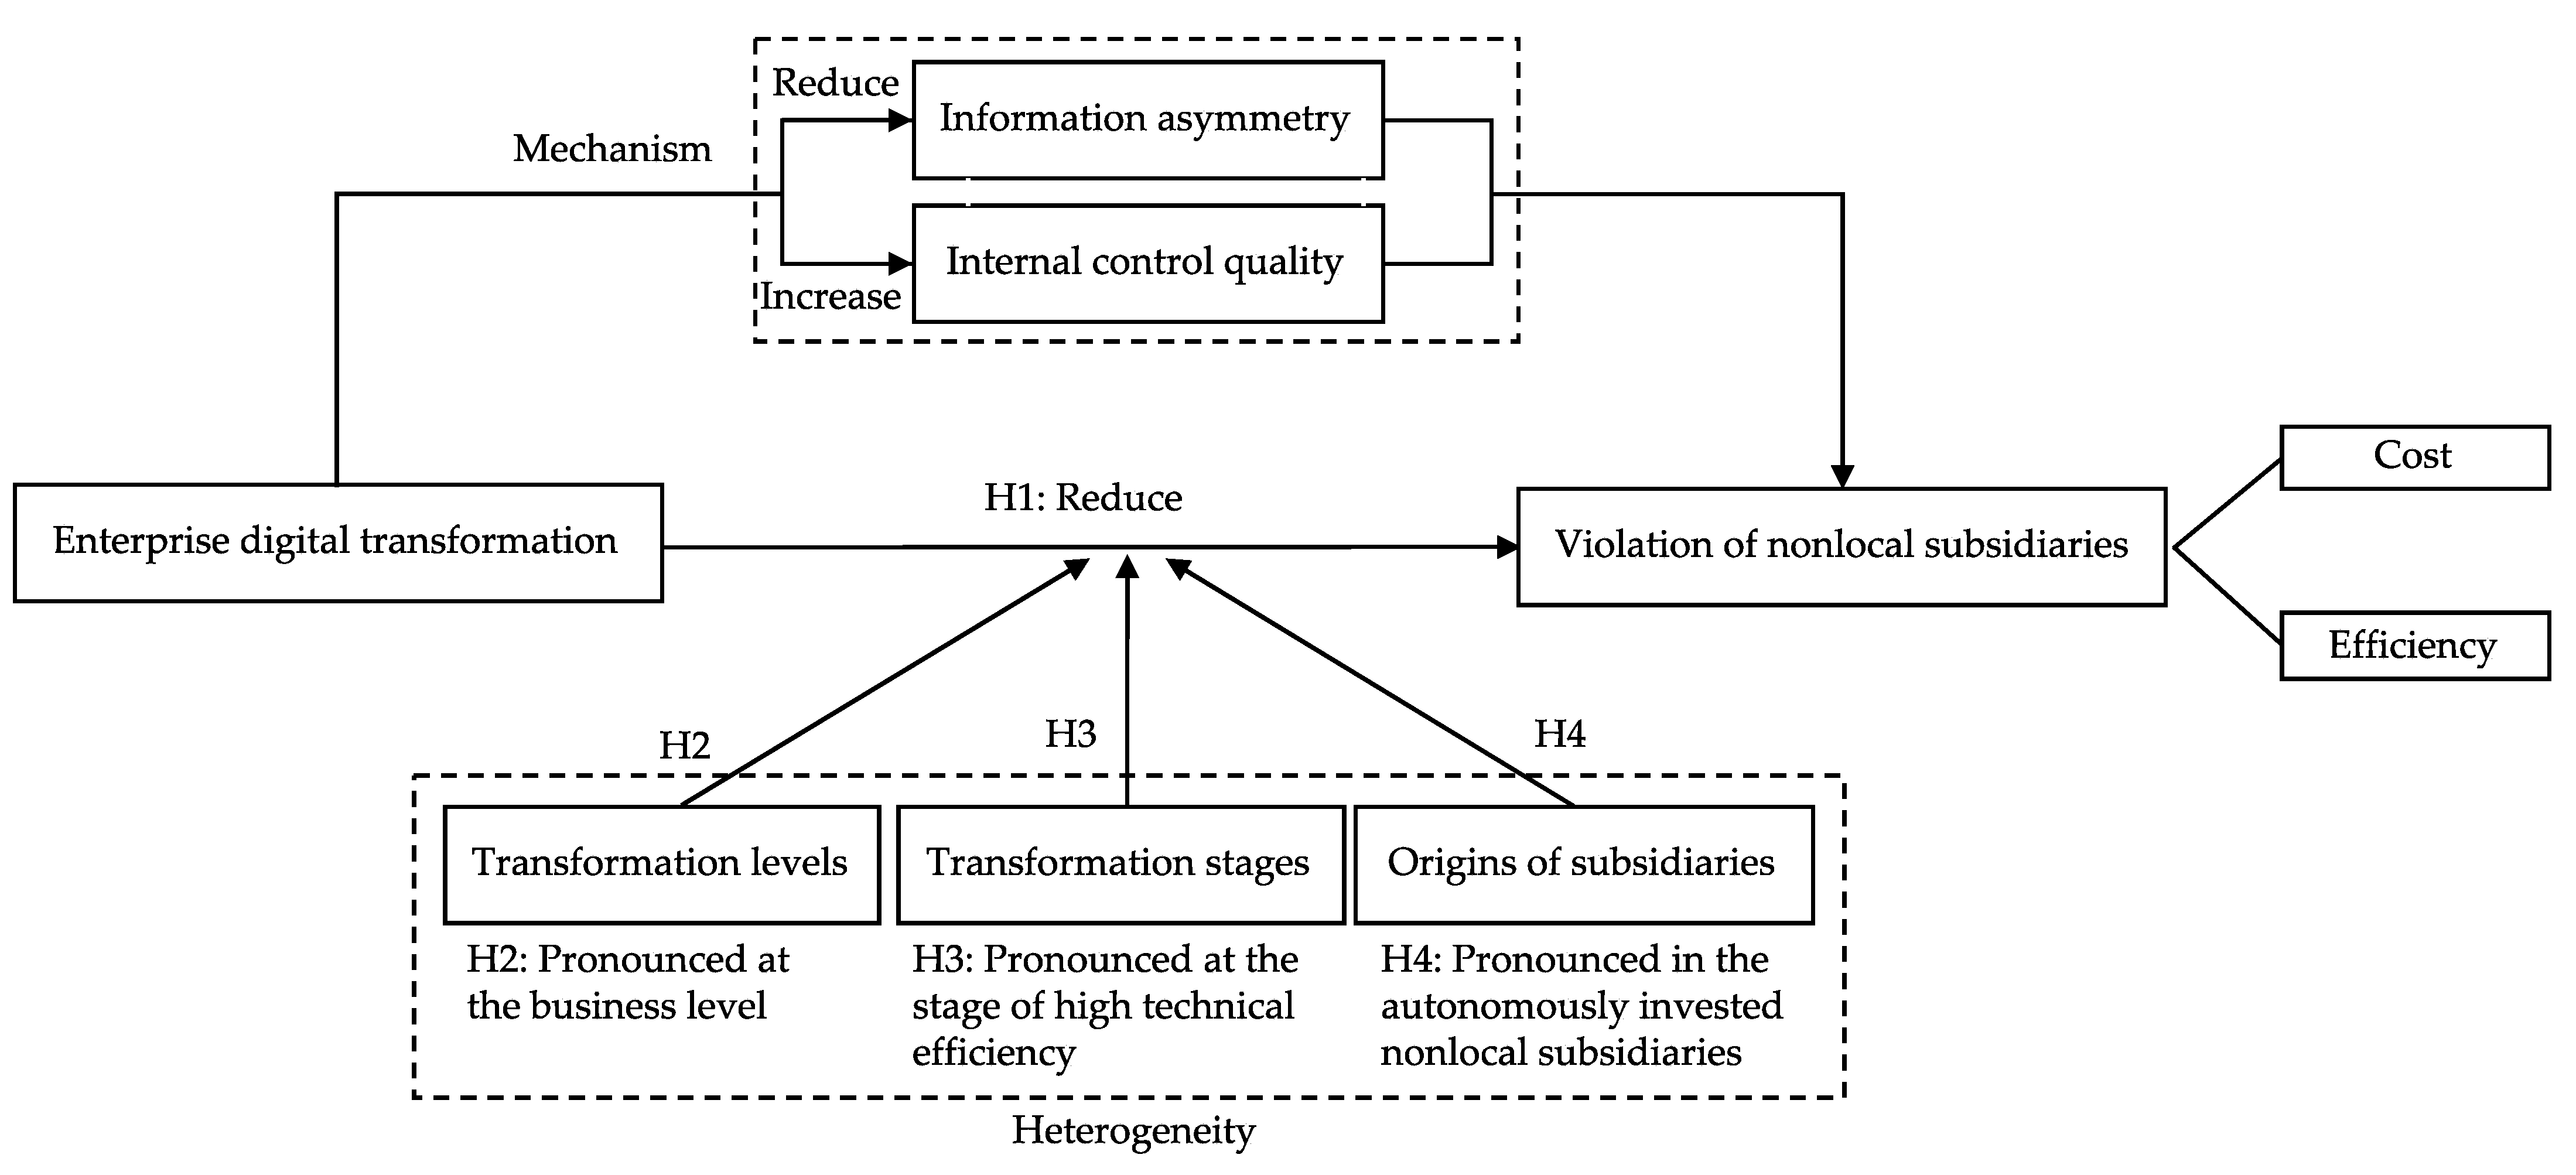
Table A1.
Rotated factor matrix.
| Indicators | Factors | ||||||||||||||||||
|---|---|---|---|---|---|---|---|---|---|---|---|---|---|---|---|---|---|---|---|
| 1 | 2 | 3 | 4 | 5 | 6 | 7 | 8 | 9 | 10 | 11 | 12 | 13 | 14 | 15 | 16 | 17 | 18 | ||
| Symbol | Definition | Effects of Digitalization (E) | Level of Business Informatization (TB) | Decision Maker’s Strategic Value Assessment of Enterprise Digital Transformation (SH) | Technical Manager’s Strategic Value Assessment of Enterprise Digital Transformation (ST) | Front-End Application Platform Construction (TQ) | Risk Control Department’s Assessment of Consistency of Digital Transformation and Strategy (SI) | Mobile Office (TO) | Transformation Resources Reserve (TR) | Ability to Apply Data (DC) | Data Security (DS) | Human Resources Back Up (OH) | Decision Maker’s Assessment of Consistency of Digital Transformation and Strategy (SL) | Back-End Technology Platform Construction (TH) | Level of Internal Audit Informatization (TA) | Organization Guarantee(OL) | Assessment of Expected Influence of Digital Transformation on Business Development (SD) | Budget Guarantee (OF) | Level of Accounting Informatization (TS) |
| SH1 | Chairman’s core strategic value assessment of enterprise digital transformation | 0.838 | |||||||||||||||||
| SH2 | CEO’s core strategic value assessment of enterprise digital transformation | 0.786 | |||||||||||||||||
| SH3 | Chairman’s core operation value assessment of enterprise digital transformation | 0.826 | |||||||||||||||||
| SH4 | CEO’s core operation value assessment of enterprise digital transformation | 0.752 | |||||||||||||||||
| ST1 | CIO’s core strategic value assessment of enterprise digital transformation | 0.828 | |||||||||||||||||
| ST2 | CIO’s core operation value assessment of enterprise digital transformation | 0.798 | |||||||||||||||||
| ST3 | CIO’s assessment of consistency of digital transformation and organization strategy | 0.677 | |||||||||||||||||
| ST4 | CIO’s assessment of consistency of digital transformation and business strategy | 0.679 | |||||||||||||||||
| SL1 | CEO’s assessment of consistency of digital transformation and organization strategy | 0.728 | |||||||||||||||||
| SL2 | CEO’s assessment of consistency of digital transformation and business strategy | 0.738 | |||||||||||||||||
| SI1 | Risk control department’s assessment of consistency of digital transformation and organization strategy | 0.893 | |||||||||||||||||
| SI2 | Risk control department’s assessment of consistency of digital transformation and business strategy | 0.902 | |||||||||||||||||
| SI3 | Development level of risk control informatization | 0.435 | |||||||||||||||||
| SD1 | Assessment of expected influence of digital transformation on business development from CFO’s perspective | 0.590 | |||||||||||||||||
| SD2 | Assessment of expected influence of digital transformation on business development from CIO’s perspective | 0.622 | |||||||||||||||||
| OH1 | Proportion of IT department’s employees | 0.860 | |||||||||||||||||
| OH2 | Proportion of IT department’s salaries | 0.858 | |||||||||||||||||
| OL1 | Power of IT department’s leader | 0.482 | |||||||||||||||||
| OL2 | Power of leader of IT department’s leader | 0.831 | |||||||||||||||||
| OF1 | Comparison between per-capita annual salary growth rate of IT department and per-capita growth rate of all employees | 0.746 | |||||||||||||||||
| OF2 | Comparison between growth rate of IT investment and growth rate of sales | 0.525 | |||||||||||||||||
| TR1 | Existing resources to support digital transformation | 0.835 | |||||||||||||||||
| TR2 | Existing resources to deal with the challenges of digital transformation | 0.812 | |||||||||||||||||
| TQ1 | Investment in e-commerce | 0.689 | |||||||||||||||||
| TQ2 | Investment in social media | 0.643 | |||||||||||||||||
| TQ3 | Investment in mobile platform | 0.649 | |||||||||||||||||
| TQ4 | Investment in video meeting | 0.668 | |||||||||||||||||
| TQ5 | Investment in ERP | 0.686 | |||||||||||||||||
| TH1 | Investment in cloud computing | 0.845 | |||||||||||||||||
| TH2 | Investment in big data | 0.816 | |||||||||||||||||
| TB1 | ERP implementation in financial accounting | 0.733 | |||||||||||||||||
| TB2 | ERP implementation in production planning | 0.747 | |||||||||||||||||
| TB3 | ERP implementation in costs control | 0.792 | |||||||||||||||||
| TB4 | ERP implementation in supply chain management | 0.796 | |||||||||||||||||
| TB5 | ERP implementation in sales and distribution management | 0.773 | |||||||||||||||||
| TB6 | ERP implementation in customer relationship management | 0.674 | |||||||||||||||||
| TB7 | ERP implementation in human resources management | 0.624 | |||||||||||||||||
| TO1 | How often the Chairman uses mobile office | 0.761 | |||||||||||||||||
| TO2 | How often the CEO uses mobile office | 0.764 | |||||||||||||||||
| TO3 | How often the CFO uses mobile office | 0.708 | |||||||||||||||||
| TO4 | How often the CIO uses mobile office | 0.516 | |||||||||||||||||
| TA1 | Use of audit information system | 0.757 | |||||||||||||||||
| TA2 | Development level of internal audit informatization | 0.795 | |||||||||||||||||
| TA3 | Independence of audit information system | 0.448 | |||||||||||||||||
| TS1 | Information system tool for financial report preparation | 0.689 | |||||||||||||||||
| DC1 | Annual assessment of the ability to apply data | 0.855 | |||||||||||||||||
| DC2 | Cumulative assessment of the ability to apply data | 0.845 | |||||||||||||||||
| DS1 | Annual assessment of data security | 0.837 | |||||||||||||||||
| DS2 | Cumulative assessment of data security | 0.851 | |||||||||||||||||
| E1 | Digital ecology level from CEO’s perspective | 0.720 | |||||||||||||||||
| E2 | Digital ecology level from CIO’s perspective | 0.773 | |||||||||||||||||
| E3 | Digital marketing level | 0.729 | |||||||||||||||||
| E4 | Digital procurement level | 0.821 | |||||||||||||||||
| E5 | Digital operation level | 0.809 | |||||||||||||||||
| E6 | Digital product level | 0.548 | |||||||||||||||||
| E7 | Digital service level | 0.812 | |||||||||||||||||
| Eigenvalue | 4.781 | 4.259 | 3.29 | 2.82 | 2.592 | 2.268 | 2.212 | 2.068 | 1.879 | 1.862 | 1.657 | 1.652 | 1.632 | 1.609 | 1.177 | 1.174 | 1.139 | 1.115 | |
| Variance explained (%) | 8.538 | 7.605 | 5.875 | 5.035 | 4.629 | 4.05 | 3.951 | 3.692 | 3.355 | 3.325 | 2.96 | 2.95 | 2.914 | 2.872 | 2.102 | 2.097 | 2.034 | 1.992 | |
| Cumulative variance explained (%) | 8.538 | 16.143 | 22.018 | 27.053 | 31.682 | 35.732 | 39.683 | 43.375 | 46.73 | 50.055 | 53.014 | 55.964 | 58.879 | 61.751 | 63.853 | 65.95 | 67.984 | 69.975 | |
Note: Extraction is carried out using principal component analysis (PCA). The rotation method is the orthogonal rotation method with Kaiser normalization; the rotation converges after 22 iterations.
Appendix B
To assess the reliability of the scale, this study conducts confirmatory factor analysis (CFA) and employs Cronbach’s alpha coefficient. Generally, a minimum alpha coefficient of 0.70 is desired, while an alpha coefficient exceeding 0.80 is considered highly favorable. The reliability of the first- and second-level indicators in the evaluation system, as depicted in Appendix B Table A2, meets the required standards. And the alpha coefficient for the comprehensive index level of enterprise digital transformation is 0.875. The results above indicate a high level of internal consistency reliability among indicators at all levels and comprehensive indices.
Table A2.
Confirmatory factor analysis.
| Variables | Third-Level Indicators | Standardized Factor Loading | Second-Level Indicators Alpha | Second-Level Indicators (Variable) | First-Level Indicators Alpha | First-Level Indicators (Variable) |
|---|---|---|---|---|---|---|
| SH1 | Chairman’s core strategic value assessment of enterprise digital transformation | 0.760 | 0.894 | Decision maker’s strategic value assessment of enterprise digital transformation (SH) | 0.866 | Strategy and development (S) |
| SH2 | CEO’s core strategic value assessment of enterprise digital transformation | 0.758 | ||||
| SH3 | Chairman’s core operation value assessment of enterprise digital transformation | 0.780 | ||||
| SH4 | CEO’s core operation value assessment of enterprise digital transformation | 0.731 | ||||
| ST1 | CIO’s core strategic value assessment of enterprise digital transformation | 0.774 | 0.855 | Technical manager’s strategic value assessment of enterprise digital transformation (ST) | ||
| ST2 | CIO’s core operation value assessment of enterprise digital transformation | 0.765 | ||||
| ST3 | CIO’s assessment of consistency of digital transformation and organization strategy | 0.748 | ||||
| ST4 | CIO’s assessment of consistency of digital transformation and business strategy | 0.758 | ||||
| SL1 | CEO’s assessment of consistency of digital transformation and organization strategy | 0.827 | 0.938 | Decision maker’s assessment of consistency of digital transformation and strategy (SL) | ||
| SL2 | CEO’s assessment of consistency of digital transformation and business strategy | 0.847 | ||||
| SI1 | Risk control department’s assessment of consistency of digital transformation and organization strategy | 0.872 | 0.781 | Risk control department’s assessment of consistency of digital transformation and strategy (SI) | ||
| SI2 | Risk control department’s assessment of consistency of digital transformation and business strategy | 0.885 | ||||
| SI3 | Development level of risk control informatization | 0.503 | ||||
| SD1 | Assessment of expected influence of digital transformation on business development from CFO’s perspective | 0.557 | 0.444 | Assessment of expected influence of digital transformation on business development (SD) | ||
| SD2 | Assessment of expected influence of digital transformation on business development from CIO’s perspective | 0.616 | ||||
| OH1 | Proportion of IT department’s employees | 0.771 | 0.827 | Human resources guarantee (OH) | 0.285 | Organization and human resources (O) |
| OH2 | Proportion of IT department’s salaries | 0.775 | ||||
| OL1 | Power of IT department’s leader | 0.508 | 0.200 | Organization guarantee (OL) | ||
| OL2 | Power of leader of IT department’s leader | 0.731 | ||||
| OF1 | Comparison between per-capita annual salary growth rate of IT department and per-capita growth rate of all employees | 0.629 | 0.308 | Budget guarantee (OF) | ||
| OF2 | Comparison between growth rate of IT investment and growth rate of sales | 0.569 | ||||
| TR1 | Existing resources to support digital transformation | 0.830 | 0.919 | Transformation resources reserve (TR) | 0.813 | Technology and platform (T) |
| TR2 | Existing resources to deal with the challenges of digital transformation | 0.832 | ||||
| TQ1 | Investment in e-commerce | 0.631 | 0.766 | Front-end application platform construction (TQ) | ||
| TQ2 | Investment in social media | 0.622 | ||||
| TQ3 | Investment in mobile platform | 0.574 | ||||
| TQ4 | Investment in video meeting | 0.645 | ||||
| TQ5 | Investment in ERP | 0.687 | ||||
| TH1 | Investment in cloud computing | 0.798 | 0.730 | Back-end technology platform construction (TH) | ||
| TH2 | Investment in big data | 0.765 | ||||
| TB1 | ERP implementation in financial accounting | 0.612 | 0.892 | Level of business informatization (TB) | ||
| TB2 | ERP implementation in production planning | 0.656 | ||||
| TB3 | ERP implementation in costs control | 0.671 | ||||
| TB4 | ERP implementation in supply chain management | 0.687 | ||||
| TB5 | ERP implementation in sales and distribution management | 0.636 | ||||
| TB6 | ERP implementation in customer relationship management | 0.595 | ||||
| TB7 | ERP implementation in human resources management | 0.638 | ||||
| TO1 | How often the Chairman uses mobile office | 0.662 | 0.704 | Mobile office (TO) | ||
| TO2 | How often the CEO uses mobile office | 0.664 | ||||
| TO3 | How often the CFO uses mobile office | 0.588 | ||||
| TO4 | How often the CIO uses mobile office | 0.518 | ||||
| TA1 | Use of audit information system | 0.656 | 0.414 | Level of internal audit informatization (TA) | ||
| TA2 | Development level of internal audit informatization | 0.699 | ||||
| TA3 | Independence of audit information system | 0.464 | ||||
| TS1 | Information system tool for financial report preparation | 0.658 | - | Level of accounting informatization (TS) | ||
| DC1 | Annual assessment of the ability to apply data | 0.819 | 0.882 | Ability to apply data (DC) | 0.797 | Data and application (D) |
| DC2 | Cumulative assessment of the ability to apply data | 0.827 | ||||
| DS1 | Annual assessment of data security | 0.814 | 0.883 | Data security (DS) | ||
| DS2 | Cumulative assessment of data security | 0.838 | ||||
| E1 | Overall digital level from CEO’s perspective | 0.757 | 0.901 | Effects of digitalization (E) | 0.901 | Business and effect (E) |
| E2 | Overall digital level from CIO’s perspective | 0.788 | ||||
| E3 | Digital marketing level | 0.669 | ||||
| E4 | Digital procurement level | 0.721 | ||||
| E5 | Digital operation level | 0.786 | ||||
| E6 | Digital product level | 0.508 | ||||
| E7 | Digital service level | 0.706 |
Note: Generally, a minimum alpha coefficient of 0.70 is desired, while an alpha coefficient exceeding 0.80 is considered highly favorable.
References
- Masulis, R.W.; Peter, K.P.; Zein, J. Family business groups around the world: Financing advantages, control motivations, and organizational choices. Rev. Financ. Stud. 2011, 24, 3556–3600. [Google Scholar] [CrossRef]
- Xia, L.; Lu, M.; Yu, W. Government-enterprise ties and cross-provincial investment: Empirical evidence from Chinese listed companies. J. Manag. World 2011, 214, 128–140. [Google Scholar]
- Cao, C.F.; Xia, C.Y.; Qian, X.H. Bilateral trust and distribution of business group: Empirical test based on the firm boundary theory. J. Manag. World 2019, 35, 179–191. [Google Scholar]
- Quan, Y.; Zhang, W. Geographic distance and board monitoring: Evidence from the relocation of independent directors. J. Corp. Financ. 2021, 66, 101802. [Google Scholar] [CrossRef]
- Knyazeva, A.; Knyazeva, D. Does being your bank’s neighbor matter? J. Bank. Financ. 2012, 36, 1194–1209. [Google Scholar]
- Jensen, K.; Kim, J.M.; Yi, H. The geography of US auditors: Information quality and monitoring costs by local versus non-local auditors. Rev. Quant. Financ. Acc. 2015, 44, 513–549. [Google Scholar] [CrossRef]
- Cao, C.F.; Jia, F.S. Hometown-based business associations and the cross-regional development of firms. Econ. Res. J. 2020, 55, 150–166. [Google Scholar]
- Huang, L.H.; Zhu, H.L.; Liu, W.H.; Dou, Y.F.; Wang, J.Z.; Cai, L.; Chen, Y.B.; Liao, X.W.; Wu, X.B.; Xie, K.; et al. The firm’s digital transformation and management: Toward a research framework and future directions. J. Manag. Sci. 2021, 24, 26–35. [Google Scholar]
- Vial, G. Understanding digital transformation: A review and a research agenda. J. Strateg. Inf. Syst. 2019, 28, 118–144. [Google Scholar]
- Andriole, S.J. Five myths about digital transformation. MIT Sloan Manag. Rev. 2017, 58, 20–22. [Google Scholar]
- Gust, G.; Flath, C.; Brandt, T.; Stroehle, P.; Neumann, D. How a traditional company seeded new analytics capabilities. MIS Q. Exec. 2017, 16, 215–230. [Google Scholar]
- Pagani, M. Digital business strategy and value creation: Framing the dynamic cycle of control points. MIS Q. 2013, 37, 617–632. [Google Scholar] [CrossRef]
- Bharadwaj, A.; El Sawy, O.A.; Pavlou, P.A.; Venkatraman, N. Digital business strategy: Toward a next generation of insights. MIS Q. 2013, 37, 471–482. [Google Scholar] [CrossRef]
- Nguyen, Q.K. The effect of FinTech development on financial stability in an emerging market: The role of market discipline. Res. Glob. 2022, 5, 100105. [Google Scholar]
- Nguyen, Q.; Dang, V. The impact of FinTech development on stock price crash risk and the role of corporate social responsibility: Evidence from Vietnam. Bus. Strategy Dev. 2023, 6, 557–570. [Google Scholar]
- Austin, A.A.; Carpenter, T.D.; Christ, M.H.; Nielson, C.S. The data analytics journey: Interactions among auditors, managers, regulation, and technology. Contemp. Account. Res. 2021, 38, 1888–1924. [Google Scholar] [CrossRef]
- Wu, W.; Zhao, Y.; Su, Z. Corporate IT construction and audit fees: New evidence in the era of digitalization. Aud. Res. 2022, 1, 106–117. [Google Scholar]
- Masli, A.; Peters, G.; Richardson, V.; Sanchez, J. Examining the potential benefits of internal control monitoring technology. Account. Rev. 2010, 85, 1001–1034. [Google Scholar] [CrossRef]
- Cressey, D. The criminal violation of financial trust. Am. Sociol. Rev. 1950, 15, 738–743. [Google Scholar]
- Wu, F.; Hu, H.Z.; Lin, H.Y.; Ren, X.Y. Enterprise digital transformation and capital market performance: Empirical evidence from stock liquidity. J. Manag. World 2021, 37, 130–144. [Google Scholar]
- Zhang, Y.K.; Li, X.B.; Xing, M.Q. Enterprise digital transformation and audit pricing. Aud. Res. 2021, 221, 62–71. [Google Scholar]
- Zhang, Q.C.; Yang, M.Z. Corporate digital transformation and internal control quality—A quasi-natural experiment from integration of informatization and industrialization. Aud. Res. 2022, 6, 117–128. [Google Scholar]
- Bae, K.H.; Kang, J.K.; Kim, J.M. Tunneling or value added? Evidence from merger by Korean business groups. J. Financ. 2002, 57, 2695–2740. [Google Scholar]
- Jiang, G.; Lee, C.; Yue, H. Tunneling through intercorporate loans: The China experience. J. Financ. Econ. 2010, 98, 1–20. [Google Scholar] [CrossRef]
- Jiang, F.; Kim, K. Corporate governance in China: A modern perspective. J. Corp. Financ. 2015, 32, 190–216. [Google Scholar] [CrossRef]
- Zhong, Y.; Zhao, H.; Yin, T. Resource bundling: How does enterprise digital transformation affect enterprise ESG development? Sustainability 2023, 15, 1319. [Google Scholar] [CrossRef]
- Guo, B.; Feng, Y.; Lin, J. Digital inclusive finance and digital transformation of enterprises. Financ. Res. Lett. 2023, 57, 104270. [Google Scholar] [CrossRef]
- Tan, Z.D.; Zhao, X.; Pan, J.; Tan, J.H. The value of digital transformation: From the perspective of corporate cash holdings. J. Financ. Econ. 2022, 48, 64–78. [Google Scholar]
- Wang, C.; Liu, T.; Zhu, Y.; Lin, M.; Chang, W.; Wang, X.; Li, D.; Wang, H.; Yoo, J. Digital economy, environmental regulation and corporate green technology innovation: Evidence from china. Int. J. Environ. Res. Public Health 2022, 19, 14084. [Google Scholar] [PubMed]
- Gill, M.; VanBoskirk, S. The Digital Maturity Model 4.0 Benchmarks: Digital Business Transformation Playbook. 2016. Available online: http://forrester.nitro-digital.com/pdf/Forrester-s%20Digital%20Maturity%20Model%204.0.pdf (accessed on 28 January 2023).
- Diller, M.; Asen, M.; Späth, T. The effects of personality traits on digital transformation: Evidence from German tax consulting. Int. J. Account. Inf. Syst. 2020, 37, 100455. [Google Scholar] [CrossRef]
- ITU-T Y.4906; Methodology for Building Digital Capabilities during Enterprises’ Digital Transformation. International Telecommunication Union (ITU): Geneva, Switzerland, 2018.
- Big Data Standard Working Group of National Information Technology Standardization Technical Committee; China Institute of Electronics Technology Standardization. White Paper on Enterprise Digital Transformation. 2021. Available online: https://www.cesi.cn/images/editor/20211104/20211104152310850.pdf (accessed on 10 April 2022).
- Zhongguancun Information Technology and Real Economy Integrated Development Alliance; China Enterprise Confederation. White Paper on the Digital Transformation Development Index and Method Path of State-Owned Enterprises (Group Standard Number: T/AIITRE 10001). Available online: http://www.clii.com.cn/lhrh/hyxx/202112/P020211215020914.pdf (accessed on 10 April 2022).
- Wan, L.; Wang, S.; Chen, X.; Du, L. Research on the Construction and Application of Evaluation Index System for Digital Transformation of Manufacturing Industry. Sci. Tech. Manag. Res. 2020, 40, 142–148. [Google Scholar]
- Yigitbasioglu, O.; Green, P.; Cheung, M. Digital transformation and accountants as advisors. Account. Audit. Accoun. J. 2023, 36, 209–237. [Google Scholar] [CrossRef]
- Li, L.; Lin, J.; Ouyang, Y.; Luo, X. Evaluating the impact of big data analytics usage on the decision-making quality of organizations. Technol. Forecast. Soc. 2022, 175, 121355. [Google Scholar] [CrossRef]
- Xiao, T.S.; Sun, R.Q.; Yuan, C.; Sun, J. Digital transformation, human capital structure adjustment and labor income share. J. Manag. World 2022, 38, 220–237. [Google Scholar]
- Zhou, S.; Zhou, P.; Ji, H. Can digital transformation alleviate corporate tax stickiness: The mediation effect of tax avoidance. Technol. Forecast. Soc. 2022, 184, 122028. [Google Scholar] [CrossRef]
- Liu, S.C.; Yan, J.C.; Zhang, S.X.; Lin, H.C. Can corporate digital transformation promote input-output efficiency. J. Manag. World 2021, 37, 170–190. [Google Scholar]
- Nie, X.K.; Wang, W.H.; Pei, X. Does enterprise digital transformation affect accounting comparability. Account. Res. 2022, 5, 17–39. [Google Scholar]
- Qi, Y.D.; Xiao, X. Transformation of enterprise management in the era of digital economy. J. Manag. World 2020, 36, 135–152. [Google Scholar]
- Parker, C.; Nielsen, V. Corporate compliance systems: Could they make any difference. Admin. Soc. 2009, 41, 3–37. [Google Scholar] [CrossRef]
- Files, R. SEC enforcement: Does forthright disclosure and cooperation really matter. J. Account. Econ. 2012, 53, 353–374. [Google Scholar] [CrossRef]
- Hutton, I.; Jiang, D.; Kumar, A. Political values, culture, and corporate litigation. Manag. Sci. 2015, 61, 2905–2925. [Google Scholar]
- Chang, Y.; Chen, H.; Cheng, R.; Chi, W. The impact of internal audit attributes on the effectiveness of internal control over operations and compliance. J. Contemp. Account. Econ. 2019, 15, 1–19. [Google Scholar]
- Donelson, D.; Ege, M.; Mcinnis, J. Internal control weaknesses and financial reporting fraud. Audit. A J. Pract. Theory 2017, 36, 45–69. [Google Scholar] [CrossRef]
- Wilkin, C.; Couchman, P.; Sohal, A.; Zutshi, A. Exploring differences between smaller and large organizations’ corporate governance of information technology. Int. J. Account. Inf. Syst. 2016, 22, 6–25. [Google Scholar] [CrossRef]
- Hoffman, B.; Sellers, R.; Skomra, J. The impact of client information technology capability on audit pricing. Int. J. Account. Inf. Syst. 2018, 29, 59–75. [Google Scholar] [CrossRef]
- Jensen, M.C.; Meckling, W.H. Theory of the firm: Managerial behavior, agency costs and ownership structure. J. Financ. Econ. 1976, 3, 305–360. [Google Scholar]
- Shleifer, A.; Vishny, R. A Survey of Corporate Governance. J. Financ. 1997, 52, 737–783. [Google Scholar] [CrossRef]
- Teece, D.J.; Pisano, G.; Shuen, A. Dynamic capabilities and strategic management. Strateg. Manag. J. 1997, 18, 509–533. [Google Scholar] [CrossRef]
- Teece, D.J. Explicating dynamic capabilities: The nature and microfoundations of (sustainable) enterprise performance. Strateg. Manag. J. 2007, 28, 1319–1350. [Google Scholar] [CrossRef]
- Hanelt, A.; Bohnsack, R.; Marz, D.; Antunes, C.A. Systematic review of the literature on digital transformation: Insights and implications for strategy and organizational change. J. Manag. Stud. 2021, 58, 1159–1197. [Google Scholar] [CrossRef]
- Ning, N.; Tanriverdi, H. Unifying the role of it in hyperturbulence and competitive advantage via a multilevel perspective of is strategy. MIS Q. 2017, 41, 937-A8. [Google Scholar]
- Barros, V.F.; Ramos, I.; Perez, G. Information systems and organizational memory: A literature review. J. Inform. Syst. Tech. Manag. 2015, 12, 45–63. [Google Scholar]
- Moll, J.; Yigitbasioglu, O. The role of internet-related technologies in shaping the work of accountants: New directions for accounting research. Brit. Account. Rev. 2019, 51, 100833. [Google Scholar] [CrossRef]
- Argote, L.; Ren, Y. Transactive memory systems: A microfoundation of dynamic capabilities. J. Manag. Stud. 2012, 49, 1375–1382. [Google Scholar] [CrossRef]
- Mikalef, P.; Wetering, R.; Krogstie, J. Building dynamic capabilities by leveraging big data analytics: The role of organizational inertia. Inform. Manag. 2020, 58, 103412. [Google Scholar] [CrossRef]
- Bao, Y.; Ke, B.; Li, B.; Yu, Y.J.; Zhang, J. Detecting accounting fraud in publicly traded US firms using a machine learning approach. J. Account. Res. 2020, 58, 199–235. [Google Scholar] [CrossRef]
- Earl, M.J. Management Strategies for Information Technology, 1st ed.; Prentice Hall: London, UK, 1989; pp. 3–4. [Google Scholar]
- Chan, Y.E.; Huff, S.L.; Barclay, D.W.; Copeland, D.G. Business strategic orientation, information systems strategic orientation, and strategic alignment. Inform. Syst. Res. 1997, 8, 125–150. [Google Scholar]
- Hidding, G.J. Sustaining strategic IT advantage in the information age: How strategy paradigms differ by speed. J. Strateg. Inf. Syst. 2001, 10, 201–222. [Google Scholar]
- Matt, C.; Hess, T.; Benlian, A. Digital transformation strategies. Bus. Inform. Syst. Eng. 2015, 57, 339–343. [Google Scholar] [CrossRef]
- Mcafee, A.; Ferraris, P.; Bonnet, D.; Tannou, M.; Westerman, G. The Digital Advantage: How Digital Leaders Outperform Their Peers in Every Industry. 2012. Available online: https://ide.mit.edu/wp-content/uploads/2016/04/TheDigitalAdvantage.pdf (accessed on 25 September 2023).
- Chen, D.Q.; Mocker, M.; Preston, D.S.; Teubner, A. Information systems strategy: Reconceptualization, measurement, and implications. MIS Q. 2010, 34, 233–259. [Google Scholar] [CrossRef]
- Prasad, A.; Heales, J.; Green, P. Capabilities-based approach to obtaining a deeper understanding of information technology governance effectiveness: Evidence from IT steering committees. Int. J. Account. Inf. Syst. 2010, 11, 214–232. [Google Scholar]
- Lee, B.; Menon, N. Information technology value through different normative lenses. J. Manag. Inf. Syst. 2000, 16, 99–119. [Google Scholar] [CrossRef]
- Bardhan, I.; Sugato, B.; Sougstad, R. Prioritizing a portfolio of information technology investment projects. J. Manag. Inf. Syst. 2004, 21, 33–60. [Google Scholar] [CrossRef]
- Wilkin, C.L.; Chenhall, R.H. Information technology governance: Reflections on the past and future directions. J. Inf. Syst. 2020, 34, 257–292. [Google Scholar] [CrossRef]
- Zammuto, R.F.; O’connor, E.J. Gaining advanced manufacturing technologies’ benefits: The roles of organization design and culture. Acad. Manag. Rev. 1992, 17, 701–728. [Google Scholar] [CrossRef]
- Leidner, D.; Kayworth, T. A review of culture in information systems research: Toward a theory of information technology culture conflict. MIS Q. 2006, 30, 357–399. [Google Scholar]
- Chen, L.; Wang, X.; Guan, T.; Xue, B. Enterprise digital path: Internal transformation to external empowerment. Sci. Res. Manag. 2023, 44, 11–20. [Google Scholar]
- Li, L.; Xiao, T.; He, Y.; Wang, X. Language experience, cultural integration, and merger performance of the acquiring party’s management. Account. Res. 2020, 2, 90–100. [Google Scholar]
- Zhou, X.; Li, S. A study on the influencing factors of value creation in mergers and acquisitions. J. Manag. World 2008, 5, 134–143. [Google Scholar]
- Sirmon, D.G.; Lane, P.J. A model of cultural differences and international alliance performance. J. Int. Bus. Stud. 2004, 35, 306–319. [Google Scholar]
- Chau, D.; Ngai, E.; Gerow, J.; Thatcher, J. The effects of business–IT strategic alignment and it governance on firm performance: A moderated polynomial regression analysis. MIS Q. 2020, 44, 1679–1703. [Google Scholar]
- Chen, C.; Lin, Y.; Chen, W.; Chao, C.; Pandia, H. Role of government to enhance digital transformation in small service business. Sustainability 2021, 13, 1028. [Google Scholar] [CrossRef]
- Brynjolfsson, E.; Mcelheran, K. The rapid adoption of data-driven decision-making. Am. Econ. Rev. 2016, 106, 133–139. [Google Scholar]
- Westerman, G.; Bonnet, D.; Mcafee, A. The nine elements of digital transformation. MIT Sloan Manag. Rev. 2014, 55, 1–6. [Google Scholar]
- Ashbaugh-Skaife, H.; Collins, D.; Kinney, W. The discovery and reporting of internal control deficiencies prior to SOX-mandated audits. J. Account. Econ. 2007, 44, 166–192. [Google Scholar]
- Chahine, S.; Colak, G.; Hasan, I.; Mazboudi, M. Investor relations and IPO performance. Rev. Account. Stud. 2020, 25, 474–512. [Google Scholar]
- Williamson, O.E. The new institutional economics: Taking stock, looking ahead. J. Econ. Lit. 2000, 38, 595–613. [Google Scholar] [CrossRef]
- Garrett, J.; Hoitash, R.; Prawitt, D. Trust and financial reporting quality. J. Account. Res. 2014, 52, 1087–1125. [Google Scholar] [CrossRef]
- Jha, A.; Chen, Y. Audit fees and social capital. Account. Rev. 2015, 90, 611–639. [Google Scholar]
- Chami, R.; Fullenkamp, C. Trust and efficiency. J. Bank. Financ. 2002, 26, 1785–1809. [Google Scholar]
- Bauer, A.; Fang, J.; Pittman, J.; Zhang, Y.; Zhao, Y. How aggressive tax planning facilitates the diversion of corporate resources: Evidence from path analysis. Contemp. Account. Res. 2020, 37, 1882–1913. [Google Scholar] [CrossRef]
- Al-Htaybat, K.; Von Alberti-Alhtaybat, L. Big data and corporate reporting: Impacts and paradoxes. Account. Audit. Accoun. J. 2017, 30, 850–873. [Google Scholar]
- Chen, D.; Hu, Q. Research on corporate governance in the digital economy era: Paradigm innovation and practice frontiers. J. Manag. World 2022, 38, 213–240. [Google Scholar]
Figure 1.
The proportion of internal control weakness related to subsidiaries.

Figure 2.
Research framework.

Table 1.
An overview of the evaluation framework of enterprise digital transformation.
| Reference | Evaluation Philosophy | Evaluation Indicators |
|---|---|---|
| Gill and VanBoskirk (2016) [30] | Company level, business level, and functional level | 4 first-level indicators: Culture, Technology, Organization, Insights. |
| Diller et al. (2020) [31] | Technology, business, and stakeholders | 5 first-level indicators: Business model transformation, Digital collaboration, Remote access, Digital communication, Interconnectivity with stakeholders |
| International Telecommunications Union (ITU) standard: Methodology for building digital capabilities during enterprises’ digital transformation (ITU-T Y.4906) [32] | Progress assessment and impact assessment | 6 first-level indicators: Basis and support, Domain application, Integration and interaction, Innovation and disruption, Digital competitiveness, Economic, environmental and social impacts. |
| White Paper on Enterprise Digital Transformation (2021) [33] | Strategic planning and implementation | 5 first-level indicators: Strategy and development, Organization and human resources, Technology and platform, Data and applications, and Business and effect |
| Group standard: Digital Transformation—Reference Architecture (T/AIITRE 10001) [34] | Optimization, innovation, and reconstruction of value system | 5 first-level indicators: Development strategy, Enhanced capabilities, Systematic solution, Governance system, and Business innovation and transformation |
| Wan et al. (2020) [35] | Value, ability, and elements | 3 first-level indicators: Strategy and resource base, Situation and capability, Efficiency and benefit |
Table 2.
Evaluation system of enterprise digital transformation.
| First-Level Indicators (Symbol) | Second-Level Indicators (Symbol) | Third-Level Indicators | Symbol | Respondent |
|---|---|---|---|---|
| Strategy and development (S) | Decision maker’s strategic value assessment of enterprise digital transformation (SH) | Chairman’s strategic value assessment of enterprise digital transformation | SH1 | Chairman |
| CEO’s core strategic value assessment of enterprise digital transformation | SH2 | CEO | ||
| Chairman’s core operation value assessment of enterprise digital transformation | SH3 | Chairman | ||
| CEO’s core operation value assessment of enterprise digital transformation | SH4 | CEO | ||
| Technical manager’s strategic value assessment of enterprise digital transformation (ST) | CIO’s core strategic value assessment of enterprise digital transformation | ST1 | CIO | |
| CIO’s core operation value assessment of enterprise digital transformation | ST2 | CIO | ||
| CIO’s assessment of consistency of digital transformation and organization strategy | ST3 | CIO | ||
| CIO’s assessment of consistency of digital transformation and business strategy | ST4 | CIO | ||
| Decision maker’s assessment of consistency of digital transformation and strategy (SL) | CEO’s assessment of consistency of digital transformation and organization strategy | SL1 | CEO | |
| CEO’s assessment of consistency of digital transformation and business strategy | SL2 | CEO | ||
| Risk control department’s assessment of consistency of digital transformation and strategy (SI) | Risk control department’s assessment of consistency of digital transformation and organization strategy | SI1 | CFO | |
| Risk control department’s assessment of consistency of digital transformation and business strategy | SI2 | CFO | ||
| Development level of risk control informatization | SI3 | CFO | ||
| Assessment of expected influence of digital transformation on business development (SD) | Assessment of expected influence of digital transformation on business development from CFO’s perspective | SD1 | CFO | |
| Assessment of expected influence of digital transformation on business development from CIO’s perspective | SD2 | CIO | ||
| Organization and human resources (O) | Human resources guarantee (OH) | Proportion of IT department’s employees | OH1 | CIO |
| Proportion of IT department’s salaries | OH2 | CIO | ||
| Organization guarantee (OL) | Power of IT department’s leader | OL1 | CIO | |
| Power of leader of IT department’s leader | OL2 | CIO | ||
| Budget guarantee (OF) | Comparison between per-capita annual salary growth rate of IT department and per-capita salary growth rate of all employees | OF1 | CIO | |
| Comparison between growth rate of IT investment and growth rate of revenue | OF2 | CIO | ||
| Technology and platform (T) | Transformation resources reserve (TR) | Existing resources to support digital transformation | TR1 | CIO |
| Existing resources to deal with the challenges of digital transformation | TR2 | CIO | ||
| Front-end application platform construction (TQ) | Investment in e-commerce | TQ1 | CIO | |
| Investment in social media | TQ2 | CIO | ||
| Investment in mobile platform | TQ3 | CIO | ||
| Investment in video meeting | TQ4 | CIO | ||
| Investment in ERP | TQ5 | CIO | ||
| Back-end technology platform construction (TH) | Investment in cloud computing | TH1 | CIO | |
| Investment in big data | TH2 | CIO | ||
| Level of business informatization (TB) | ERP implementation in financial accounting | TB1 | CIO | |
| ERP implementation in production planning | TB2 | CIO | ||
| ERP implementation in costs control | TB3 | CIO | ||
| ERP implementation in supply chain management | TB4 | CIO | ||
| ERP implementation in sales and distribution management | TB5 | CIO | ||
| ERP implementation in customer relationship management | TB6 | CIO | ||
| ERP implementation in human resources management | TB7 | CIO | ||
| Mobile office (TO) | How often the chairman uses mobile office | TO1 | Chairman | |
| How often the CEO uses mobile office | TO2 | CEO | ||
| How often the CFO uses mobile office | TO3 | CFO | ||
| How often the CIO uses mobile office | TO4 | CIO | ||
| Level of internal audit informatization (TA) | Use of audit information system | TA1 | internal control department’s leader | |
| Development level of internal audit informatization | TA2 | internal control department’s leader | ||
| Independence of audit information system | TA3 | internal control department’s leader | ||
| Level of accounting informatization (TS) | Information system tool for financial report preparation | TS1 | CFO | |
| Data and application (D) | Ability to apply data (DC) | Annual assessment of the ability to apply data | DC1 | The enterprise as a whole |
| Cumulative assessment of the ability to apply data | DC2 | The enterprise as a whole | ||
| Data security (DS) | Annual assessment of data security | DS1 | The enterprise as a whole | |
| Cumulative assessment of data security | DS2 | The enterprise as a whole | ||
| Business and effect (E) | Effects of digitalization (E) | Overall digital level from CEO’s perspective | E1 | CEO |
| Overall digital level from CIO’s perspective | E2 | CIO | ||
| Digital marketing level | E3 | The enterprise as a whole | ||
| Digital procurement level | E4 | The enterprise as a whole | ||
| Digital operation level | E5 | The enterprise as a whole | ||
| Digital product level | E6 | The enterprise as a whole | ||
| Digital service level | E7 | The enterprise as a whole |
Table 3.
Variable definition.
| Symbol | Variable | Measurement |
|---|---|---|
| Dependent variable | ||
| VIOLA | Degree of violation of nonlocal subsidiaries | VIOLA refers to the degree of violation of nonlocal subsidiaries in year t and in place j of listed company i. |
| Independent variable | ||
| DGT | Enterprise digital transformation index | Enterprise digital transformation index (DGT) of Chinese listed firms is calculated using factor analysis and the unique survey data from internal control questionnaires of Chinese listed firms |
| Control variable | ||
| SIZE_PAR | Firm size | Relative size of the parent firm measured by the proportion of the parent firm’s assets in the consolidated assets. |
| IBDEBT | Solvency | Ratio of liability with interest, which is equal to (short-term borrowings + long-term borrowings + current maturity of long-term liabilities)/total assets |
| ROE | Profitability | Net income/equity at the end of year |
| GROWTH | Sales growth | (Sales of the current year—sales of the previous year)/sales of the previous year |
| MA | Changes in organizational structure | Dummy variable of whether the firm has M&A activity during the period from year t to year t − 2 |
| SHRCR1 | Concentration of ownership | Ownership ratio of the largest shareholder |
| BALANCE | Balance of ownership | Ownership ratio of the second- to the fifth-largest shareholder/Ownership ratio of the largest shareholder |
| INDEP | External supervision | Proportion of independent directors in board of directors |
| BIG4 | External supervision | Dummy variable of whether it is audited by the “Big Four” or not |
| DUAL | Management power | Dummy variable of whether the CEO also serves as the chairman |
| PC | Political background of top management | Dummy variable of whether the chairman or CEO is or was a government official |
| RC | Intensity of internal supervision | Dummy variable of whether the listed firm sets up a risk control department |
| IA | Intensity of internal supervision | Dummy variable of whether internal audit department of the listed firm is responsible to the chairman or the audit committee |
| PROVGDPG | Regional economic development | GDP growth rate of the province where the nonlocal subsidiary is located |
| SEREXPR | Regional public service size | Ratio of public service expenditure to fiscal expenditure in the province where the nonlocal subsidiary is located |
| CONFISREVR | Regional punishment severity | Proportion of forfeiture income in fiscal income where the nonlocal subsidiary is located |
| MARKET | Regional marketization | Marketization index of province where the nonlocal subsidiary is located |
| DISTPC | Cost of internal supervision | Geographical distance between the two capitals of the province where the parent and the nonlocal subsidiary are located respectively |
Table 4.
Descriptive statistics.
| Variables | N | Mean | Std.Dev | Min | Median | Max |
|---|---|---|---|---|---|---|
| VIOLA | 4723 | 0.175 | 0.065 | 0.024 | 0.218 | 0.289 |
| DGT | 4723 | 0.423 | 0.134 | 0.038 | 0.429 | 0.886 |
| SIZE_PAR | 4723 | 0.838 | 0.287 | 0.347 | 0.841 | 3.747 |
| IBDEBT | 4723 | 0.144 | 0.127 | 0.000 | 0.124 | 0.564 |
| ROE | 4723 | 0.079 | 0.098 | −0.494 | 0.076 | 0.715 |
| GROWTH | 4723 | 0.298 | 1.509 | −0.412 | 0.134 | 20.751 |
| MA | 4723 | 0.744 | 0.437 | 0.000 | 1.000 | 1.000 |
| SHRCR1 | 4723 | 0.324 | 0.135 | 0.088 | 0.305 | 0.761 |
| BALANCE | 4723 | 0.583 | 0.422 | 0.036 | 0.493 | 1.885 |
| INDEP | 4723 | 0.374 | 0.052 | 0.250 | 0.333 | 0.667 |
| BIG4 | 4723 | 0.064 | 0.244 | 0.000 | 0.000 | 1.000 |
| DUAL | 4723 | 0.397 | 0.489 | 0.000 | 0.000 | 1.000 |
| PC | 4723 | 0.430 | 0.495 | 0.000 | 0.000 | 1.000 |
| RC | 4723 | 0.946 | 0.227 | 0.000 | 1.000 | 1.000 |
| IA | 4723 | 0.997 | 0.052 | 0.000 | 1.000 | 1.000 |
| PROVGDPG | 4723 | 0.084 | 0.031 | −0.040 | 0.089 | 0.183 |
| SEREXPR | 4723 | 0.089 | 0.024 | 0.042 | 0.089 | 0.159 |
| CONFISREVR | 4723 | 0.021 | 0.009 | 0.006 | 0.021 | 0.043 |
| MARKET | 4723 | 7.562 | 1.852 | 0.710 | 7.390 | 10.000 |
| DISTPC | 4723 | 1070.234 | 606.516 | 158.214 | 1049.000 | 3228.783 |
Table 5.
Correlation matrix.
| VIOLA | DGT | SIZE_PAR | IBDEBT | ROE | GROWTH | MA | SHRCR1 | BALANCE | INDEP | BIG4 | DUAL | PC | RC | IA | PROVGDPG | SEREXPR | CONFISREVR | MARKET | DISTPC | |
|---|---|---|---|---|---|---|---|---|---|---|---|---|---|---|---|---|---|---|---|---|
| VIOLA | 1.000 | |||||||||||||||||||
| DGT | −0.049 *** | 1.000 | ||||||||||||||||||
| SIZE_PAR | 0.031 ** | −0.021 | 1.000 | |||||||||||||||||
| IBDEBT | −0.043 *** | −0.102 *** | −0.248 *** | 1.000 | ||||||||||||||||
| ROE | −0.069 *** | 0.021 | 0.332 *** | −0.163 *** | 1.000 | |||||||||||||||
| GROWTH | −0.058 *** | −0.068 *** | 0.717 *** | −0.083 *** | 0.513 *** | 1.000 | ||||||||||||||
| MA | −0.026 * | −0.098 *** | −0.059 *** | −0.000 | 0.055 *** | 0.079 *** | 1.000 | |||||||||||||
| SHRCR1 | −0.021 | 0.012 | 0.028 * | −0.049 *** | 0.005 | −0.041 *** | −0.057 *** | 1.000 | ||||||||||||
| BALANCE | 0.004 | 0.113 *** | −0.009 | −0.071 *** | −0.001 | 0.040 *** | 0.093 *** | −0.632 *** | 1.000 | |||||||||||
| INDEP | 0.013 | 0.009 | 0.188 *** | −0.052 *** | 0.054 *** | 0.176 *** | 0.005 | 0.101 *** | −0.033 ** | 1.000 | ||||||||||
| BIG4 | 0.009 | 0.279 *** | 0.069 *** | −0.031 ** | −0.001 | −0.030 ** | −0.215 *** | 0.055 *** | 0.032 ** | −0.056 *** | 1.000 | |||||||||
| DUAL | −0.013 | 0.022 | 0.160 *** | −0.041 *** | 0.003 | 0.080 *** | −0.004 | 0.048 *** | −0.075 *** | 0.143 *** | −0.088 *** | 1.000 | ||||||||
| PC | 0.009 | 0.099 *** | 0.055 *** | −0.077 *** | −0.060 *** | −0.076 *** | −0.084 *** | −0.042 *** | 0.093 *** | −0.046 *** | 0.161 *** | −0.088 *** | 1.000 | |||||||
| RC | 0.023 | 0.107 *** | −0.249 *** | 0.082 *** | −0.091 *** | −0.307 *** | −0.040 *** | −0.091 *** | 0.043 *** | −0.070 *** | 0.040 *** | −0.002 | 0.009 | 1.000 | ||||||
| IA | −0.006 | 0.070 *** | −0.029 ** | 0.056 *** | 0.023 | 0.000 | 0.006 | 0.047 *** | −0.057 *** | −0.071 *** | −0.085 *** | 0.043 *** | 0.046 *** | 0.219 *** | 1.000 | |||||
| PROVGDPG | 0.053 *** | −0.018 | −0.017 | −0.008 | −0.035 ** | −0.061 *** | −0.027 * | 0.053 *** | −0.009 | 0.003 | −0.000 | 0.008 | 0.069 *** | 0.009 | 0.010 | 1.000 | ||||
| SEREXPR | 0.042 *** | 0.031 ** | −0.023 | 0.013 | 0.007 | −0.021 | −0.012 | 0.027 * | 0.027 * | −0.005 | 0.016 | 0.023 | 0.068 *** | 0.026 * | 0.050 *** | 0.404 *** | 1.000 | |||
| CONFISREVR | 0.017 | 0.059 *** | −0.010 | 0.015 | 0.031 ** | 0.026 * | 0.013 | 0.002 | 0.019 | 0.006 | 0.032 ** | 0.016 | 0.031 ** | 0.012 | 0.046 *** | −0.132 *** | 0.630 *** | 1.000 | ||
| MARKET | −0.071 *** | −0.036 ** | 0.012 | −0.034 ** | −0.035 ** | −0.015 | 0.012 | −0.009 | 0.004 | 0.043 *** | −0.025 * | 0.024 * | −0.049 *** | −0.042 *** | −0.043 *** | 0.009 | −0.456 *** | −0.580 *** | 1.000 | |
| DISTPC | 0.022 | 0.008 | 0.024 * | 0.005 | 0.015 | 0.035 ** | −0.010 | −0.006 | −0.026 * | 0.003 | 0.038 *** | −0.016 | −0.028 * | 0.014 | 0.024 * | −0.124 *** | 0.024 * | 0.023 | −0.341 *** | 1.000 |
Note: ***, **, * represent significance levels of 1%, 5%, and 10%, respectively.
Table 6.
Differences in the degree of violations between nonlocal and local subsidiaries.
| Variables | Mean Degree of Violation of Nonlocal Local Subsidiaries | Mean Degree of Violation of Local Subsidiaries | Difference | Percentage of Difference |
|---|---|---|---|---|
| VIOLA | 0.059 | 0.054 | 0.005 *** | 9.26% |
Note: *** represent significance levels of 1%.
Table 7.
The results of KMO and Bartlett’s test.
| Kaiser–Meyer–Olkin measure of sampling adequacy | 0.786 | |
| Bartlett’s test of sphericity | Approx. Chi-square | 157,447.484 |
| df | 1540 | |
| Sig. | 0.000 | |
Table 8.
Regression results of enterprise digital transformation and violation of nonlocal subsidiaries.
Table 8.
Regression results of enterprise digital transformation and violation of nonlocal subsidiaries.
| Variables | (1) | (2) |
|---|---|---|
| VIOLA | F1_VIOLA | |
| DGT | −0.022 *** | −0.032 *** |
| (−2.725) | (−3.171) | |
| SIZE_PAR | 0.028 *** | 0.032 *** |
| (4.684) | (3.945) | |
| IBDEBT | −0.021 ** | −0.027 *** |
| (−2.401) | (−2.591) | |
| ROE | −0.025 ** | −0.043 *** |
| (−1.996) | (−2.611) | |
| GROWTH | −0.006 *** | −0.007 *** |
| (−5.113) | (−4.317) | |
| MA | 0.001 | −0.003 |
| (0.494) | (−0.878) | |
| SHRCR1 | −0.011 | −0.016 |
| (−1.074) | (−1.313) | |
| BALANCE | 0.001 | 0.004 |
| (0.309) | (1.169) | |
| BIG4 | 0.009 ** | 0.015 *** |
| (2.027) | (2.652) | |
| DUAL | −0.002 | −0.001 |
| (−1.187) | (−0.476) | |
| PC | −0.001 | −0.002 |
| (−0.637) | (−0.862) | |
| RC | 0.007 | 0.008 |
| (1.451) | (1.330) | |
| IA | 0.001 | 0.035 |
| (0.042) | (1.494) | |
| PROVGDPG | −0.011 | −0.037 |
| (−0.169) | (−0.461) | |
| SEREXPR | −0.192 | −0.327 |
| (−0.916) | (−1.265) | |
| CONFISREVR | −0.007 | 0.442 |
| (−0.014) | (0.746) | |
| MARKET | −0.001 | −0.002 |
| (−0.302) | (−0.568) | |
| DISTPC | 0.000 | 0.000 |
| (0.848) | (0.978) | |
| Constant | 0.140 *** | 0.126 ** |
| (3.126) | (2.251) | |
| Industry | Yes | Yes |
| Year | Yes | Yes |
| Province | Yes | Yes |
| adj. R2 | 0.090 | 0.100 |
| N | 4723 | 4550 |
| Coefficients differences | 0.010 * | |
| p-value | 0.077 | |
Note: ***, **, * represent significance levels of 1%, 5%, and 10%, respectively. The t-value in parentheses has been adjusted using company-level clustering. The empirical p-value is used to test the significance of the differences in the coefficients of the main explanatory variables between two groups. The p-value is calculated by conducting bootstrap sampling 1000 times. Data sources: CSMAR and CEI, same as below.
Table 9.
Regression result of entropy balance matching.
| Variables | (1) | (2) |
|---|---|---|
| VIOLA | F1_VIOLA | |
| DGT | −0.039 *** | −0.048 *** |
| (−3.708) | (−3.388) | |
| SIZE_PAR | 0.032 *** | 0.038 *** |
| (3.630) | (3.322) | |
| IBDEBT | −0.021 ** | −0.028 ** |
| (−2.082) | (−2.192) | |
| ROE | −0.001 | 0.002 |
| (−0.073) | (0.072) | |
| GROWTH | −0.004 | −0.010 * |
| (−0.916) | (−1.734) | |
| MA | 0.001 | 0.001 |
| (0.461) | (0.297) | |
| SHRCR1 | 0.014 | 0.023 |
| (1.024) | (1.432) | |
| BALANCE | 0.005 | 0.011 *** |
| (1.437) | (2.614) | |
| BIG4 | 0.016 ** | 0.022 ** |
| (2.487) | (2.271) | |
| DUAL | −0.003 | −0.000 |
| (−1.290) | (−0.069) | |
| PC | −0.006 ** | −0.006 * |
| (−2.217) | (−1.763) | |
| RC | 0.009 * | 0.010 |
| (1.708) | (1.586) | |
| IA | −0.008 | 0.039 |
| (−0.225) | (0.868) | |
| PROVGDPG | 0.000 | −0.079 |
| (0.004) | (−0.793) | |
| SEREXPR | 0.017 | −0.162 |
| (0.065) | (−0.522) | |
| CONFISREVR | −1.052 | −0.898 |
| (−1.496) | (−1.023) | |
| MARKET | −0.006 | −0.011 * |
| (−1.291) | (−1.868) | |
| DISTPC | 0.000 | 0.000 |
| (0.148) | (0.450) | |
| Constant | 0.201 *** | 0.213 *** |
| (2.929) | (2.646) | |
| Industry | Yes | Yes |
| Year | Yes | Yes |
| Province | Yes | Yes |
| adj. R2 | 0.089 | 0.110 |
| N | 4723 | 4550 |
Note: ***, **, * represent significance levels of 1%, 5%, and 10%, respectively. The t-value in parentheses has been adjusted using company-level clustering.
Table 10.
Results of instrumental variable regression.
| Variables | (1) | (2) |
|---|---|---|
| DGT | VIOLA | |
| DGT | −0.124 * | |
| (−1.912) | ||
| PROVDGT | 0.117 *** | |
| (8.665) | ||
| SIZE_PAR | 0.003 | 0.031 *** |
| (0.209) | (4.991) | |
| IBDEBT | −0.067 *** | −0.025 ** |
| (−3.466) | (−2.372) | |
| ROE | 0.097 *** | −0.048 *** |
| (3.142) | (−2.836) | |
| GROWTH | −0.010 *** | −0.006 *** |
| (−4.548) | (−4.468) | |
| MA | −0.006 | −0.000 |
| (−1.309) | (−0.144) | |
| LOSS3 | −0.019 | −0.040 *** |
| (−1.023) | (−4.383) | |
| SHRCR1 | 0.042 ** | −0.009 |
| (2.260) | (−0.852) | |
| BALANCE | 0.030 *** | 0.004 |
| (5.410) | (1.028) | |
| DUAL | −0.004 | −0.004 * |
| (−1.035) | (−1.861) | |
| PC | 0.011 *** | −0.002 |
| (2.893) | (−0.888) | |
| BIG4 | 0.159 *** | 0.026 ** |
| (19.165) | (2.328) | |
| PROVGDPG | 0.016 | −0.017 |
| (0.212) | (−0.247) | |
| UNEMRATE | −0.002 | −0.003 |
| (−0.625) | (−0.261) | |
| DISTPC | −0.000 | 0.000 |
| (−0.497) | (1.047) | |
| SEREXPR | 0.047 | −0.202 |
| (0.367) | (−0.901) | |
| CONFISREVR | 0.266 | 0.052 |
| (0.754) | (0.102) | |
| MARKET | −0.001 | −0.001 |
| (−0.485) | (−0.226) | |
| ROLAW | 0.000 | 0.000 |
| (0.273) | (0.104) | |
| Constant | 0.435 *** | 0.196 *** |
| (12.615) | (3.793) | |
| Industry | Yes | Yes |
| Year | Yes | Yes |
| Province | No | Yes |
| adj. R2 | 0.254 | 0.060 |
| N | 4723 | 4723 |
Note: ***, **, * represent significance levels of 1%, 5%, and 10%, respectively. The t-value in parentheses has been adjusted using company-level clustering.
Table 11.
Regression results of instrumental variable regression.
| Variables | (1) | (2) | (3) |
|---|---|---|---|
| DUM | VIOLA | F1_VIOLA | |
| DGT | −0.025 * | −0.030 * | |
| (−1.662) | (−1.738) | ||
| MILLS | −0.083 ** | −0.044 | |
| (−1.994) | (−0.975) | ||
| SIZE_PAR | −0.173 | 0.040 *** | 0.036 *** |
| (−0.536) | (3.514) | (2.603) | |
| IBDEBT | −0.493 | 0.013 | −0.003 |
| (−1.086) | (0.638) | (−0.136) | |
| ROE | 1.000 * | −0.064 * | −0.053 |
| (1.819) | (−1.963) | (−1.499) | |
| GROWTH | 0.011 | −0.010 *** | −0.010 *** |
| (0.147) | (−5.367) | (−4.088) | |
| MA | −0.000 | 0.001 | −0.003 |
| (−0.004) | (0.191) | (−0.724) | |
| SHRCR1 | −1.244 ** | 0.048 * | 0.023 |
| (−2.379) | (1.716) | (0.758) | |
| BALANCE | −0.355 ** | 0.015 ** | 0.014 ** |
| (−2.152) | (2.450) | (2.071) | |
| BIG4 | 0.691 * | −0.034 | −0.014 |
| (1.651) | (−1.589) | (−0.584) | |
| DUAL | 0.243 ** | −0.014 * | −0.007 |
| (2.213) | (−1.821) | (−0.798) | |
| PC | −0.179 * | 0.009 | 0.005 |
| (−1.744) | (1.479) | (0.663) | |
| RC | 0.378 | −0.018 | −0.007 |
| (1.643) | (−1.287) | (−0.475) | |
| IA | 0.077 | −0.003 | 0.000 |
| (0.412) | (−0.457) | (0.014) | |
| PROVGDPG | −0.027 | −0.006 | −0.022 |
| (−0.068) | (−0.182) | (−0.536) | |
| SEREXPR | −1.519 | −0.068 | −0.093 |
| (−1.189) | (−0.496) | (−0.613) | |
| CONFISREVR | 0.143 | −0.014 | 0.381 |
| (0.041) | (−0.053) | (1.299) | |
| MARKET | 0.016 | −0.001 | −0.002 |
| (0.754) | (−0.404) | (−0.705) | |
| DISTPC | −0.000 | 0.000 | 0.000 |
| (−0.509) | (1.382) | (1.232) | |
| Constant | −0.545 | 0.209 *** | 0.186 *** |
| (−0.726) | (4.039) | (3.193) | |
| Industry | Yes | Yes | Yes |
| Year | Yes | Yes | Yes |
| Province | Yes | Yes | Yes |
| adj. R2 | - | 0.094 | 0.100 |
| pseudo R2 | 0.129 | - | - |
| N | 9244 | 4723 | 4530 |
Note: ***, **, * represent significance levels of 1%, 5%, and 10%, respectively. The t-value in parentheses has been adjusted using company-level clustering.
Table 12.
Controlling the firm and year fixed effects.
| Variables | (1) | (2) |
|---|---|---|
| VIOLA | F1_VIOLA | |
| DGT | −0.115 ** | −0.139 * |
| (−1.989) | (−1.671) | |
| SIZE_PAR | −0.005 | −0.011 |
| (−0.390) | (−1.334) | |
| IBDEBT | −0.015 | −0.013 |
| (−1.203) | (−0.754) | |
| ROE | −0.027 | −0.047 * |
| (−1.103) | (−1.822) | |
| GROWTH | −0.001 | 0.002 * |
| (−0.472) | (1.738) | |
| MA | 0.000 | −0.002 |
| (0.053) | (−1.084) | |
| SHRCR1 | −0.020 * | −0.006 |
| (−1.813) | (−0.381) | |
| BALANCE | 0.000 | 0.007 |
| (0.025) | (1.510) | |
| INDEP | −0.027 | −0.011 |
| (−0.758) | (−0.293) | |
| BIG4 | −0.009 * | −0.011 |
| (−1.720) | (−0.579) | |
| DUAL | −0.002 | −0.005 |
| (−0.649) | (−1.144) | |
| PC | −0.001 | −0.001 |
| (−0.481) | (−0.300) | |
| PROVGDPG | −0.018 | −0.057 |
| (−0.626) | (−1.587) | |
| SEREXPR | −0.059 | −0.060 |
| (−0.547) | (−0.455) | |
| CONFISREVR | −0.139 | 0.076 |
| (−0.618) | (0.278) | |
| MARKET | −0.000 | −0.003 * |
| (−0.208) | (−1.750) | |
| DISTPC | 0.000 | 0.000 |
| (0.763) | (0.106) | |
| Constant | 0.274 *** | 0.308 *** |
| (6.716) | (5.940) | |
| Firm | Yes | Yes |
| Year | Yes | Yes |
| adj. R2 | 0.073 | 0.024 |
| N | 4723 | 4530 |
Note: ***, **, * represent significance levels of 1%, 5%, and 10%, respectively. The t-value in parentheses has been adjusted using company-level clustering.
Table 13.
Excluding the impact of subsidiaries’ digital transformation.
| Variables | (1) | (2) |
|---|---|---|
| VIOLA | F1_VIOLA | |
| DGT | −0.031 *** | −0.041 *** |
| (−3.144) | (−3.499) | |
| SIZE_PAR | 0.027 *** | 0.029 *** |
| (3.923) | (2.975) | |
| IBDEBT | −0.039 *** | −0.051 *** |
| (−3.675) | (−4.011) | |
| ROE | −0.031 * | −0.057 *** |
| (−1.950) | (−2.943) | |
| GROWTH | −0.006 *** | −0.006 *** |
| (−4.429) | (−3.511) | |
| MA | 0.001 | −0.001 |
| (0.432) | (−0.357) | |
| SHRCR1 | −0.001 | −0.004 |
| (−0.111) | (−0.268) | |
| BALANCE | 0.006 * | 0.008 * |
| (1.667) | (1.904) | |
| BIG4 | 0.014 *** | 0.021 *** |
| (2.685) | (3.184) | |
| DUAL | −0.004 | −0.004 |
| (−1.604) | (−1.318) | |
| PC | −0.001 | −0.001 |
| (−0.524) | (−0.403) | |
| RC | 0.005 | 0.006 |
| (0.922) | (0.988) | |
| IA | 0.003 | 0.004 |
| (0.606) | (0.665) | |
| PROVGDPG | −0.007 | −0.084 |
| (−0.089) | (−0.914) | |
| SEREXPR | −0.269 | −0.560 * |
| (−1.097) | (−1.943) | |
| CONFISREVR | 0.126 | 0.616 |
| (0.211) | (0.888) | |
| MARKET | −0.002 | −0.004 |
| (−0.384) | (−0.765) | |
| DISTPC | 0.000 | 0.000 |
| (0.758) | (1.558) | |
| Constant | 0.179 *** | 0.219 *** |
| (3.625) | (3.714) | |
| Industry | Yes | Yes |
| Year | Yes | Yes |
| Province | Yes | Yes |
| adj. R2 | 0.109 | 0.127 |
| N | 3527 | 3373 |
Note: ***, * represent significance levels of 1% and 10%, respectively. The t-value in parentheses has been adjusted using company-level clustering.
Table 14.
Excluding the impact of subsidiaries’ internal control.
| Variables | (1) | (2) |
|---|---|---|
| VIOLA | F1_VIOLA | |
| DGT | −0.020 ** | −0.027 *** |
| (−2.414) | (−2.699) | |
| ICW_SUB | −0.004 | −0.000 |
| (−0.671) | (−0.050) | |
| SIZE_PAR | 0.029 *** | 0.029 *** |
| (4.692) | (3.499) | |
| IBDEBT | −0.027 *** | −0.034 *** |
| (−2.947) | (−3.156) | |
| ROE | −0.027 ** | −0.050 *** |
| (−2.030) | (−2.972) | |
| GROWTH | −0.006 *** | −0.006 *** |
| (−5.156) | (−4.086) | |
| MA | 0.001 | −0.002 |
| (0.470) | (−0.784) | |
| SHRCR1 | −0.007 | −0.011 |
| (−0.687) | (−0.932) | |
| BALANCE | 0.003 | 0.005 |
| (0.877) | (1.369) | |
| BIG4 | 0.009 * | 0.015 ** |
| (1.896) | (2.551) | |
| DUAL | −0.003 | −0.001 |
| (−1.316) | (−0.448) | |
| PC | −0.001 | −0.002 |
| (−0.500) | (−0.661) | |
| RC | 0.006 | 0.008 |
| (1.223) | (1.315) | |
| IA | 0.003 | 0.004 |
| (0.860) | (0.943) | |
| PROVGDPG | −0.012 | −0.038 |
| (−0.181) | (−0.475) | |
| SEREXPR | −0.169 | −0.283 |
| (−0.770) | (−1.093) | |
| CONFISREVR | 0.053 | 0.503 |
| (0.101) | (0.824) | |
| MARKET | −0.000 | −0.003 |
| (−0.045) | (−0.712) | |
| DISTPC | 0.000 | 0.000 |
| (1.034) | (1.271) | |
| Constant | 0.133 *** | 0.163 *** |
| (3.059) | (3.152) | |
| Industry | Yes | Yes |
| Year | Yes | Yes |
| Province | Yes | Yes |
| adj. R2 | 0.095 | 0.106 |
| N | 4723 | 4530 |
Note: ***, **, * represent significance levels of 1%, 5%, and 10%, respectively. The t-value in parentheses has been adjusted using company-level clustering.
Table 15.
Controlling the impact of regional institution.
| Variables | (1) | (2) |
|---|---|---|
| VIOLA_resid | F1_VIOLA_resid | |
| DGT | −0.020 ** | −0.023 ** |
| (−2.366) | (−2.570) | |
| SIZE_PAR | 0.029 *** | 0.026 *** |
| (4.697) | (3.492) | |
| IBDEBT | −0.027 *** | −0.031 *** |
| (−2.962) | (−3.155) | |
| ROE | −0.026 * | −0.046 *** |
| (−1.951) | (−3.075) | |
| GROWTH | −0.006 *** | −0.006 *** |
| (−5.209) | (−4.017) | |
| MA | 0.001 | −0.003 |
| (0.567) | (−0.987) | |
| SHRCR1 | −0.008 | −0.010 |
| (−0.750) | (−0.871) | |
| BALANCE | 0.002 | 0.005 |
| (0.796) | (1.620) | |
| BIG4 | 0.009 ** | 0.012 ** |
| (1.992) | (2.375) | |
| DUAL | −0.003 | −0.001 |
| (−1.215) | (−0.514) | |
| PC | −0.001 | −0.002 |
| (−0.480) | (−0.647) | |
| RC | 0.006 | 0.006 |
| (1.212) | (1.198) | |
| IA | 0.003 | 0.004 |
| (0.887) | (0.991) | |
| PROVGDPG | −0.002 | −0.021 |
| (−0.023) | (−0.287) | |
| SEREXPR | −0.172 | −0.232 |
| (−0.781) | (−0.984) | |
| CONFISREVR | 0.129 | 0.500 |
| (0.244) | (0.896) | |
| MARKET | 0.001 | −0.002 |
| (0.279) | (−0.406) | |
| DISTPC | 0.000 | 0.000 |
| (1.067) | (1.296) | |
| Constant | −0.060 | −0.038 |
| (−1.375) | (−0.796) | |
| Industry | Yes | Yes |
| Year | Yes | Yes |
| Province | Yes | Yes |
| adj. R2 | 0.090 | 0.103 |
| N | 4723 | 4529 |
Note: ***, **, * represent significance levels 1%, 5%, and 10%, respectively. The t-value in parentheses has been adjusted using company-level clustering.
Table 16.
Regression results using the violation of newly registered nonlocal subsidiaries.
| Variables | (1) | (2) |
|---|---|---|
| VIOLA_mean2 | VIOLA_mean4 | |
| DGT_group | −0.008 ** | −0.011 ** |
| (−2.185) | (−2.145) | |
| SIZE_PAR | 0.010 | 0.006 |
| (1.536) | (0.832) | |
| IBDEBT | −0.028 * | −0.046 * |
| (−1.883) | (−1.954) | |
| ROE | −0.080 *** | −0.137 *** |
| (−2.604) | (−2.896) | |
| GROWTH | −0.004 *** | −0.001 |
| (−3.747) | (−0.760) | |
| MA | 0.007 | −0.001 |
| (1.330) | (−0.091) | |
| SHRCR1 | −0.015 | −0.005 |
| (−0.993) | (−0.221) | |
| BALANCE | 0.002 | −0.012 |
| (0.305) | (−1.540) | |
| BIG4 | 0.003 | 0.017 ** |
| (0.348) | (1.988) | |
| DUAL | 0.009 ** | 0.001 |
| (2.439) | (0.259) | |
| PC | 0.013 *** | 0.013 ** |
| (3.359) | (2.520) | |
| RC | 0.007 | 0.016 |
| (0.749) | (1.259) | |
| IA | 0.006 | 0.003 |
| (0.964) | (0.326) | |
| PROVGDPG | −0.027 | −0.371 |
| (−0.299) | (−1.428) | |
| SEREXPR | −0.652 | 1.274 |
| (−1.637) | (1.060) | |
| CONFISREVR | −0.495 | 0.246 |
| (−0.799) | (0.143) | |
| MARKET | −0.005 | 0.062 |
| (−0.737) | (1.336) | |
| DISTPC | 0.000 | −0.000 |
| (0.761) | (−1.259) | |
| Constant | 0.260 *** | −0.424 |
| (3.291) | (−1.004) | |
| Industry | Yes | Yes |
| Year | Yes | Yes |
| Province | Yes | Yes |
| adj. R2 | 0.118 | 0.187 |
| N | 1204 | 537 |
Note: ***, **, * represent significance levels of 1%, 5%, and 10%, respectively. The t-value in parentheses has been adjusted using company-level clustering.
Table 17.
Regression results using alternative independent variables.
| Variables | (1) | (2) |
|---|---|---|
| VIOLA | F1_VIOLA | |
| DGT_ALTERN | −0.003 ** | −0.003 * |
| (−2.288) | (−1.849) | |
| SIZE_PAR | 0.032 *** | 0.051 *** |
| (6.561) | (6.667) | |
| IBDEBT | −0.038 *** | −0.042 *** |
| (−5.286) | (−4.346) | |
| ROE | −0.061 *** | −0.059 *** |
| (−6.394) | (−4.618) | |
| GROWTH | −0.006 *** | −0.005 |
| (−2.995) | (−1.169) | |
| MA | −0.001 | −0.002 |
| (−0.264) | (−0.584) | |
| SHRCR1 | −0.019 ** | −0.021 * |
| (−2.296) | (−1.922) | |
| BALANCE | −0.008 *** | −0.004 |
| (−3.090) | (−1.070) | |
| BIG4 | −0.001 | 0.005 |
| (−0.352) | (0.879) | |
| DUAL | −0.002 | 0.000 |
| (−1.123) | (0.056) | |
| PC | −0.003 | −0.005 * |
| (−1.462) | (−1.919) | |
| RC | −0.003 | −0.006 |
| (−0.795) | (−1.247) | |
| IA | 0.004 | 0.007 * |
| (1.568) | (1.873) | |
| PROVGDPG | −0.023 | −0.025 |
| (−0.396) | (−0.150) | |
| SEREXPR | −0.059 | −0.177 |
| (−0.308) | (−0.487) | |
| CONFISREVR | −0.045 | 0.375 |
| (−0.099) | (0.240) | |
| MARKET | 0.001 | −0.002 |
| (0.167) | (−0.366) | |
| DISTPC | 0.000 | 0.000 |
| (1.195) | (1.223) | |
| Constant | 0.224 *** | 0.238 *** |
| (6.181) | (4.413) | |
| Industry | Yes | Yes |
| Year | Yes | Yes |
| Province | Yes | Yes |
| adj. R2 | 0.092 | 0.099 |
| N | 8792 | 5482 |
Note: ***, **, * represent significance levels of 1%, 5%, and 10%, respectively. The t-value in parentheses has been adjusted using company-level clustering.
Table 18.
Mechanism test.
| Variables | (1) | (2) | (3) | (4) |
|---|---|---|---|---|
| ILL | VIOLA | ICW | VIOLA | |
| DGT | −0.001 *** | −0.019 ** | −0.127 *** | −0.017 ** |
| (−4.572) | (−2.263) | (−3.460) | (−2.045) | |
| ILL | 1.722 ** | |||
| (2.272) | ||||
| ICW | 0.006 * | |||
| (1.651) | ||||
| SIZE_PAR | 0.001 *** | 0.027 *** | −0.045 | 0.049 *** |
| (2.855) | (4.390) | (−1.331) | (6.832) | |
| IBDEBT | −0.000 | −0.027 *** | −0.011 | −0.016 * |
| (−0.185) | (−2.929) | (−0.277) | (−1.814) | |
| ROE | −0.000 | −0.026 * | 0.169 *** | −0.017 ** |
| (−0.875) | (−1.909) | (4.138) | (−2.294) | |
| GROWTH | −0.000 ** | −0.006 *** | −0.004 *** | −0.004 *** |
| (−2.264) | (−4.954) | (−2.633) | (−5.319) | |
| MA | 0.000 * | 0.001 | −0.014 | 0.000 |
| (1.713) | (0.498) | (−1.384) | (0.194) | |
| SHRCR1 | 0.000 | −0.007 | 0.018 | −0.012 |
| (0.066) | (−0.715) | (0.403) | (−1.149) | |
| BALANCE | 0.000 *** | 0.002 | 0.023 * | 0.002 |
| (5.300) | (0.651) | (1.708) | (0.742) | |
| BIG4 | −0.000 *** | 0.010 ** | −0.089 *** | −0.003 |
| (−8.213) | (2.032) | (−3.673) | (−0.152) | |
| DUAL | 0.000 | −0.003 | −0.026 *** | −0.004 * |
| (0.612) | (−1.302) | (−2.986) | (−1.706) | |
| PC | −0.000 | −0.001 | −0.032 *** | −0.002 |
| (−0.561) | (−0.460) | (−3.377) | (−0.793) | |
| RC | −0.000 *** | 0.007 | 0.037 ** | 0.003 |
| (−2.999) | (1.340) | (2.115) | (0.636) | |
| IA | 0.000 | 0.003 | −0.026 | 0.003 |
| (0.646) | (0.849) | (−1.462) | (0.951) | |
| PROVGDPG | 0.000 | −0.012 | 0.050 | −0.013 |
| (0.377) | (−0.183) | (0.183) | (−0.195) | |
| SEREXPR | −0.003 | −0.162 | −0.381 | −0.164 |
| (−0.866) | (−0.741) | (−0.387) | (−0.750) | |
| CONFISREVR | 0.015 | 0.024 | 2.467 | 0.097 |
| (1.277) | (0.046) | (1.222) | (0.185) | |
| MARKET | 0.000 | −0.000 | −0.000 | −0.000 |
| (1.266) | (−0.097) | (−0.001) | (−0.062) | |
| DISTPC | −0.000 | 0.000 | 0.000 ** | 0.000 |
| (−0.849) | (1.084) | (2.102) | (1.083) | |
| Constant | −0.001 | 0.135 *** | 0.253 | 0.115 *** |
| (−0.994) | (3.092) | (1.374) | (2.638) | |
| Industry | Yes | Yes | Yes | Yes |
| Year | Yes | Yes | Yes | Yes |
| Province | Yes | Yes | Yes | Yes |
| adj. R2 | 0.244 | 0.096 | 0.064 | 0.097 |
| N | 4723 | 4723 | 4723 | 4723 |
Note: ***, **, * represent significance levels of 1%, 5%, and 10%, respectively. The t-value in parentheses has been adjusted using company-level clustering.
Table 19.
Enterprise digital transformation at the business and functional level.
| Enterprise Digital Transformation at the Business Level | Enterprise Digital Transformation at the Functional Level | ||
|---|---|---|---|
| Indicators | Symbol | Indicators | Symbol |
| ERP implementation in production planning | TB2 | ERP implementation in financial accounting | TB1 |
| ERP implementation in costs control | TB3 | ERP implementation in human resources management | TB7 |
| ERP implementation in supply chain management | TB4 | How often the Chairman uses mobile office | TO1 |
| ERP implementation in sales and distribution management | TB5 | How often the CEO uses mobile office | TO2 |
| ERP implementation in customer relationship management | TB6 | How often the CFO uses mobile office | TO3 |
| Digital marketing level | E3 | How often the CIO uses mobile office | TO4 |
| Digital procurement level | E4 | Use of audit information system | TA1 |
| Digital operation level | E5 | Development level of internal audit informatization | TA2 |
| Digital product level | E6 | Independence of audit information system | TA3 |
| Digital service level | E7 | Information system tool for financial report preparation | TS1 |
Table 20.
Regression results of heterogeneous analysis of the levels of enterprise digital transformation.
Table 20.
Regression results of heterogeneous analysis of the levels of enterprise digital transformation.
| Variables | (1) | (2) | (3) | (4) |
|---|---|---|---|---|
| VIOLA | VIOLA | F1_VIOLA | F1_VIOLA | |
| BUSIDGT | −0.014 ** | −0.019 ** | ||
| (−2.249) | (−2.458) | |||
| FUNCDGT | −0.003 | −0.004 | ||
| (−0.347) | (−0.473) | |||
| SIZE_PAR | 0.030 *** | 0.029 *** | 0.030 *** | 0.028 *** |
| (4.805) | (4.696) | (3.615) | (3.481) | |
| IBDEBT | −0.026 *** | −0.024 *** | −0.033 *** | −0.030 *** |
| (−2.880) | (−2.707) | (−3.083) | (−2.872) | |
| ROE | −0.026 * | −0.026 ** | −0.049 *** | −0.049 *** |
| (−1.926) | (−1.965) | (−2.976) | (−2.974) | |
| GROWTH | −0.006 *** | −0.006 *** | −0.006 *** | −0.006 *** |
| (−5.250) | (−5.160) | (−4.170) | (−4.076) | |
| MA | 0.001 | 0.001 | −0.002 | −0.002 |
| (0.620) | (0.562) | (−0.700) | (−0.792) | |
| SHRCR1 | −0.007 | −0.009 | −0.012 | −0.014 |
| (−0.721) | (−0.884) | (−0.942) | (−1.103) | |
| BALANCE | 0.003 | 0.002 | 0.005 | 0.004 |
| (0.859) | (0.629) | (1.390) | (1.153) | |
| BIG4 | 0.008 * | 0.006 | 0.013 ** | 0.011 * |
| (1.660) | (1.344) | (2.274) | (1.932) | |
| DUAL | −0.003 | −0.003 | −0.001 | −0.001 |
| (−1.219) | (−1.224) | (−0.371) | (−0.401) | |
| PC | −0.001 | −0.001 | −0.002 | −0.002 |
| (−0.401) | (−0.494) | (−0.567) | (−0.651) | |
| RC | 0.007 | 0.005 | 0.008 | 0.006 |
| (1.326) | (1.003) | (1.417) | (1.026) | |
| IA | 0.003 | 0.004 | 0.004 | 0.005 |
| (0.831) | (1.057) | (0.925) | (1.203) | |
| PROVGDPG | −0.011 | −0.011 | −0.036 | −0.037 |
| (−0.159) | (−0.167) | (−0.455) | (−0.469) | |
| SEREXPR | −0.165 | −0.167 | −0.278 | −0.284 |
| (−0.752) | (−0.763) | (−1.075) | (−1.096) | |
| CONFISREVR | 0.053 | 0.040 | 0.505 | 0.488 |
| (0.102) | (0.077) | (0.828) | (0.800) | |
| MARKET | −0.000 | −0.000 | −0.003 | −0.003 |
| (−0.060) | (−0.081) | (−0.721) | (−0.734) | |
| DISTPC | 0.000 | 0.000 | 0.000 | 0.000 |
| (1.070) | (1.017) | (1.289) | (1.226) | |
| Constant | 0.131 *** | 0.127 *** | 0.161 *** | 0.156 *** |
| (3.024) | (2.901) | (3.106) | (2.979) | |
| Industry | Yes | Yes | Yes | Yes |
| Year | Yes | Yes | Yes | Yes |
| Province | Yes | Yes | Yes | Yes |
| adj. R2 | 0.095 | 0.094 | 0.105 | 0.104 |
| N | 4723 | 4723 | 4530 | 4530 |
Note: ***, **, * represent significance levels of 1%, 5%, and 10%, respectively. The t-value in parentheses has been adjusted using company-level clustering.
Table 21.
Stages of enterprise digital transformation.
| Stages | Measurement (PROGRESS_GROUP, EFFECT_GROUP) | Description |
|---|---|---|
| Balanced achievement | (1, 1) | Developed and effective |
| Initial achievement | (0, 1) | Underdeveloped and effective |
| Potential achievement | (0, 0) | Underdeveloped and ineffective |
| Insufficient achievement | (1, 0) | Developed and ineffective |
Table 22.
Regression results of heterogeneous analysis of the stages of enterprise digital transformation.
Table 22.
Regression results of heterogeneous analysis of the stages of enterprise digital transformation.
| Variables | (1) | (2) | (3) | (4) |
|---|---|---|---|---|
| Balanced Achievement | Initial Achievement | Potential Achievement | Insufficient Achievement | |
| VIOLA | VIOLA | VIOLA | VIOLA | |
| DGT | −0.113 *** | −0.053 ** | −0.004 | −0.006 |
| (−3.098) | (−2.129) | (−0.153) | (−0.126) | |
| SIZE_PAR | 0.030 | 0.007 | 0.026 *** | 0.093 *** |
| (1.472) | (0.520) | (3.306) | (5.826) | |
| IBDEBT | −0.002 | 0.025 | −0.040 ** | −0.062 *** |
| (−0.066) | (1.470) | (−2.381) | (−2.992) | |
| ROE | −0.008 | −0.007 | −0.072 ** | −0.022 |
| (−0.223) | (−0.300) | (−2.123) | (−0.807) | |
| GROWTH | −0.001 | −0.004 ** | −0.002 | 0.007 |
| (−0.106) | (−2.041) | (−0.259) | (0.957) | |
| MA | −0.012 ** | 0.007 | 0.002 | 0.011 * |
| (−2.442) | (1.534) | (0.323) | (1.888) | |
| SHRCR1 | −0.024 | 0.001 | 0.029 | −0.036 * |
| (−0.871) | (0.038) | (1.203) | (−1.743) | |
| BALANCE | 0.017 ** | −0.002 | 0.000 | −0.006 |
| (2.024) | (−0.254) | (0.041) | (−0.936) | |
| BIG4 | 0.012 | 0.009 | −0.042 | 0.008 |
| (1.420) | (0.558) | (−1.278) | (0.797) | |
| DUAL | −0.014 ** | 0.015 *** | −0.004 | −0.019 *** |
| (−2.475) | (3.628) | (−1.018) | (−4.337) | |
| PC | −0.015 *** | 0.005 | 0.006 | 0.006 |
| (−2.920) | (1.009) | (1.244) | (1.221) | |
| RC | −0.004 | −0.006 | −0.004 | −0.007 |
| (−0.289) | (−0.529) | (−0.365) | (−0.696) | |
| IA | 0.000 | 0.000 | 0.000 | 0.033 |
| (.) | (.) | (0.006) | (0.796) | |
| PROVGDPG | −0.063 | −0.058 | −0.011 | 0.032 |
| (−0.481) | (−0.464) | (−0.079) | (0.280) | |
| SEREXPR | −0.120 | −0.379 | 0.158 | −0.087 |
| (−0.283) | (−0.857) | (0.394) | (−0.234) | |
| CONFISREVR | −0.081 | −0.972 | 1.136 | −0.298 |
| (−0.090) | (−1.010) | (1.091) | (−0.359) | |
| MARKET | −0.008 | −0.002 | 0.000 | 0.003 |
| (−1.002) | (−0.369) | (0.035) | (0.515) | |
| DISTPC | 0.000 * | 0.000 | −0.000 | 0.000 |
| (1.729) | (1.233) | (−0.256) | (0.436) | |
| Constant | 0.285 *** | 0.278 *** | 0.092 | 0.010 |
| (3.050) | (3.417) | (1.206) | (0.124) | |
| Industry | Yes | Yes | Yes | Yes |
| Year | Yes | Yes | Yes | Yes |
| Province | Yes | Yes | Yes | Yes |
| adj. R2 | 0.166 | 0.125 | 0.096 | 0.263 |
| N | 1073 | 1285 | 1105 | 1274 |
| Coefficients differences | (1) vs. (2): −0.060 ** | - | - | |
| Empirical p-value | 0.012 | - | - | |
Note: ***, **, * represent significance levels of 1%, 5%, and 10%, respectively. The t-value in parentheses has been adjusted using company-level clustering. The empirical p-value is used to test the significance of the differences in the coefficients of the main explanatory variables between two groups. The p-value is calculated by conducting bootstrap sampling 1000 times. Variable IA has no variation in column (1) and (2), as the internal audit department of the listed firm in the group of Balanced Achievement and Initial Achievement are all responsible to the chairman or the audit committee so that the values of IA of these two groups are all 1.
Table 23.
Regression results of heterogeneous analysis of the origins of nonlocal subsidiaries.
| Variables | (1) | (2) | (3) |
|---|---|---|---|
| VIOLA_SIE | VIOLA_UCC | VIOLA_NUCC | |
| DGT | −0.030 * | −0.056 | −0.018 |
| (−1.677) | (−0.387) | (−0.494) | |
| SIZE_PAR | 0.025 *** | 0.005 | 0.017 |
| (2.688) | (0.133) | (1.202) | |
| IBDEBT | −0.037 ** | 0.187 ** | −0.107 *** |
| (−2.018) | (2.222) | (−2.712) | |
| ROE | −0.027 | −0.150 * | −0.033 |
| (−1.546) | (−1.933) | (−1.477) | |
| GROWTH | −0.020 *** | 0.005 | −0.007 *** |
| (−3.310) | (0.816) | (−2.771) | |
| MA | −0.004 | −0.058 ** | −0.007 |
| (−0.726) | (−2.200) | (−0.473) | |
| SHRCR1 | −0.016 | 0.009 | −0.086 * |
| (−0.720) | (0.090) | (−1.680) | |
| BALANCE | 0.010 | −0.030 | −0.028 ** |
| (1.503) | (−0.935) | (−2.411) | |
| BIG4 | 0.022 ** | −0.031 | −0.023 |
| (2.239) | (−0.644) | (−1.221) | |
| DUAL | −0.005 | 0.020 | 0.000 |
| (−1.100) | (0.573) | (0.016) | |
| PC | 0.002 | −0.001 | 0.001 |
| (0.401) | (−0.031) | (0.138) | |
| RC | 0.011 | 0.095 | −0.029 |
| (1.040) | (1.475) | (−1.244) | |
| IA | 0.006 | −0.006 | 0.032 * |
| (0.664) | (−0.129) | (1.949) | |
| PROVGDPG | −0.077 | −0.160 | −0.020 |
| (−0.555) | (−0.389) | (−0.087) | |
| SEREXPR | −0.419 | 1.076 | −0.083 |
| (−0.983) | (0.718) | (−0.105) | |
| CONFISREVR | −0.467 | 1.053 | 0.194 |
| (−0.460) | (0.396) | (0.101) | |
| MARKET | −0.003 | −0.036 | −0.003 |
| (−0.366) | (−1.397) | (−0.175) | |
| DISTPC | 0.000 | 0.000 *** | −0.000 |
| (0.497) | (3.798) | (−0.528) | |
| Constant | 0.298 *** | 0.415 | 0.190 |
| (3.032) | (1.420) | (1.052) | |
| Industry | Yes | Yes | Yes |
| Year | Yes | Yes | Yes |
| Province | Yes | Yes | Yes |
| adj. R2 | 0.112 | 0.350 | 0.155 |
| N | 2530 | 289 | 657 |
Note: ***, **, * represent significance levels of 1%, 5%, and 10%, respectively. The t-value in parentheses has been adjusted using company-level clustering.
Table 24.
Economic benefits analysis of the effect of enterprise digital transformation on nonlocal subsidiaries.
Table 24.
Economic benefits analysis of the effect of enterprise digital transformation on nonlocal subsidiaries.
| Variables | (1) | (2) | (3) |
|---|---|---|---|
| SUBADMEX | SUBASAEX | SUBTURN | |
| DGT | −0.252 ** | −0.349 ** | 1.589 *** |
| (−2.277) | (−1.988) | (3.976) | |
| SIZE_PAR | 0.211 *** | 0.323 *** | −0.617 ** |
| (2.828) | (2.701) | (−2.463) | |
| IBDEBT | −0.011 | 0.008 | −0.189 |
| (−0.150) | (0.062) | (−0.438) | |
| ROE | −0.156 | −0.211 | 0.395 |
| (−0.872) | (−0.913) | (0.819) | |
| GROWTH | −0.059 | −0.094 * | 0.131 * |
| (−1.609) | (−1.851) | (1.868) | |
| MA | −0.018 | −0.039 | 0.004 |
| (−0.883) | (−1.082) | (0.038) | |
| SHRCR1 | 0.091 | 0.142 | 1.287 *** |
| (0.834) | (0.628) | (3.035) | |
| BALANCE | 0.040 | 0.048 | 0.430 *** |
| (1.412) | (0.946) | (3.257) | |
| BIG4 | 0.030 | −0.014 | −0.170 |
| (0.739) | (−0.249) | (−1.165) | |
| DUAL | −0.011 | 0.001 | −0.075 |
| (−0.522) | (0.036) | (−0.873) | |
| PC | −0.051 *** | −0.065 * | 0.068 |
| (−2.654) | (−1.910) | (0.700) | |
| RC | −0.011 | 0.013 | 0.055 |
| (−0.367) | (0.241) | (0.289) | |
| IA | 0.047 | 0.065 | −0.240 * |
| (1.538) | (1.541) | (−1.698) | |
| PROVGDPG | 2.617 * | 4.821 * | 1.440 |
| (1.697) | (1.750) | (0.569) | |
| SEREXPR | 2.209 | 2.994 | −7.556 |
| (0.927) | (0.726) | (−0.954) | |
| CONFISREVR | −5.440 | 3.261 | −8.311 |
| (−0.497) | (0.197) | (−0.480) | |
| MARKET | 0.014 | 0.007 | −0.146 |
| (0.301) | (0.082) | (−1.045) | |
| DISTPC | 0.000 | 0.000 | −0.000 |
| (0.507) | (0.126) | (−1.144) | |
| Constant | −0.488 | −0.965 | 3.133 * |
| (−1.022) | (−1.292) | (1.797) | |
| Industry | Yes | Yes | Yes |
| Year | Yes | Yes | Yes |
| Province | Yes | Yes | Yes |
| adj. R2 | 0.075 | 0.041 | 0.225 |
| N | 404 | 396 | 1879 |
Note: ***, **, * represent significance levels of 1%, 5%, and 10%, respectively. The t-value in parentheses has been adjusted using company-level clustering.
Disclaimer/Publisher’s Note: The statements, opinions and data contained in all publications are solely those of the individual author(s) and contributor(s) and not of MDPI and/or the editor(s). MDPI and/or the editor(s) disclaim responsibility for any injury to people or property resulting from any ideas, methods, instructions or products referred to in the content. |
© 2024 by the authors. Licensee MDPI, Basel, Switzerland. This article is an open access article distributed under the terms and conditions of the Creative Commons Attribution (CC BY) license (https://creativecommons.org/licenses/by/4.0/).
Share and Cite
MDPI and ACS Style
Yan, S.; Xi, Y.; Wu, Z. Enterprise Digital Transformation and Compliance in Cross-Regional Development: A Dynamic Capabilities Perspective. Sustainability 2024, 16, 844. https://doi.org/10.3390/su16020844
AMA Style
Yan S, Xi Y, Wu Z. Enterprise Digital Transformation and Compliance in Cross-Regional Development: A Dynamic Capabilities Perspective. Sustainability. 2024; 16(2):844. https://doi.org/10.3390/su16020844
Chicago/Turabian StyleYan, Shaojun, Yiyang Xi, and Zhaoxiang Wu. 2024. "Enterprise Digital Transformation and Compliance in Cross-Regional Development: A Dynamic Capabilities Perspective" Sustainability 16, no. 2: 844. https://doi.org/10.3390/su16020844
Note that from the first issue of 2016, this journal uses article numbers instead of page numbers. See further details here.