
Measuring Space Efficiency and Estimating the Potential for Reduced Operational and Embodied Energy Use for Office Spaces

1
Department of Sustainable Development, Environmental Science and Engineering, KTH Royal Institute of Technology, 100 44 Stockholm, Sweden
2
KTH Climate Action Centre, KTH Royal Institute of Technology, 100 44 Stockholm, Sweden
3
Department of Precision Engineering, School of Engineering, The University of Tokyo, Tokyo 113-8656, Japan
4
Department of the Built Environment, Aalborg University Copenhagen, 2450 Copenhagen, Denmark
*
Author to whom correspondence should be addressed.
Sustainability 2024, 16(1), 332; https://doi.org/10.3390/su16010332
Submission received: 24 October 2023
/
Revised: 22 December 2023
/
Accepted: 22 December 2023
/
Published: 29 December 2023
(This article belongs to the Topic Building Energy Efficiency)
Abstract
:This paper explores how opportunities for reducing the total use of office space can be identified, investigates how the benefits in terms of energy savings from space efficiency measures could be calculated, and gives a first estimate of such values. A simple method to measure office space use is presented and tested at two university departments, and very low space efficiency is found. A variety of reasons for the low space efficiency are identified via interviews with property managers and heads of the concerned departments. These include the fact that the incentives for using space efficiently are small for the decision-makers, and the costs in terms of time and trouble are perceived as high. This suggests that interesting results can be achieved without large efforts. Moreover, we present a proof of concept of how to estimate the amount of energy that can be saved by reducing space use. We find a rough estimate of the potential energy savings of 2 MWh/m2 in embodied primary energy intensity (assuming that more efficient use of space leads to a decrease in new construction) and 200 kWh/m2/year in final energy intensity. Those numbers should be useful as rough estimates when looking at opportunities for saving energy by using space more efficiently.
1. Introduction
1.1. Background
In order to achieve sustainable use of resources, resource consumption must be minimised by slowing down and closing the material/energy cycle [1]. In the UN Sustainable Development Goals (SDGs), efficient energy use is considered crucial for achieving a sustainable society. The building sector accounts for about 31% of global final energy demand, 21% of global greenhouse gas emissions, and 40% of European primary energy demand [2,3]. In Europe, about a quarter of the useful floor area consists of service buildings, of which a quarter consists of office space [3]. However, service buildings exhibit a higher energy use per m2 than residential buildings and account for about a third of final energy use for space heating, cooling and hot water [3]. Therefore, reducing the energy use of office buildings is crucial for a more sustainable use of resources.
To reduce resource consumption and greenhouse gas emissions, one promising idea is to use space more efficiently through, e.g., a more intensive use of existing space [4]. Intensifying space use could reduce the demand for constructing new buildings and could, therefore, reduce resource consumption and energy use for construction. It would also reduce the need for operational energy in the total building stock. However, previous studies have typically evaluated energy efficiency only per unit area (kWh/m2). This can be misleading since it does not say anything about the use of the building [5,6]. While recent studies have started exploring this question regarding the sharing of residential buildings [7], knowledge is lacking regarding the environmental benefits of sharing office space, in particular for buildings with unique features, such as university buildings. Past industry surveys seem to indicate that desks and meeting rooms are typically in use about 50% of the time during work hours, which indicates a potential to use the space more efficiently [8].
University buildings consist of a diversity of buildings, such as lecture halls, laboratories and offices. This diversity makes assessments of energy use difficult to interpret [9]. One way of exploring stakeholders’ views on energy savings measures is by interviewing staff at various levels, a method used, e.g., by Nair et al. [9]. They focus on lecture halls and, to some extent, offices but do not discuss the use of laboratories and do not base their discussions on any data on the use of premises [9]. Azimi et al. [10] have used Passive Infrared Radiation sensors to measure space use in lecture halls as a starting point for space-use efficiency improvements. They also calculate an energy savings potential in terms of reduced operational electricity use and the need for heating per lecture hall. However, they do not discuss embodied energy use, nor do they try to identify potentials in terms of reductions per square metre. There is interest in the literature on occupancy measurement, but most of that interest seems to be focused on optimising and dimensioning lighting and HVAC [11]. Azimi et al. [10] found that only a fraction of such papers dealt with space utilisation. There seems to be a gap in terms of how to evaluate embodied energy savings linked with space efficiency measures, including embodied energy. Additionally, more knowledge from practical use cases regarding simple approaches to monitor office space use efficiency and how to understand and address inefficient office use would be valuable.
1.2. Aim and Research Questions
The objective of this study is to find out how opportunities for reducing the use of office space can be identified, to investigate how the benefits in terms of operational and embodied energy savings from space efficiency measures could be calculated and to give a first estimate of such values.
We try a simple way of collecting data on office use and test how this can be used to obtain new knowledge on office space use and then use the data to discuss improvements in space use. The purpose is also to provide default values and orders of magnitude to estimate potential resource savings for more efficient use of office buildings. We set the following two research questions:
- RQ1: What can be understood about an organisation’s space efficiency by just counting the use of the rooms and interviewing the managers?
- RQ2: How could the potential savings of embodied and operational energy through intensified space use be calculated? What would be a first approximation of the size of the savings, and what are the main considerations in such a calculation?
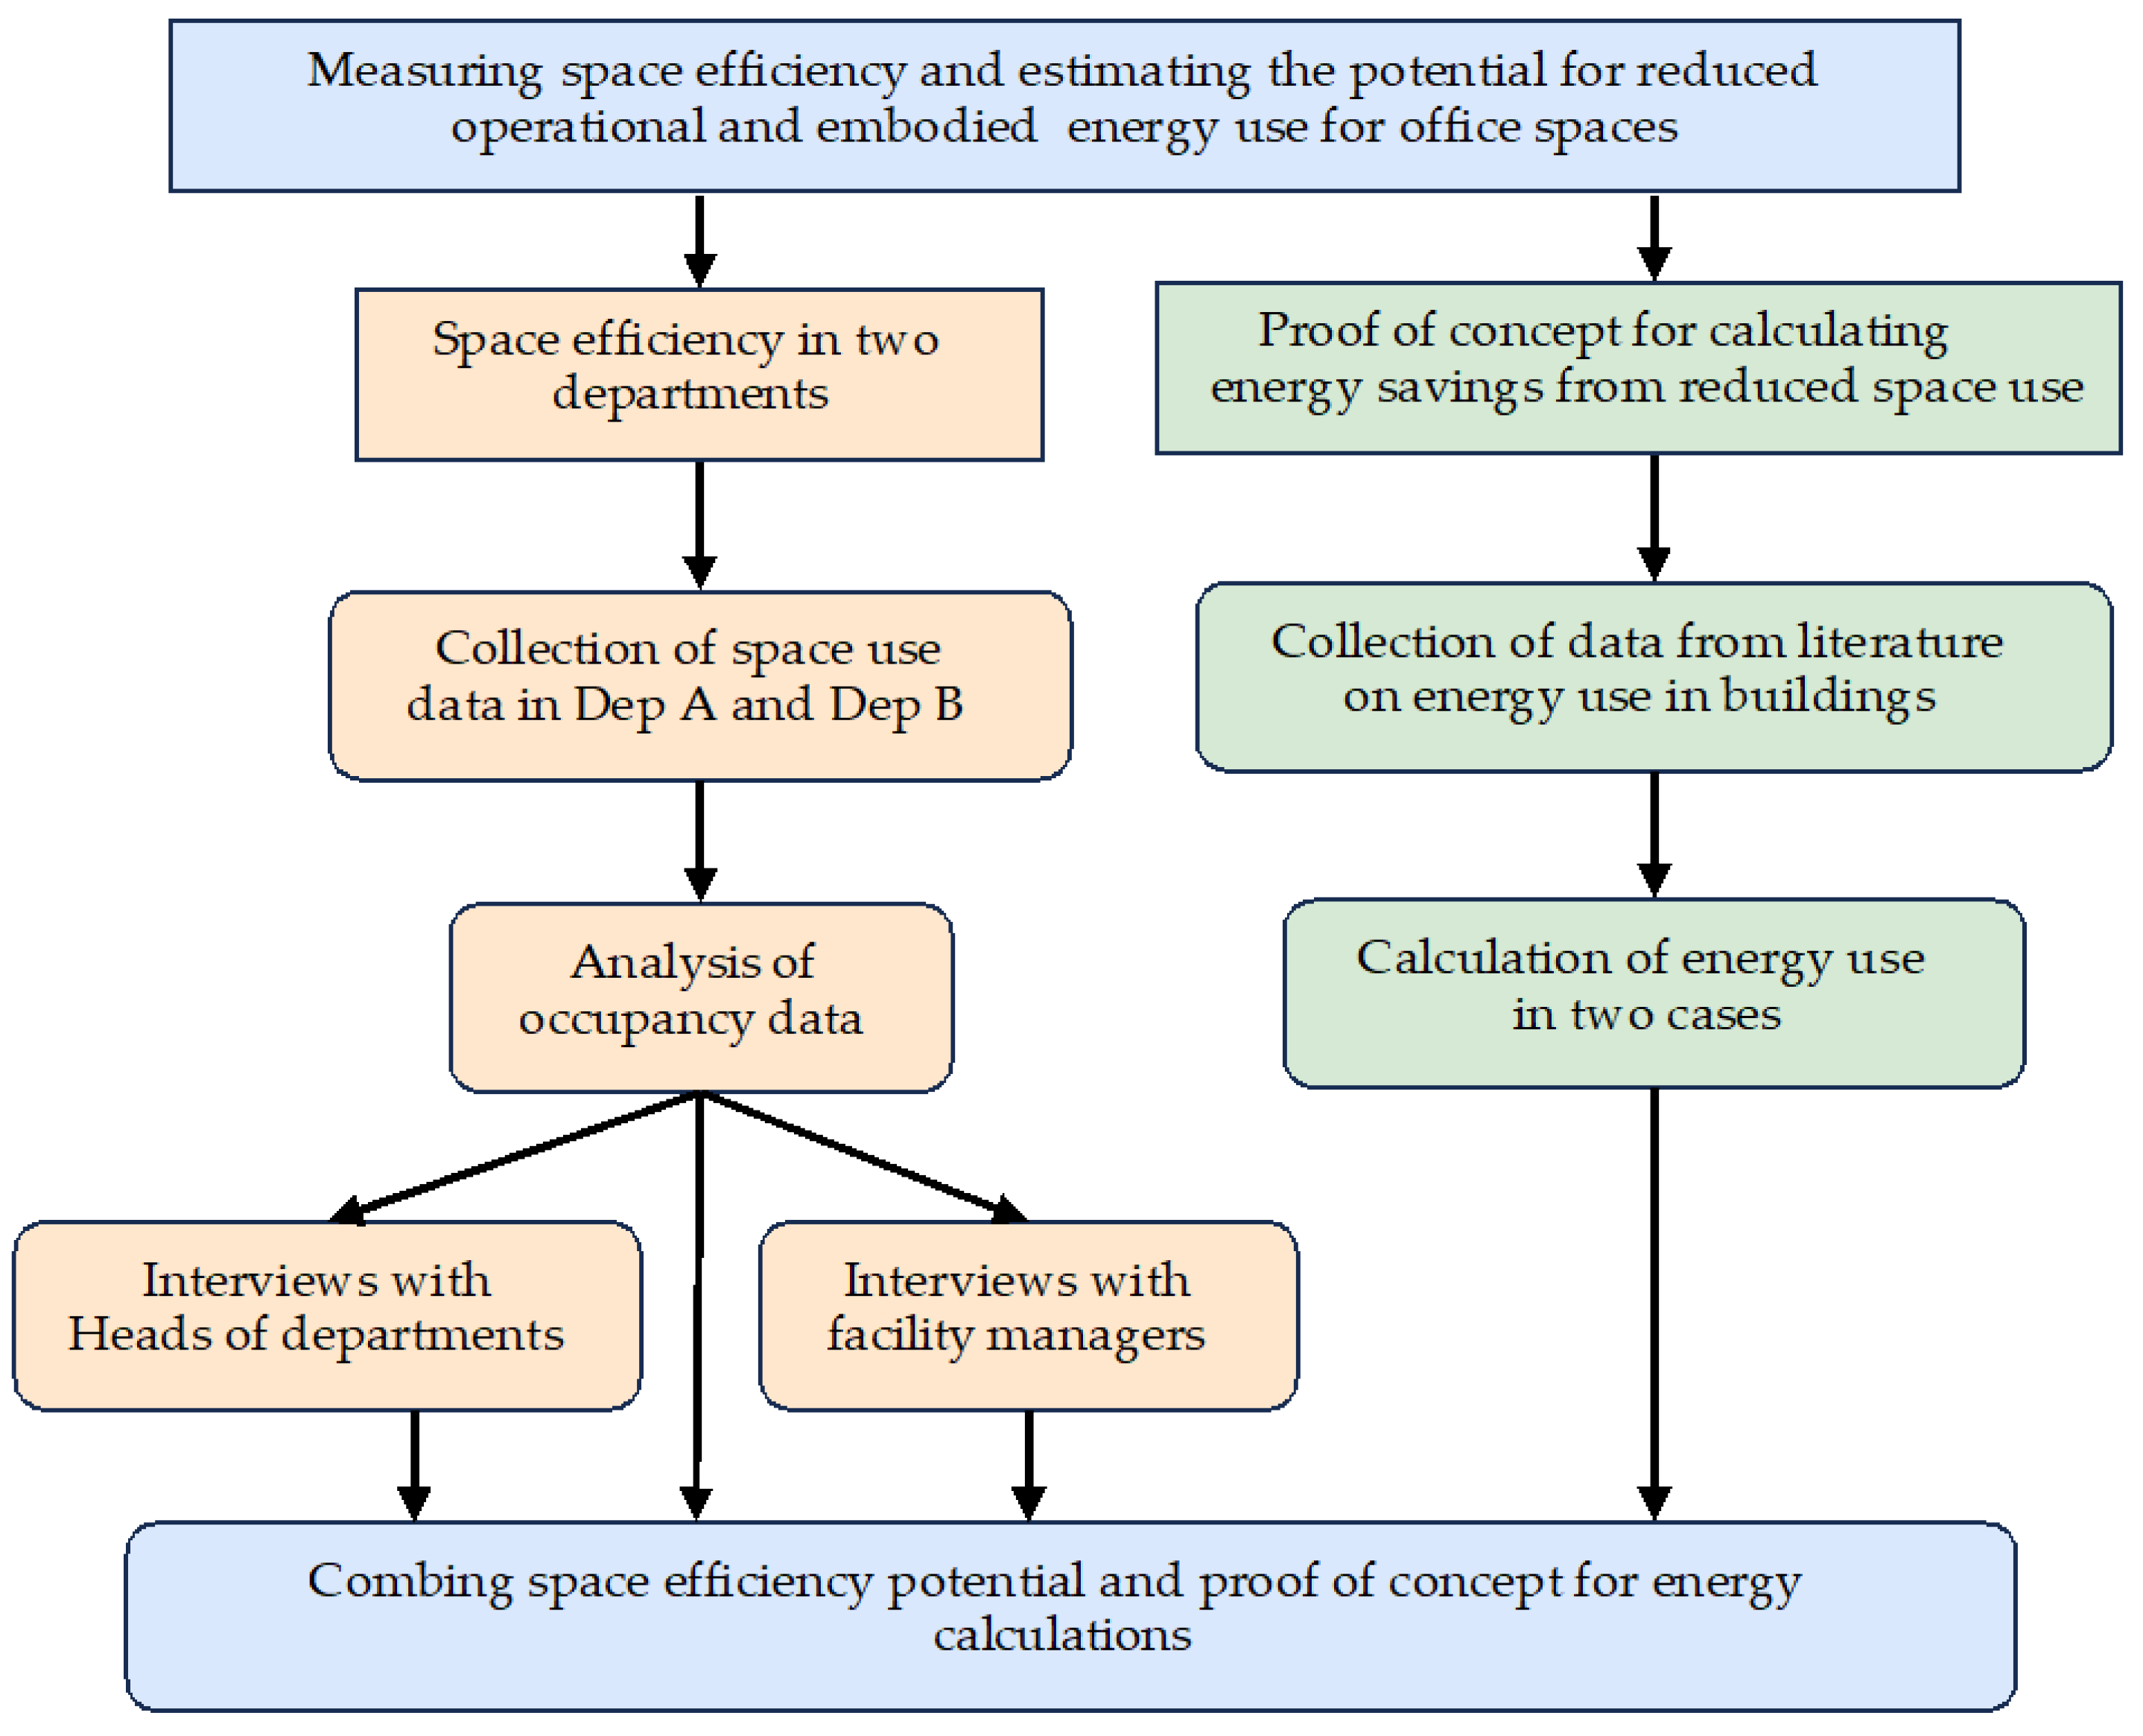
In this paper, we use two departments at KTH Royal Institute of Technology in Stockholm, Sweden, as a case when dealing with the first research question. The second research question is addressed from a principal perspective so that, in practice, the two research questions run more in parallel than in sequence, see Figure 1.
This study is focusing on space efficiency. Additional aspects, such as building design issues and social effects, are important to consider when implementing space efficiency measures, but they are not included in this study. Other delimitations of the study are connected to the fact that it was performed in one specific area, in one specific cultural context, and that there were no detailed sensor results to compare the manual counts with.
In Section 2, we specify the concept of space efficiency and describe the case study. In Section 3, the results of the case study in terms of both measuring space efficiency and interviews are presented. Section 4 is introduced with a description of how space efficiency could change energy use and how the change could be calculated. This is followed by a rough estimation of energy savings potential. Section 5 consists of a discussion regarding the results of the case study, followed by a discussion of the estimation and ends with a discussion connecting those parts. The paper ends with conclusions in Section 6.
2. Outline of the Case Study
The case study consisted of two parts—collection of occupancy data and interviews with managers. Below, we describe the outline of each of them in separate subsections.
2.1. Collection and Analysis of Occupancy Data
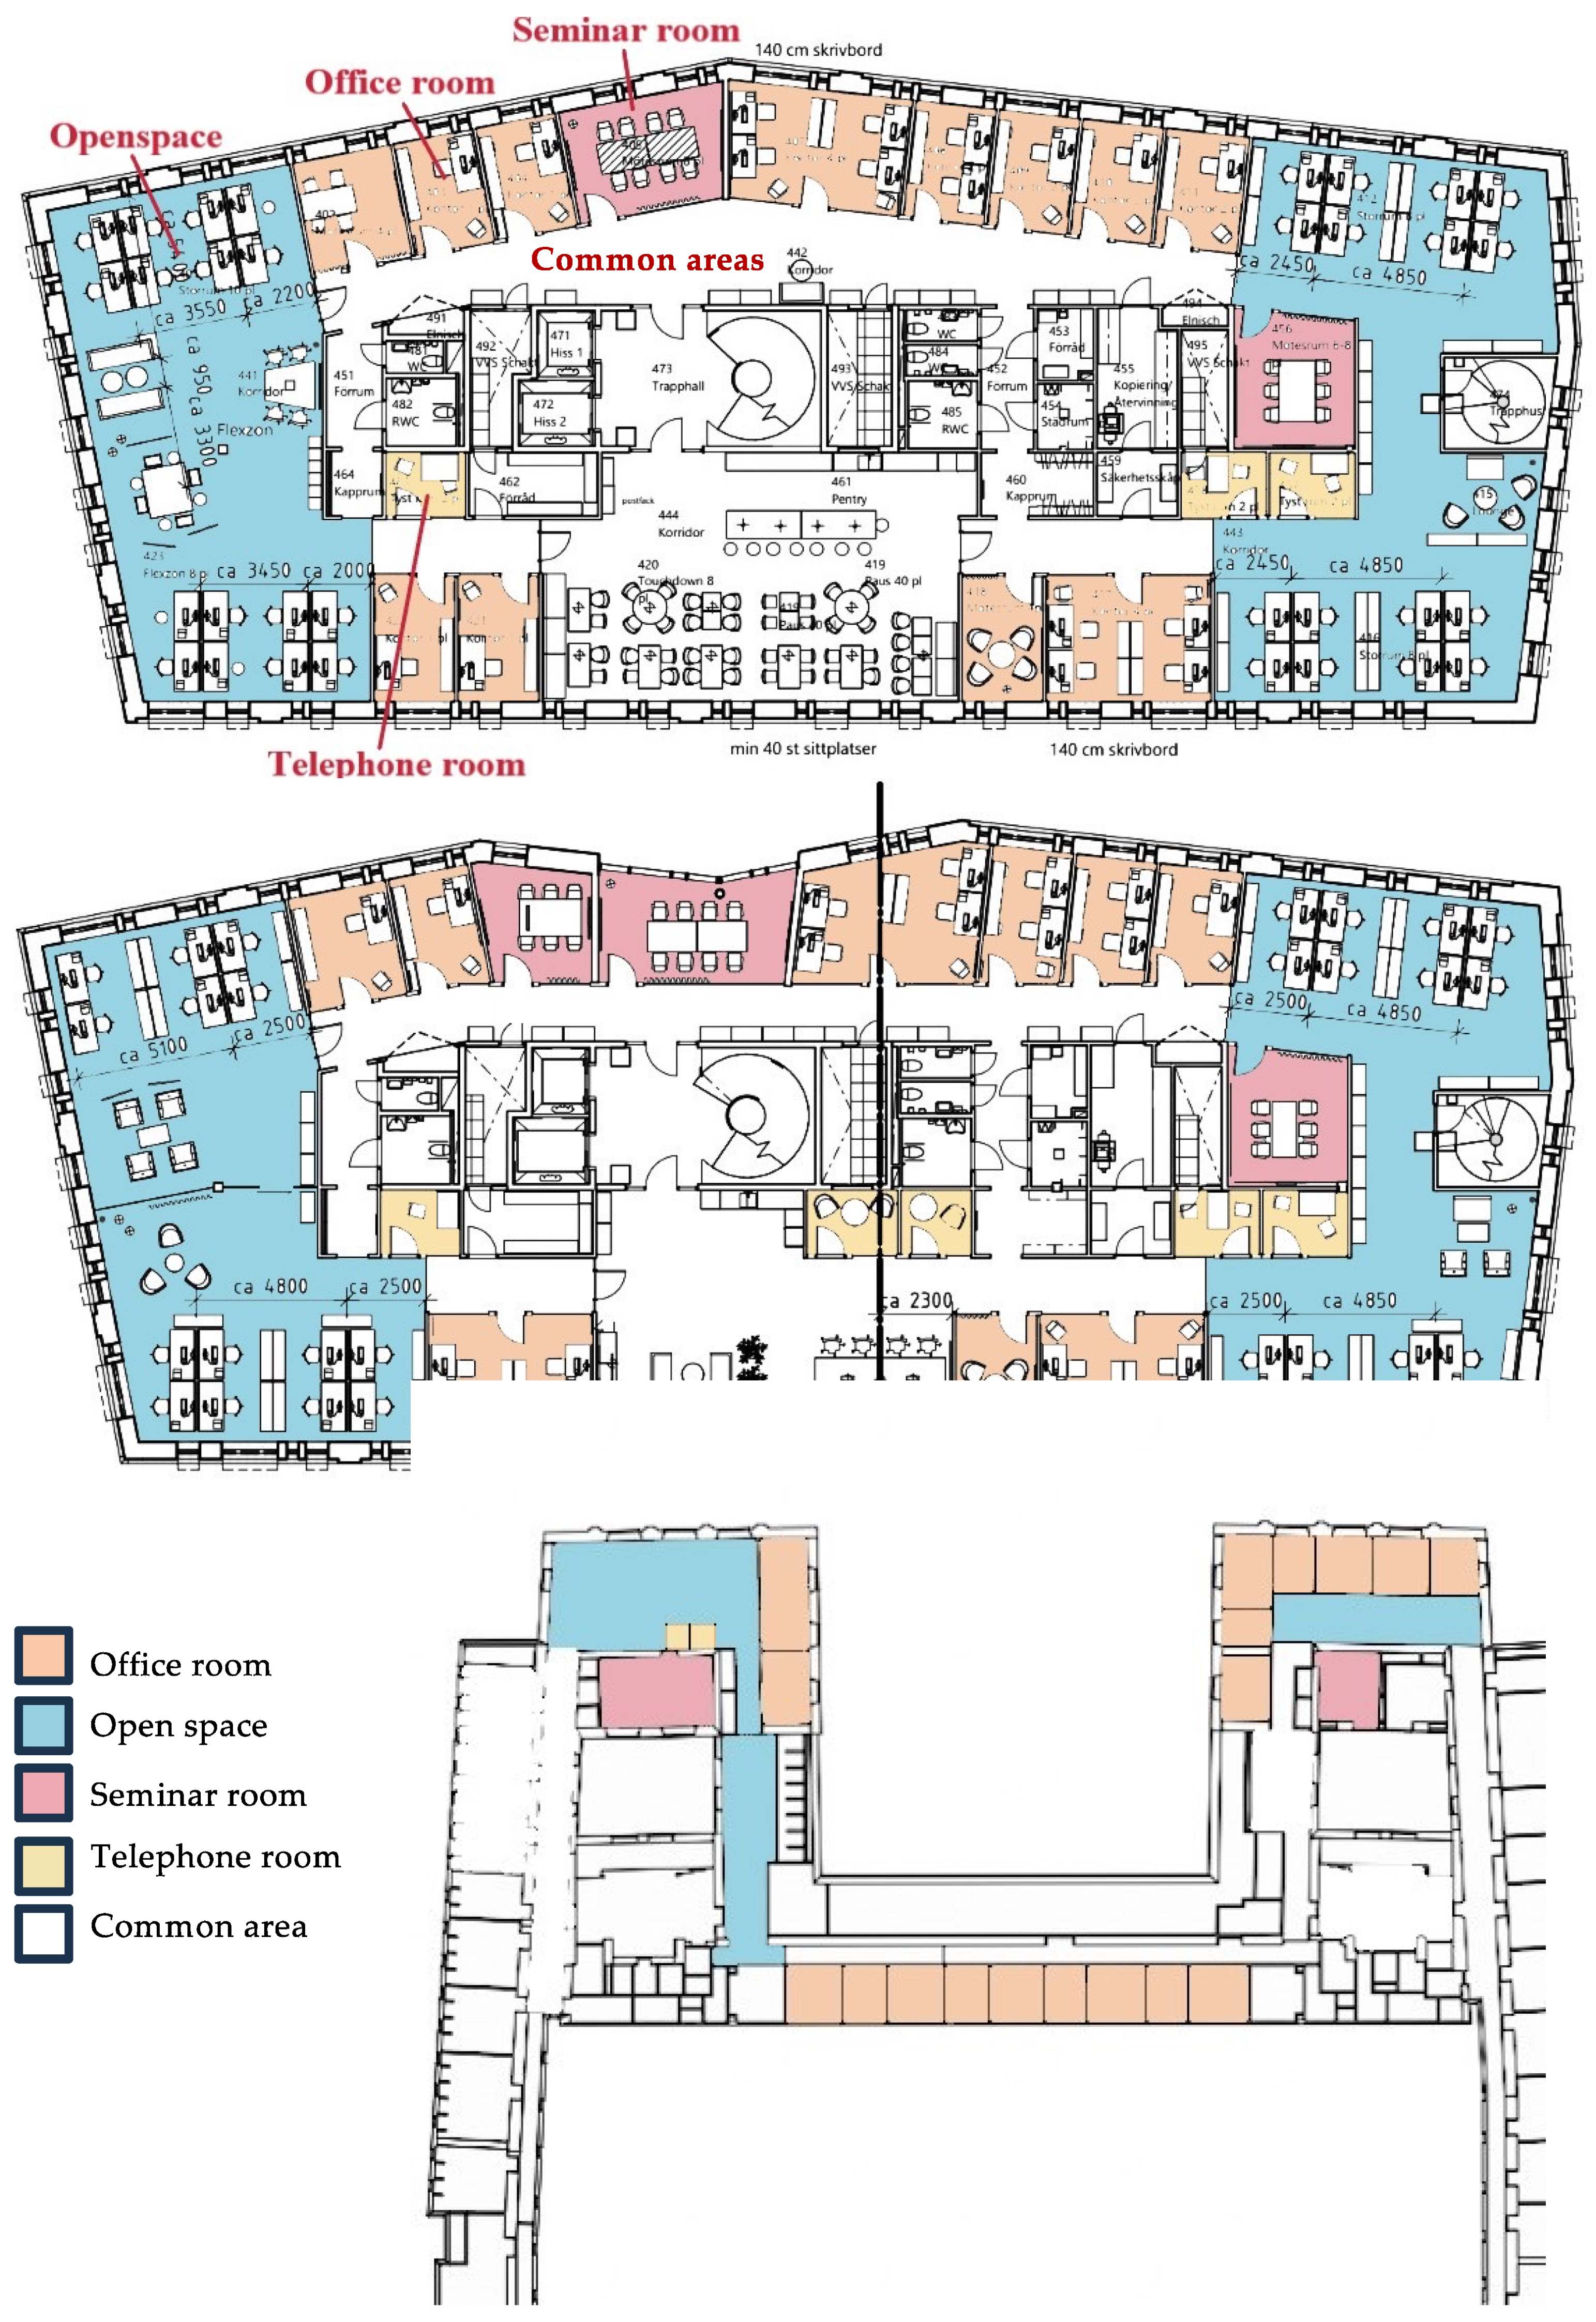
Two departments (Department A and Department B), placed in two different buildings at KTH Royal Institute of Technology in Stockholm, Sweden, were chosen as our cases. This small sample size prevents us from drawing generalisable quantitative conclusions. Still, such case studies are appropriate to gain context-dependent knowledge on an issue, especially in an exploratory study, since closeness to the subject and a narrow scope allow the researcher to become familiar with relevant details of the cases [12]. We collected data on space use via observation according to a predefined schedule. As a starting point for collecting data, we classified the rooms in the target buildings into four types (see Table 1). Figure 2 shows the color-coded floor plans by room type. Department A consists of about one-third of the common areas, such as corridors, kitchens, and toilets, and Department B has about 40% of the common areas. See also photos in Appendix A.
The data collection in Department A was performed by counting the number of occupants in each room during 13 weekdays in October 2019, four times each day, twice in the morning (9:00 a.m. and 11:00 a.m.) and twice in the afternoon (3:00 p.m. and 5:00 p.m.), altogether 52 times. The plan was to have the same number of counts for Department B, but practical reasons prevented that, so we only got 14 measurements from that department.
Next, space use was analysed by calculating indicators of how efficiently space is used. This could be performed by combining our collected data with data on room size (m2) and the number of desks/seats in each room. Space efficiency was defined in three different ways: how often a specific seat is used, how often a specific room has at least one occupant, and how many m2 each user occupies. In a study by the UK Higher Education Space Management Project [13], those three were named:
- Occupancy (%) = #occupants/#seats
- Frequency (%) = #occupied times/#measurements
- Individual space use (m2/person) = room area × #measurements/#occupants
When presenting the results, the focus is on average numbers for the period of measurement.
2.2. Interviews
After the collection and analysis of data regarding space use, five semi-structured interviews [14] were conducted. The purpose of conducting interviews was to hear decision-makers’ opinions on space efficiency and understand what can be done about it. The interviews took about one hour each. Each interview started with a presentation of the results from the measurements and then loosely followed the interview guide presented in Table 2. The interviews were recorded, and notes were taken from the recordings.
The interviewees were the heads of each of the two departments and three managers working with facilities and administration: the sustainability director of KTH, the head of facility management of KTH and one project manager with responsibility for facilities for the school, which Department B belongs to. The latter three are named “facility managers” below.
3. Results of the Case Study at KTH
3.1. Collection and Analysis of Occupancy Data
As mentioned in Section 2.1, the occupancy was measured 52 times in Department A and 14 times in Department B and results were evaluated in terms of occupancy (%), frequency (%) and individual space use (m2/person).
Table 3 provides a high-level summary of the results in terms of Individual space use. The table shows that the maximum and minimum values of the individual space use varied highly between rooms, and it also displays some extreme numbers for office rooms, since there was one office room in each department that was empty at all times of measurement.
Below, we present the results of the measurement in more detail for some of the room types. More results are presented for Department A since more data were collected there.
3.1.1. Office Rooms
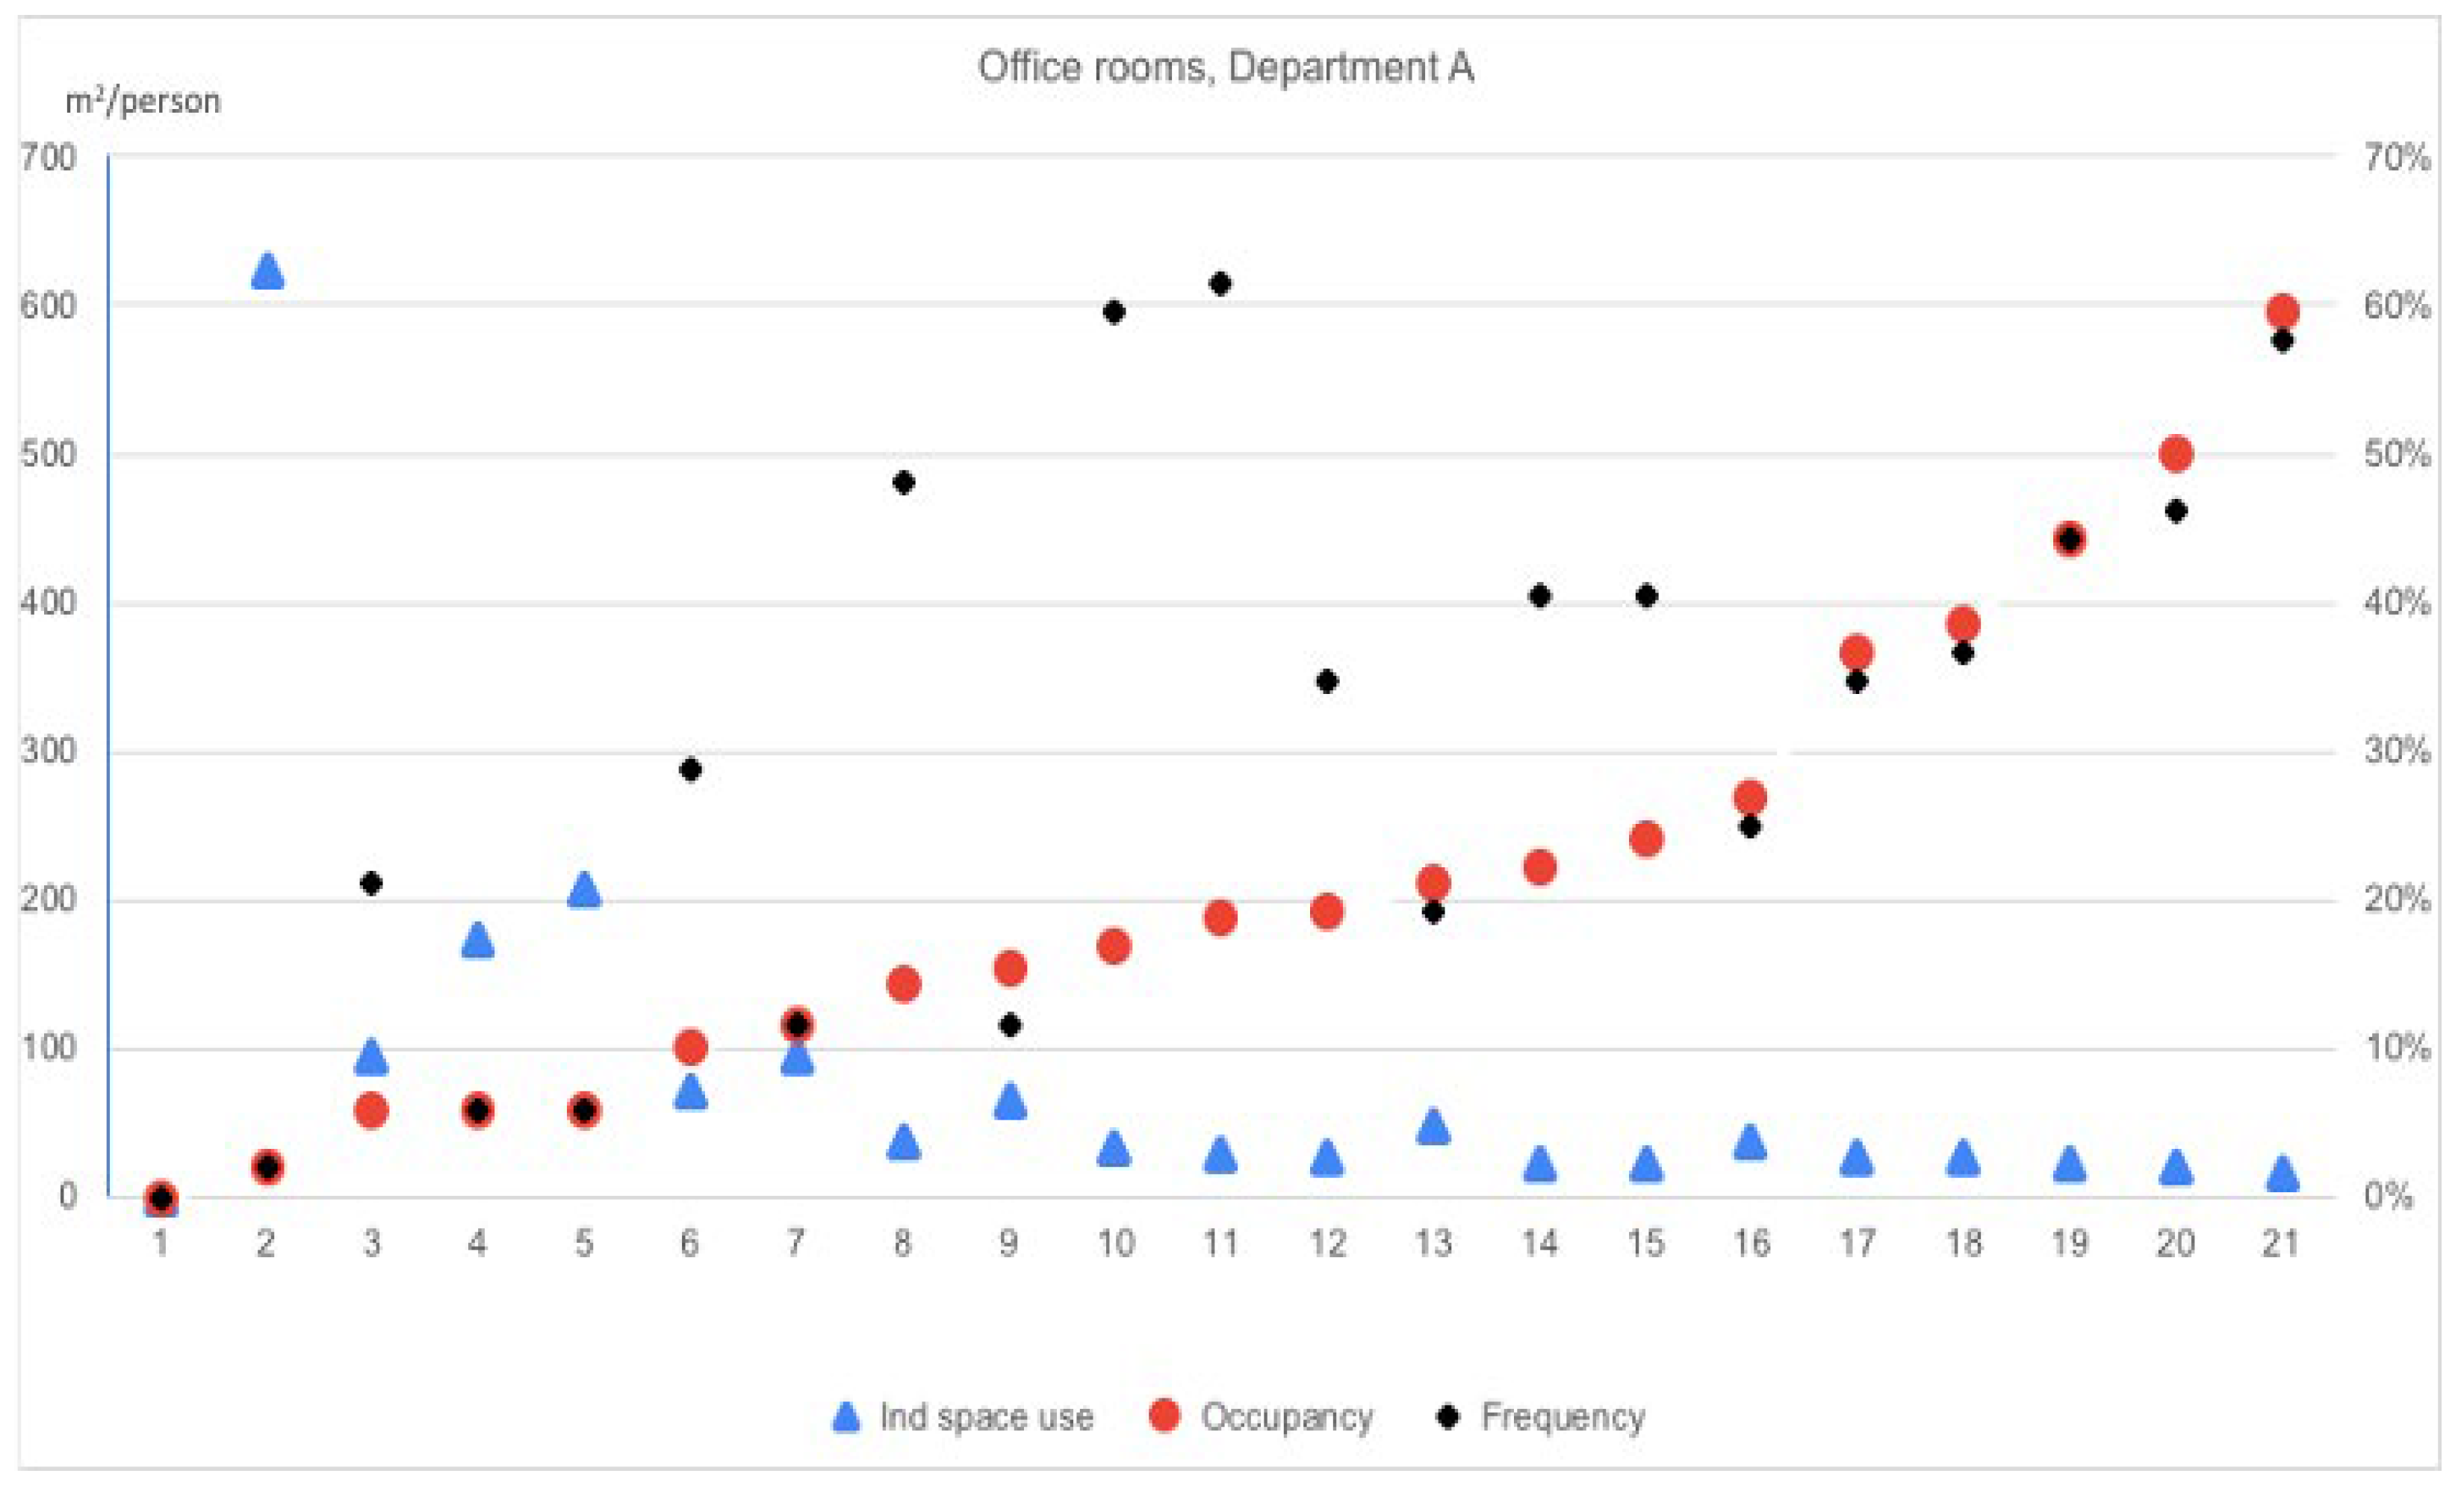
At Department A, one room was not used at all during the time of measurement, and the one with the highest occupancy reached almost 60% (see Table 4 and Figure 3). The average occupancy was 21%, meaning that, on average, only one out of five rooms was used at the time of measurement. 8 out of 21 rooms were unoccupied at all measurements, more than 6 out of the 13 days of measurement. Table 4 shows the distribution of occupancies between the 21 rooms; e.g., it shows that 16 of the 21 rooms had an occupancy of less than 30%. We also checked “overloaded times”, which is the number of times that the number of occupants exceeded the number of seats. This could be when, e.g., a temporary meeting was ongoing in a room and increased the average occupancy for a few specific rooms. Office rooms had an average of 0.4 overloaded times.
Department B had higher occupancy in the office rooms—an average of 35% and a distribution between 0% and 100% (see Table 5). Half of the office rooms had an occupancy below 30%. The “overload” explains the 100% measurement since it comes from one single room being populated by six persons at one time. That room was empty half of the measurements, i.e., the frequency was 50%. With only 14 measurements, the overloaded occasion had a high impact on the overall score.
Individual space use can be explored in a similar way, i.e., taking the size of the rooms into account. The pattern is, to a great extent, the same, with individual space use varying greatly between rooms. One room in each department gets an infinite individual space use since they were not used by anyone. The most efficiently used office rooms reached 16–17 m2/person in both departments.
Figure 3 shows individual space use, occupancy and frequency in each office room in Department A. As expected, a higher occupancy tends to bring with it fewer m2/pers. The frequency is sometimes considerably higher than the occupancy in rooms with more than one desk (room numbers 3, 6, 8, 10–12, and 14–15).
3.1.2. Open Spaces
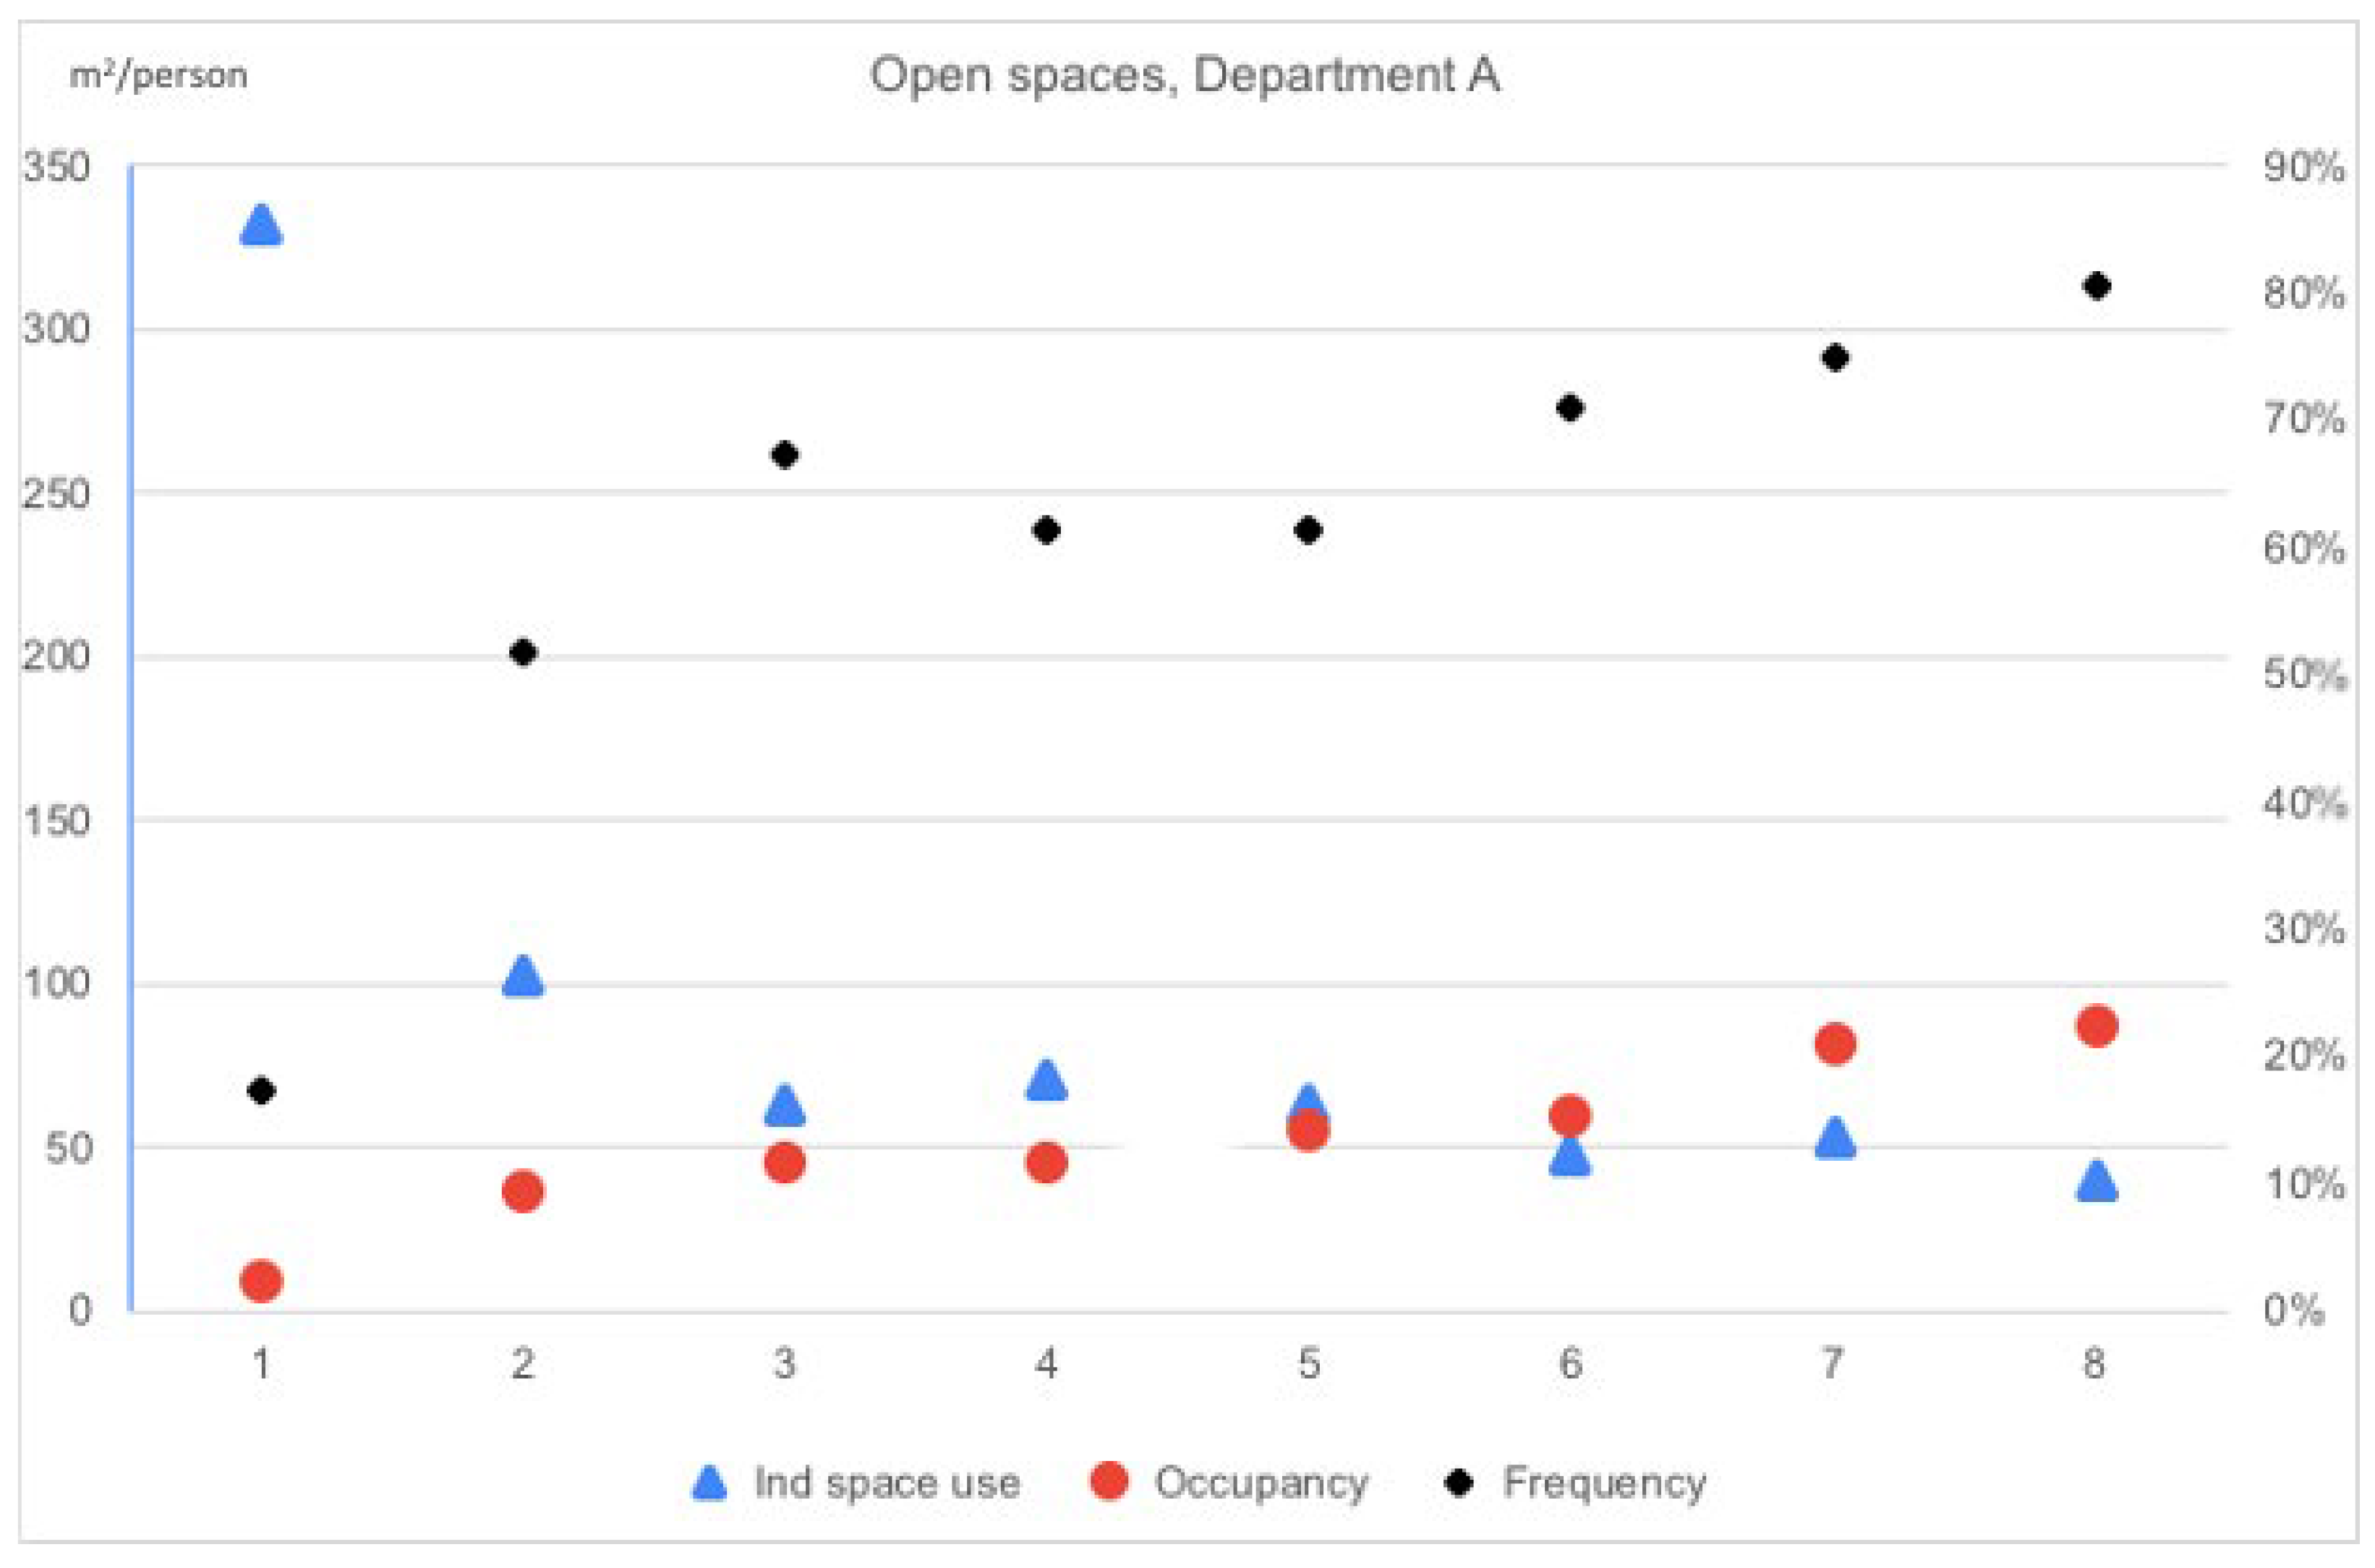
Seven of the eight Open spaces of Department A had eight desks, and one had six, resulting in a total of 62 desks. All the Open spaces had occupancies of less than 30%. The average Individual space use was almost 100 m2/person, with one of the Open spaces reaching 330 m2/pers. In practice, this means that 10 persons were counted in that room with eight desks during the 52 measurements. That room was empty 80% of the time. See also Figure 4.
Department B had three Open spaces with four, five and eight places, with occupancies between 20% and 70% and average individual space use of 10–90 m2. None of the Open spaces in Department B were empty more than 50% of the time, and the one with eight seats was populated at 13 out of 14 measurements.
3.1.3. Seminar Rooms and Telephone Rooms
At Department A, the five seminar rooms with space for 6–8 people were empty on average 70% of the time, and only during one measurement were they all used simultaneously. It was rare that the rooms were used by more than two people (about 3% of the measurements).
The telephone rooms at Department A were empty on average about 90% of the time, and 0–2 rooms were used except for in 3 measurements. At every point in time, there were at least four empty telephone rooms. The data for Department B is sparse, but they do not differ much from the overarching picture from Department A.
3.2. Interviews
This section is divided into two parts, with the first covering the interviews with the two heads of department and the second covering the interviews with the three facility managers.
3.2.1. Interviews with Heads of Department
In the introductory question, we asked for a reaction to the results of the measurements. Neither of the two heads of the department was surprised by the results. One pointed out that it is difficult to compare results because the rooms are used differently in the two departments. Even if they were not surprised by the results, they were not satisfied with them.
KTH rent all its premises from a real estate company. The costs for the rent are pushed down in the administration so that each department carries its own costs for the rooms. In principle, the departments can lower the cost by choosing to use spaces more efficiently and thus rent less space. During the interviews, it became clear that this is not a prioritised area for the managers. They have other more pressing issues to deal with, and making reforms for reduced office space was seen as difficult and potentially risky in terms of creating a bad workplace atmosphere. Often, the costs can be transferred to project budgets with external funding, and that way, they do not directly affect the managers’ budgets very much. The managers also explained that they did not find it easy to reduce the rented space since rooms can only be “given back” to central administration in blocks, not individually. One manager also mentioned that they wanted some slack in order to keep the opportunity to grow, and one said that even if there was a lot of unused space, it was still difficult to find exactly the right spaces, e.g., undisturbed rooms for concentrated writing.
Regarding future strategies, one interviewee considered making more use of space by having more people, in this case, inviting students to use the premises and making the work environment more useful. Another aimed at increasing the staff and room sharing. As for the drivers, one head thought of individualising costs so that each project paid for the (share of) rooms they used. That would also incentivise project leaders to reduce space use. However, with less attractive offices, the head was worried this could reduce the time employees worked at the office. As for the barriers and concerns, one head mentioned a fear of conflicts with faculty not being satisfied with their rooms as soon as room distribution discussions were opened.
3.2.2. Interviews with Facility Managers
Two out of three interviewees from facility management stated that the results were not surprising. The third had expected a higher frequency for office rooms and a lower frequency for seminar rooms. They commented that it is necessary to discuss what to do about the low use of the rooms. One suggested that spaces should be more shared between schools/departments. They had also performed some measurements for the purpose of reducing energy use, and they were aware that the space use was low. In general, the three interviewees in this group found it important to reduce space use, but they also found it difficult to obtain the heads of departments to agree on that.
They had various ideas regarding how space could be used more efficiently, e.g., that it should be possible to use the Open spaces more efficiently partly by being more open-minded in assignments of rooms and flexible desks. A rent structure encouraging more flexible assignments of desks and keeping the flexible desks well-equipped were also ideas under consideration.
It was claimed that (too) independent Heads of Departments worrying about conflicts with conservative faculty is a barrier against change. Another related barrier that was mentioned is the current regulations and traditions where permanent faculty expect dedicated rooms. The facility managers also noted that the fact that only blocks of rooms can be given back to central administration may hinder a more flexible use of rooms.
4. Estimation of the Potential to Reduce Energy Use through Space Efficiency
This section is an exploration of how the benefits of space efficiency measures in terms of total energy use could be calculated. It is primarily a methodological discussion but also includes a first attempt to roughly estimate potential energy savings related to increased space efficiency.
4.1. A Method for Estimating the Potential to Reduce Energy Use through Improved Space Efficiency
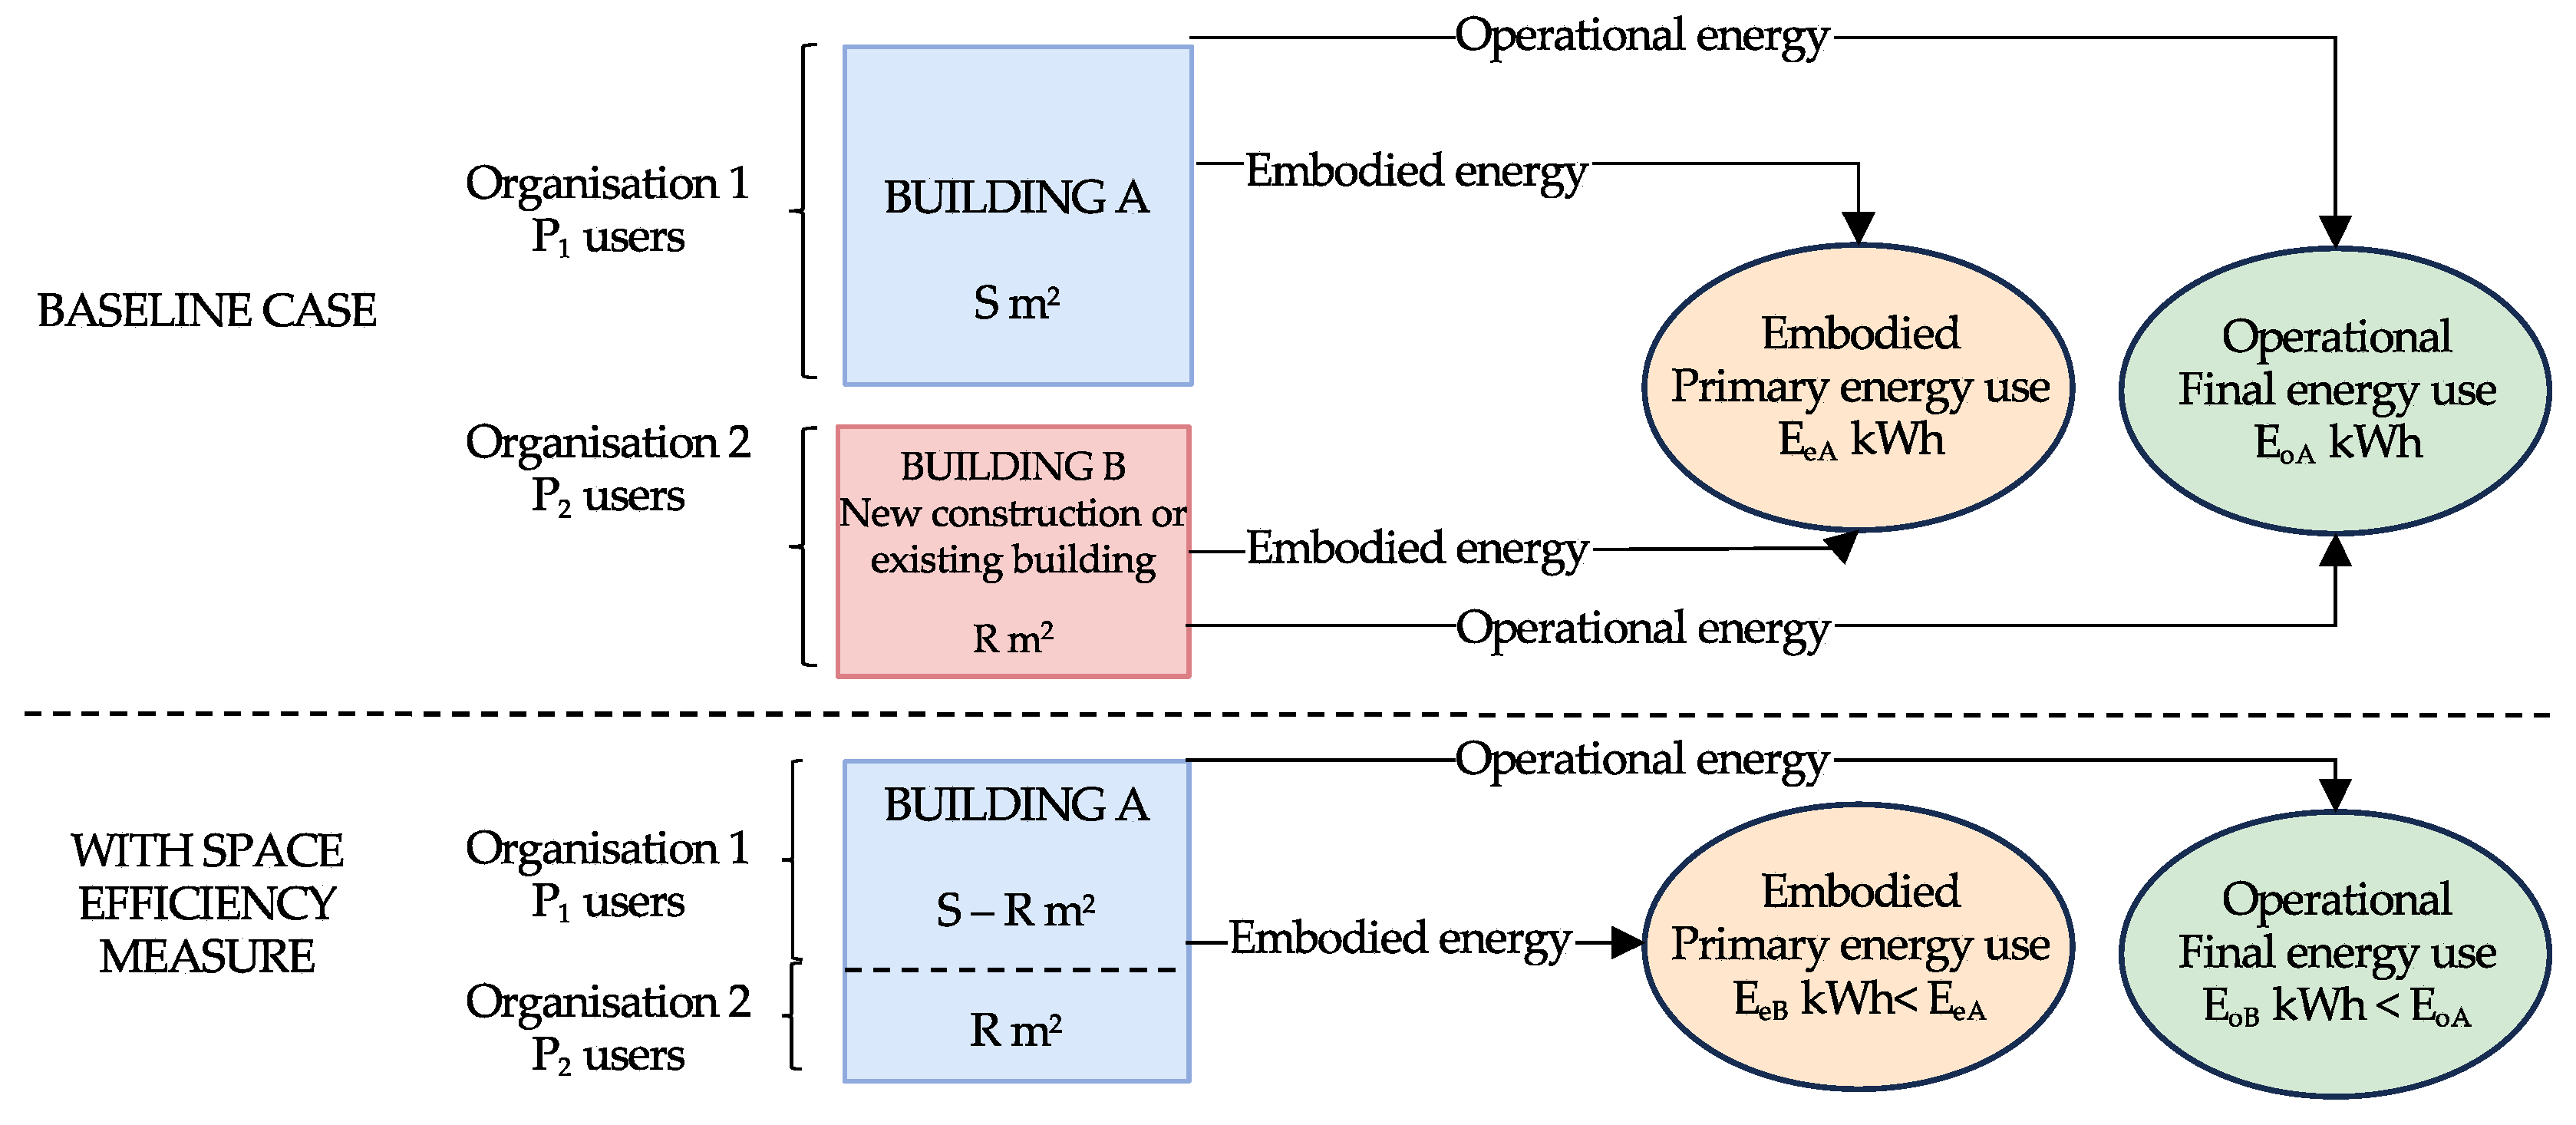
We consider a fictive case of a space efficiency measure implemented in Building A, occupied by Organisation 1. The measure reduces the space needed by Organisation 1 by R m2, leaving the saved space for Organisation 2, creating a shared building. Without the space efficiency measure, instead of renting space in Building A, Organisation 2 would use Building B (either a newly constructed building or an existing building), as illustrated in Figure 5. The estimates of the consequences of this marginal change are differentiated between embodied primary energy in construction materials and operational final energy use. There are two reasons for this choice of approach. On one hand, calculating savings in embodied primary energy for material allows the use of a common unit for different types of materials. Assessments of embodied primary energy are common in scientific literature [15,16,17,18,19]. On the other hand, the use of primary energy to assess operational energy savings would entail very high uncertainties and arbitrary choices. Indeed, the future evolution of the energy supply mix is uncertain, and there are numerous possible ways of defining primary energy factors for heat and electricity [20,21]. Therefore, savings in embodied primary energy are assessed separately from operational final energy.
In order to estimate the potential reduction in embodied primary energy use and operational final energy use due to intensified space use, two energy intensities, PEIe and FEIo are introduced.
PEIe is the embodied Primary Energy Intensity, expressed in kWh primary energy/m2. A measure saving R m2 will lead to a change in embodied primary energy use equal to:
where
- PEIeB is the change in embodied primary energy from the avoided construction and maintenance of Building B (the building that would have been occupied by Organisation 2 in the base case). PEIeB is negative (i.e., corresponds to a decrease in primary energy use). When the alternative for Organisation 2 is an existing building, PEIeB corresponds only to the avoided maintenance of that building.
- PEIeA is the change in embodied primary energy from the necessary refurbishment of the current building in order to accommodate space sharing. PEIeA is positive.
- PEIem represents changes in embodied primary energy from indirect effects on the real estate market caused by the adoption of space efficiency measures (e.g., changes in the types and amounts of buildings constructed). PEIem can be either positive or negative.
FEIo is the operational Final Energy Intensity, expressed in kWh final energy/m2/year. A measure saving R m2 will lead to a yearly change in operational final energy use equal to:
where
- FEIoB is the change in operational final energy from the avoided operation of Building B (the building that would have been occupied by Organisation 2 in the base case). FEIoB is negative.
- FEIoA is the change in operational final energy in the current building. Since occupancy is increasing in the building, the measure is likely to result in an increase in energy use, and FEIoA is positive.
- FEIom represents changes in operational final energy from indirect effects on the real estate market caused by the adoption of space efficiency measures (e.g., changes in occupancy in other buildings, in the share of employees working remotely, etc.). FEIom can be either positive or negative.
In the next section, we present an illustration and a rough estimate of PEIe and FEIo in the case of a space efficiency measure applied to a hypothetical office building in Stockholm, Sweden
4.2. A First Estimate of the Potential to Reduce Energy Use
First, an intensification in the use of office space within an organisation in a city with a growing population, high demand for real estate and extensive new construction is considered. It is thus assumed that the increasing demand for office space is met using new construction. Accordingly, it is assumed that a change in demand for office space will result entirely in a similar change in new construction. Moreover, a change in occupancy in the studied building is not assumed to lead to a change in occupancy in other existing buildings (e.g., the share of employees working remotely remains constant). It is also assumed that background aspects such as prices, technology for new construction and energy supply remain unaffected. Overall, a space efficiency measure that saves X m2 in a building reduces new construction by X m2, so that FEIom = 0 and PEIem = 0. In reality, it is possible that other market dynamics would come into play or that the relationship would be non-linear or exhibit threshold effects. These aspects are disregarded in this first rough estimate.
Determining appropriate values for PEIeB, the embodied primary energy intensity of Building B (the avoided new building), requires assumptions regarding the construction of that building. Embodied energy values per m2 are dependent on the construction materials used [15,22]. Ding [23] indicates a broad range of embodied energy values per m2 for office buildings (all values converted to MWh/m2 for convenience and consistency): 0.95 to 5.3 MWh/m2, with a mean of 2.6 MWh/m2. Ramesh, Prakash and Shukla [16] normalise embodied energy values from a number of case studies per year of building operation and find values ranging from 35 to 140 kWh/m2/year. Aktas and Bilec [24] indicate a range of 0.47 to 2.0 MWh/m2 (with a mean of 1.1 MWh/m2) for conventional houses and 1.2–2.1 MWh/m2 (mean of 1.7 MWh/m2) for low-energy houses. Chastas [17] provides a comprehensive and more up-to-date analysis and finds values ranging from 0.28 to 5.4 MWh/m2 (mean of 1.8 MWh/m2) based on a review of process LCAs, whereas values found in hybrid LCAs range from 5.0 to 9.2 MWh/m2 (mean of 7.0 MWh/m2). The highest values are found for net zero energy buildings (nZEBs). A newly constructed building might have somewhat higher embodied energy values per square meter than the average existing building due, e.g., to an increase in the amount of insulation materials used. It should also be noted that these values are based on attributional assessments and that the embodied energy content of materials in consequential assessments might use different values. Based on the references above, a reasonable default value and first estimate of PEIeB would be in the order of −2 MWh/m2.
To this value, changes in embodied primary energy due to maintenance and replacement of materials over the building’s life cycle should be added. Dixit [20] provides a review of studies of embodied energy from maintenance and replacement processes. The studies reviewed in Dixit [20] estimate that this yearly recurring embodied energy corresponds to 0.2–1.8% of the initial embodied energy (mean of 0.53%). The avoided construction of a new office building will also avoid future maintenance and replacement. However, it can be expected that maintenance needs will increase in the shared building as wear and tear increase with occupancy. Moreover, the shared building might need to be retrofitted in order to welcome more users in shared spaces. This retrofit will entail an additional use of primary energy due to the partial replacement of internal walls, finishes and furniture, as represented by the parameter PEIeA. Treloar et al. [25] estimate that internal walls and wall finishes in office buildings amount to about 0.3 MWh/m2 embodied energy on average. During a retrofit for space sharing, only a fraction of this might need to be replaced. It is assumed the net effect of retrofit, avoided maintenance in an additional building and increased maintenance in the shared building is small enough not to influence the estimate above. With both PEIeA, and PEIem being small in relation to PEIeB, a reasonable rough estimate for is −2 MWh/m2.
FEIoB and FEIoA both represent changes in final energy use for heating, cooling, facility energy use (ventilation, lighting in common areas, elevators, etc.) and users’ energy use (appliances, etc). FEIoB represents a decrease in energy use due to the avoided operation of new buildings, and FEIoA represents an increase in energy use in the studied building caused by increased occupancy. It is assumed that the user energy use components of FEIoB and FEIoA cancel each other out (any increase in energy use from appliances in the studied building due to higher occupancy corresponds to a similar avoided energy use from appliances in another building). Regarding heating, hot water and cooling, official Swedish statistics indicate that offices built during the last decade use an average of 128 kWh/m2/year [26]. Regarding facility energy use, the same statistics indicate that the total facility energy use of buildings in Sweden is about 2360 GWh per year, and the total surface of office buildings is 32.3 million m2. This yields a facility energy use of about 73 kWh/m2/year. Thus, the changes in operational final energy from the avoided operation of an additional building would be about −200 kWh/m2/year, and a reasonable first-order estimate for changes in final operational energy from reduced floor space would be = −200 kWh/m2/year.
It is possible that an increase in occupancy would lead to a change in heating or ventilation needs in the shared building, but it is here assumed that the resulting effect is small enough that it does not affect the estimate.
In sum, the estimated embodied primary energy savings would be in the order of 2 MWh/m2 and operational final energy savings in the order of 200 kWh/m2/year when the alternative is a new building. If the alternative is not a new building but an existing empty building, the embodied primary energy reduction would be zero, and the yearly operational energy reduction would be similar. The numbers are rough estimates proposed here to support a discussion of the benefits of space efficiency measures with policymakers and decision-makers.
5. Discussion
As stated in the introduction, the objective of this study is to find out how opportunities for reducing space use in office buildings can be identified, to investigate how the benefits in terms of energy savings from space efficiency measures could be calculated and to give a first estimate of such values. In the following, we first discuss the results from the two departments at KTH, both in terms of the actual data collected and in terms of the interviews. That is followed by a short discussion of the method used to collect data. In Section 5.3, we discuss the estimation of potential energy savings from space efficiency measures, and in Section 5.4, we combine the KTH measurements with the estimated potential and discuss what this implies.
5.1. Space Use Measurements
The results regarding the measurements of space use can be discussed in terms of the quantitative results and in terms of the reactions of managers to the results.
When it comes to the quantitative results, the numbers regarding space use are low, indicating a heavy “space waste”, leading to a waste of resources at both investigated departments. We have not investigated data for other buildings within KTH or for other buildings. However, with office rooms having an occupancy average of 20% respectively 35% during office hours, in the two departments, and the open spaces being to a high degree empty spaces, there seems to be a large opportunity to save resources from just those two departments. There is a huge variation in how many office rooms are used, and seminar rooms and telephone rooms are often empty. This indicates that there would be opportunities for employees to find entirely calm spaces if needed.
In the interviews, the interviewees claimed that the measurement results were not unexpected. Still, we identified two very different perspectives on space use. The heads of department seemed uninterested in prioritising efficient use of space for several reasons: not very strong economic incentives, other more pressing issues to spend time on and a reluctance to confront the topics as they might be sensitive in relation to staff. By contrast, the facility managers were motivated to plan the intensification of space use. In short, it seems like those with the most power regarding the use of space, the heads of department, have little incentive and/or interest to deal with the issue. This makes it hard to see how to make change happen, but a few potential opportunities identified in the interviews were: (i) to highlight the costs for the facilities, creating incentives already at the project leader level for efficient use of spaces, (ii) to make it easier to stop renting smaller number of rooms, combined with more flexible room use between departments (iii) an external pressure on heads of department so that it gets harder to “hide” costs for facilities in externally funded budgets, or tougher requirements from top management to stop wasting space.
5.2. Measuring Space Use
To compare and evaluate the data collection method, we identified a number of alternative ways of measuring space use in offices in the literature. They are described in Table 6.
The way of measuring occupancy in our study was simple—just counting the number of people in each room a certain number of times. This simplicity brings with it some concerns, e.g., people could have changed their behaviour when they were informed about the measurements, risks for miscounts, and hard-to-count rooms where it is difficult to look inside. Moreover, the method is evidently less exact than continuous measuring.
On the other hand, with the three indicators of space use, it was possible to identify the low occupancy with data collected in a simple way and at a very low cost. The indicator of space efficiency introduced the viewpoint of room area into the discussion of occupancy by taking space per person into account.
5.3. Estimating Potential to Reduce Energy Use through Intensified Space Use
In the estimation of the potential to reduce energy use via more efficient space use, assessed operational final energy and embodied primary energy were analysed separately. On one hand, using primary energy is a commonly used and reliable way of comparing the energy embodied in different materials. On the other, it was deemed necessary to assess final energy rather than primary energy for the operational part in order to provide a result that does not depend strongly on assumptions about the energy mix and other uncertainties related to primary energy factors for heat and electricity. A disadvantage is that it is not possible to make a direct summary of the two parts of our calculation.
In the case of an office building in Stockholm, the energy savings from a space efficiency measure would come mainly from PEIeB and FEIoB, i.e., the avoided construction, maintenance and operational energy use of a marginal new building. When it comes to our estimates, FEIoB may have been overestimated since modern, highly insulated buildings may have very low heating needs. On the other hand, PEIeB may have been underestimated since highly insulated buildings tend to have high embodied energy values.
One sensitive assumption in the calculation states that a reduction in space use by R m2 in one building also gives a total reduction in the demand for R m2. The numbers are rough first estimates that need to be used with care, but they should be useful, e.g., for estimating how much energy can be saved when an organisation starts using space more efficiently. However, in practice, total savings will be dependent on how the saved space is used and how much the demand for office space is actually reduced. For instance, it cannot be said that just because a room is suddenly used by two people instead of one, half the space has been saved elsewhere. Moreover, our cases focused on rooms for work activities without addressing supporting facilities and infrastructure such as toilets, fire exits, parking spaces, etc. This implies an assumption that the use of these common facilities would be intensified to the same degree as the work areas. In practice, office spaces need to fulfil minimum requirements in terms of, e.g., accessibility, fire safety, parking spaces, bathrooms, etc., to accommodate all users. This poses practical challenges to space efficiency measures [6], at least in cases when final space efficiency reaches higher numbers than the premises were originally designed for.

Table 6.
Alternative methods of measuring occupancy/occupant activities.
| Method | Description | Strengths | Weaknesses |
|---|---|---|---|
| Survey (manual measurement as in this paper) | - | No special equipment required Little measurement time Cheap | Impossible to collect continuous data Risk to disturb occupants |
| Survey (questionnaire/interview) [27] | Asking occupants about their use of offices | No special equipment required High flexibility | Data depends on how occupants interpret questions Possible errors in false responses |
| Survey (diary) [28] | Asking occupants to record their activities | No special equipment required High flexibility | Requires effort of occupants Difficulty in obtaining accurate data |
| Motion sensor [29] | Detecting the presence and movement of occupants | Large sample size Opportunity to obtain exact measurements. | Adjustment required (positions/angles/sensitivity of sensors) Costly Difficulty in measuring occupancy in a shared space |
| RF-based technology [29] | Detecting the position of occupants using radio frequency | Large sample size Flexibility for deployment Wide communication range Opportunity to obtain exact measurements. | Equipment and preparation required (all the occupants need to be equipped) Costly in long-term |
| CO2 sensor [30] | Measuring occupancy based on CO2 concentration | Large sample size. | Data on the ventilation systems required Calculations needed afterwards Difficulty in obtaining accurate data |
| Virtual sensor [29] | Measuring occupancy using general sensors (e.g., energy meters) | Large sample size Enable non-intrusive measurements Usually no special equipment required | Risk for errors due to the behaviour of occupants Calculations needed afterwards Difficulty in obtaining accurate data |
The results are highly dependent on assumptions about the consequences of a marginal reduction in the demand for office space. In the case of an office building in a city where the demand for office space is higher than the available supply, the demand for more office space would lead to the construction of new offices, and a reduction in demand would translate into a similar avoided construction and operation of a new office building, without affecting occupancy in other buildings. The results would be different in cases where new construction is driven by supply rather than demand or where there is plenty of empty office space already available, in which case a reduction in demand might not affect new construction. The office vacancy rate in Stockholm is about 6% and varies between 3–13% in other large European cities, which indicates that there is a significant amount of empty office space already available [31]. When looking deeper into the effects of more efficient use of space, the time scale should also be considered. The effect on the market in terms of avoided construction would not be an immediate effect of increased space efficiency but would be a factor affecting the real estate market over time.
Structural changes in terms of changed ways of working and behavioural changes are not included in our estimate. It can be speculated that with more intense use of offices, more people would prefer to work from home, which might lead to people using more space and energy at home, moving further away from their offices and moving into larger homes. On the other hand, it could also lead to a general acceptance of shared spaces, spreading this idea and causing more organisations to start to improve their space efficiency.
In this paper, such effects have not been estimated, but for policymakers and researchers using the numbers in this paper, it is important to have those potential effects in mind and either try to deal with them through, for example, policy measures or try to estimate them.
5.4. Combining Energy Potentials with Space Use Investigations
As stated in the introduction, the objective of this study is to find out how opportunities for reducing space use of office buildings can be identified, to investigate how the benefits in terms of energy savings from space efficiency measures could be calculated and to give a first estimate of such values.
In Section 3.1, results regarding the space use of two departments at KTH were presented. Below, the results are used to discuss possible space savings of Open spaces and Office rooms in Department A.
Among the 62 desks in the eight Open spaces, the average total number of used desks was 8.1, which is about one person in each Open space on average. The highest measurement was 21 users, but the second highest was 14. Thus, with no individual desks, three Open spaces with 24 places would have covered the need even at maximum load. Using only half of the 8-seat Open spaces would give 32 places, thus giving some margin even at maximum load. This would still not be very highly used since, on 51 out of 52 occasions, there would still be less than one person per two desks. Thus, halving the number of Open spaces should be possible, provided the fixed-desk system is not kept.
The 39 office spaces were, on average, occupied by 7.1 persons, with the highest measurement being 14. Halving from 39 to 20 should thus not be impossible, provided people give up their fixed places. This reduction might be considerably more difficult to implement since people in the office rooms tend to be higher in the hierarchy than those in the Open spaces, and they might also be more dedicated to their dedicated rooms.
Altogether, this shows that halving the open spaces and office rooms would still not lead to any crowdedness. It seems reasonable to assume the same for telephone rooms and seminar rooms. The data assembled regarding the two departments state that Department A has an overall floor area of about 1200 m2 and Department B about 800 m2. Altogether, this adds up to 2000 m2. If half of this area could be saved just by a more flexible use of space, that would be 1000 m2. This comparison assumes that the common areas (see Figure 2) are reduced by the same share as the working areas. In this case, our case study buildings were dimensioned to accommodate a larger number of users than currently, which suggests that the buildings could be used more intensively without infringing on minimum standards for parking spaces, fire safety or other common facilities.
Looking at the numbers from Section 4.2, this would correspond to savings in the order of 2000 MWh in primary embodied energy due to the reduced need for constructing a new building and savings in final operational energy in the magnitude of 200 MWh/year. The avoided construction of a new building is mainly valid in cities with a growing demand for office space, and this calculation is merely an example. It should be noted that the estimated savings in final operational energy are not linked to the energy performance of our case study buildings but rather to the average energy performance of newly constructed office buildings in Sweden since space efficiency measures are assumed to trigger a chain of relocations. In other words, the savings are linked with the avoided operation of a marginal new office building, which would have to be constructed and operated to accommodate the rising demand for office space in the absence of space efficiency measures.
6. Conclusions
The first research question in this paper was concerned with what can be understood about an organisation’s space efficiency by just counting the use of the rooms and interviewing the managers. A simple method for measuring space efficiency–manual counting of the use of the premises on a limited number of occasions during one month was developed and demonstrated. This is much cheaper than existing technical solutions with sensors. It can also be implemented by any organisation without much planning. Despite the simplicity and the low sample size, the measurements gave strong indications of a huge waste of space within two departments of KTH. In response to the first research question, we find that simple but well-structured observations of an organisation’s use of premises give a rather good understanding of how space is used. The results clearly showed a very low degree of space use. Even though the precision in counting heads at distinct points in time is not high, the method still gave a strong indication that it would have been hard to be followed as quickly by using other means of measuring presence.
Through interviews with Heads of Departments and Facility managers, we got a strong indication of the reasons behind the waste of space—the incentives for using space efficiently are small for the decision-makers, and the costs in terms of time and trouble are not seen as small. We also identified quite different priorities for space efficiency in the organisation. We conclude that not many interviews in the organisation were needed to obtain indications of what kind of resistance might be causing the waste of space.
We conclude that even with limited effort, it was possible to understand important things regarding space use in the two departments. Using manual counting, we could identify that the level of use was very low. Additionally, using a limited number of interviews, we could identify reasons behind space waste. Thus, identifying space waste does not necessarily require an advanced or expensive method.
The second research question was concerned with how potential savings of energy through intensified space use could be calculated, what a first approximation of the size of the savings could be, and the main considerations in such a calculation. In the paper, we developed a proof of concept for how to calculate the energy savings from reduced need for space. The calculation is based on a division of energy use in primary energy intensity for embodied energy and final energy intensity for operational energy and on arguments regarding alternative use of the saved space. The proof of concept leads to a rough estimate of the potential energy savings of 2 MWh/m2 in embodied primary energy intensity (when a new building is an alternative) and 200 kWh/m2/year in final energy intensity. Despite being based on rough estimates, those numbers are reasonable to use as starting points when looking at opportunities for saving energy by using space more efficiently. Furthermore, the ability to put a number on savings linked with space efficiency helps highlight the relevance of such measures and facilitates discussions about the relevance of space efficiency from an environmental point of view since aspects that are quantified and monitored often receive considerably more attention in decision processes [32]. The main considerations when calculating the potential savings are how to deal with the alternative use of the space, the hypothetical construction type for the alternative building and the hypothetical operational energy use of the alternative building.
The generalizability of the results in this paper might be seen as limited due to the highly specific case—two university departments in Stockholm. However, the part on exploring what can be learnt through a simple count of room use and a number of interviews should be useful for more or less any office building. Evidently, both the quantitative results regarding space use and the responses to the interviews will be different, but this paper has shown what kind of results can be obtained from that kind of method. The other part of the study, finding a first approximation for energy savings potential, is also generalisable to a certain degree. The numbers presented here should be relevant for countries with energy use in the building stock similar to Sweden’s. For other countries, it should be possible to use the method for making a rough estimate, but specific data would need to be adjusted to the country in question.
Further research is needed on how to overcome the identified reasons for space waste and to identify further reasons for such waste. Moreover, more quantitative studies of changes in energy use when using space more efficiently would be welcome. This could lead to further understanding both specific cases and effects on a broader systems level. Additionally, such understanding could be one important input to future office design decisions.
Author Contributions
Conceptualization, M.H.; Methodology, M.H., Y.H., N.F. and Y.K.; Formal analysis, M.H. and N.F.; Investigation, Y.H.; Writing—original draft, M.H., Y.H. and N.F.; Writing—review & editing, M.H.; Supervision, M.H. and Y.K.; Project administration, M.H. All authors have read and agreed to the published version of the manuscript.
Funding
Part of the research by MH was funded by the Swedish Energy Agency.
Institutional Review Board Statement
Not applicable.
Data Availability Statement
The data presented in this study are available on request from the corresponding author.
Conflicts of Interest
The authors declare no conflict of interest.
Appendix A. Photos from Department A and B
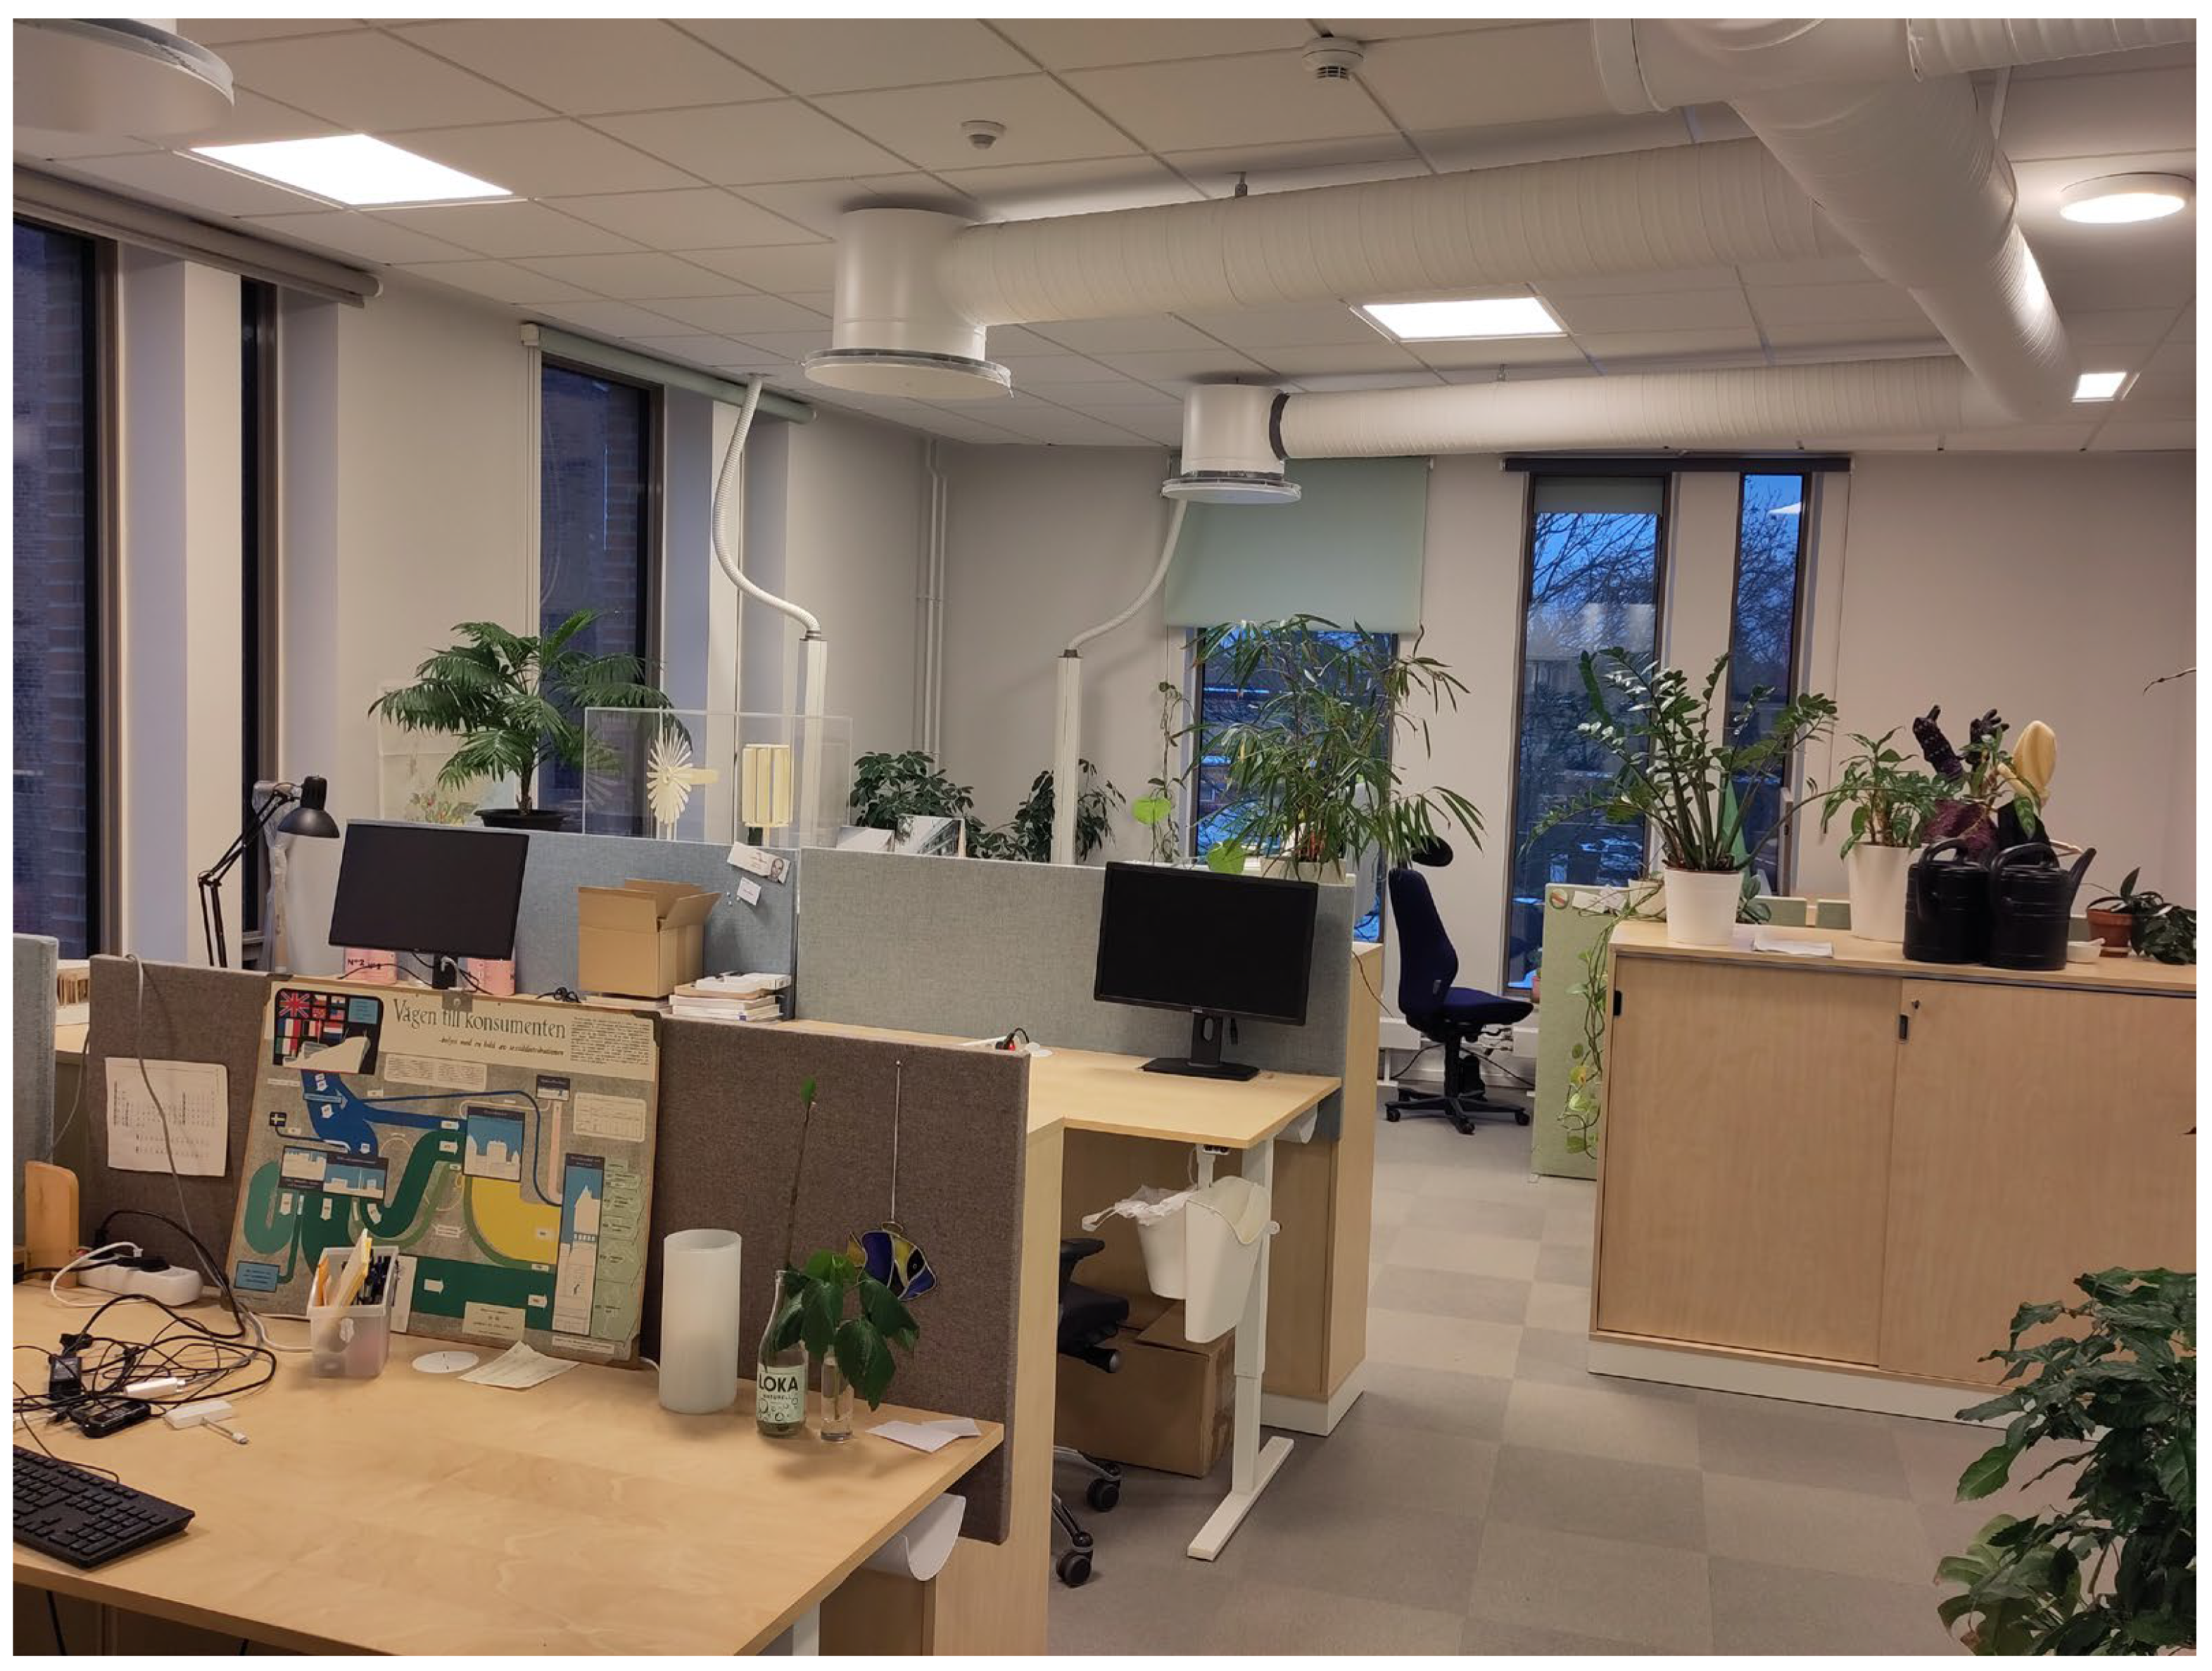
Figure A1.
An Open space at Department A.

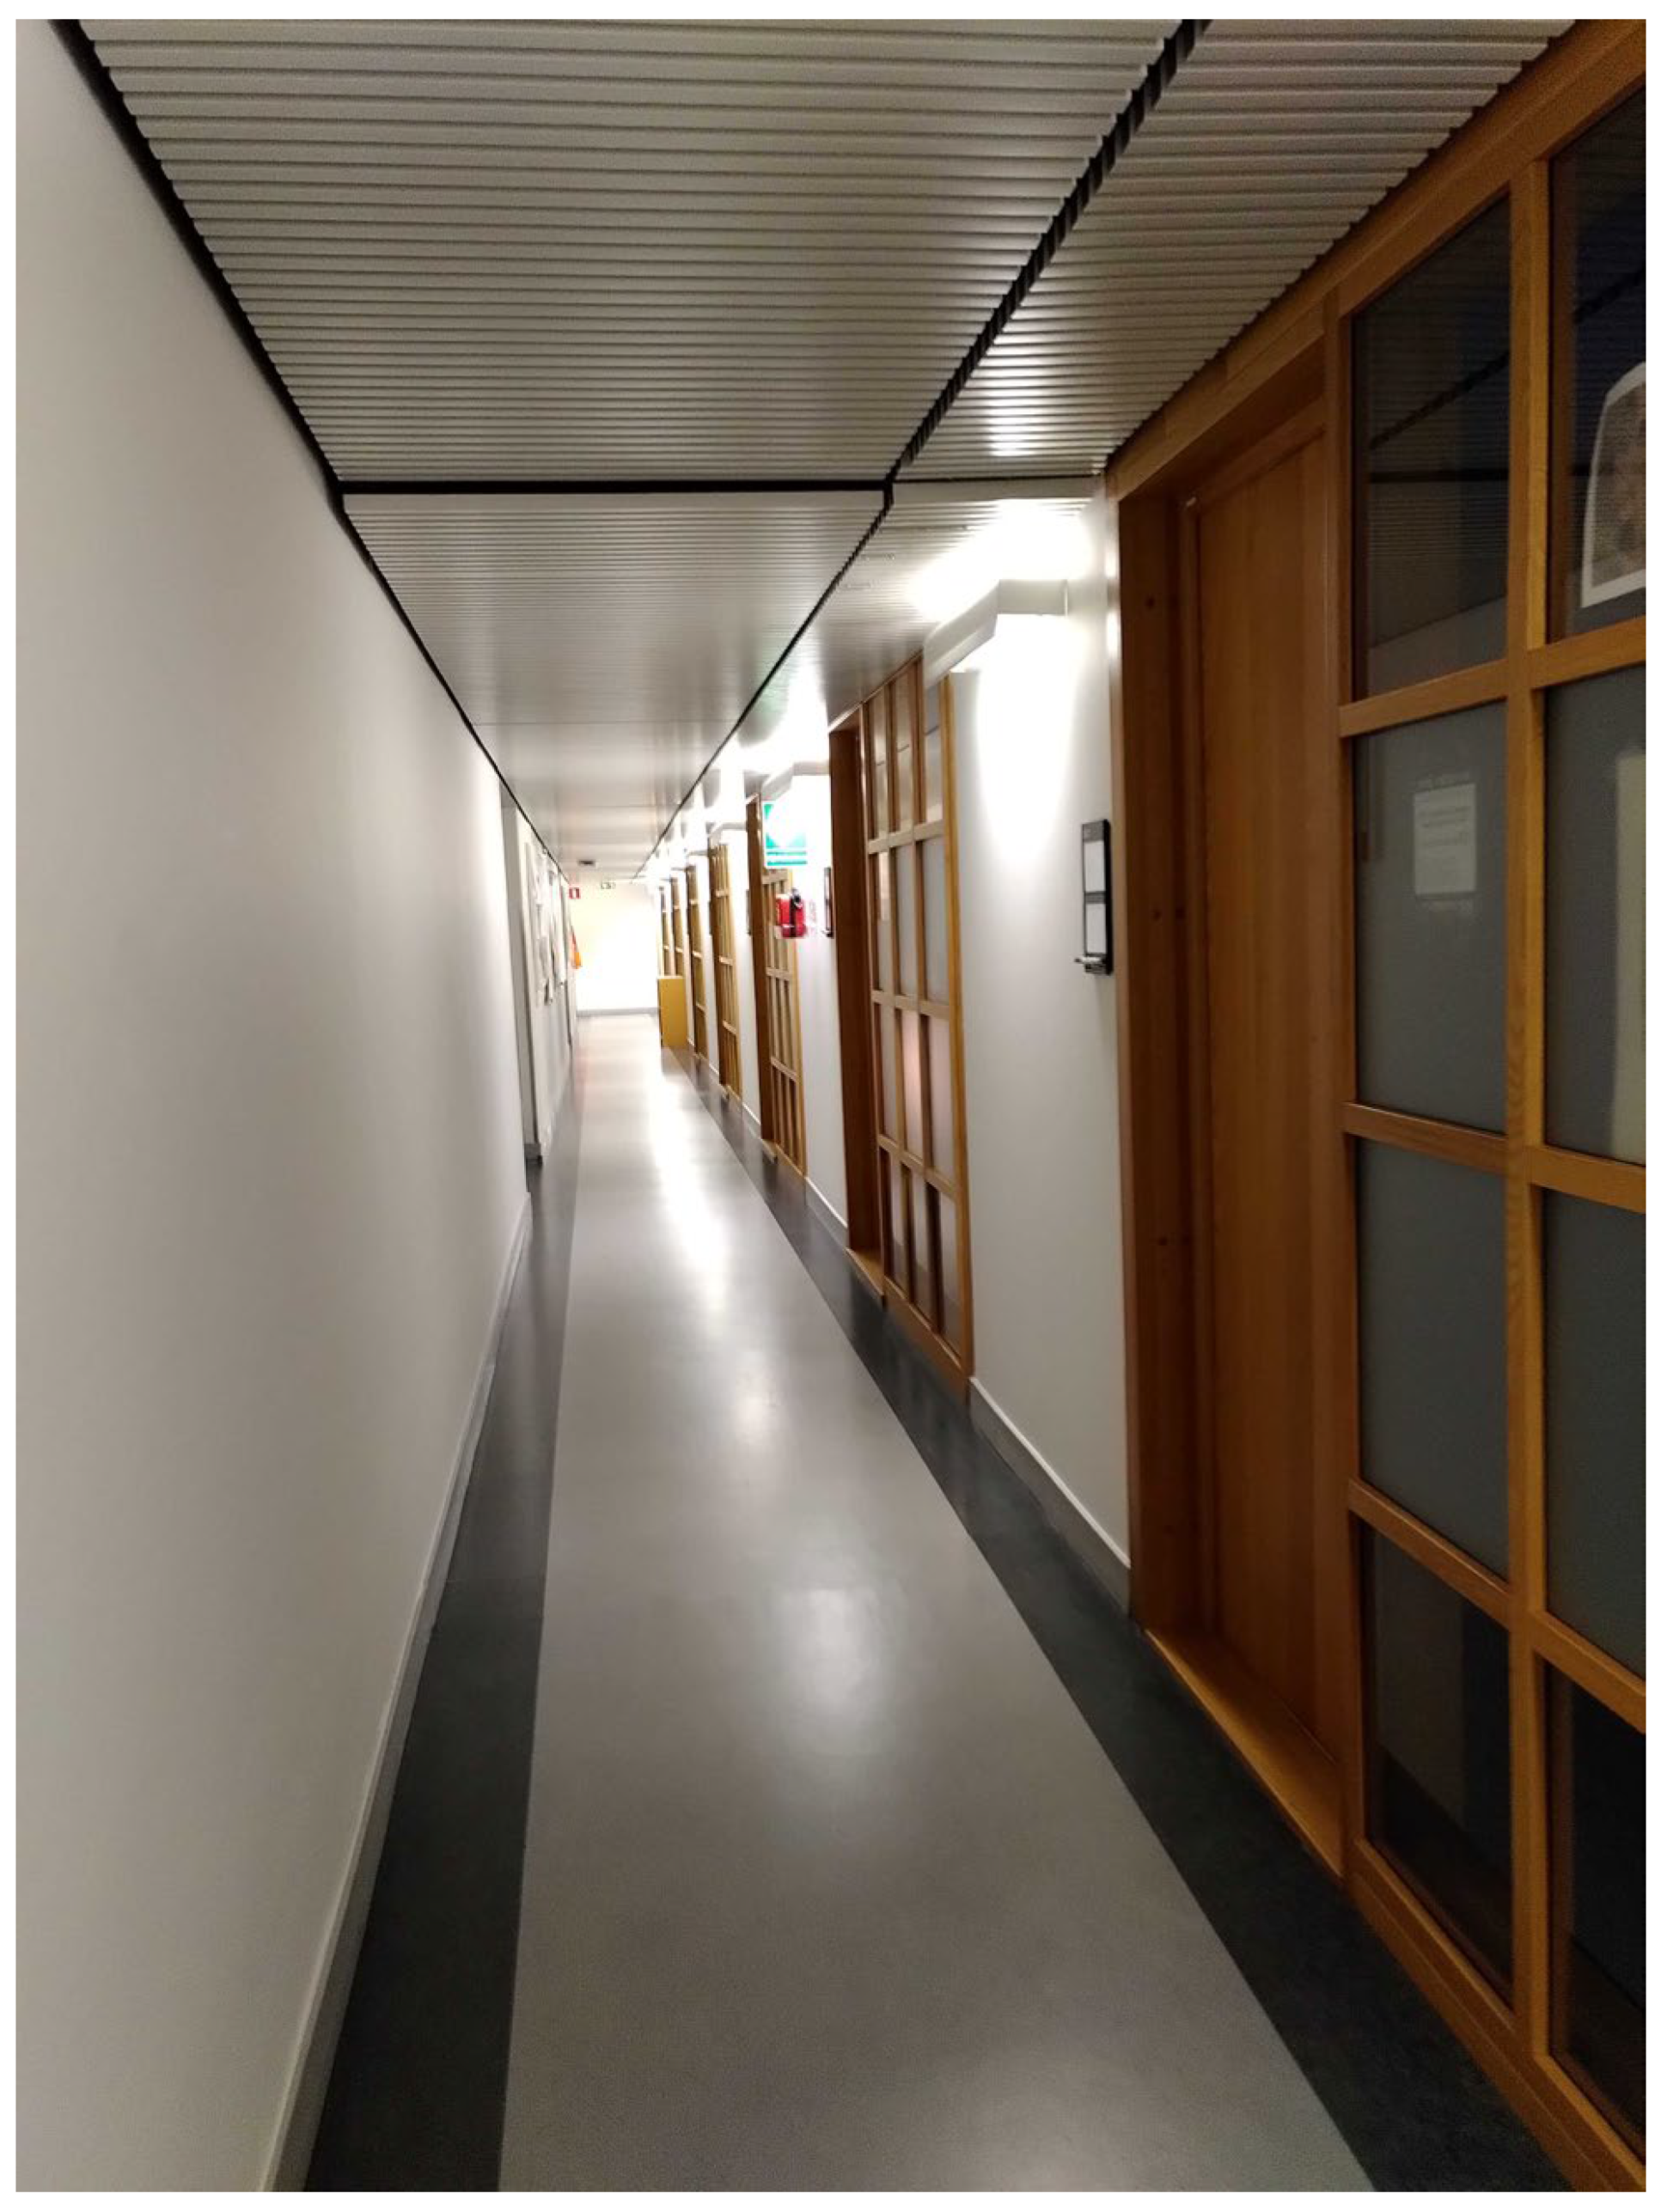
Figure A2.
The central corridor at Department B.

References
- Geissdoerfer, M.; Savaget, P.; Bocken, N.M.P.; Hultink, E.J. The Circular Economy—A new sustainability paradigm? J. Clean. Prod. 2017, 143, 757–768. [Google Scholar] [CrossRef]
- Cabeza, L.F.; Bai, Q.; Bertoldi, P.; Kihila, J.M.; Lucena, A.F.P.; Mata, É.; Mirasgedis, S.; Novikova, A.; Saheb, Y. Buildings. In Climate Change 2022: Mitigation of Climate Change; Contribution of Working Group III to the Sixth Assessment Report of the Intergovernmental Panel on Climate Change; Shukla, P.R., Skea, J., Slade, R., Al Khourdajie, A., van Diemen, R., McCollum, D., Pathak, M., Some, S., Vyas, P., Fradera, R., et al., Eds.; Cambridge University Press: Cambridge, UK, 2022; Available online: https://www.ipcc.ch/report/ar6/wg3/ (accessed on 6 January 2023).
- Gevorgian, A.; Pezzutto, S.; Zambotti, S.; Croce, S.; Oberegger, U.F.; Lollini, R.; Kranzl, L.; Müller, A. European Building Stock Analysis a Country by Country Descriptive and Comparative Analysis of the Energy Performance of Buildings; Eurac Research: Bolzano, Italy, 2021. [Google Scholar]
- Höjer, M.; Mjörnell, K. Measures and Steps for More Efficient Use of Buildings. Sustainability 2018, 10, 1949. [Google Scholar] [CrossRef]
- Huovila, A.; Tuominen, P.; Airaksinen, M. Effects of Building Occupancy on Indicators of Energy Efficiency. Energies 2017, 10, 628. [Google Scholar] [CrossRef]
- Francart, N.; Höjer, M.; Mjörnell, K.; Orahim, A.S.; von Platten, J.; Malmqvist, T. Sharing indoor space: Stakeholders’ perspectives and energy metrics. Build. Cities 2020, 1, 70–85. [Google Scholar] [CrossRef]
- Malmqvist, T.; Brismark, J. Embodied carbon savings of co-living and implications for metrics. Build. Cities 2023, 4, 386–404. [Google Scholar] [CrossRef]
- Knoll Workplace Research. The Workplace Net.Work. 2015. Available online: https://library.hermanmiller.group/m/b487a60a1fe6f13d/original/Knoll_The_Workplace_NetWork.pdf (accessed on 21 December 2023).
- Nair, G.; Azizi, S.; Olofsson, T. A multi-stakeholder perspective on opportunities and challenges for energy efficiency improvement in university buildings. E3S Web Conf. 2021, 246, 05006. [Google Scholar] [CrossRef]
- Azimi, S.; O’Brien, W. Fit-for-purpose: Measuring occupancy to support commercial building operations: A review. Build. Environ. 2022, 212, 108767. [Google Scholar] [CrossRef]
- O’Brien, W.; Gaetani, I.; Carlucci, S.; Hoes, P.-J.; Hensen, J.L.M. On occupant-centric building performance metrics. Build Environ. 2017, 122, 373–385. [Google Scholar] [CrossRef]
- Flyvbjerg, B. Five Misunderstandings about Case-Study Research. Qual. Inq. 2006, 12, 219–245. [Google Scholar] [CrossRef]
- UK Higher Education Space Management Project. Space Utilisation: Practice, Performance and Guidelines. No. 38. 2006. Available online: http://www.smg.ac.uk/documents/utilisation.pdf (accessed on 21 December 2023).
- DiCicco-Bloom, B.; Crabtree, B.F. The qualitative research interview. Med. Educ. 2006, 40, 314–321. [Google Scholar] [CrossRef]
- Azari, R. Life Cycle Energy Consumption of Buildings; Embodied + Operational. In Sustainable Construction Technologies; Tam, V.W.Y., Le, K.N., Eds.; Butterworth-Heinemann: Oxford, UK, 2019; pp. 123–144. [Google Scholar] [CrossRef]
- Ramesh, T.; Prakash, R.; Shukla, K.K. Life cycle energy analysis of buildings: An overview. Energy Build. 2010, 42, 1592–1600. [Google Scholar] [CrossRef]
- Chastas, P.; Theodosiou, T.; Bikas, D. Embodied energy in residential buildings-towards the nearly zero energy building: A literature review. Build Environ. 2016, 105, 267–282. [Google Scholar] [CrossRef]
- Gustafsson, M.S.; Gustafsson, M.; Myhren, J.A.; Dotzauer, E. Primary energy use in buildings in a Swedish perspective. Energy Build 2016, 130, 202–209. [Google Scholar] [CrossRef]
- Gustavsson, L.; Joelsson, A. Life cycle primary energy analysis of residential buildings. Energy Build 2010, 42, 210–220. [Google Scholar] [CrossRef]
- Dixit, M.K. Life cycle recurrent embodied energy calculation of buildings: A review. J. Clean. Prod. 2018, 209, 731–754. [Google Scholar] [CrossRef]
- Hitchin, R. Primary Energy Factors and the primary energy intensity of delivered energy: An overview of possible calculation conventions. Build. Serv. Eng. Res. Technol. 2019, 40, 198–219. [Google Scholar] [CrossRef]
- Dixit, M.K.; Fernández-Solís, J.L.; Lavy, S.; Culp, C.H. Need for an embodied energy measurement protocol for buildings: A review paper. Renew. Sustain. Energy Rev. 2012, 16, 3730–3743. [Google Scholar] [CrossRef]
- Ding, G.K.C. The Development of a Multi-Criteria Approach for the Measurement of Sustainable Performance for Built Projects and Facilities. Ph.D. Thesis, University of Technology, Sydney, Australia, 2004; p. 404. [Google Scholar]
- Aktas, C.B.; Bilec, M.M. Impact of lifetime on US residential building LCA results. Int. J. Life Cycle Assess. 2012, 17, 337–349. [Google Scholar] [CrossRef]
- Treloar, G.J.; Fay, R.; Ilozor, B.; Love, P.E.D. An analysis of the embodied energy of office buildings by height. Facilities 2001, 19, 204–214. [Google Scholar] [CrossRef]
- Swedish Energy Agency. Energistatistik för Lokaler; Swedish Energy Agency: Eskilstuna, Sweden, 2020. [Google Scholar]
- Gilani, S.; O’Brien, W. Review of current methods, opportunities, and challenges for in-situ monitoring to support occupant modelling in office spaces. J. Build. Perform. Simul. 2017, 10, 444–470. [Google Scholar] [CrossRef]
- Hiller, C. Factors influencing residents’ energy use—A study of energy-related behaviour in 57 Swedish homes. Energy Build 2015, 87, 243–252. [Google Scholar] [CrossRef]
- Salimi, S.; Hammad, A. Critical review and research roadmap of office building energy management based on occupancy monitoring. Energy Build. 2019, 182, 214–241. [Google Scholar] [CrossRef]
- Bagge, H.; Johansson, D.; Lindstrii, L. Measured indoor hygrothermal conditions and occupancy levels in an arctic Swedish multi-family building. HVAC R Res. 2014, 20, 376–383. [Google Scholar] [CrossRef]
- BNP Paribas Real Estate. Prime Office Vacancy Rates in Selected European Cities from 2021 to 2022. Available online: https://www.statista.com/statistics/791978/office-vacancy-rates-europe/ (accessed on 6 December 2023).
- Espeland, W.N.; Stevens, M.L. A sociology of quantification. Arch. Eur. Sociol. 2008, 49, 401–436. [Google Scholar] [CrossRef]
Figure 1.
Project workflow.

Figure 2.
Floor plans of Department A (2 floors, top two floor plans) and Department B (bottom floor plan). Orange: office rooms. Blue: open spaces. Red: seminar rooms. Yellow: telephone rooms. White: Common areas such as corridors, kitchen, and toilets.
Figure 2.
Floor plans of Department A (2 floors, top two floor plans) and Department B (bottom floor plan). Orange: office rooms. Blue: open spaces. Red: seminar rooms. Yellow: telephone rooms. White: Common areas such as corridors, kitchen, and toilets.

Figure 3.
Space use at Office rooms at Department A. Individual space use (blue triangles) uses the left-hand axis (m2/person). Occupancy (red dots) and frequency (black ovals) use the right-hand axis (%).
Figure 3.
Space use at Office rooms at Department A. Individual space use (blue triangles) uses the left-hand axis (m2/person). Occupancy (red dots) and frequency (black ovals) use the right-hand axis (%).

Figure 4.
Space use in Open spaces at Department A. Individual space use (blue triangles) uses the left-hand axis (m2/person). Occupancy (red dots) and frequency (black ovals) use the right-hand axis (%).
Figure 4.
Space use in Open spaces at Department A. Individual space use (blue triangles) uses the left-hand axis (m2/person). Occupancy (red dots) and frequency (black ovals) use the right-hand axis (%).

Figure 5.
Compared cases with and without space efficiency measure.

Table 1.
Number of different types of rooms in the two departments.
| Dep A | Dep B | |
|---|---|---|
| Office room: a room with 1–4 desks and a clear boundary to other space | 21 | 18 |
| Open space: a room with several desks and without a clear boundary to other space | 8 | 3 |
| Seminar room: a room assigned for meetings and with more than two seats | 5 | 2 |
| Telephone room: a room without assigned desks and with one or two seats | 8 | 2 |
Table 2.
Questions asked in the interviews.
| Question | |
|---|---|
| About the results | 1. What are your immediate thoughts about the results? |
| 2. What had you expected? | |
| 3. Are you satisfied with the results? | |
| Current situation | 4. How do you make decisions regarding room distribution? |
| 5. How are the costs for the rooms allocated? | |
| 6. Have there been any major changes in terms of room distribution? | |
| 7. What effects have you seen of the changes? | |
| 8. Have you seen any barriers and concerns regarding the changes? | |
| Future strategies | 9. What are your thoughts on future changes in terms of room distribution? |
| 10. How do you think your strategy/idea can affect space efficiency? | |
| 11. What drivers for improving space efficiency can you see? | |
| 12. What possible barriers and concerns regarding the implementation of the strategy/idea can you see? |
Table 3.
Maximum and minimum average individual space use for each type of room at Department A and Department B, and median among all rooms for each room type, m2/person.
Table 3.
Maximum and minimum average individual space use for each type of room at Department A and Department B, and median among all rooms for each room type, m2/person.
| Room Type | Department (#Rooms) | Min | Max | Median |
|---|---|---|---|---|
| Office rooms | A (21) | 17 | no occupants | 37 |
| B (18) | 16 | no occupants | 42 | |
| Open spaces | A (8) | 40 | 333 | 64 |
| B (3) | 11 | 93 | 66 | |
| Seminar rooms | A (5) | 17 | 37 | 19 |
| B (2) | 27 | 31 | - | |
| Telephone rooms | A (8) | 23 | 125 | 65 |
| B (2) | 23 | no occupants | - |
Table 4.
Average occupancy in Office rooms at Department A (21 rooms, 52 measurements).
| % | 0–10 | 10–20 | 20–30 | 30–40 | 40–50 | 50–60 |
|---|---|---|---|---|---|---|
| Number of rooms | 5 | 7 | 4 | 2 | 1 | 2 |
Table 5.
Average occupancy in Office rooms at Department B (18 rooms, 14 measurements).
| % | 0–10 | 10–20 | 20–30 | 30–40 | 40–50 | 50–60 | 60–100 |
|---|---|---|---|---|---|---|---|
| Number of rooms | 2 | 3 | 4 | 2 | 4 | 0 | 3 |
Disclaimer/Publisher’s Note: The statements, opinions and data contained in all publications are solely those of the individual author(s) and contributor(s) and not of MDPI and/or the editor(s). MDPI and/or the editor(s) disclaim responsibility for any injury to people or property resulting from any ideas, methods, instructions or products referred to in the content. |
© 2023 by the authors. Licensee MDPI, Basel, Switzerland. This article is an open access article distributed under the terms and conditions of the Creative Commons Attribution (CC BY) license (https://creativecommons.org/licenses/by/4.0/).
Share and Cite
MDPI and ACS Style
Höjer, M.; Hongo, Y.; Francart, N.; Kishita, Y. Measuring Space Efficiency and Estimating the Potential for Reduced Operational and Embodied Energy Use for Office Spaces. Sustainability 2024, 16, 332. https://doi.org/10.3390/su16010332
AMA Style
Höjer M, Hongo Y, Francart N, Kishita Y. Measuring Space Efficiency and Estimating the Potential for Reduced Operational and Embodied Energy Use for Office Spaces. Sustainability. 2024; 16(1):332. https://doi.org/10.3390/su16010332
Chicago/Turabian StyleHöjer, Mattias, Yuki Hongo, Nicolas Francart, and Yusuke Kishita. 2024. "Measuring Space Efficiency and Estimating the Potential for Reduced Operational and Embodied Energy Use for Office Spaces" Sustainability 16, no. 1: 332. https://doi.org/10.3390/su16010332
Note that from the first issue of 2016, this journal uses article numbers instead of page numbers. See further details here.