Article

Evaluating Daylighting and Preservation in Heritage Halls: Shading Retrofit Case Study at Chengdu Jiangnan Pavilion Street Site Museum

1
School of Human Settlements and Civil Engineering, Xi’an Jiaotong University, Xi’an 710049, China
2
State Key Laboratory of Building Safety and Built Environment & National Engineering Research Center of Building Technology, Beijing 100013, China
3
Sichuan Provincial Institute of Cultural Relics and Archaeology, Chengdu 610015, China
*
Author to whom correspondence should be addressed.
Sustainability 2023, 15(24), 16929; https://doi.org/10.3390/su152416929
Submission received: 13 November 2023 / Revised: 5 December 2023 / Accepted: 13 December 2023 / Published: 18 December 2023
(This article belongs to the Collection Urban Planning and Built Environment)

Abstract

:
Site museums, focusing on immovable relics, are crucial for preserving unearthed artifacts by controlling their microenvironment. Artifacts are typically found in air–soil coupled environments. Current environmental control standards, designed for artifacts preserved in air, lead to diseases in soil artifacts due to inappropriate storage conditions. Taking Chengdu’s Jiangnan Guan Street as a case study, this research, through monitoring the on-site artifact environment and analyzing the correlation between diseases and the environment, proposes a tensioned membrane sunshade for the protection of artifacts under exposed roofs. Utilizing computational fluid dynamics and lighting simulations, we compared the environmental changes before and after the implementation of the plan. The results indicate: (1) direct sunlight from the exposed roof is the main cause of instability and disease in the soil–air coupled environment of the artifacts; (2) the sunshade significantly improves the storage environment of the artifacts, reducing the temperature difference at various locations from 12.8 °C to 0.3 °C and decreasing direct solar exposure by over 90%. Our proposed solution effectively improves the preservation environment of unearthed artifacts, offering new insights for the protection of the Chengdu Jiangnan Pavilion Street site.

1. Introduction

Site artifacts, as records of ancient human activities, are valuable cultural and historical heritages [1]. With urban development, numerous urban-based archaeological sites must coexist with urban production and living spaces. The challenge in heritage conservation and urban planning is how to effectively display site artifacts as public cultural resources while ensuring their protection [2]. Given their immovable nature, museums built at the original sites of artifacts transform their environment from outdoor to indoor, providing physical protection and optimized preservation conditions. Hence, establishing site museums is key to protecting and displaying these precious artifacts [3,
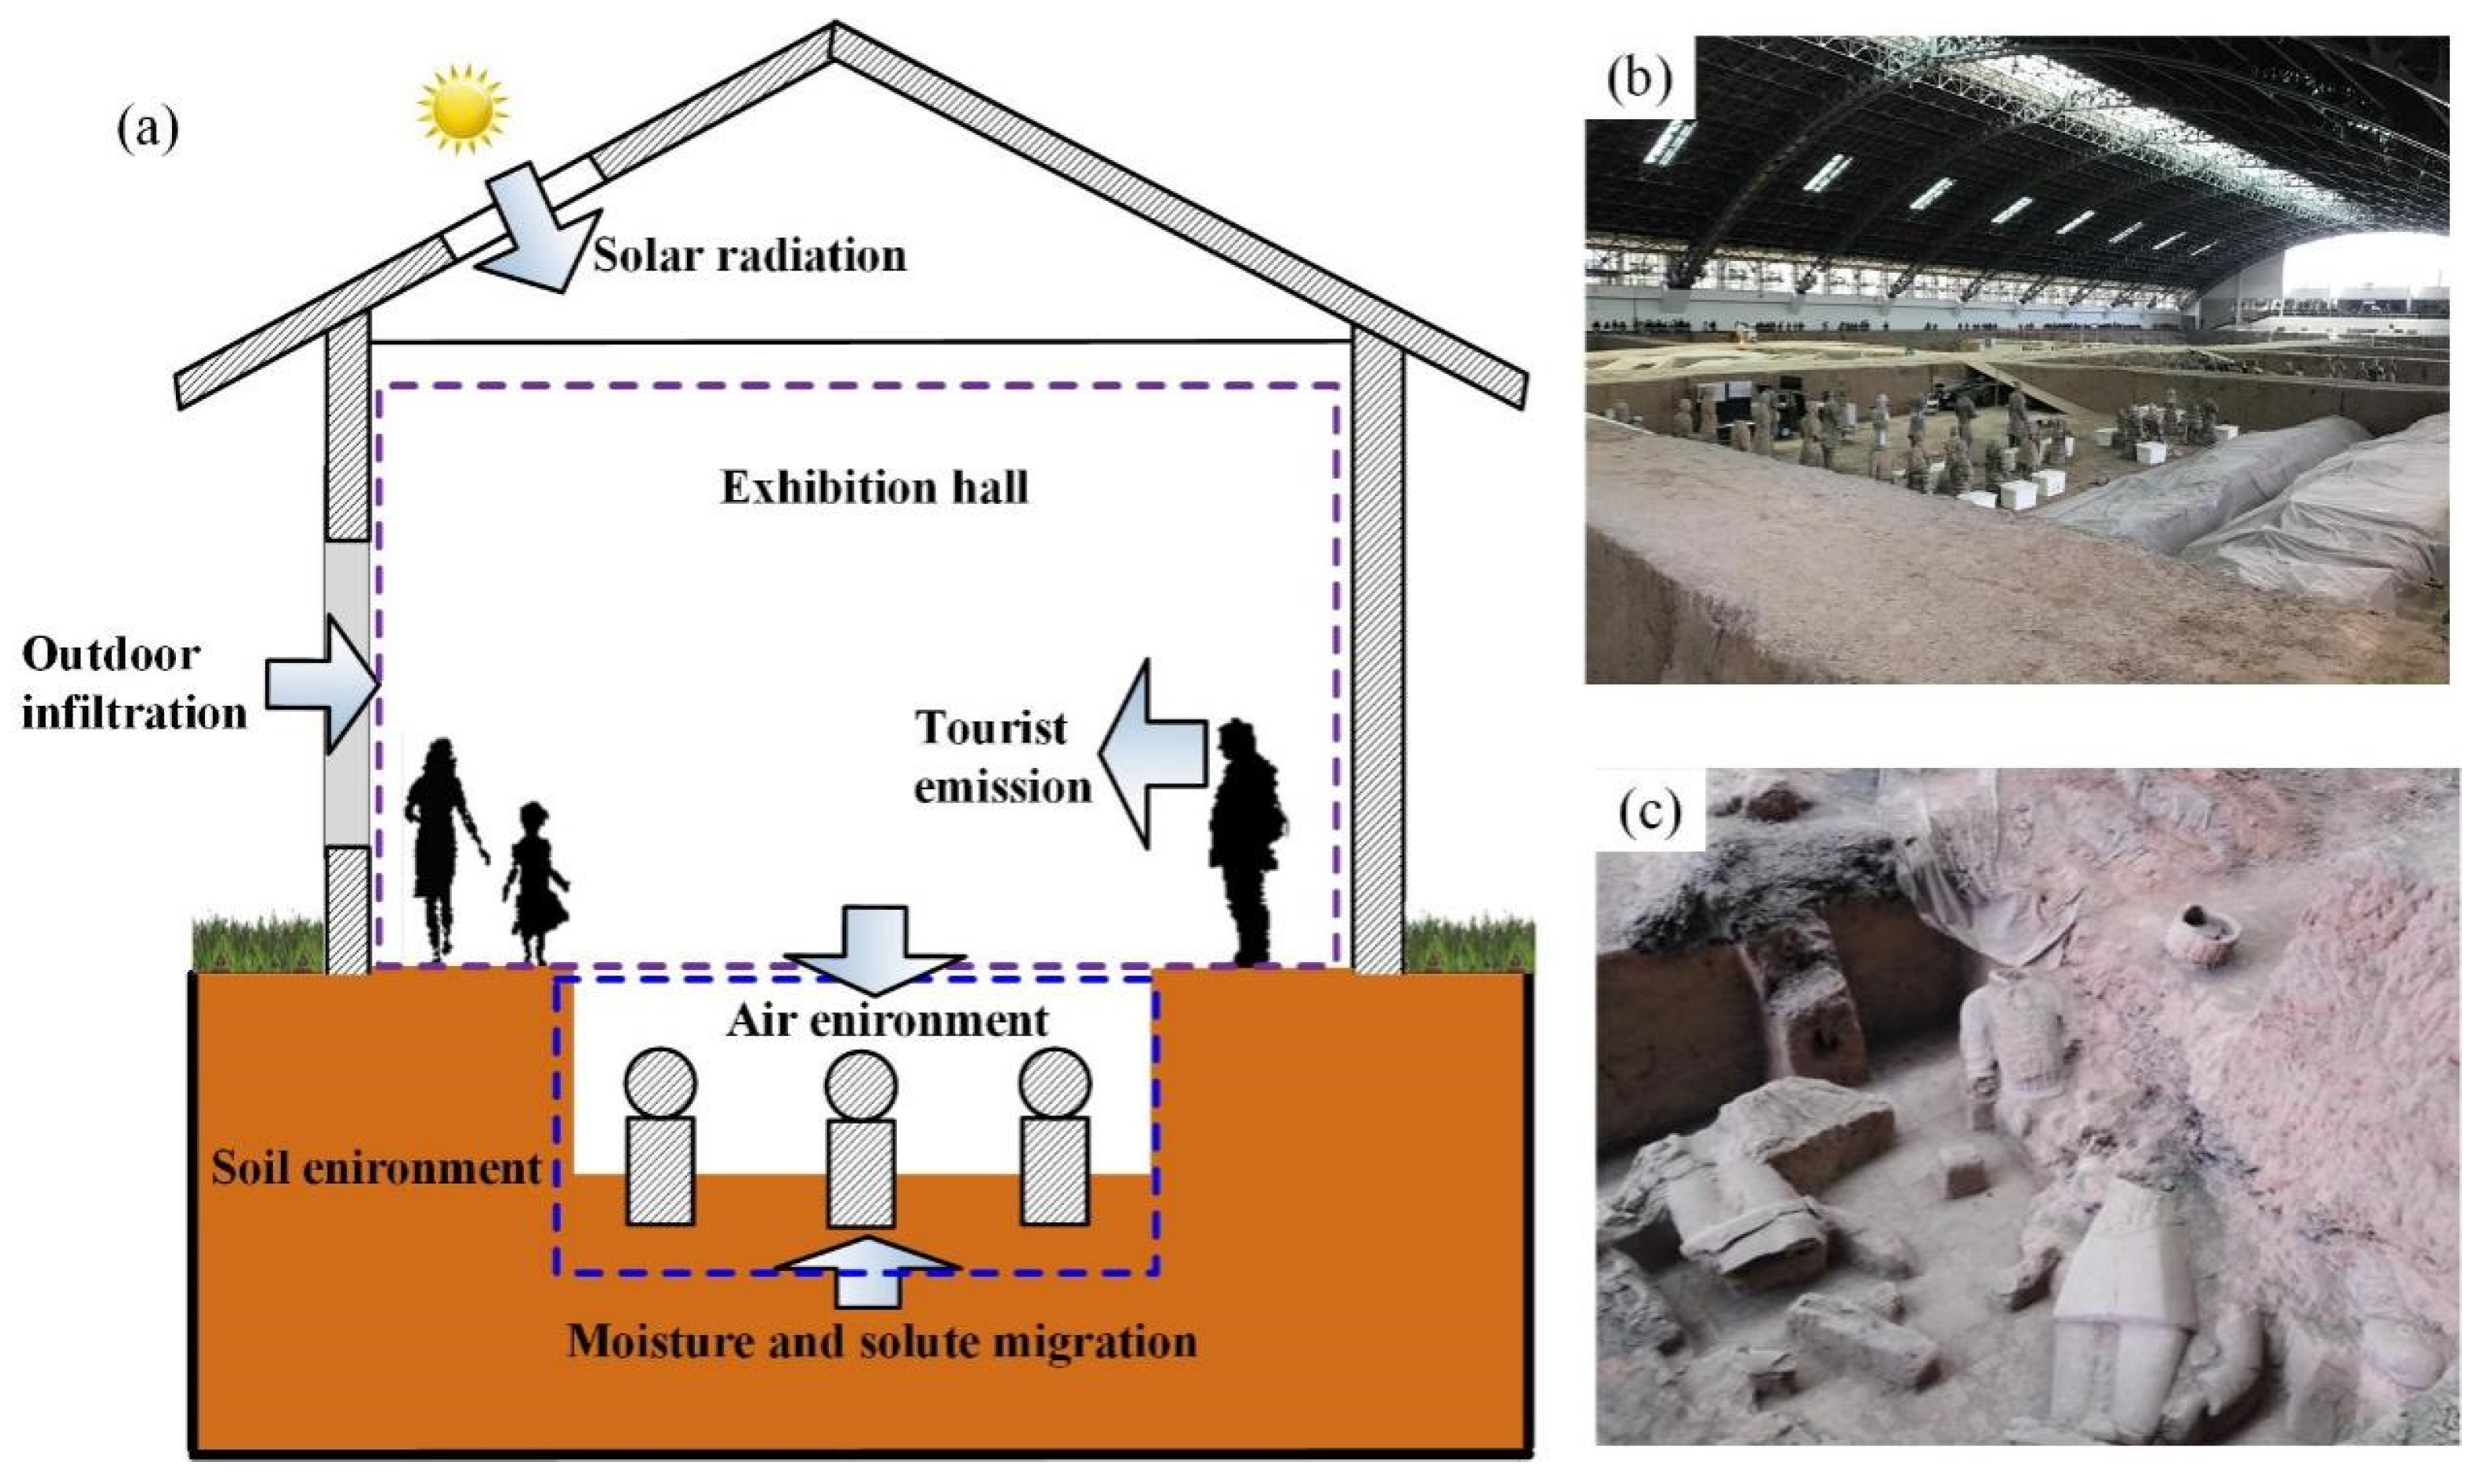
4]. While site museums benefit artifact preservation, factors like soil salinity and air pollution (see Figure 1a) mean that museums alone cannot fully resolve artifact diseases, leaving many artifacts at risk even within museums [5,6,7].
To ensure the integrity of collections and facilitate public display, museums should design lighting and environmental control systems to preemptively protect artifacts and create a comfortable viewing environment [8,9]. Different types of museums have varying requirements for interior environmental design and control, especially regarding lighting, which affects both artifact preservation and visitor experience [10]. Natural lighting reduces energy consumption and improves illumination, but direct sunlight can cause overheating and color degradation of artifacts [11]. Although direct sunlight has a limited direct aging effect on inorganic materials, its photothermal impact can lead to various environmental changes, causing damage to artifacts. This includes the following: (1) direct damage to artifacts made of specific materials [12]; (2) accelerated evaporation of moisture and rapid accumulation of salts on soil site surfaces [13]; (3) excessive heat introduction, resulting in significant diurnal temperature fluctuations on the soil site surface [14]; (4) increased energy consumption for environmental control systems [
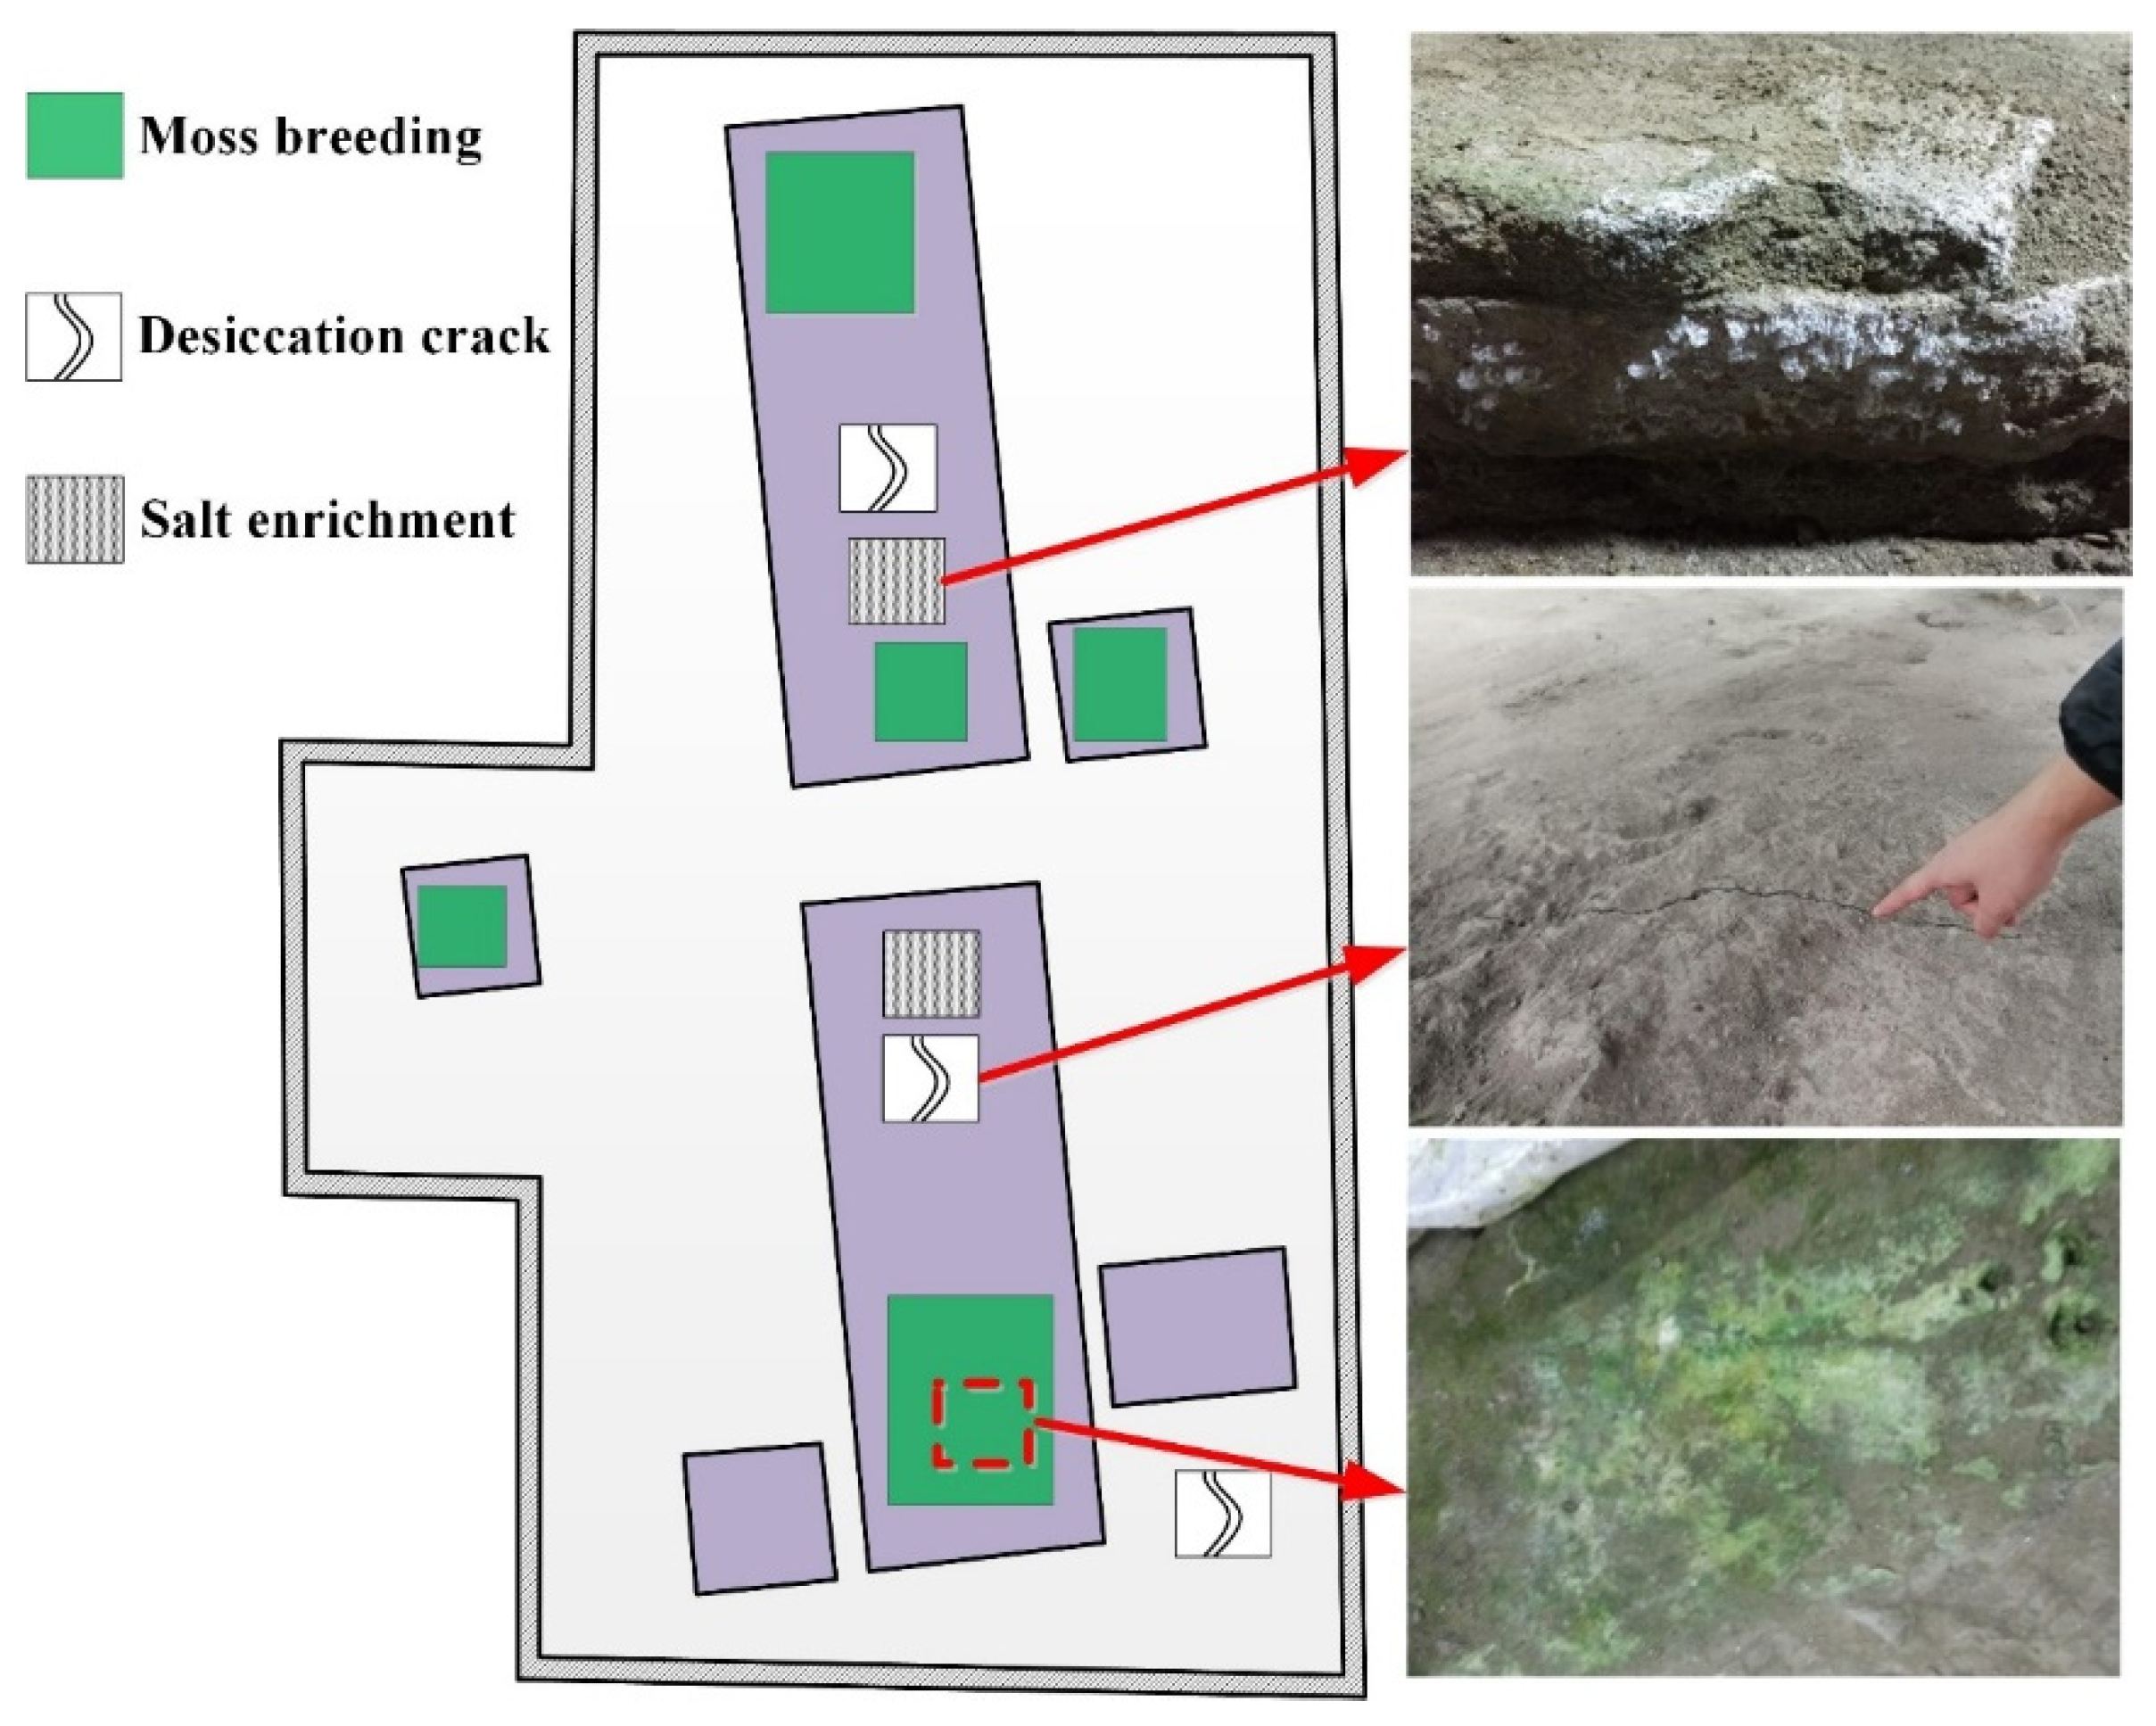
15]; and (5) in humid climates, the combined effects of light and moisture can promote moss growth on the soil site surface, leading to diseases [16]. Balancing natural lighting to optimize display effects while minimizing solar radiation on artifacts is a significant challenge for museum designers. Designers and managers must strike a balance between artifact preservation and visitor experience [17,18].
Research has been conducted on optimizing the design of museum skylights to reduce their impact on artifacts. Many museums worldwide are transformed from buildings initially designed for other purposes, often featuring numerous skylights and side windows for natural lighting before renovation. To assess the risks of natural lighting post-renovation and develop appropriate strategies, Hoyo-Meléndez et al. [19] proposed a method for assessing natural lighting in museum galleries, focusing on the preventive conservation of artifacts, exemplified by the Donald W. Reynolds Center for American Art and Portraiture. Khaled A. Al-Sallal et al. [10] studied the impact of various sky models, building orientations, and window-to-wall ratios on artifacts and visitor comfort in museum galleries converted from traditional buildings in the UAE, providing analysis methods and guidelines for lighting design in such transformations. Addressing the direct sunlight issue from the pyramid-shaped skylight of the Seoul Art Museum, Chang-Sung Kim et al. [20] proposed replacing it with monitor-shaped and saw-tooth-shaped skylights, using RADIANCE software (version 1.02) for simulation and design optimization to effectively block direct light and stabilize illumination.
The impact of lighting on artifacts is closely related to the intensity of light and the sensitivity of the material. The International Commission on Illumination categorizes artifacts into four types based on their light sensitivity and sets standards for light intensity and annual exposure, as shown in Table 1 [11]. These standards, based on the aging characteristics of materials and the direct effect of light, are crucial for museum lighting design.
Table 1 indicates that for inorganic artifacts like earthen sites and pottery, which are insensitive to light, there are no restrictions on light intensity and cumulative exposure in their preservation environment according to the standards. Most unearthed site artifacts are inorganic materials insensitive to light, leading many galleries to adopt large spaces with skylights, as shown in Figure 1b, to enhance display effects [21,22]. However, such large spaces with skylights, as in the Terracotta Army Museum, which is part of China’s first emperor’s mausoleum, can negatively impact the preservation environment of artifacts, with temperature fluctuations exceeding 11 °C observed in the exhibit area during the summer [23]. Hu et al. [24] conducted seasonal environmental sampling in five site museums along the Yangtze River and found fluctuations and seasonal variations in temperature and humidity in the exhibition halls. In archaeological sites where museums are built in situ, the storage environment of artifacts changes from solely soil to a soil–air coupled system (see Figure 1c). Although direct sunlight has limited direct aging effects on inorganic materials, its photothermal effect can cause various environmental change-induced damages to the artifacts. Luo et al. [25], taking the Tang (618–907 AD) and Song (960–1279 AD) dynasty site at Chengdu’s Jiangnan Guan Street as an example, analyzed the impact of direct sunlight through skylights on the degradation of artifacts in a soil–air coupled environment. They found that direct sunlight is a primary cause of salt accumulation, moss growth, and short-term fluctuations in temperature and humidity, suggesting the use of shading measures for improvement.
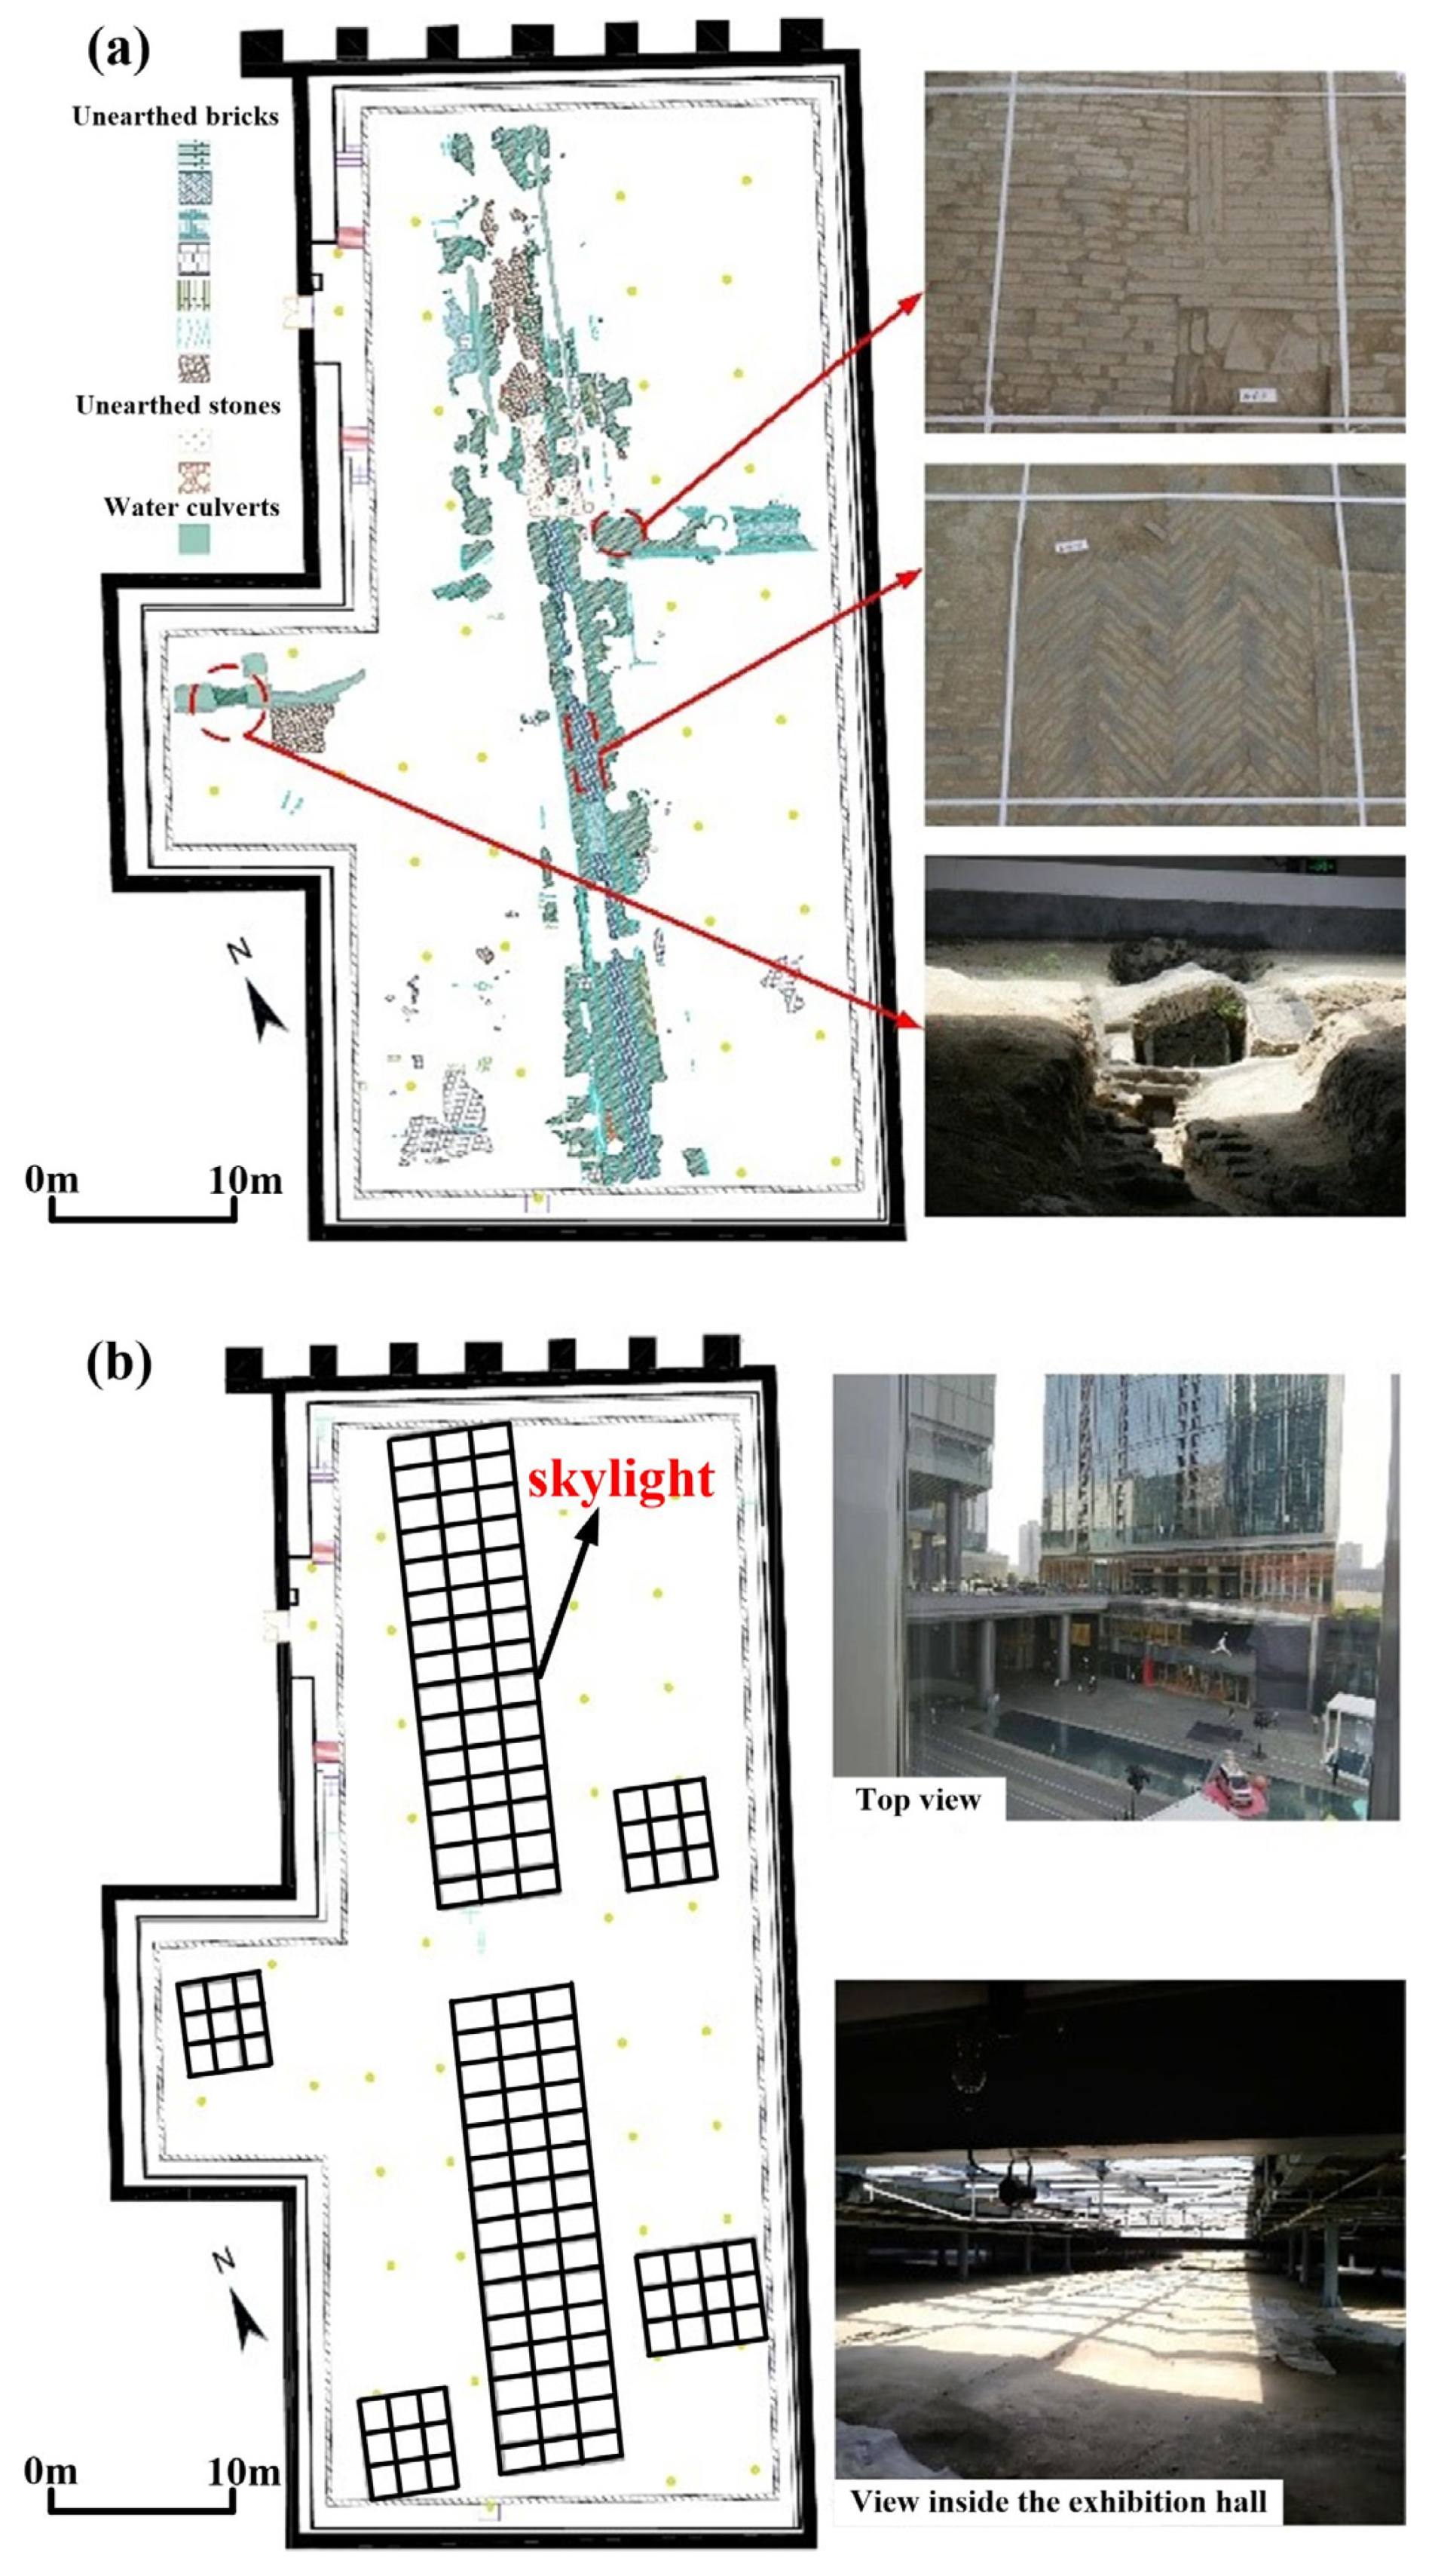
Building on Luo et al. [25], this paper focuses on the improvement needs of a site museum in the city center, selecting the Tang and Song dynasty site at Chengdu’s Jiangnan Guan Street for study, located in Chengdu, Sichuan Province, China. It designs a shading structure to improve the artifact environment, considering the relationship between artifact diseases and the environment and the characteristics of the site and surrounding urban architecture. Computational fluid dynamics and lighting simulation were employed to assess the artifact conservation and display environment, laying the scientific groundwork for future enhancement and conservation strategies.

2. Chengdu Jiangnan Pavilion Street Site

2.1. Site Exhibition Hall

The Chengdu Jiangnan Pavilion Street site, located on Chunxi Road in Chengdu, Sichuan Province, China, was discovered during the construction of the Chengdu International Finance Center in 2007, leading to archaeological excavations and protective measures. Numerous valuable relics from the Tang (618–907 AD) and Song (960–1279 AD) periods were unearthed at the site, including 16 drainage channels, four brick-paved roads, four dirt paths, 22 residential sites, along with eight Ming dynasty residential sites and three wells (as shown in Figure 2a). The site was named one of China’s Top 10 New Archaeological Discoveries in 2008 and was designated as a key national cultural heritage site in China in 2013. A gallery has been established in the core area of the site for its preservation. The site’s exhibition hall, spanning 1556 m2, is a semi-underground structure. Its roof integrates with the entrance plaza of the International Finance Center, featuring skylights above important parts like main streets and culverts. These skylights, covering a total area of 469 m2, allow visitors to view the site through the glass from the plaza (as shown in Figure 2b). To mitigate the impact of direct sunlight, the skylights are made of double-glazed Low-E glass, and the exhibition hall is equipped with an all-air central air conditioning system for year-round environmental control.

2.2. Distribution of Site Diseases

Despite numerous protective measures in design and management, the Chengdu Jiangnan Pavilion Street site exhibition hall still faced issues like soil cracking, moss growth, and localized salt accumulation in certain areas after completion (as shown in Figure 3). These problems, mainly concentrated under the skylight roofs, are closely related to the internal environment of the exhibition hall [25].

3. Methods

This study extended its approach by conducting on-site measurements at the Chengdu Jiangnan Pavilion Street site, complementing the initial computational and lighting analyses (Figure 4). On-site measurements included surface temperature at representative points, air temperature and humidity, and illumination in the artifact area, while numerical simulations covered the environmental lighting and indoor temperature and humidity distribution throughout the space.

3.1. Environmental Monitoring in the Exhibition Hall

To compare the environmental conditions of artifacts in skylight and non-skylight areas, this study deployed air temperature and humidity recorders, soil site surface temperature recorders, and natural lighting illuminance meters in various areas of the exhibition hall. The testing period was from 00:00 on 5 July 2020 to 00:00 on 21 July 2020. All the mentioned sensors automatically recorded environmental parameters continuously during the period. Additionally, for the glass material display, the museum employed a double-layered Low-E glass luminaire cover. The placement of sensors is shown in Figure 5. T1 and T2 are air temperature sensors located under the clear glass and opaque concrete roofs, respectively, at a height of 0.8 m from the ground; S1 and S2 are soil site surface temperature sensors under the respective roofs, inserted 0.5 cm into the soil; G1 is an illuminance sensor, placed under the clear glass, 0.5 m above the ground. The accuracy details of each sensor are listed in Table 2.

3.2. Computational Fluid Dynamics Simulation of the Exhibition Hall Environment

To accurately determine the temperature distribution in the exhibition hall, this study used a Computational Fluid Dynamics (CFD) model to numerically simulate the temperature distribution within the hall.

3.2.1. Geometric Model

The numerical simulation initially involves creating a geometric model of the exhibition hall’s space, followed by mesh partitioning. Control equations are then discretized and solved on these meshes to determine the distribution of environmental parameters. In this study, detailed modeling of the Chengdu Jiangnan Pavilion Street site exhibition hall was implemented. The hall’s geometric dimensions and positioning were obtained through on-site surveying. The model simplifies structures like internal beams and columns, which have a minor impact on the calculations, but precisely represents the distribution of roof glass, internal air ducts, and air outlets. The final geometric model is shown in Figure 6a, and the locations of the 22 all-air outlets are indicated in Figure 6b as 1–22.

3.2.2. Control Equations and Selection of Discretization Formats

The characteristics of air movement and heat transfer in the computational region can be determined by solving control equations for mass conservation, momentum conservation, and energy conservation in fluid motion. The variables to be solved (such as velocity, temperature, turbulent kinetic energy, and dissipation) are denoted by ϕ , and the general control equation can be expressed in a unified form, as shown in Equation (1) [26].
ρ ϕ t + div ρ U ϕ = div Γ ϕ g r a d ϕ + S ϕ
In the equation, ρ represents fluid density, U = u , v , w represents the velocity vector, Γ ϕ represents the generalized diffusion coefficient, and S ϕ represents the generalized source term. The discretization of the control equation in this study uses the finite volume method. Specifically, the time term is discretized using the implicit Euler method, the convection term with the second-order upwind differencing, and the diffusion term with the central differencing. The solution of the entire control equation is carried out using the commercial software Fluent (version 18.0). The coupling of pressure and velocity is handled using the SIMPLE algorithm, and the turbulence model employed is the standard k ε two-equation model.

3.2.3. Boundary Condition Settings

To study the most significant impact of sunlight on the site artifacts, the simulation conditions were assumed to be at noon during a clear summer day, representing the maximum direct solar intensity. This study establishes the typical boundary conditions for clear summer weather by averaging boundary measurements from 12:30 p.m. to 1:30 p.m. on 28 July 2020 (Figure 7). The roof area temperature (including skylight and shaded areas) was set to the average measured value of that afternoon; the ground area temperature (direct and shaded areas) to the average measured value on the site surface, wall temperatures to the average measured value of the inner walls, and the air outlet wind speed and temperature were also based on that afternoon’s measurements. The boundary condition settings of the model are detailed in Table 3.

3.2.4. Analysis of Model Grid Independence and Model Validation

The solution of control equations relies on computational grids, making appropriate grid partitioning crucial for accuracy, reliability, and computational time. Too coarse grids or insufficient grid numbers can lead to significant deviations from actual results, while overly fine grids may result in excessive grid numbers, making the computation difficult to converge and more time-consuming. This study conducted grid independence verification for the model shown in Figure 6a using unstructured tetrahedral grids. Tests were carried out with four different grid divisions: 76,439, 155,790, 3,276,025, and 5,472,301. The results indicated that at 3,276,025 grids (as shown in Figure 8a), further increasing the number of grids had minimal impact on computational parameters; thus, 3,276,025 was selected as the final grid division number. The study also selected six points, D1 to D6, located 0.05 m above the ground on a cross-sectional plane, as observation points for temperature comparison analysis under different simulated conditions. Table 4 shows the comparison between simulated and measured values at these points. The results reveal that the simulated and measured temperatures at each observation point are very close, with an absolute relative error within 5%, indicating the reliability of the numerical simulation.

3.3. Sunlight Simulation in the Exhibition Hall Artifact Area

To acquire the annual distribution of sunlight through the exhibition hall’s glass roof, this study conducted a simulation analysis of the hall’s sunlight conditions using the architectural environment Ecotect analysis software (version 2011). Detailed parameters for the lighting simulation model and boundary condition settings can be found in reference [25]. This study established the reflectivity and glass transmission rates in the model, informed by a review of Ecotect simulation literature and ‘Museum Building Design Code’ specifications. These settings are detailed in Table 5. The Ecotect calculation grid was set near the ground in the site area to represent the artifact area.

4. Analysis of Museum Exhibition Hall Artifact Environmental Monitoring Results

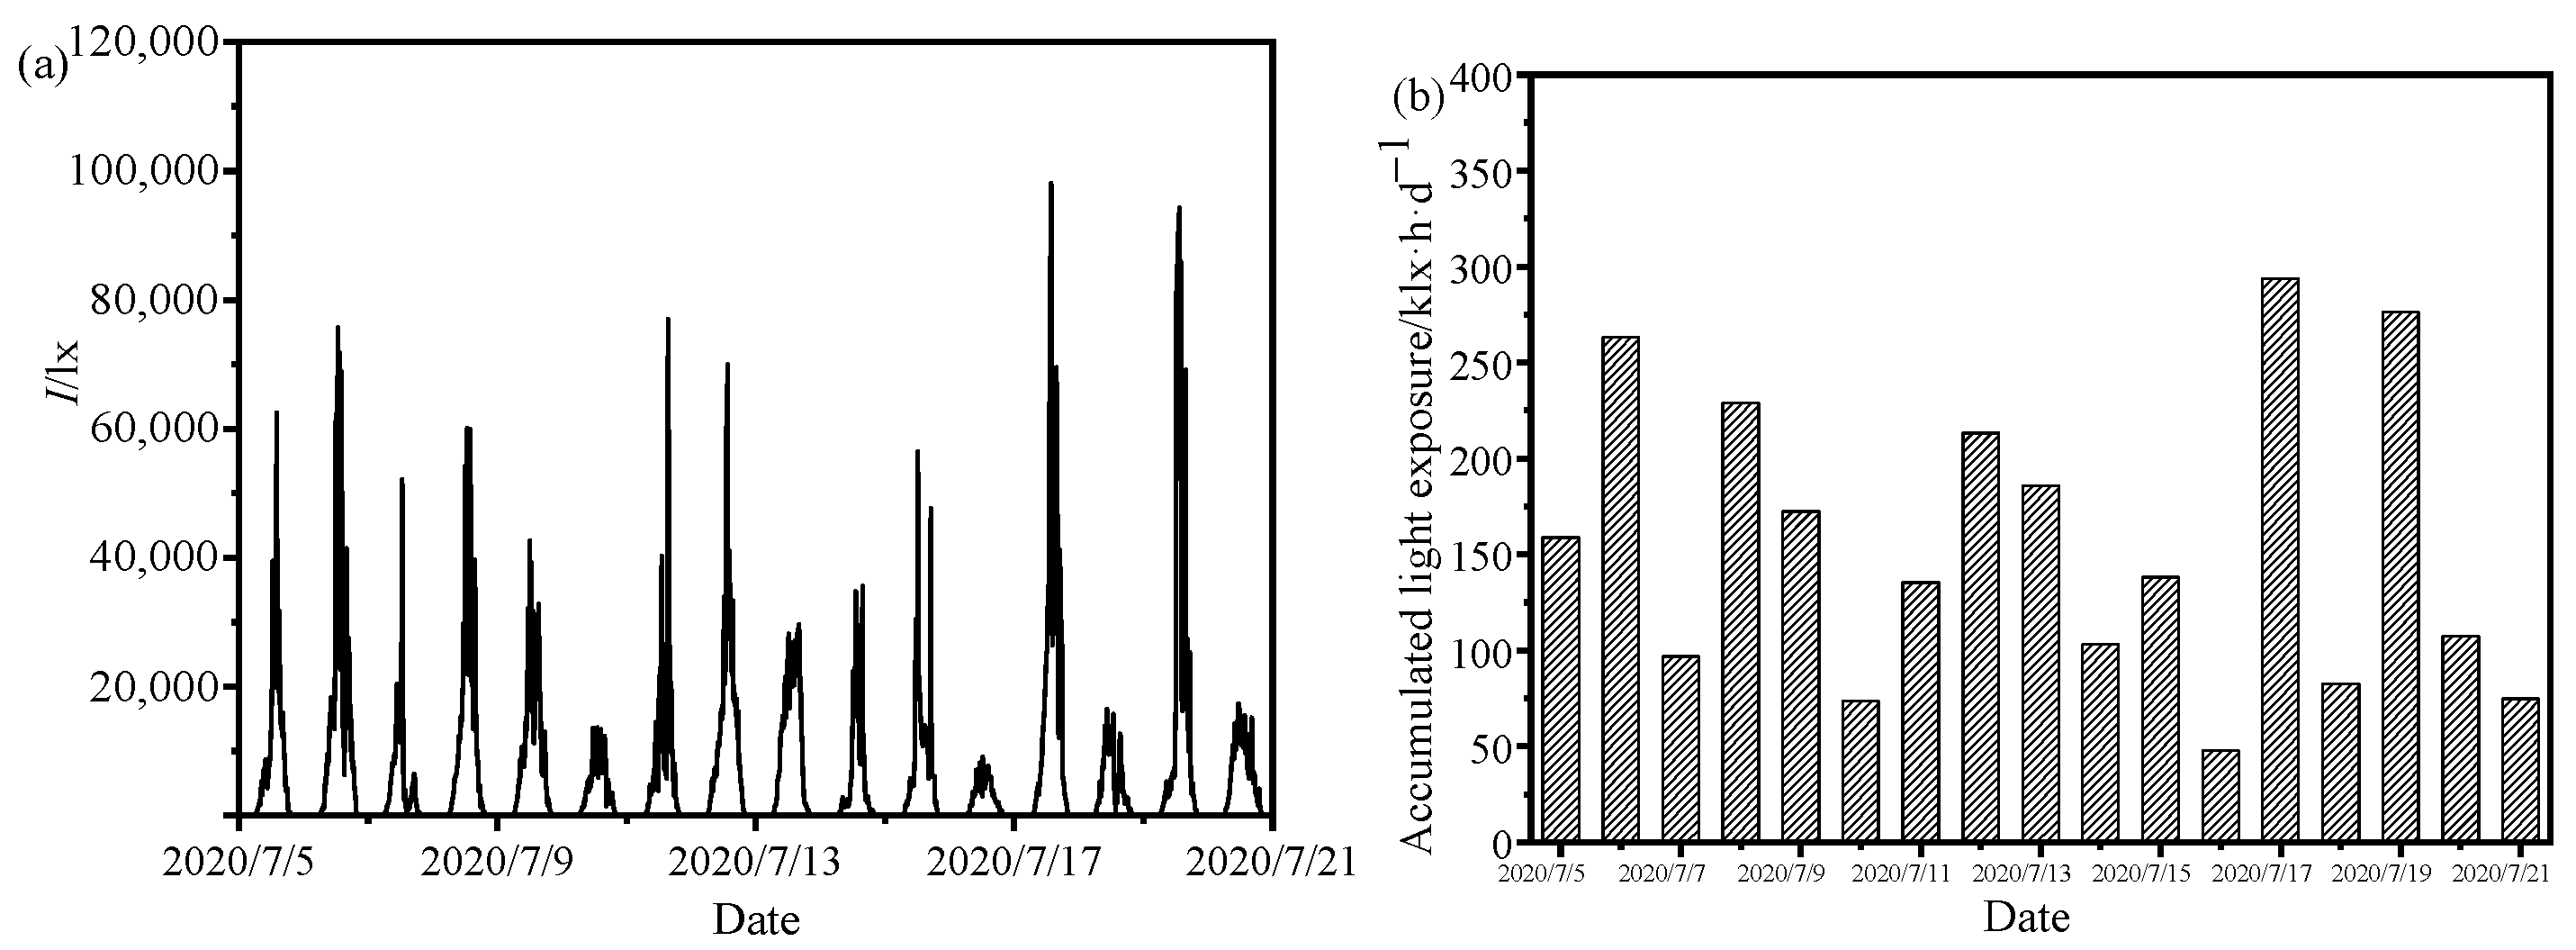
Figure 9 demonstrates that the daytime illuminance in the relic area peaks at 100,000 lx, exhibiting a dual peak pattern at noon and in the afternoon. This occurs primarily because a south-side high-rise building obstructs the exhibition hall lighting between these peak periods. Weather conditions significantly influence the variation in light intensity. During the measurement period, peak illuminance on sunny days neared 1.0 × 10⁵ lx, whereas it remained around 2.0 × 10⁴ lx on cloudy and rainy days, notably on the 10th, 16th, 18th, and 20th. Illuminance and cumulative light intensity values substantially surpass the recommended levels for museum exhibit lighting.
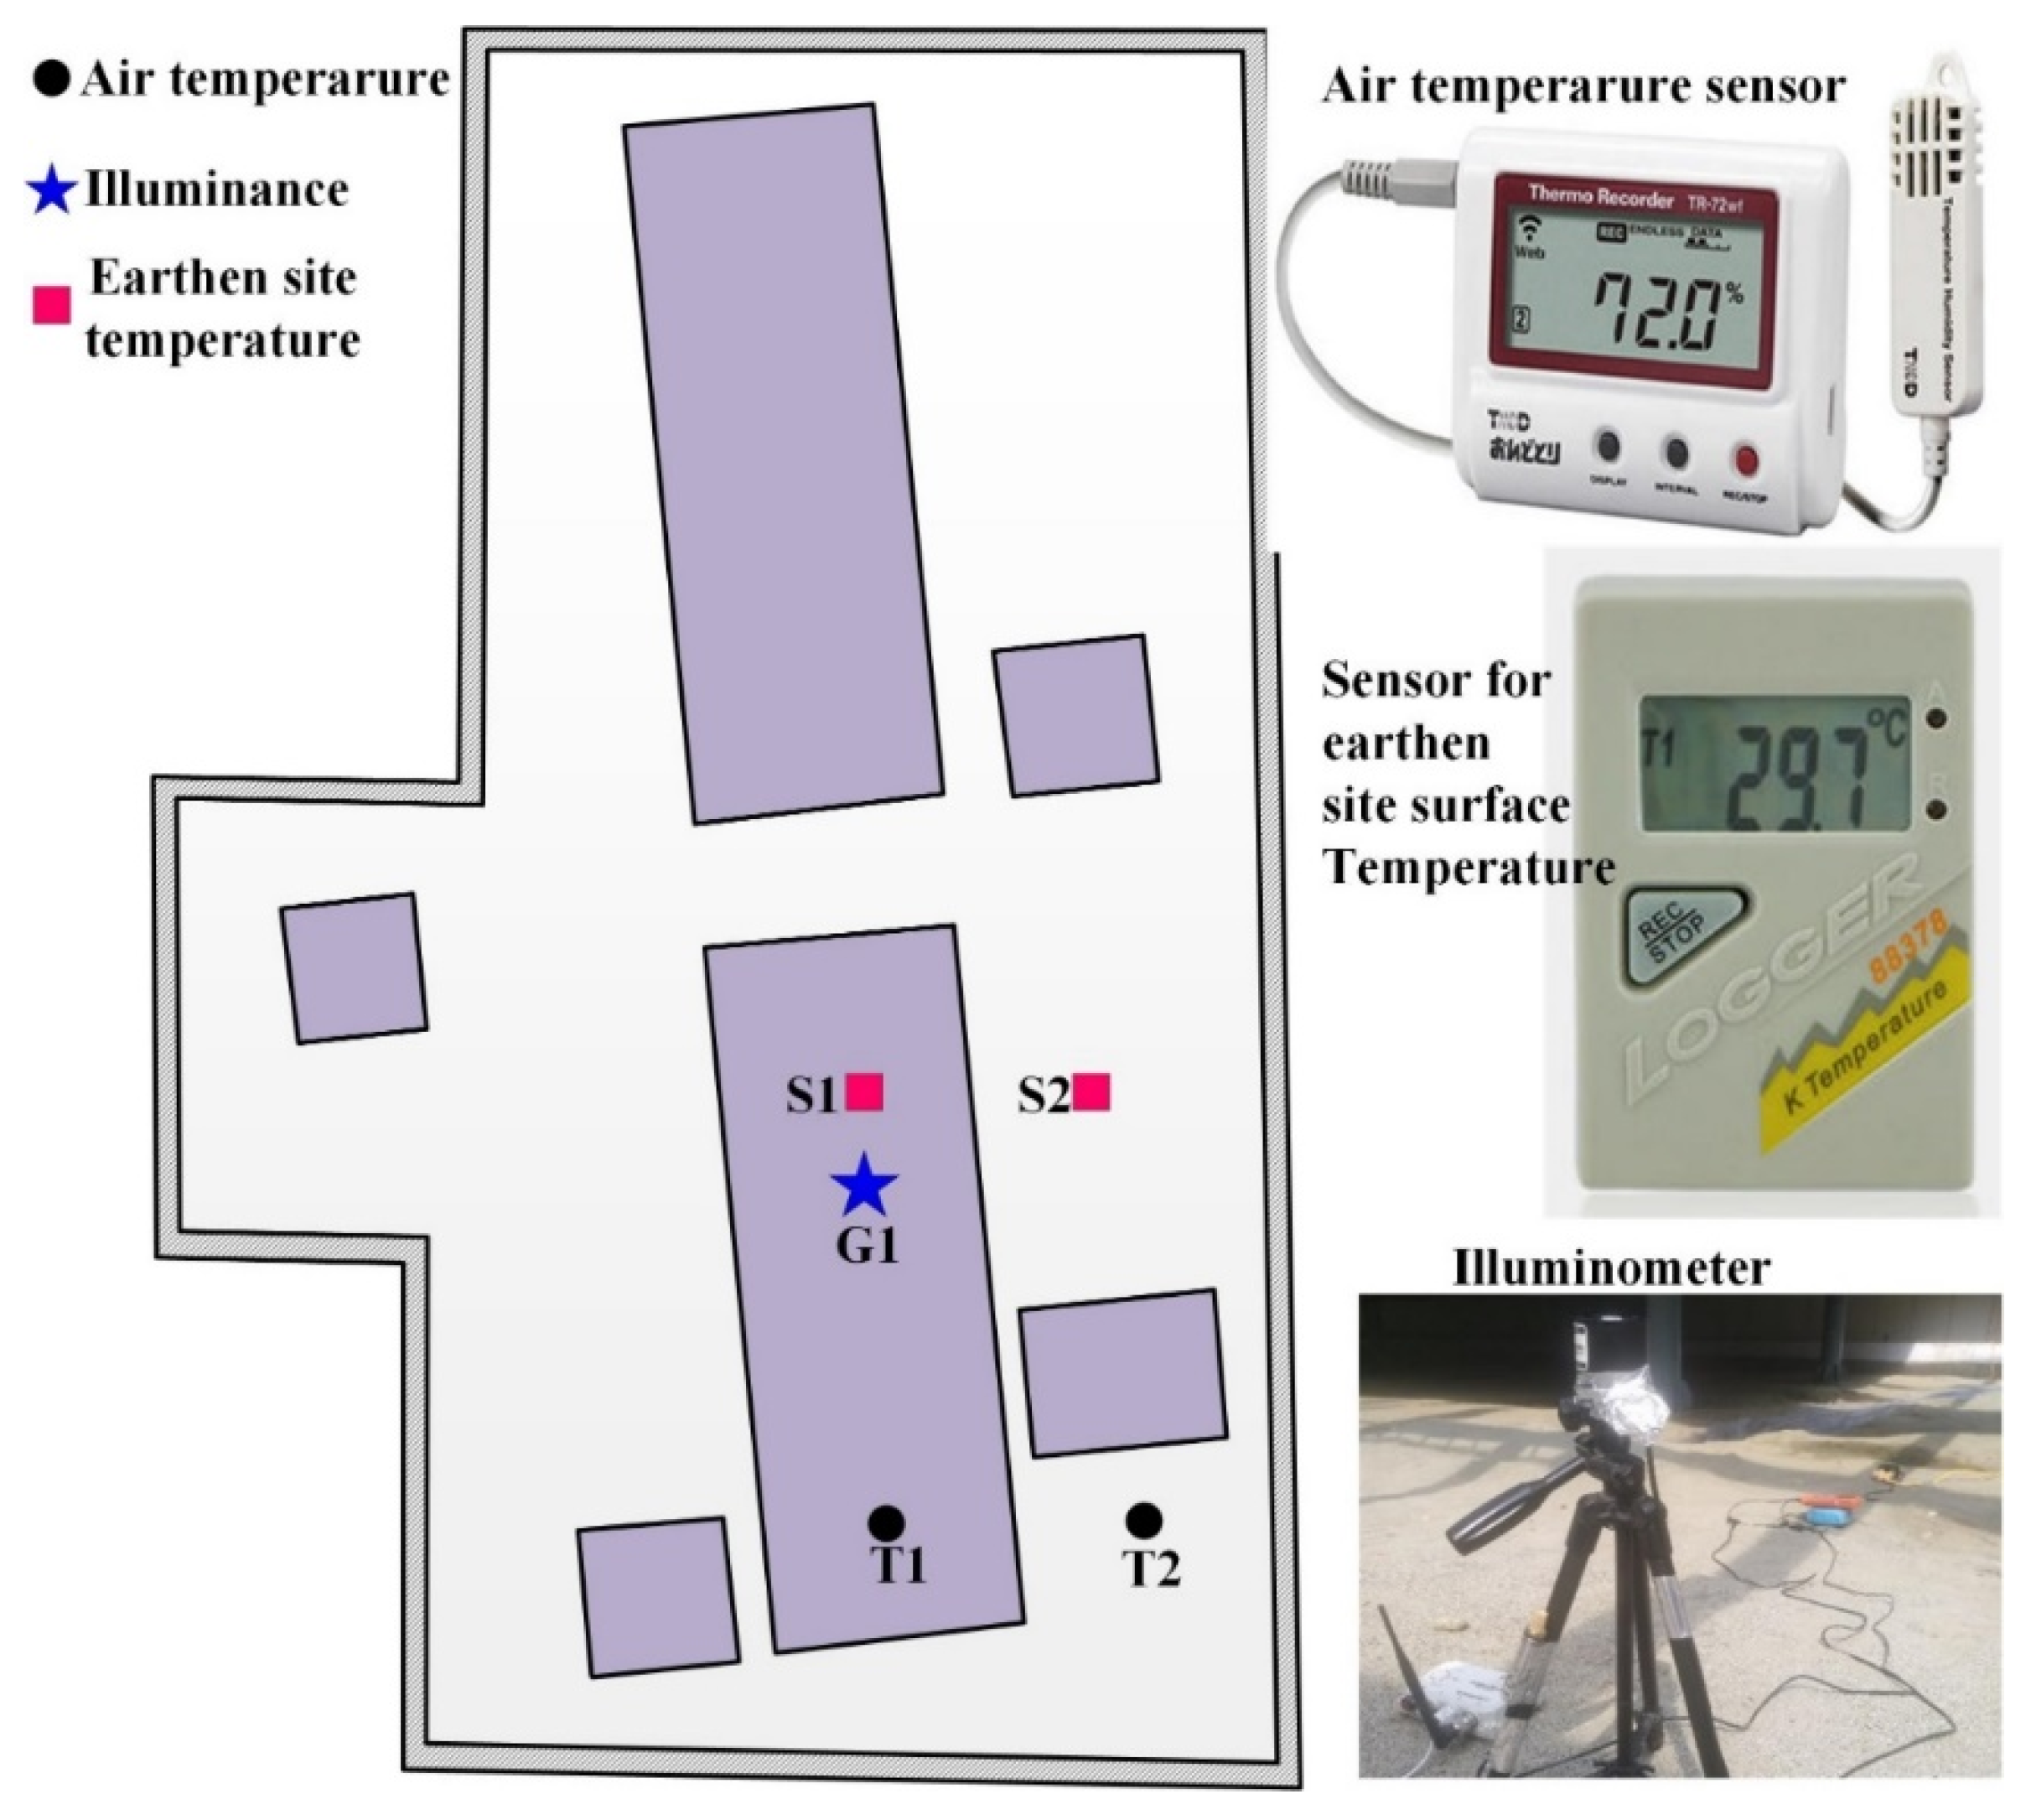
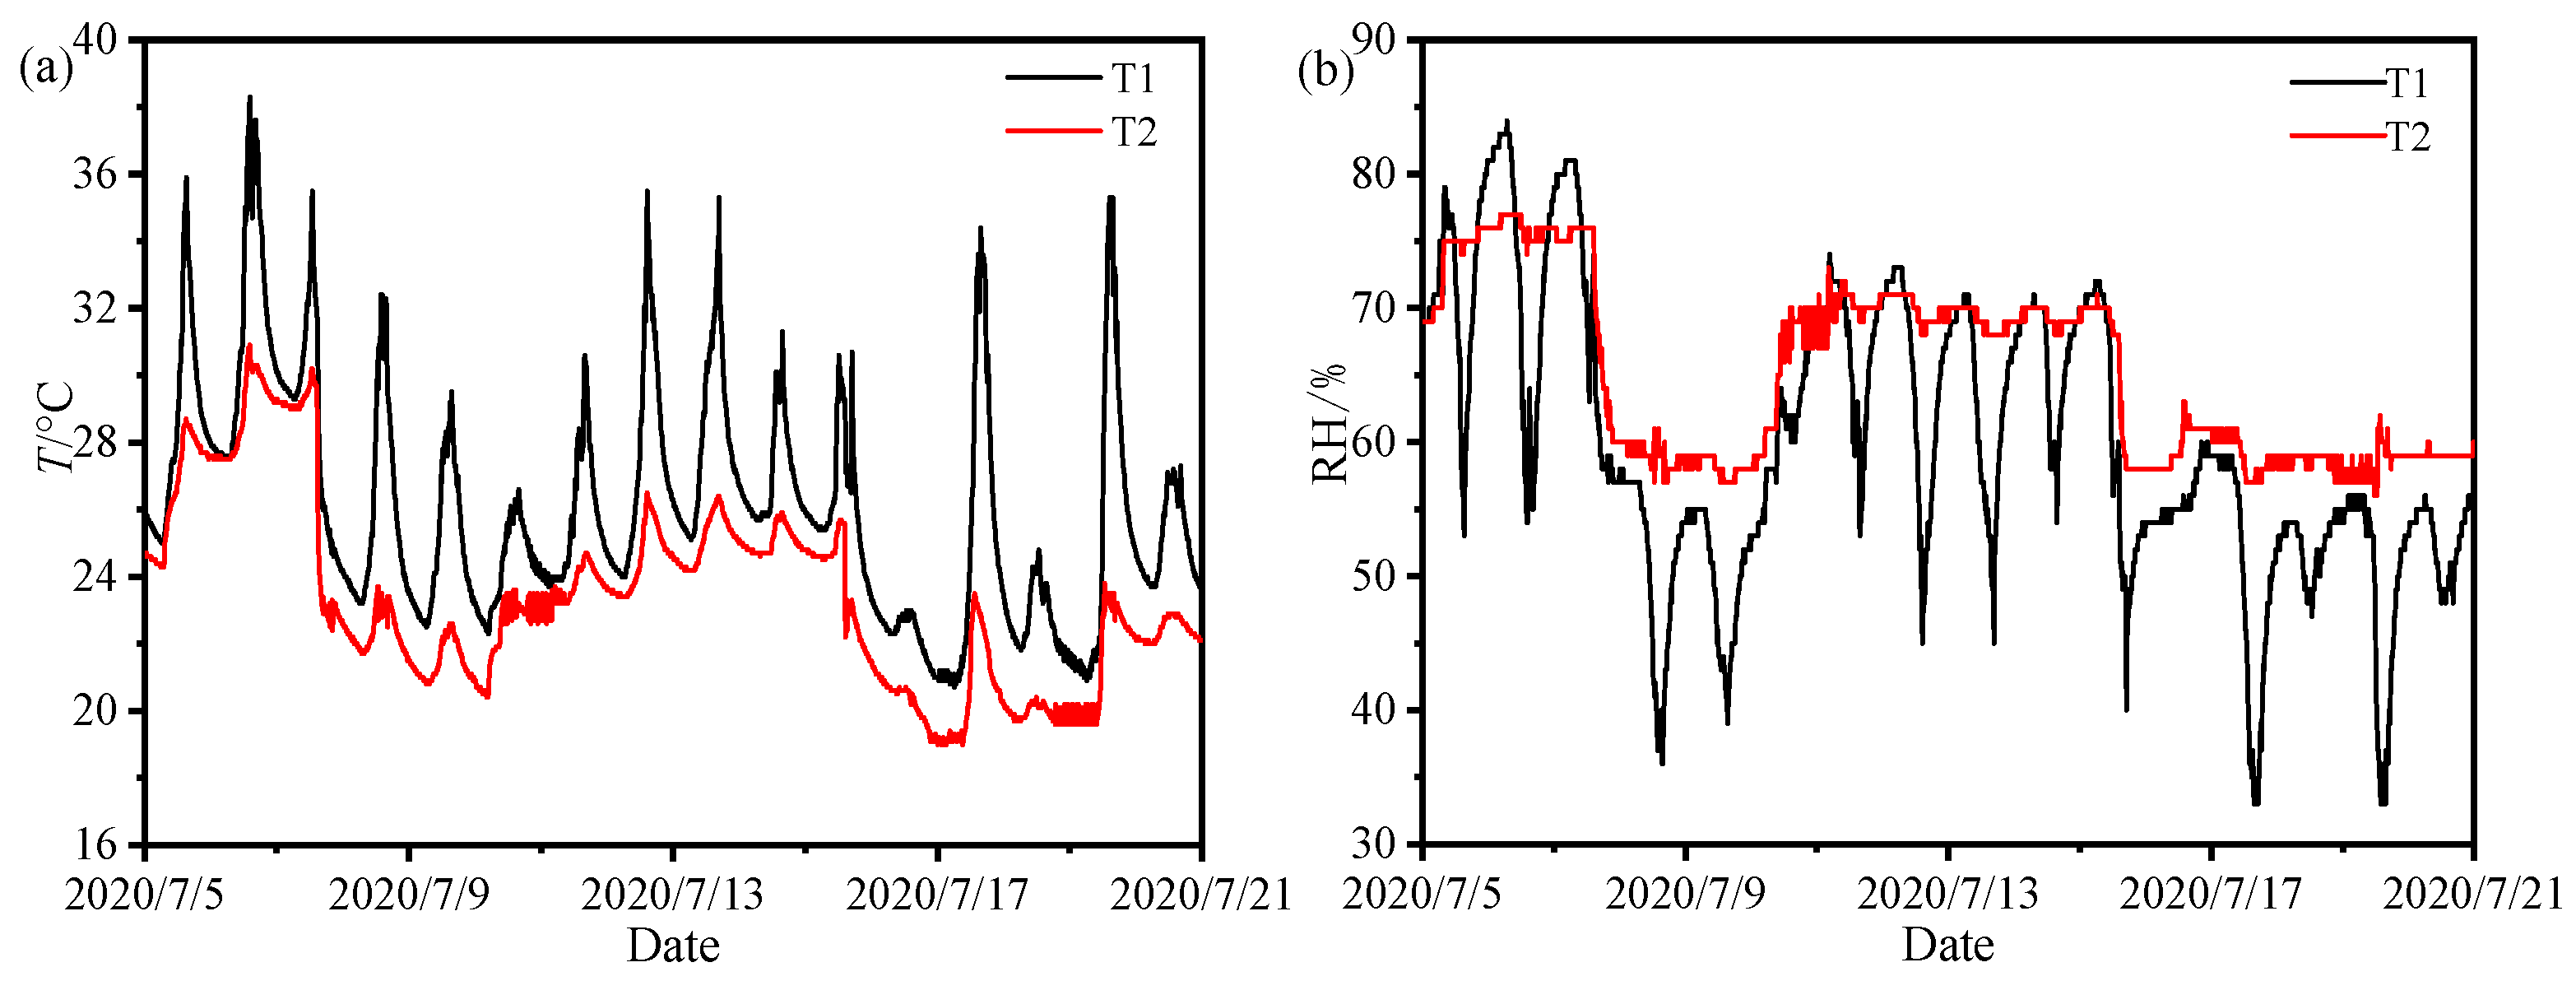
Figure 10 shows the distribution of temperature and relative humidity at points T1 and T2 within the exhibition hall, while Table 6 presents the statistical values of these measurements. During the test period, the average temperature at point T1 under the illuminated area was 25.7 °C, with an average diurnal temperature fluctuation of 7.4 °C, both significantly exceeding the recommended average value of 20 °C and the maximum fluctuation limit of 5 °C as per the “Museum Building Design Standards” (JGJ 66-2015) [27]. In contrast, at the non-illuminated area under the concrete roof, the average temperature at point T2 was 23.3 °C, with an average diurnal fluctuation of 2.7 °C. Although these values are slightly above the recommended 20 °C, the excess is minor. This is mainly due to the influence of solar radiative heat from the large, illuminated area, while the temperature fluctuation meets the standard’s maximum limit of 5 °C. The distribution of relative humidity mirrors that of temperature. The average relative humidity at points T1 and T2 was 58.5% and 68.7%, respectively, with diurnal fluctuations of 16.1% and 6.6%. The fluctuation in the illuminated area at T1 significantly exceeds the recommended maximum limit of 5% [27]. The statistical data reveal that rooftop skylights significantly impact the environmental conditions in heritage conservation areas. Under direct sunlight, the temperature and humidity fluctuations in illuminated areas are pronounced, making it challenging to maintain the stable environmental conditions required for preserving artifacts.
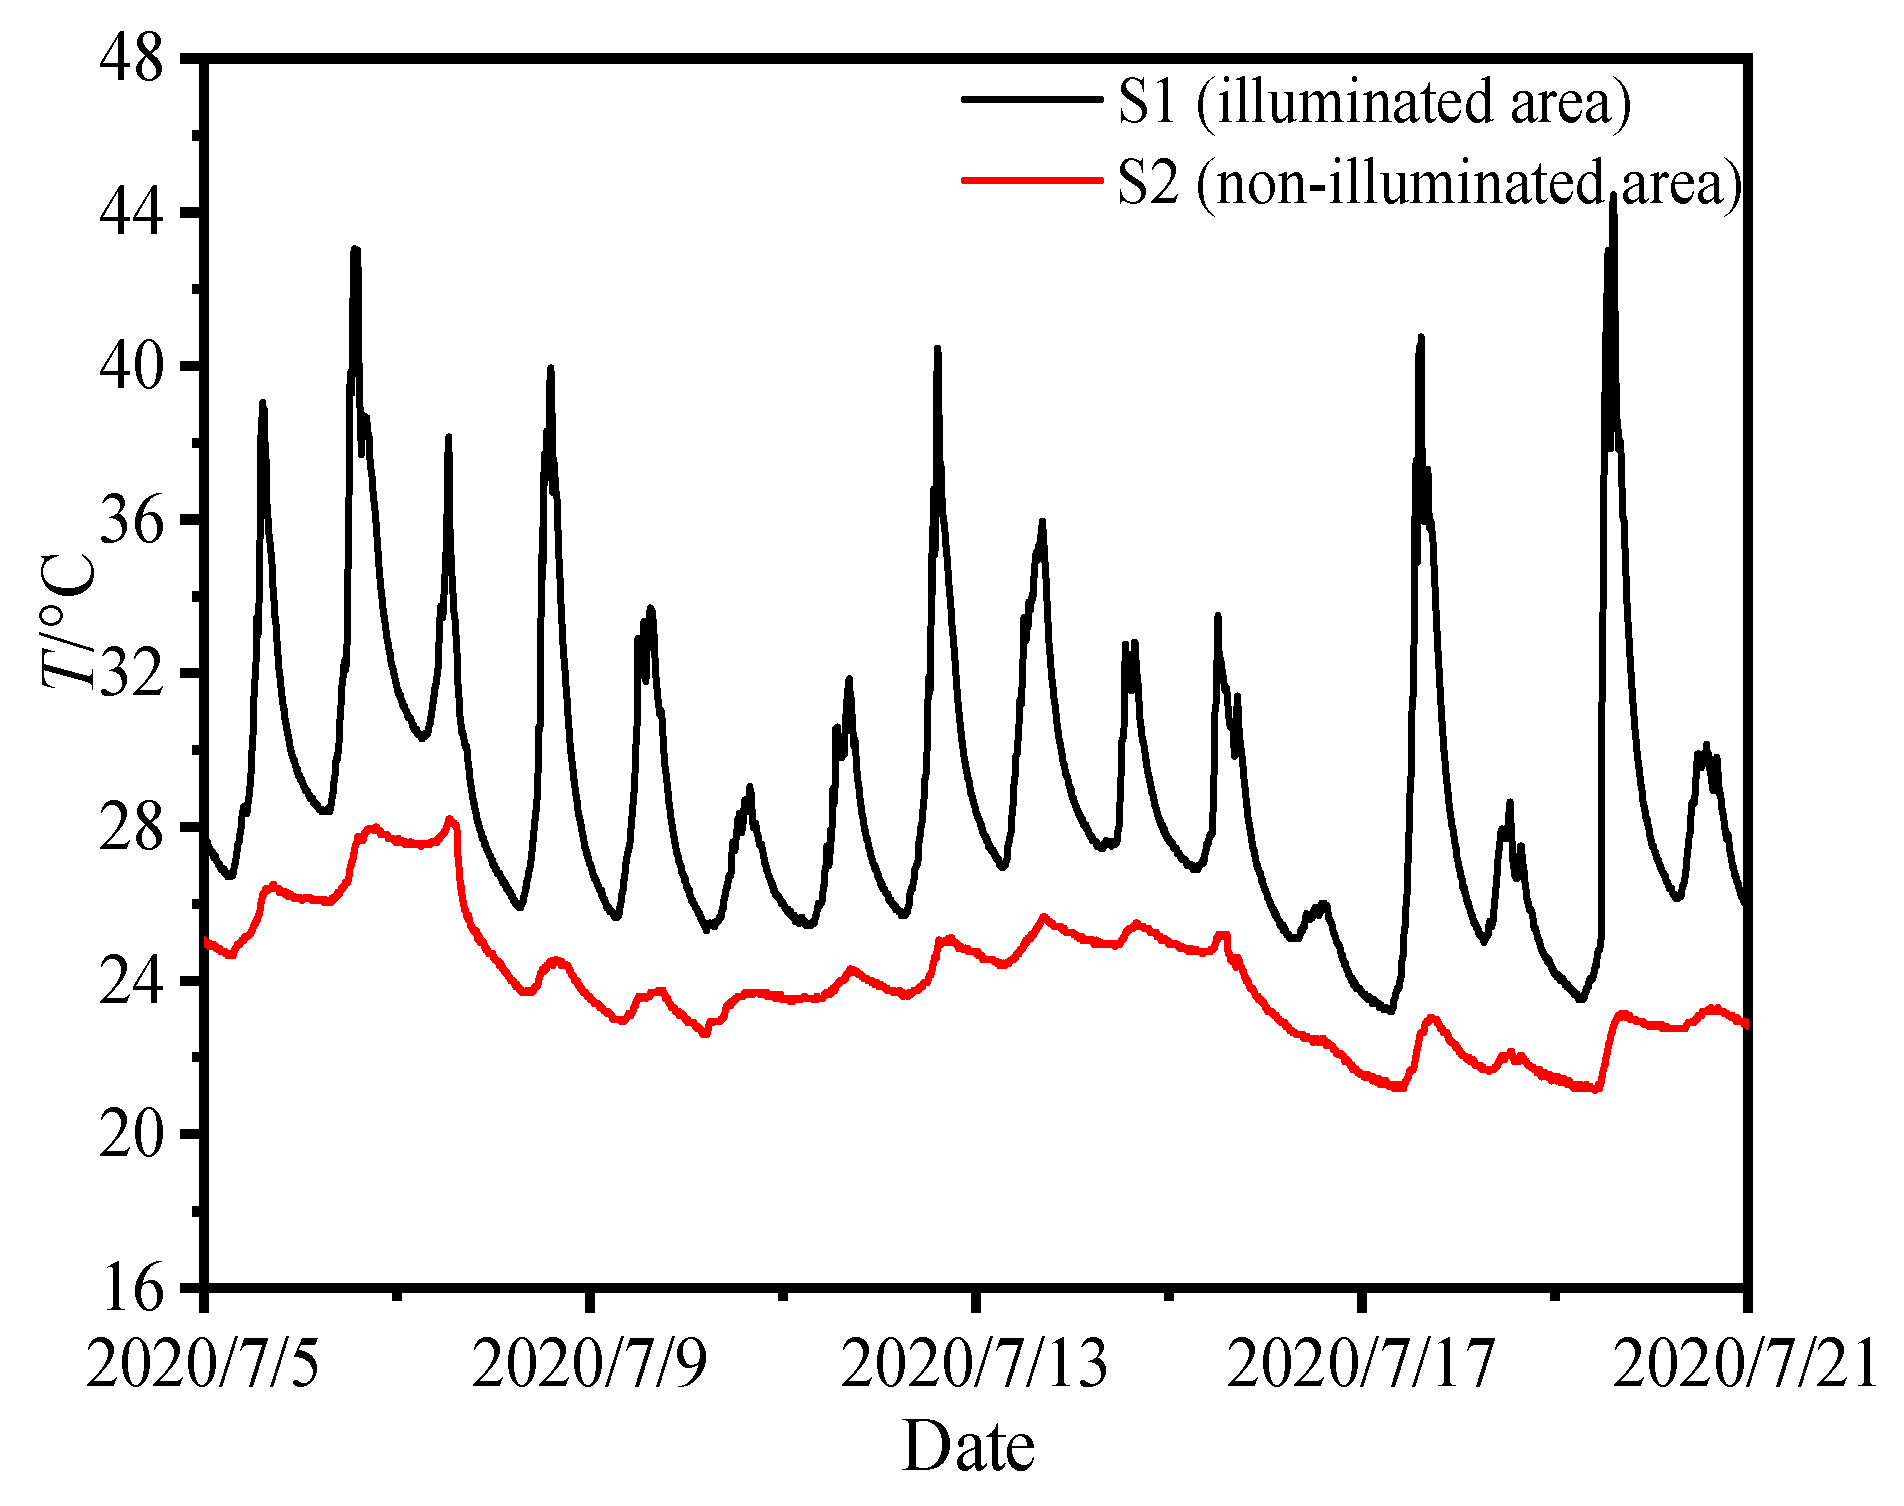
Figure 11 shows the temperature distribution on the surface of the earthen site at measurement points S1 and S2, with Table 7 presenting the corresponding temperature statistics. The charts indicate significant temperature fluctuations at the earthen site in illuminated areas. During the monitoring period, the highest temperature at point S1 reached 44.5 °C, with an average temperature of 28.8 °C and an average diurnal temperature variation of 9.8 °C. In contrast, the average temperature at the non-illuminated area’s measurement point S2 was significantly lower, at only 24.0 °C, with an average diurnal temperature variation of just 1.5 °C. The test results indicate that solar radiation introduced through transparent glass causes unstable temperature fluctuations in the earthen site itself, and the environmental control system has not effectively regulated temperatures in the illuminated areas. Therefore, implementing shading measures is essential to improve the effectiveness of the environmental control system.

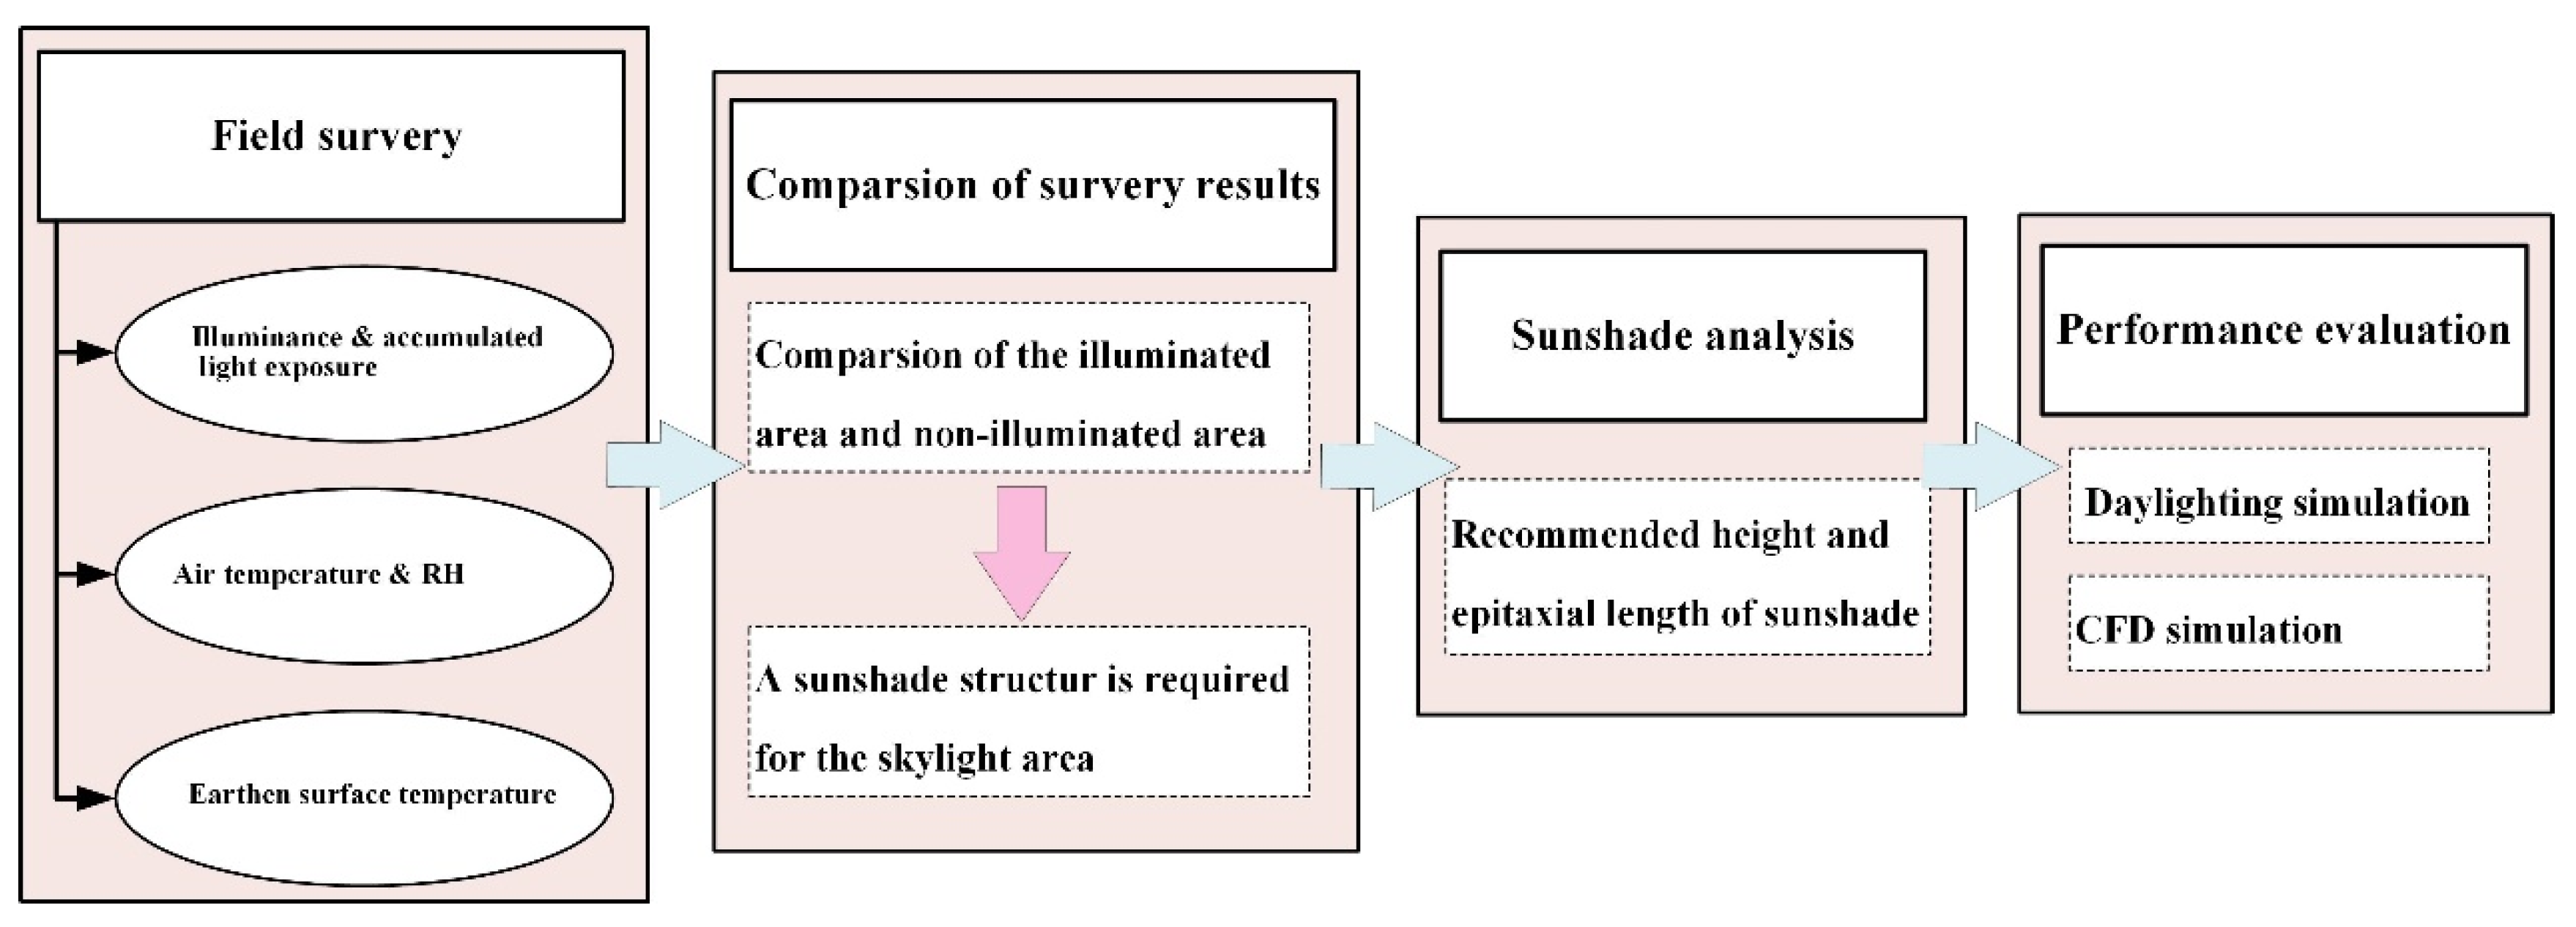
5. Protective Shading Structure Plan for the Site

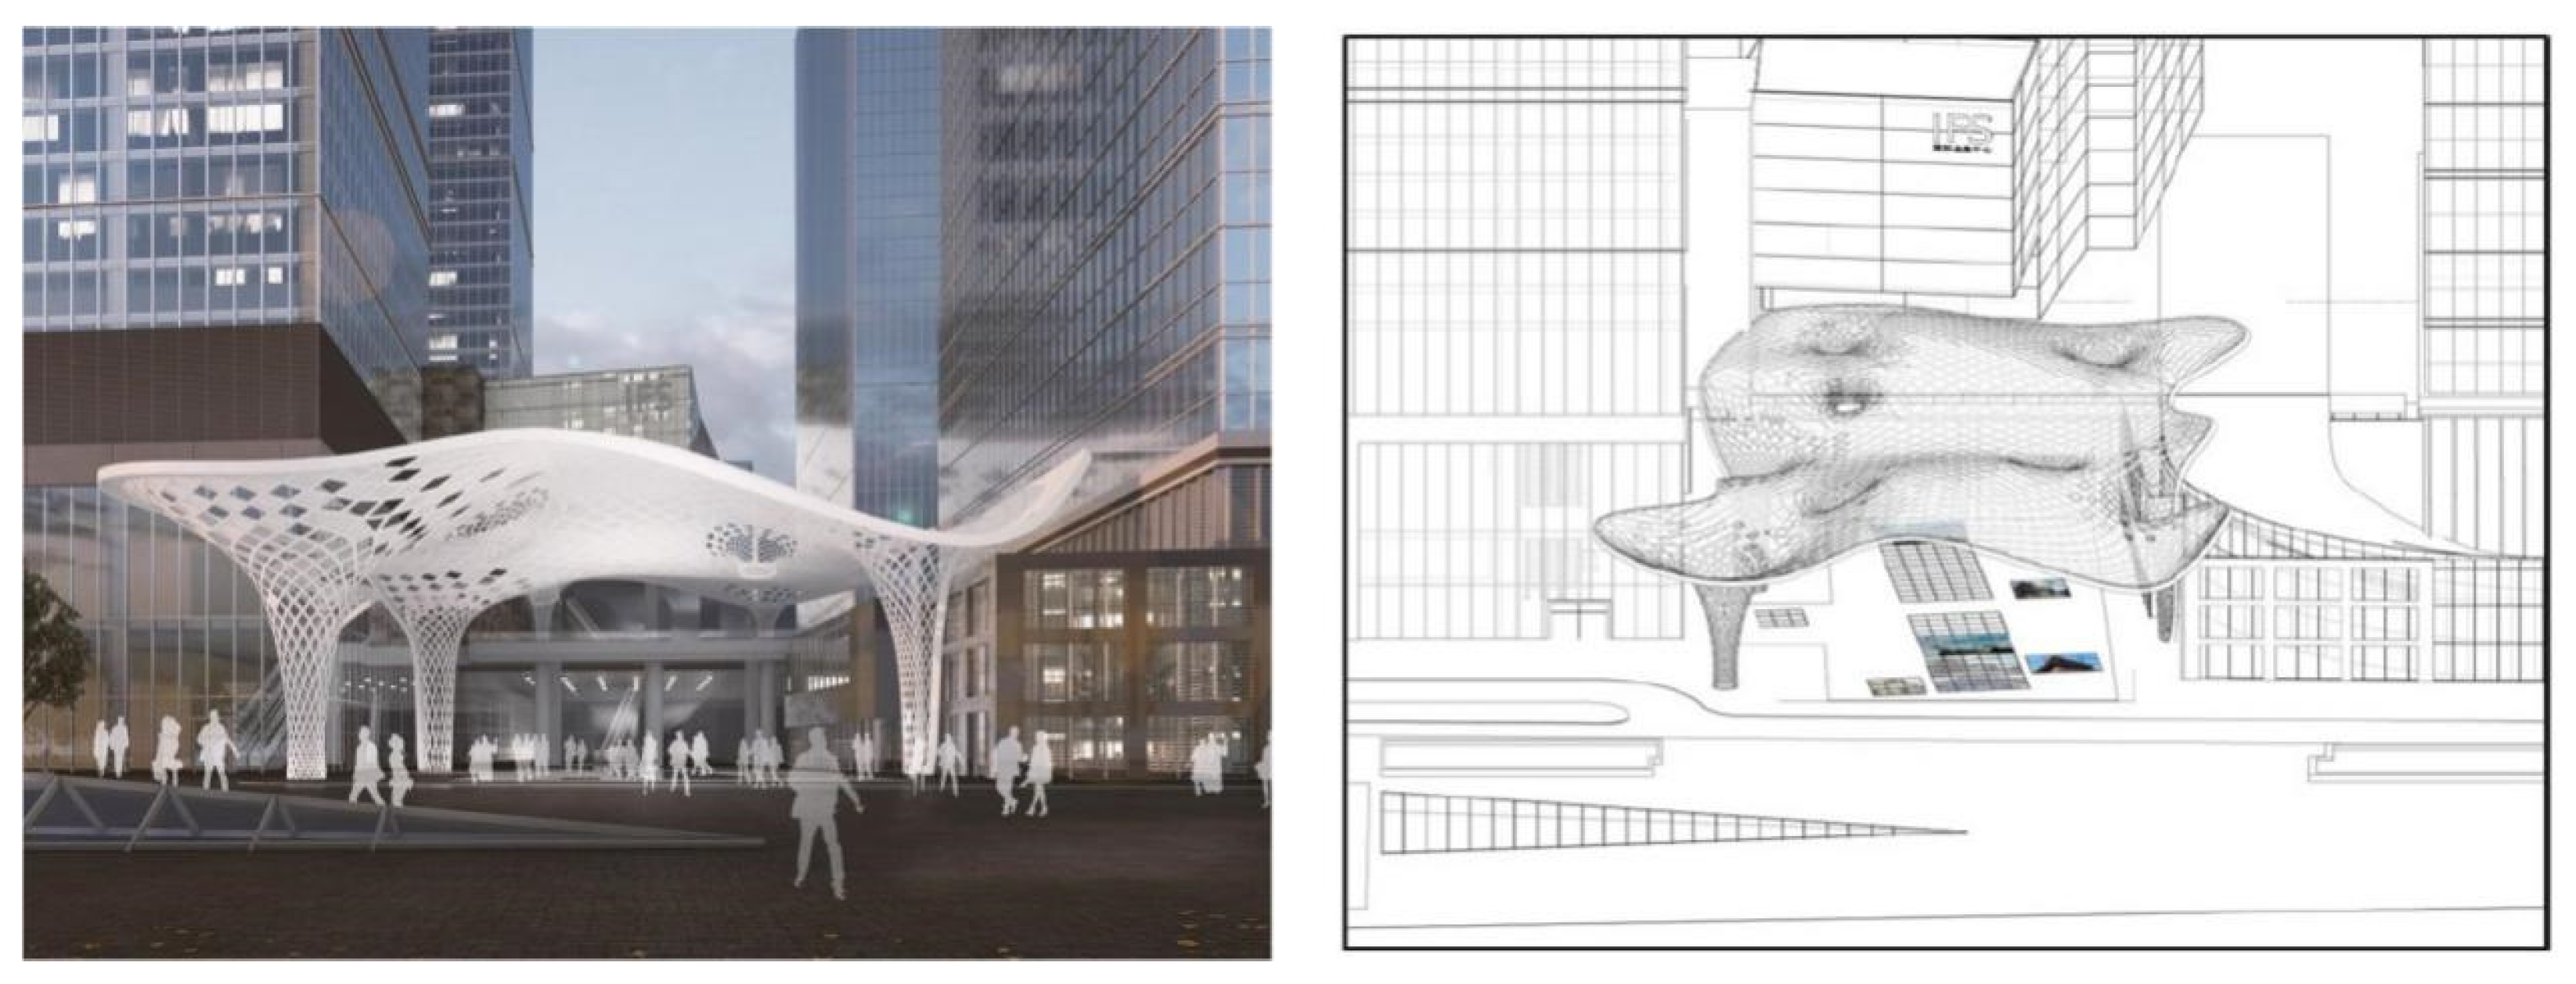
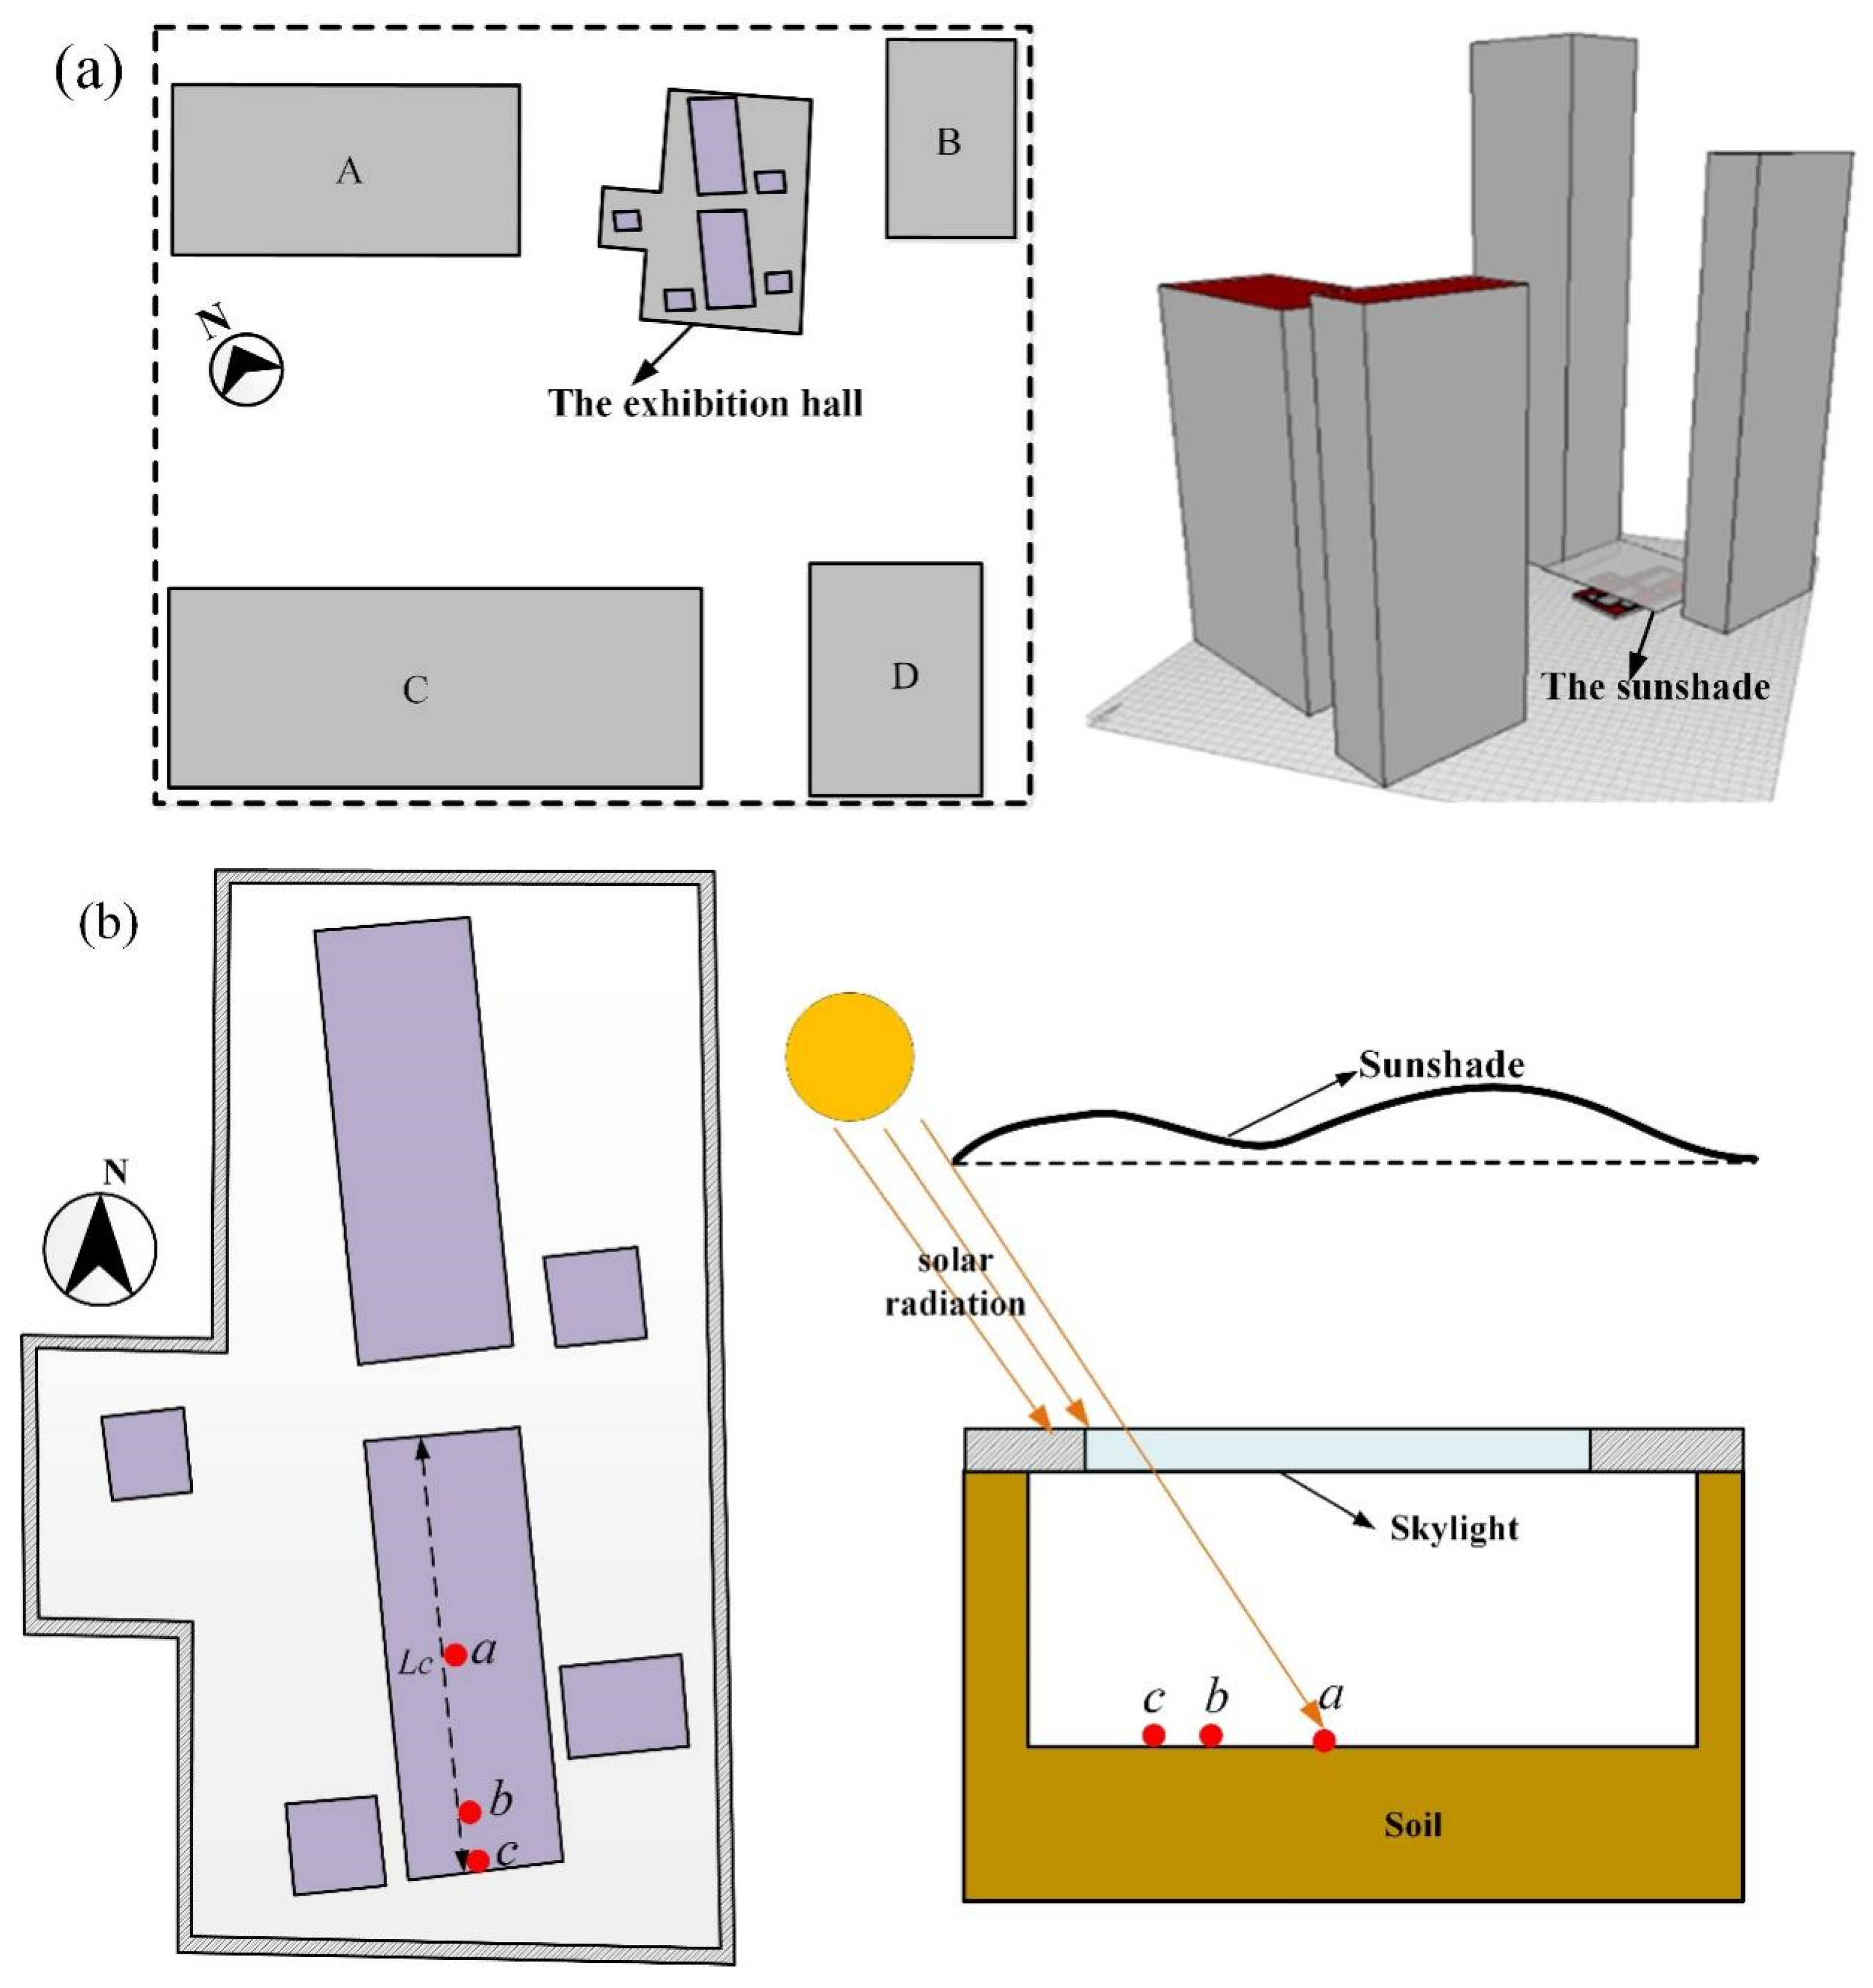
Comprehensive analysis and numerical simulation results indicate that direct sunlight through the glass roof of the exhibition hall has accelerated the occurrence of environmental diseases affecting artifacts at the Chengdu Jiangnan Pavilion Street site. Therefore, implementing shading measures to block direct sunlight and rainwater will help prevent the occurrence of these environmental diseases. Given that the rooftop plaza above the Chengdu Jiangnan Pavilion Street site serves as an entrance and emergency access for the IFS Center, it is inappropriate to use permanent architectural structures for shading. This study draws on the tensioned membrane structure of the new Arc de Triomphe entrance in France [28], designing a tensioned membrane shading structure above the Chengdu Jiangnan Pavilion Street site that does not interfere with tourist observation or plaza functionality (see Figure 12). Additionally, the effects of this shading solution were predicted using the aforementioned lighting simulation software (Ecotect Analysis 2011) in conjunction with computational fluid dynamics for the indoor environment.
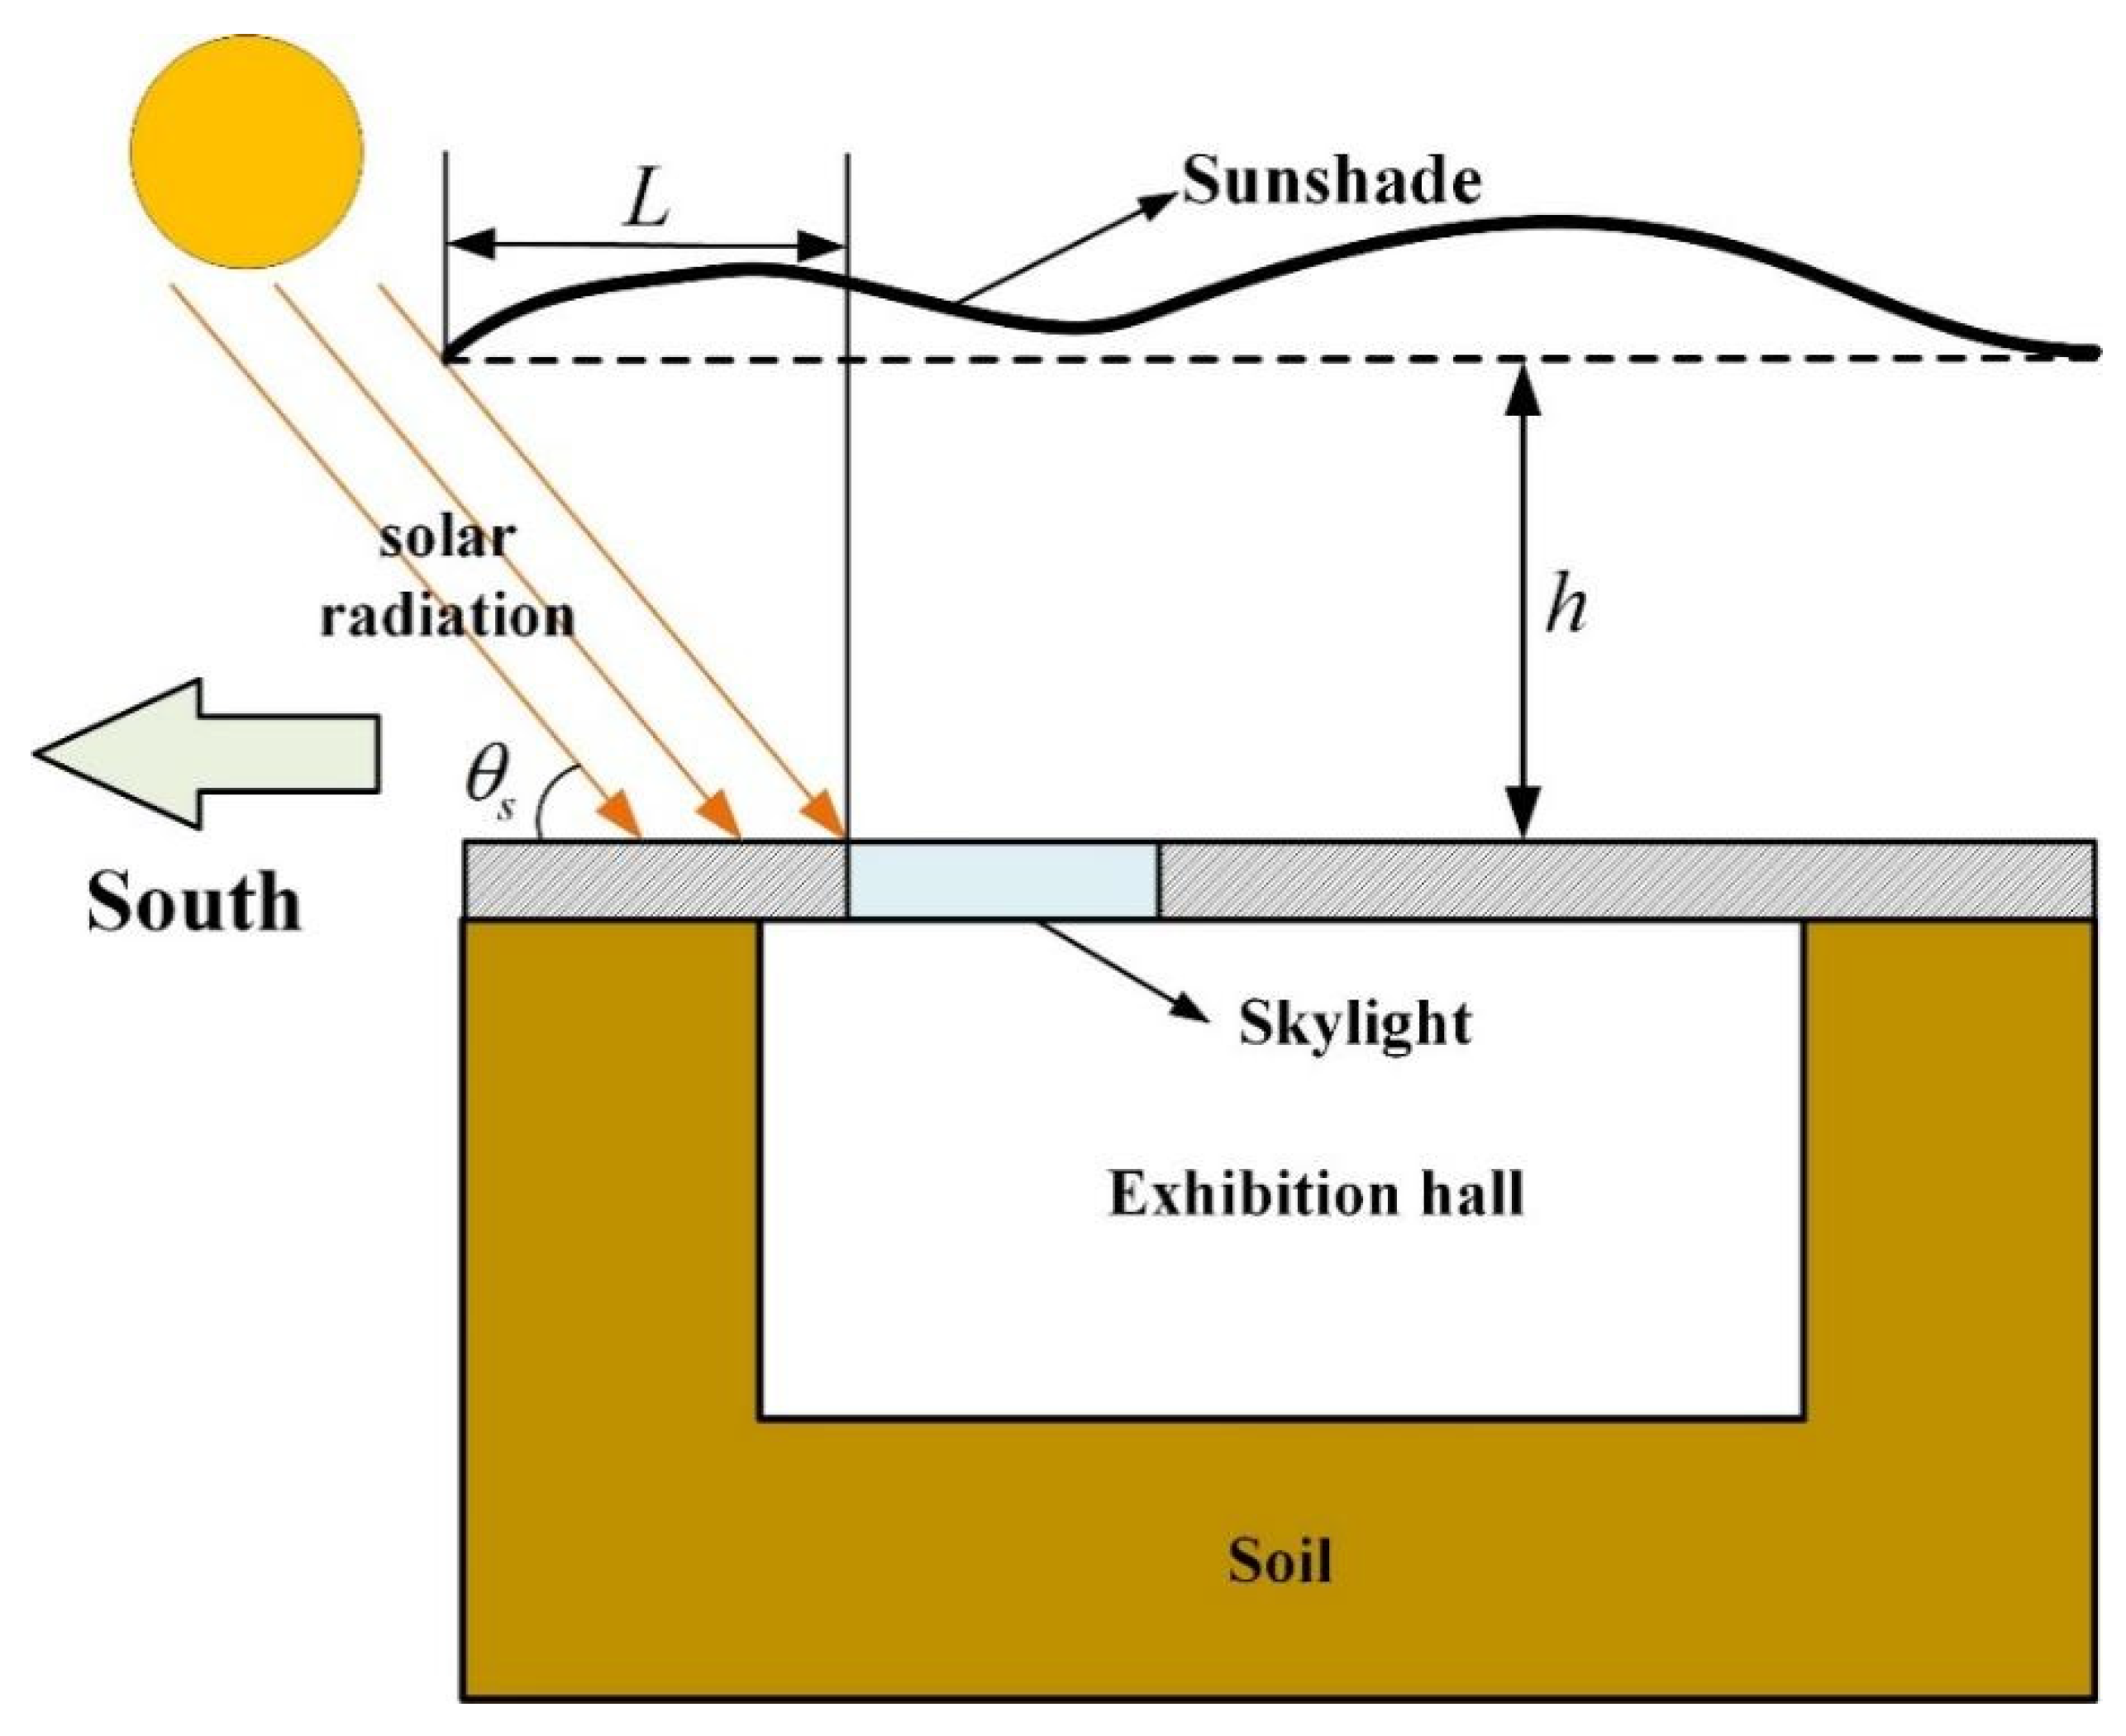
Figure 13 illustrates the relationship between the height and width of the shading structure and the solar altitude angle. Given that Chengdu’s Jiangnan Museum Street is in the Northern Hemisphere, the design of the shading structure primarily focuses on the southward extension length L (as shown in Figure 13), which can be estimated using Equation (2) based on the projection relationship.
L = h tan θ s
In the formula, h represents the height of the shading structure, and θ s denotes the solar altitude angle. Considering the solar altitude angle θ s , in winter, a longer L is required for effective shading due to the lower solar altitude. Additionally, the higher the shading structure height h, the longer L is needed to shade the glass roof location. As the site is located in the city center and constrained by the main municipal road to the south of the site plaza, the maximum value of L is set to not exceed 2 m. Considering that summer has the strongest outdoor solar radiation, the solar altitude angle at 16:00 on the summer solstice should be chosen to determine the projection length in the southward direction of the building. Additionally, due to the height restrictions of surrounding buildings, the height h of the exhibition hall is set to not exceed 8 m.
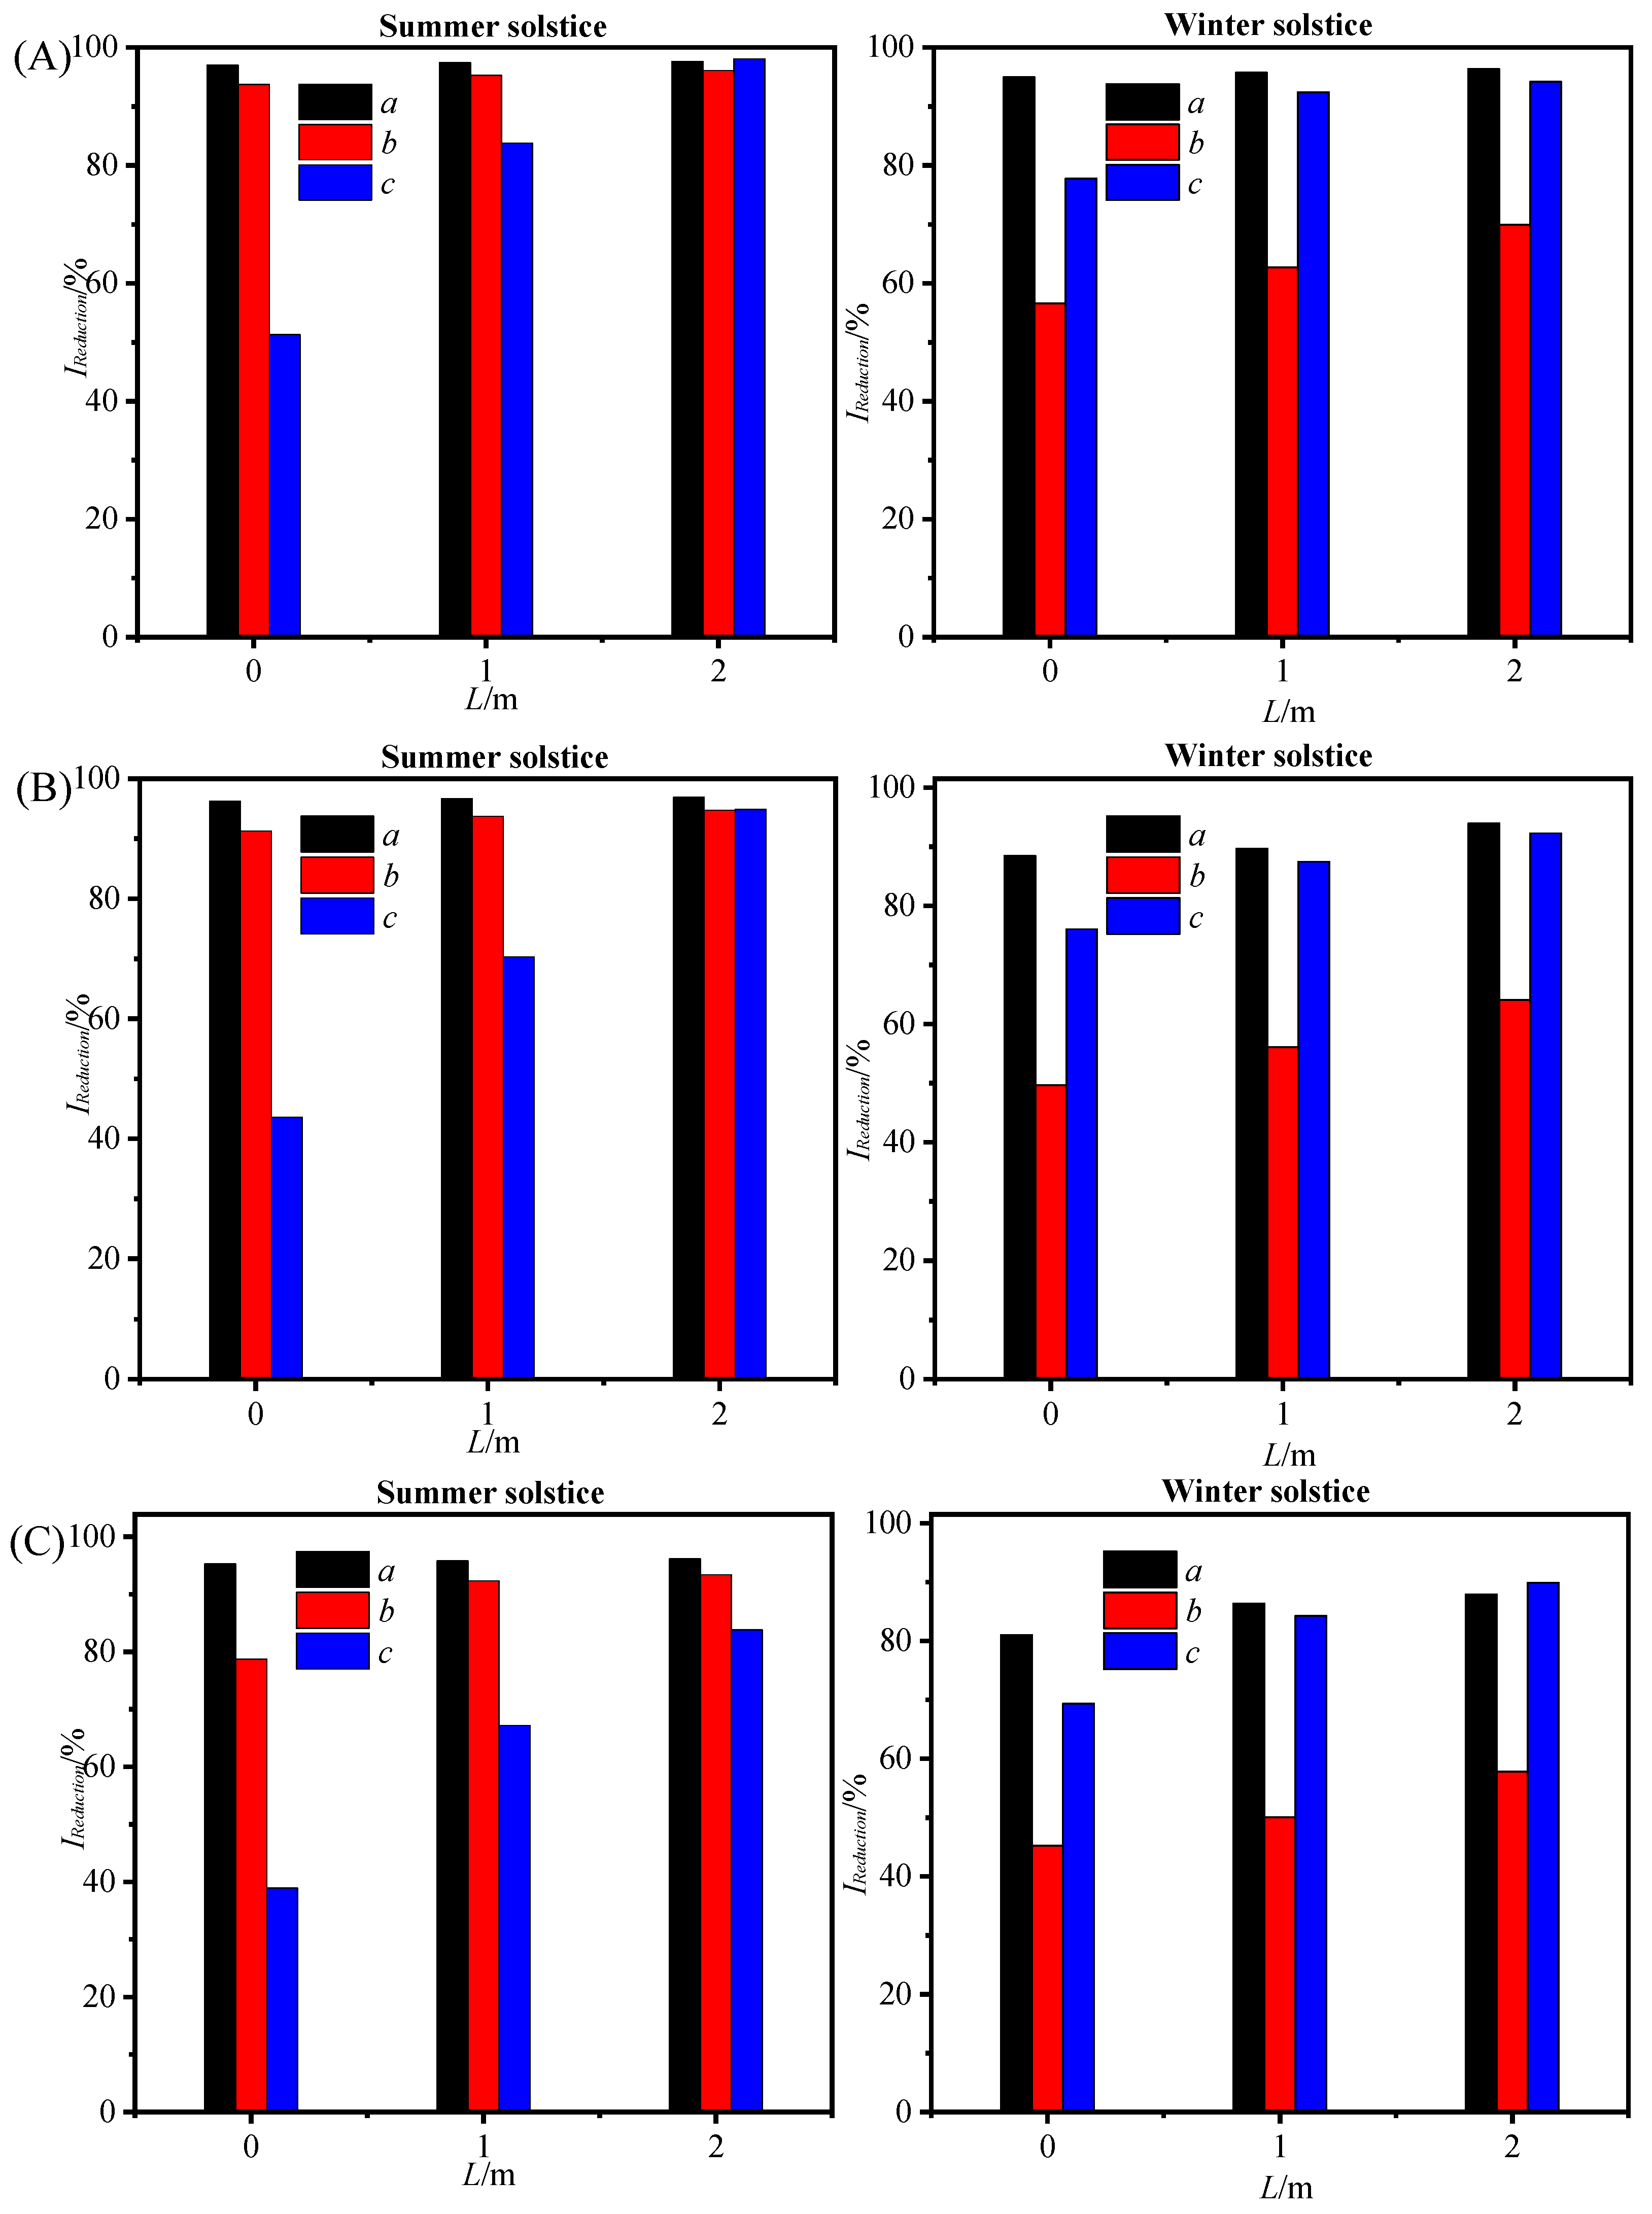
This study finds that the effectiveness of a sunshade in a museum is influenced by the solar altitude angle, with taller sunshades casting larger shadows and proving more effective in winter due to the lower solar angle. Adjusting the sunshade’s height changes the area it covers, requiring a proportional increase in its extension length to maintain consistent shadow coverage. Moreover, taller and longer sunshades enhance thermal comfort and energy efficiency by reducing heat gain. However, the museum’s location in a busy commercial district with high-rise buildings imposes spatial constraints on sunshade construction. Therefore, the design must consider these limitations to achieve optimal shading while being mindful of the surrounding urban landscape and cityscape impact, balancing shade effectiveness with space constraints. To further this study, an evaluation of the impact of different exhibition hall heights h (4 m, 6 m, and 8 m) and extension lengths L (0 m, 1 m, and 2 m) on shading effectiveness was conducted, as detailed in Table 8. This evaluation also includes a comparison with scenarios where no shading structure is present, providing a comprehensive understanding of the sunshade’s impact.

6. Assessment of the Shading Display Plan for the Site

6.1. Evaluation of Shading Effectiveness

Figure 14 presents a simplified model of the shading structure based on the improved scheme. The dimensions of buildings A, B, C, and D surrounding the site’s exhibition hall are detailed in Reference [25]. The tensioned membrane material of the shading structure is selected for its high reflectivity and low visible light transmittance, with a reflectivity of 70% and a transmittance of 15% set in the simulation. To compare lighting effects, three sampling points were set on the transparent glass shown in Figure 14b. Point a is located at the southernmost side of the glass, point b at a distance 1 6 L c from the southernmost side, and point c at a distance 1 2 L c from the southernmost side. This study evaluates the effect of differently sized shading structures on the exhibition hall’s lighting environment by calculating the illumination reduction rate at representative points. The equation for calculating the illumination reduction rate is as follows:
I Reduction = I w i t h o u t   s u n s h a d e I w i t h   s u n s h a d e I w i t h o u t   s u n s h a d e %
In the formula, I w i t h   s u n s h a d e and I w i t h o u t   s u n s h a d e , respectively, represent the annual cumulative illumination with and without shading measures, measured in /lx·h·y – 1.
Figure 15 presents the cumulative exposure attenuation rates at positions a, b, and c on the summer and winter solstices. Overall, with the same height of the shading structure, as the extension length increases, the attenuation of cumulative exposure intensity on the surface of the earthen site becomes more pronounced, especially at point c near the outer edge of the shading structure. Taking the position c with a shading structure height of h = 4 m as an example, when the extension increases from 0 m to 2 m, the exposure intensity attenuation on the summer solstice increases from 51.34% to 98.08%, and on the winter solstice, from 77.79% to 94.18%. With the same extension length, an increase in the height of the shading structure leads to reduced shading effectiveness. For example, at position c with an extension length of L = 2 m, as the height of the shading structure increases from 4 m to 8 m, the cumulative radiation attenuation rate on the summer solstice decreases from 98.08% to 83.79%, and on the winter solstice, from 94.18% to 89.93%. Based on the above calculations, it is recommended to choose a shading structure height of 4 m or 6 m and an extension length of 2 m.

6.2. The Impact of Shading on Environmental Temperature

A CFD (Computational Fluid Dynamics) model was used to compare the air temperature inside the exhibition hall with and without shading, assuming the glass roof is completely covered in the shading scenario. Figure 16 and Figure 17, respectively, show the temperature cloud diagrams at horizontal sections 0.05 m and 0.8 m above the ground in the exhibition hall, without and with shading. Without shading, the indoor temperature distribution is significantly affected by solar radiation through the glass roof, reaching around 34 °C under the glass roof, while it remains between 20 °C and 27 °C under the opaque concrete roof. Furthermore, due to heat diffusion caused by air circulation, the temperature in the artifact preservation environment under the concrete roof is also significantly higher than the 20 °C set by the environmental control system. After implementing the shading solution, the highest temperature in the exhibition hall dropped from 34 °C to 24 °C, with the space temperature generally maintained between 21 °C and 22 °C. This study selected six representative points in the exhibition hall (as shown in Figure 8b) and compared their temperatures before and after improvement, with results listed in Table 9.

7. Conclusions

This research, undertaken at the Jiangnan Guan Street site museum in Chengdu, focused on tackling the issues posed by skylight illumination in exhibition halls. Our aim was to harmonize the needs of artifact conservation with the requirements of tourist observation and urban functions. Our findings reveal that despite its aesthetic appeal, skylight illumination may not be ideal for artifacts in soil–air conservation settings, as inorganic materials often do not react to light. A major result of this study is the suggestion to incorporate tensioned membrane shades into the hall’s roof, effectively improving the conservation conditions for artifacts impacted by the skylight.
Our analysis indicates that direct sunlight penetrating the exposed roof greatly exacerbates the instability and degradation of soil artifacts. Implementing the sunshade significantly enhanced artifact storage by moderating temperature fluctuations and reducing solar exposure, offering a sustainable preservation method for artifacts in urban areas. Employing computational fluid dynamics and daylighting simulations, we gathered concrete proof of the sunshade’s role in stabilizing the artifact preservation environment.
These results are especially pertinent to the protection of the Chengdu Jiangnan Pavilion Street site, indicating novel environmental control strategies for urban site museums. Additionally, this study emphasizes the importance for policy makers to contemplate the renovation and enhancement of such exhibition halls. The comparative outcomes of our CFD and daylighting simulations clearly advocate the advantages of sunshade structures, aiding in persuading policy makers to endorse environmental upgrades.
However, a challenge exists in the urban placement of many site museums, where the size of sunshade structures is limited by the surrounding buildings. As shown in our case study, this limitation means full site coverage is not always achievable. Nevertheless, CFD and daylighting simulations prove invaluable in predicting design scheme performance and guiding optimization efforts.

8. Limitations and Further Research

Although the sunshade structure is found to effectively upgrade the preservation environment of the exhibition hall with a skylight, the following limitations should be considered for further investigation and evaluation:
(1)
The shading structure proposed in this research will, on the one hand, reduce the operating energy consumption of the air conditioning system in summer, but at the same time, it will increase the operating energy consumption of air conditioning in winter, and the energy consumption of lighting will also increase, a systematic comparative analysis must be conducted in further.
(2)
Only a very simple shading structure was investigated in this manuscript, and further design schemes varying the geometrical dimension of the sunshade and light transmission coefficient of the membrane structure should be evaluated in the future.

Author Contributions

Conceptualization, X.L. (Xilian Luo) and F.S.; methodology, X.L. (Xilian Luo); software, X.L. (Xilian Luo); investigation, X.L. (Xinrong Li) and S.Y.; writing—original draft preparation, F.S. and X.L. (Xilian Luo); writing—review and editing, X.L. (Xilian Luo), J.L. and B.C.; supervision, X.L. (Xilian Luo); funding acquisition, X.L. (Xilian Luo). All authors have read and agreed to the published version of the manuscript.

Funding

This research was funded by the Opening Funds of State Key Laboratory of Building Safety and Built Environment & National Engineering Research Center of Building Technology, grant number BSBE2021-13, and the National Natural Science Foundation of China, grant number 52078417.

Institutional Review Board Statement

Not applicable.

Informed Consent Statement

Not applicable.

Data Availability Statement

The data presented in this study are available on request from the corresponding author.

Conflicts of Interest

The authors declare no conflict of interest.

References

  1. Li, Z.; Wang, X.; Sun, M.; Chen, W.; Guo, Q.; Zhang, H. Conservation of Jiaohe ancient earthen site in China. J. Rock Mech. Geotech. 2011, 3, 270–281. [Google Scholar] [CrossRef]
  2. Chinese National Committee for the International Council on Monuments and Sites. Principles for Conservation of Heritage Site in China; Cultural Relics Press: Beijing, China, 2015. [Google Scholar]
  3. Yang, S.; Wu, L.; Wu, B.; Zhang, Y.; Wang, H.; Tan, X. Diversity and structure of soil microbiota of the Jinsha earthen relic. PLoS ONE 2020, 15, e0236165. [Google Scholar] [CrossRef] [PubMed]
  4. Luo, X.L.; Chang, B.; Tian, W.; Li, J.; Gu, Z.L. Experimental study on local environmental control for historical site in archaeological museum by evaporative cooling system. Renew. Energy 2019, 143, 798–809. [Google Scholar] [CrossRef]
  5. Lv, J.; Zhou, T.; Du, Q.; Wu, H. Experimental investigation on properties of gypsum-quicklime-soil grout material in the reparation of earthen site cracks. Constr. Build Mater. 2017, 157, 253–262. [Google Scholar] [CrossRef]
  6. Xia, Y.; Ma, Q.; Zhang, Z.; Liu, Z.; Feng, J.; Shao, A.; Wang, W.; Fu, Q. Development of Chinese barium copper silicate pigments during the Qin Empire based on Raman and polarized light microscopy studies. J. Archaeol. Sci. 2014, 49, 500–509. [Google Scholar] [CrossRef]
  7. Hu, T.F.; Lee, S.C.; Cao, J.J.; Chow, J.C.; Watson, J.G.; Ho, K.F.; Ho, W.K.; Rong, B.; An, Z.S. Characterization of winter airborne particles at Emperor Qin’s Terra-cotta Museum, China. Sci. Total Environ. 2009, 407, 5319–5327. [Google Scholar] [CrossRef]
  8. Garside, D.; Curran, K.; Korenberg, C.; MacDonald, L.; Teunissen, K.; Robson, S. How is museum lighting selected An insight into current practice in UK museums. J. Inst. Conserv. 2017, 40, 3–14. [Google Scholar] [CrossRef]
  9. La Gennusa, M.; Rizzo, G.; Scaccianoce, G.; Nicoletti, F. Control of indoor environments in heritage buildings: Experimental measurements in an old Italian museum and proposal of a methodology. J. Cult. Herit. 2005, 6, 147–155. [Google Scholar] [CrossRef]
  10. Khaled, A.A.S.; Amira, R.A.E.; Maitha, B.D. UAE heritage buildings converted into museums: Evaluation of daylighting effectiveness and potential risks on artifacts and visual comfort. Energ Build. 2018, 176, 333–359. [Google Scholar]
  11. CIE157; Control of Damage to Museum Objects by Optical Radiation. Commission Internationale De L’eclairage: Austria, Vienna, 2004.
  12. Illuminating Engineering Society of North America. Museum and Art Gallery Lighting: A Recommended Practice; Illuminating Engineering Society of North America: New York, NY, USA, 1996. [Google Scholar]
  13. Camuffo, D.; Del Monte, M.; Sabbioni, C.; Vittori, O. Wetting, deterioration and visual features of stone surfaces in an urban area. Atmos. Environ. 1982, 16, 2253–2259. [Google Scholar] [CrossRef]
  14. ASHRAE Handbook. HVAC applications Chapter 23: Museum, galleries, archives, and libraries. In American Society of Heating, Refrigerating and Air-Conditioning Engineers, SI Edition; ASHRAE: Atlanta, GA, USA, 2015. [Google Scholar]
  15. Lucchi, E. Review of preventive conservation in museum buildings. J. Cult. Herit. 2018, 29, 180–193. [Google Scholar] [CrossRef]
  16. Thomson, G. Conservation in the museums of the United Kingdom. Mus. Int. 1971, 23, 134–145. [Google Scholar] [CrossRef]
  17. Gennusa, M.L.; Lascari, G.; Rizzo, G.; Scaccianoce, G. Conflicting needs of the thermal indoor environment of museums: In search of a practical compromise. J. Cult. Herit. 2008, 9, 125–134. [Google Scholar] [CrossRef]
  18. Li, H.; Wang, W.; Zhan, H.; Qiu, F.; Guo, Q.; Sun, S.; Zhang, G. The effects of atmospheric moisture on the mural paintings of the Mogao Grottoes. Stud. Conserv. 2017, 62, 229–239. [Google Scholar] [CrossRef]
  19. del Hoyo-Meléndez, J.M.; Mecklenburg, M.F.; Doménech-Carbó, M.T. An evaluation of daylight distribution as an initial preventive conservation measure at two Smithsonian Institution Museums, Washington DC, USA. J. Cult. Herit. 2011, 12, 54–64. [Google Scholar] [CrossRef]
  20. Kim, C.S.; Chung, S.J. Daylighting simulation as an architectural design process in museums installed with toplights. Build. Environ. 2011, 46, 210–222. [Google Scholar] [CrossRef]
  21. Zou, W.; Yeo, S.Y. Investigation on the Painting Materials and Profile Structures Used in Ancient Chinese Folk Architectural Paintings by Multiple Analytical Methods. Coatings 2022, 12, 320. [Google Scholar] [CrossRef]
  22. Sahin, C.D.; Coşkun, T.; Arsan, Z.D.; Akkurt, G.G. Investigation of indoor microclimate of historic libraries for preventive conservation of manuscripts. Case Study: Tire Necip Paşa Library, İzmir-Turkey. Sustain. Cities Soc. 2017, 30, 66–78. [Google Scholar] [CrossRef]
  23. Cao, J.J.; Rong, B.; Lee, S.C.; Chow, J.C.; Ho, K.F.; Liu, S.X.; Zhu, C.S. Composition of indoor aerosols at Emperor Qin’s Terra-cotta Museum, Xi’an China, during summer, 2004. China Particuology 2005, 3, 170–175. [Google Scholar] [CrossRef]
  24. Hu, T.F.; Jia, W.T.; Cao, J.J.; Huang, R.J.; Li, H.; Liu, S.X.; Ma, T.; Zhu, Y.Q. Indoor air quality at five site museums of Yangtze River civilization. Atmos. Environ. 2015, 123, 449–454. [Google Scholar] [CrossRef]
  25. Luo, X.L.; Zhu, X.Y.; Tian, W.; Gu, Z.L. The negative impact of skylights on light-irresponsive historical sites within archaeological museums: A case study. Sol. Energy 2020, 202, 104–114. [Google Scholar] [CrossRef]
  26. Gu, Z.L.; Luo, X.L.; Meng, X.Z.; Wang, Z.S.; Ma, T.; Yu, C.; Rong, B.; Li, K.; Li, W.W.; Tan, Y. Primitive environment control for preservation of pit relics in archaeology museums of China. Environ. Sci. Technol. 2013, 47, 1504–1509. [Google Scholar] [PubMed]
  27. Ministry of Housing and Urban-Rural Development of the People’s Republic of China. Code for Design Museum Building (JGJ 66-2015); China Building Industry Press: Beijing, China, 2015. [Google Scholar]
  28. Clouds of the Great Arch of La Défense. 2018. Available online: https://structurae.net/en/structures/clouds-of-the-great-arch-of-la-defense (accessed on 15 January 2020).
Figure 1. Exhibition hall of site museum. (a) Schematic of environmental factors affecting the preservation environment. (b) Skylight for exhibition hall. (c) Soil–air coupled preservation environment.
Sustainability 15 16929 g001
Figure 2. Exhibition hall of Chengdu Jiangnan Pavilion Street Site Museum. (a) Unearthed relics. (b) The exhibition hall.
Sustainability 15 16929 g002
Figure 3. Schematic of deteriorations in the exhibition hall.
Sustainability 15 16929 g003
Figure 4. Organization chart of the research methodology.
Sustainability 15 16929 g004
Figure 5. The arrangement of measurement sensors.
Sustainability 15 16929 g005
Figure 6. Geometric model of the exhibition hall. (a) Geometric model of the simulation. (b) Schematic of the air supply outlet.
Sustainability 15 16929 g006
Figure 7. Boundary condition measurements on 28 July 2020.
Sustainability 15 16929 g007
Figure 8. Computational mesh. (a) Computational mesh of the exhibition hall. (b) Observation points.
Sustainability 15 16929 g008
Figure 9. Measured illuminance at G1. (a) Illuminance at G1. (b) Daily accumulated light exposure.
Sustainability 15 16929 g009
Figure 10. Temperature distribution in the exhibition hall. (a) Temperature at T1 (illuminated area). (b) Temperature at T2 (non-illuminated area).
Sustainability 15 16929 g010
Figure 11. Earthen site surface temperature in the exhibition hall. Temperature at S1 (illuminated area). Temperature at S2 (non-illuminated area).
Sustainability 15 16929 g011
Figure 12. Conceptual drawing of the sunshade for Chengdu Jiangnan Pavilion Street Site Museum.
Sustainability 15 16929 g012
Figure 13. Schematic of sunshine and shading of sunshade.
Sustainability 15 16929 g013
Figure 14. Geometric model of the simulation. (a) Sketch plan of the entire simulation area. (b) Observation points.
Sustainability 15 16929 g014
Figure 15. Reduction ratio of daily accumulated light exposure. (A) h = 4 m. (B) h = 6 m. (C) h = 8 m.
Sustainability 15 16929 g015
Figure 16. Cloud diagram of the temperature distribution before shading. (a) Cross-section for at the height of 0.05 m. (b) Cross-section for at the height of 0.8 m.
Sustainability 15 16929 g016
Figure 17. Cloud diagram of the temperature distribution after shading. (a) Cross-section for at the height of 0.05 m. (b) Cross-section for at the height of 0.8 m.
Sustainability 15 16929 g017
Table 1. Illuminance and annual exposure limits for each material responsivity class.
Material ClassIlluminance Limit (lx)Exposure Limit (lx h/y)
Irresponsiveno limitno limit
Low-responsivity200600,000
Medium-responsivity50150,000
High-responsivity5015,000
Table 2. The measured parameters and instruments.
PositionParametersInstrumentsAccuracy
T1, T2Air temperature and RHTR-72Ui thermo recorder±0.3 °C, ±5%RH
S1, S2Earthen site temperatureK thermocouple0.4% × T
G1IlluminanceTES1334A illuminometer±3% × E
Table 3. Boundary conditions.
Boundary NameBoundary Condition
Top Skylight Area T = 44.7   ° C
Top Shading Area T = 28.2   ° C
Ground Direct Radiation Area T = 37.8   ° C
Ground Shading Area T = 25.2   ° C
Wall T = 25.9   ° C
Air Supply Vent Velocity and Temperature U ¯ = 2.1   m / s , T ¯ = 20.8   ° C
Table 4. Comparison of simulation and test results.
Measurement PointD1D2D3D4D5D6
Simulated Value34.222.133.921.433.927.6
Measured Value35.321.635.120.934.826.8
Table 5. The settings of the reflectivity of various surfaces and the transmittance of glass.
SurfaceRoofExternal WallGroundVentilation DuctGlass
Reflectivity/Transmittance (%)75.363.525.130.280.0
Table 6. Statistical values of temperature and RH at T1 and T2.
PositionT, °CRH, %
T Avg T Max T Min Δ T R H Avg R H Max R H Min Δ R H
T125.737.520.47.458.5783616.1
T223.329.919.52.768.788586.6
Table 7. Statistical values of temperature at S1 and S2.
Position T Avg , T Max , T Min , Δ T ,
S128.844.523.29.8
S224.028.221.21.5
Table 8. Simulation cases.
Cases h , m L , m
140
241
342
460
561
662
780
881
982
Table 9. Comparison of temperature at D1–D6 before and after shading.
Measurement PointBefore ImprovementAfter Improvement
D134.221.5
D222.121.5
D333.921.0
D421.421.2
D533.921.2
D627.621.8
Disclaimer/Publisher’s Note: The statements, opinions and data contained in all publications are solely those of the individual author(s) and contributor(s) and not of MDPI and/or the editor(s). MDPI and/or the editor(s) disclaim responsibility for any injury to people or property resulting from any ideas, methods, instructions or products referred to in the content.

