
Sustainable Automated Mobility-On-Demand Strategies in Dense Urban Areas: A Case Study of the Tel Aviv Metropolis in 2040

1
The Porter School of the Environment and Earth Sciences, Tel Aviv University, Ramat Aviv 6997801, Israel
2
Department of Applied Mathematics, Ariel University, Ariel 4070000, Israel
3
Department of Civil Engineering, Ariel University, Ariel 4070000, Israel
*
Author to whom correspondence should be addressed.
Sustainability 2023, 15(22), 16037; https://doi.org/10.3390/su152216037
Submission received: 3 August 2023
/
Revised: 20 October 2023
/
Accepted: 7 November 2023
/
Published: 17 November 2023
(This article belongs to the Collection Sustainable Urban Mobility Project)
Abstract
:The emergence of automated mobility-on-demand (AMoD) services in urban regions has underscored crucial issues concerning the sustainable advancement of urban mobility. In particular, the impact of various AMoD implementation strategies in dense, transit-oriented cities has yet to be investigated in a generalized manner. To address this gap, we quantify the effects of AMoD on trip patterns, congestion, and energy and emissions in a dense, transit-oriented prototype city via high-fidelity simulation. We employ an activity- and agent-based framework, with specific demand and supply considerations for both single and shared AMoD rides. Our findings suggest that, in densely populated, transit-oriented cities such as the Tel Aviv metropolis, AMoD contributes to higher congestion levels and increased passenger vehicle kilometers traveled (VKT). However, when AMoD is integrated with public transit systems or introduced alongside measures to reduce household car ownership, it helps alleviate the VKT impact. Furthermore, these combined approaches effectively counter the negative impact of AMoD on public transit ridership. None of the AMoD strategies analyzed in our study reduce the congestion effects of AMoD and all strategies cannibalize active mobility in dense, transit-oriented cities compared to the base case. Nevertheless, our analysis reveals that a policy leading to decreased car ownership proves to be a more efficient measure in curbing energy consumption and greenhouse gas emissions.
1. Introduction
The growing ubiquity of mobility-on-demand (MoD) services in cities worldwide has had major implications for urban transportation. Indeed, MoD services have spurred technological advancements in connectivity and information that have been responsible for greater convenience in ride hailing and ride sharing. However, MoD services are increasingly considered severe competition for struggling transit services, while also contributing to increased congestion. In the United States, for instance, transit ridership has been observed to have declined by 6% between 2014 and 2015 due to the growth of ride hailing [1]—a trend referred to as mass transit cannibalization [2,3]. Furthermore, the worsening of urban congestion has arguably been linked to the growth of MoD services. Supporting studies have indicated that MoD could indeed be responsible for increasing vehicle kilometers traveled (VKT) in cities [1,4]. Consequently, MoD has also been associated with the growth of road fatalities in the U.S. [5].
While the effects of mobility on demand (MoD) on transportation networks are still being studied, the potential of automated mobility-on-demand (AMoD) services has attracted substantial attention from researchers, policymakers, and the economy. Nonetheless, the outlook for AMoD availability is uncertain, and its relationship with existing mobility patterns and its influence on system performance has not been fully ascertained. Optimistic studies project that AMoD will potentially reduce costs [6], VKT [7,8], and parking demand [9,10,11,12], and improve traffic management [13,14,15]. AMoD, under environmentally conscious regulation, has also been demonstrated to reduce energy usage and greenhouse gas (GHG) emissions [16]. However, the expected efficiencies of AMoD could further exacerbate cannibalization and even active modes [17]. Less promising projections point to the energy benefits of AMoD being offset by a potential rise in travel demand [18]. In some instances, AMoD is also expected to worsen congestion [19]. The acceptance of AMoD services by the users and their perception are also an emerging topic [20]. It was found that ease of access is an important factor for the acceptance of AMoD [21,22,23,24,25,26], as well as technological acceptance [15,19], and the willingness to share the AMoD vehicle [27,28]. A comprehensive review of recent and important AMoD studies can be found in [20].
The challenges surrounding the introduction of AMoD suggest that operational strategies, regulatory policies, behavior, and urban form will be critical to the sustainability of this mode of transportation. Numerous trials have showcased the potential effects of AMoD on urban mobility across a range of scenarios, encompassing factors such as cost, demand, supply (fleet control and management), and policy considerations. These studies have, however, been modeled on either specific cities [7,8,29,30,31,32,33,34,35,36] or on virtual cities [9,35,36,37] under idealized conditions. The result is that the implications of these studies are neither readily nor broadly applicable to a wide range of cities. These limitations emphasize the significance of evaluating how differences in urban conditions influence the effects of AMoD and other emerging modes. Insights from subsequent investigations could, consequently, dictate the optimal implementation of AMoD strategies in relevant cities.
To address this knowledge gap, ref. [38] embarked on a typologization of cities based on mobility-relevant indicators. Subsequently, AMoD scenario simulations were conducted on two prototypes of autodependent cities generated to represent their respective typologies [39,40]. These autodependent cities, typical of the majority of cities in the U.S. and Canada, are differentiated by population density and access to mass transit. The results of these simulations demonstrated that AMoD could be sustainably introduced in sparse, sprawling autodependent cities (Auto Sprawl), even at the expense of mass transit. In addition, equity analyses of the simulation results are performed in [41].
In autodependent cities, with urban density and an appreciable public transportation system (Auto Innovative), AMoD significantly increases congestion. In lieu of AMoD competing with mass transit in cities of this type, they would be better served by a subsidized integration of AMoD with transit. This paper further contributes to the prototype-city simulation approach and, thus, makes significant contributions to the existing literature on AMoD impacts on future mobility in the following areas: (1) We generated a prototype city resembling a large-scale dense, transit-oriented urban environment (Tel Aviv metropolis/Gush Dan) using advanced agent-based simulation. (2) We developed and simulated AMoD scenarios in such a dense, transit-oriented metropolis. We considered (a) the naive introduction of AMoD, along with scenarios in which AMoD is (b) integrated with mass transit and (c) introduced along with a policy intervention to reduce household car ownership. (3) We addressed demand–supply interactions and compared the impacts to three other distinct urban typologies where similar policies were examined. Such a comparison allows us to link the results to the unique typology of the metropolis, so that our results are broadly applicable to cities in that typology and further demonstrate the viability of the prototype-city methodology.
The organization of this paper is as follows: In the next section, a description of the methodology, along with key definitions, data sources, and scenarios, is presented. Particular focus is given to a new prototype city, the Tel Aviv metropolis. We then discuss the implications of the results and conclude with a summary, laying out avenues for future work.
2. Materials and Methods
Our aim is to assess the environmental consequences of forthcoming AMoD strategies in densely populated, transit-oriented cities, aiming to offer sustainable solutions. Given the feasibility of modeling and simulating all cities of interest due to time and data constraints, [39] classified cities on a global scale based on network topology, socioeconomic indicators, and mobility factors. From these groups, representative prototype cities were developed [40] that can be used to analyze scenarios with outcomes that are relevant to the cities in that typology. In this paper, our simulation experiments are performed on a prototype city representing a futuristic Tel Aviv metropolitan area for 2040, which belongs to the MassTransit Heavyweight typology. To aid the reader, we list and describe all abbreviations and acronyms used throughout this paper in Table 1.
2.1. Simulation Environment
The metropolitan area of Tel Aviv was modeled with a hybridized simulation framework combining SimMobility MT and Aimsun. SimMobility Mid-Term (SimMobility-MT) contains three modules. In this work, we used the demand (PreDay) module, where daily travel schedules are simulated via an activity-based model (ABM), which hierarchically specifies tour number and type, mode, time and origin of departure, and nodes of destination. Further details on the SimMobility-MT framework are provided in [40]. SimMobility’s demand module was combined with Aimsun Next, which is commercial software that provides a multiresolution model for large-scale networks [42]. Further details on the SimMobility–Aimsun framework are provided in [34,43].
2.2. City Generation
We created a futuristic Tel Aviv metropolitan area of 2040, which is expected to belong to a prototype city representing the MassTransit Heavyweight typology. MassTransit Heavyweight is a group of highly developed and densely populated cities with robust mass transit availability and usage. Examples of member cities include Madrid, Seoul, Berlin, Paris, and Singapore (the complete list is given in [39]). The future Tel Aviv metropolitan area of 2040 is a high-fidelity testbed in which we develop AMoD scenarios for agent-based simulation. We compare a few indicators of the Tel Aviv metropolitan area to those of the prototype city (typology averages) in Table 2.
2.2.1. Population and Land-Use Synthesis
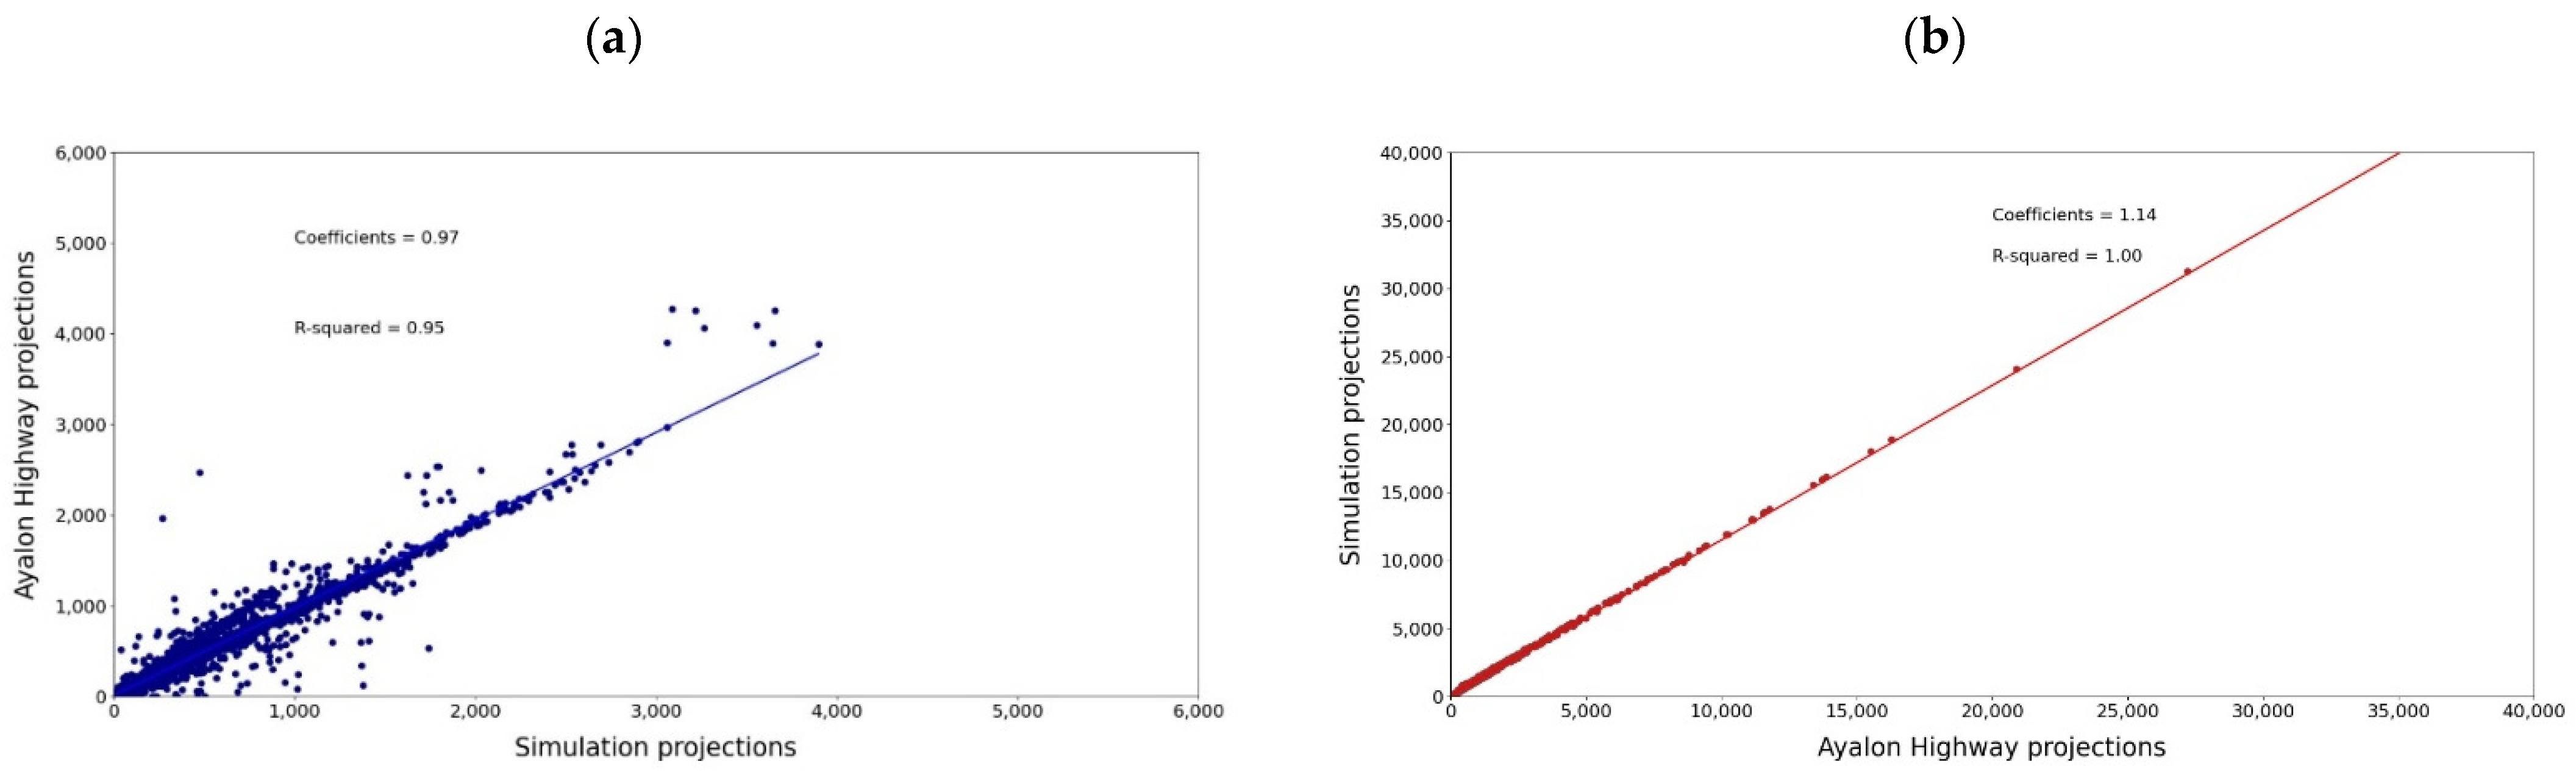
For SimMobility’s demand module, a population that is synthetic and with known sociodemographic features can be used as an input. In a former work, we synthesized the Tel Aviv metropolitan population for 2017 while creating a full representation of the metropolis in the simulator [34]. For the purpose of creating the future Tel Aviv metropolitan area, we synthesized the Tel Aviv metropolitan population for 2040 mainly based on the synthetic population of 2017 by randomly duplicating/reducing individuals along with their characteristics at each traffic zone. The randomness in this process is reflected in a random choice of the person whom we chose to replicate in a certain TAZ. This process was validated against Ayalon Highway (the regional planning authority) predictions for 2040 while controlling for various parameters, such as the number of residents by age and gender and the number of license holders in each TAZ. To account for new residential areas that do not currently exist but will be realized in 2040, we randomly duplicated the population of existing areas located one kilometer away from the new area and assigned them to the new area. This process calibrates the predictions of all demographic parameters, as shown in Figure 1 and Figure 2, except for the employment location of individuals.
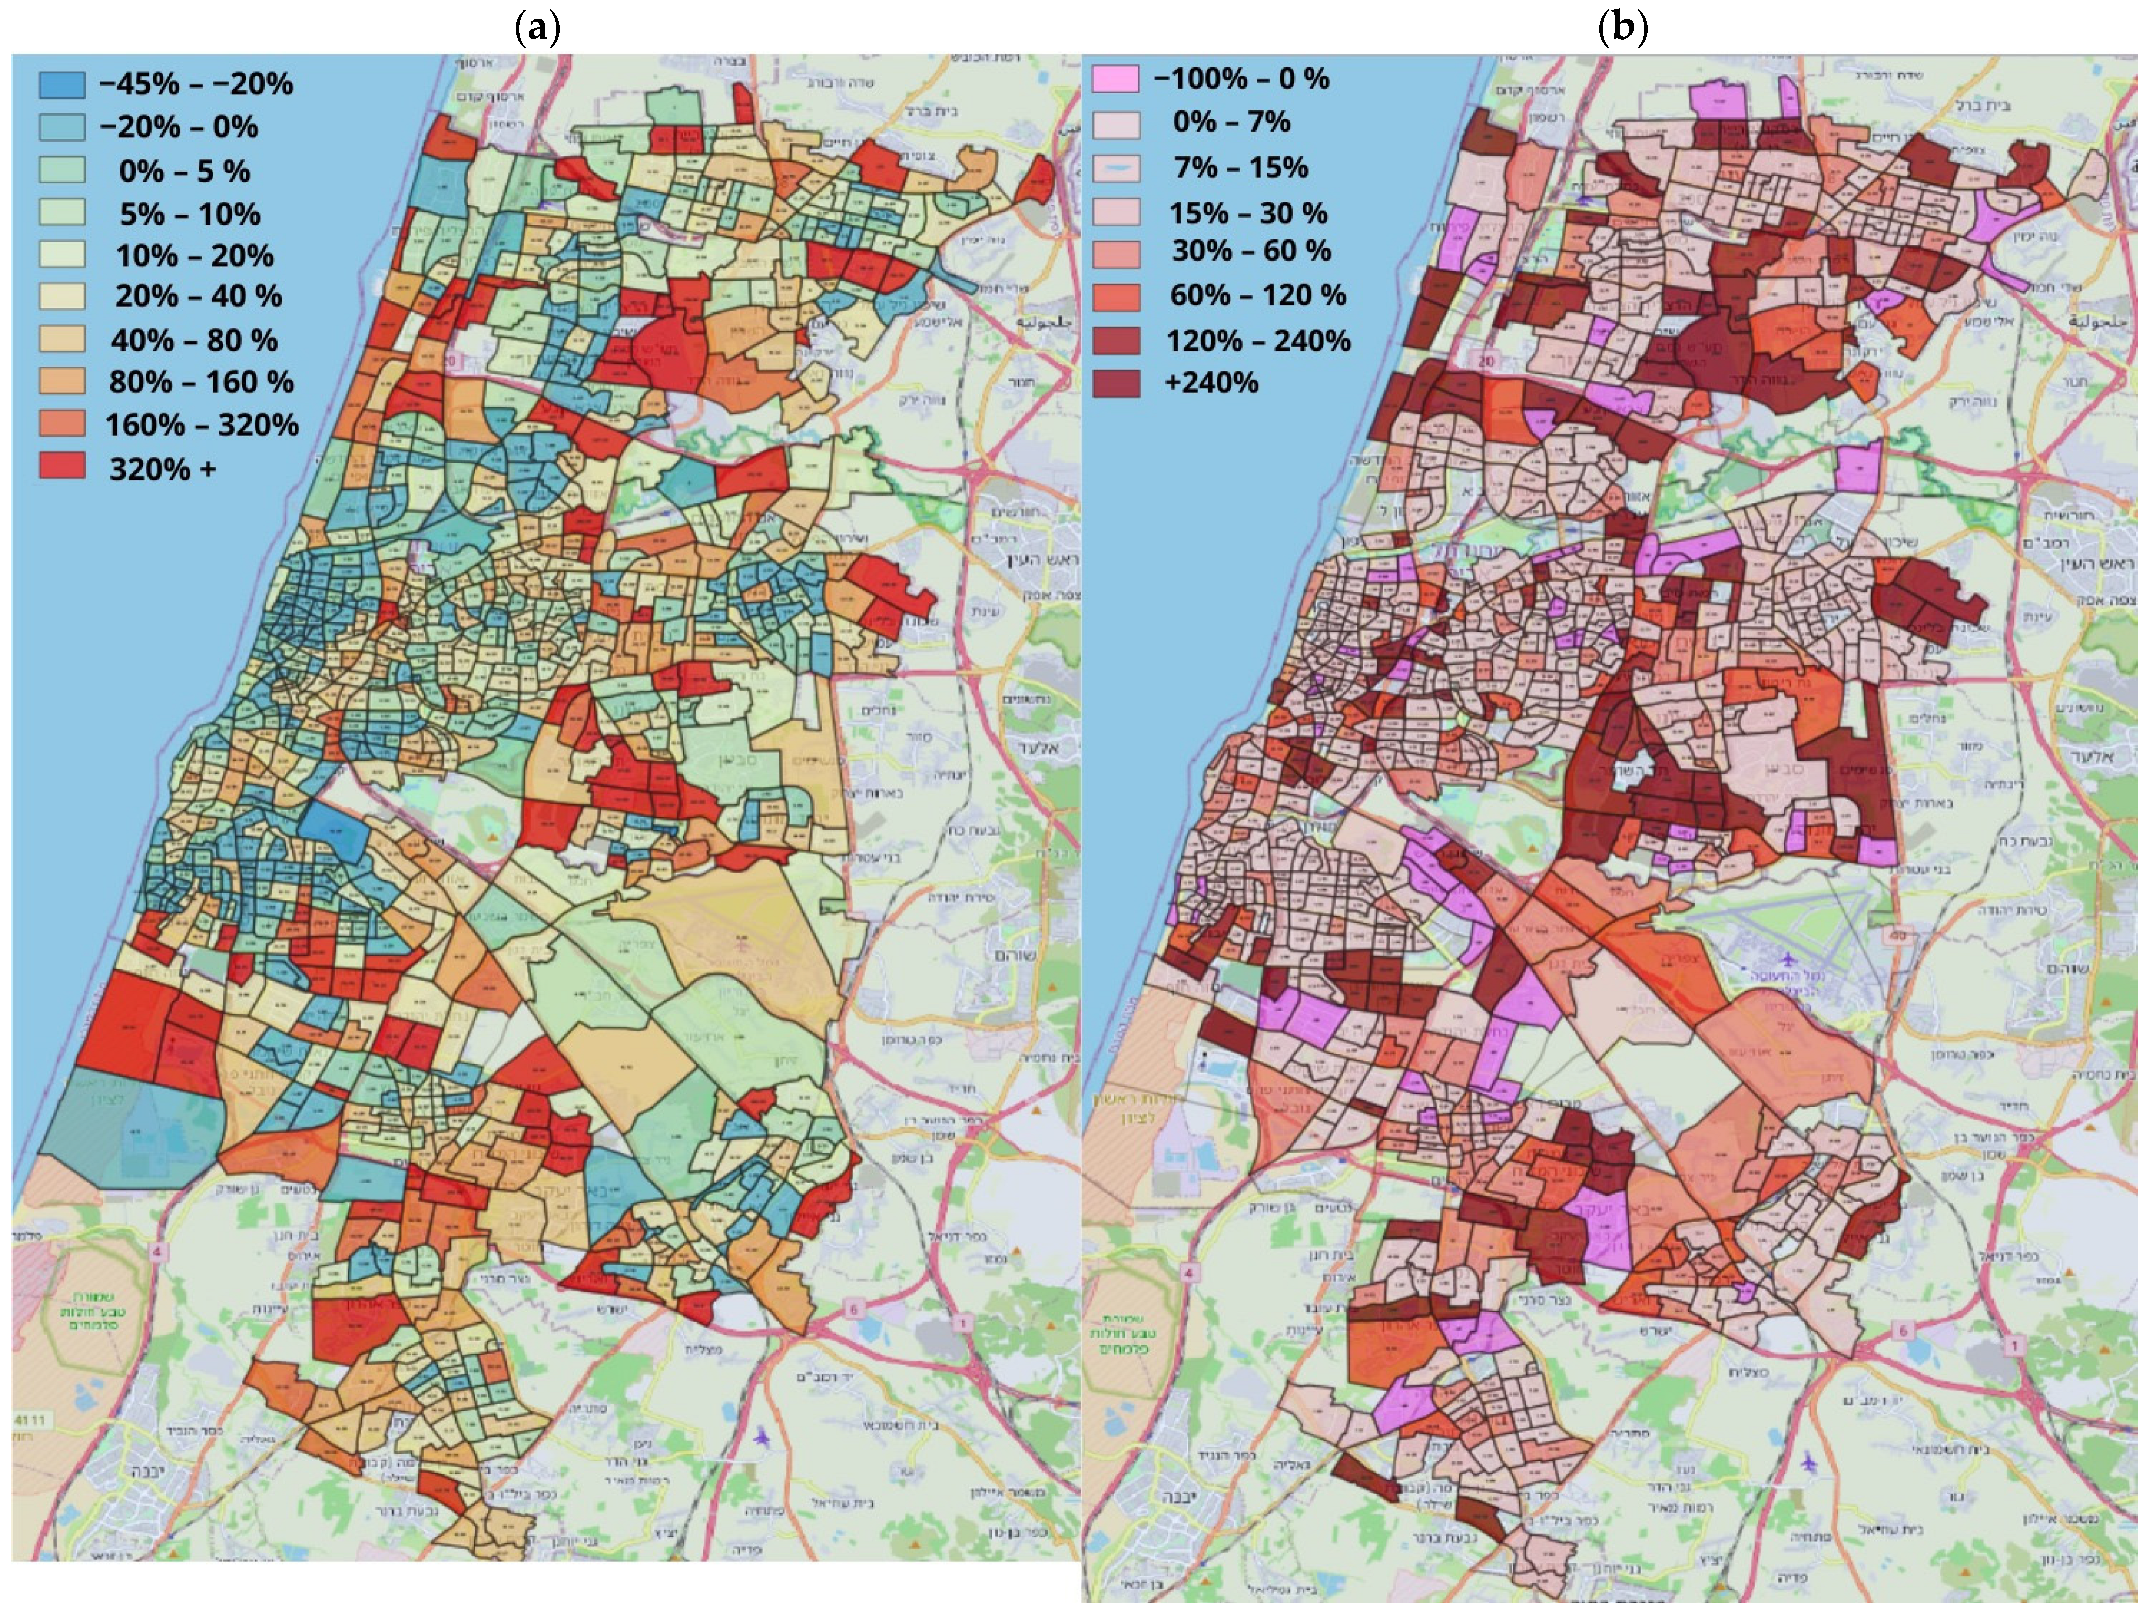
To calibrate the employment locations, we utilized a Frater factor model [44] that involved matching the matrix of residential locations with the predicted employment locations in 2017 to the prediction vectors for employment areas in 2040. The results after 10 million iterations are shown in Figure 1a,b. Figure 2a,b show selected synthetic population outputs—the change in population density and the change in employment density by TAZ.
2.2.2. Demand Modeling
For Boston, there was an initial estimate for PreDay ABM [38]. It was then calibrated for average mode share fit, as well as for Tel Aviv metropolitan area (2017) activity share and trip generation rate. This was achieved by manual adjustment of scale parameters and alternative-specific constants, as well as variable coefficients to coincide with the Tel Aviv metropolis activity shares and mode [34].
Using the same adjustment procedure that was conducted for PreDay, we also fit the demand model to European fuel price elasticities (Table 3). Based on the literature, these were representative of the MassTransit Heavyweight typology. Elasticity in fuel price can be defined as the change in percentage in trip number demand (of a given mode) based on a 1% increase in the price of fuel (gasoline). We also performed checks on temporal patterns, mode-activity proportions, and trip and tour distributions.
On both the demand and supply sides, one of the most significant changes to the transportation system in Israel by 2040 will be the implementation of a mass rapid transit (MRT) system, which will consist of three metro lines and three light rail lines. These additions are expected to significantly impact the demand for private vehicles, travel times, road congestion, and energy consumption and emissions. To create an urban environment that closely resembles the future conditions across the Tel Aviv metropolis, another new mode was added to the behavioral mode and mode/destination choice models in the demand simulator. As MRT is a new service in Israel, demand-based models consider that consumer choice in Tel Aviv, which uses coefficients in its modeling, for MRT is similar to PT service in Tel Aviv, along with MRT-unique specifications of travel time and walking time to MRT stations. This is a conservative assumption in the absence of such a service and may lead to an underestimation of demand for MRT.
In Figure 3, the mode shares are categorized into five mode types: mass transit (bus, light rail and metro), active modes (bicycle and walk), on-demand (taxis, car/carpool), and other (motorcycle and private bus). For the 2017 base year, agents undertake more than 66% of the trips by car, with active modes (walk and bike) consisting of 21.6%, mass transit only 7.9%, and taxis only 0.4%. In the future year 2040, with the presence of the mass transit system, we expect an increase of 294% for mass transit trips, which will make up 31% of the share, while private car trips will make up 41% of the share with a decrease of 38%. The significant increase in mass transit trips can be explained by the high accessibility level, as most of the metropolis will be accessible by an average walking time of 16 min to metro stations, in addition to the high frequency of the service—every 3 min—and significantly shorter travel times compared to public transport travel times (3 times shorter) in the reality of a congested metropolis. Additionally, we expect an increase of 13% for active modes, which will make up 24%, as trips are expected to become shorter and less prolonged compared to 2017. On-demand use, however, is expected to decrease from 0.4% in 2017 to 0.3% in the future year 2040 (a decrease of 25%), as the service in Tel Aviv is very expensive compared to other modes (such as MRT), which are expected to become even more attractive in terms of price to the consumer. Overall, the results indicate less reliance on private transportation and significantly more public transportation usage, along with more walking and cycling.
In the study area (which includes the 3 inner rings of the Tel Aviv metropolis; see Figure 4) of the base year, a population of 2.6 million people was synthesized. These individuals embark on more than 8.16 million daily trips, with an average stop rate of 4.495 per individual. A total of 3.9 million trips make use of private cars. In the future Tel Aviv of 2040, a population of 3.5 million people was synthesized, and they are expecting to make over 10.5 million trips per day, with an average stop rate of 4.5 per individual. A total of 3.8 million trips are expected using private cars.
The future population growth in the study area is not expected to significantly increase the number of trips (0.2%) demanded compared to the base year of 2017. This result is quite surprising. A thorough examination of the results shows that the explanation stems from the urban structure, which will change significantly with the construction of new trade and employment subcenters, which will be built in different areas of the metropolis. This change will result in a very different distribution of trips relative to what is observed today, to shorter trips and a reduced use of motorized trips. This result is also in line with the fact that today’s metropolis is already saturated and the number of trips made by its residents is enormous relative to population size. We show the average stops per person by scenarios in Table 4.
2.2.3. Supply Modeling
In the simulation framework, the network and its characteristics serve as inputs to the mesoscopic model, alongside the O-D matrices derived from SimMobility, which were adjusted to align with Aimsun’s format (trips by mode were selected from the activity diary and grouped for assignment to half an hour OD matrices). The supply model of Tel Aviv uses dynamic traffic assignment, which was calibrated and validated for 2017 conditions [34]. The same network was used for 2040 with an important addition: the MRT network, which is one of the most significant changes to the transportation system in Israel by 2040. Thus, we constructed a comprehensive MRT network model including all the lines and station locations based on the plans of the Israeli MOT. From this modeling, we extracted travel times using MRT. To account for walking times, we matched the traffic zone to the nearest MRT station and calculated walking times based on an assumed walking speed of 5 km per hour. This MRT network model is shown in Figure 4. Table 5 details the selected transport network supply model parameter specifications for the Tel Aviv metropolitan area.
After building both demand and supply simulators for the future year 2040, a demand and supply rebalancing process was conducted. Network performance, in the form of travel times from the supply simulator, is inputted into the demand simulator, updating agent knowledge and enabling a learning process that is day-to-day. This circular process continued until the travel times between successive iterations showed negligible changes. Figure 5 shows the convergence of the equilibrium between demand and supply.
2.2.4. Energy and Emissions Considerations
As part of the SimMobility–Aimsun framework, a systematic mesoscopic energy consumption and emission model was developed [43]. We calibrated and validated our energy consumption and emissions model to match the 2017 characteristics of Israel’s domestic vehicle fleet, making necessary adjustments to emission factors based on engine volume. Fuel consumption; CO2 and GHG emission; and NOX, PM2.5, and NMVOC emission changes per road section based on time of day can be examined using our model. The correlation between the information coming out of the simulation and emission from each vehicle is made by the emission factor. The emission factor is a representative value that relates pollution to activity. The Handbook Emission Factors for Road Transport (HBEFA) database connects the emission factor to the road jam and type, as well as car characteristics such as European emission standards and engine size. We used the Ministry of Energy and Infrastructure fleet composition forecasts for 2040 for calculating different emission types and evaluating level of air pollution in the Tel Aviv metropolitan area for 2040, given that fleet composition is expected to change dramatically by 2040 (fleet composition for 2040 is based on the composition of the fleet at the household level in 2017 as a base, after which we randomly changed the composition to match the 60% electrification assumption) [46]. Following these forecasts, the private vehicle fleet composition in 2040 is expected to be 60% battery electric vehicles (BEVs), with only 40% of the fleet powered by internal combustion engine (ICE) or hybrid electric drivetrain (HEV).
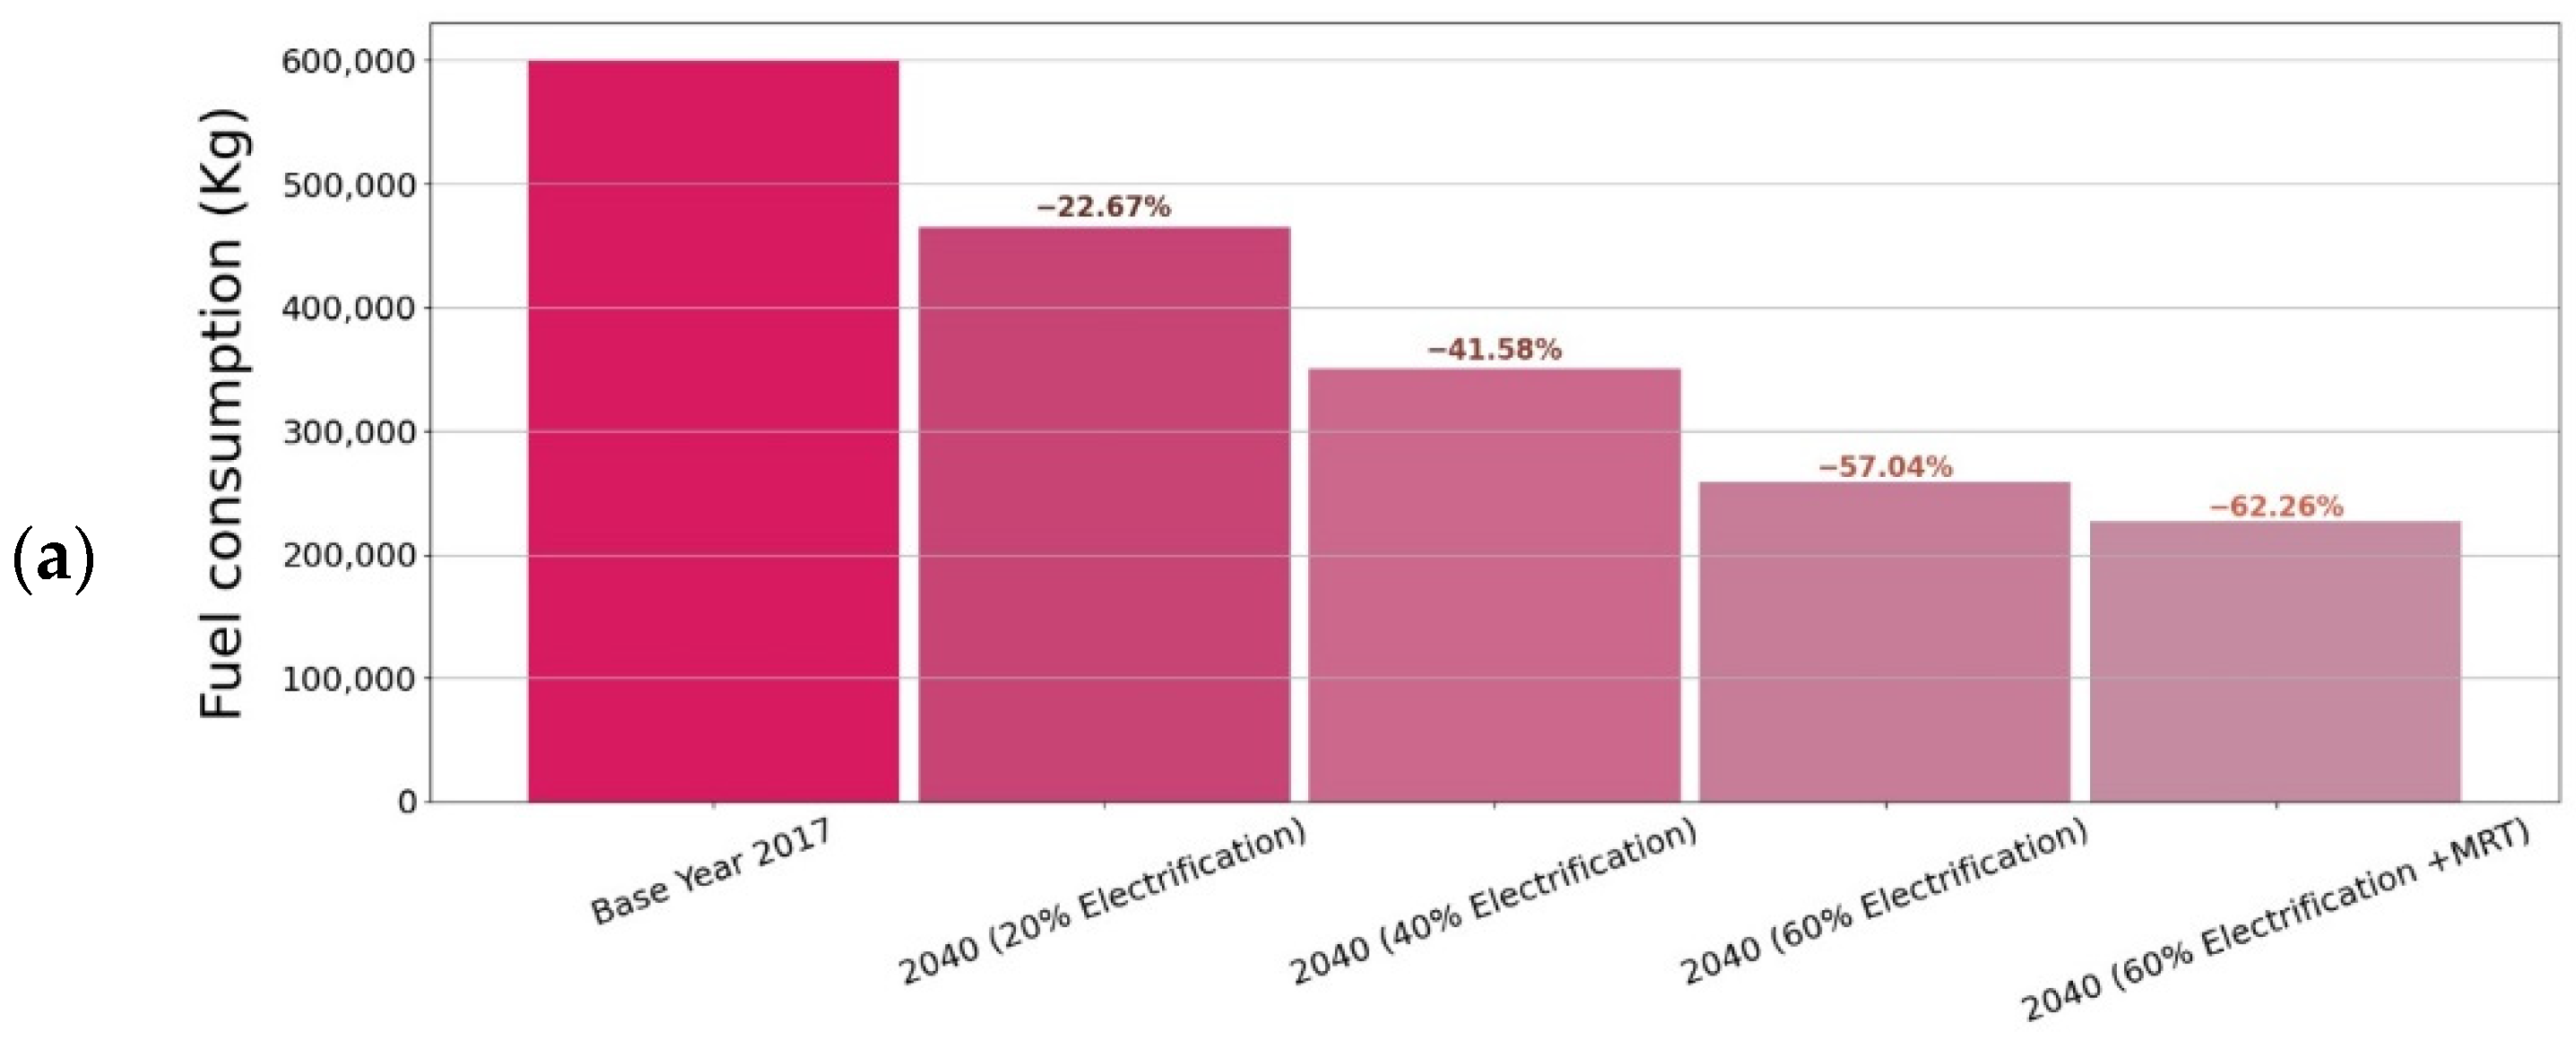
The outputs generated by the supply simulator undergo processing and are then transmitted to the energy consumption and emissions model. This model considers the density and speed of each road segment at a temporal resolution of 15 min. For every vehicle and propulsion category, emissions are computed using emission factors that establish a connection between pollution and activity, following the HBEFA methodology. The resulting outputs provide pollutant-specific emission volumes for each road section across the entire network. The electrical energy consumption by vehicles is calculated assuming fixed electricity consumption on motorways, primary ways, and suburban ways, and is based on Tesla Model 3 Standard Range Plus performance data (see [47]). Under 60% electrification in 2040, following the Ministry of Energy forecasts for 2040 [46], a decrease of 57% in primary energy consumption is observed, as can be seen in Figure 6a.
By including the mass transit system, fuel-based (gasoline and diesel) consumption decreases by an additional 5%. Total GHG emissions follow a similar trend where emissions are significantly reduced by 58%. The presence of a mass transit system reduces emissions by an additional 5% (please see Figure 6b).
2.3. Scenario Design
In our analysis of AMoD impact throughout the metropolitan area of Tel Aviv, we implemented four scenarios for the target year 2040. Through these, we examined potential AMoD scenarios that involve either passive or active strategies for AMoD management within the study region. In these scenarios, the AMoD fleet is assumed to be entirely electric, whereas the power sources for other private vehicles are determined based on their distribution within the population at the household level. These distribution data were gathered from the 2017 Travel Habit Survey and projected to 2040 by the Ministry of Energy and Infrastructure, based on a future of environmental optimism.
2.3.1. Base Case for 2040
The base case reflects projected 2040 Tel Aviv metropolitan area conditions, encompassing mode availability, mode selection, and network performance. The available modes comprise private car (both single and shared), mobility-on-demand (including taxis), mass rapid transit (comprising buses, light rail, and metro), active mobility (encompassing cycling and walking), and other (involving motorcycles and private buses). Taxi fares are modeled in accordance with municipal regulations.
2.3.2. AMoD
This scenario outlines a future in which AMoD services are replacements for MoDs, offering discounted rates compared to standard taxi fares, without additional policy interventions or strategies. Previous research on cost implications of AMoD contextualize this cost range [7,33,48]. Offering both single and shared ride (pooling), AMoD options lead to reduced fares and energy consumption. The cost of a single AMoD service is 50% cheaper compared to taxi fares following our preliminary experiments, which considered various cost reductions (see [34]). A shared AMoD service involves passengers sharing an AMoD vehicle (such as ride sharing) with at least one other traveler and is assumed to be priced 30% lower than individual AMoD rides. In the supply models, the AMoD vehicle is considered equivalent to a typical car, with no robotic automation.
As the AMOD car fleet does not currently exist, it was modeled under the AMoD assumption that consumer preference is modeled via coefficients—which is the same for MoD. The Ministry of Transport in Israel provides information regarding the size of the MoD fleet at the city level. We used this information to generate the appropriate number of AMoDs in each city, while, within the city, the exact co-ordinates of each MoD location were randomly generated. Thus, a fleet of 9723 AMOD vehicles was generated; we kept this fleet size constant throughout all the scenarios examined.
2.3.3. AMoD Transit Integration
Rather than allowing a passive and transit-competitive introduction of AMoD, governments could intervene by subsidizing the integration of AMoD with mass transit. As a potentially implementable urban policy, on-demand integration with transit as a means of improving connectivity is the subject of much research [49,50,51]. As such, using the AMoD transit integration scenario, we evaluate this strategy, in which there is 20% AMoD subsidization for rail stop shared access-and-egress connectivity. Nonintegrated (and unsubsidized) AMoD is further offered.
2.3.4. AMoD + Car Reduction
We have implemented a scenario focused on reducing car ownership, depicting a scenario in which car ownership decreases by 25% in the central area of the metropolis. This reduction can be achieved through mechanisms such as imposing taxes on private vehicle purchases or employing other policy instruments. Reducing car ownership has been put forward as a plausible and potentially beneficial policy approach for enhancing sustainability outcomes in urban environments [52,53]. Singapore is perhaps the best documented; it has pursued a consistent policy for almost four decades in which car ownership and use have been controlled. As a result, its level of car ownership is around a third of that of comparative cities [54]. The Tel Aviv metropolitan area is expected to grow and become similar to Singapore in many ways. Therefore, within this scenario, we examine the effects of constrained car ownership by simulating the consequences of a 25% reduction in household car ownership. This reduction is coupled with the introduction of a cost-effective AMoD service to replace the conventional MoD. Consequently, the household car ownership rate decreases to 63% from the initial 77% in the base case. Table 6 summarizes the mode availabilities across scenarios, while Table 7 summarizes powertrain assumptions and specifications under the various scenarios.
3. Results
Using the scenario results of the AMoD metropolitan area of Tel Aviv, we will proceed to analyze the effects of on-demand, VKT, congestion, and energy and emissions, along with relevant figures and tables. Unless otherwise noted, all percentage changes are in relation to the base case for 2040.
3.1. Demand Impacts
The introduction of AMoD does not lead to a significant increase in the number of demanded trips, with a mere 0.3% deviation compared to the base case. Similar outcomes are observed under both the AMoD Transit Integration (approximately 0%) and AMoD + Car Reduction (−1%) scenarios. These findings suggest that there is no discernible latent demand within the Tel Aviv metropolitan area in 2040. We show the mode shares across all scenarios in Figure 7.
In the AMoD scenario, there is an increase of 3297% for on-demand trips, while, for private car trips, there is a decrease of 2.5%. In addition, transit use decreases by 3.4%. Integrating AMoD with transit (AMoD Transit Integration) reverses cannibalization as transit ridership increases by 10%. In this scenario, there is an increase of 2940% for on-demand trips and a decrease of 12% for private car trips. Shifts from the active modes, Walk and Bike, make up the largest portion when integrating AMoD (decrease of 33%) and the smallest portion when integrating AMoD with transit (decrease of 27%) (Table 8).
With a 25% reduction in car ownership precipitated by an increased tax on ownership, transit ridership increases by 9% (compared to a decrease of 3.4% under AMoD). Additionally, the boost in transit ridership is slightly higher under AMoD Transit Integration (10%) than under AMoD + Car Reduction (9%). Under AMoD, car reduction on-demand trips increase the most by 3640% (compared to 3297% under AMoD). Private car trips decrease by 16% (compared to a decrease of only 2.5% under AMoD).
3.2. Congestion
We measure congestion in the network based on the travel time index (TTI), here defined as the distance-weighted average of in-simulation trip time to free-flow trip time for all passenger vehicle trips within a given period of time. Thus,
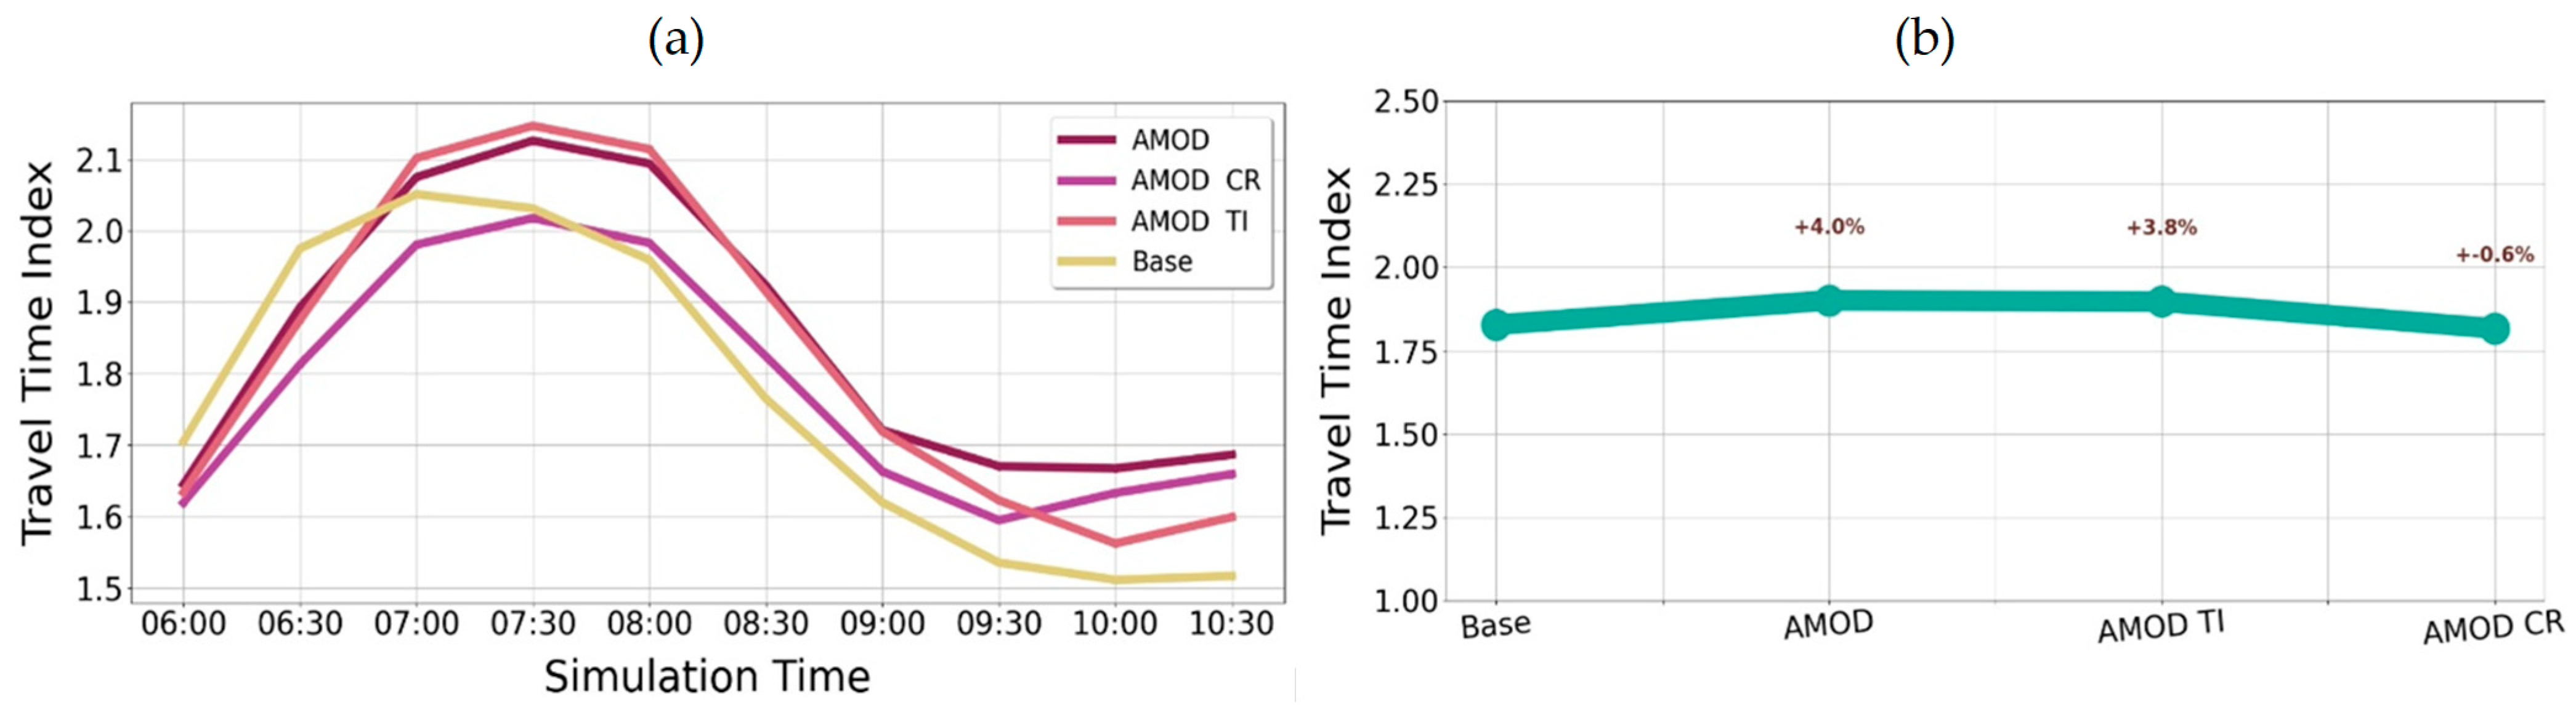
where i is the index of passenger vehicle trips in period T, and di, and are the trip distance, in-simulation travel time, and free-flow time, respectively. We show the TTI across the scenarios by time in the morning hours (6–11 a.m.) (Figure 8a) and aggregated over the morning (Figure 8b). In the scenarios where AMoD is present, we see adverse effects on congestion, apart from AMoD Car Reduction, which manages to reduce congestion.
Under AMoD, congestion increases by 4%. This impact can be explained by the corresponding increase in VKT in this scenario. However, given the dominance of mass transit, the potential for greater congestion is moderated. Integration, however, only slightly improves the congestion situation by 3.8% relative to the base case. This is because the ubiquity of transit stops results in increased routing for access/egress trips.
Under AMoD + Car Reduction, congestion increases by only 0.6% relative to the base case. Thus, compared to the base case scenario, the congestion situation remains almost unchanged. This is due to the similar share of trips under AMoD + Car Reduction relative to the base case.
3.3. Energy and Emissions
Under AMoD, fuel-based (gasoline and diesel) consumption remained more or less the same (~0%), while electricity consumption, primarily driven by the AMoD fleet, increased by 10%. With the integration of AMoD with transit, however, fuel-based consumption increases by 8.9%, while electricity consumption, primarily driven by the AMoD fleet, increases by 10.5%. The increase in fuel-based consumption can be explained by the increase in congestion in peak hours (8–7 a.m.) around MRT stations, which results in a significant reduction in speed from 45 km/h at 7 am to 35 km/h at 8 a.m., as well as a corresponding increase in GHG emissions of up to 8.7% during rush hour. It is important to note that, although the total number of vehicles decreased under AMoD transit integration, during peak hours, it remained the same as in the AMoD scenario. Car reduction results in greater energy savings, as fuel-based consumption decreases by 7% relative to the base case (Figure 9b), yet electricity consumption, driven by the AMoD fleet, increases by 12%.
Total GHG emissions follow a similar trend across the scenarios (Figure 10). Under AMoD Intro, emissions are not significantly impacted (increasing by 0.6% relative to the base case). Under AMoD + Car Reduction, emissions decrease by 7%. Car reduction, thus, results in the most sustainable outcome for the Tel Aviv metropolitan area.
4. Discussion
The implications of our results are herein discussed in the context of three other prototypes investigated in an earlier effort [40]—Auto Sprawl, Auto Innovative, and MassTransit Heavyweight—to juxtapose the effects of AMoD in transit-oriented and autodependent urban areas. Based on our simulation results, we find that the introduction of AMoD is potentially detrimental to the network in all four cities. Moreover, across the four cities, AMoD cannibalizes mass transit by up to 20%, leads to a passenger VKT increase by up to 30%, and results in a 50% congestion increase. The energy and emissions effect are, however, urban-dependent. Under the assumptions we made on an AMoD fleet that is completely electrified, the emission levels and energy decrease with the AMoD introduction in Auto Sprawl, while they increase in Auto Innovative and MassTransit Heavyweight, and in the Tel Aviv metropolis. This indicates that, under a full electrification policy, AMoD could save energy in low-density autodependent cities (such as Auto Sprawl and Auto Innovative). However, further improvements in the environmental sustainability of electricity production and car restrictive policy would be required for a positive impact on energy consumption and emissions in dense cities.
With appropriate policy interventions, such as the integration of transit systems or automobile reduction, the inimical effects of AMoD can be effectively countered. Integrating AMoD with transit by subsidizing AMoD access and egress trips while restricting other AMoD trips for local circulation arrests transit cannibalization in dense, transit-oriented cities (as observed in the Tel Aviv metropolis). In autodependent cities (Auto Sprawl and Auto Innovative) with lower urban densities that have sparser mass transit, integration not only reverses transit cannibalization, but also boosts transit ridership (Table 9). Transit integration can mitigate the detrimental impacts of unrestricted AMoD on VKT, congestion, energy consumption, and emissions (Table 10a).
The benefits are greater in transit-oriented cities (MassTransit Heavyweight and Tel Aviv metropolis) but may also result in greater congestion, energy consumption, and emissions where the mass transit stations are very close to each other and people travel significantly more to stations instead of walking or cycling, as in the case of Tel Aviv metropolis. A restrictive parking policy and encouraging the use of micromobility would be effective in reducing these harmful effects.
In transit-oriented cities (MassTransit Heavyweight and Tel Aviv metropolis), targeted car ownership reduction also mitigates the impact of unrestricted AMoD (Table 10b). We observe a significant reduction in VKT relative to the AMoD Introduction scenario. Similarly, it results in a reduction in energy and emissions relative to the base case. We consider AMoD + Car Reduction to be the most sustainable of the three AMoD strategies for transit-oriented high-density urban areas, as it results in the greatest decrease in energy and emissions. We note, however, that, even with car ownership reduction, congestion remains higher relative to the base case. This is due to an increase in shorter trips from the adoption of AMoD. This indicates that, in very dense cities, simply curtailing car ownership by as much as 25% will not necessarily improve congestion.
5. Conclusions
We developed and calibrated a prototype city representing a futuristic Tel Aviv metropolitan area for the year 2040. This metropolis is characterized by a high level of development coupled with significant mass transit availability and usage. Using the combined SimMobility–Aimsun framework, we investigated the effects of automated mobility-on-demand services in this model transit-oriented city. The goal was to understand which strategies would lead to the most sustainable outcomes in this type of metropolis. From the base case, three scenarios were simulated and compared, namely, AMoD, AMoD Transit Integration, and AMoD + Car Reduction.
Our results indicate that simply introducing an AMoD service with single and shared rides at half the cost of taxis would increase passenger VKT, congestion by 4%, energy consumption by 12%, and emissions by 1.4%. By subsidizing the integration of AMoD with mass transit and further restricting usage to local trips, VKT would decrease. Congestion would increase by 3.8% in the morning, but, in the morning, peak travel speed drops dramatically, which results in fuel consumption and emissions increases of 9% and 8%, respectively. An enforced 25% reduction in cars owned per household would increase VKT but would result in decreases in energy consumption and emissions by 7% and 9%, respectively.
Thus, even with high levels of AMoD transit integration and a massive reduction in car ownership, AMoD still increases congestion. These outcomes suggest that infrastructure and demand-based pricing are likely to be more effective in tackling the congestion problem. We consider this an important avenue for further research. However, both the integration and car reduction strategies reverse the cannibalization of mass transit. In fact, both strategies boost the usage of mass transit but, at the same time, cannibalize active mobility. We expect these simulation results to provide valuable insights to policymakers and other researchers in the continuing exploration of AMoD implementation and (A)MoD regulation. Furthermore, they would be of immediate value to dense transit-oriented cities.
As with any simulation framework, there are limitations that arise from the system’s design. In this study, freight mobility was not included both in the on-demand and in the supply simulator, as the demand simulator is incapable of estimating freight demand within the existing framework. The presence of trucks may significantly influence air pollution and also impact traffic volume on roads by altering the flow on specific routes. Additionally, some simplifications were made in order to enable the running of the mesoscopic model for such a large and crowded network. First, we did not include local roads in the network so that the centroids were connected directly to the collectors and primary roads. Thus, our road network does not encompass short trips (up to 1.5 km), which may further contribute to air pollution. Second, we replaced some of the roundabouts with un-signalized intersections to prevent unrealistic gridlocks. As a result of those simplifications, the model is less accurate in representing local conditions in specific zones. It should be noted that, in general, mesoscopic models are less accurate in representing local conditions, with microscopic models being more appropriate for that goal. In future, it is possible to improve those parts of the network and use a hybrid simulation, so that we can learn the effects of local conditions on the overall large network (e.g., prioritizing public transit on a specific corridor). Furthermore, in this study, the operator controlling the AMOD vehicle fleet is a very simple controller; it cannot model complex behaviors such as charging behavior, rebalancing, and mode changing within the trip, which may affect both demand and supply. These are under development and are subjects for further research. Finally, when introducing the MRT system, we did not consider the capacity of the lines which may affect the waiting time and the level of service. Future work may also consider the capacity constraints of the MRT lines, as well as gradual implementation of the lines. It is important to recognize that automated mobility on demand, despite its benefits, still contributes to energy consumption and congestion as shown by this study. Thus, future studies may also consider other strategies for sustainable urban mobility such as micro-mobility [54,55,56] and its interaction with the AmoD fleet, changes in population density, land use, or various technological advancements in transportation.
Author Contributions
The authors confirm contributions to the paper as follows: study conception and design: B.-H.N.-B.; data collection and method development: B.-H.N.-B., G.D. and Y.L.; analysis and interpretation of the results: B.-H.N.-B., G.D. and Y.L.; and manuscript preparation: B.-H.N.-B. and G.D. All authors have read and agreed to the published version of the manuscript.
Funding
This research was funded by the Israeli Smart Transportation Research Center.
Institutional Review Board Statement
Not applicable.
Informed Consent Statement
Not applicable.
Data Availability Statement
The full data set used for this study is publicly available in our GitHub repository: https://github.com/futuremobilitylabTAU/SimMobility_Aimsun (accessed on 2 August 2023).
Acknowledgments
The authors would also like to acknowledge the contribution of Jimi Oke. The authors are grateful to Ayalon Highway, which supported this research by sharing and providing data.
Conflicts of Interest
The authors declare no conflict of interest.
References
- Adnan, M.; Pereira, F.C.; Lima Azevedo, C.M.; Basak, K.; Lovric, M.; Raveau, S.; Zhu, Y.; Ferreira, J.; Zegras, C.; Ben-Akiva, M.E. Simmobility: A multiscale integrated agent- based simulation platform. In Proceedings of the Transportation Research Board 95th Annual Meeting, Washington, DC, USA, 10–14 January 2016. [Google Scholar]
- Alonso-Mora, J.; Samaranayake, S.; Wallar, A.; Frazzoli, E.; Rus, D. On-demand high-capacity ride-sharing via dynamic trip-vehicle assignment. Proc. Natl. Acad. Sci. USA 2017, 114, 462–467. [Google Scholar] [CrossRef]
- Azevedo, C.L.; Marczuk, K.; Raveau, S.; Soh, H.; Adnan, M.; Basak, K.; Loganathan, H.; Deshmunkh, N.; Lee, D.H.; Frazzoli, E.; et al. Microsimulation of demand and supply of autonomous mobility on demand. Transp. Res. Rec. J. Transp. Res. Board 2016, 2564, 21–30. [Google Scholar] [CrossRef]
- Babar, Y.; Burtch, G. Examining the Impact of Ridehailing Services on Public Transit Use. 2017. Available online: https://ssrn.com/abstract=3042805 (accessed on 1 June 2022).
- Barrios, J.M.; Hochberg, Y.V.; Yi, H. The Cost of Convenience: Ridehailing and Traffic Fatalities. 2019. Available online: https://papers.ssrn.com/sol3/papers.cfm?abstract_id=3361227 (accessed on 1 May 2022).
- Basu, R.; Araldo, A.; Akkinepally, A.P.; Biran, B.H.N.; Basak, K.; Seshadri, R.; Deshmukh, N.; Kumar, N.; Azevedo, C.L.; Ben-Akiva, M. Automated mobility on demand vs. mass transit: A multimodal activity-driven agent-based simulation approach. Transp. Res. Rec. 2018, 2672, 608–618. [Google Scholar] [CrossRef]
- Bosch, P.M.; Becker, F.; Becker, H.; Axhausen, K.W. Cost-based analysis of autonomous mobility services. Transp. Policy 2018, 64, 76–91. [Google Scholar] [CrossRef]
- Chen, S.; de Lima, I.H.V.; Needell, Z.; Araldo, A.; Akkinepally, A.; Trancik, J.; Ben-Akiva, M.; Fournier, N.; Deliali, A.; Christofa, E.; et al. Integrated simulation of activity-based demand and multi-modal dynamic supply for energy assessment. In Proceedings of the ITSC 2018: 21st International IEEE Conference on Intelligent Transportation Systems, Maui, HI, USA, 4–7 November 2018. [Google Scholar]
- Clewlow, R.R.; Mishra, G.S. Disruptive Transportation: The Adoption, Utilization, and Impacts of Ride-Hailing in the United States; Research Report UCD-ITS-RR-17-07; Institute of Transportation Studies, University of California, Department of Statistics: Davis, CA, USA, 2017. [Google Scholar]
- Nguyen-Phuoc, D.Q.; Zhou, M.; Chua, M.H.; Alho, A.R.; Oh, S.; Seshadri, R.; Le, D.T. Examining the effects of Automated Mobility-on-Demand services on public transport systems using an agent-based simulation approach. Transp. Res. Part A Policy Pract. 2023, 169, 103583. [Google Scholar] [CrossRef]
- Alotaibi, E.T.S.; Herrmann, J.M. Autonomous Mobility on Demand: From Case Studies to Standardized Evaluation. Front. Future Transp. 2023, 4, 1224322. [Google Scholar] [CrossRef]
- Choi, S.; Lee, J. An analytical model of parking infrastructure and fleet size optimization for Shared Autonomous Vehicles. Transp. Res. Part E Logist. Transp. Rev. 2023, 176, 103213. [Google Scholar] [CrossRef]
- Ghaffar, A.; Shariat, N.; Hyland, M. Fleet Sizing for Robo-Taxi Services: Comparing Novel and State-of-the-Art Scalable Modeling Approaches. Available online: https://papers.ssrn.com/sol3/papers.cfm?abstract_id=4168352 (accessed on 20 March 2023).
- Beirigo, B.A.; Negenborn, R.R.; Alonso-Mora, J.; Schulte, F. A business class for autonomous mobility-on-demand: Modeling service quality contracts in dynamic ridesharing systems. Transp. Res. Part C Emerg. Technol. 2022, 136, 103520. [Google Scholar] [CrossRef]
- Wang, S.; de Almeida Correia, G.H.; Lin, H.X. Modeling the competition between multiple Automated Mobility on-Demand operators: An agent-based approach. Phys. A Stat. Mech. Appl. 2022, 605, 128033. [Google Scholar] [CrossRef]
- Fiori, C.; Ahn, K.; Rakha, H.A. Power-based electric vehicle energy consumption model: Model development and validation. Appl. Energy 2016, 168, 257–268. [Google Scholar] [CrossRef]
- Firnkorn, J.; Muller, M. Free-floating electric carsharing-fleets in smart cities: The dawning of a post-private car era in urban environments? Environ. Sci. Policy 2015, 45, 30–40. [Google Scholar] [CrossRef]
- Giesel, F.; Nobis, C. The impact of carsharing on car ownership in german cities. Transp. Res. Procedia 2016, 19, 215–224. [Google Scholar] [CrossRef]
- Greenblatt, J.B.; Shaheen, S. Automated vehicles, on-demand mobility, and environmental impacts. Curr. Sustain./Renew. Energy Rep. 2015, 2, 74–81. [Google Scholar] [CrossRef]
- Mantouka, E.G.; Fafoutellis, P.; Vlahogianni, E.I.; Oprea, G.M. Understanding user perception and feelings for autonomous mobility on demand in the COVID-19 pandemic era. Transp. Res. Interdiscip. Perspect. 2022, 16, 100692. [Google Scholar] [CrossRef]
- Alonso-Gonzalez, M.J.; Hoogendoorn-Lanser, S.; van Oort, N.; Cats, O.; Hoogendoorn, S. Drivers and barriers in adopting Mobility as a Service (MaaS)—A latent class cluster analysis of attitudes. Transp. Res. A Policy Pract. 2020, 132, 378–401. [Google Scholar] [CrossRef]
- Cai, Y.; Wang, H.; Ong, G.P.; Meng, Q.; Lee, D.H. Investigating user perception on autonomous vehicle (AV) based mobility-on-demand (MOD) services in Singapore using the logit kernel approach. Transportation 2019, 46, 2063–2080. [Google Scholar] [CrossRef]
- Distler, V.; Lallemand, C.; Bellet, T. Acceptability and acceptance of autonomous mobility on demand: The impact of an immersive experience. In Proceedings of the Conference on Human Factors in Computing Systems, Montreal, QC, Canada, 21–26 April 2018. [Google Scholar] [CrossRef]
- Frei, C.; Hyland, M.; Mahmassani, H.S. Flexing service schedules: Assessing the potential for demand-adaptive hybrid transit via a stated preference approach. Transp. Res. Part C Emerg. Technol. 2017, 76, 71–89. [Google Scholar] [CrossRef]
- Krueger, R.; Rashidi, T.H.; Rose, J.M. Preferences for shared autonomous vehicles. Transp. Res. Part C Emerg. Technol. 2016, 69, 343–355. [Google Scholar] [CrossRef]
- Yap, M.D.; Correia, G.; van Arem, B. Preferences of travellers for using automated vehicles as last mile public transport of multimodal train trips. Transp. Res. A Policy Pract. 2016, 94, 1–16. [Google Scholar] [CrossRef]
- Lavieri, P.S.; Bhat, C.R. Modeling individuals’ willingness to share trips with strangers in an autonomous vehicle future. Transp. Res. A Policy Pract. 2019, 124, 242–261. [Google Scholar] [CrossRef]
- Lavieri, P.S.; Garikapati, V.M.; Bhat, C.R.; Pendyala, R.M.; Astroza, S.; Dias, F.F. Modeling Individual Preferences for Ownership and Sharing of Autonomous Vehicle Technologies. Transp. Res. Rec. 2017, 2665, 1–10. [Google Scholar] [CrossRef]
- Henao, A.; Marshall, W.E. The impact of ride-hailing on vehicle miles traveled. Transportation 2018, 6, 2173–2194. [Google Scholar] [CrossRef]
- Hensher, D.A. Tackling road congestion—What might it look like in the future under a collaborative and connected mobility model? Transp. Policy 2018, 66, A1–A8. [Google Scholar] [CrossRef]
- Ben-Dor, G.; Ogulenko, A.; Klein, I.; Benenson, I. Modal Shift and Shared Automated Demand-Responsive Transport: A Case Study of Jerusalem. Procedia Comput. Sci. 2022, 201, 581–586. [Google Scholar] [CrossRef]
- Ben-Dor, G.; Ben-Elia, E.; Benenson, I. Determining an optimal fleet size for a reliable shared automated vehicle ride-sharing service. Procedia Comput. Sci. 2019, 151, 878–883. [Google Scholar] [CrossRef]
- Hörl, S.; Ruch, C.; Becker, F.; Frazzoli, E.; Axhausen, K.W. Fleet operational policies for automated mobility: A simulation assessment for zurich. Transp. Res. Part C Emerg. Technol. 2019, 102, 20–31. [Google Scholar] [CrossRef]
- Nahmias-Biran, B.H.; Dadashev, G.; Levi, Y. Demand exploration of automated mobility on-demand services using an innovative simulation tool. IEEE Open J. Intell. Transp. Syst. 2022, 3, 580–591. [Google Scholar] [CrossRef]
- Oh, S.; Seshadri, R.; Azevedo, C.L.; Kumar, N.; Basak, K.; Ben-Akiva, M. Assessing the impacts of automated mobility-on-demand through agent-based simulation: A study of Singapore. Transp. Res. Part A Policy Pract. 2020, 138, 367–388. [Google Scholar] [CrossRef]
- Iacobucci, J.; Hovenkotter, K.; Anbinder, J. Transit Systems and the Impacts of Shared Mobility; Springer International Publishing: Cham, Switzerland, 2017; pp. 65–76. [Google Scholar]
- Le Vine, S.; Polak, J. Automated Cars: A Smooth Ride Ahead? ITC Occasional Paper; Independent Transport Commission: London, UK, 2014. [Google Scholar]
- de Lima, I.V.; Danaf, M.; Akkinepally, A.; Azevedo, C.L.D.; Ben-Akiva, M. Modeling Framework and Implementation of Activity- and Agent-Based Simulation: An Application to the Greater Boston Area. Transp. Res. Rec. 2018, 2672, 146–157. [Google Scholar] [CrossRef]
- Oke, J.B.; Aboutaleb, Y.M.; Akkinepally, A.; Azevedo, C.L.; Han, Y.; Zegras, P.C.; Ferreira, J.; Ben-Akiva, M.E. A novel global urban typology framework for sustainable mobility futures. Environ. Res. Lett. 2019, 14, 095006. [Google Scholar] [CrossRef]
- Oke, J.B.; Akkinepally, A.P.; Chen, S.; Xie, Y.; Aboutaleb, Y.M.; Azevedo, C.L.; Zegras, P.C.; Ferreira, J.; Ben-Akiva, M. Evaluating the systemic effects of automated mobility-on-demand services via large-scale agent-based simulation of auto-dependent prototype cities. Transp. Res. Part A Policy Pract. 2020, 140, 98–126. [Google Scholar] [CrossRef]
- Nahmias-Biran, B.H.; Oke, J.B.; Kumar, N. Who benefits from AVs? Equity implications of automated vehicles policies in full-scale prototype cities. Transp. Res. Part A Policy Pract. 2021, 154, 92–107. [Google Scholar] [CrossRef]
- Aimsun Next Modeling Guidelines (2018). Nevada Department of Transportation. Available online: https://www.dot.nv.gov/home/showpublisheddocument/15707/636729449686570000 (accessed on 20 January 2021).
- Dadashev, G.; Levi, Y.; Nahmias-Biran, B.H. Implications of de-carbonization policies using an innovative urban transport simulator. Transp. Res. Part D Transp. Environ. 2023, 119, 103754. [Google Scholar] [CrossRef]
- Fratar, T.J. Forecasting distribution of interzonal vehicular trips by successive approximations. Highw. Res. Board Proc. 1954, 33, 376–384. [Google Scholar]
- TRACE. Elasticity Handbook: Elasticities for Prototypical Contexts; Report RO-97-SC.2035; European Commission, Directorate-General for Transport: Brussels, Belgium, 1999. [Google Scholar]
- The Ministry of Energy and Infrastructure. Energy Demand Model 3/2022; The Ministry of Energy and Infrastructure: Jerusalem, Israel, 2022. [Google Scholar]
- Electric Vehicles Database. 2021. Available online: https://ev-database.org/#sort:path~type~order=.rank~number~desc|range-slider-range:prev~next=0~1200|range-slider-acceleration:prev~next=2~23|range-slider-topspeed:prev~next=110~350|range-slider-battery:prev~next=10~200|range-slider-towweight:prev~next=0~2500|range-slider-fastcharge:prev~next=0~1500|paging:currentPage=0|paging:number=9 (accessed on 30 March 2022).
- Pavone, M. Autonomous mobility-on-demand systems for future urban mobility. In Autonomes Fahren; Springer: Berlin/Heidelberg, Germany, 2015; pp. 399–416. [Google Scholar]
- Scheltes, A.; de Almeida Correia, G.H. Exploring the use of automated vehicles as last mile connection of train trips through an agent-based simulation model: An application to Delft, Netherlands. Int. J. Transp. Sci. Technol. 2017, 6, 28–41. [Google Scholar] [CrossRef]
- Shen, Y.; Zhang, H.; Zhao, J. Integrating shared autonomous vehicle in public transportation system: A supply-side simulation of the first-mile service in Singapore. Transp. Res. Part A Policy Pract. 2018, 113, 125–136. [Google Scholar] [CrossRef]
- Wen, J.; Chen, Y.X.; Nassir, N.; Zhao, J. Transit-oriented autonomous vehicle operation with integrated demand-supply interaction. Transp. Res. Part C Emerg. Technol. 2018, 97, 216–234. [Google Scholar] [CrossRef]
- May, A.D. Urban transport and sustainability: The key challenges. Int. J. Sustain. Transp. 2013, 7, 170–185. [Google Scholar] [CrossRef]
- Sperling, D.; Salon, D. Transportation in Developing Countries: An Overview of Greenhouse Gas Reduction Strategies; Technical Report; UC Berkeley, University of California Transportation Center: Berkeley, CA, USA, 2002. [Google Scholar]
- Mangold, M.; Zhao, P.; Haitao, H.; Mansourian, A. Geo-fence planning for dockless bike-sharing systems: A GIS-based multi-criteria decision analysis framework. Urban Inform. 2022, 1, 17. [Google Scholar] [CrossRef]
- Zhao, P.; Haitao, H.; Li, A.; Mansourian, A. Impact of data processing on deriving micro-mobility patterns from vehicle availability data. Transp. Res. Part D Transp. Environ. 2021, 97, 102913. [Google Scholar] [CrossRef]
- Schumann, H.H.; Haitao, H.; Quddus, M. Passively generated big data for micro-mobility: State-of-the-art and future research directions. Transp. Res. Part D Transp. Environ. 2023, 121, 103795. [Google Scholar] [CrossRef]
Figure 1.
Calibration results: Ayalon Highway projections vs. simulation projections for (a) population and (b) employment.
Figure 1.
Calibration results: Ayalon Highway projections vs. simulation projections for (a) population and (b) employment.

Figure 2.
Synthetic population for 2040 projections: (a) change in employment density and (b) change in population by TAZ.
Figure 2.
Synthetic population for 2040 projections: (a) change in employment density and (b) change in population by TAZ.

Figure 3.
Mode shares: from 2017 to 2040 forecast.

Figure 4.
Tel Aviv metropolitan area road networks: (a) map by ring boundaries; and (b) hierarchical MRT network and road map.
Figure 4.
Tel Aviv metropolitan area road networks: (a) map by ring boundaries; and (b) hierarchical MRT network and road map.

Figure 5.
Demand and supply equilibrium for 2040: the day-to-day learning process.

Figure 6.
Primary energy consumption and emissions in comparison between 2017 and 2040: (a) fuel-based consumption and (b) greenhouse gas (GHG) emissions in the morning.
Figure 6.
Primary energy consumption and emissions in comparison between 2017 and 2040: (a) fuel-based consumption and (b) greenhouse gas (GHG) emissions in the morning.


Figure 7.
Mode shares.

Figure 8.
Congestion as measured by the passenger vehicle travel time index (TTI): (a) by time of day; and (b) aggregated over morning peak hours (6–11 a.m.).
Figure 8.
Congestion as measured by the passenger vehicle travel time index (TTI): (a) by time of day; and (b) aggregated over morning peak hours (6–11 a.m.).

Figure 9.
Primary energy consumption: (a) fuel-based consumption and (b) electricity consumption.

Figure 10.
Total greenhouse gas (GHG) emissions in the morning.


Table 1.
List of abbreviations and their descriptions.
| Abbreviation | Description |
| ABM | Activity-based model |
| AMoD | Automated mobility on demand |
| AMOD | AMoD Introduction scenario |
| AMOD CR | AMoD + Car Reduction scenario AMOD TI |
| Base Case | Base Case scenario for 2040 |
| MRT | Mass rapid transit |
| KWh | Kilowatt-hours (unit of energy) |
| GHG | Greenhouse gas |
| MoD | Mobility on demand (taxi and smart mobility service) |
| TAZ | Traffic analysis zone |
| TTI | [passenger vehicle] Travel time index (unit of congestion) |
| VKT | [passenger] Vehicle kilometers traveled |
Table 2.
Key validation metrics for archetype city selection.
| Selected Characteristics | Archetype City | Prototype City | |
|---|---|---|---|
| Tel Aviv Metropolis of 2040 | MassTransit Heavyweight | ||
| Mode shares (%) | Car | 41 | 32 |
| Mass transit | 31 | 37 | |
| Walk | 23 | 23 | |
| Bicycle | 2.5 | 7.5 | |
| Sociodemographic | Population (million) | 3.5 | 8.9 |
| Population density (per sq. km) | 8714 | 5460 | |
| GDP per capita (US$1000) | 42 | 53.4 | |
| CO2 emissions per capita (annual metric tonnes) | 12 | 9.6 | |
| Network | Travel time index | 1.8 | 1.39 |
| Street length average (m) | 130 | 125 | |
Table 3.
Validation of fuel price elasticities of trip demand in MassTransit Heavyweight.
| Mode | Elasticity | |
|---|---|---|
| MassTransit Heavyweight | Europe [45] | |
| Private car | −0.15 | −0.18 |
| Mass transit | +0.09 | +0.13 |
| Bike | +0.05 | 0.07 |
| Walk | +0.06 | |
| All | −0.007 | |
Table 4.
Average stops per person by scenario.
| Base Year 2017 | Base Year 2040 | |
|---|---|---|
| Stop/Person | 4.495 | 4.504 |
| Tour/Person | 1.663 | 1.671 |
Table 5.
Selected transport network supply model parameter specifications for the Tel Aviv metropolitan area.
Table 5.
Selected transport network supply model parameter specifications for the Tel Aviv metropolitan area.
| Network Component | Number | |
|---|---|---|
| Road | Nodes | 6220 |
| Links | 14,799 | |
| Segments | 30,585 | |
| Bus | Routes | 728 |
| Stops | 4607 | |
| Rail | Routes | 6 |
| Stations | 223 | |
Table 6.
Mode availabilities across scenarios.
| Mode | Base Case | AmoD Instead of MoD | AMoD Transit Integration | AMoD+ Car Reduction | |
|---|---|---|---|---|---|
| Car | Drive alone | ||||
| Pool (2) | |||||
| Pool (3) | |||||
| Mass rapid transit | Bus | ||||
| Train | |||||
| On-demand | Taxi | X | X | X | |
| AMoD single | X | ||||
| AMoD shared | X | ||||
| Active mobility | Bicycle | ||||
| Walk | |||||
| Other | Private bus | ||||
| Motorcycle |
Table 7.
Powertrain assumptions and specifications.
| Vehicle | Powertrain |
|---|---|
| Private car | Gasoline-powered (conventional and hybrid) and electric (according to survey and forecasts) |
| MoD | Gasoline-powered (conventional and hybrid according to survey) |
| AMoD | Battery electric |
| Public bus | Electric |
| Train | Electric |
Table 8.
Summary of trip impacts.
| Trip Mode | AMOD | AMOD TI | AMOD CR |
|---|---|---|---|
| Car/Carpool | −2.5% | −12.2% | −16.1% |
| Mass transit | −3.4% | 10.2% | 9.2% |
| Active mobillity | −33.7% | −26.7% | −31.0% |
| Other | −1.1% | 4.7% | −2.7% |
| On-demand | 3297% | 2940% | 3640% |
Table 9.
Comparison of the impacts of AMoD on mass transit mode share across cities (in red—unsustainable outcome; in green—sustainable outcome).
Table 9.
Comparison of the impacts of AMoD on mass transit mode share across cities (in red—unsustainable outcome; in green—sustainable outcome).
| Prototype City | Mass Transit Share | |||
|---|---|---|---|---|
| Base | AMOD | AMOD TI | AMOD CR | |
| Auto Sprawl | 4% | 3% | 7% | |
| Auto Innovative | 10% | 8.5% | 12.5% | |
| MassTransit Heavyweight | 38% | 36% | 39.5% | 41% |
| Tel Aviv Metropolis | 31% | 30% | 33.8% | 33.9% |
Table 10.
Impacts of (a) AMoD Transit Integration and (b) AMoD + Car Reduction with respect to the base case and AMoD compared across three prototype cities (in green—sustainable outcome).
Table 10.
Impacts of (a) AMoD Transit Integration and (b) AMoD + Car Reduction with respect to the base case and AMoD compared across three prototype cities (in green—sustainable outcome).
| (a) AMoD Transit Integration | ||||||
| Prototype City | Percentage Changes | |||||
| TTI | Energy | Emissions | ||||
| Base | AMOD | Base | AMOD | Base | AMOD | |
| Auto Sprawl | 12% | 2% | −3% | 1% | −13% | −3% |
| Auto Innovative | 36% | −5% | 12% | 2% | ∼0% | 2% |
| MassTransit Heavyweight | 9% | 1% | −9% | −13% | −11% | −12% |
| Tel Aviv Metropolis | 3.8% | ∼0% | 9% * | 8% * | 9% | 8% |
| 1% * | 1% ** | |||||
| (b) AMoD + Car Reduction | ||||||
| Prototype City | Percentage Changes | |||||
| TTI | Energy | Emissions | ||||
| Base | AMOD | Base | AMOD | Base | AMOD | |
| MassTransit Heavyweight | 8% | ∼0% | −16% | −20% | −20% | −21% |
| Tel Aviv Metropolis | 1% | 3% | −7% * | −9% * | −7% | −7% |
| 3% ** | −5% ** | |||||
* Fuel-based (gasoline and diesel) consumption. ** Electricity consumption.
Disclaimer/Publisher’s Note: The statements, opinions and data contained in all publications are solely those of the individual author(s) and contributor(s) and not of MDPI and/or the editor(s). MDPI and/or the editor(s) disclaim responsibility for any injury to people or property resulting from any ideas, methods, instructions or products referred to in the content. |
© 2023 by the authors. Licensee MDPI, Basel, Switzerland. This article is an open access article distributed under the terms and conditions of the Creative Commons Attribution (CC BY) license (https://creativecommons.org/licenses/by/4.0/).
Share and Cite
MDPI and ACS Style
Nahmias-Biran, B.-H.; Dadashev, G.; Levi, Y. Sustainable Automated Mobility-On-Demand Strategies in Dense Urban Areas: A Case Study of the Tel Aviv Metropolis in 2040. Sustainability 2023, 15, 16037. https://doi.org/10.3390/su152216037
AMA Style
Nahmias-Biran B-H, Dadashev G, Levi Y. Sustainable Automated Mobility-On-Demand Strategies in Dense Urban Areas: A Case Study of the Tel Aviv Metropolis in 2040. Sustainability. 2023; 15(22):16037. https://doi.org/10.3390/su152216037
Chicago/Turabian StyleNahmias-Biran, Bat-Hen, Gabriel Dadashev, and Yedidya Levi. 2023. "Sustainable Automated Mobility-On-Demand Strategies in Dense Urban Areas: A Case Study of the Tel Aviv Metropolis in 2040" Sustainability 15, no. 22: 16037. https://doi.org/10.3390/su152216037
Note that from the first issue of 2016, this journal uses article numbers instead of page numbers. See further details here.