
Risk Classification Assessment and Early Warning of Heavy Metal Contamination in Meat Products
1
National Engineering Research Centre for Agri-Product Quality Traceability, Beijing Technology and Business University, Beijing 100083, China
2
China Food Flavor and Nutrition Health Innovation Center, Beijing Technology and Business University, Beijing 100048, China
3
China International Electronic Commerce Center, Beijing 100083, China
*
Author to whom correspondence should be addressed.
Sustainability 2023, 15(21), 15558; https://doi.org/10.3390/su152115558
Submission received: 15 July 2023
/
Revised: 21 October 2023
/
Accepted: 31 October 2023
/
Published: 2 November 2023
Abstract
:Risk classification assessment and early warning systems are indispensable tools and technologies in the realm of regulatory control. Evaluating and issuing early warnings regarding heavy metal contaminants in meat products play a pivotal role in ensuring public safety and maintaining societal stability. In this study, we focused on heavy metal pollutants such as lead, cadmium, chromium, and arsenic. We collected national inspection data for meat products from 20 provinces in 2020. Combining dietary structure data, toxicology information, and dietary exposure assessment methods, we constructed a risk assessment model for heavy metal contaminants in food. Furthermore, we employed an entropy weight-based analytic hierarchy process (AHP-EW) to classify the results of the risk assessment for heavy metal contaminants in food. This involved determining risk rating levels and thresholds. Finally, we constructed a multi-step food contaminant risk prediction model based on the Transformer framework. To validate the model’s performance, comparative assessments were conducted across 20 datasets using various models. The results clearly indicate that the Transformer model outperformed the others in 14 datasets, excelling in its ability to provide advanced warnings for heavy metal risks in meat products. This empowers relevant authorities to strengthen their regulatory oversight of meat products based on the procedures and models proposed in this study, ultimately enhancing the efficiency of food safety risk management.
1. Introduction
Meat products constitute an important component of the daily human diet, and they are a major source of both moisture and nutrients, including protein, minerals, vitamins, and fats. However, meat products also contain a certain level of heavy metal residues such as cadmium (Cd), lead (Pb), arsenic (As), and chromium (Cr) [1,2]. Owing to their toxicological effects on human health, the accumulation of heavy metals in meat products is becoming a serious concern regarding food safety; even at very low levels, most of these metals can cause various diseases and negative health effects, such as renal insufficiency and osteoporosis, as well as cardiovascular, hematological, reproductive, and immune system disorders [3,4]. Simultaneously, the heavy metal contamination of meat products has also increased at an unprecedented rate [5]. Therefore, both dietary exposure assessment and the strict control of potentially toxic metals in meat products bear particular significance.
To systematically assess the heavy metal hazards from consuming meat products, dietary exposure to these elements needs to be determined, and the risk level has to be accurately evaluated. Comprehensive dietary studies on element analysis in different food items, including meat products, have been conducted as part of the Total Diet Study over recent decades in Denmark [6], Brazil [7], and China [8]. Specifically, in China, Wang [8] et al. analyzed spatial distributions and performed a parameter estimation of the heavy metal contents in Chinese meat products. Liang [9] et al. assessed the health risks of foodstuffs in Beijing, including meat products, that were associated with toxic metals, as determined from target hazard quotients (THQs). In existing risk assessment studies of meat products, the risk assessment of the heavy metals occurring in meat products has primarily focused on toxic heavy metals. Although several dietary exposure assessments of meat products have been conducted in specific areas (e.g., Beijing), a systematic and comprehensive exposure assessment of meat products at the national level has yet to be undertaken.
Several improved risk classification assessment models have been applied in food safety risk assessment. The analytic hierarchy process–entropy weight (AHP-EW) method is among the most commonly and successfully used techniques. Geng [10] et al. used the AHP-EW approach to fuse the risk of each detection index based on the detection data by which the risk classification and the objective risk assessment are realized. However, their studies directly fused detection data instead of assessment indices, which may not comprehensively reflect health risk. Niu [11] et al. determined the risk and the risk grade of the product by combining the entropy weight with the dietary exposure assessment indices of edible vegetable oil by using AHP-EW. They avoided the influence of subjective factors, but their research only assessed integrated heavy metal hazards. To comprehensively determine the risk and the risk classification of single and integrated heavy metal hazards in meat products with objective weights, AHP-EW based on dietary exposure assessment was applied, thereby establishing a risk classification model.
Accurate prediction of the future, given the past based on time series data, is of paramount importance, since it opens the door for decision making and risk management ahead of time [12]. A growing number of food safety risk prediction models have been developed to enhance prediction performance, which is crucial for an effective food safety early warning model based on risk assessment and classification. However, current studies have mostly adopted solutions or paradigms that describe the food safety risk prediction problem as a regression problem instead of as a time series analysis problem (i.e., multi-step time series prediction, the analytical task of predicting a sequence of values in the future). These methods generally include back propagation (BP) [13] and the radial basis function (RBF) network [14]. Geng [15] et al. further adapted the agglomerative hierarchical clustering (AHC) algorithm, which integrates RBF to improve the accuracy of early warning, thereby facilitating effective food safety control. Niu [11] et al. also established a vegetable oil safety early warning model based on BP neural networks. Chemical hazards in vegetable oil was thus detected at an early stage. Although shallow neural networks (e.g., BP and RBF) have achieved satisfactory results in regression problems, they remain unable to completely solve multi-step time series forecasting problems because of certain insuperable problems, such as error accumulation [16].
Traditional shallow neural network models, such as artificial neural networks (ANNs), BP neural networks, and RBF models, may not be able to extract and use deep features, while deep learning methods such as Recurrent Neural Networks (RNNs) [17], Long Short-Term Memory (LSTM) [18], and Gated Recurrent Unit (GRU) [19] can capture the high-dimensional features of data and can exhibit dynamic changes in the time dimension. These methods are used for forecasting in many fields, such as weather forecasting and traffic forecasting, and the prediction accuracy is high [20]. Based on deep learning models, such as RNN, LSTM, and GRU, encoder–decoder networks can further improve the efficiency of processing time series data. However, their performance will rapidly degrade with the increase of the input length of the sequence [20]. To solve this problem, attention-based encoder–decoder networks [21] apply an attention mechanism and hide some states during the time step, and thus good results are obtained in multivariate time series prediction. In addition, the Transformer model [22] shows better performance than the RNN model in capturing long-range dependencies, and it can reduce the maximum travel path length of the network signal to the shortest possible length through a self-attentive mechanism, which can avoid circular structures [23]. However, the Transformer model has three obvious limitations in solving long-term prediction, namely, the secondary computation of self-attention, the speed plunge in predicting long outputs, and the memory bottleneck of stacked layers. Some results have been proposed to improve prediction efficiency. Zhou [23] et al. designed the multi-head ProbSparse-based informer model to solve the three limitations in long-term prediction.
Based on the current state of research, it is evident that there are several issues in the field of risk classification assessment and warning systems. Specifically, regarding the subject of food risk classification management, the focus has predominantly been on food producers and types, with relatively limited research on the risk classification of food contaminants. From a regulatory perspective, there is limited research that combines temporal and spatial dimensions to implement fine-grained risk classification. Most studies have concentrated on exposure assessments in specific regions, often utilizing small datasets, and few have conducted nationwide research. In terms of research methods, most risk assessments have employed semi-quantitative approaches, and the predictive methods used for food safety are mostly single-step or fitting predictive techniques, making it difficult to predict long-term trends in food safety risks.
Therefore, in this study, we have constructed a risk classification assessment model based on food sampling data, hazard substance levels, dietary patterns, and the integration of exposure assessment and the AHP-EW method. From the perspective of health risks caused by the intake of heavy metal contaminants in residents’ diets, we have dynamically assessed the risk of heavy metal contamination in food across twenty provinces and municipalities. To solve the multi-step time series prediction problem, a widely applied Transformer-based model was introduced in this study to construct an early warning model with improved performance. This model could effectively perform a comprehensive risk classification assessment of meat products, as well as predict the risk of a single or an integrated heavy metal hazard.
2. Materials and Methods
2.1. Data Collection and Processing
2.1.1. Data Source
Cd, Pb, As, and Cr were selected to analyze the heavy metal hazards in meat products. A total number of 27,000 samples from the National Food Safety Sampling Inspection Information System of China in 2020 were included in this study.
To establish the subsequent risk assessment model, we collected resident consumption data and related toxicology data to calculate the assessment indexes. The resident consumption data on meat products in four regions, consisting of 20 provinces, in China were obtained from the 5th Chinese Total Diet Study (TDS) [8].
Moreover, related toxicology data were collected from the Food and Agriculture Organization of the United Nations, the World Health Organization, and the United States Environmental Protection Agency. The reference doses (RfD, mg/(kg·d)), cancer slope factor (CSF, (kg·d)/mg), and the national limit standard (mg/kg) for sources of heavy metals in meat products are listed in Table 1.
2.1.2. Data Preprocessing
Key information was integrated, and useless information was deleted during data preprocessing. Some detection results were recorded as “not detected” in the original data. This study used the data processing specifications of the European Food Safety Agency (EFSA), in which the concentration of heavy metals was set at half the limit standard for the non-detections, which were then presented as half the limit standard in this study. For results with an extra symbol, such as “<”, the symbol was deleted, and the value was retained [25].
2.2. Dietary Exposure Assessment Method
To systematically measure the precise risk of heavy metal hazards in meat products, the risk levels were classified based on the following selected risk assessment indices: the human health risk was evaluated based on the Target Cancer Risk (TCR) and Target hazard quotient (THQ) for carcinogenic and noncarcinogenic risks. In addition, the Nemerow integrated pollution index (NIPI), which has an advantage over other indices in that it can determine the risk of contamination of metals studied in the region, was also introduced to evaluate the environmental risk [26,27].
2.2.1. Geographic Scope and Division
In this study, we adopted the division used in the 5th Chinese TDS to conduct a safety risk assessment and early warning of meat products in China. The divisions were as follows: the North I, North II, South I, and South II regions. North I includes Beijing and the provinces of Hebei, Heilongjiang, Jilin, and Liaoning; North II includes Inner Mongolia and the Qinghai, Ningxia, Shannxi, and Henan provinces; South I includes Shanghai and the provinces of Jiangsu, Zhejiang, Jiangxi, and Fujian; and South II includes the provinces of Guangdong, Guangxi, Hunan, Hubei, and Sichuan. Each region (representing a major market basket) consists of five provinces, municipalities, or autonomous regions. The four aforementioned regions cover a total of 20 provinces (municipalities and autonomous regions) [28].
2.2.2. Nemerow Integrated Pollution Index
NIPI is used to evaluate heavy metal pollution in meat products, which reflects the characteristics of food pollution [29]. The expression is given by
where is the detection value of the heavy metal in food ; is the national limit standard for heavy metal in food [30]; is the average value of the heavy metal pollution index in meat products; and is the maximum value.
2.2.3. Target Cancer Risk
We used the TCR to measure the carcinogenic risk [31]. The expression is given by
where denotes the carcinogenic intensity index of the heavy metal ; is the per capita daily consumption of meat product ; is the 50th quantile (mg/kg) of the heavy metal detected on a certain day or area; and is the average body mass of the residents.
2.2.4. Target Hazard Quotient
2.3. Analytical Hierarchy Process–Entropy Weight
The AHP-EW approach based on risk assessment indices (i.e., NIPI, TCR, and THQ) was used to fuse the assessment indices, thereby obtaining the single and integrated heavy metal hazard level. The early warning threshold was thus determined, and the risk classification was realized. AHP-EW uses the entropy weight method to calculate the weights of indicators, combined with AHP for matrix evaluation. The purpose is maximizing the unity of objective and subjective weights, thus improving the accuracy of weight evaluation results. The specific AHP-EW process is outlined as follows:
Step 1: The original assessment index matrix I is constructed in accordance with the detection data:
where n is the number of samples, and m is the number of risk assessment indices.
Step 2: Central normalization is performed using Equation (5) to eliminate the effects of different ranges of assessment index metrics:
Step 3: The risk assessment indices do not include negative numbers; thus, the n-dimensional symmetric matrix COR is directly calculated as follows:
Step 4: The weight of each index in the m-dimensional symmetric matrix is calculated using Equation (7).
where represents the entropy of each index; entropy represents the measure of the difference in index data in the symmetric matrix COR; and denotes the weight of each index.
Step 5: The calculated weight is used for fusing risk assessments to determine the risk value of each sample data. The risk value , which fuses the different assessment indices, is ultimately determined using Equation (8).
2.4. Transformer-Based Model
2.4.1. Problem Description
Based on the aforementioned AHP-EW method, three corresponding risk assessment indices—that is, the NIPI, TCR, and THQ, calculated using the detection data—of each heavy metal (i.e., Cd, Pb, As, and Cr) were fused to determine the single heavy metal hazard (i.e., the Cd, Pb, As, and Cr hazard). Moreover, the integrated heavy metal hazard, which fused the aforementioned four single heavy metal hazards, was also acquired and employed to realize an early warning for integrated and comprehensive heavy metal hazards in meat products; the integrated heavy metal hazard results, calculated and obtained by the AHP-EW method based on the four aforementioned single heavy metal hazards, combined with the hazard results for four single heavy metals, also functioned as datasets for the subsequent time series prediction model.
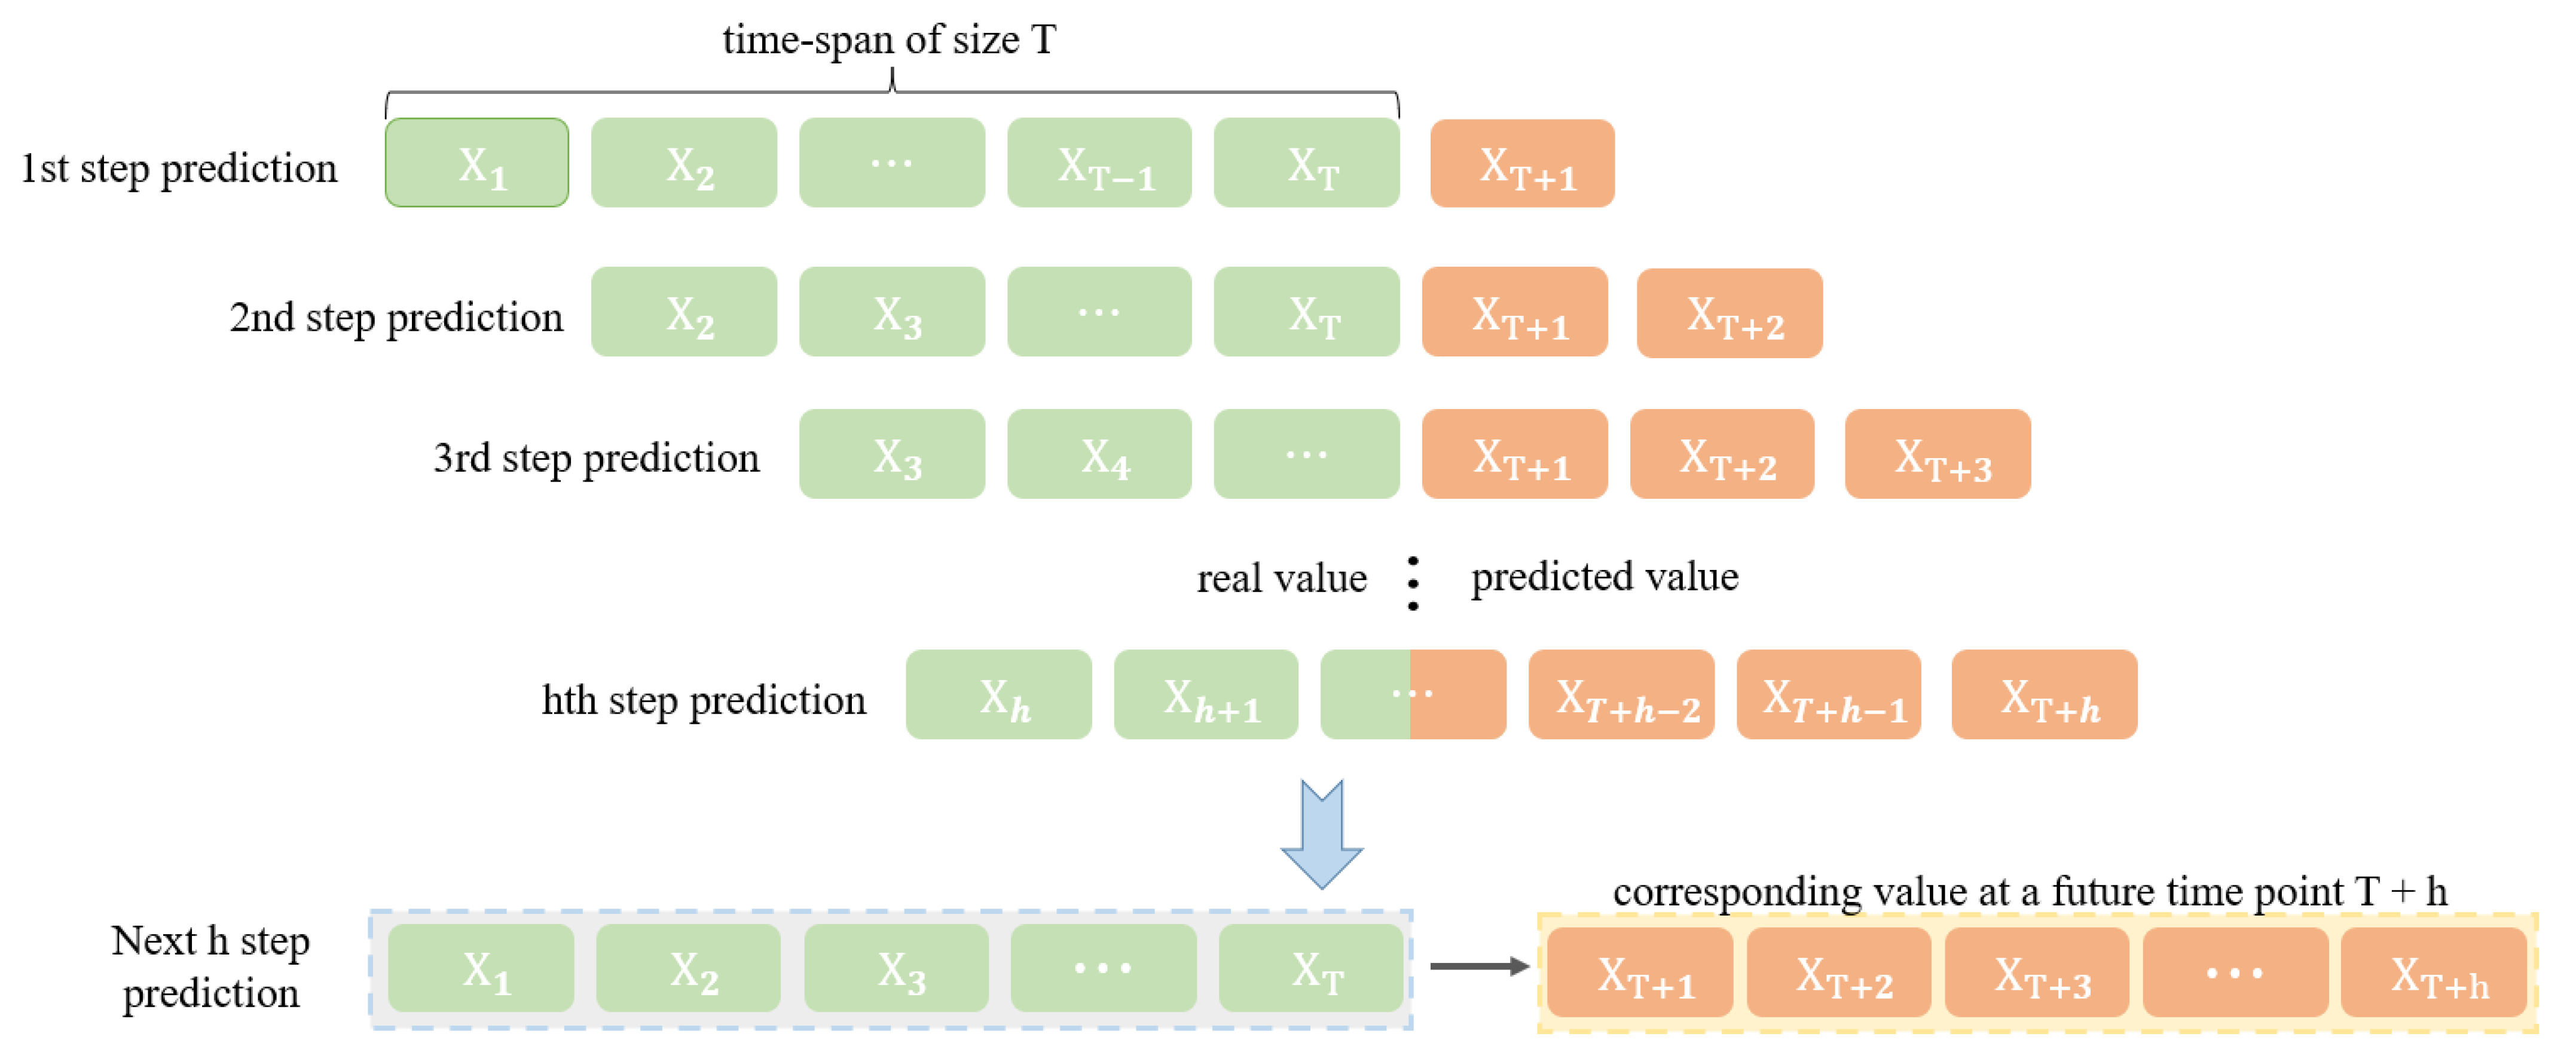
We denoted the size of the time span for one input as T. At each time step t, the historical risk value was denoted by , whose elements are the observations from m heavy metal risk values. The training data in a time span of size T were . The problem was to predict the corresponding value at a future time point T + h, where h refers to the horizon of the prediction [9]. When h is larger than 1, the problem becomes a multi-step prediction task, as shown in Figure 1.
Specifically, in our study, we selected four single risk values fusing the three assessment indices of heavy metals per day (t) to conduct an early warning of four single heavy metal hazards; we also chose the integrated risk values, fusing four single risk values per day (t) to conduct the early warning of integrated heavy metal hazards in meat products.
2.4.2. Input Embedding
The Transformer uses a point-wise self-attention mechanism to capture long-range dependence [34,35]. The scalar context is projected into the -dim vector by applying one-dimensional convolutional filters, where the stride is 1 and the kernel width is 3.
where is the length of the input, and is the feature dimension after input embedding.
2.4.3. ProbSpare Self-Attention
The ProbSparse self-attention mechanism is defined as
where , is a sparse matrix, and is the input dimension.
The ith query attention on all keys is defined as a probability . In order to distinguish the importance of queries, the similarity between and is measured by using the Kullback–Leibler divergence. The ith query sparsity measurement can be defined as
To reduce the computational complexity, Equation (11) can be approximated as
2.4.4. Encoder and Decoder
The encoder module captures the long-term dependency of inputs. The encoder is composed of several attention layers and convolutional layers. The relation between two layers is
where is the multi-head ProbSparse self-attention, Convld performs one-dimensional convolutional filters, and ELU is the activation function [36].
The feature map generated by the encoder is imported into the decoder. The decoder has two identical multi-head attention layers. To mitigate the speed plunge in long prediction, the following vector is fed to the encoder:
where is embedded in the input sequence and time stamp. is a placeholder for the target sequence with scalar value 0.
By using the encoder module and the decoder module, the Transform-based model achieves a long-term food safety risk time series prediction.
2.5. Overall Framework
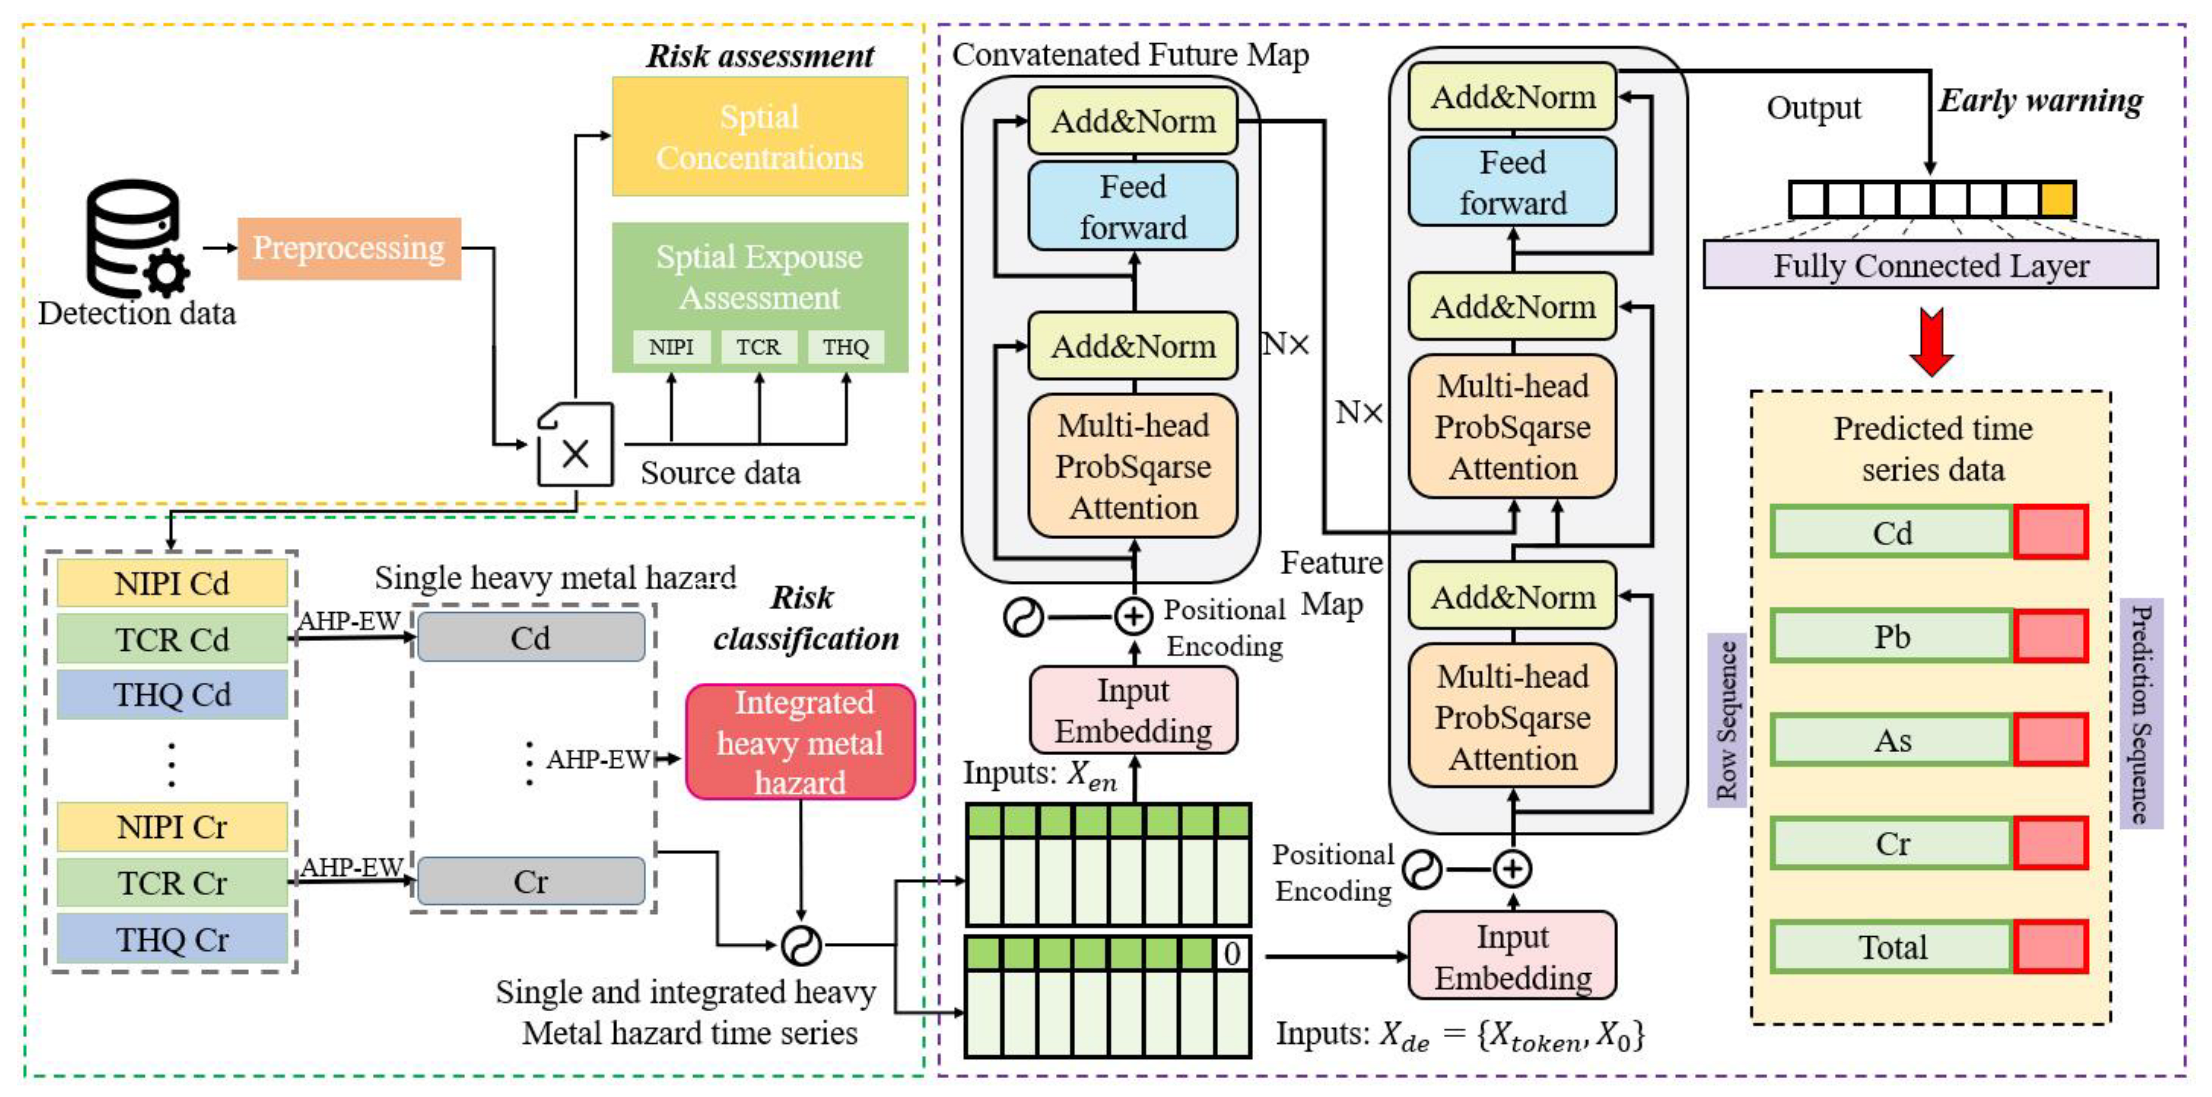
The proposed heavy metal risk classification assessment and the Transformer-based prediction framework presented in Figure 2 mainly consist of three blocks: (1) First, in the risk assessment blocks, the detection data of meat products are used perform a comprehensive spatial dietary exposure assessment of heavy metals by using the risk assessment index system, which integrates human health (TCR and THQ) and the environment (NIPI) as factors. (2) Second, in the risk classification blocks, the risk of single and integrated heavy metals and the risk grade were determined by deploying the AHP-EW method to fuse risk assessment indices which then function as datasets for the subsequent early warning model of heavy metal hazards in meat products. (3) Eventually, in the early warning block, a novel Transform-based model was applied to realize the effective long-term prediction of single and integrated heavy metal risk on the basis of the detection data in the China time series prediction.
3. Result and Discussion
3.1. Risk Assessment of Heavy Metals
We first statistically analyzed the concentrations and then conducted a risk assessment of four heavy metals. Table 2 lists the distribution of the heavy metal contents and their assessment indices in meat products.
With regard to heavy metals in China in 2020, Cr exhibited the highest mean concentration (0.0699 mg/kg), followed by Pb (0.0199 mg/kg), in the tested meat products. These results were consistent with the findings reported by Wang et al. 2019. In addition, the concentrations of Cr and As largely varied (i.e., large standard deviation), indicating that a portion of the meat was highly contaminated by these heavy metals, resulting from different pollution sources. With regard to the risk assessment indices, for NIPI, Cd showed the highest index (3.2529), followed by Pb; for TCR, Cr exhibited the highest index (0.000292), followed by Cd (0.000053); for THQ, As achieved the highest value (2.222), followed by Cr (1.3333). The aforementioned results indicate that the order of the average content of heavy metals in meat products in China was Cr > Pb > As > Cd; nonetheless, on the basis of the TCR and THQ, the carcinogenic risk may be primarily caused by Cr and Cd, whereas the noncarcinogenic risk may be attributed to As and Cr. Moreover, the four heavy metals exceeded 1, as determined by the TCR and THQ. This finding, particularly the level of Cd pollution in meat products, is concerning.
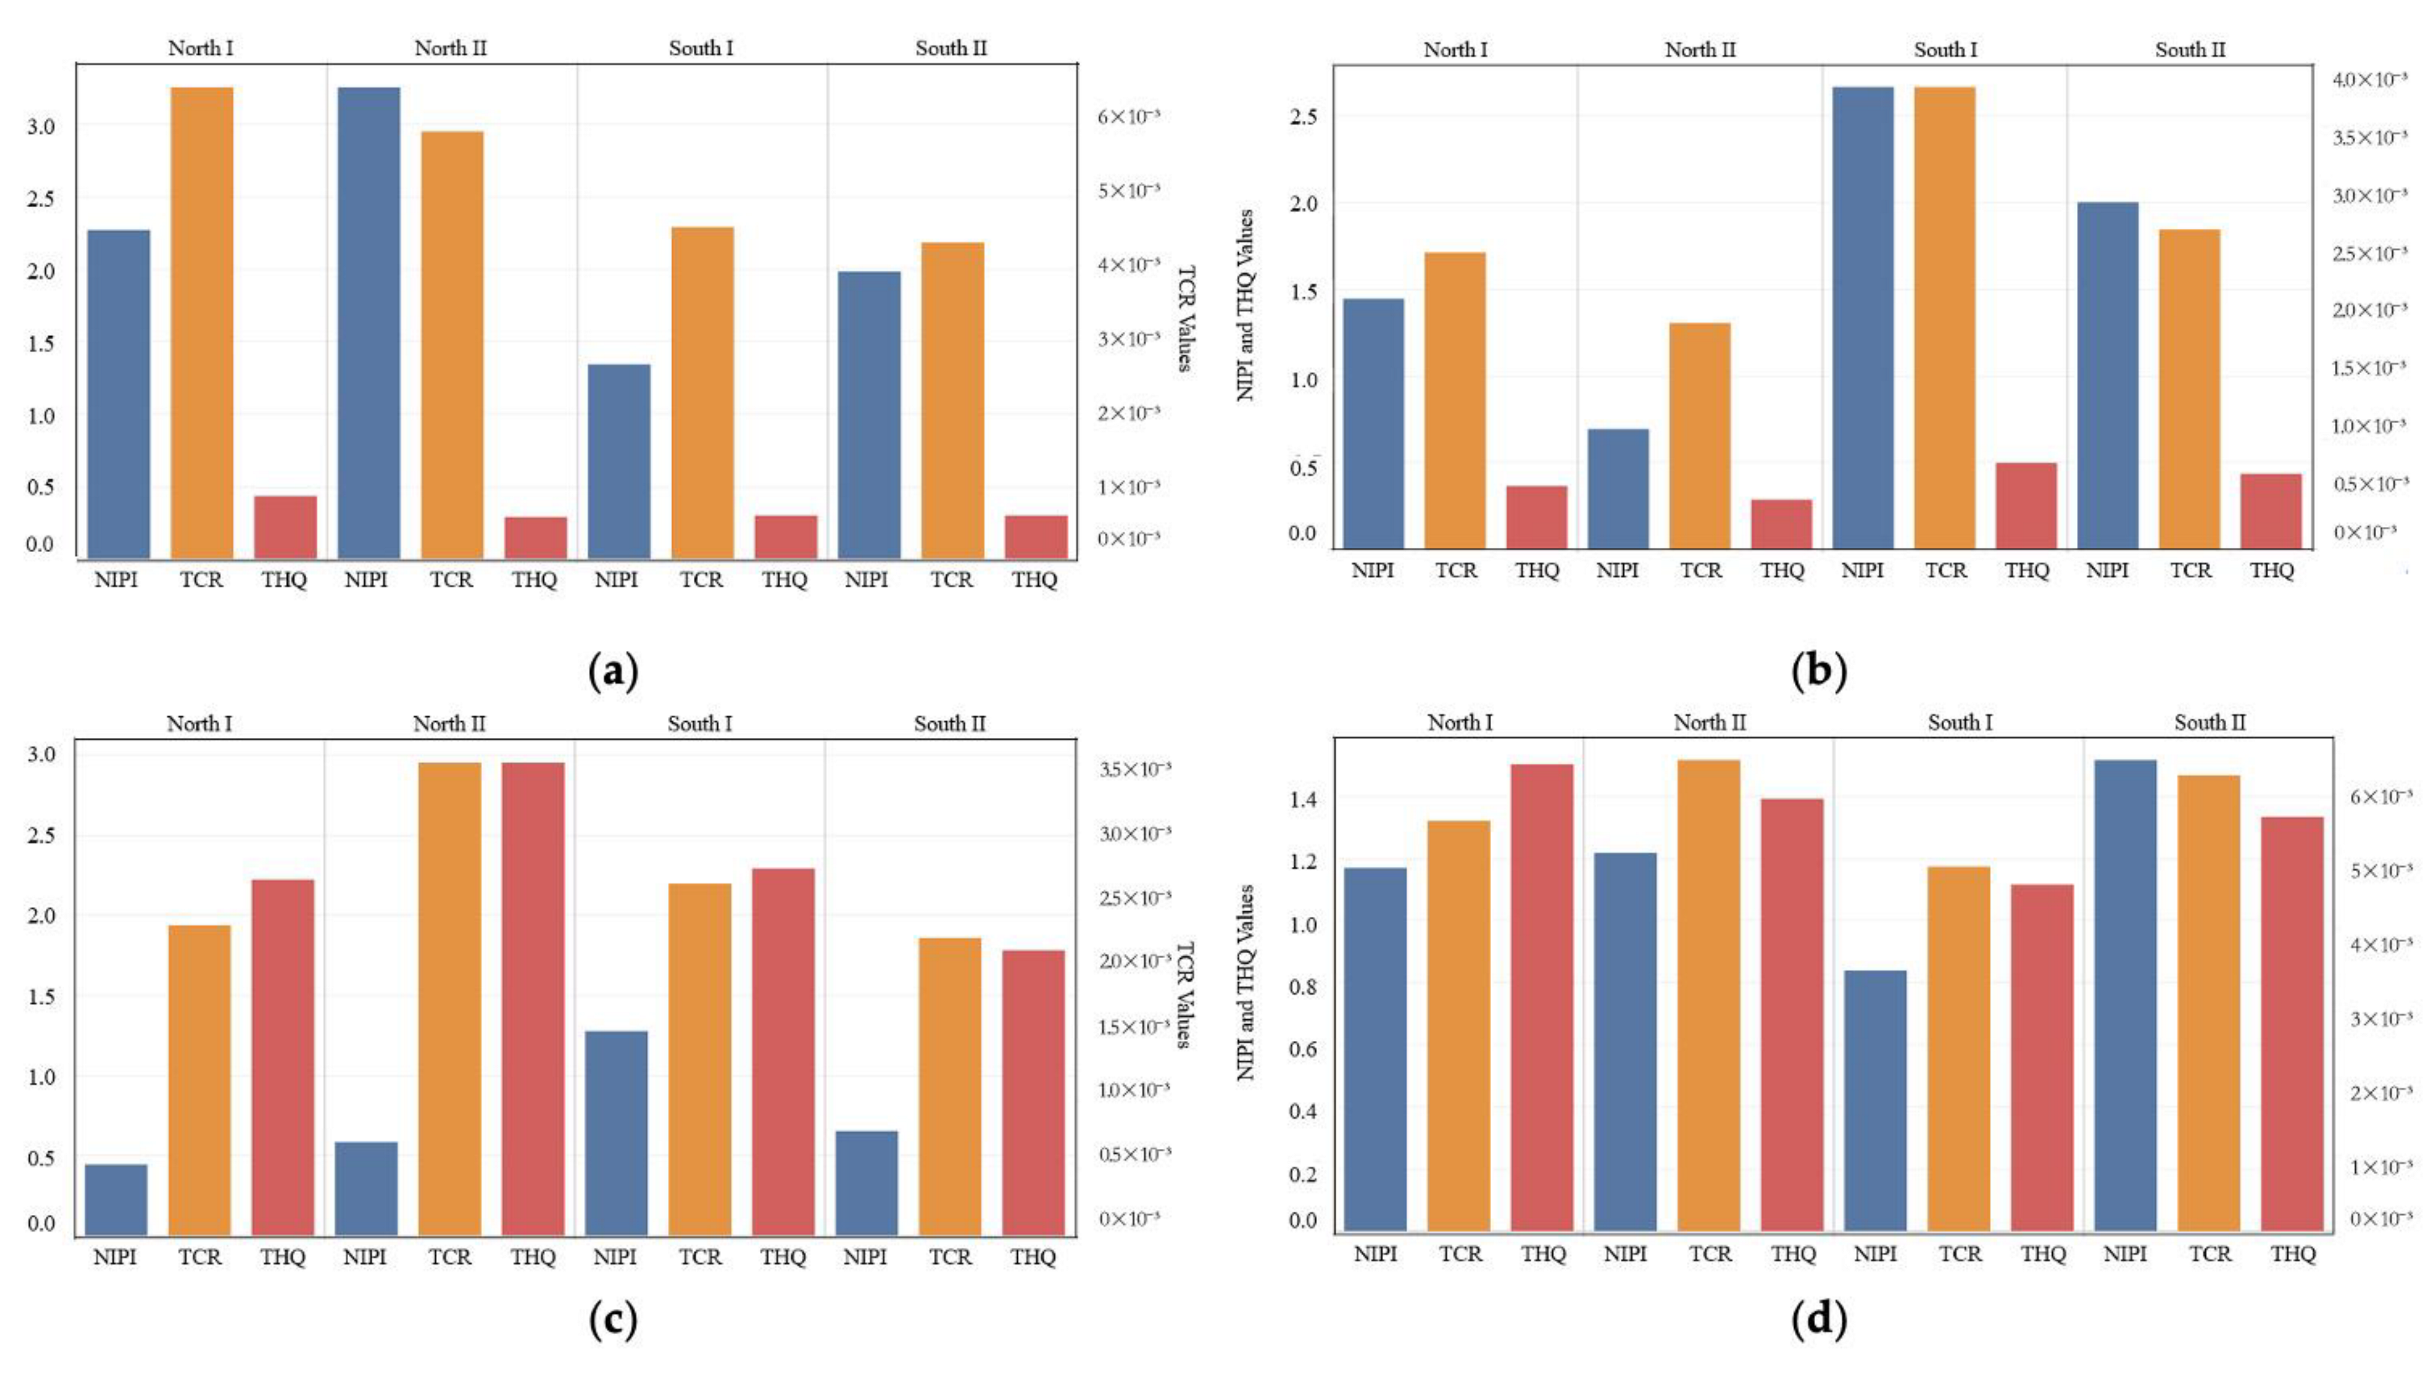
After an overall assessment of the heavy metal content in China was conducted, spatial analysis of four heavy metals in meat products was performed. Figure 3 presents the spatial concentration and the risk index distributions of Cd, Pb, As, and Cr in four regions.
The NIPI and TCR values, with respect to Cd, were higher in North I and North II, with North I having a higher TCR than North II, reaching . The TCR values in all regions exceeded , indicating that the carcinogenic risks of Cd in meat products fell outside of the acceptable range and that exposure to such risks could not be ignored. Meanwhile, the regional differences in THQ were smaller, and the THQ values in all four regions were less than 0.5, indicating that the Cd in meat products presented a negligible noncarcinogenic risk to human health. The assessment indices with respect to Pb were higher in the south than in the north. The NIPI value was lower than 1 in North II only, whereas the TCR and THQ values were lower in all four regions, with TCR considerably below the safety threshold (10–4), compared with Cd, and THQ was less than 1. These results are consistent with previous health risk assessment results as determined from surveys and from a literature review in China (Yu et al., 2017), indicating the low carcinogenic and noncarcinogenic risks of lead in meat products in all four regions. However, the level of environmental hazard (NIPI) in lead is still not negligible.
The assessment indices with regard to As, similar to Cd, were higher in the northern regions, particularly in North II, than in the southern regions. NIPI exceeded 1 in South II only, indicating the low concentration of As in other regions. However, all TCR and THQ values in the four regions exceeded the safety threshold. The THQ values with respect to As in the four regions were close to or higher than 2, considerably higher than the THQ with respect to the other three metals. This outcome indicates the exposure of the inhabitants of China to possible adverse health effects. Notably, a THQ > 1 does not necessarily suggest that local people were exposed to noncarcinogenic risk. Nonetheless, given the high risk assessment indices in this study, the carcinogenic and noncarcinogenic risks of As in meat products need to be effectively regulated, particularly in North II (i.e., Inner Mongolia, Shaanxi, etc.). Meanwhile, the differences in Cr among the four regions were small; however, the assessment indices in South I were relatively low—that is, the NIPI < 1. Both TCR and THQ with respect to Cr exceeded the safety threshold, similar to As; however, the THQ values were below 2, indicating that the noncarcinogenic risk of Cr was lower than that of As. Nonetheless, the values remained within the higher-risk range, thus requiring sufficient attention from regulatory authorities. Therefore, to reduce the risk of heavy metal contamination in meat products, relevant departments should actively strengthen the supervision of heavy metals, and attention should be shifted toward the monitoring of meat products in North II.
3.2. Risk Classification of Heavy Metal Hazard
We performed a risk classification, based on the risk assessment of four heavy metals in meat products, for both single and integrated heavy metal hazards in four regions using the AHP-EW method. Furthermore, we systematically analyzed the spatial distribution of four heavy metal contaminants and established a time series early warning model.
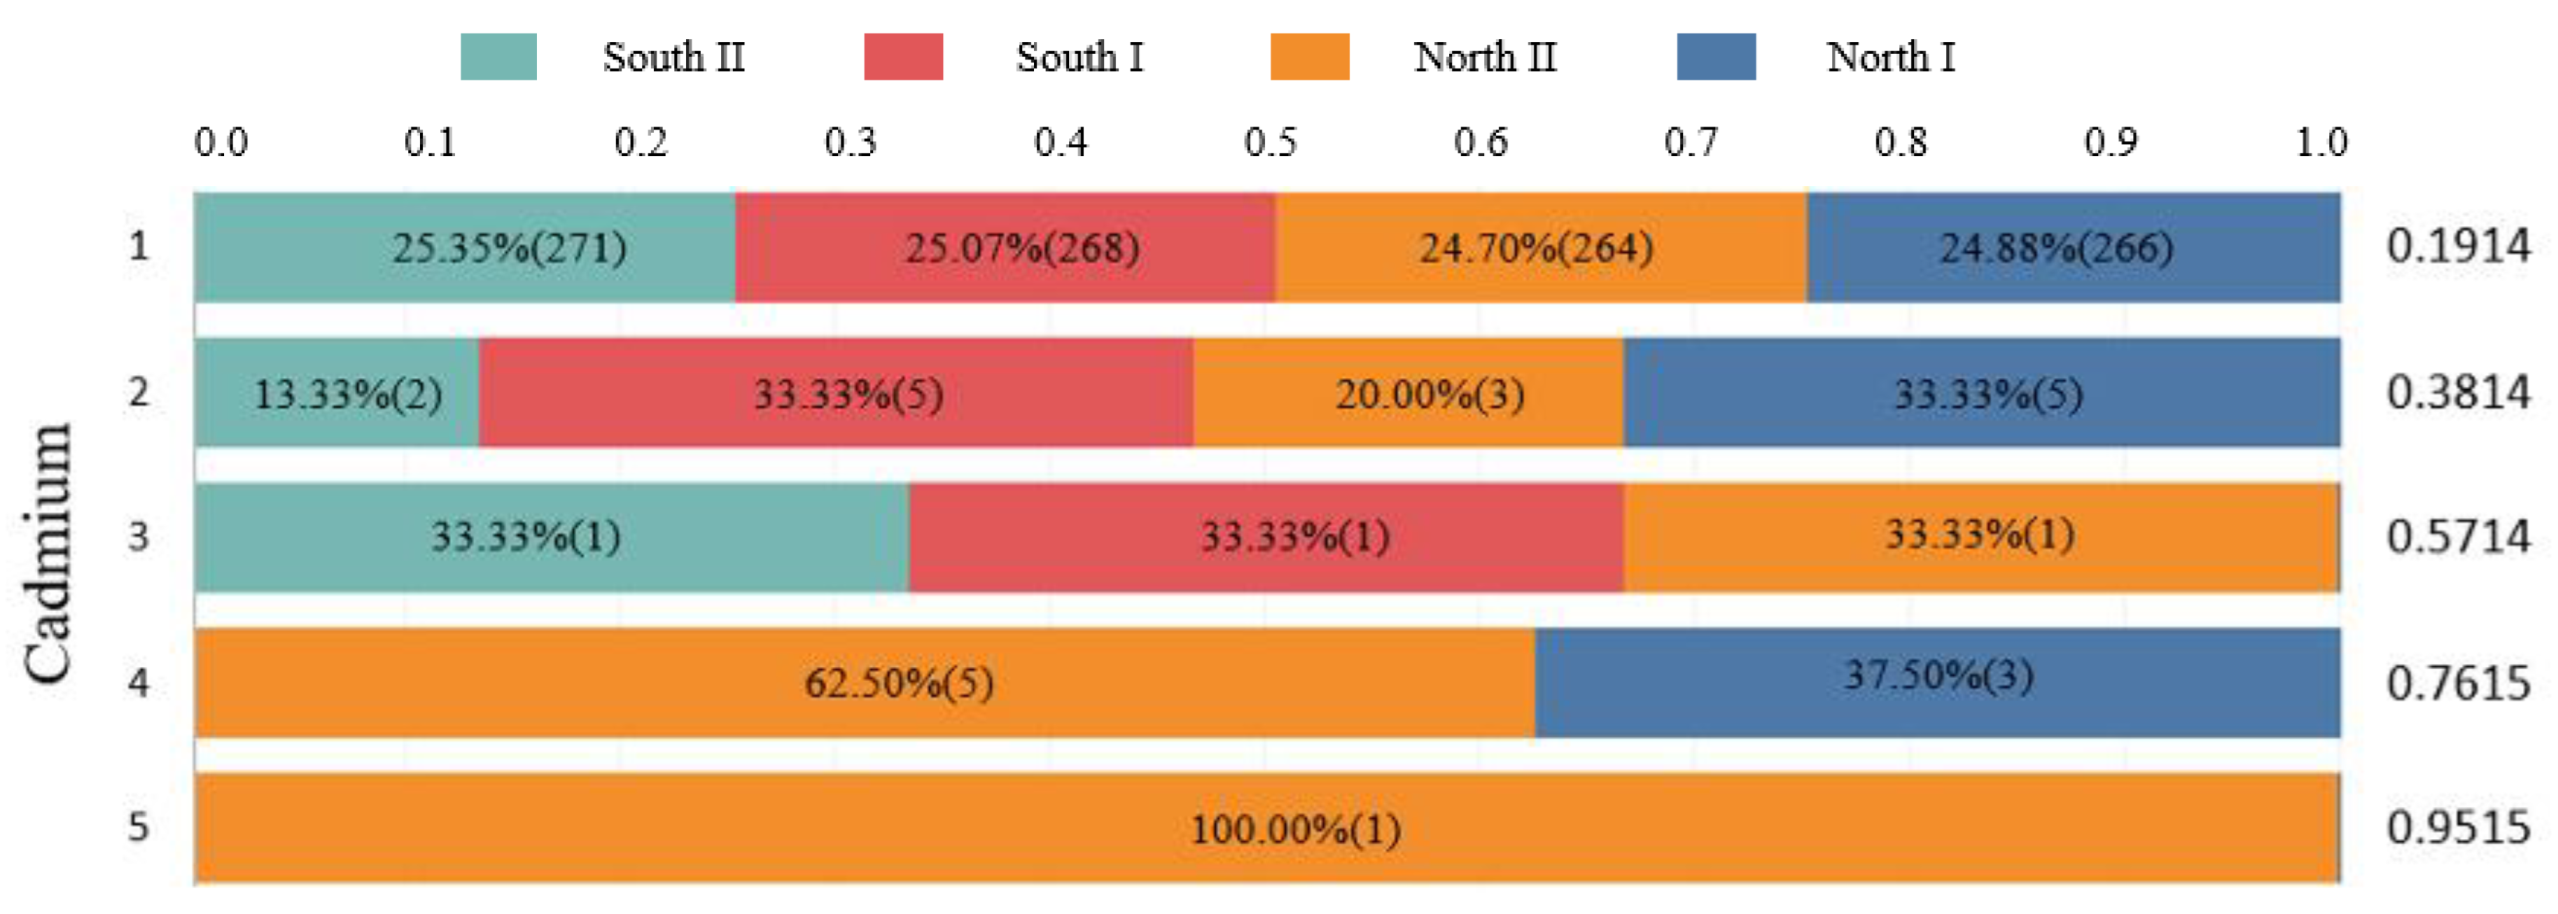
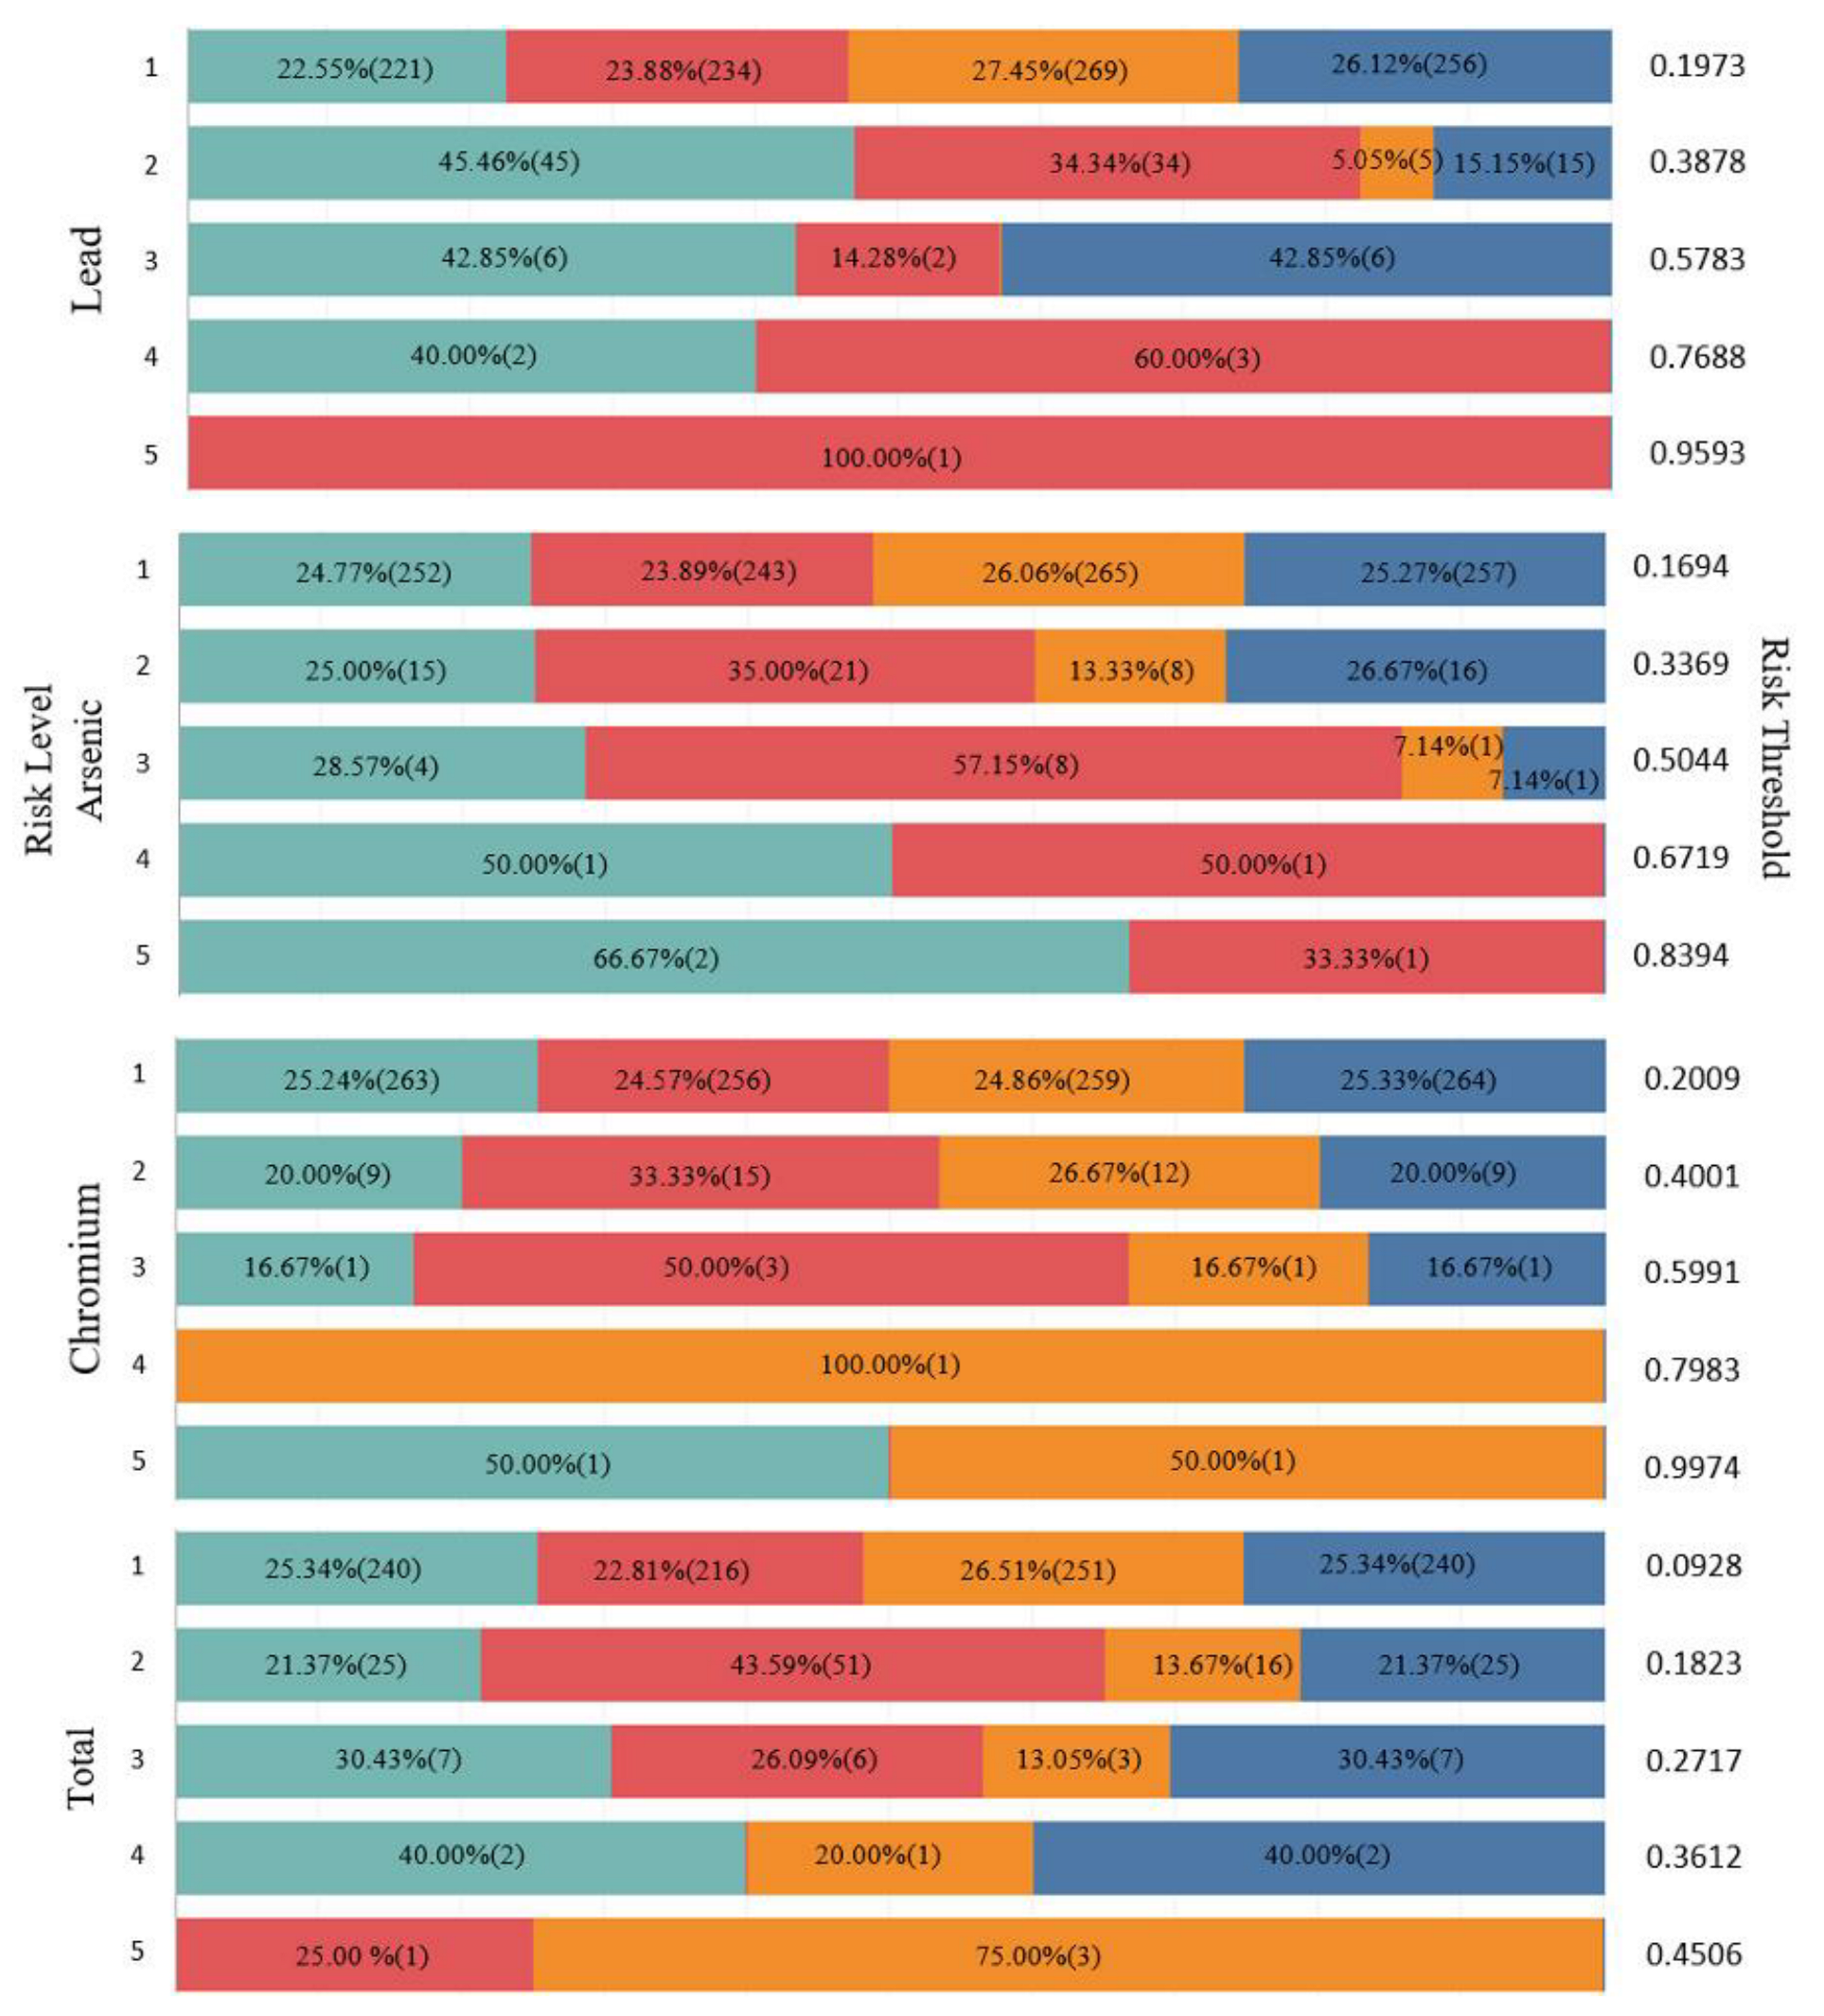
The risks of four single heavy metals (i.e., Cd, Pb, As, and Cr) were determined by fusing three risk assessment indexes via the AHP-EW method. The integrated risk calculation of heavy metal hazards was performed by fusing the aforementioned risk for each of the four heavy metals. Thus, the risk of single and integrated heavy metal hazards in meat products in the four regions, from April 2020 to November 2020, was determined and was then divided into five risk levels (Figure 4) by using the five-equal-parts approach [37]. Using this technique, we could determine and understand the spatial differences, illustrated in Figure 4, in risk levels in single and integrated heavy metals among the four regions.
As shown in Figure 4, for Cd, most samples with risk level 1 were concentrated in the interval, constituting 97.53% of total Cd samples; only nine samples had risk levels 4 and 5 (high-risk level), with six samples being from North II and the remaining ones from North I, which is consistent with the results presented in Figure 3a. With regard to Pb and As in meat products, the samples with high risk levels were concentrated in South I and II, 66% of which were from South I (e.g., Jiangsu, Zhejiang, Shanghai, etc.); 60% of the samples with high-risk As contamination were from South II (e.g., Hunan, Guangdong, Sichuan, etc.). With regard to Cr and the integrated (i.e., total) heavy metal risk level, North II exhibited a higher risk of exposure to Cr and integrated (i.e., total) heavy metal hazards, compared with other regions, comprising 66.7% risk for chromium and 50% integrated heavy metal risk. Similar to the method proposed by Cai et al. [38], the early warning or high-risk thresholds of heavy metal risk in the current study were 0.7615 (Cd), 0.7688 (Pb), 0.6719 (As), 0.7983 (Cr), and 0.3612 (integrated heavy metals).
Overall, the risk assessment and classification results reveal that the northern region had slightly higher assessment indices and risk levels than the southern region. North II was more severe than any other region under study, particularly for Cd, As, and Cr pollution in meat products (Figure 3 and Figure 4). Heavy metals in meat products are mainly derived from environmental conditions, industrial waste, and mining activities [39]. These relatively high risk levels of Cd and As in North II could be attributed to the rapid development prompted by the implementation of the Western development strategy, as discussed by Wang [40]. Provinces such as Shaanxi and Inner Mongolia might have entered the high-speed development mode. Consequently, sewage discharge is exacerbated by population growth, and environmental pollution is aggravated by energy development. Meanwhile, the high risk level of Cr could be ascribed to the high chromium content in feed ingredients [41] in North II, and the Pb pollution arises from the large amounts of waste generated by mining activities in provinces such as Qinghai [42,43]. Therefore, to control the risk of heavy metals in meat products, the relevant authorities need to control mining activities and reduce industrial pollution, particularly in North II.
3.3. Early Warning for Meat Products
After determining the early warning threshold for single and integrated heavy metals, we established an effective food safety risk prediction model by introducing the popular Transformer-based method. This approach allows government departments to promptly control and prevent heavy metal risks in time.
Notably, unlike other models proposed previously, in which the risk of single and integrated heavy metals was used as the expected output of the model and the detection sample data were used as the input of the model to deal with the regression problem, the proposed model addresses the problem using time series prediction. Under this method, the input of the model is the risk of single and integrated heavy metals in a time-span of size T, whereas the output of the model is the prediction of the corresponding value at a future time point T + h.
In food safety risk prediction, the number of single and integrated heavy metal sample datasets was 274. For all datasets, samples from April 2020 to November 2020 were used as the training set for the proposed model, and the remaining samples, in December 2020, were used as the testing data to predict the food safety risk of single and integrated heavy metals. To verify the effectiveness of the proposed Transformer-based model, the results were compared with those obtained by conducting BP, RNN, GRU, and LSTM on the same detection data. Furthermore, for hyperparameter setting, the number of heads in multi-head attention was selected in the range of {8, 16}, and the dimension of the multi-head attention output was set to 256 or 128. The layer of the encoder was chosen from {6, 4, 3, 2}, and the layer of the decoder was set to 2 or 1.
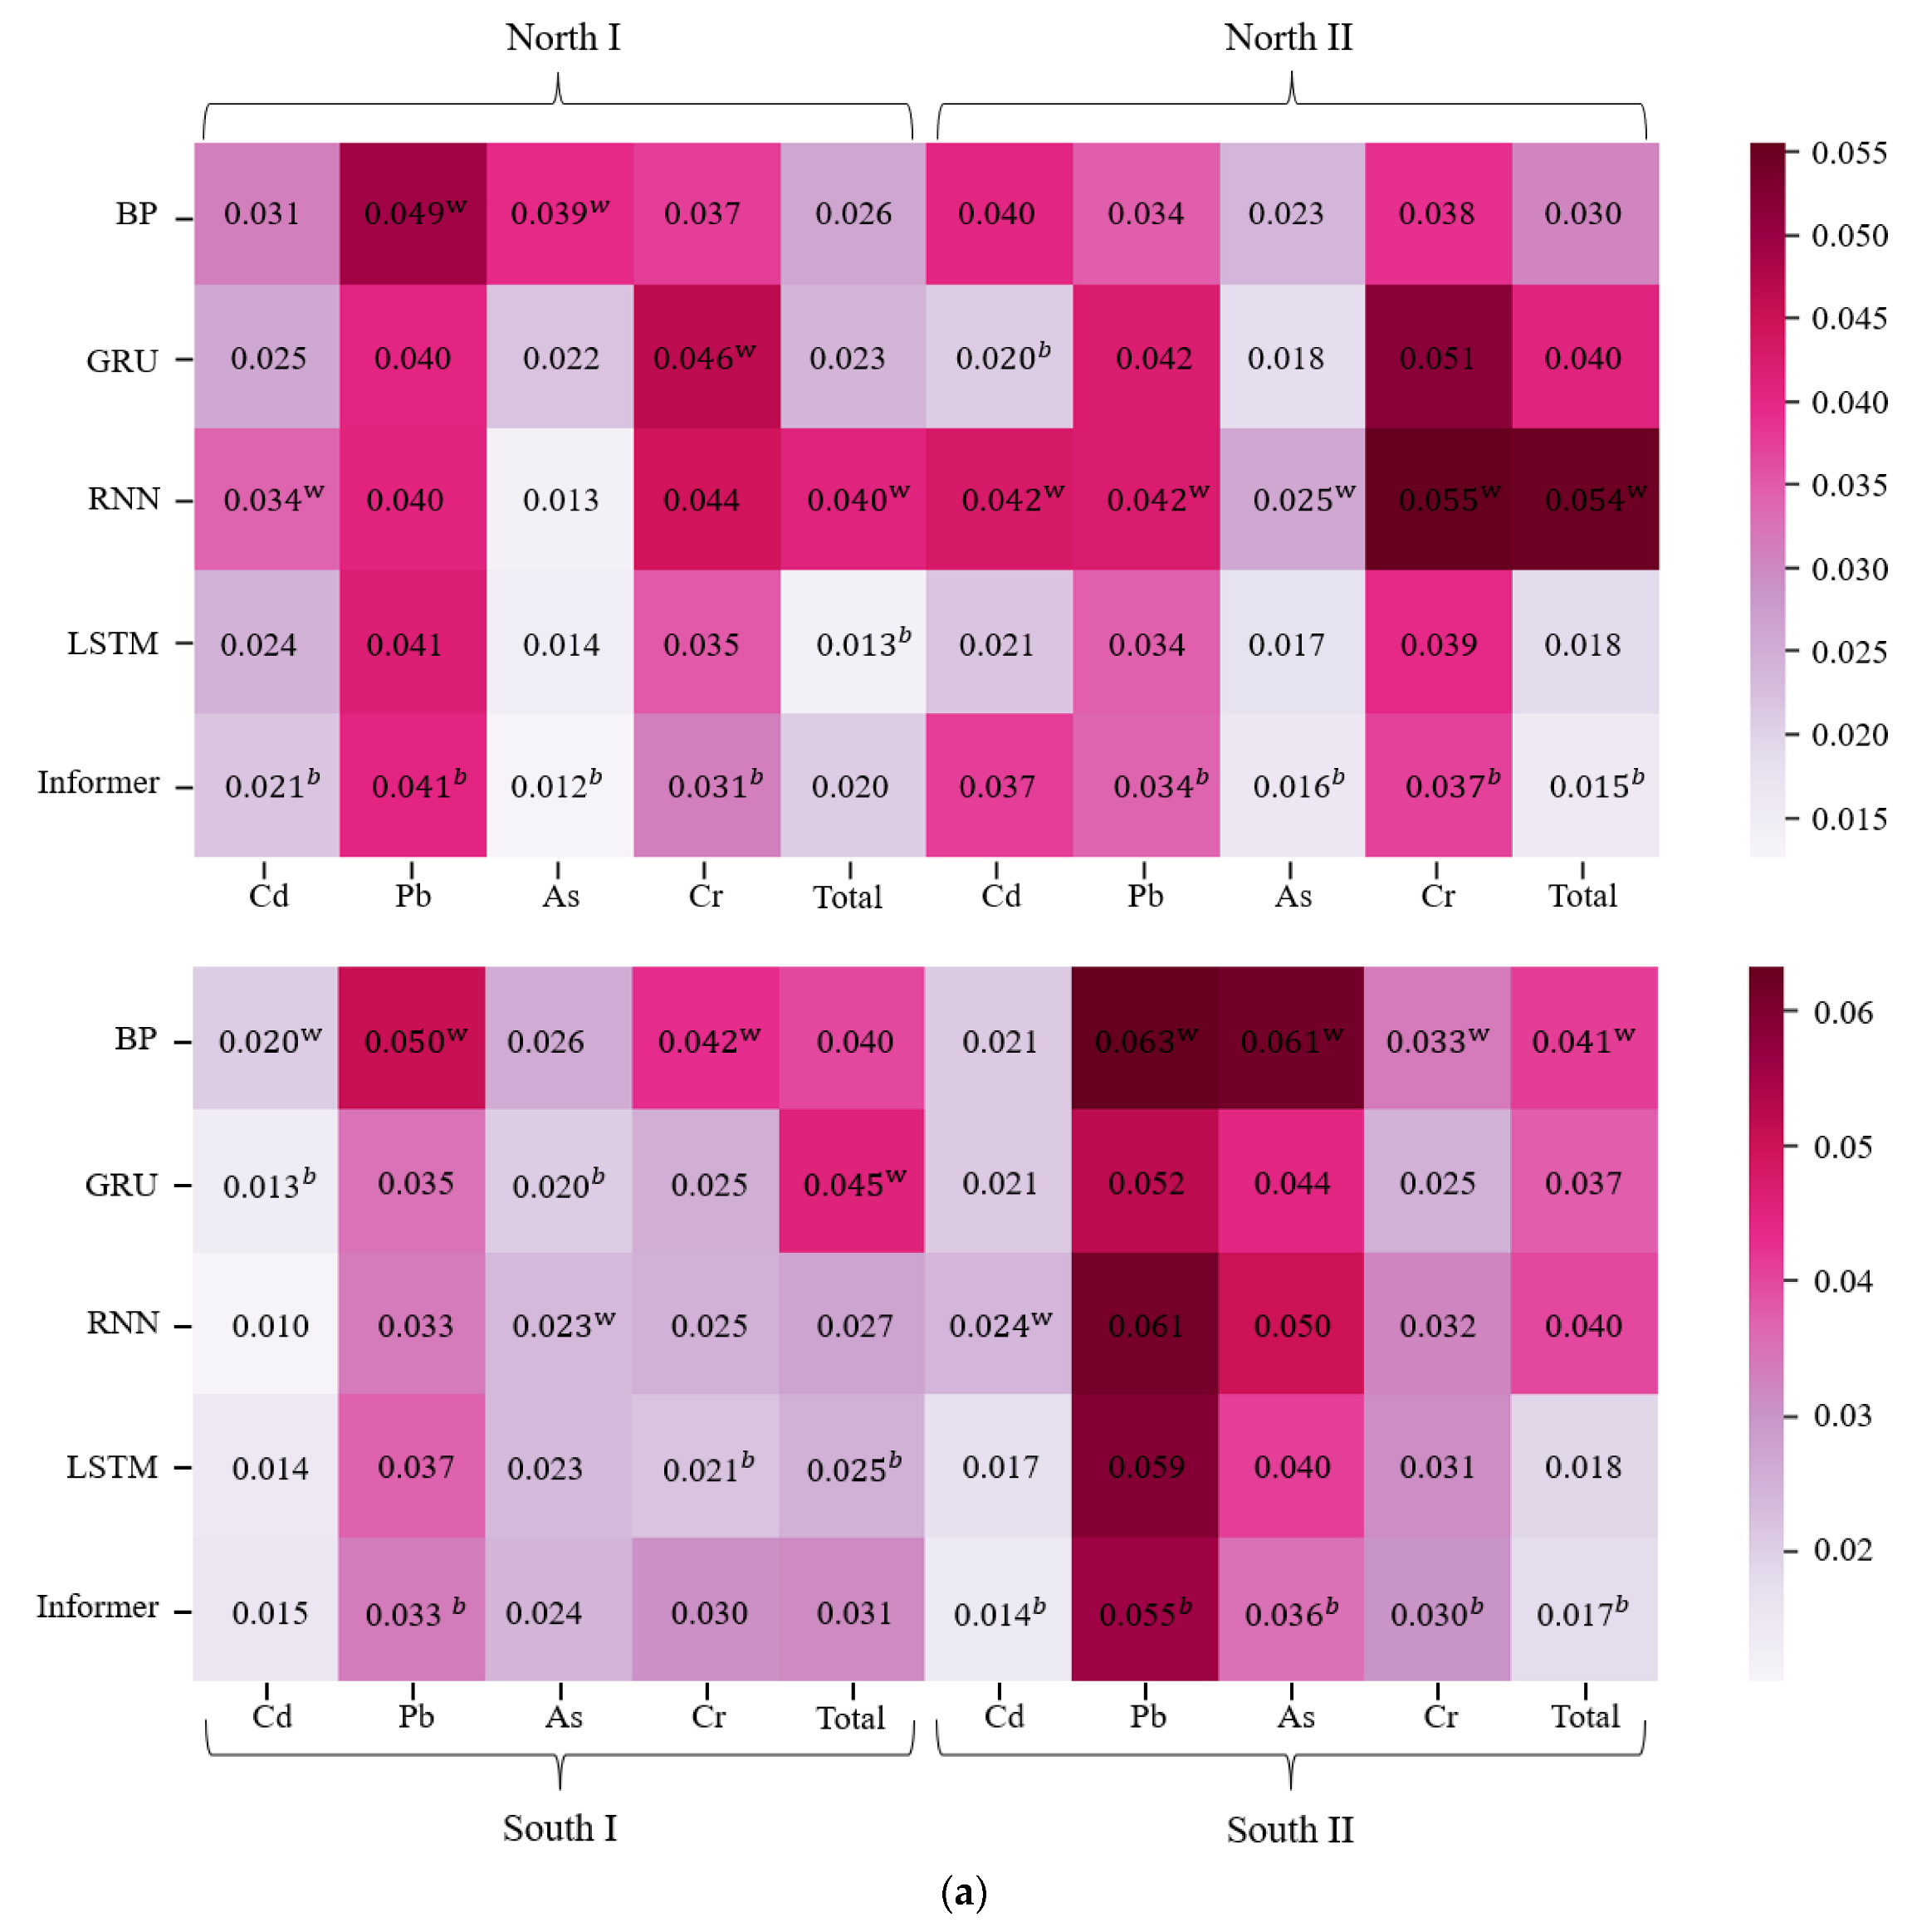
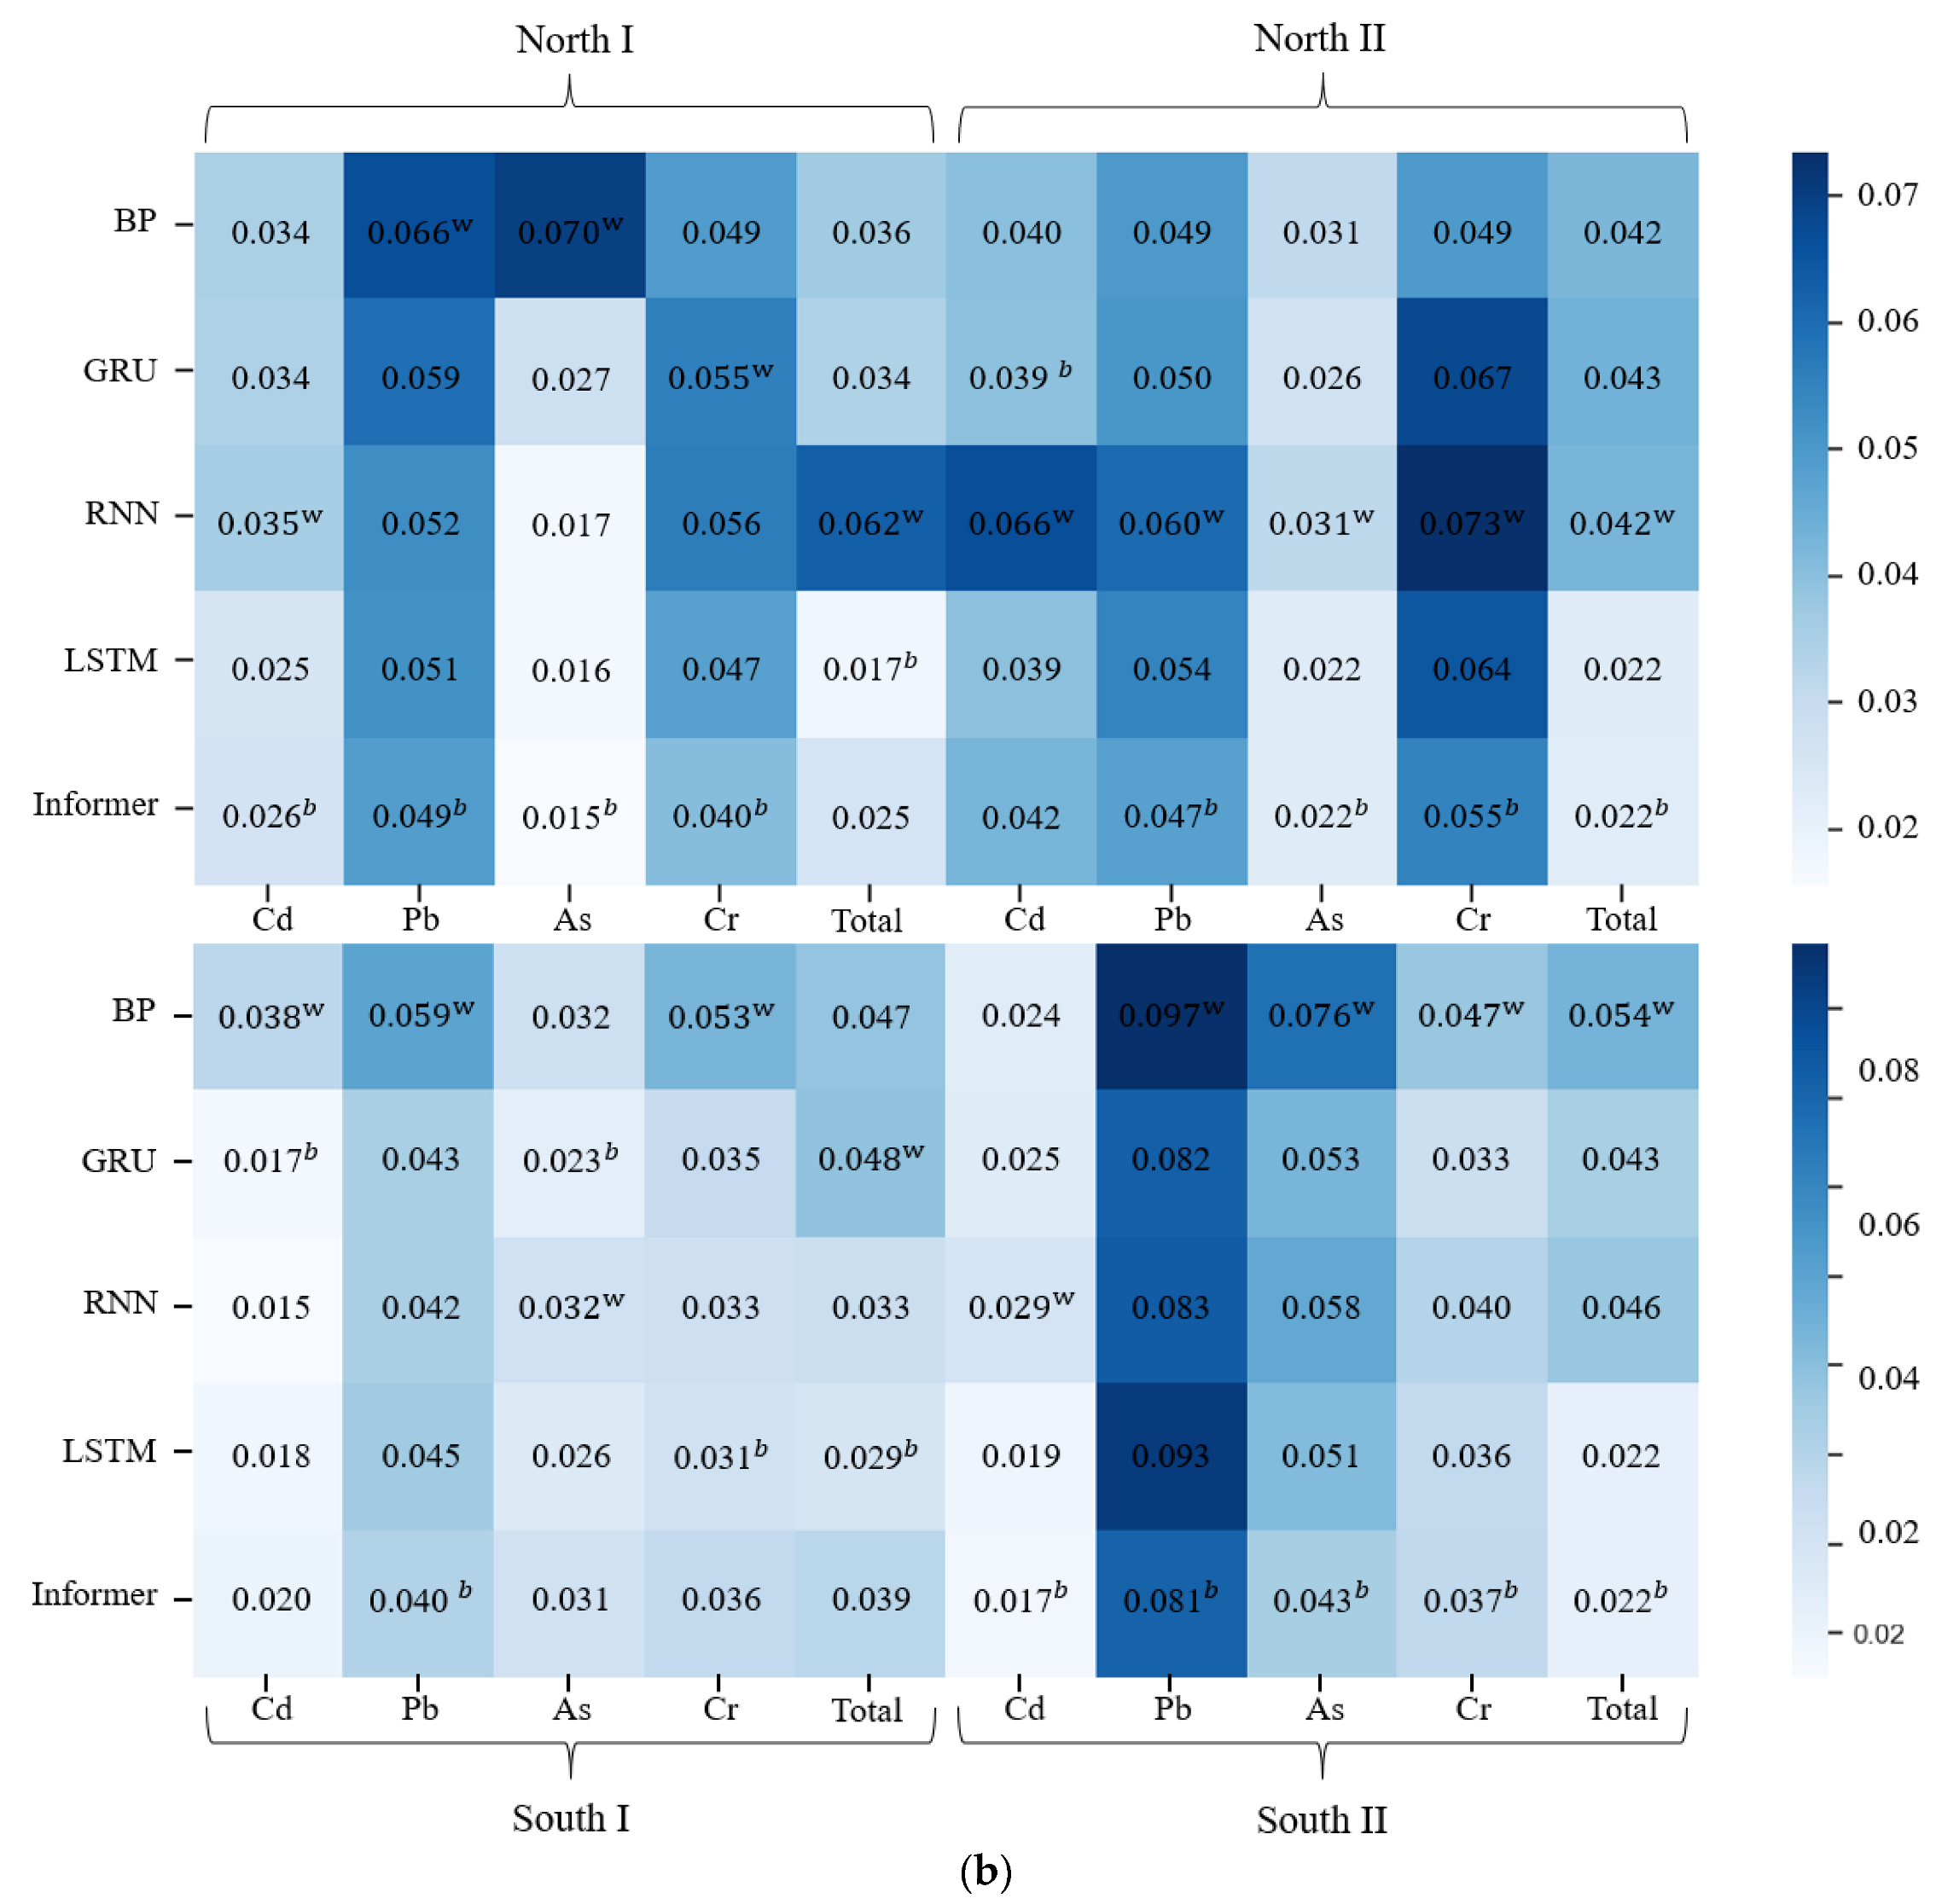
We evaluated our approach to long-term (i.e., h = 30 days) prediction to achieve an early warning for four single and integrated heavy metal hazards, thus satisfying the requirement of relevant departments for monthly reports on food safety. Figure 5 summarizes and compares the prediction results of all methods with respect to root mean square error (RMSE) and mean absolute error (MAE) calculated using Equations (15) and (16), where the predicted and true values are denoted as and , respectively. Thus, the accuracy of the model in single and integrated heavy metal datasets can be assessed.
In the Arsenic hazard dataset of North I, compared with other models, BP exhibited the poorest prediction performance (Figure 5), with a MAE and RMSE of 0.039 and 0.070, respectively; these were the largest among the values obtained using the five neural networks. GRU, RNN, and LSTM with MAE values of 0.022, 0.013, and 0.014 and RMSE values of 0.027, 0.017, and 0.16 performed more efficiently and showed better generalization capabilities as compared with BP. Among the five neural networks, the Informer performed the most efficiently, with the smallest MAE and RMSE values of 0.012 and 0.015, respectively. Similarly, the proposed model—that is, the Informer—was determined as the best model in 14 of 20 datasets. Following the Informer were LSTM and GRU, both of which showed the best performance in three datasets. The BP and RNN models showed the worst results in nine datasets, indicating that the Transformer-based model with attention mechanisms functioned efficiently in long-term food safety risk prediction.
In our experiment, the shallow neural network (i.e., BP) showed the worst performance, compared with the other models, except for the RNN model, which was close to the BP model in performance. The poor performance of the BP model could be attributed to the evident low efficiency and inability to approximate complicated functions when faced with complex tasks characterized by high dimensionality and variance [44]. However, as Geng et al. [10] emphasized and cited, the food safety inspection data exhibited high dimensionality, complexity, discreteness, and nonlinearity. Nonetheless, in previous research, the BP model was verified to be better than the other three machine learning or the shallow neural network models in constructing early warning models for edible vegetable oil in China, and was able to solve regression problems with high dimensionality and complex food safety inspection data. When more complex time series problems using detection data were encountered, the BP model performed less efficiently as compared to other deep learning models (e.g., GRU and LSTM) because of its disadvantages. Meanwhile, an unusual finding was that, as a deep learning model, RNN, which exhibits flexibility in capturing nonlinear relations, should have performed well in computational cost and accuracy, given the capability of the network to not only learn patterns between input and output but also between observations of the sequence [45]. However, the experiment results indicated that the performances of RNN and the BP model were only slightly different. This observation could be ascribed to the inadequacy of the RNN model in addressing the problem of vanishing gradients, which impeded its ability to capture long-term dependencies [46].
By contrast, the LSTM and GRU models could overcome the vanishing gradient problem by improving gradient flow within the network [16,44]. Thus, they yielded superior results to those of the RNN model (Figure 5). Furthermore, the proposed model equipped with widely used Transformer architectures, in addition to overcoming the vanishing gradient, showed its advantages in aggregating temporal features by using dynamically generated weights. Consequently, the network was allowed to directly focus on significant time steps in the past, even if they were located considerably far back (30 days) in the lookback window [47], further achieving improved results in the single and integrated heavy metal risk predictions. Therefore, an effective heavy metal hazard risk prediction model could be established and could provide guidance for relevant departments to identify food safety risks in meat products via novel time series prediction and satisfactory performance. The efficiency of food safety risk management in Chinese meat products has thus been enhanced [48,49].
From the standpoint of food safety, the early warning analysis model of meat product safety, based on the AHP-EW and Transformer-based model, can accurately predict the heavy metal risk value in meat products. The risk and the risk grade of the meat products are obtained by combining the weight with the calculated risk assessment indices of detection data, and then the Transformer architecture is introduced to perform multi-step time series prediction. The stability and efficacy of the proposed model can be ensured by comparing different algorithms in several datasets. The establishment of a food safety early warning system based on a multi-step prediction paradigm can identify the heavy metal hazards of meat products at an early stage, thereby dealing with these hazards in time before they develop into real risks and opening the door for decision making and risk management ahead of time [50,51].
4. Conclusions
In this study, the concentrations and the risk assessment indices of four heavy metals were analyzed to investigate the spatial distribution of heavy metal hazards in Chinese meat products. Combined with the results of the risk classification model using the AHP-EW method, on the basis of the regional division of the 5th Chinese TDS, we found that the northern region has a slightly higher risk level than the southern region, and North II (i.e., Inner Mongolia, Shaanxi, etc.) has a more severe situation, particularly for cadmium, arsenic, and chromium, which suggest carcinogenic and noncarcinogenic risks to human health. Therefore, the monitoring of meat products, particularly in the North II region, needs to be strengthened and more resources need to be allocated to control environmental pollution. With regard to the early warning model, a widely used Transformer-based model was introduced to solve high-dimensional and high-complexity time series prediction problems. To verify the effect of our method, four baseline models were compared under the 20 datasets, including the risks of single and integrated heavy metal contamination, using the AHP-EW method. The proposed model was found to outperform the other models in 14 datasets. This result indicates that the proposed model could better realize the early warning of heavy metal hazards in meat products. This empowers relevant authorities to strengthen their regulatory oversight of meat products based on the procedures and models proposed in this study, ultimately enhancing the efficiency of food safety risk management.
As people’s quality of life continues to improve, their demands for food safety and quality are on the rise. Therefore, integrating public sentiment analysis into future food safety risk assessment and warning systems is imperative. This integration is poised to have profound implications for food safety management. Real-time Monitoring and Swift Response: The ubiquity of social media and the Internet has accelerated the pace of information dissemination. Food safety authorities can expedite the detection of food safety issues and take prompt actions through public sentiment analysis. Public Engagement: Public sentiment analysis can encourage public participation in food safety regulation, offering more feedback and information. This contributes to establishing a more transparent food supply chain, thereby enhancing public trust. Big Data and Artificial Intelligence: Leveraging emerging big data and artificial intelligence technologies enables a more precise public sentiment analysis, extraction of valuable insights from vast datasets, identification of food safety trends, and the formulation of more effective policies and measures.
Author Contributions
Conceptualization, T.J.; methodology, W.D.; software, Y.G. and Z.W.; validation, X.X.; formal analysis, Y.G. and Z.W.; investigation, Y.G. and Z.W.; resources, T.J.; data curation, Y.G. and Z.W.; writing—original draft preparation, Y.G. and Z.W.; writing—review and editing, Y.G. and Z.W.; visualization, Y.G. and Z.W.; supervision, Y.G. and Z.W.; project administration, Y.G. and W.D.; funding acquisition, Y.G. and W.D. All authors have read and agreed to the published version of the manuscript.
Funding
This research was funded by the National Key R&D Program of China (No. 2021YFD2100605), Project of Beijing Municipal University Teacher Team Construction Support Plan under (Grant BPHR20220104), the Humanity and Social Science Youth Foundation of Ministry of Education of China (No. 20YJCZH229), and the R&D Program of Beijing Municipal Commission of Education (No. KM202010011011).
Institutional Review Board Statement
This study does not involve any human or animal testing. This study was preventative and conducted in accordance with Helsinki’s Declaration.
Informed Consent Statement
Not applicable.
Data Availability Statement
The data are unavailable due to privacy or ethical restrictions.
Conflicts of Interest
The authors declare no conflict of interest.
References
- Bilandžić, N.; Sedak, M.; Čalopek, B.; Đokić, M.; Varenina, I.; Kolanović, B.S.; Hruškar, M. Dietary exposure of the adult Croatian population to meat, liver and meat products from the Croatian market: Health risk assessment. J. Food Compos. Anal. 2021, 95, 103672. [Google Scholar] [CrossRef]
- Zeinali, T.; Salmani, F.; Naseri, K. Dietary intake of cadmium, chromium, copper, nickel, and lead through the consumption of meat, liver, and kidney and assessment of human health risk in Birjand, Southeast of Iran. Biol. Trace Elem. Res. 2019, 191, 338–347. [Google Scholar] [CrossRef] [PubMed]
- Wang, X.; Zhang, Y.; Geng, Z.; Liu, Y.; Guo, L.; Xiao, G. Spatial analysis of heavy metals in meat products in China during 2015–2017. Food Control. 2019, 104, 174–180. [Google Scholar] [CrossRef]
- Chen, S.S.; Lin, Y.W.; Kao, Y.M.; Shih, Y.C. Trace elements and heavy metals in poultry and livestock meat in Taiwan. Food Addit. Contam. Part B 2013, 6, 231–236. [Google Scholar] [CrossRef] [PubMed]
- Bortey-Sam, N.; Nakayama, S.M.; Ikenaka, Y.; Akoto, O.; Baidoo, E.; Yohannes, Y.B.; Ishizuka, M. Human health risks from metals and metalloid via consumption of food animals near gold mines in Tarkwa, Ghana: Estimation of the daily intakes and target hazard quotients (THQs). Ecotoxicol. Environ. Saf. 2015, 111, 160–167. [Google Scholar] [CrossRef]
- Larsen, E.H.; Andersen, N.L.; Møller, A.; Petersen, A.; Mortensen, G.K.; Petersen, J. Monitoring the content and intake of trace elements from food in Denmark. Food Addit. Contam. 2002, 19, 33–46. [Google Scholar] [CrossRef]
- Avegliano, R.P.; Maihara, V.A.; da Silva, F.F. A Brazilian total diet study: Evaluation of essential elements. J. Food Compos. Anal. 2001, 24, 1009–1016. [Google Scholar] [CrossRef]
- Wu, Y.; Zhao, Y.; Li, J. The Fifth China Total Diet Study; Science Press: Beijing, China, 2018; pp. 1–649. (In Chinese) [Google Scholar]
- Liang, G.; Gong, W.; Li, B.; Zuo, J.; Pan, L.; Liu, X. Analysis of heavy metals in foodstuffs and an assessment of the health risks to the general public via consumption in Beijing, China. Int. J. Environ. Res. Public Health 2019, 16, 909. [Google Scholar] [CrossRef]
- Geng, Z.; Zhao, S.; Tao, G.; Han, Y. Early warning modeling and analysis based on analytic hierarchy process integrated extreme learning machine (AHP-ELM): Application to food safety. Food Control 2017, 78, 33–42. [Google Scholar] [CrossRef]
- Niu, B.; Zhang, H.; Zhou, G.; Zhang, S.; Yang, Y.; Deng, X.; Chen, Q. Safety risk assessment and early warning of chemical contamination in vegetable oil. Food Control 2021, 125, 107970. [Google Scholar] [CrossRef]
- Liu, S.; Yu, H.; Liao, C.; Li, J.; Lin, W.; Liu, A.X.; Dustdar, S. Pyraformer: Low-Complexity Pyramidal Attention for Long-Range Time Series Modeling and Forecasting. In Proceedings of the International Conference on Learning Representations, Vienna, Austria, 4 May 2021. [Google Scholar]
- Liu, Z.; Meng, L.; Zhao, W.; Yu, F. Application of ANN in food safety early warning. In Proceedings of the 2010 2nd International Conference on Future Computer and Communication, Wuhan, China, 21–24 May 2010; IEEE: New York, NY, USA, 2010; Volume 3, pp. V3-667–V3-680. [Google Scholar]
- Geng, Z.; Shang, D.; Han, Y.; Zhong, Y. Early warning modeling and analysis based on a deep radial basis function neural network integrating an analytic hierarchy process: A case study for food safety. Food Control 2019, 96, 329–342. [Google Scholar] [CrossRef]
- Geng, Z.; Liu, F.; Shang, D.; Han, Y.; Shang, Y.; Chu, C. Early warning and control of food safety risk using an improved AHC-RBF neural network integrating AHP-EW. J. Food Eng. 2021, 292, 110239. [Google Scholar] [CrossRef]
- Li, L.; Jiang, Y.; Huang, B. Long-term prediction for temporal propagation of seasonal influenza using Transformer-based model. J. Biomed. Inform. 2021, 122, 103894. [Google Scholar] [CrossRef] [PubMed]
- Alassafi, M.O.; Jarrah, M.; Alotaibi, R. Time series predicting of COVID-19 based on deep learning. Neurocomputing 2022, 468, 335–344. [Google Scholar] [CrossRef]
- Li, Y.; Zhu, Z.; Kong, D.; Han, H.; Zhao, Y. EA-LSTM: Evolutionary attention-based LSTM for time series prediction. Knowl. Based Syst. 2019, 181, 104785. [Google Scholar] [CrossRef]
- Struye, J.; Latré, S. Hierarchical temporal memory and recurrent neural networks for time series prediction: An empirical validation and reduction to multilayer perceptrons. Neurocomputing 2020, 396, 291–301. [Google Scholar] [CrossRef]
- Cho, K.; Van Merriënboer, B.; Bahdanau, D.; Bengio, Y. On the properties of neural machine translation: Encoder-decoder approaches. arXiv 2014, arXiv:1409.1259. [Google Scholar]
- Du, S.; Li, T.; Yang, Y.; Horng, S.J. Multivariate time series forecasting via attention-based encoder–decoder framework. Neurocomputing 2020, 388, 269–279. [Google Scholar] [CrossRef]
- Vaswani, A.; Shazeer, N.; Parmar, N.; Uszkoreit, J.; Jones, L.; Gomez, A.N.; Polosukhin, I. Attention is all you need. In Advances in Neural Information Processing Systems; The MIT Press: Cambridge, MA, USA, 2017; Volume 30. [Google Scholar]
- Zhou, H.; Zhang, S.; Peng, J.; Zhang, S.; Li, J.; Xiong, H.; Zhang, W. Informer: Beyond efficient transformer for long sequence time-series forecasting. In Proceedings of the AAAI Conference on Artificial Intelligence; AAAI Press: Washington, DC, USA, 2021. [Google Scholar]
- GB 2762-2017; National Food Safety Standard—Maximum Levels of Contaminants in Foods. National Food Safety Standards: Beijing, China, 2018.
- Jiang, T.-Q.; Wang, Z.; Zhang, Q.-C.; Wang, Z.-Z.; Cheng, B.-L. Establishment and application of risk classification model for lead in vegetables based on spectral clustering algorithms. Food Sci. Nutr. 2022, 10, 879–887. [Google Scholar] [CrossRef]
- Loska, K.; Wiechula, D.; Korus, I. Metal contamination of farming soils affected by industry. Environ. Int. 2004, 30, 159–165. [Google Scholar] [CrossRef]
- Ma, L.; Yang, Z.; Li, L.; Wang, L. Source identification and risk assessment of heavy metal contaminations in urban soils of Changsha, a mine-impacted city in Southern China. Environ. Sci. Pollut. Res. 2016, 23, 17058–17066. [Google Scholar] [CrossRef] [PubMed]
- Wei, J.; Gao, J.; Cen, K. Levels of eight heavy metals and health risk assessment considering food consumption by China’s residents based on the 5th China total diet study. Sci. Total Environ. 2019, 689, 1141–1148. [Google Scholar] [CrossRef] [PubMed]
- Wei, J.; Geng, Y.; Cen, K. The heavy metal content monitoring and dietary risk assessment of commercial Rice in Beijing. Modern. Food Sci. Technol. 2018, 34, 267–273. [Google Scholar]
- Yari, A.A.; Varvani, J.; Zare, R. Assessment and zoning of environmental hazard of heavy metals using the Nemerow integrated pollution index in the vineyards of Malayer city. Acta Geophys. 2021, 69, 149–159. [Google Scholar] [CrossRef]
- Yang, Q.; Li, Z.; Lu, X.; Duan, Q.; Huang, L.; Bi, J. A review of soil heavy metal pollution from industrial and agricultural regions in China: Pollution and risk assessment. Sci. Total Environ. 2018, 642, 690–700. [Google Scholar] [CrossRef] [PubMed]
- Zhang, Y.; Chu, C.; Li, T.; Xu, S.; Liu, L.; Ju, M. A water quality management strategy for regionally protected water through health risk assessment and spatial distribution of heavy metal pollution in 3 marine reserves. Sci. Total Environ. 2017, 599, 721–731. [Google Scholar] [CrossRef]
- Shaheen, N.; Irfan, N.M.; Khan, I.N.; Islam, S.; Islam, M.S.; Ahmed, M.K. Presence of heavy metals in fruits and vegetables: Health risk implications in Bangladesh. Chemosphere 2016, 152, 431–438. [Google Scholar] [CrossRef] [PubMed]
- Chang, Y.Y.; Sun, F.Y.; Wu, Y.H.; Lin, S.D. A memory-network based solution for multivariate time-series forecasting. arXiv 2016, arXiv:1809.02105. [Google Scholar]
- Devlin, J.; Chang, M.W.; Lee, K.; Toutanova, K. Bert: Pre-training of deep bidirectional transformers for language understanding. arXiv 2018, arXiv:1810.04805. [Google Scholar]
- Clevert, D.A.; Unterthiner, T.; Hochreiter, S. Fast and accurate deep network learning by exponential linear units (elus). arXiv 2015, arXiv:1511.07289. [Google Scholar]
- Li, Q.; Liu, W.; Sun, A.; Duan, M.; Liu, P.; Dai, Y. Study on the risk grading evaluation of processed food. Food Ferment. Ind. 2015, 41, 220–224. [Google Scholar]
- Cai, Q.; Wang, J.J.; Li, H.S.; Mao, D.H. Research on establishment of food safety evaluation modle based on neural network. J. Food Sci. Technol. 2014, 4, 69–77. [Google Scholar]
- Abduljaleel, S.A.; Shuhaimi-Othman, M.; Babji, A. Assessment of trace metals contents in chicken (Gallus gallus domesticus) and quail (Coturnix coturnix japonica) tissues from Selangor (Malaysia). J. Environ. Sci. Technol. 2012, 5, 441–451. [Google Scholar] [CrossRef]
- Wang, Z. Study on heavy metal pollution caused by wastewater discharge in Shaanxi province. Technol. Innov. Appl. 2018, 25, 75–76. [Google Scholar]
- Pillay, A.E.; Williams, J.R.; El Mardi, M.O.; Al-Lawati, S.M.H.; Al-Hadabbi, M.H.; Al-Hamdi, A. Risk assessment of chromium and arsenic in date palm leaves used as livestock feed. Environ. Int. 2003, 29, 541–545. [Google Scholar] [CrossRef]
- Li, Y.; Li, Z.; Cozzi, G.; Turetta, C.; Barbante, C.; Huang, J.; Xiong, L. Signals of pollution revealed by trace elements in recent snow from mountain glaciers at the Qinghai–Tibetan plateau. Chemosphere 2018, 200, 523–531. [Google Scholar] [CrossRef]
- Gao, Y.; Xia, J. Chromium contamination accident in China: Viewing environment policy of China. Environ. Sci. Technol. 2011, 45, 8605–8606. [Google Scholar] [CrossRef]
- Han, Z.; Zhao, J.; Leung, H.; Ma, K.F.; Wang, W. A review of deep learning models for time series prediction. IEEE Sens. J. 2019, 21, 7833–7848. [Google Scholar] [CrossRef]
- Lara-Benítez, P.; Carranza-García, M.; Riquelme, J.C. An experimental review on deep learning architectures for time series forecasting. Int. J. Neural Syst. 2021, 31, 2130001. [Google Scholar] [CrossRef]
- Bengio, Y.; Simard, P.; Frasconi, P. Learning long-term dependencies with gradient descent is difficult. IEEE Trans. Neural Netw. 1994, 5, 157–166. [Google Scholar] [CrossRef]
- Lim, B.; Arik, S.O.; Loeff, N.; Pfister, T. Temporal fusion transformers for interpretable multi-horizon time series forecasting. arXiv 2019, arXiv:1912.09363. [Google Scholar] [CrossRef]
- Yuan, X.; Zhang, D.; Zhu, X.; Liu, H.; Sun, B. Triple-dimensional spectroscopy combined with chemometrics for the discrimination of pesticide residues based on ionic liquid-stabilized Mn-ZnS quantum dots and covalent organic frameworks. Food Chem. 2021, 342, 128299. [Google Scholar] [CrossRef]
- Yuan, X.; Zhu, X.; Sun, R.; Jiang, W.; Zhang, D.; Liu, H.; Sun, B. Sensory attributes and characterization of aroma profiles of fermented sausages based on fibrous-like meat substitute from soybean protein and Coprinus comatus. Food Chem. 2022, 373, 131537. [Google Scholar] [CrossRef] [PubMed]
- Saeed, R.; Feng, H.; Wang, X.; Zhang, X.; Fu, Z. Fish quality evaluation by sensor and machine learning: A mechanistic review. Food Control 2022, 137, 108902. [Google Scholar] [CrossRef]
- Asgari, L.B.; Najafi, N.; Moghiseh, E.; Mosaferi, M.; Hadian, J. Micronutrient and heavy metal concentrations in basil plant cultivated on irradiated and non-irradiated sewage sludge-treated soil and evaluation of human health risk. Reg. Toxicol. Pharmacol. 2019, 104, 141–150. [Google Scholar] [CrossRef] [PubMed]
Figure 1.
Schematic of multi-step prediction task.

Figure 2.
Overall framework of risk classification assessment and early warning model of heavy metals in meat products via a Transformer-based model.
Figure 2.
Overall framework of risk classification assessment and early warning model of heavy metals in meat products via a Transformer-based model.

Figure 3.
Spatial risk index distribution of heavy metals (cadmium, lead, arsenic, and chromium) in meat products in four regions in 2020. (a) Spatial risk index distribution of cadmium; (b) Spatial risk index distribution of lead; (c) Spatial risk index distribution of arsenic; (d) Spatial risk index distribution of chromium.

Figure 4.
Risk classification and threshold of single and integrated heavy metals (cadmium, lead, arsenic, and chromium) in meat products in China in 2020.
Figure 4.
Risk classification and threshold of single and integrated heavy metals (cadmium, lead, arsenic, and chromium) in meat products in China in 2020.


Figure 5.
Predicted results of different models in single and integrated heavy metal datasets. b Best results in the dataset; w Worst results in the dataset. (a) Mean absolute error results; (b) Root mean square error results.
Figure 5.
Predicted results of different models in single and integrated heavy metal datasets. b Best results in the dataset; w Worst results in the dataset. (a) Mean absolute error results; (b) Root mean square error results.


Table 1.
Reference doses (RfD), cancer slope factor (CSF), and the national limit standard in meat products.
Table 1.
Reference doses (RfD), cancer slope factor (CSF), and the national limit standard in meat products.
| Heavy Metals | Reference Doses mg/(kg·d) | Cancer Slope Factor (kg·d)/mg | National Limit Standard (mg/kg) |
|---|---|---|---|
| Lead | 0.0037 | 0.0085 | 0.2 |
| Cadmium | 0.001 | 6.3 | 0.1 |
| Chromium | 0.003 | 0.5 | 1.0 |
| Arsenic | 0.0003 | 1.5 | 0.5 |
Note: National limit standard source from [24].
Table 2.
Heavy metals in Chinese meat products: mean (mean ± SD) and ranges of concentrations (mg/kg) and risk assessment indices in four regions in 2020.
Table 2.
Heavy metals in Chinese meat products: mean (mean ± SD) and ranges of concentrations (mg/kg) and risk assessment indices in four regions in 2020.
| Region | Heavy Metal | Mean | Range * | NIPI | TCR | THQ |
|---|---|---|---|---|---|---|
| North I | Cd | 0.0060 ± 0.0200 | −0.320 | 2.2631 | 0.00064 | 0.4333 |
| Pb | 0.0176 ± 0.0445 | −0.407 | 1.4403 | 2.5 × 10⁻⁶ | 0.3613 | |
| As | 0.0089 ± 0.0236 | −0.310 | 0.4386 | 0.00023 | 2.2222 | |
| Cr | 0.0646 ± 0.1190 | −1.650 | 1.1676 | 0.00054 | 1.5000 | |
| North II | Cd | 0.0055 ± 0.0273 | −0.460 | 3.2529 | 0.00058 | 0.2833 |
| Pb | 0.0135 ± 0.0250 | −0.195 | 0.6911 | 1.9 × 10⁻⁶ | 0.2845 | |
| As | 0.0137 ± 0.0284 | −0.410 | 0.5802 | 0.00035 | 2.9500 | |
| Cr | 0.0744 ± 0.1192 | −1.720 | 1.2174 | 0.00062 | 1.3889 | |
| South I | Cd | 0.0042 ± 0.0097 | −0.190 | 1.3438 | 0.00045 | 0.3000 |
| Pb | 0.0273 ± 0.0525 | −0.754 | 2.6675 | 3.9 × 10⁻⁶ | 0.4923 | |
| As | 0.0085 ± 0.0274 | −0.900 | 1.2729 | 0.00026 | 2.2889 | |
| Cr | 0.0575 ± 0.0988 | −1.180 | 0.8354 | 0.00048 | 1.1111 | |
| South II | Cd | 0.0041 ± 0.0100 | −0.280 | 1.9801 | 0.00043 | 0.3000 |
| Pb | 0.0189 ± 0.0434 | −0.566 | 2.0022 | 2.7 × 10⁻⁶ | 0.4324 | |
| As | 0.0085 ± 0.0246 | −0.460 | 0.6507 | 0.00022 | 1.7778 | |
| Cr | 0.0714 ± 0.1190 | −2.140 | 1.5141 | 0.00060 | 1.3333 | |
| Total | Cd | 0.0048 ± 0.0165 | −0.460 | 3.2529 | 0.000053 | 0.3333 |
| Pb | 0.0199 ± 0.0441 | −0.754 | 2.6667 | 7.08 × 10⁻⁷ | 0.4220 | |
| As | 0.0098 ± 0.0258 | −0.900 | 1.2729 | 0.000038 | 2.2222 | |
| Cr | 0.0669 ± 0.1144 | −2.140 | 1.5139 | 0.000292 | 1.3333 |
* Lower than the reported limit of detection (LOD).
Disclaimer/Publisher’s Note: The statements, opinions and data contained in all publications are solely those of the individual author(s) and contributor(s) and not of MDPI and/or the editor(s). MDPI and/or the editor(s) disclaim responsibility for any injury to people or property resulting from any ideas, methods, instructions or products referred to in the content. |
© 2023 by the authors. Licensee MDPI, Basel, Switzerland. This article is an open access article distributed under the terms and conditions of the Creative Commons Attribution (CC BY) license (https://creativecommons.org/licenses/by/4.0/).
Share and Cite
MDPI and ACS Style
Wang, Z.; Gao, Y.; Xu, X.; Dong, W.; Jiang, T. Risk Classification Assessment and Early Warning of Heavy Metal Contamination in Meat Products. Sustainability 2023, 15, 15558. https://doi.org/10.3390/su152115558
AMA Style
Wang Z, Gao Y, Xu X, Dong W, Jiang T. Risk Classification Assessment and Early Warning of Heavy Metal Contamination in Meat Products. Sustainability. 2023; 15(21):15558. https://doi.org/10.3390/su152115558
Chicago/Turabian StyleWang, Zheng, Yanping Gao, Xuemei Xu, Wei Dong, and Tongqiang Jiang. 2023. "Risk Classification Assessment and Early Warning of Heavy Metal Contamination in Meat Products" Sustainability 15, no. 21: 15558. https://doi.org/10.3390/su152115558
Note that from the first issue of 2016, this journal uses article numbers instead of page numbers. See further details here.