
Contribution of the Sediment Flow Connectivity Index (SfCI) in Landscape Archaeology Investigations: Test Case of a New Interdisciplinary Approach

 ,
,  , , , and
Abstract
:1. Introduction
2. Study Area
3. Materials and Methods
3.1. Geomorphological Analysis
3.1.1. SfCI Computation
3.1.2. SfCI Data Processing
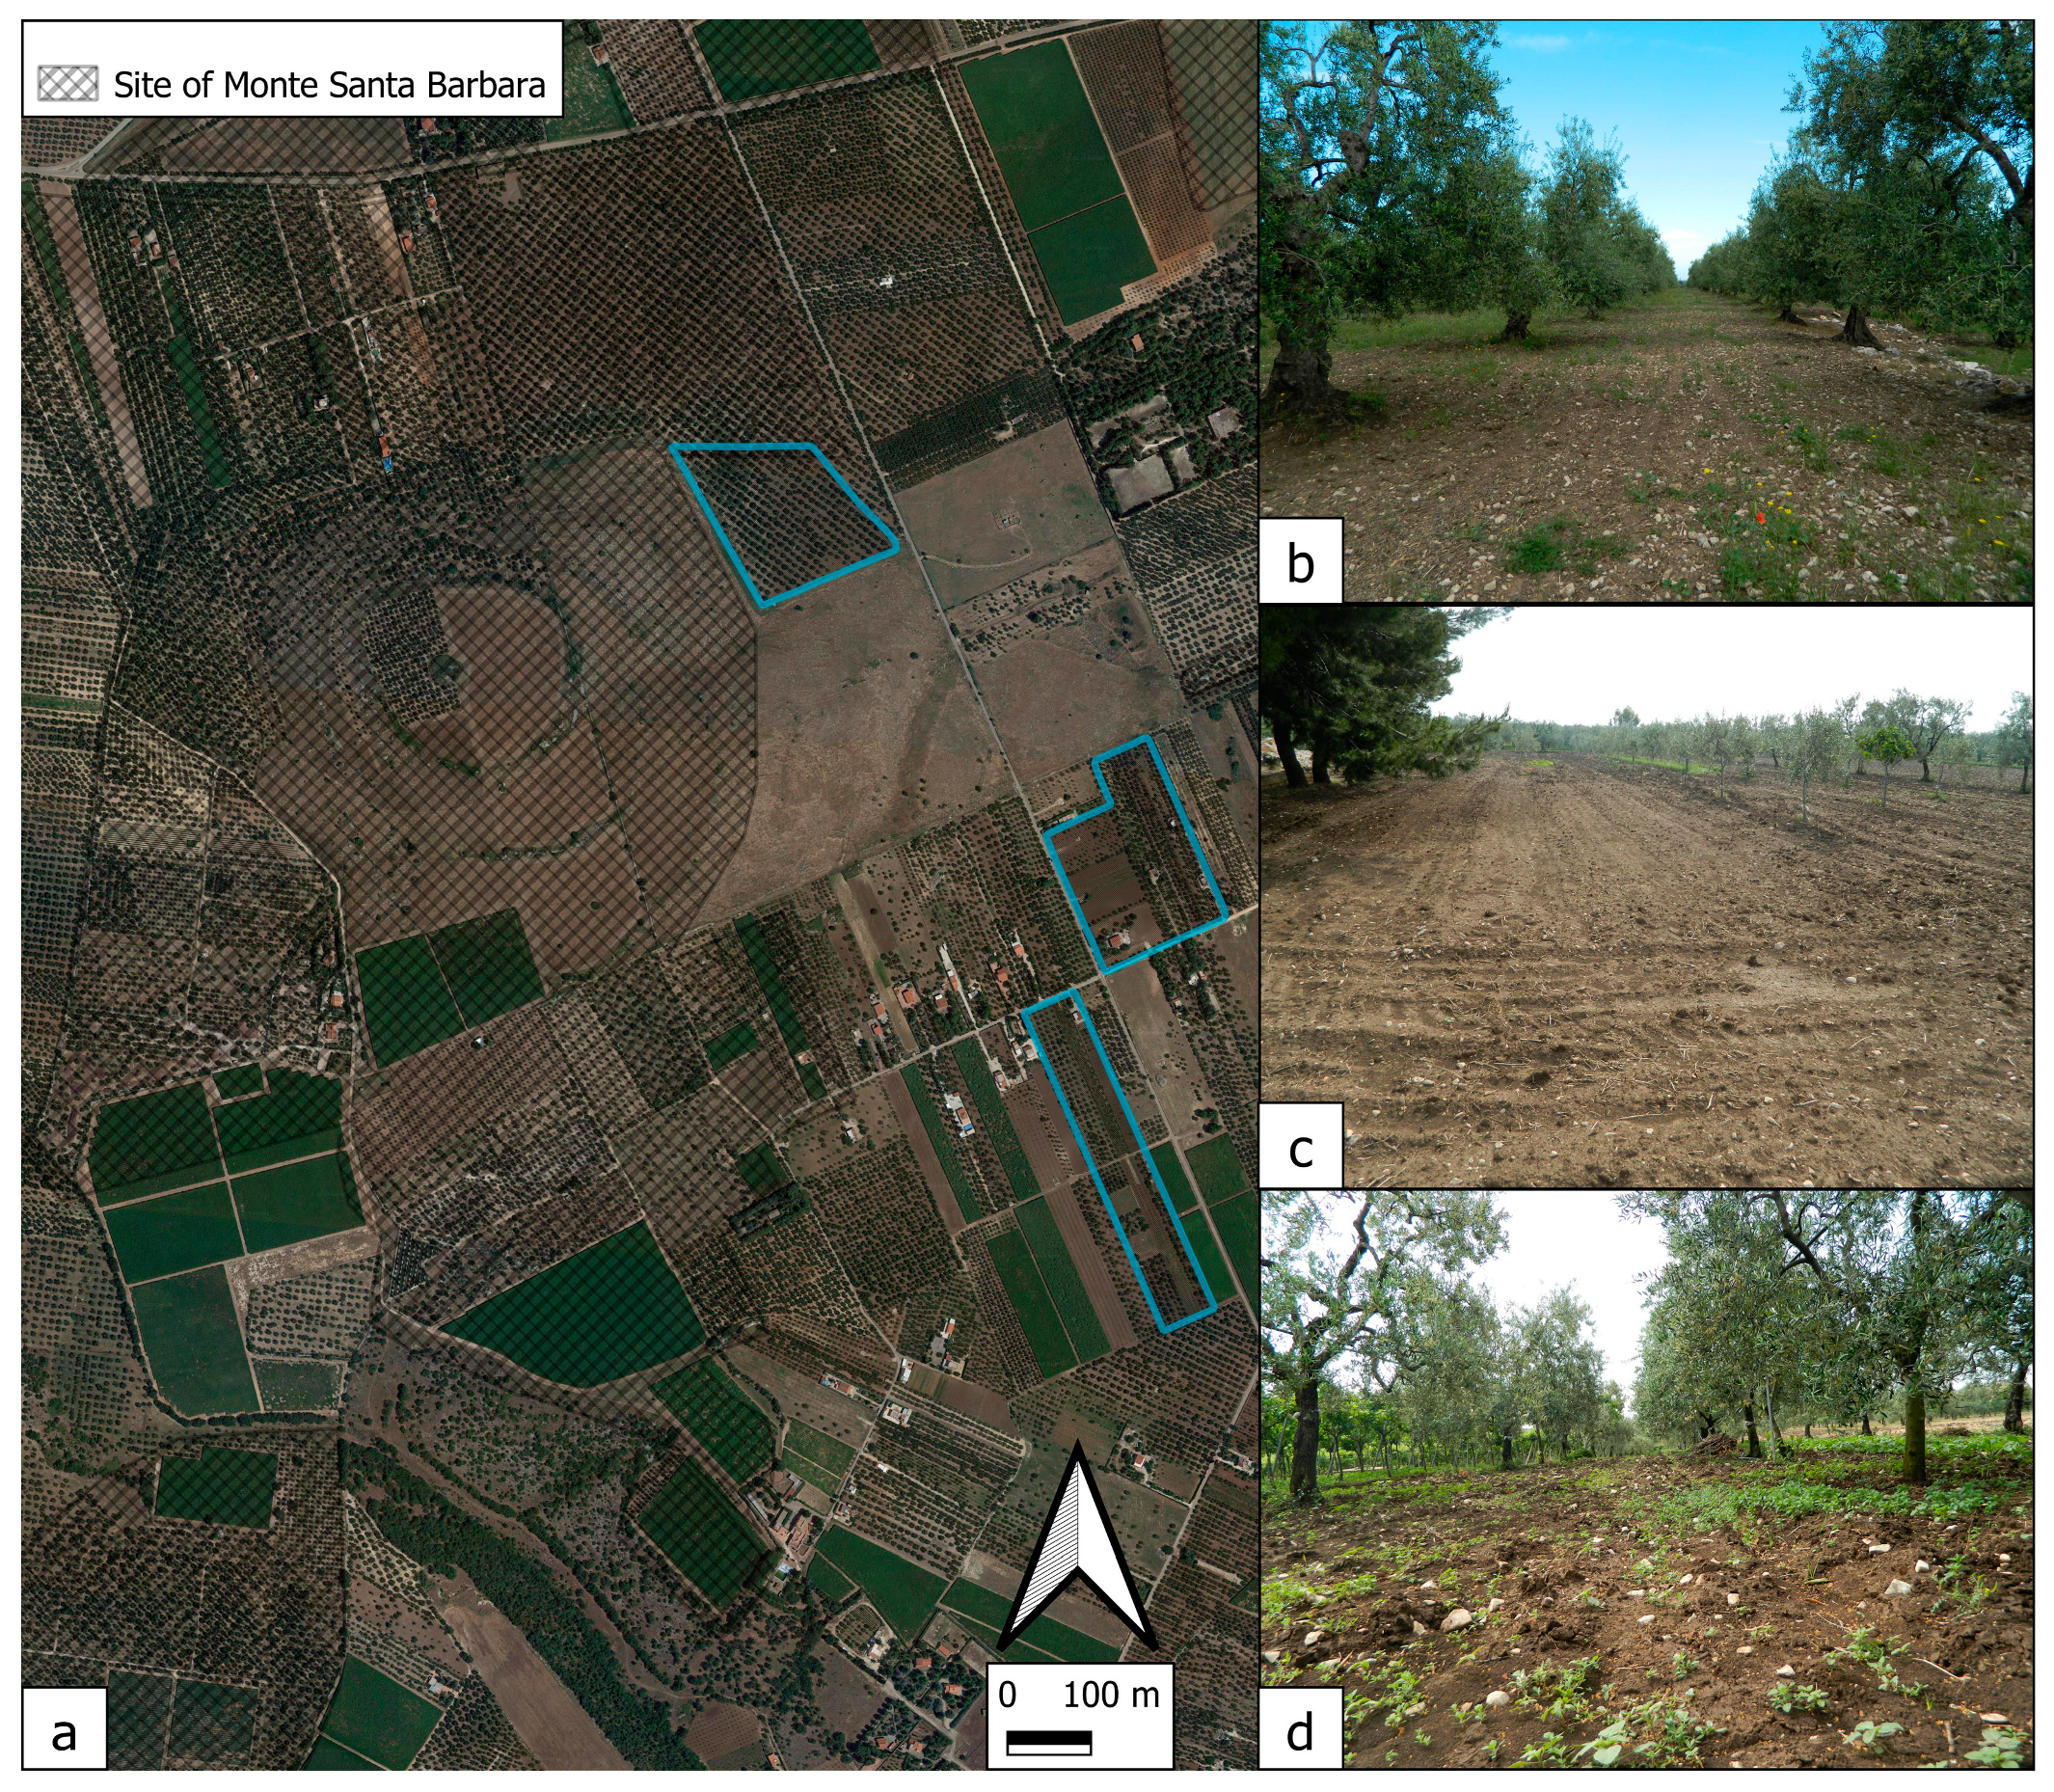
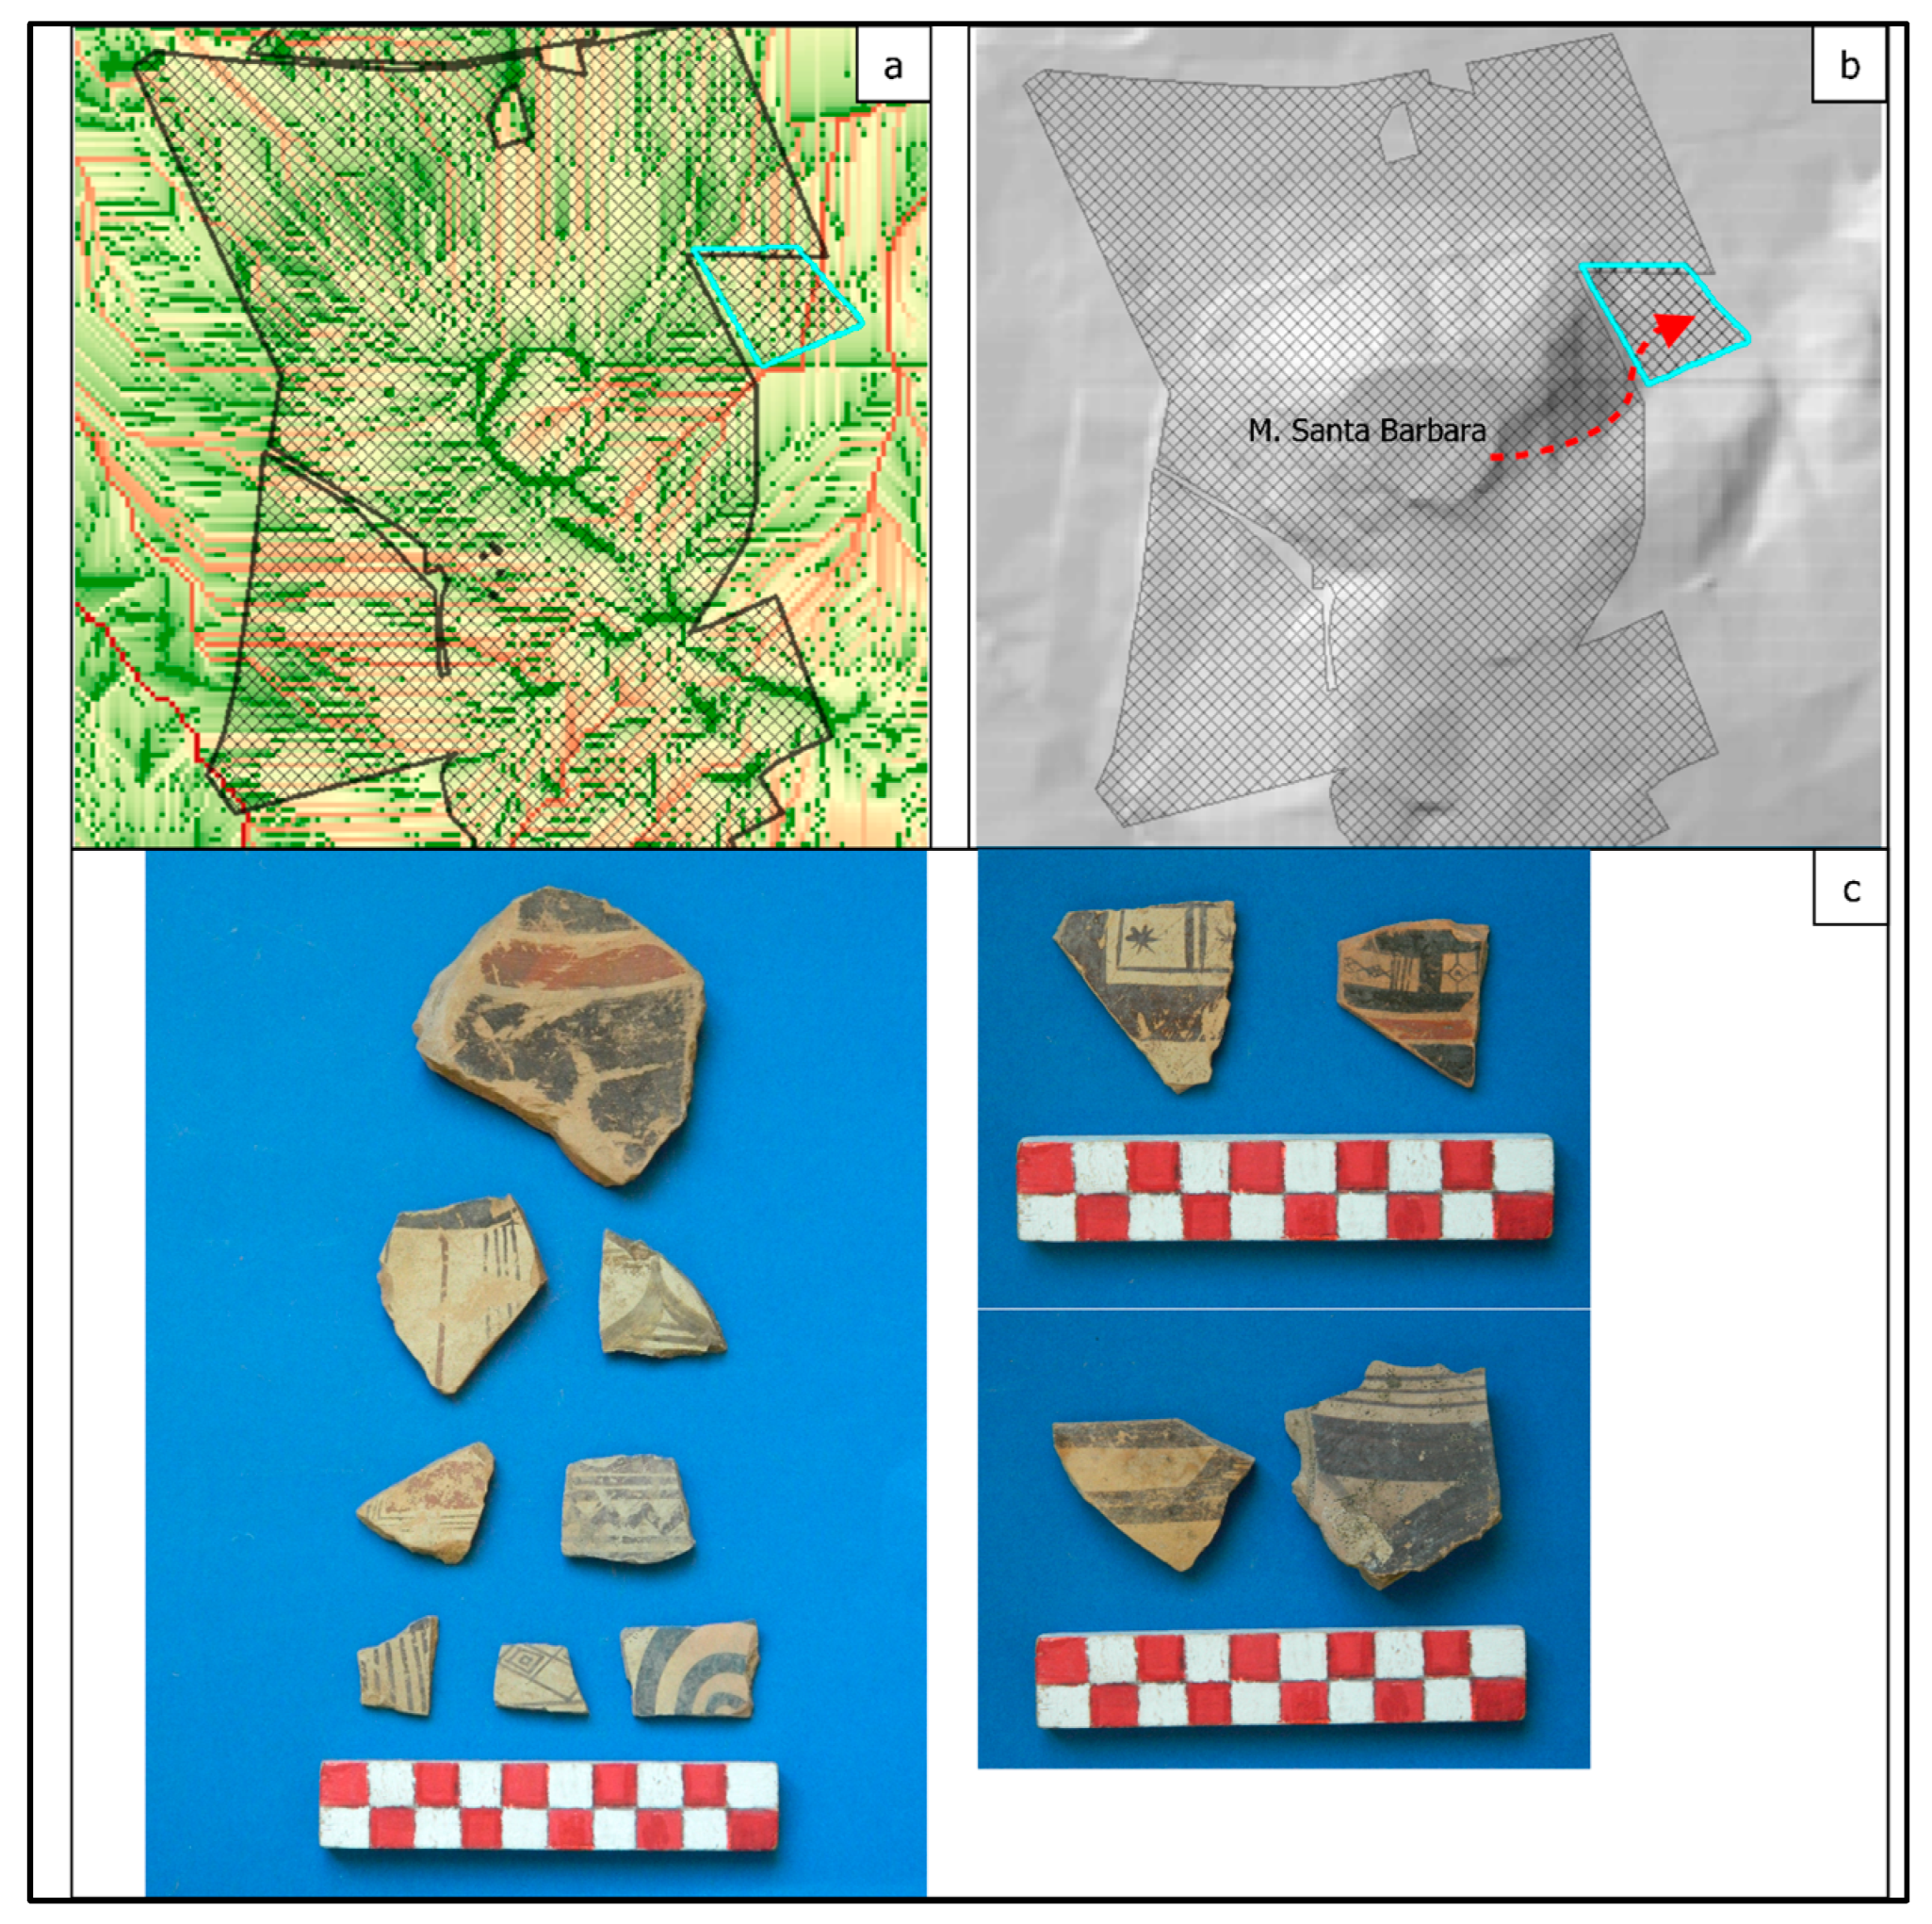
3.2. Archaeological Analysis
3.3. SfCI and Archaeo-Records Comparison
4. Results
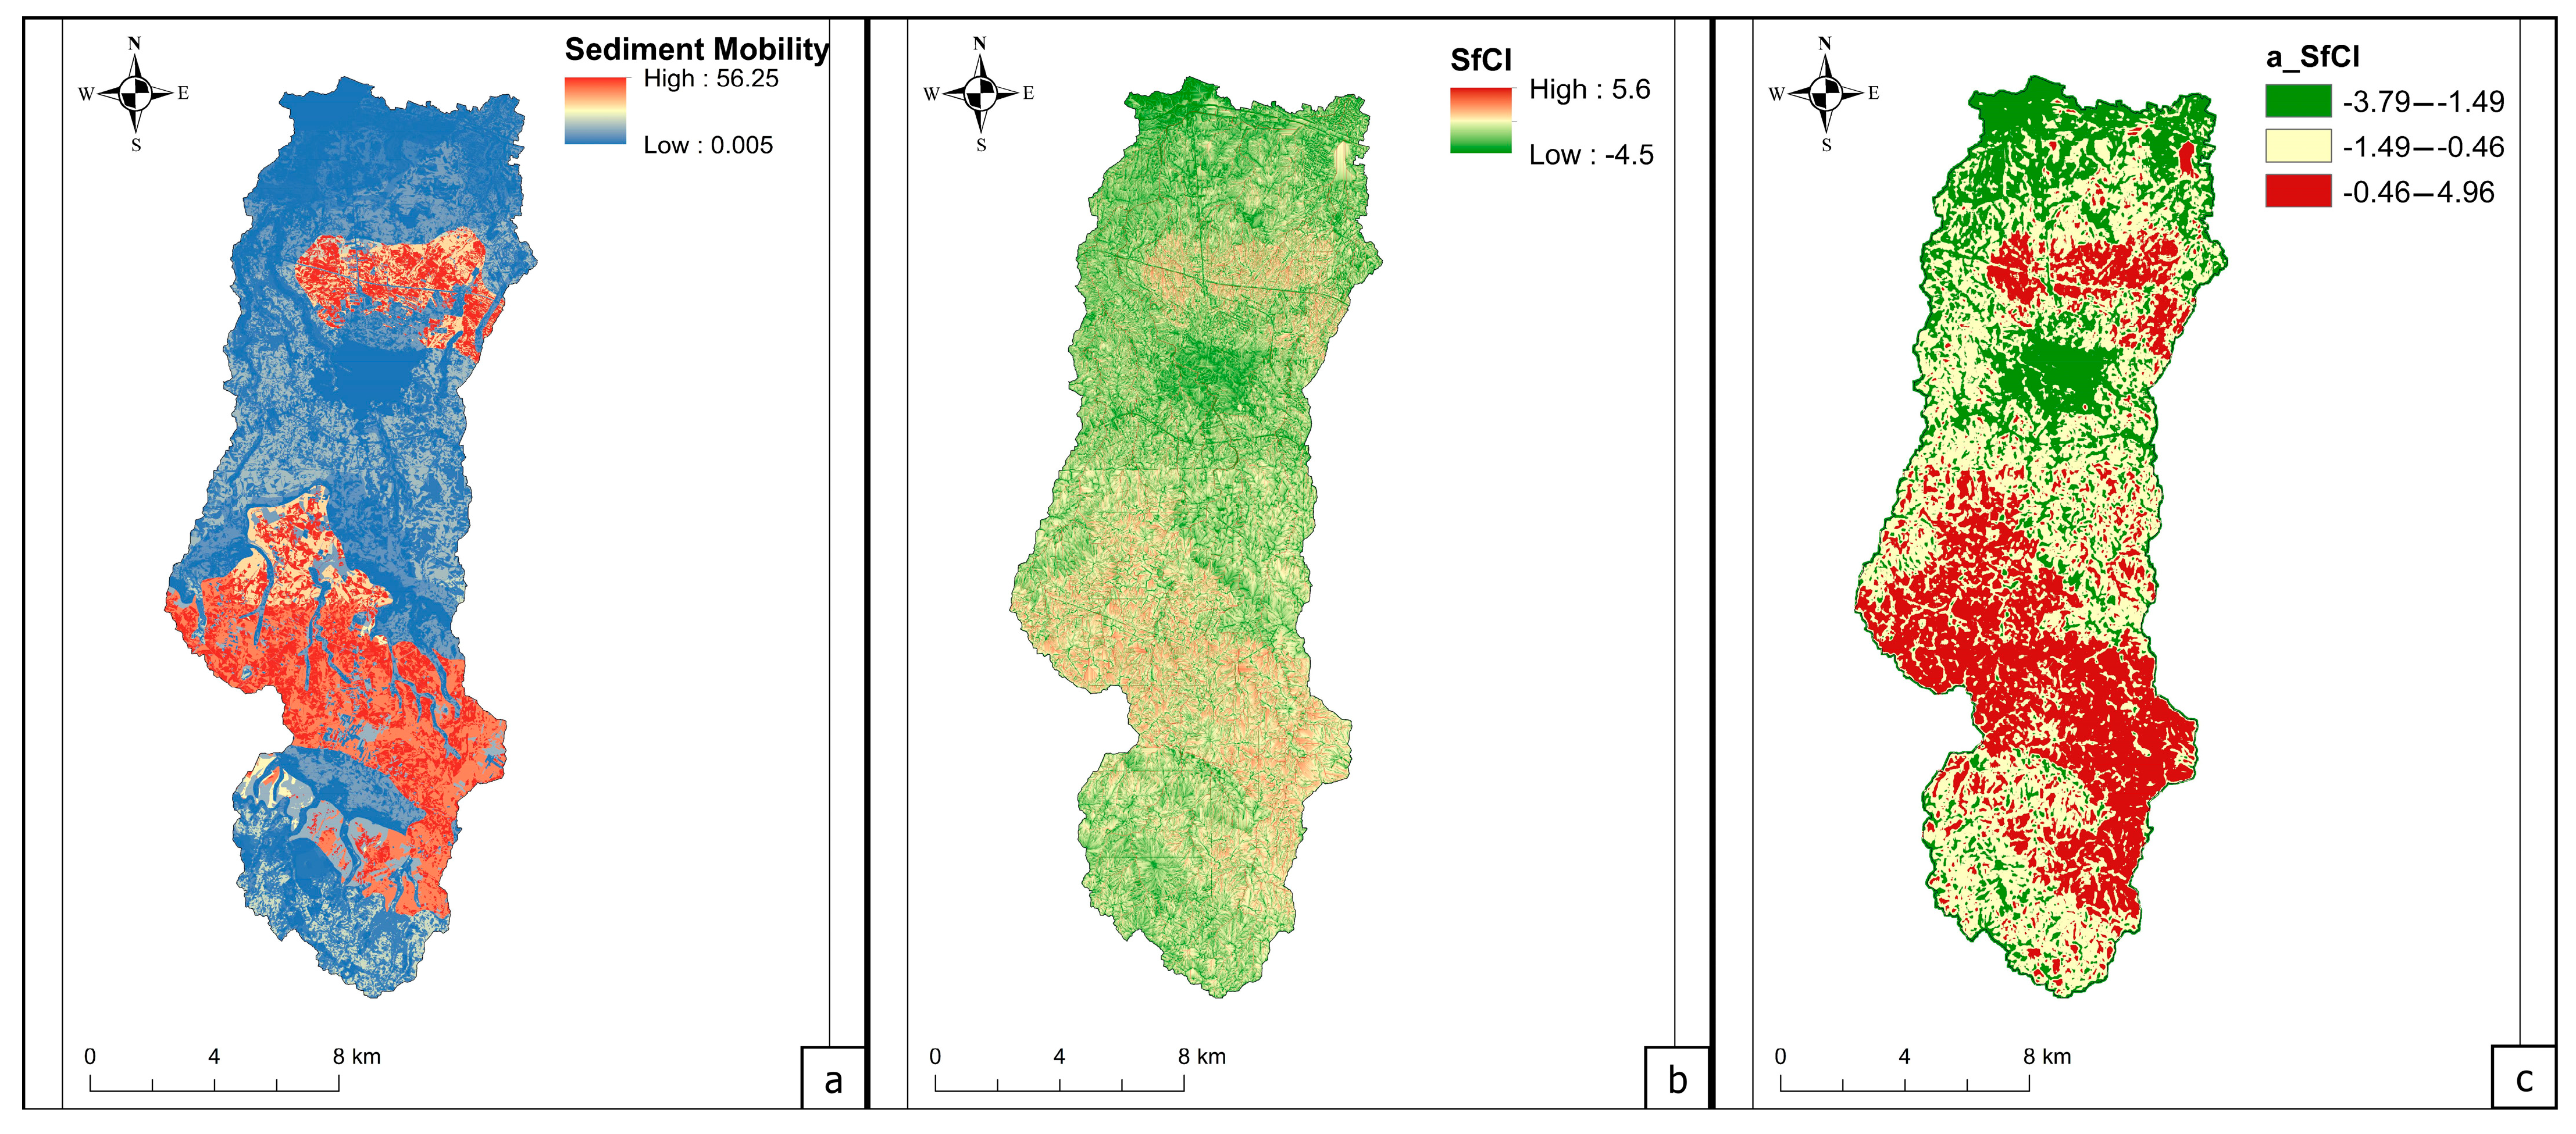
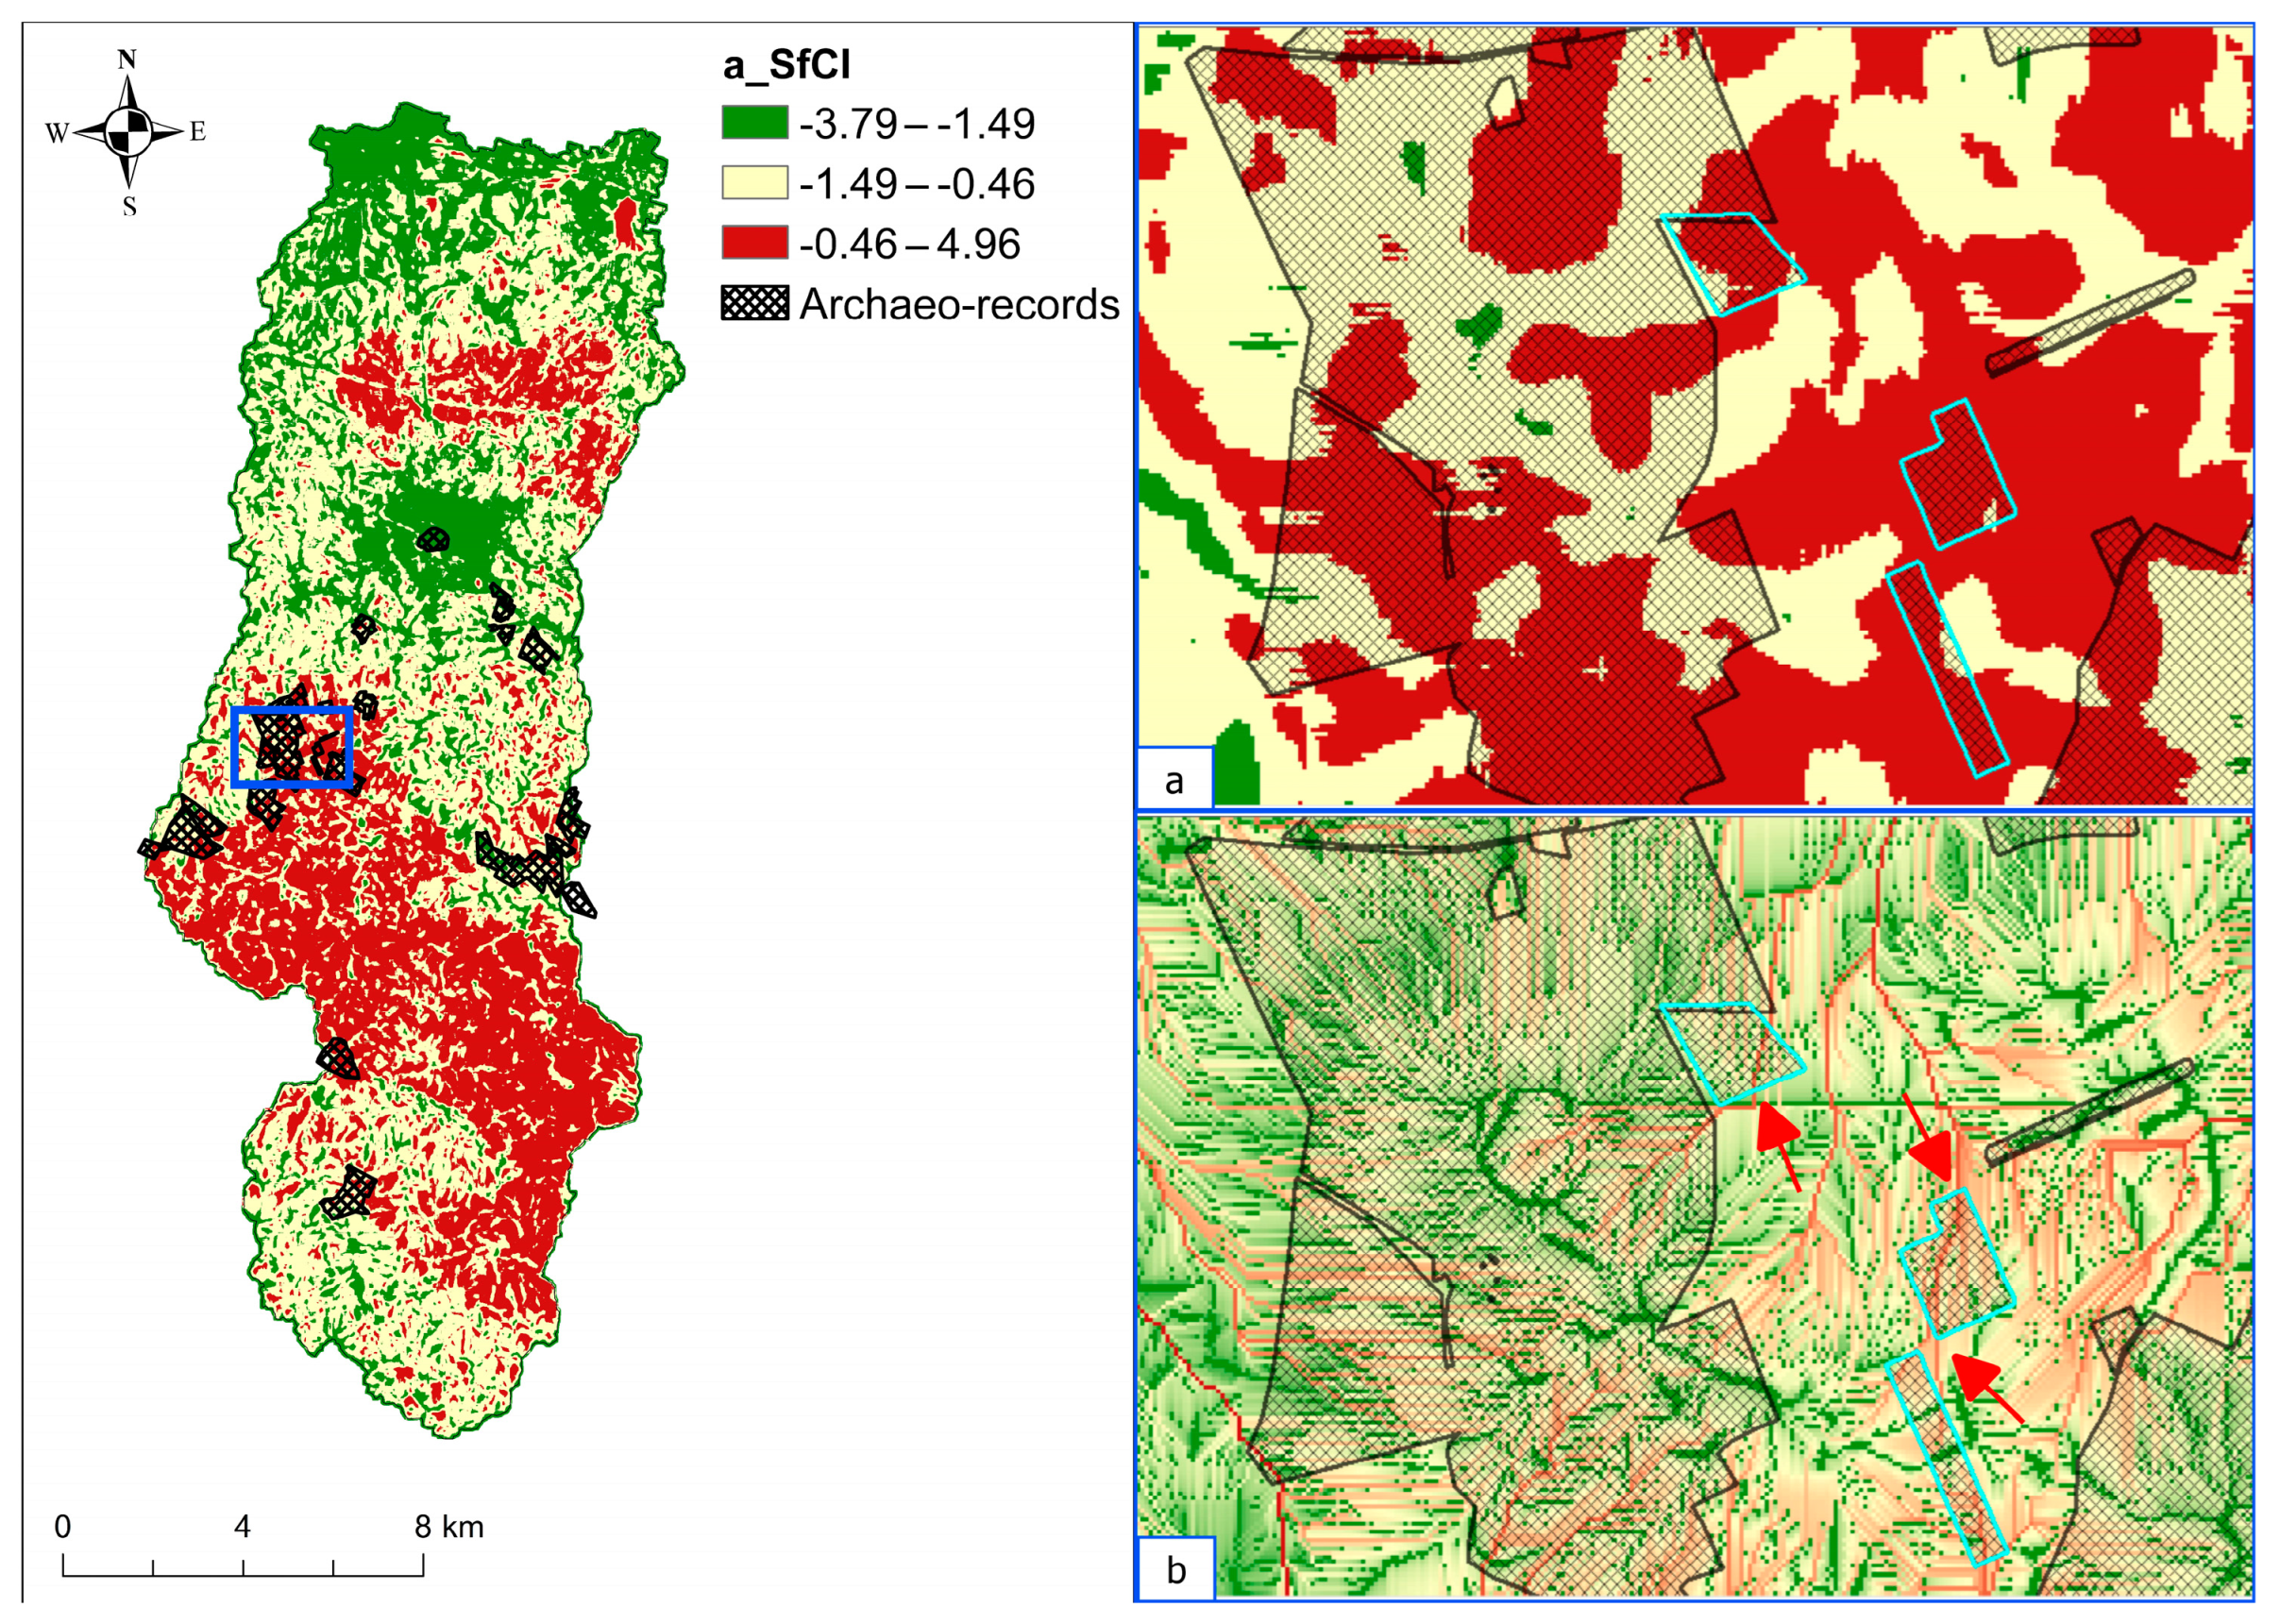
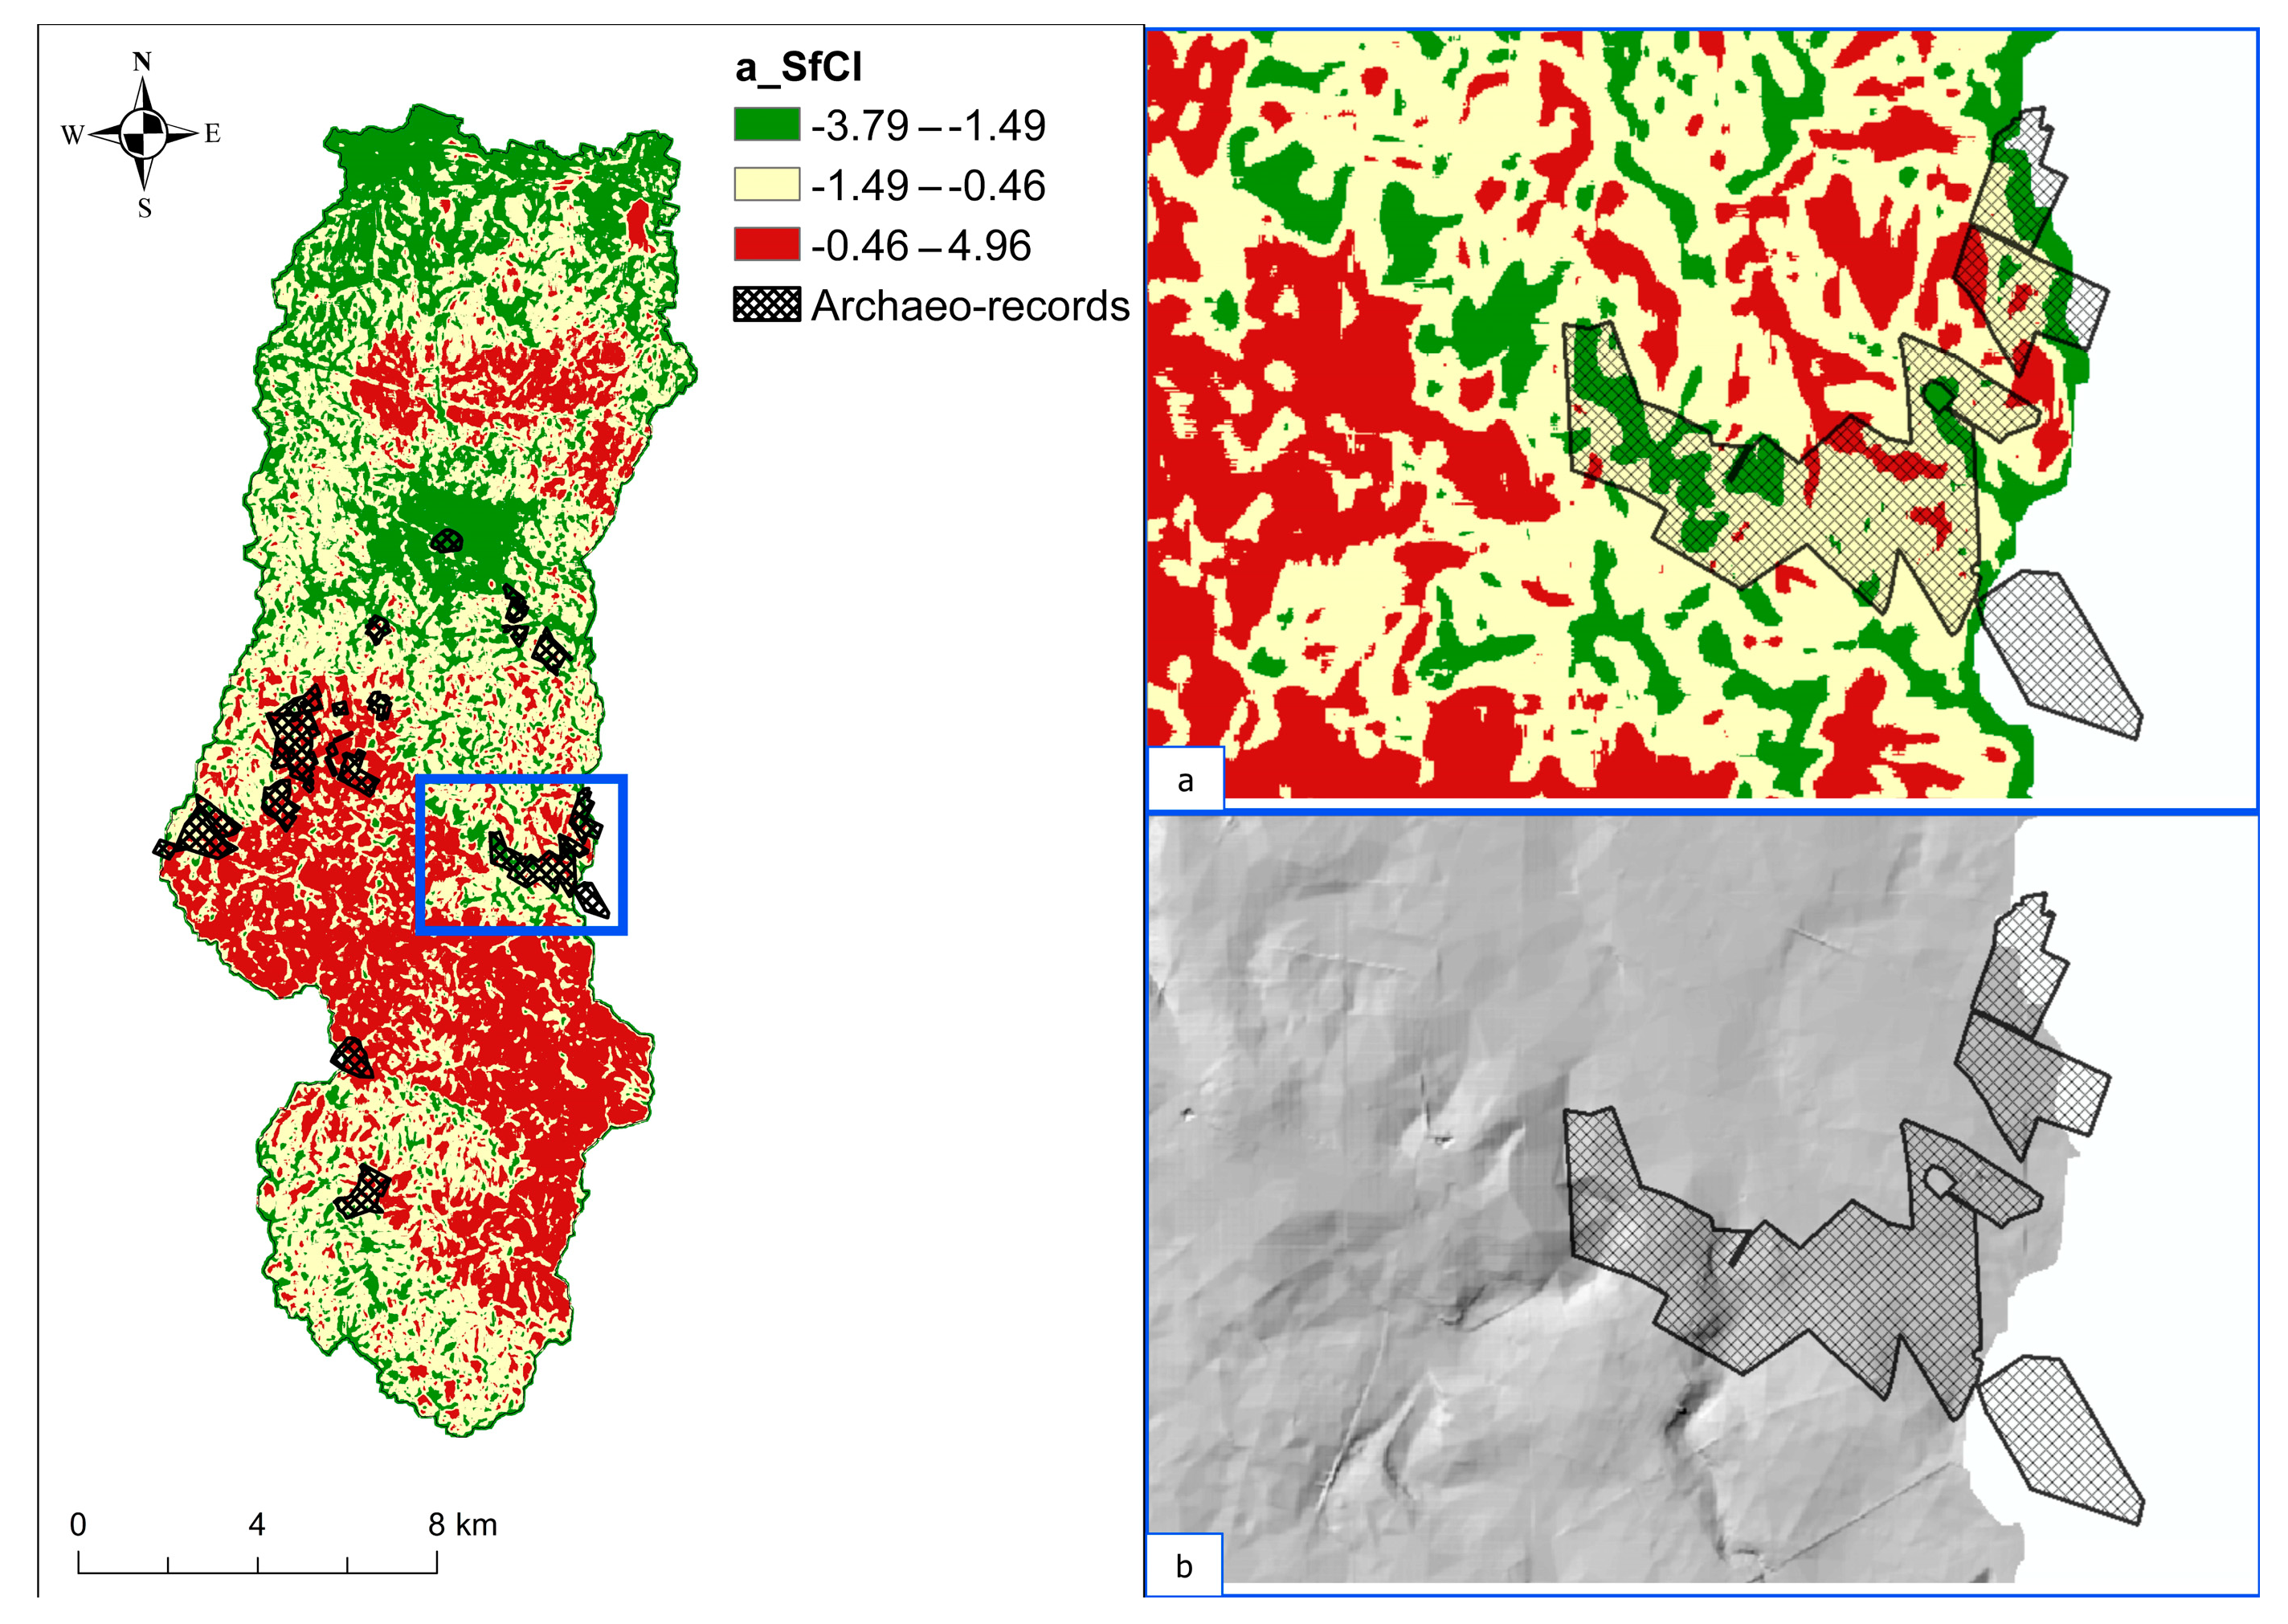
4.1. SM, SfCI, and a_SfCI Maps
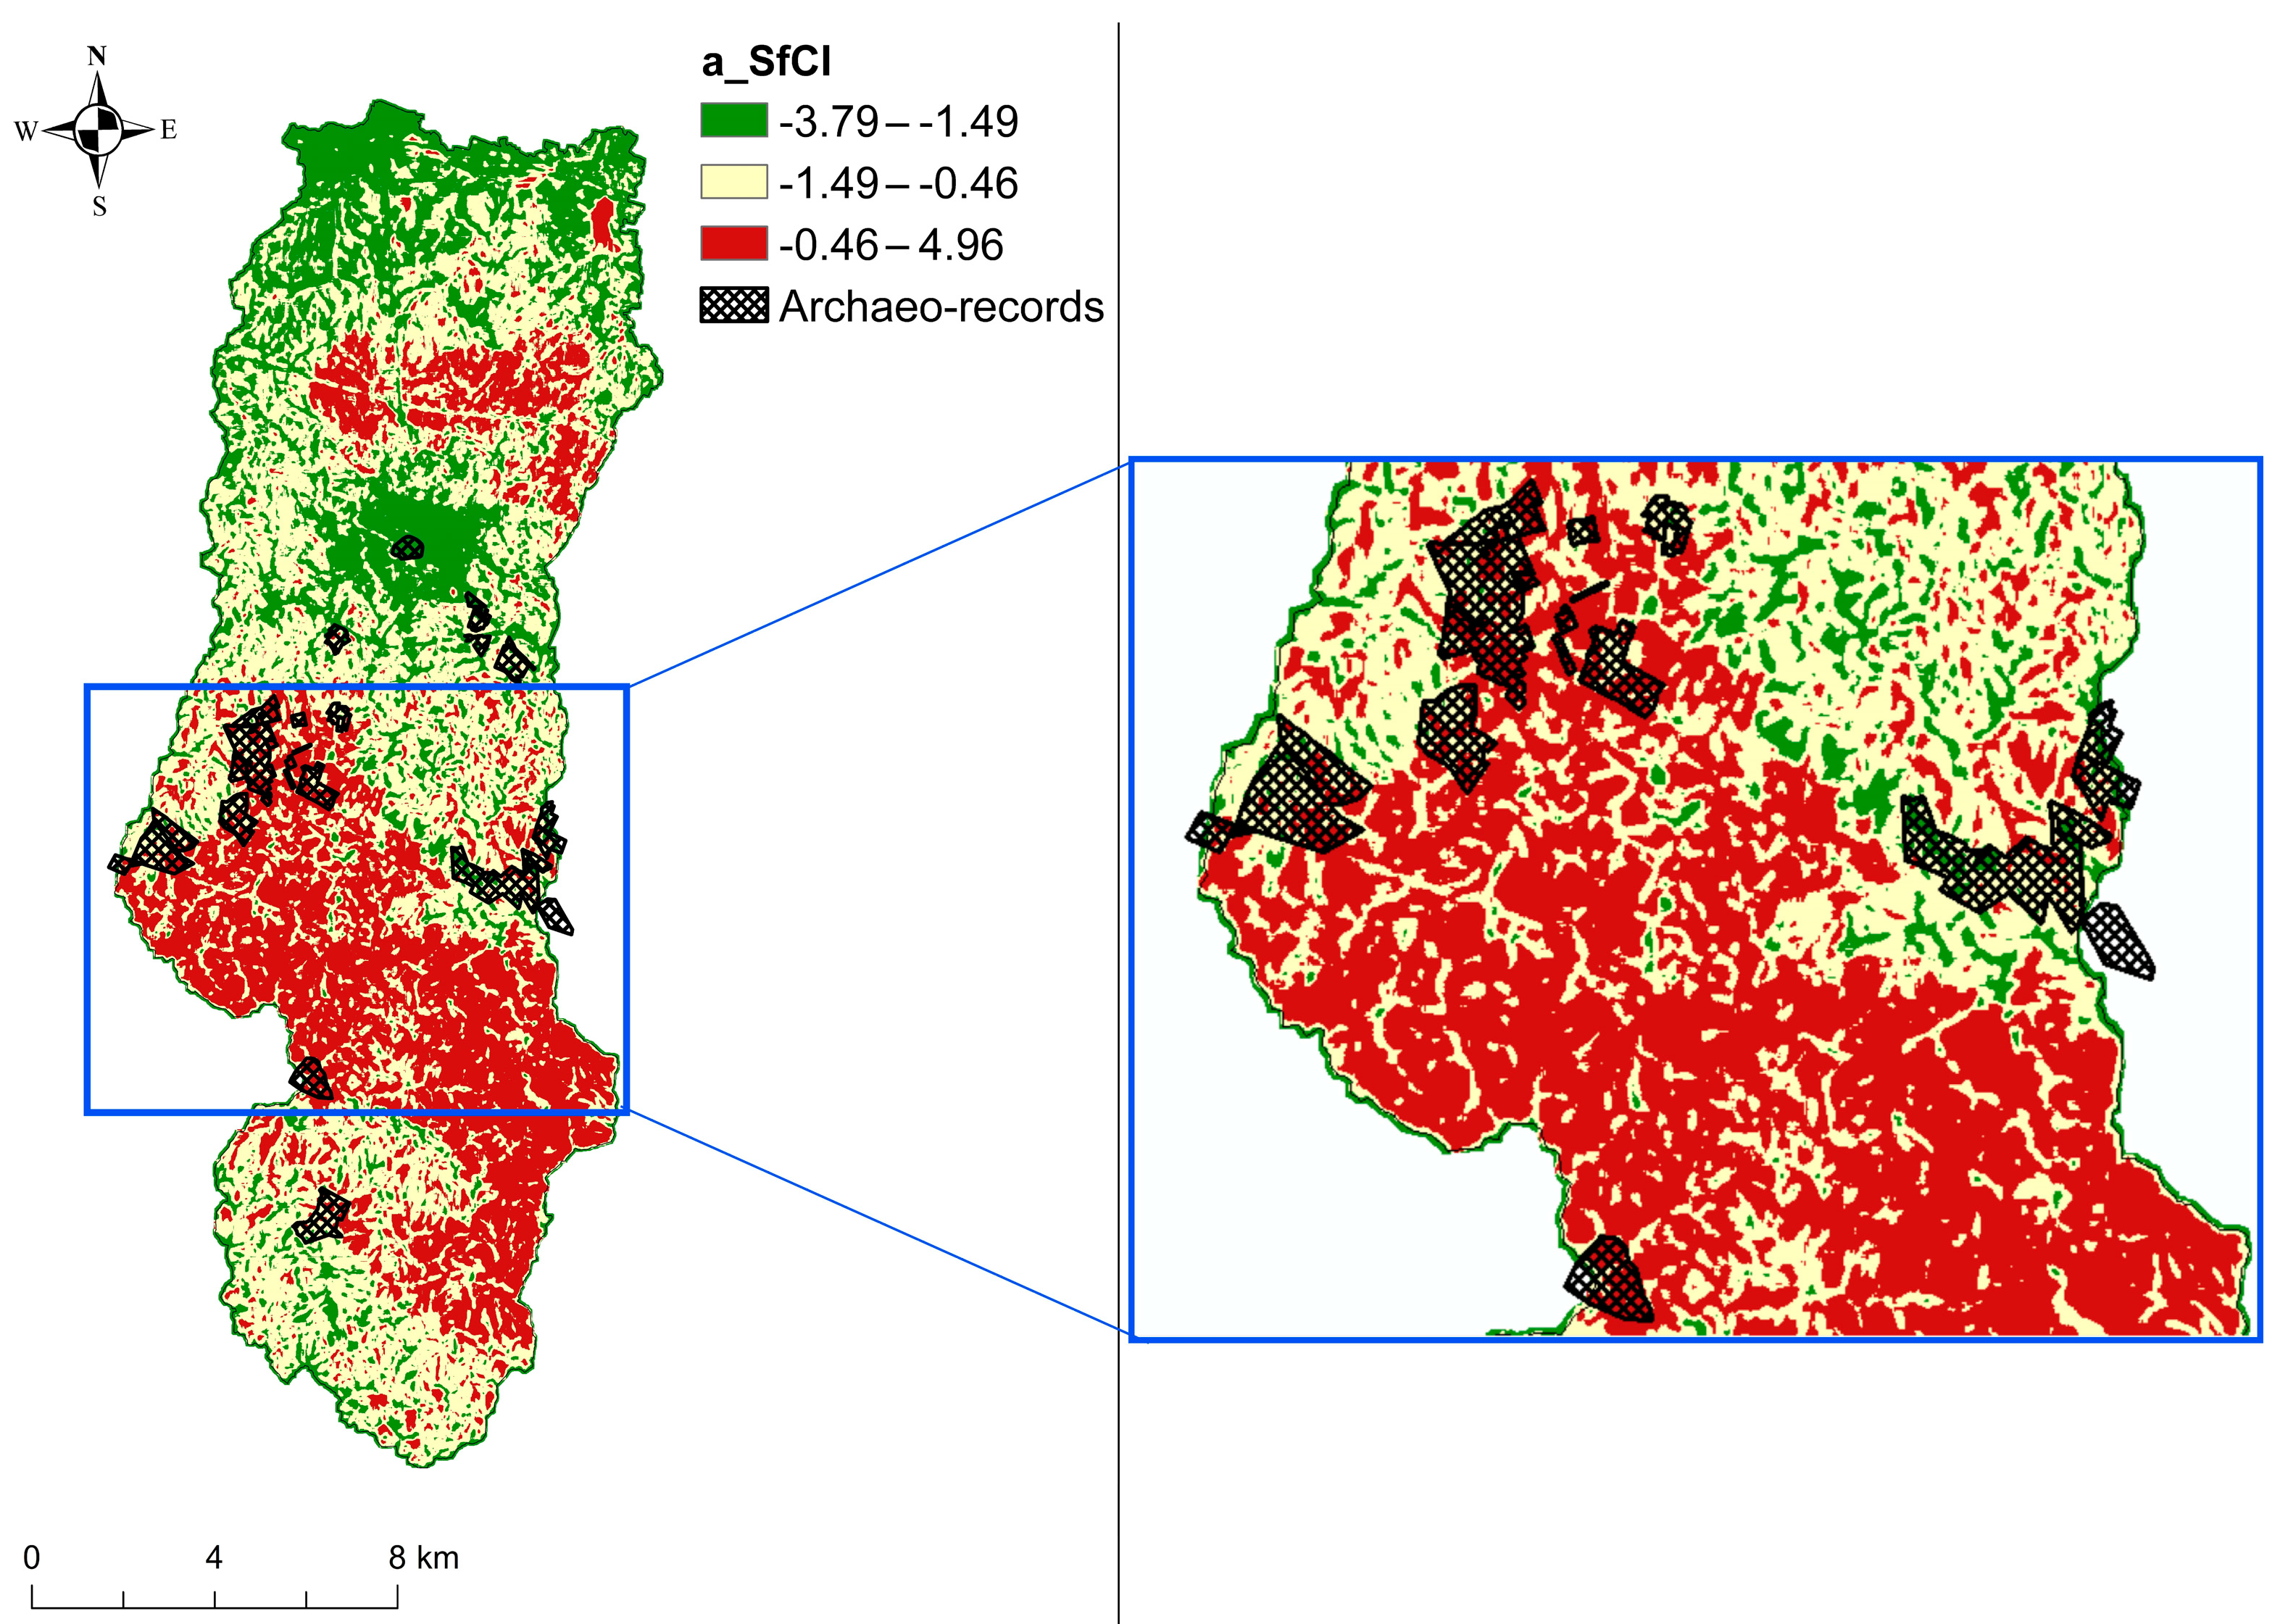
4.2. SfCI Comparison with Archaeological Occurrence
5. Discussion
6. Conclusions
- The simplified approach of our index may overlook: (i) the complex dynamics of sediment transport (represented by the use of a flow-accumulation algorithm, and justified by the assumptions on which the index itself is based); (ii) the different characteristics of the various factors involved in the calculation (represented by the intermediate dimensionless indices, i.e., rainfall, soil stability, land use, slope, and ruggedness, defined by normalization procedure);
- Some characteristics of the Lama Camaggi basin (such as the poor spatial variability of precipitation, overall low slopes) could affect the results; which, however, were shown to be such that they did not invalidate the test. It should be specified that our study area, while not constituting an exemplar case study, represents a good test case because of the significant presence of surface archaeological evidence and the presence of fluvio-karst valleys that correspond to the main surface hydrographic network;
- The spatial resolution of maps (8 m) partially limits the sediment connectivity analysis and the subsequent assessment, especially when considered in relation to the spatial extent of the archaeological evidence.
Author Contributions
Funding
Institutional Review Board Statement
Informed Consent Statement
Data Availability Statement
Acknowledgments
Conflicts of Interest
References
- Brancato, R. How to Access Ancient Landscapes? Field Survey and Legacy Data Integration for Research on Greek and Roman Settlement Patterns in Eastern Sicily. Groma 2020, 4, 1–32. [Google Scholar] [CrossRef]
- Doneus, M.; Banaszek, Ł.; Verhoeven, G.J. The Impact of Vegetation on the Visibility of Archaeological Features in Airborne Laser Scanning Datasets from Different Acquisition Dates. Remote Sens. 2022, 14, 858. [Google Scholar] [CrossRef]
- Kempf, M. Modeling Multivariate Landscape Affordances and Functional Ecosystem Connectivity in Landscape Archeology. Archaeol. Anthropol. Sci. 2020, 12, 159. [Google Scholar] [CrossRef]
- Satellite Monitoring of Geo-Hazards Affecting Cultural Heritage. In A Research Agenda for Heritage Planning; Stegmeijer, E.; Veldpaus, L. (Eds.) Edward Elgar Publishing: Cheltenham, UK, 2021; ISBN 978-1-78897-463-9. [Google Scholar]
- Storchi, P. Tannetum: Mutamenti Ambientali, Considerazioni Storiche e Fotografia Aerea per La Localizzazione Della Città e La Ricostruzione Del Territorio. Agri Centuriati Int. J. Landsc. Archaeol. 2014, 11, 61–82. [Google Scholar] [CrossRef]
- Zingaro, M.; Scicchitano, G.; Capolongo, D. The Innovative Growth of Space Archaeology: A Brief Overview of Concepts and Approaches in Detection, Monitoring, and Promotion of the Archaeological Heritage. Remote Sens. 2023, 15, 3049. [Google Scholar] [CrossRef]
- Dall’Aglio, P. Topografia Antica, Geoarcheologia e Discipline Paleoambientali. J. Anc. Topogr. 2011, 21, 7–24. [Google Scholar]
- Ferrari, K. Studying Evolving Landscapes: Geomorphology as a Research Tool for Landscape Archaeology. In TRAC 2016: Proceedings of the Twenty-Sixth Theoretical Roman Archaeology Conference: Sapienza University of Rome, Rome, Italy, 16–19 March 2016; Open Library of Humanities: London, UK, 2016; ISBN 88-7140-770-9. [Google Scholar]
- Wells, L. A Geomorphological Approach to Reconstructing Archaeological Settlement Patterns Based on Surficial Artifact Distribution. In Earth Sciences and Archaeology; Springer: New York, NY, USA, 2001; pp. 107–141. ISBN 978-1-4613-5433-8. [Google Scholar]
- Zingaro, M.; Mastronuzzi, G. Il Popolamento Antico Di Lama Diumo-San Giorgio in Relazione Alle Forme Del Paesaggio. Agri Centuriati 2017, 14, 39–56. [Google Scholar]
- Luo, L.; Wang, X.; Guo, H.; Lasaponara, R.; Shi, P.; Bachagha, N.; Li, L.; Yao, Y.; Masini, N.; Chen, F.; et al. Google Earth as a Powerful Tool for Archaeological and Cultural Heritage Applications: A Review. Remote Sens. 2018, 10, 1558. [Google Scholar] [CrossRef]
- Howland, M.D.; Jones, I.W.N.; Najjar, M.; Levy, T.E. Quantifying the Effects of Erosion on Archaeological Sites with Low-Altitude Aerial Photography, Structure from Motion, and GIS: A Case Study from Southern Jordan. J. Archaeol. Sci. 2018, 90, 62–70. [Google Scholar] [CrossRef]
- Forti, L.; Brandolini, F.; Oselini, V.; Peyronel, L.; Pezzotta, A.; Vacca, A.; Zerboni, A. Geomorphological Assessment of the Preservation of Archaeological Tell Sites. Sci. Rep. 2023, 13, 7683. [Google Scholar] [CrossRef]
- Parcak, S.H. GIS, Remote Sensing, and Landscape Archaeology. In Online Only—Archaeology; Oxford Handbooks Editorial Board, Ed.; Oxford University Press: Oxford, UK, 2017; ISBN 978-0-19-993541-3. [Google Scholar]
- Tapete, D. Remote Sensing and Geosciences for Archaeology. Geosciences 2018, 8, 41. [Google Scholar] [CrossRef]
- Tarolli, P.; Sofia, G. Human Topographic Signatures and Derived Geomorphic Processes across Landscapes. Geomorphology 2016, 255, 140–161. [Google Scholar] [CrossRef]
- Contillo, L.; Zingaro, M.; Capolongo, D.; Corrado, G.; Schiattarella, M. Geomorphology and Geotourism for a Sustainable Development of the Daunia Mts, Southern Italy. J. Maps 2022, 18, 418–427. [Google Scholar] [CrossRef]
- Bonazza, A.; Bonora, N.; Duke, B.; Spizzichino, D.; Recchia, A.P.; Taramelli, A. Copernicus in Support of Monitoring, Protection, and Management of Cultural and Natural Heritage. Sustainability 2022, 14, 2501. [Google Scholar] [CrossRef]
- Gray, M. Geodiversity, Geoheritage and Geoconservation for Society. Int. J. Geoheritage Park. 2019, 7, 226–236. [Google Scholar] [CrossRef]
- Spizzichino, D.; Margottini, C.; Brustia, E.; Cigna, F.; Comerci, V.; Dessì, B.; Guerrieri, L.; Iadanza, C.; Leoni, G.; Tapete, D.; et al. Satellite Monitoring Applied to Natural Hazards and Cultural Heritage: The PROTHEGO Project 2017. In Proceedings of the 11th Remote Sensing Thematic Workshop, Bologna, Italy, 27–28 June 2017. [Google Scholar]
- Wang, Y.; Wu, F.; Li, X.; Chen, L. Geotourism, Geoconservation, and Geodiversity along the Belt and Road: A Case Study of Dunhuang UNESCO Global Geopark in China. Proc. Geol. Assoc. 2019, 130, 232–241. [Google Scholar] [CrossRef]
- United Stations. The Sustainable Development Goals Report; UN: New York, NY, USA, 2022. [Google Scholar]
- Cavalazzi, M. “Looking through the Keyhole”: Problems and Research Strategies for Landscape Archaeology in an Alluvial Plain with a High Rate of Vertical Growth. The Case of Bassa Romagna and South-Eastern Po Valley. Groma. Doc. Archaeol. 2021, 5. [Google Scholar] [CrossRef]
- Cremaschi, M.; Storchi, P.; Perego, A. Geoarchaeology in an Urban Context: The Town of Reggio Emilia and River Dynamics during the Last Two Millennia in Northern Italy. Geoarchaeology 2018, 33, 52–66. [Google Scholar] [CrossRef]
- Herz, N.; Garrison, E.G. Geomorphology in Archaeology. In Geological Methods for Archaeology; Oxford University Press: Oxford, UK, 1998; ISBN 978-0-19-509024-6. [Google Scholar]
- Franceschelli, C.; Marabini, S. Lettura Di Un Territorio Sepolto: La Pianura Lughese in Età Romana; Studi e Scavi. Nuova Serie; Ante quem: Bologna, Italy, 2007; ISBN 978-88-7849-027-7. [Google Scholar]
- Cuca, B.; Agapiou, A. Impact of land use change to the soil erosion estimation for cultural landscapes: Case study of paphos disrict in cyprus. Int. Arch. Photogramm. Remote Sens. Spatial Inf. Sci. 2017, 42, 25–29. [Google Scholar] [CrossRef]
- De Angeli, S.; Battistin, F. Archaeological Site Monitoring and Risk Assessment Using Remote Sensing Technologies and GIS. In A Research Agenda for Heritage Planning: Perspectives from Europe; Edward Elgar Publishing: Cheltenham, UK, 2021; p. 145. [Google Scholar]
- Wainwright, J. Erosion of Archaeological Sites: Results and Implications of a Site Simulation Model. Geoarchaeology 1994, 9, 173–201. [Google Scholar] [CrossRef]
- Baartman, J.E.M.; Masselink, R.; Keesstra, S.D.; Temme, A.J.A.M. Linking Landscape Morphological Complexity and Sediment Connectivity: Landscape Morphological Complexity and Sediment Connectivity. Earth Surf. Process. Landf. 2013, 38, 1457–1471. [Google Scholar] [CrossRef]
- Bracken, L.J.; Turnbull, L.; Wainwright, J.; Bogaart, P. Sediment Connectivity: A Framework for Understanding Sediment Transfer at Multiple Scales: Sediment Connectivity: Sediment Transfer at Multiple Scales. Earth Surf. Process. Landf. 2015, 40, 177–188. [Google Scholar] [CrossRef]
- Cavalli, M.; Vericat, D.; Pereira, P. Mapping Water and Sediment Connectivity. Sci. Total Environ. 2019, 673, 763–767. [Google Scholar] [CrossRef] [PubMed]
- Fryirs, K.A.; Brierley, G.J.; Preston, N.J.; Kasai, M. Buffers, Barriers and Blankets: The (Dis)Connectivity of Catchment-Scale Sediment Cascades. CATENA 2007, 70, 49–67. [Google Scholar] [CrossRef]
- Fryirs, K. (Dis)Connectivity in Catchment Sediment Cascades: A Fresh Look at the Sediment Delivery Problem. Earth Surf. Process. Landf. 2013, 38, 30–46. [Google Scholar] [CrossRef]
- Wohl, E. Connectivity in Rivers. Prog. Phys. Geogr. Earth Environ. 2017, 41, 345–362. [Google Scholar] [CrossRef]
- Ali, G.; Oswald, C.; Spence, C.; Wellen, C. The T-TEL Method for Assessing Water, Sediment, and Chemical Connectivity. Water Resour. Res. 2018, 54, 634–662. [Google Scholar] [CrossRef]
- Heckmann, T.; Schwanghart, W. Geomorphic Coupling and Sediment Connectivity in an Alpine Catchment—Exploring Sediment Cascades Using Graph Theory. Geomorphology 2013, 182, 89–103. [Google Scholar] [CrossRef]
- Najafi, S.; Dragovich, D.; Heckmann, T.; Sadeghi, S.H. Sediment Connectivity Concepts and Approaches. CATENA 2021, 196, 104880. [Google Scholar] [CrossRef]
- Poeppl, R.E.; Parsons, A.J. The Geomorphic Cell: A Basis for Studying Connectivity: The Geomorphic Cell. Earth Surf. Process. Landforms 2018, 43, 1155–1159. [Google Scholar] [CrossRef]
- Kalantari, Z.; Cavalli, M.; Cantone, C.; Crema, S.; Destouni, G. Flood Probability Quantification for Road Infrastructure: Data-Driven Spatial-Statistical Approach and Case Study Applications. Sci. Total Environ. 2017, 581, 386–398. [Google Scholar] [CrossRef]
- Kondolf, G.M.; Boulton, A.J.; O’Daniel, S.; Poole, G.C.; Rahel, F.J.; Stanley, E.H.; Wohl, E.; Bång, A.; Carlstrom, J.; Cristoni, C.; et al. Process-Based Ecological River Restoration: Visualizing Three-Dimensional Connectivity and Dynamic Vectors to Recover Lost Linkages. Ecol. Soc. 2006, 11, 13–37. [Google Scholar] [CrossRef]
- Poeppl, R.E.; Keesstra, S.D.; Maroulis, J. A Conceptual Connectivity Framework for Understanding Geomorphic Change in Human-Impacted Fluvial Systems. Geomorphology 2017, 277, 237–250. [Google Scholar] [CrossRef]
- Doyle, M.W.; Ensign, S.H. Alternative Reference Frames in River System Science. BioScience 2009, 59, 499–510. [Google Scholar] [CrossRef]
- Lizaga, I.; Quijano, L.; Palazón, L.; Gaspar, L.; Navas, A. Enhancing Connectivity Index to Assess the Effects of Land Use Changes in a Mediterranean Catchment: Effects of Land Use Changes in a Mediterranean Catchment. Land Degrad. Develop. 2018, 29, 663–675. [Google Scholar] [CrossRef]
- Coulthard, T.J.; Van De Wiel, M.J. Modelling Long Term Basin Scale Sediment Connectivity, Driven by Spatial Land Use Changes. Geomorphology 2017, 277, 265–281. [Google Scholar] [CrossRef]
- Ludwig, J.A.; Bastin, G.N.; Chewings, V.H.; Eager, R.W.; Liedloff, A.C. Leakiness: A New Index for Monitoring the Health of Arid and Semiarid Landscapes Using Remotely Sensed Vegetation Cover and Elevation Data. Ecol. Indic. 2007, 7, 442–454. [Google Scholar] [CrossRef]
- Turnbull, L.; Wainwright, J.; Brazier, R.E. A Conceptual Framework for Understanding Semi-Arid Land Degradation: Ecohydrological Interactions across Multiple-Space and Time Scales. Ecohydrology 2008, 1, 23–34. [Google Scholar] [CrossRef]
- Zingaro, M.; Refice, A.; Giachetta, E.; D’Addabbo, A.; Lovergine, F.; De Pasquale, V.; Pepe, G.; Brandolini, P.; Cevasco, A.; Capolongo, D. Sediment Mobility and Connectivity in a Catchment: A New Mapping Approach. Sci. Total Environ. 2019, 672, 763–775. [Google Scholar] [CrossRef]
- Zingaro, M.; Refice, A.; D’Addabbo, A.; Hostache, R.; Chini, M.; Capolongo, D. Experimental Application of Sediment Flow Connectivity Index (SCI) in Flood Monitoring. Water 2020, 12, 1857. [Google Scholar] [CrossRef]
- Zingaro, M. Advanced Analysis and Integration of Remote Sensing and in Situ Data for Flood Monitoring. Rend. Online Della Soc. Geol. Italy 2021, 54, 41–47. [Google Scholar] [CrossRef]
- Iurilli, V.; Cacciapaglia, G.; Selleri, G.; Palmentola, G.; Mastronuzzi, G. Karst Morphogenesis and Tectonics In South-Eastern Murge (Apulia, Italy). Geogr. Fis. Din. Quat. 2009, 32, 145–155. [Google Scholar]
- Mastronuzzi, G.; Sansò, P. Quaternary Coastal Morphology and Sea Level Changes. Puglia 2003, 437, 184. [Google Scholar] [CrossRef]
- Sabato, L.; Tropeano, M. Geologia Della Puglia. In Geositi della Puglia; Regione Puglia: Puglia, Italy, 2015; pp. 48–53. [Google Scholar]
- Fiore, A.; Gallicchio, S.; Giandonato, P.B.; Iurilli, V.; Mastronuzzi, G.; Pieri, P.; Sabato, L.; Sansò, P.; Selleri, G.; Simone, O.; et al. IL PATRIMONIO GEOLOGICO DELLA PuGLIA: INIZIATIVA EDITORIALE DELLA SIGEA PuGLIA. In Geologia dell’Ambiente; Il patrimonio geologico della Puglia: Puglia, Italy, 2010. [Google Scholar]
- Mastronuzzi, G.; Sansò, P. Pleistocene Sea-Level Changes, Sapping Processes and Development of Valley Networks in the Apulia Region (Southern Italy). Geomorphology 2002, 46, 19–34. [Google Scholar] [CrossRef]
- Zingaro, M. Evoluzione Storica Del Popolamento Antico in Agro Di Andria (Puglia). J. Anc. Topogr. 2018, 28, 95–104. [Google Scholar]
- Ashby, T.; Gardner, R. The Via Traiana. Pap. Br. Sch. Rome 1916, 8, 104–171. [Google Scholar] [CrossRef]
- Ruta, R. La via Traiana Tra Canosa Ed Egnazia: Problemi Di Topografia e Di Toponomastica. Atene Roma 1983, 28, 174–179. [Google Scholar]
- Uggeri, G. La Viabilità Romana Nel Salento; Grafischena: Fasano, Italy, 1983. [Google Scholar]
- Wainwright, J.; Turnbull, L.; Ibrahim, T.G.; Lexartza-Artza, I.; Thornton, S.F.; Brazier, R.E. Linking Environmental Régimes, Space and Time: Interpretations of Structural and Functional Connectivity. Geomorphology 2011, 126, 387–404. [Google Scholar] [CrossRef]
- Heckmann, T.; Cavalli, M.; Cerdan, O.; Foerster, S.; Javaux, M.; Lode, E.; Smetanová, A.; Vericat, D.; Brardinoni, F. Indices of Sediment Connectivity: Opportunities, Challenges and Limitations. Earth Sci. Rev. 2018, 187, 77–108. [Google Scholar] [CrossRef]
- Altmann, M.; Haas, F.; Heckmann, T.; Liébault, F.; Becht, M. Modelling of Sediment Supply from Torrent Catchments in the Western Alps Using the Sediment Contributing Area (SCA) Approach. Earth Surf. Process. Landf. 2021, 46, 889–906. [Google Scholar] [CrossRef]
- Jenson, S.K.; Domingue, O. Extracting Topographic Structure from Digital Elevation Data for Geographic Information System Analysis. Photogramm. Eng. Remote Sens. 1988, 54, 1593–1600. [Google Scholar]
- Schwanghart, W.; Scherler, D. Short Communication: TopoToolbox 2—MATLAB-Based Software for Topographic Analysis and Modeling in Earth Surface Sciences. Earth Surf. Dyn. 2014, 2, 1–7. [Google Scholar] [CrossRef]
- Shepard, D. A two-dimensional interpolation function for irregularly-spaced data. In Proceedings of the 1968 23rd ACM National Conference, New York, NY, USA, 27–29 August 1968; pp. 517–524. [Google Scholar] [CrossRef]
- Cevasco, A.; Pepe, G.; Brandolini, P. The influences of geological and land use settings on shallow landslides triggered by an intense rainfall event in a coastal terraced environment. Bull. Eng. Geol. Environ. 2014, 73, 859–875. [Google Scholar] [CrossRef]
- Wilson, M.F.; O’Connell, B.; Brown, C.; Guinan, J.C.; Grehan, A.J. Multiscale terrain analysis of multibeam bathymetry data for habitat mapping on the continental slope. Mar. Geod. 2007, 30, 3–35. [Google Scholar] [CrossRef]
- Perfido, P.; Angiulli, S.; Cascione, V.; Milella, S. Realizzazione Di Un Archivio Informatizzato Di Dati Contenti Tutte Le Informazioni Archeologiche Del Territorio Comunale Di Andria (Ba) Implementate Su Un GIS; Relazione Tecnica; Technical Report: Bari, Italy, 2005. [Google Scholar]
- Belvedere, O. La ricognizione di superficie. Bilancio e prospettive. J. Anc. Topogr. 2010, 20, 31–40. [Google Scholar]
- Dall’Aglio, P. Il Survey e La Ricerca Storico-Topografica. In La Topografia Antica; CLUEB: Bologna, Italy, 2000; pp. 233–240. [Google Scholar]
- Renfrew, C.; Bahn, P.G. Archaeology: Theories, Methods, and Practice, 7th ed.; Thames & Hudson: London, UK, 2016; ISBN 978-0-500-29210-5. [Google Scholar]
- Fornaro, A. La Viabilità. In La Puglia Centrale dall’Età del Bronzo all’Alto Medioevo. Archeologia e Storia. Atti del Convegno di Studi (Bari, 15–16 Giugno 2009); Bretschneider George: Rome, Italy, 2010; pp. 377–382. [Google Scholar]
- Abate, N.; Lasaponara, R. Preventive Archaeology Based on Open Remote Sensing Data and Tools: The Cases of Sant’Arsenio (SA) and Foggia (FG), Italy. Sustainability 2019, 11, 4145. [Google Scholar] [CrossRef]
- Danese, M.; Masini, N.; Biscione, M.; Lasaponara, R. Predictive Modeling for Preventive Archaeology: Overview and Case Study. Open Geosciences 2014, 6, 42–55. [Google Scholar] [CrossRef]
- Charisma Cultural Heritage Academy for Risk Management. Study on Risk Assessment and Management of Cultural Heritage across Europe. In Risk Management for Cultural Heritage; WARREDOC: Perugia, Italy, 2022. [Google Scholar]


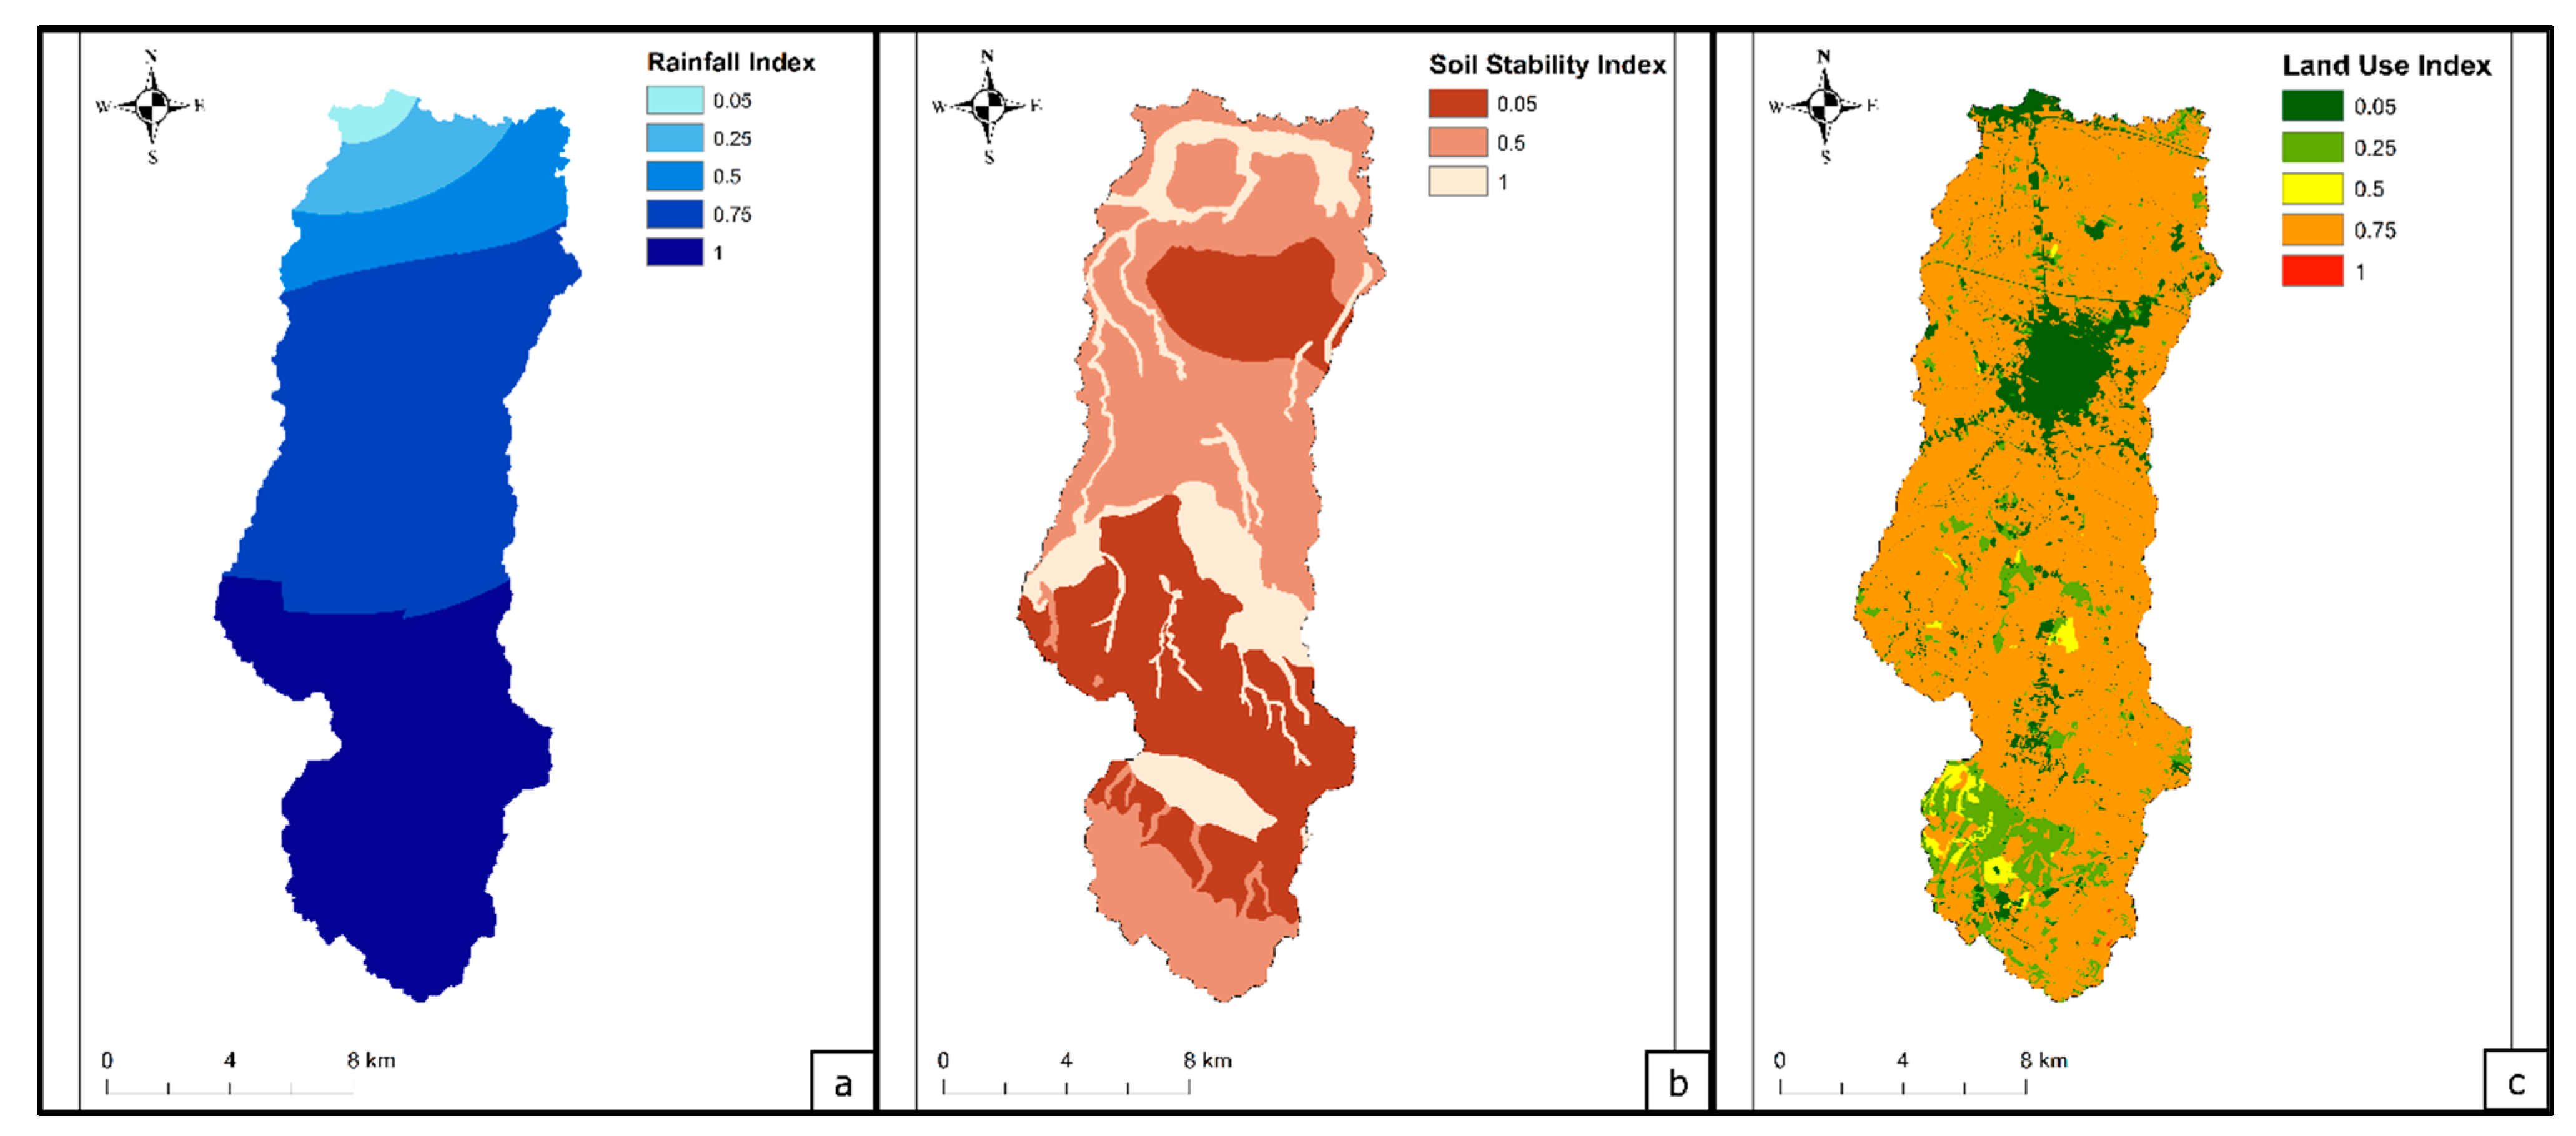
| MAP (mm per Year) | Rainfall Index Value |
|---|---|
| 517–522 | 0.05 |
| 523–541 | 0.25 |
| 542–560 | 0.50 |
| 561–579 | 0.75 |
| 580–598 | 1 |
| Soil Properties | Soil Properties Classes |
|---|---|
| Permeability Classes | |
| 1 | HP |
| 2 | HP |
| 3 | MP |
| 4 | MP |
| 5 | LP |
| 6 | LP |
| Thickness Classes | |
| <100 cm | LT |
| 100–199 cm | MT |
| >199 cm | HT |
| HT | MT | LT | |
|---|---|---|---|
| HP | HS | MS | MS |
| MP | HS | MS | LS |
| LP | MS | MS | LS |
| Soil Stability Classes | Soil Index Value |
|---|---|
| LS | 0.05 |
| MS | 0.5 |
| HS | 1 |
| Land-Use Classes | Land-Use Index Value |
|---|---|
| Urban areas | 0.05 |
| Grassland/pastures/shrubs | 0.25 |
| Woods | 0.50 |
| Croplands | 0.75 |
| Beaches/Poorly vegetated | 1 |
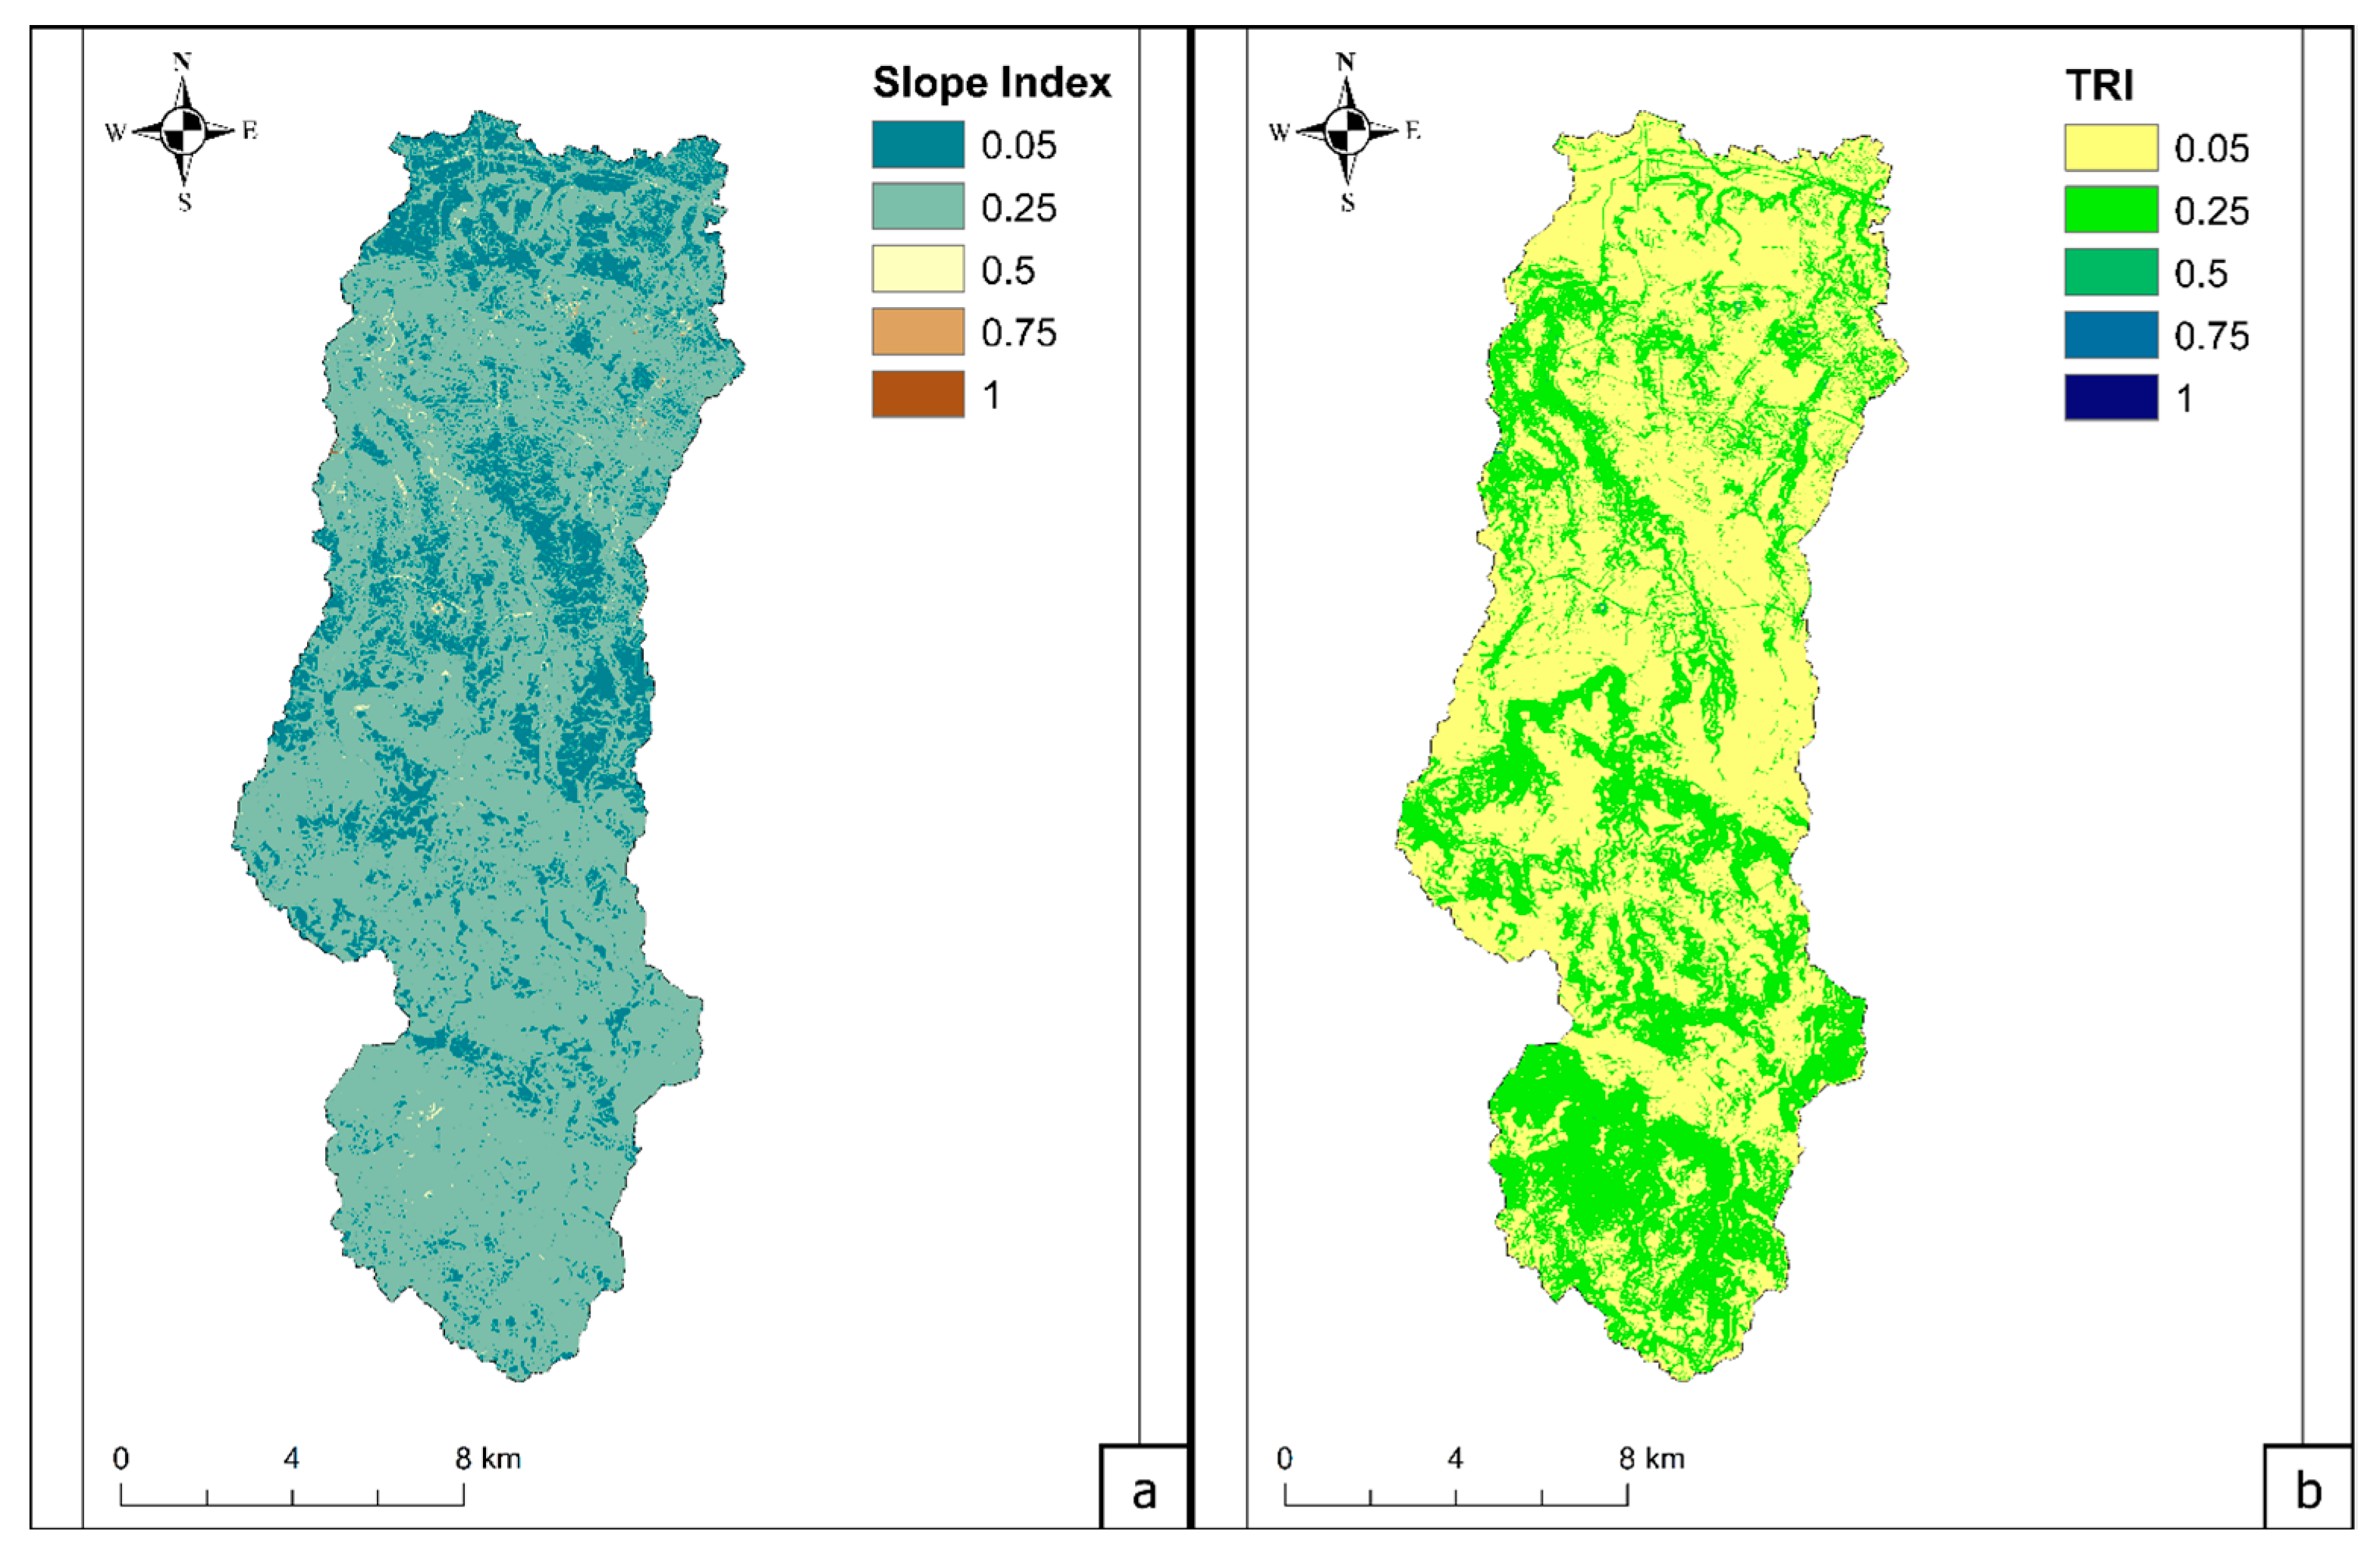
| Slope (Degree) | Slope Index Value |
|---|---|
| 0.00–0.99 | 0.05 |
| 1.00–15.99 | 0.25 |
| 16.00–30.99 | 0.50 |
| 31.00–45.99 | 0.75 |
| 46.00–60.74 | 1 |
| TRI (m) | TRI Value |
|---|---|
| 0.00–0.25 | 0.05 |
| 0.26–3.00 | 0.25 |
| 3.01–6.00 | 0.50 |
| 6.01–9.00 | 0.75 |
| 9.01–12.65 | 1 |
Disclaimer/Publisher’s Note: The statements, opinions and data contained in all publications are solely those of the individual author(s) and contributor(s) and not of MDPI and/or the editor(s). MDPI and/or the editor(s) disclaim responsibility for any injury to people or property resulting from any ideas, methods, instructions or products referred to in the content. |
© 2023 by the authors. Licensee MDPI, Basel, Switzerland. This article is an open access article distributed under the terms and conditions of the Creative Commons Attribution (CC BY) license (https://creativecommons.org/licenses/by/4.0/).
Share and Cite
Zingaro, M.; Scicchitano, G.; Palmentola, P.; Piscitelli, A.; Refice, A.; Roseto, R.; Scardino, G.; Capolongo, D. Contribution of the Sediment Flow Connectivity Index (SfCI) in Landscape Archaeology Investigations: Test Case of a New Interdisciplinary Approach. Sustainability 2023, 15, 15042. https://doi.org/10.3390/su152015042
Zingaro M, Scicchitano G, Palmentola P, Piscitelli A, Refice A, Roseto R, Scardino G, Capolongo D. Contribution of the Sediment Flow Connectivity Index (SfCI) in Landscape Archaeology Investigations: Test Case of a New Interdisciplinary Approach. Sustainability. 2023; 15(20):15042. https://doi.org/10.3390/su152015042
Chicago/Turabian StyleZingaro, Marina, Giovanni Scicchitano, Paola Palmentola, Arcangelo Piscitelli, Alberto Refice, Rodolfo Roseto, Giovanni Scardino, and Domenico Capolongo. 2023. "Contribution of the Sediment Flow Connectivity Index (SfCI) in Landscape Archaeology Investigations: Test Case of a New Interdisciplinary Approach" Sustainability 15, no. 20: 15042. https://doi.org/10.3390/su152015042