
Source Analysis Based on the Positive Matrix Factorization Models and Risk Assessment of Heavy Metals in Agricultural Soil

1
School of Environment Science and Spatial Informatics, China University of Mining and Technology, Xuzhou 221116, China
2
Jiangsu Key Laboratory of Resources and Environmental Information Engineering, China University of Mining and Technology, Xuzhou 221116, China
*
Author to whom correspondence should be addressed.
Sustainability 2023, 15(17), 13225; https://doi.org/10.3390/su151713225
Submission received: 19 July 2023
/
Revised: 21 August 2023
/
Accepted: 24 August 2023
/
Published: 4 September 2023
(This article belongs to the Section Health, Well-Being and Sustainability)
Abstract
:Soil heavy metal pollution is a severe and growing problem, and it is crucial to assess the level of soil heavy metal contamination and determine the origins of pollutants. However, there is limited research on soil heavy metal source apportionment and its carcinogenic and non-carcinogenic hazards. Positive Matrix Factorization (PMF) is a powerful technique for source apportionment of pollutants in environmental matrices such as atmospheric particulate matter and soil, as it can handle missing and imprecise data to ensure data reliability, among other benefits. In order to explore the distribution characteristics and main sources of heavy metals in agricultural land, the contents of Cd, Cr, Cu, Pb, and Ni were collected and determined. The positive matrix factorization (PMF) model was used to analyze the source of heavy metals in the soil in the study area, and the human health risk evaluation was carried out. The results showed that (1) the coefficient of variation of Cd in the four areas was much higher than that of the other four heavy metals, which showed strong variability; (2) the content and distribution of heavy metals in different regions were different under the influence of different environments; (3) the PMF model analysis showed that the heavy metal pollution sources in the four areas were divided into two types: the soil parent material, which had industrial pollution, traffic pollution, and agricultural pollution; and the contribution rate of each pollution source; (4) the non-carcinogenic risks of heavy metals in children at all points in the study area were greater than those of adults, and the carcinogenic risks were the opposite of the carcinogenic risk in the study area. And the most serious carcinogenic risk in the study area was the harm caused by oral ingestion of heavy metal Cr into the adults’ bodies.
1. Introduction
In recent years, heavy metal pollution in soil has attracted great attention [1]. As, Cd, Ni, Cu, Hg, and Pb in 19.4% of agricultural soil samples in China were contaminated with different degrees of heavy metals [2]. Because of its ecotoxicity, non-degradability, and persistence, it brings detrimental effects to the environment and human health [3,4,5,6].
At the same time, soil heavy metal pollution has the characteristics of concealment [7]. Due to the complexity and diversity of soil, the distribution of heavy metals in soil presents high spatial variability and source uncertainty, which leads to great difficulties in the study of soil source analysis [8]. There are two main methods for soil heavy metal source analysis: qualitative and quantitative. Up to now, a complete and systematic analysis method system has not been established. The research on source analysis of heavy metals in soil has shown a fold increase since 2010. The main used methods include [9,10,11] absolute principal component score/multiple linear regression, principal component multiple linear regression, principal factor analysis/multiple linear regression (FA/MLR), and positive matrix factorization (PMF). Additionally, several isotopic tracing methods are implemented to identify the sources of contamination. Ai et al. [12] used the UNMIX model to analyze four pollution sources of soil samples from Jipi Gully gold mine in the upper reaches of Songhua River. The results of the UNMIX model were consistent with the local land use types, human activities, and distribution of Cd, Hg, and Pb contents. When using the model, components with fewer missing values should be selected as much as possible; otherwise, it will have some impact on the model results. Zhu et al. [13] used multivariate statistical analysis and the lead isotopic ratios method to identify the sources of heavy metal pollution in topsoil samples from Beijing Capital Iron and Steel Factory and its surrounding areas. The results showed that the heavy metals in the soil mainly came from anthropogenic factors such as industrial activities, traffic emissions, and atmospheric deposition, among which the main source of lead was the dust generated during the steel production process. However, the isotopic ratios method can only trace back to specific pollutants, and the number of pollution sources that can be analyzed is limited. The sample pretreatment is also costly.
PMF has the ability to accurately determine the significant factors and contributions, based on the assumption of mass conservation and chemical mass balance between the emission source and acceptor [14,15]. PMF can limit the factor matrix to a range of non-negative values to obtain more meaningful factors [16].
PMF is widely used in various fields. In terms of air pollution control, Dai et al. [17] and Li [18] used PMF models to analyze the Chinese atmosphere and derive its main characteristics and sources. In terms of VOC pollution control, Su et al. [19] used PMF to analyze the data of VOCs for one year and found that the petroleum complex was the largest source of single volatile organic compounds in the local area. Regarding the control of heavy metal pollution in soil, Chen et al. [20] utilized the PMF model and determined that the contamination of Cd and Cr in the soil was severe. The main sources of this pollution were identified as local zinc smelting, agricultural production, and coal usage. Ling et al. [21] combined PMF models with geostatistical analysis for source identification, and the findings emphasized the importance of considering waste industrial legacy when developing risk reduction strategies in the area. Wang et al. [22] verified the accuracy of PMF source contribution analysis with correlation analysis and principal component analysis. Qiao et al. [23] used PMF analysis to identify four main pollution sources in Beijing, and the results showed that PMF resolved the four factors to be stable and appropriate. Yin et al. [24] analyzed the source of heavy metal elements in the soil of Guangzhou and found that the PMF model can identify an agricultural source that has not been recognized by the other three receptor models. And it could better distinguish different types of pollution sources. All these show that the PMF model has unique advantages of processing and optimizing data.
Ecological risk assessment is essential for heavy metals in soils that alter soil ecosystems [25]. Heavy metals enter the human body through the food chain and pose a serious threat to human health [26,27]. Soil risk assessment is mainly used for the risk management of toxic and harmful chemicals and the risk assessment of soil heavy metals in environmental fields, mostly from the perspective of soil safety, and gradually changes into the safety perspective of soil and agricultural products [28]. Albert et al. [29] first proposed the problem of predicting the toxicity of complex mixtures, generally ignoring synergies between substances that may weaken or increase potential risk when considering the sum of individual and potential toxicity risks. Chen et al. [30] found that the more complex the contaminant mixture, the greater the co-toxicity. Wierzbicka et al. [31] found that although the single concentration of each pollutant did not exceed the limit value, the mixed pollutants had a highly toxic effect on organisms. The applicability of the combined toxicological method under specific conditions was limited and the data could not be generalized [32]. The health risk assessment model [33] developed by USEPA was used to evaluate the non-carcinogenic and carcinogenic risk of heavy metals entering human health in the study area.
Heavy metals can potentially cause harm to humans and ecosystems. Conducting source analysis can help us identify the sources and migration paths of heavy metals in soil, which is crucial for developing effective response measures. These efforts not only protect human health and ecological safety, but also provide a solid foundation for sustainable development.
In this study, we initially assumed the following: “Environmental factors influence the content and distribution of heavy metals in soil, which are also related to soil parent material, land use type, and human activities. These factors pose a threat to human health. The PMF model can identify different sources of pollution in soil.” The objectives of this study were to (1) measure the content of heavy metals and analyze their distribution characteristics, (2) use the PMF model to analyze soil heavy metal sources and determine the source of pollution, (3) evaluate soil heavy metal risks based on human health risks, and (4) evaluate the harm that heavy metals may cause to human bodies.
2. Materials and Methods
2.1. Description of the Study Area
Xuzhou is located in the southeast of the North China Plain and northwest of Jiangsu Province. The terrain of the plain of Xuzhou covers the largest area, reaching 90%, and belongs to the warm temperate semi-humid monsoon climate. The annual average temperature and annual average frost-free period in Xuzhou are 14 °C and 200~220 d, respectively. The average annual precipitation is 800~930 mm, with the rainy season precipitation accounting for 56% of the total precipitation [34]. The ground elevation of Xuzhou is about 39.5 m. Its lithology is mainly sub-sand, silty sand, and medium and fine sand, and the seismic intensity is 7.0 m. In the sampling area, area 1, area 2, and area 3 contain leaching brown soil, and area 4 contains sandy soil. The background values of the five heavy metals Cr, Ni, Cu, Cd, and Pb are 55.50 mg/kg, 32.80 mg/kg, 12.61 mg/kg, 0.29 mg/kg, and 16.30 mg/kg, respectively [35].
2.2. Sample Collection and Analysis
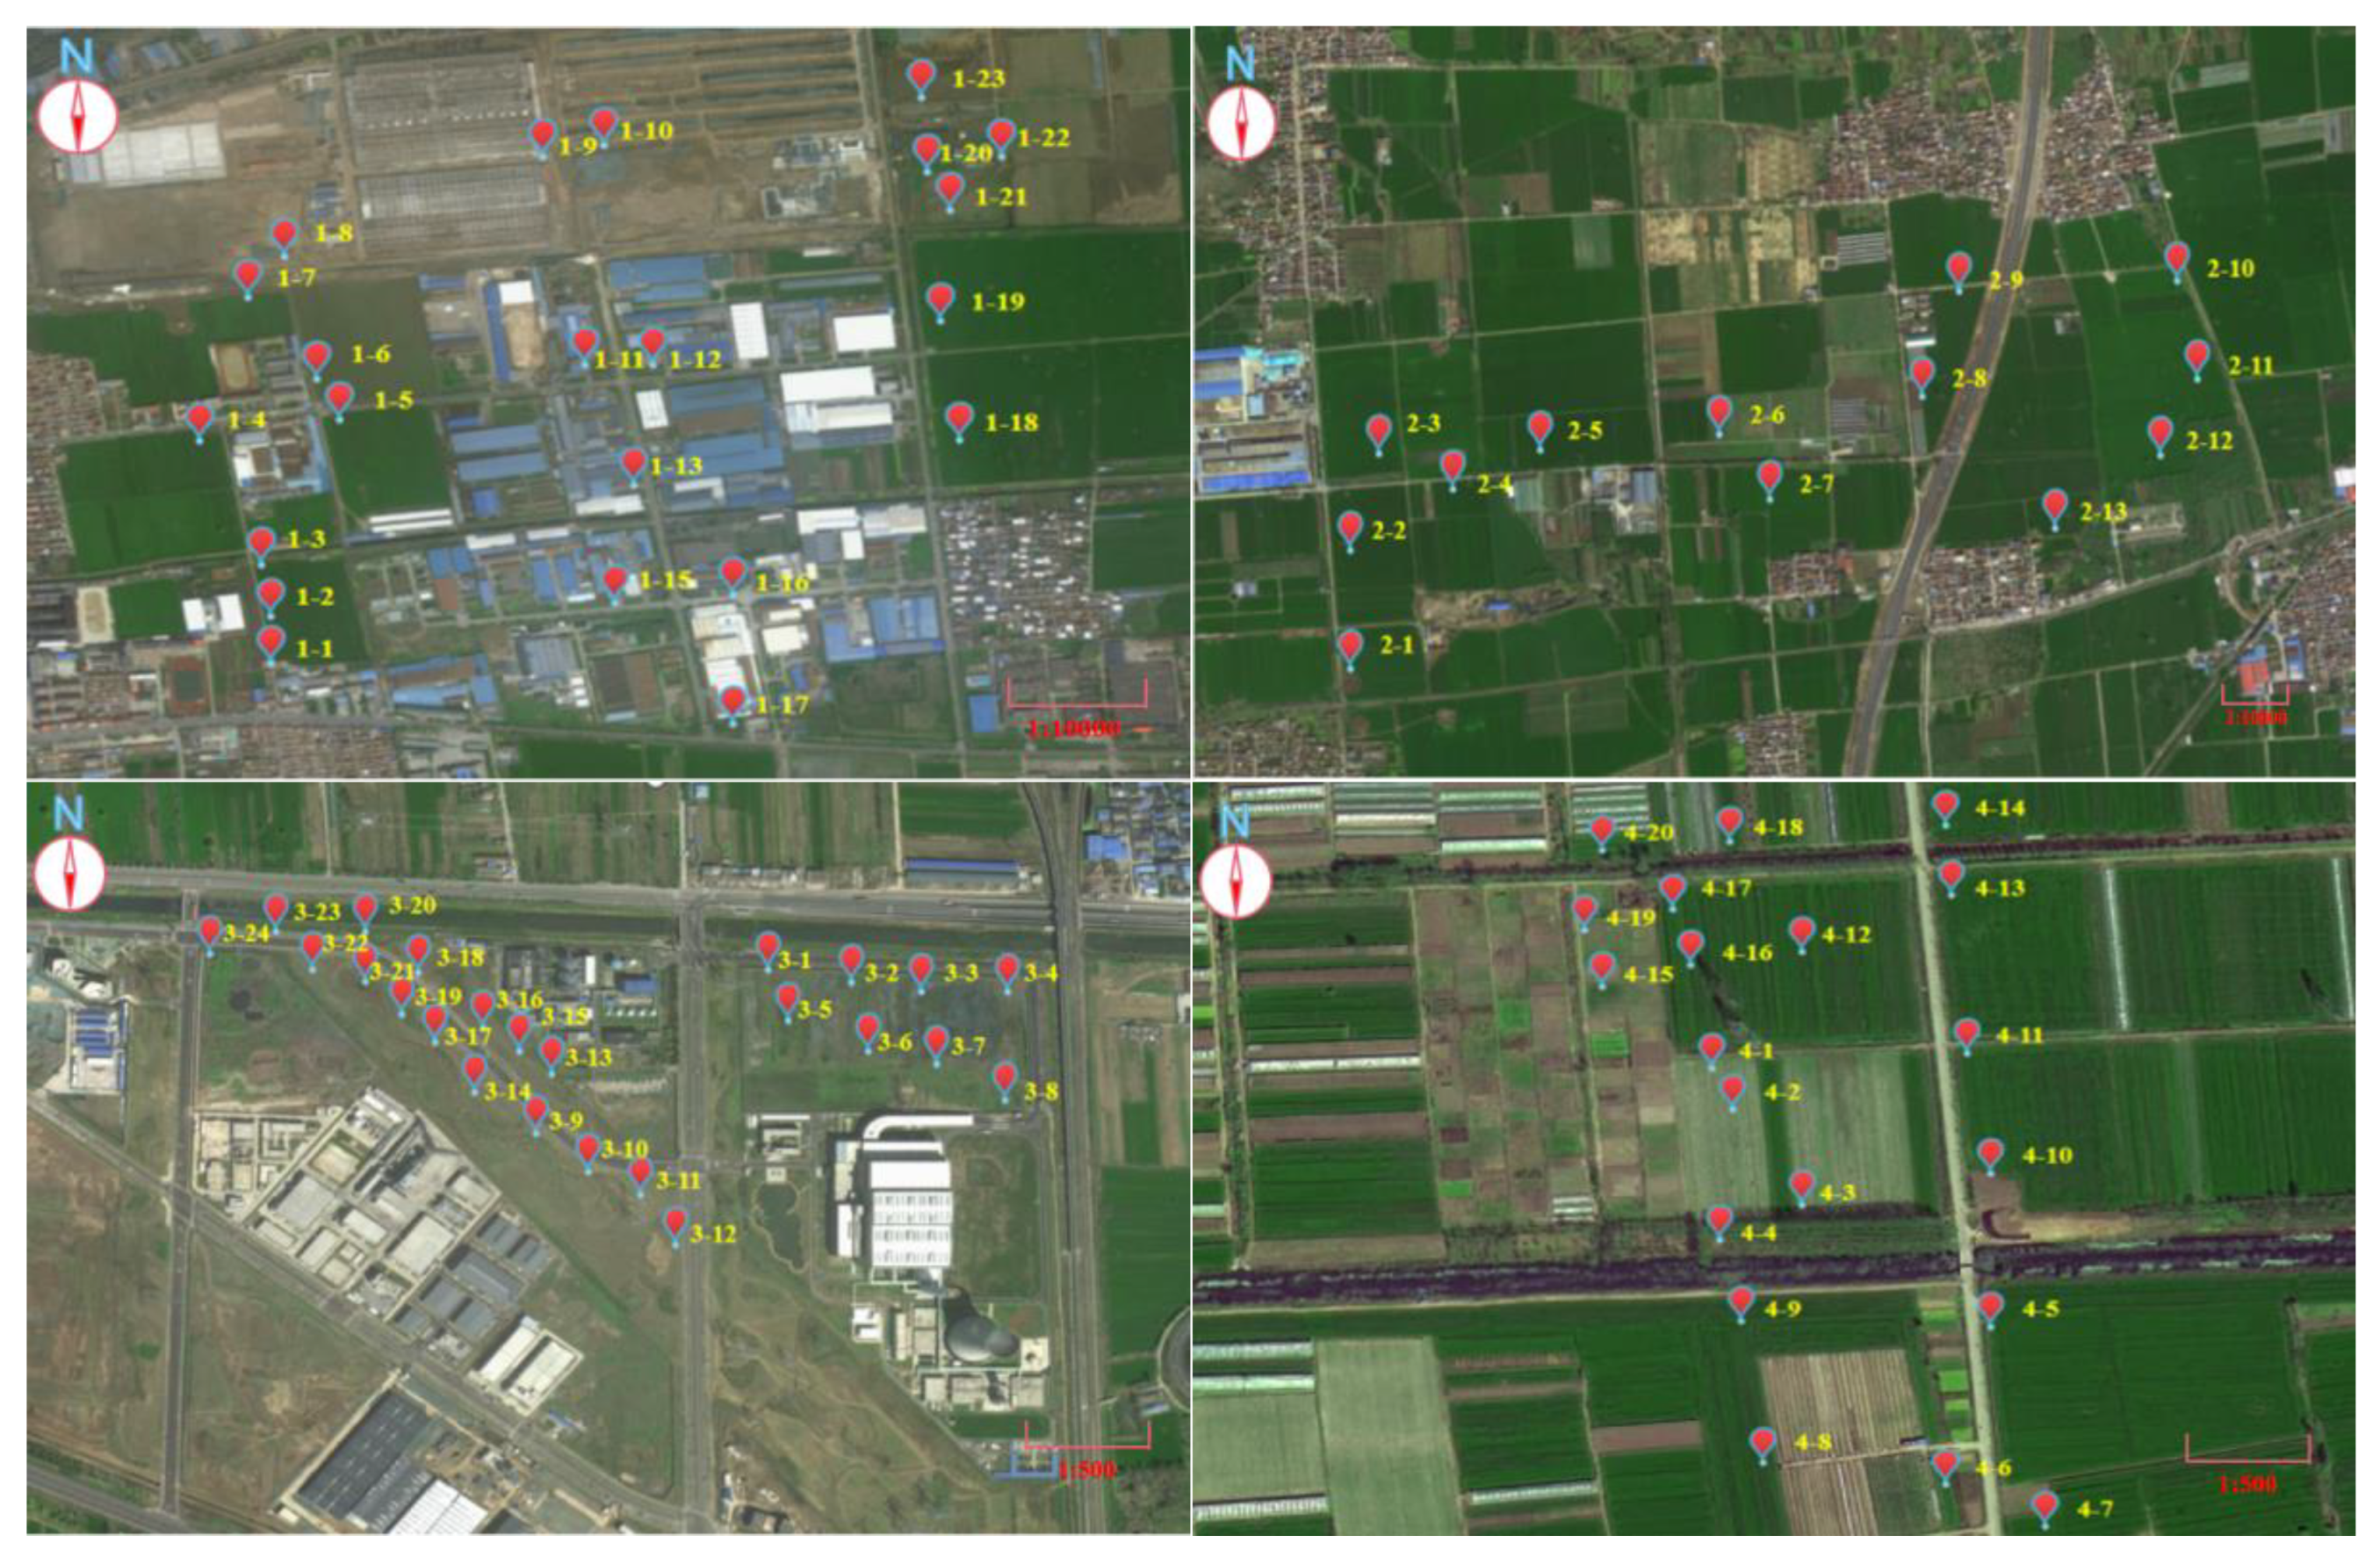
The layout of sampling points and the sample collection for the soil pollution investigation of agricultural land were subject to HJ/T 166 technical specifications in this paper. The soil samples collected were mixed. The sampling depth was 0–20 cm, with a total of 79 sampling points. Among them, 23, 13, 24, and 19 sampling points were deployed in areas 1, 2, 3, and 4, respectively. The specific sampling diagram is shown in Figure 1.
Area 1 is surrounded by many industrial plants, there are more varieties of crops in agricultural land, and the research area is about 3100 hectares. Area 2 is agricultural land, far from rural and industrial plant areas, and the crops are mainly wheat and corn, with a research area of about 2800 hectares. Area 3 is located around a treatment plant. The land is dominated by weeds, representing the agricultural land of the only treatment plant in the surrounding area, and the study area is about 29 hectares. Area 4 is also agricultural land. The sampling point in Area 4 is far from the road. The crop is rice, and the study area is about 3.6 hectares.
After the soil mixture sample was air-dried, gravel and weeds were removed. The ground sample was sieved using a 100-mesh sieve. The sample was dried to constant weight in a dryer. The treated sample was placed in a ziplock bag sealed for use, and the analysis method was carried out according to “Soil Environmental Quality Standard for Soil Pollution Risk Control of Agricultural Land (Trial)”, National Standard of the People’s Republic of China GB15618–2018, 2018.
The soil samples to be tested were placed in crucibles, and hydrochloric acid, nitric acid, hydrofluoric acid, and perchloric acid were added in a 3:1:3:1 ratio to the crucible. The soil samples were digested completely with these acids. After digestion, the samples were filtered and made up to a precise volume for measurement. All the acids used for digestion were analytical grade. An Agilent Technologies LA-ICP-MS (NWR 213–7900, ESI, America) was employed to measure the total content of heavy metals in the soil (LA-ICP-MS is suitable for the detection of soil digestion solutions with low salt root ion content). The maximum value of the relative standard deviation (RSD) of the determination of heavy metal data in this paper was 5.49, and 82.6% of the RSD did not exceed 1.8, which was highly accurate. In the process of experimentation, a sample was randomly selected as a standard sample for sampling and testing of every ten samples, and all test samples were subtracted from the blank sample as the final value of the sample. And the sample was compared with the reference material during the test to ensure the reliability and accuracy of the test results.
The data of heavy metals were analyzed and calculated by using Excel and IBM SPSS Statistics 20 software. The sources of heavy metals were apportioned by using EPA PMF 5.0 software. The graphs were drawn by using Origin 2022 software.
2.3. PMF Model
The PMF model was used to study the source analysis of areal soil heavy metal pollution, and the main methods are illustrated by Equations (1)~(4):
where Xij is the content of the jth element in the ith sample, Gik is the relative contribution of the sample to the contribution rate of the kth contamination source in sample i, Fkj is the characteristic value of pollution source k for the jth concentration of heavy metals, Eij is the residuals and P is the number of factors, and i, j, and k = 1, 2, 3, …. The original matrix X is decomposed by the PMF model to obtain the optimized matrices F and G, the objective function Q is minimized, and the Q formula is as follows:
Among them, Uij is the magnitude of the uncertainty of the jth element content of the ith sample. This model weights each data point and assigns an appropriate uncertainty size to each data point, when the element concentration is less than or equal to the corresponding method detection limit. The equation is
Otherwise,
where δ is relative standard deviation, C is the concentration of heavy metal elements, and MDL is the Detection method limit. This analysis used USEPA’s software PM5.0, increased the number of factors by 3–6, set the number of operations to 20, and randomly selected points to run the PMF model.
2.4. Risk Assessment of Heavy Metals in Soil
The calculation equations of soil heavy metal risk assessment based on the human health risk method are as follows:
Among these variables, CDI represents the daily exposure measurement in milligrams per kilogram of body weight per day (mg/(k·d)). PM10 is the concentration of atmospheric particulate matter in the study area, measured at 0.096 mg/m3. MPM represents the concentration of heavy metals found in airborne particulate matter, assumed to be equivalent to soil heavy metal concentration. ET stands for exposure time, measured at 0.56 hour per day for children and 3.3 hours per day for adults. IRair denotes the average daily intake of air, measured at 9.7 m3/day for children and 15.7 m3/day for adults. EF represents exposure frequency (350 days per year), while ED represents the duration of exposure (9 years for children and 30 years for adults). Csoil stands for soil heavy metal concentration in milligrams per kilogram (mg/kg), and SA represents soil contact area, measured at 8880 cm2/day for children and 16,000 cm2/day for adults. PE represents the proportion of skin that comes into contact with soil (39.3%), AF represents the soil adhesion factor (0.2 for children and 0.07 for adults), and ABS is the skin absorption efficiency factor (0.001 for As and 0.03 for non-carcinogenic substances). BW refers to body weight, measured at 23.24 kg for children and 60.6 kg for adults. AT represents the average contact time with soil (70·365 days for carcinogenic substances and ED·365 for non-carcinogenic substances), IRsoil indicates the per-capita soil intake (87 mg/day for children and 50 mg/day for adults), and PEF is the particulate matter emission factor (1.36·109 m3/kg).
where HQ is dangerous entropy, RfD is the reference dose of heavy metals, and HI is the overall potential risk index (HI > 1, non-carcinogenic risk may occur).
Among them, CR is the probability of carcinogenic risk, TCR is the total probability of carcinogenic risk, and CSF is the carcinogenic intensity coefficient for each heavy metal. When CR < 10−6, the area is not carcinogenic. When 10−6 < CR < 10−4, the area has an acceptable carcinogenic risk. When CR > 10−4, the area is more likely to have cancerous risk [36]. The reference doses are shown in Table 1.
2.5. Coefficient of Variation
The degree of variation is divided into weak variability, moderate variability, and strong variability. The sample has weak variability when the coefficient of variation (CV) < 10%, moderate variability when 10% < CV < 100%, and strong variability when the CV > 100% [37].
3. Results
3.1. Characteristics of Soil Heavy Metal Content in the Study Area
The statistical results of soil heavy metal content parameters in four areas are shown in Table 2.
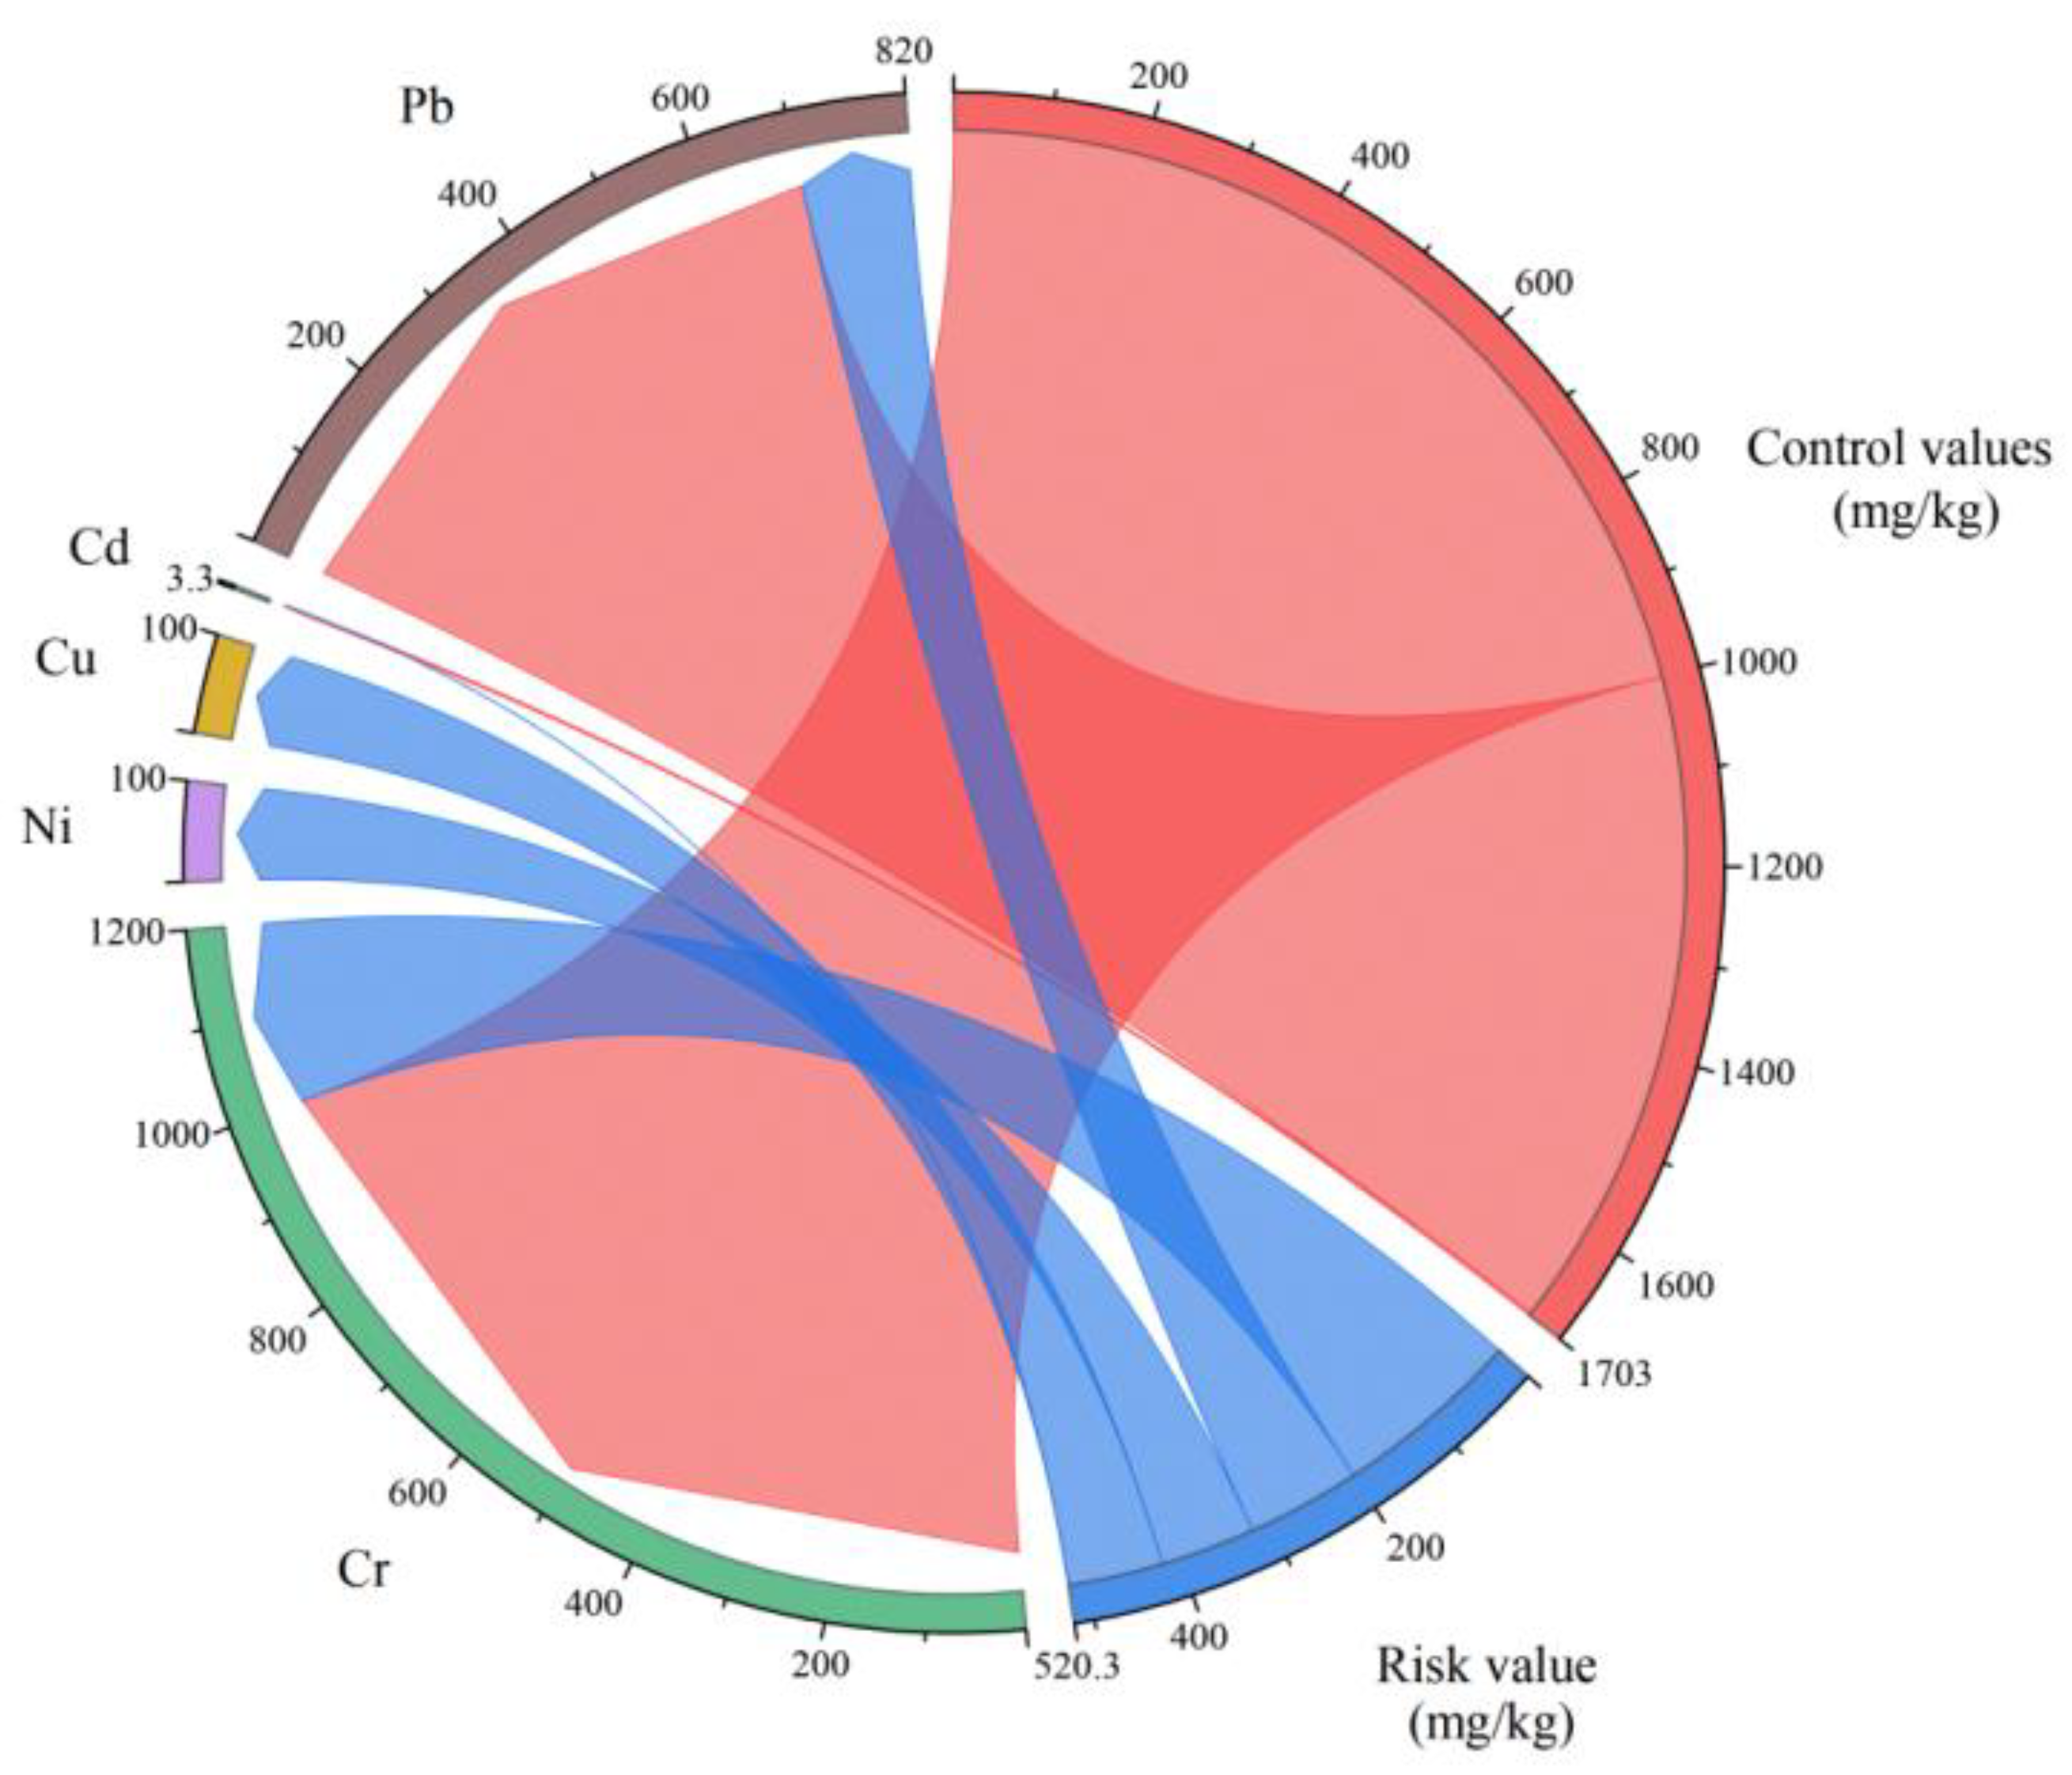
As shown in Table 2 and Figure 2, Cd’s average values in four areas all exceeded the risk value. Except for Cd, the other heavy metals’ averages were within the risk value. But within the control value, there may be edible agricultural products that do not meet food quality and safety standards, and in principle, agronomic regulation, alternative planting, and other measures should be taken.
The CVs of Cr in the four areas were 0.312, 0.254, 0.146, and 0.099, respectively. The CVs for Ni were 0.187, 0.179, 0.137, and 0.107, respectively. The CVs of Cu were 0.2, 0.156, 0.249, and 0.134, respectively. The CVs of Cd were 2.008, 1.222, 1.818, and 1.076, respectively. The CVs of Pb were 0.231, 0.381, 0.114, and 0.117, respectively. The order of the CVs of heavy metals in area 1 was Cd > Cr > Pb > Cu > Ni. Cd was strongly variable, and Cr, Pb, Cu, and Pb had medium variability in area 1. The CVs of heavy metals in area 2 were Cd > Pb > Cr > Ni > Cu, where Cd had strong variability and Cr, Pb, Cu, and Pb had medium variability. The order of the CVs of heavy metals in area 3 was Cd > Cu > Cr > Ni > Pb, where Cd and Pb had strong variability, and heavy metals Cr, Ni, and Cu had medium variability. The CVs of heavy metals in area 4 were as follows: Cd > Cu > Pb > Ni > Cr. Cd had strongly variability. Ni, Cu, and Pb had medium variability, and Cr had weak variability in area 4.
There was no apparent pattern in the average values of heavy metals in different regions. Cr and Cd showed an increasing trend from Area 1 to Area 4, while Ni and Cu showed a decreasing trend. This suggested that the content and distribution of heavy metals in different regions varied due to the influence of different environmental factors. The results of the standard deviation showed that the data fluctuated greatly, which also proved that environmental factors could affect the distribution of heavy metal content.
3.2. The Factor Contribution Rate Based on PMF
The four areal factors and contribution rates are shown in Table 3:
With the exception of area 4, the remaining three areas were all affected by three factors. And the contribution rate of the three factors to a certain heavy metal in some areas was 0, which was related to the different environment. In addition, in terms of Cr, the contribution rate of factor 1 in the four areas was ranked as area 4 > area 1 > area 2 > area 3. The contribution rate of factor 2 was ranked as area 3 > area 1 > area 4 > area 2. And the contribution rate of factor 3 was area 2 > area 3 > area 1, where the contribution rate of factor 3 to Cr in Area 1 was 0. The highest contribution rate was that of factor 2 to Cd in area 2 of 100%, indicating that Cd in this area was only affected by factor 2. The lowest contribution rate was 0 and up to 6, of which, in three areas (except area 4), the contribution rate of each factor to Cd was 0.
3.3. Soil Heavy Metal Risk Assessment
The average, maximum, minimum, and standard deviation of the overall potential risk index for different exposed groups at different exposure routes were calculated as shown in Table 4:
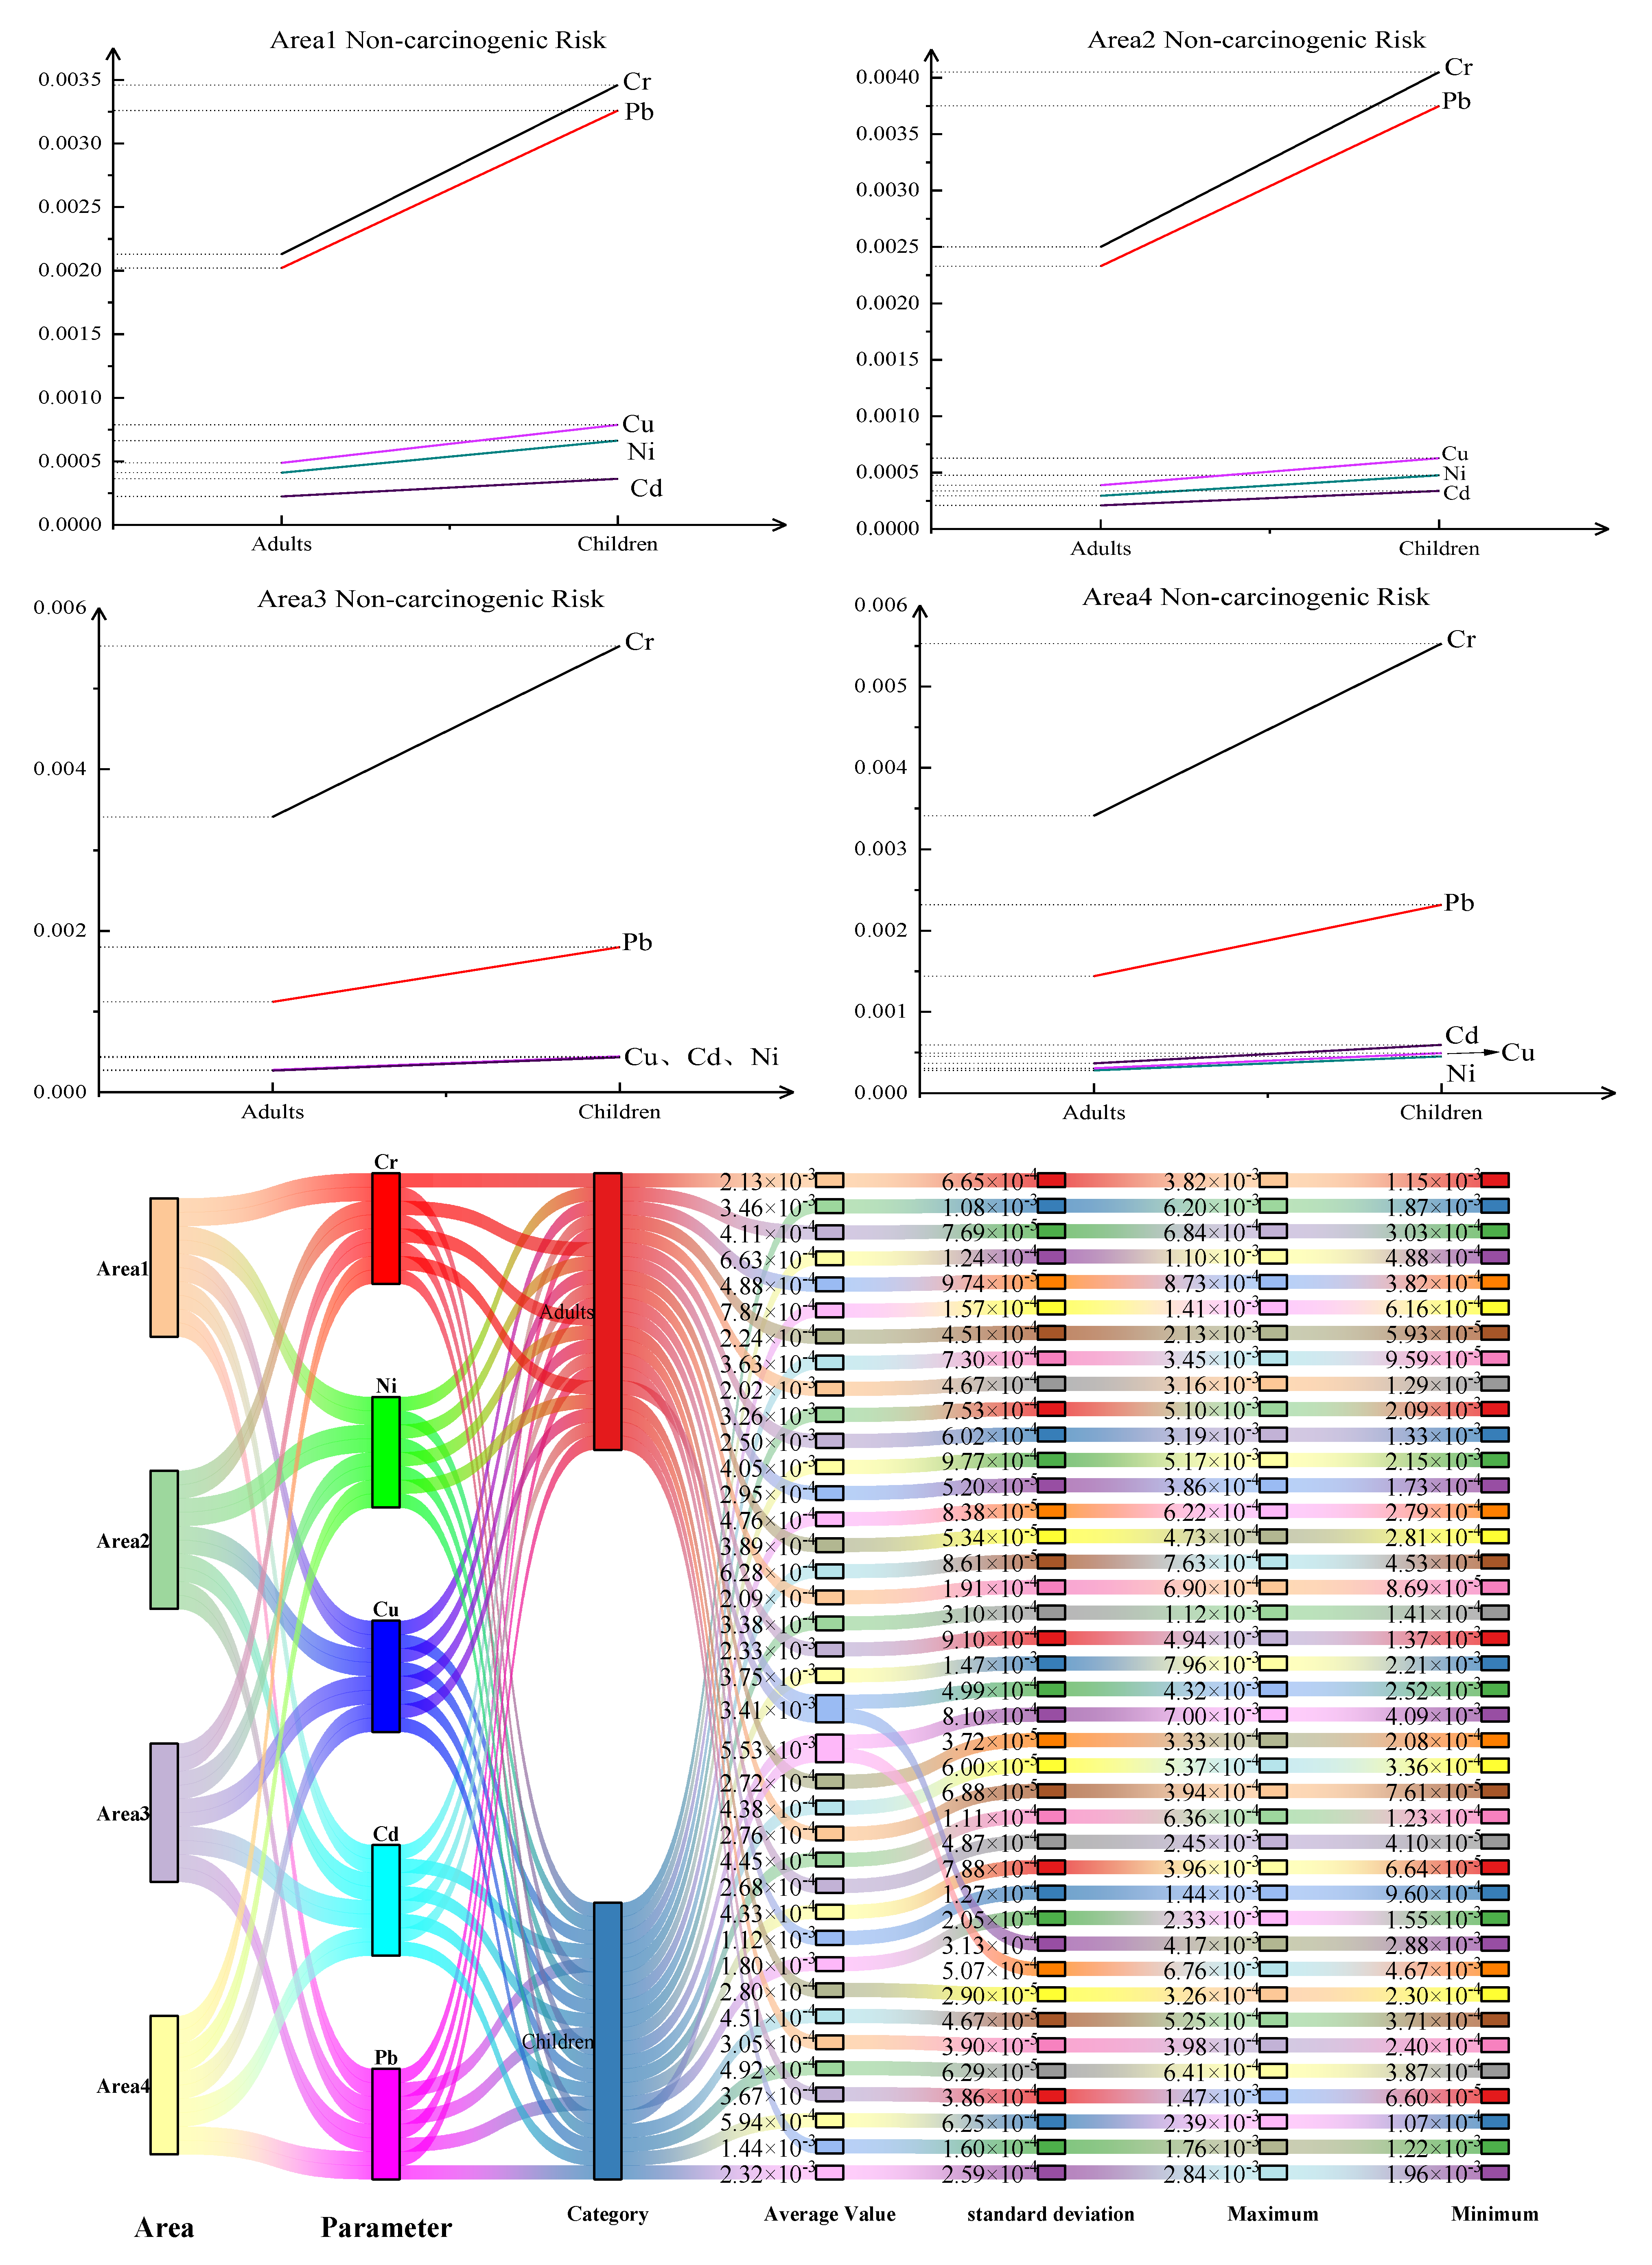
The average HI of heavy metals in each area was 5.53 × 10⁻³, which was the overall potential risk index of Cr in children in area 4. The minimum mean HI was 2.09 × 10⁻⁴, which was the overall potential risk index of Cd in adults in area 2. The maximum value of HI in all zone points was 7.96 × 10⁻³, where the overall potential hazard index of Pb was 2–7 in area 2. The minimum value of HI in all zone points was 4.10 × 10⁻⁵, where the overall potential hazard index of Cd was 3–11 in area 2.
4. Discussion
4.1. Analysis of Soil Heavy Metal Content and Differences in the Study Area
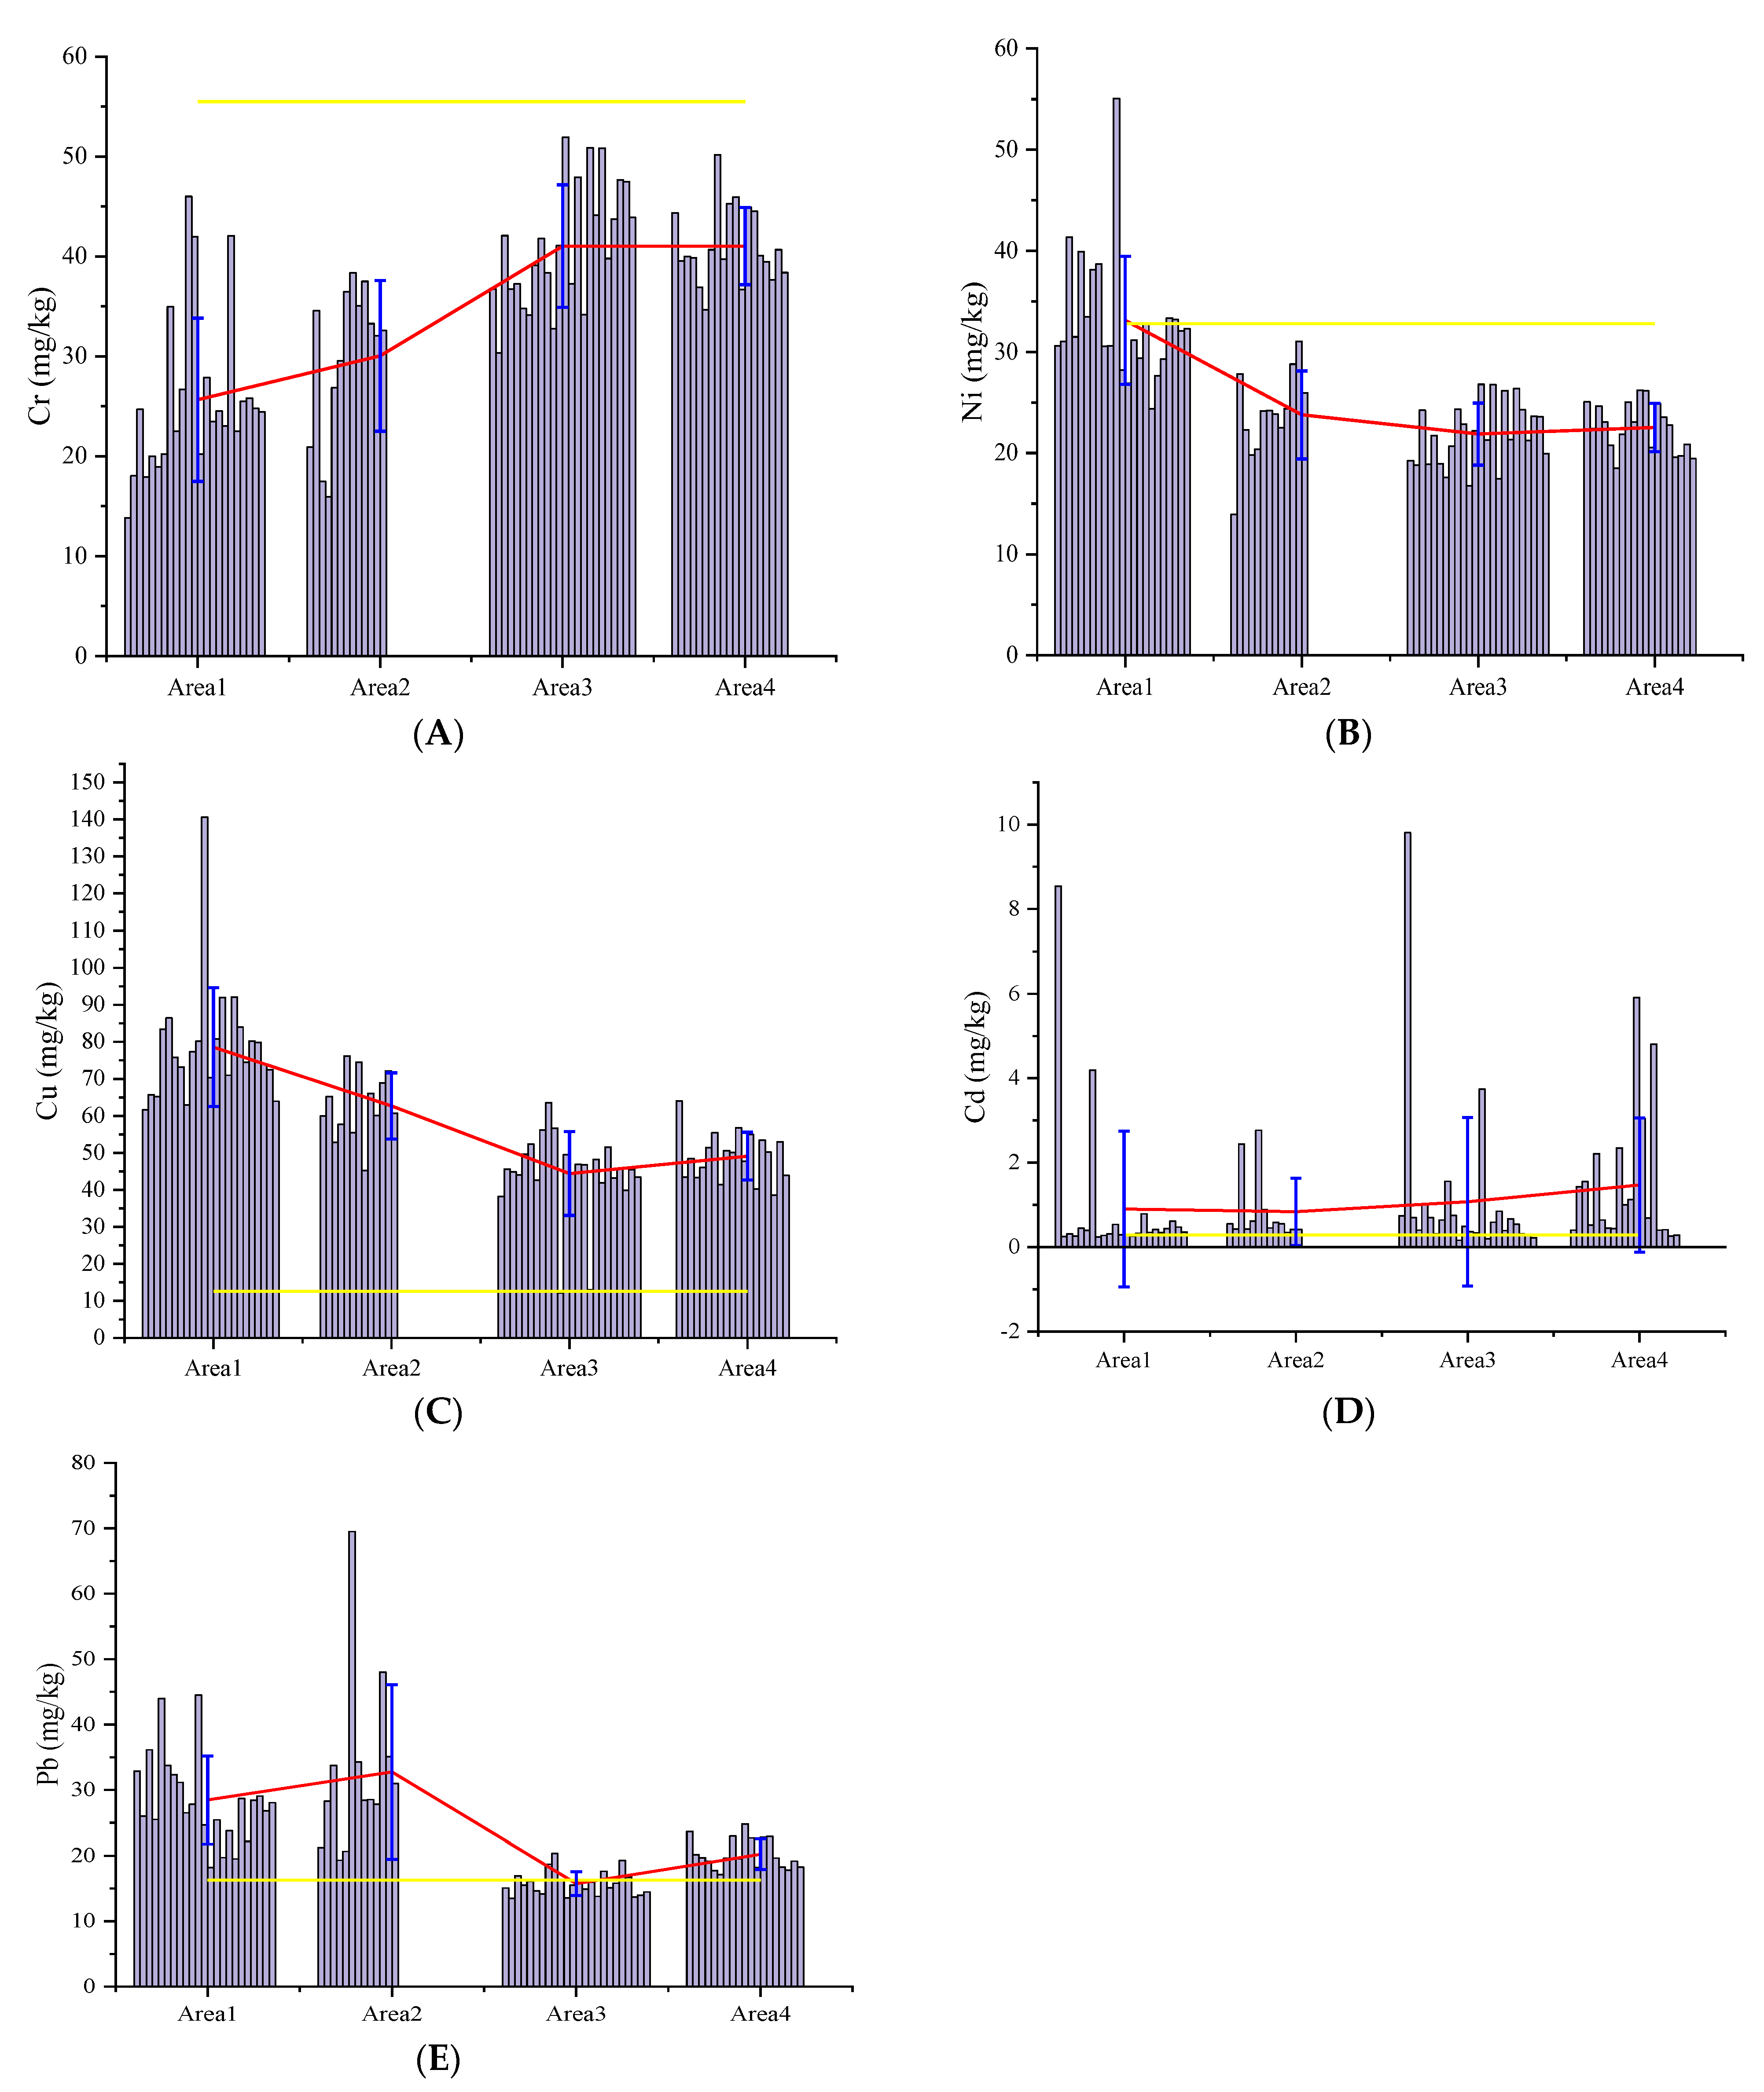
It can be seen from Table 2 that the CV of Cd in the four areas was much higher than those of the other four heavy metals, and the coefficients of variation of the other four heavy metals were less different. It is preliminarily believed that human activities have a greater impact on the distribution difference of Cd content in soil [38] and have little effect on the distribution difference of Cu, Ni, Pb, and Cr in soil. There was no obvious regularity in the average values of heavy metals in each area. Cr and Cd showed an increasing trend from area 1 to area 4, while Ni and Cu showed a downward trend, which indicated that the content and distribution of heavy metals in different areas were diverse due to the influence of divergent environmental effects. We further carried out statistical analysis of the content of different heavy metals in four areas, and the content of each area is shown in Figure 3.
It can be seen from Figure 3 that the Cr did not exceed the soil background value, indicating that there was no Cr pollution in the area. Cu, Cd, and Pb all greatly exceeded the soil background value, and the accumulation of heavy metals was serious. This is consistent with the results from collecting data to conduct a risk assessment of heavy metals in Chinese soil [39].
Some points of Ni in area 1 exceeded the soil background value, and the average value was slightly larger than the soil background value, which was due to the accumulation of Ni at some points because of the large number of surrounding industrial plants. In addition, the Cu, Cd, and Pb contents of area 1 greatly exceeded the soil background value, and there was heavy metal accumulation. The Cr and Ni contents and mean values of area 2 were lower than the soil background values, and the average values of Cu, Cd, and Pb exceeded the soil background values. Area 2 is agricultural land. Although it is far from the sources of pollution in rural and industrial plants, the agricultural land is mainly wheat and corn, which might be due to the accumulation of heavy metals caused by long-term irrigation. The average content of Cu, Cd, and Pb in area 3 exceeded the soil background value. Ni and Cr did not accumulate. Area 3 is located around the plant area, and the accumulation of the former may be related to pollution from the treatment plant. The average Cr and Ni content of area 4 was lower than the soil background value, while the average content of Cu, Cd, and Pb was higher than the soil background value. Area 4 is far from the road and has no influence on automobile exhaust, so the content of Cr and Ni was low. The crops in area 4 were rice. Although the Cu, Cd, and Pb contents exceeded the soil background value, they were all lower than those in area 2, which also indicated that rice had an absorption effect on Cu and Pb content.
4.2. Research on Pollution Source Analysis and Risk Assessment based on PMF Method
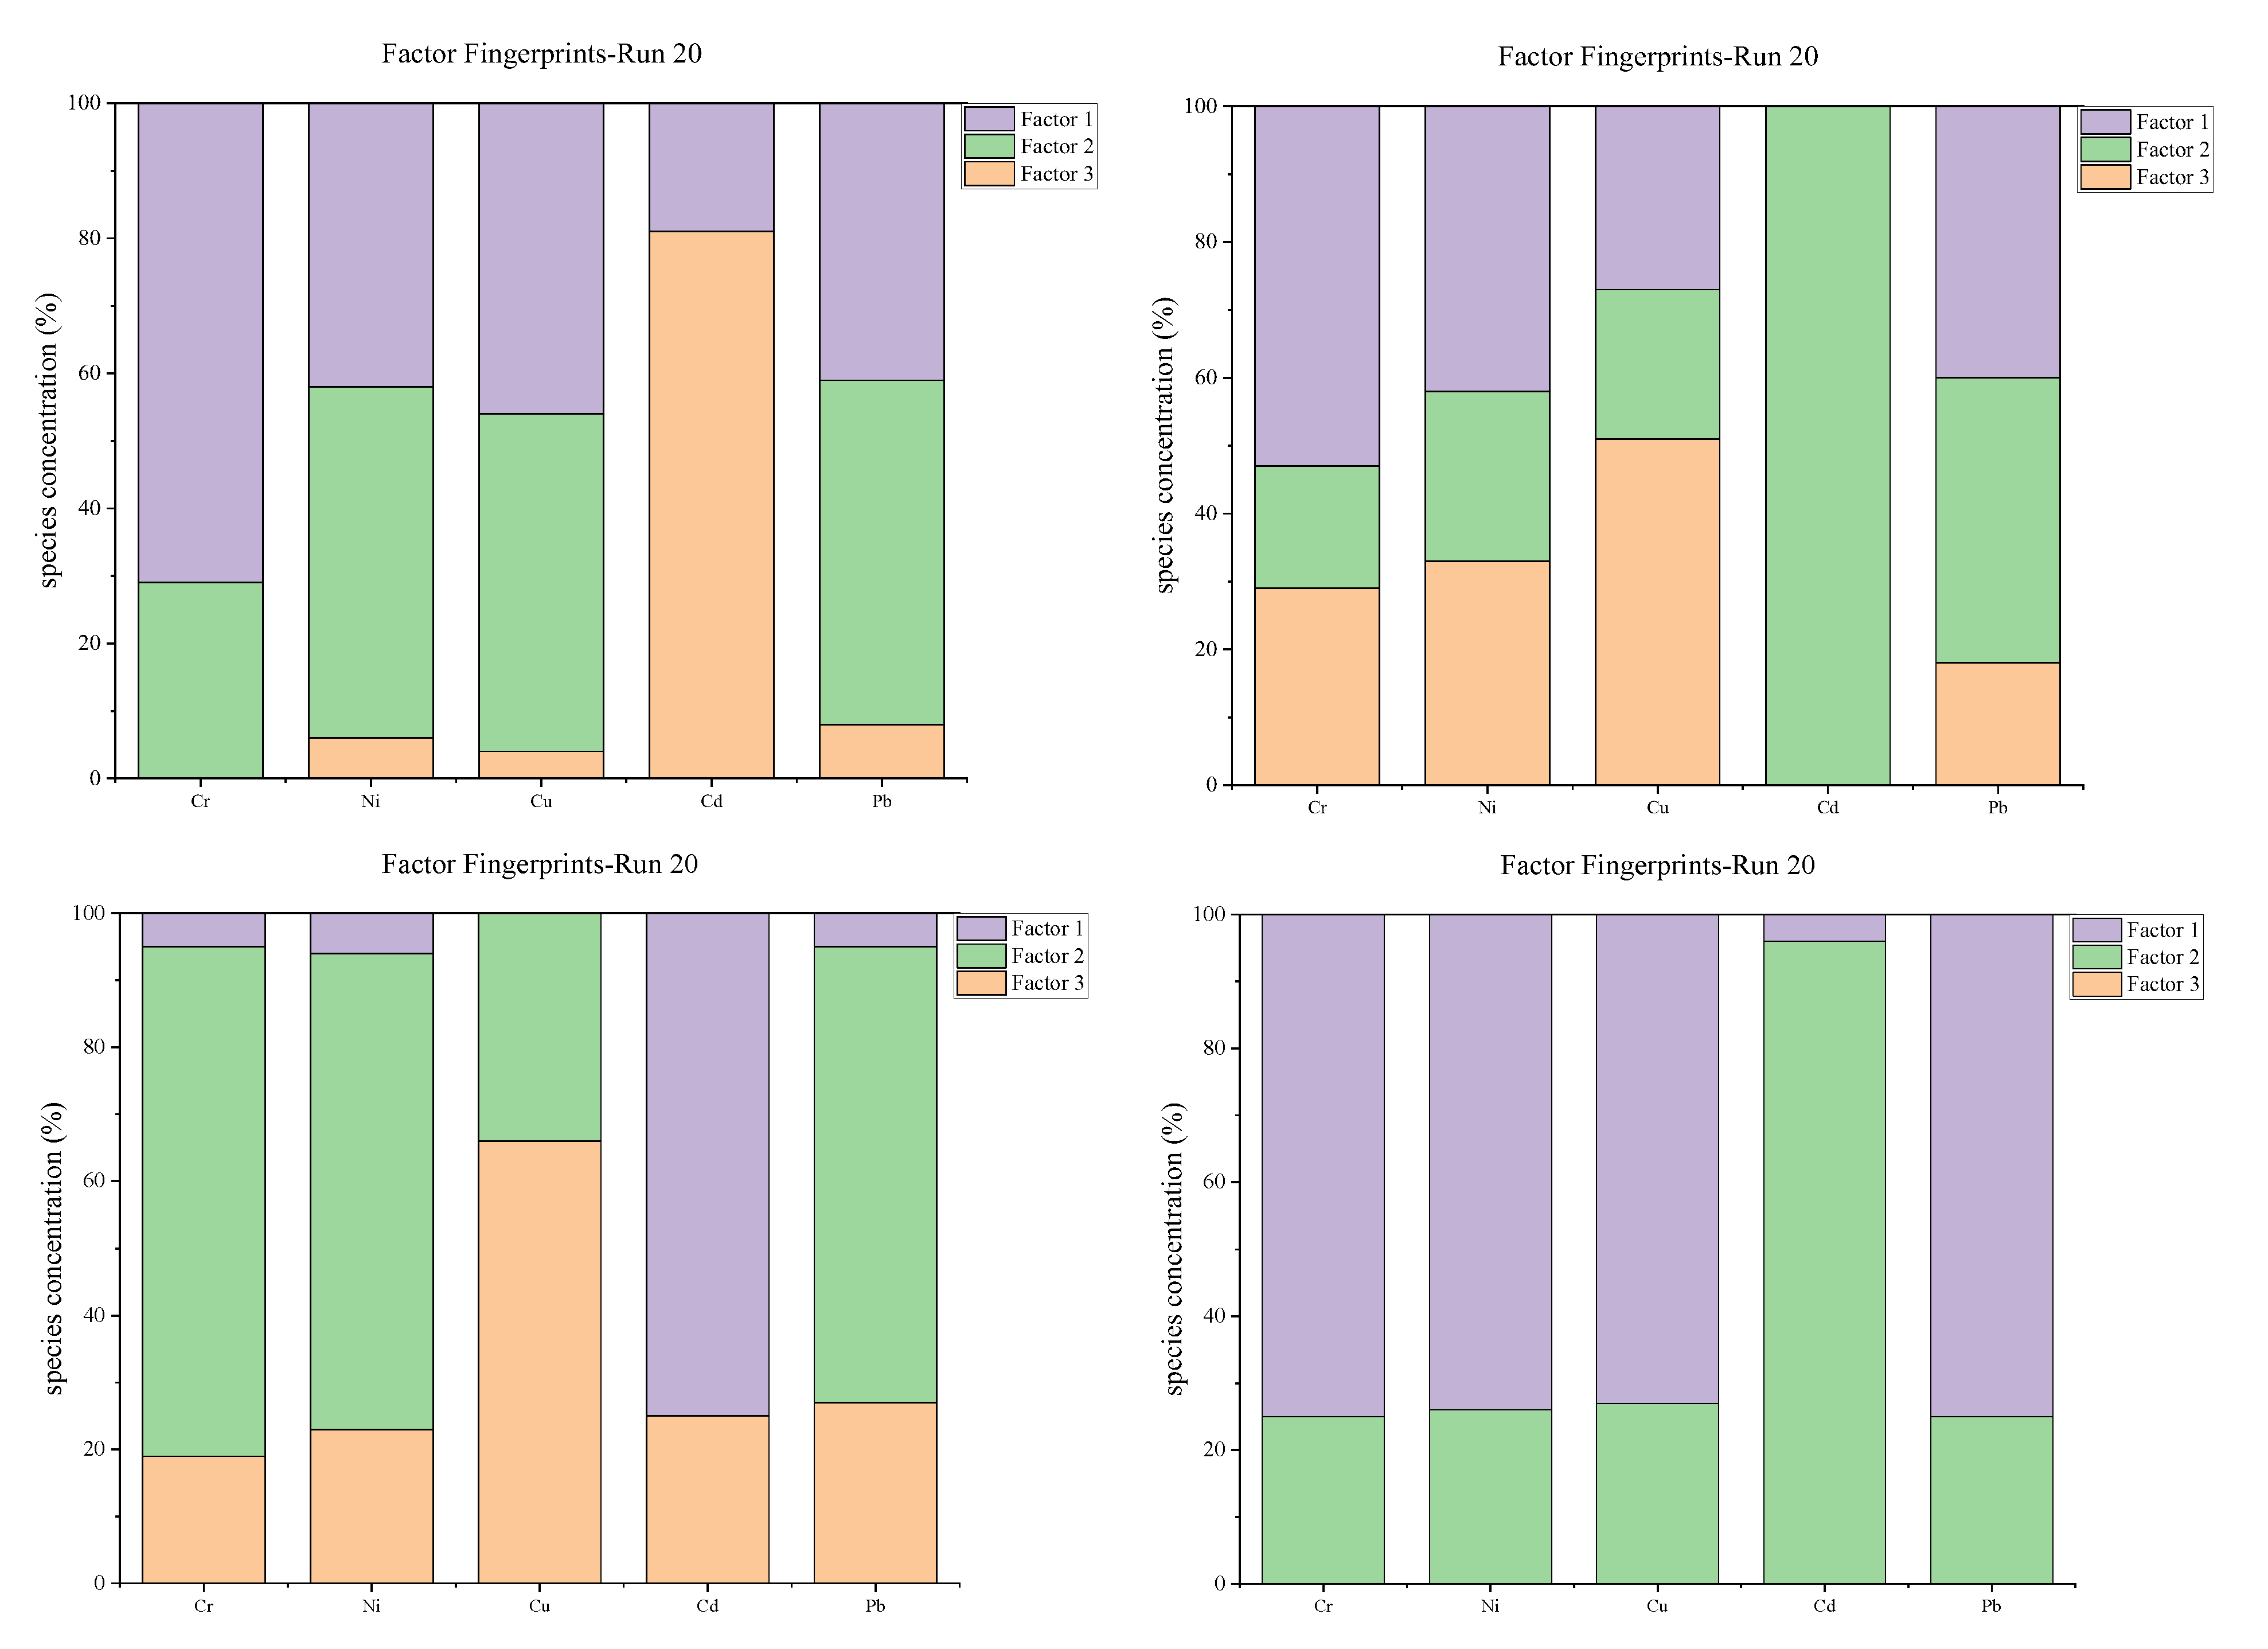
The PMF source analysis of four areas is shown in Figure 4. According to the possible source of heavy metals, traffic factors and the use of organic fertilizers for livestock and poultry will cause Cu pollution. If the heavy metal content does not exceed the background value, it indicates that it is less affected by human activities and it is the soil’s parent material. Cd sources mainly include agricultural factors, transportation factors, etc. Pb is mainly derived from industrial activity and traffic factors [40,41].
The figure of the factor and contribution rate of area 1 is shown in Figure 3A. The first factor in area 1 was involved in all heavy metals. The second factor was involved in heavy metals except Cd, and the third factor was mainly involved in Cd. According to the surrounding conditions of area 1, the determination factor 1 was the soil parent material, factor 2 was the industrial factor, and factor 3 was the traffic factor. The factors and contributions of area 2 are shown in Figure 3B. The first factor in area 2 was involved in all heavy metals except Cd. The second factor was involved in heavy metals, Cd was the mainstay, and the third factor was involved in heavy metals except Cd. According to the surrounding conditions of area 2, factor 1 was the soil parent material, factor 2 was the traffic factor, and factor 3 was the agricultural factor. As shown in Figure 3C, the first factor in area 3 was mainly Cd. All heavy metals were involved in the second factor except Cd and accounted for more, and the third factor was involved in all areas. According to the surrounding conditions of area 3, factor 1 was determined to be an industrial factor, factor 2 was soil parent material, and factor 3 was an agricultural factor. The factors and contribution rates of area 4 are shown in Figure 3D, the first factor in area 4 was involved in each heavy metal residue, and the second factor mainly involved Cd. According to the surrounding conditions of area 4, the determination factor 1 was the soil parent material and factor 2 was the agricultural factor.
In this study, the PMF method also had some drawbacks, such as the lack of a clear criterion for choosing the optimal number of factors. Therefore, the program had to be run multiple times to minimize the objective function Q and the residual matrix e value, and to maximize the correlation between the simulated and observed results. In future studies, multiple models can be combined to trace back the sources of pollution, to correct each other and make the results more accurate.
4.3. Analysis of the Difference between Carcinogenic Risk and Non-Carcinogenic Risk
The differences in non-carcinogenic risk between adults and children in each area are shown in Figure 5.
Figure 5 shows that the non-carcinogenic risk of heavy metals for children at each point was greater than that for adults. The five heavy metals in the overall potential hazard index of children were sorted as follows: Cr > Pb > Cu > Ni > Cd. The five heavy metals in the adults’ potential hazard index were sorted as follows: Cr > Pb > Cu > Ni > Cd. Heavy metal Cr posed a higher risk to children and adults than other heavy metals. From the average and maximum values, the potential risk index of the five heavy metal elements in the study area was less than 1, indicating that there would be no non-carcinogenic health risk effects on the human’s body.
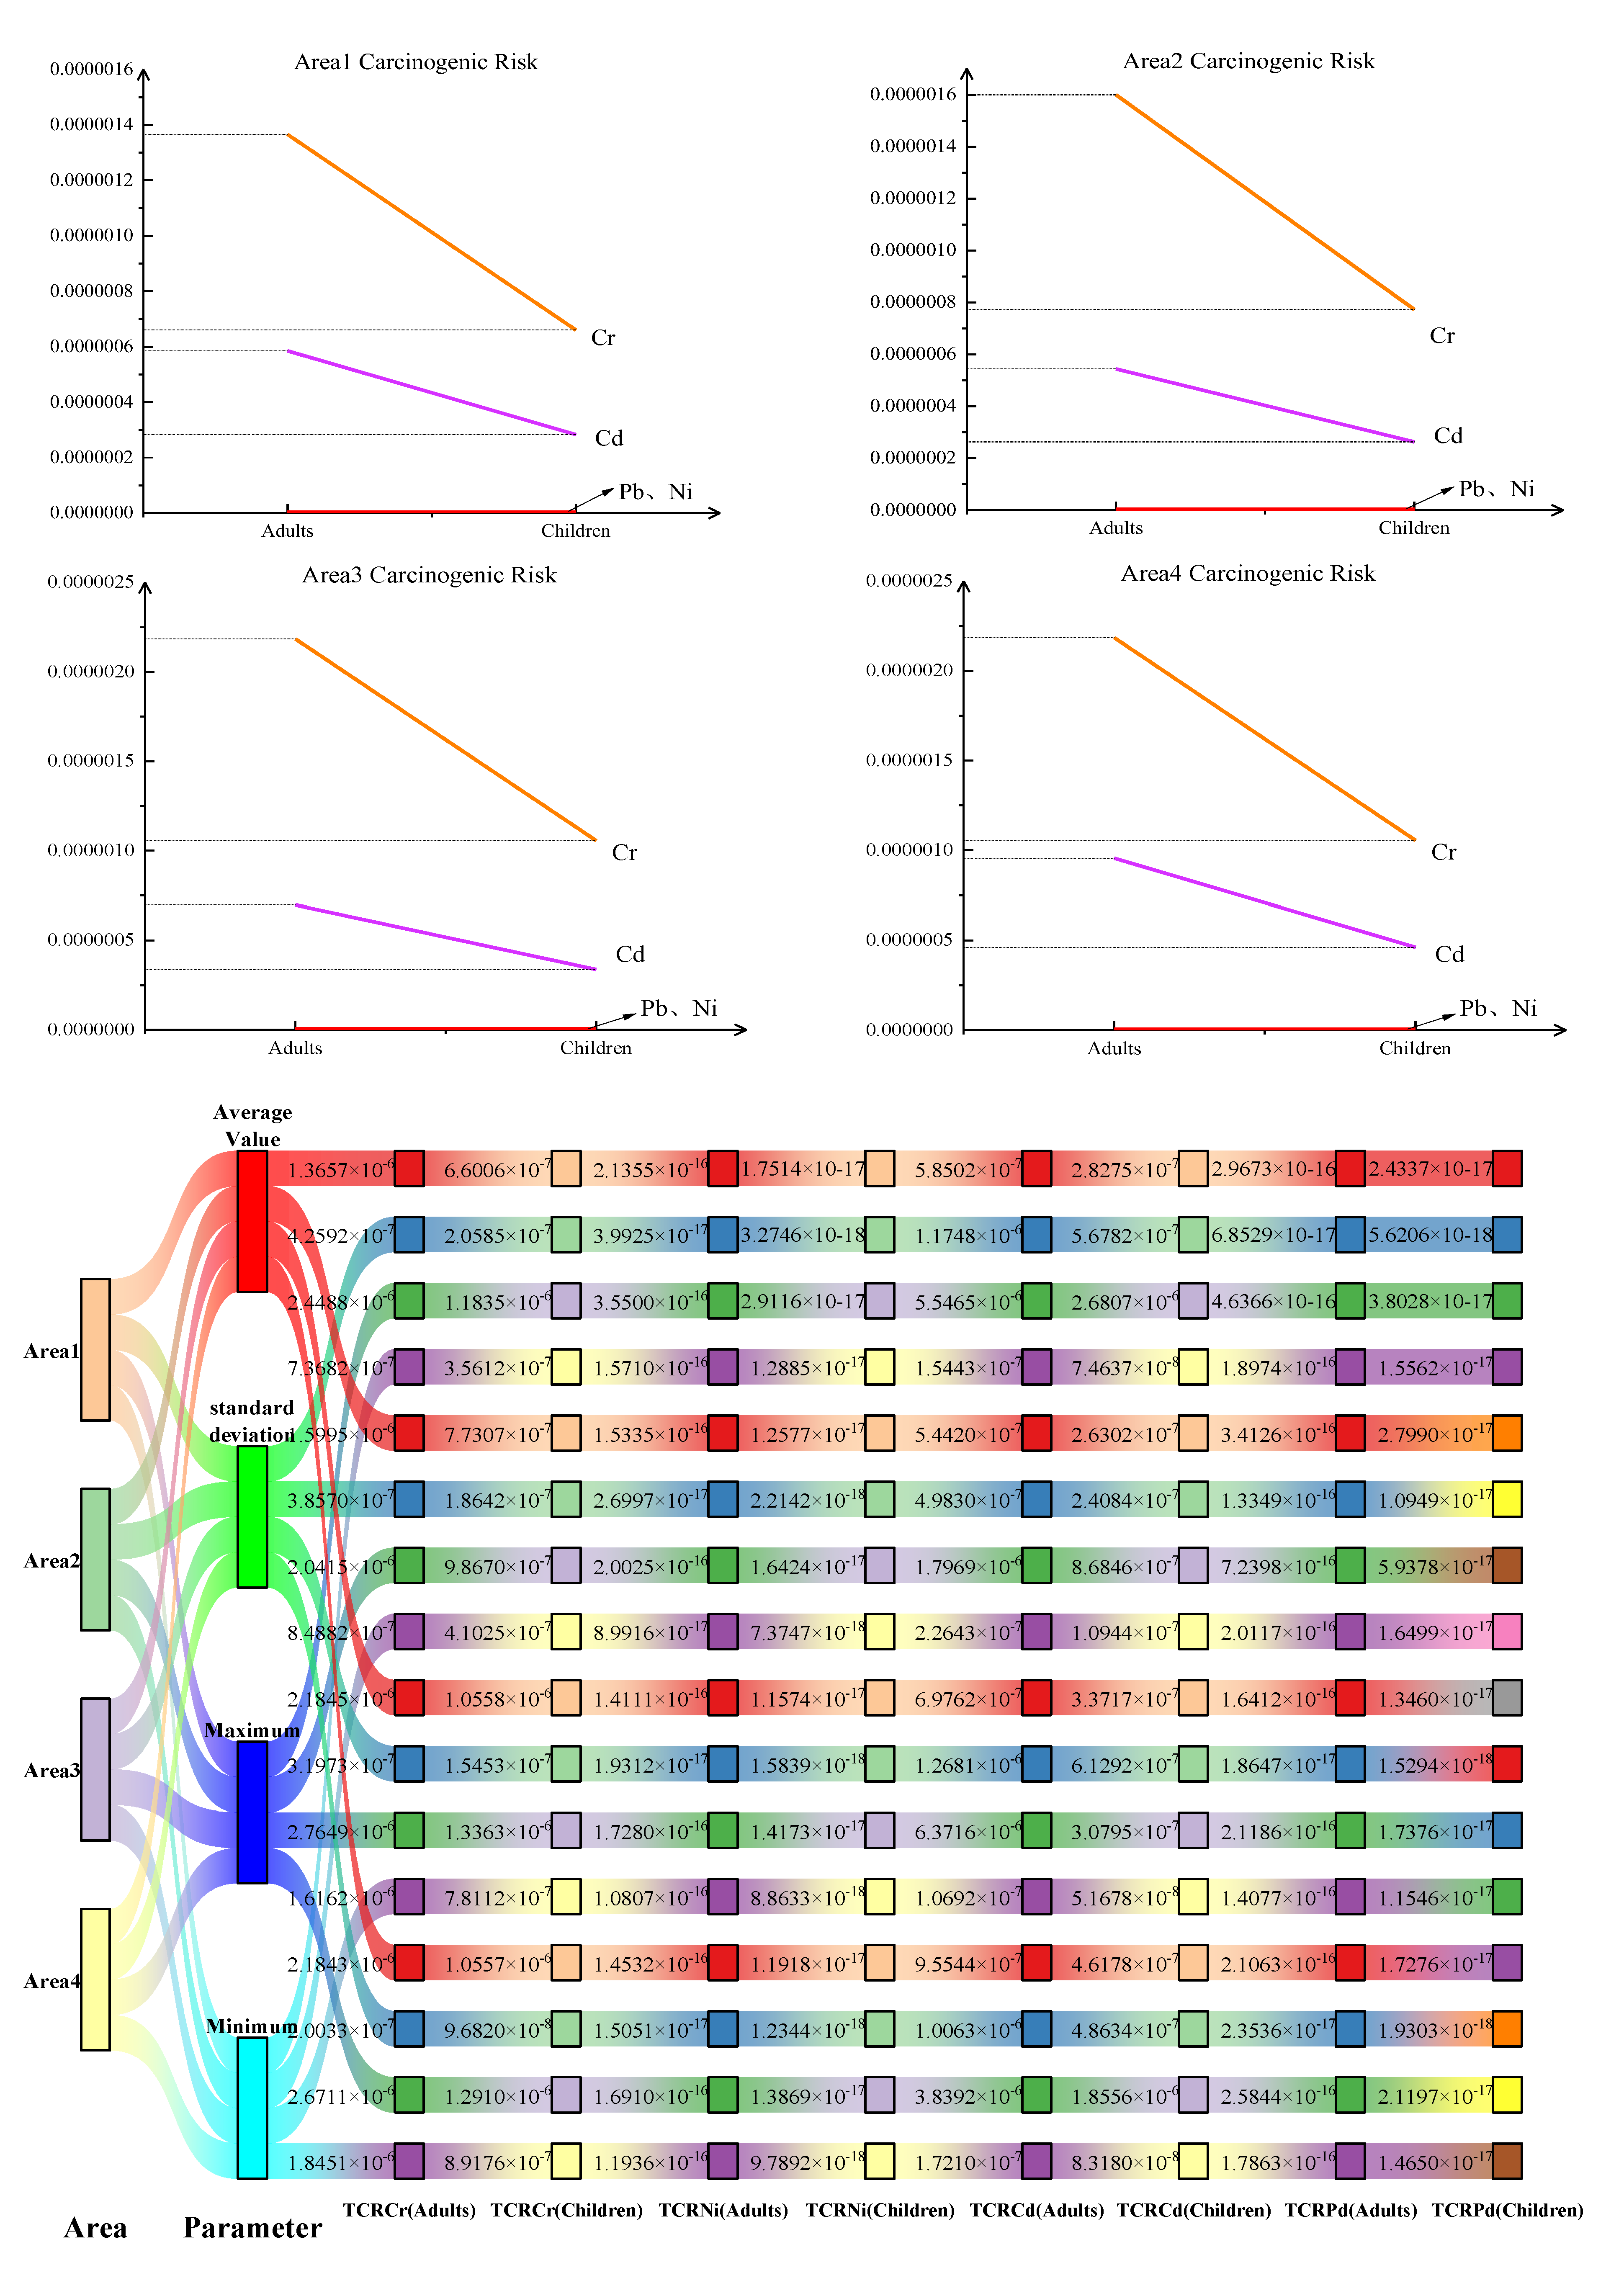
Figure 6 shows the probability of carcinogenic risk of heavy metals in the study area. For the risk order of carcinogenic risk probability pathways, ingested by mouth > ingested through the skin > ingested by breath, and the risk route in adults was greater than that in children. From the perspective of different heavy metal elements, the order of carcinogenic risk of heavy metals in adults and children in all areas was Cr > Cd > Pb > Ni. Therefore, the most serious carcinogenic risk in the study area was the harm caused by oral ingestion of heavy metal Cr into the adults’ body.
The order of Cr carcinogenic risk in different areas was area 3 > area 4 > area 2 > area 1. And the carcinogenic risk of Cr in area 3 was the most serious, so a treatment plant might aggravate the carcinogenic risk of Cr in the surrounding soil. But there was no such phenomenon in industrial parks.
The order of Ni carcinogenic risk in different areas was area 1 > area 2 > area 3 > area 4. Industrial parks might aggravate the risk of Ni carcinogenesis in the surrounding soil, but a treatment plant would not.
The order of Cd carcinogenic risk in different areas was area 4 > area 3 > area 1 > area 2. Area 4 agricultural land had a greater carcinogenic risk. It was believed that the industrial park and a treatment plant did not increase the carcinogenic risk of the surrounding Cd, and the carcinogenic risk of Cd mainly came from agriculture.
The order of Pd carcinogenic risk in different areas was area 2 > area 1 > area 4 > area 3, and it was believed that the industrial park and a treatment plant did not increase the carcinogenic risk of the surrounding Pd.
In summary, the analysis of human health risk assessment showed that Cr and Cd were more harmful than Ni, Cu, and Pb, and should be prevented. In addition, Cr had a certain risk of cancer and non-cancer. This was related to the method of intake and the reference dose of carcinogenic and non-carcinogenic risks. Different values and calculation results were directly related. Therefore, when calculating human health risks, the value of parameters should be clarified to obtain accurate results.
This study has some limitations that should be noted. In this study, heavy metals in plants and agricultural products were not analyzed. Crop plants, agricultural products, soil, and the human body were not uniformly assessed for risk. Further investigation and analysis of heavy metals around high points to determine the extent of pollution were not conducted in this paper.
5. Conclusions
In this paper, the PMF model was used to analyze the source of heavy metals in the soil in the study area, and the human health risk assessment was used to evaluate the human health risks. The main conclusions obtained are as follows:
- The heavy metal content in soil did not show regularity as a whole, and the distribution of heavy metal content was affected by the environment. Cd in the four areas had a pollution risk.
- Based on the PMF model, this study showed that area 1, area 2, and area 3 had three pollution source factors, and area 4 had two pollution source factors. The sources of pollution were soil parent material, traffic factors, agricultural chemical use, industrial factors, etc.
- The non-carcinogenic risk of heavy metals in children at all points in the study area was greater than that in adults. The risk of heavy metal Cr to children and adults was higher than that of other heavy metals. For the probability of carcinogenic risk, the risk pathway in adults was greater than that in children. And the most serious carcinogenic risk in the study area was the harm caused by oral ingestion of heavy metal Cr into the adults’ body.
- The results of human health risk evaluation showed that Cr and Cd were more harmful than Ni, Cu, and Pb, and should be prevented.
This study shows that the PMF model can well detect the source of heavy metal pollution, and the human health risk evaluation on the basis of known sources also shows the suitability and accuracy of the two. At the same time, it can provide reference for government decision making.
Author Contributions
Conceptualization, D.Y. and Y.Y.; methodology, Y.H.; software, Y.Y.; validation, D.Y., Y.Y. and Y.H.; formal analysis, Y.Y.; investigation, Y.H.; resources, D.Y.; data curation, Y.Y.; writing—original draft preparation, Y.Y.; writing—review and editing, D.Y.; visualization, Y.Y.; supervision, D.Y.; project administration, D.Y.; funding acquisition, D.Y. All authors have read and agreed to the published version of the manuscript.
Funding
The work was supported by “the Key Project of Joint Funds of the National Natural Science Foundation of China” (No. U2003103) and the “special fund for promoting scientific and technological innovation in Xuzhou in 2022 (key research and development plan (modern agriculture)—general project, KC22075)”.
Informed Consent Statement
Informed consent was obtained from all subjects involved in the study.
Data Availability Statement
The datasets used and/or analyzed during the current study are available from the corresponding author upon reasonable request.
Acknowledgments
We would like to thank the reviewers for their constructive comments and suggestions that helped to improve the quality of this paper.
Conflicts of Interest
The authors declare no conflict of interest.
References
- Chen, H.; Wang, Y.; Wang, S. Analysis and pollution assessment of heavy metals in farmland around Tongshan mining area. Environ. Sci. 2022, 43, 2719–2731. (In Chinese) [Google Scholar]
- National Soil Pollution Survey Bulletin. National Soil Pollution Survey Bulletin (April 17, 2014). volume 1. Environ. Educ. 2014, 8–10. Available online: https://www.gov.cn/foot/2014-04/17/content_2661768.htm (accessed on 18 July 2023). (In Chinese)
- Chapman, P.M.; Wang, F.; Adams, W.J.; Green, A. Appropriate applications of sediment quality values for metals and metalloids. Environ. Sci. Technol. 1999, 33, 3937–3941. [Google Scholar] [CrossRef]
- Zhang, Z.; Yu, N.; Liu, D.; Zhang, Y. Assessment and source analysis of heavy metal contamination in water and surface sediment in Dongping Lake, China. Chemosphere 2022, 307, 136016. [Google Scholar] [CrossRef] [PubMed]
- Adgate, J.L.; Willis, R.D.; Buckley, T.J.; Chow, J.C.; Watson, J.G.; Rhoads, G.G.; Lioy, P.J. Chemical mass balance source apportionment of lead in house dust. Environ. Sci. Technol. 1998, 32, 108–114. [Google Scholar] [CrossRef]
- Kou, J.; Gan, Y.; Lei, S.; Meng, W.; Feng, C.; Xiao, H. Soil health and ecological risk assessment in the typical coal mines on the Mongolian Plateau. Ecol. Indic. 2022, 142, 109189. [Google Scholar] [CrossRef]
- Chen, W.; Yang, Y.; Xie, T.; Wang, M.; Peng, C.; Wang, L. Challenges and countermeasures of heavy metal pollution prevention and control in farmland soil in China. Acta Pearthen Sin. 2018, 55, 261–272. (In Chinese) [Google Scholar]
- Muthu, S.S. Assessment of Carbon Footprint in Different Industrial Sectors; Springer Science & Business: Berlin/Heidelberg, Germany, 2014; Volume 1. [Google Scholar]
- Zeng, W.; Wan, X.; Wang, L. Apportionment and location of heavy metal (loid) s pollution sources for soil and dust using the combination of principal component analysis, Geodetector, and multiple linear regression of distance. J. Hazard. Mater. 2022, 438, 129468. [Google Scholar] [CrossRef]
- Liao, S.; Jin, G.; Khan, M.A. The quantitative source apportionment of heavy metals in peri-urban agricultural soils with UNMIX and input fluxe analysis. Environ. Technol. Innov. 2021, 21, 101232. [Google Scholar] [CrossRef]
- Wang, Y.; Guo, G.; Zhang, D.; Lei, M. An integrated method for source apportionment of heavy metal (loid) s in agricultural soils and model uncertainty analysis. Environ. Pollut. 2021, 276, 116666. [Google Scholar] [CrossRef]
- Ai, J.-C.; Wang, N.; Yang, J. Source apportionment of soil heavy metals in Jiapigou goldmine based on the UNMIX model. Environ. Sci. 2014, 35, 3530–3536. [Google Scholar]
- Zhu, G.; Guo, Q.; Xiao, H.; Chen, T.; Yang, J. Multivariate statistical and lead isotopic analyses approach to identify heavy metal sources in topsoil from the industrial zone of Beijing Capital Iron and Steel Factory. Environ. Sci. Pollut. Res. 2017, 24, 14877–14888. [Google Scholar] [CrossRef] [PubMed]
- Xu, Z.-J.; Zhu, H.-B.; Shu, L.-Y. Estimation of the fraction of soil-borne particulates in indoor air by PMF and its impact on health risk assessment of soil contamination in Guangzhou, China. Environ. Pollut. 2022, 308, 119623. [Google Scholar] [CrossRef] [PubMed]
- Shi, X.-M.; Liu, S. Contamination and source-specific risk analysis of soil heavy metals in a typical coal industrial city, central China. Sci. Total Environ. 2022, 836, 155694. [Google Scholar] [CrossRef]
- Chen, T.; Chang, Q.; Liu, J.; Clevers, J.G.P.W.; Kooistra, L. Identification of soil heavy metal sources and improvement in spatial mapping based on soil spectral information: A case study in northwest China. Sci. Total Environ. 2016, 565, 155–164. [Google Scholar] [CrossRef] [PubMed]
- Dai, Q.; Ding, J.; Song, C. Changes in source contributions to particle number concentrations after the COVID-19 outbreak: Insights from a dispersion normalized PMF. Sci. Total Environ. 2021, 759, 143548. [Google Scholar] [CrossRef]
- Li, Y.; Liu, B.; Xue, Z. Chemical characteristics and source apportionment of PM2. 5 using PMF modelling coupled with 1-hr resolution online air pollutant dataset for Linfen, China. Environ. Pollut. 2020, 263, 114532. [Google Scholar] [CrossRef]
- Su, Y.-C.; Chen, W.-H.; Fan, C.-L. Source apportionment of volatile organic compounds (VOCs) by positive matrix factorization (PMF) supported by model simulation and source markers-using petrochemical emissions as a showcase. Environ. Pollut. 2019, 254, 112848. [Google Scholar] [CrossRef]
- Chen, Z.; Shi, Z.; Ni, S.; Cheng, L. Characteristics of soil pollution and element migration associated with the use of coal in Hutou Village, Yunnan Province, China. Ecol. Indic. 2022, 139, 108976. [Google Scholar] [CrossRef]
- Zhou, L.; Zhao, X.; Meng, Y.; Fei, Y.; Teng, M.; Song, F.; Wu, F. Identification priority source of soil heavy metals pollution based on source-specific ecological and human health risk analysis in a typical smelting and mining region of South China. Ecotoxicol. Environ. Saf. 2022, 242, 113864. [Google Scholar] [CrossRef]
- Wang, J.; Yu, D.; Wang, Y.; Du, X.; Li, G.; Li, B.; Zhao, Y.; Wei, Y.; Xu, S. Source analysis of heavy metal pollution in agricultural soil irrigated with sewage in Wuqing, Tianjin. Sci. Rep. 2021, 11, 17816. [Google Scholar] [CrossRef]
- Qiao, P. Quantitative analysis of the main sources of pollutants in the soils around key areas based on the positive matrix factorization method. Environ. Pollut. 2021, 273, 116518. [Google Scholar] [CrossRef]
- Yin, X.; Xie, Z.; Wang, W.; Luo, X.; Shen, L.; Liu, B.; Shao, L. Analysis of soil heavy metal sources in Guangzhou: Comparison of three receptor models. J. Univ. Sci. Technol. China 2021, 51, 813–821. [Google Scholar]
- Jia, X.; Fu, T.; Hu, B.; Shi, Z.; Zhou, L.; Zhu, Y. Identification of the potential risk areas for soil heavy metal pollution based on the source-sink theory. J. Hazard. Mater. 2020, 393, 122424. [Google Scholar] [CrossRef]
- Liu, L.; Xu, X.; Han, J.; Zhu, J.-M. Heavy metal (loid) s in agricultural soils in the world’s largest barium-mining area: Pollution characteristics, source apportionment, and health risks using PMF model and Cd isotopes. Process Saf. Environ. Prot. 2022, 166, 669–681. [Google Scholar] [CrossRef]
- Bhuiyan MA, H.; Karmaker, S.C.; Bodrud-Doza, M.; Rakib, M.A.; Saha, B.B. Enrichment, sources and ecological risk mapping of heavy metals in agricultural soils of dhaka district employing SOM, PMF and GIS methods. Chemosphere 2021, 263, 128339. [Google Scholar] [CrossRef]
- Yadav, P.; Singh, R.; Gupta, N.; Kumar, S.; Thakur, R.S.; Khan, A.; Ansari, N.G.; Patel, D.K. Modified DLLME-SFO approach for evaluation of multiclass agrochemicals and its associated risk assessment: Soil, Saccharum officinarum and Jaggery. Food Chem. Adv. 2022, 1, 100032. [Google Scholar] [CrossRef]
- Albert, R.E. Issues in biochemical applications to risk assessment: How do we predict toxicity of complex mixtures? Environ. Health Perspect. 1987, 76, 185–186. [Google Scholar] [CrossRef]
- Chen, C.; Wang, Y.; Qian, Y.; Zhao, X.; Wang, Q. The synergistic toxicity of the multiple chemical mixtures: Implications for risk assessment in the terrestrial environment. Environ. Int. 2015, 77, 95–105. [Google Scholar] [CrossRef]
- Wierzbicka, M. Multidimensional evaluation of soil pollution from railway tracks. Ecotoxicology 2015, 24, 805–822. [Google Scholar] [CrossRef] [PubMed]
- Sarigiannis, D.A.; Hansen, U. Considering the cumulative risk of mixtures of chemicals—A challenge for policy makers. Environ. Health 2012, 11, S18. [Google Scholar] [CrossRef]
- Ho, S.; Cheng, Y.; Bai, Y. Risk Assessment of Indoor Formaldehyde and Other Carbonyls in Campus Environments in Northwestern China. Aerosol Air Qual. Res. 2016, 16, 1967–1980. [Google Scholar] [CrossRef]
- Chen, Z.; Hua, Y.; Xu, W.; Pei, J. Analysis of heavy metal pollution sources in suburban farmland based on positive-definite matrix factor analysis model. J. Environ. Sci. 2020, 40, 276–283. [Google Scholar]
- Liu, G.; Hu, L.; He, Z. Analysis of heavy metal pollution sources in soil. J. Chengdu Univ. Nat. Sci. Ed. 2015, 34, 200–203. [Google Scholar]
- Li, J. Evaluation of Heavy Metal Pollution and Health Risk Assessment of Cultivated Land Based on Soil-Crop-Human System. Master’s Thesis, Zhejiang University, Hangzhou, China, 2019. (In Chinese). [Google Scholar]
- Cai, N. Classification of Soil Heavy Metal Cd Pollution Degree Based on Potato Quality and Safety. Master’s Thesis, Guizhou University, Guiyang, China, 2019. (In Chinese). [Google Scholar]
- Azhar, U.; Ahmad, H.; Shafqat, H.; Babar, M.; Munir, H.M.S.; Sagir, M.; Arif, M.; Hassan, A.; Rachmadona, N.; Rajendran, S.; et al. Remediation techniques for elimination of heavy metal pollutants from soil: A review. Environ. Res. 2022, 214, 113918. [Google Scholar] [CrossRef]
- Yang, Q. A review of soil heavy metal pollution from industrial and agricultural regions in China: Pollution and risk assessment. Sci. Total Environ. 2018, 642, 690–700. [Google Scholar] [CrossRef]
- Wei, Y.; Li, G.; Wang, Y.; Zhang, Q. Influencing Factors of PMF Model: A Case Study of Soil Heavy Metal Source Analysis in Farmland Surrounding a Lead and Zinc Mine. J. Agro-Environ. Sci. 2018, 37, 198–208. [Google Scholar]
- Chai, L.; Wang, X.; Ma, L.; Cheng, Z.; Su, L.; Wang, Y. Analysis of soil heavy metal sources in cultivated land in Lanzhou based on PMF model. China Environ. Sci. 2020, 40, 3919–3929. (In Chinese) [Google Scholar]
Figure 1.
Schematic diagram of sampling points in the study area.

Figure 2.
Parameters of heavy metals.

Figure 3.
Different heavy metal content in the study area (in broken line graph: red is average value and yellow is background value). (A) Cr content. (B) Ni content. (C) Cu content. (D) Cd content. (E) Pb content.
Figure 3.
Different heavy metal content in the study area (in broken line graph: red is average value and yellow is background value). (A) Cr content. (B) Ni content. (C) Cu content. (D) Cd content. (E) Pb content.

Figure 4.
Analysis of PMF pollution sources in 4 areas.

Figure 5.
Non-carcinogenic risk probability in the study area.

Figure 6.
Carcinogenic risk probability in the study area.


Table 1.
Reference doses of heavy metals.
| Reference Dose | Ingestion Mode | Cr | Ni | Cu | Cd | Pb |
|---|---|---|---|---|---|---|
| RfD | Ingested by breath | 0.0000286 | 0.00009 | 0.04 | 0.00001 | 0.00352 |
| Ingested through the skin | 0.00006 | 0.0054 | 0.012 | 0.000025 | 0.000525 | |
| Ingested by mouth | 0.003 | 0.02 | 0.04 | 0.001 | 0.0035 | |
| CSF | Ingested by breath | 84 | 0.26 | 1.8 | 0.042 | |
| Ingested through the skin | 0.001 | 0.38 | ||||
| Ingested by mouth | 0.5 | 6.1 |
Table 2.
Soil heavy metal content in the study area.
| Area | Parameter (mg/kg) | Cr | Ni | Cu | Cd | Pb |
|---|---|---|---|---|---|---|
| Area 1 | average value | 25.65 | 33.12 | 78.57 | 0.9 | 28.49 |
| standard deviation | 8.001 | 6.192 | 15.684 | 1.809 | 6.579 | |
| coefficient of variation | 0.312 | 0.187 | 0.2 | 2.008 | 0.231 | |
| Area 2 | average value | 31.07 | 24.21 | 64.26 | 1.18 | 32.5 |
| standard deviation | 7.902 | 4.323 | 10.031 | 1.444 | 12.386 | |
| coefficient of variation | 0.254 | 0.179 | 0.156 | 1.222 | 0.381 | |
| Area 3 | average value | 41.04 | 21.88 | 44.42 | 1.07 | 15.76 |
| standard deviation | 6.006 | 2.995 | 11.076 | 1.953 | 1.79 | |
| coefficient of variation | 0.146 | 0.137 | 0.249 | 1.818 | 0.114 | |
| Area 4 | average value | 40.66 | 22.37 | 48.59 | 1.42 | 20.04 |
| standard deviation | 4.015 | 2.386 | 6.533 | 1.527 | 2.345 | |
| coefficient of variation | 0.099 | 0.107 | 0.134 | 1.076 | 0.117 |
Table 3.
Contribution rates of factors in the study areas.
| Area | Heavy Metal | Cr | Ni | Cu | Cd | Pb |
|---|---|---|---|---|---|---|
| Area1 | Factor1 | 71.1% | 41.5% | 45.8% | 20.6% | 40.9% |
| Factor2 | 28.9% | 52.5 | 49.8 | 0% | 51.2% | |
| Factor3 | 0% | 6.0% | 4.4% | 79.4% | 7.9% | |
| Area2 | Factor1 | 52.6% | 41.9% | 26.7% | 0% | 40.1% |
| Factor2 | 18.6% | 23.9% | 21.2% | 100% | 41.8% | |
| Factor3 | 28.8% | 34.2% | 52.1% | 0% | 18.1% | |
| Area3 | Factor1 | 5.0% | 5.5% | 0% | 75.0% | 4.7% |
| Factor2 | 76.3% | 71.7% | 35.2% | 0% | 68.8% | |
| Factor3 | 18.7% | 22.8% | 64.8% | 25.0% | 26.4% | |
| Area4 | Factor1 | 75.4% | 74.1% | 72.5% | 4.2% | 75.1% |
| Factor2 | 24.6% | 25.9% | 27.5% | 95.8% | 24.9% |
Table 4.
Numerical range of carcinogenic risk in the study area.
| Area | Heavy Metal | Crowd Category | Average Value | Standard Deviation | Maximum | Minimum |
|---|---|---|---|---|---|---|
| 1 | Cr | Adults | 2.13 × 10⁻³ | 6.65 × 10⁻⁴ | 3.82 × 10⁻³ | 1.15 × 10⁻³ |
| Children | 3.46 × 10⁻³ | 1.08 × 10⁻³ | 6.20 × 10⁻³ | 1.87 × 10⁻³ | ||
| Ni | Adults | 4.11 × 10⁻⁴ | 7.69 × 10⁻⁵ | 6.84 × 10⁻⁴ | 3.03 × 10⁻⁴ | |
| Children | 6.63 × 10⁻⁴ | 1.24 × 10⁻⁴ | 1.10 × 10⁻³ | 4.88 × 10⁻⁴ | ||
| Cu | Adults | 4.88 × 10⁻⁴ | 9.74 × 10⁻⁵ | 8.73 × 10⁻⁴ | 3.82 × 10⁻⁴ | |
| Children | 7.87 × 10⁻⁴ | 1.57 × 10⁻⁴ | 1.41 × 10⁻³ | 6.16 × 10⁻⁴ | ||
| Cd | Adults | 2.24 × 10⁻⁴ | 4.51 × 10⁻⁴ | 2.13 × 10⁻³ | 5.93 × 10⁻⁵ | |
| Children | 3.63 × 10⁻⁴ | 7.30 × 10⁻⁴ | 3.45 × 10⁻³ | 9.59 × 10⁻⁵ | ||
| Pb | Adults | 2.02 × 10⁻³ | 4.67 × 10⁻⁴ | 3.16 × 10⁻³ | 1.29 × 10⁻³ | |
| Children | 3.26 × 10⁻³ | 7.53 × 10⁻⁴ | 5.10 × 10⁻³ | 2.09 × 10⁻³ | ||
| 2 | Cr | Adults | 2.50 × 10⁻³ | 6.02 × 10⁻⁴ | 3.19 × 10⁻³ | 1.33 × 10⁻³ |
| Children | 4.05 × 10⁻³ | 9.77 × 10⁻⁴ | 5.17 × 10⁻³ | 2.15 × 10⁻³ | ||
| Ni | Adults | 2.95 × 10⁻⁴ | 5.20 × 10⁻⁵ | 3.86 × 10⁻⁴ | 1.73 × 10⁻⁴ | |
| Children | 4.76 × 10⁻⁴ | 8.38 × 10⁻⁵ | 6.22 × 10⁻⁴ | 2.79 × 10⁻⁴ | ||
| Cu | Adults | 3.89 × 10⁻⁴ | 5.34 × 10⁻⁵ | 4.73 × 10⁻⁴ | 2.81 × 10⁻⁴ | |
| Children | 6.28 × 10⁻⁴ | 8.61 × 10⁻⁵ | 7.63 × 10⁻⁴ | 4.53 × 10⁻⁴ | ||
| Cd | Adults | 2.09 × 10⁻⁴ | 1.91 × 10⁻⁴ | 6.90 × 10⁻⁴ | 8.69 × 10⁻⁵ | |
| Children | 3.38 × 10⁻⁴ | 3.10 × 10⁻⁴ | 1.12 × 10⁻³ | 1.41 × 10⁻⁴ | ||
| Pb | Adults | 2.33 × 10⁻³ | 9.10 × 10⁻⁴ | 4.94 × 10⁻³ | 1.37 × 10⁻³ | |
| Children | 3.75 × 10⁻³ | 1.47 × 10⁻³ | 7.96 × 10⁻³ | 2.21 × 10⁻³ | ||
| 3 | Cr | Adults | 3.41 × 10⁻³ | 4.99 × 10⁻⁴ | 4.32 × 10⁻³ | 2.52 × 10⁻³ |
| Children | 5.53 × 10⁻³ | 8.10 × 10⁻⁴ | 7.00 × 10⁻³ | 4.09 × 10⁻³ | ||
| Ni | Adults | 2.72 × 10⁻⁴ | 3.72 × 10⁻⁵ | 3.33 × 10⁻⁴ | 2.08 × 10⁻⁴ | |
| Children | 4.38 × 10⁻⁴ | 6.00 × 10⁻⁵ | 5.37 × 10⁻⁴ | 3.36 × 10⁻⁴ | ||
| Cu | Adults | 2.76 × 10⁻⁴ | 6.88 × 10⁻⁵ | 3.94 × 10⁻⁴ | 7.61 × 10⁻⁵ | |
| Children | 4.45 × 10⁻⁴ | 1.11 × 10⁻⁴ | 6.36 × 10⁻⁴ | 1.23 × 10⁻⁴ | ||
| Cd | Adults | 2.68 × 10⁻⁴ | 4.87 × 10⁻⁴ | 2.45 × 10⁻³ | 4.10 × 10⁻⁵ | |
| Children | 4.33 × 10⁻⁴ | 7.88 × 10⁻⁴ | 3.96 × 10⁻³ | 6.64 × 10⁻⁵ | ||
| Pb | Adults | 1.12 × 10⁻³ | 1.27 × 10⁻⁴ | 1.44 × 10⁻³ | 9.60 × 10⁻⁴ | |
| Children | 1.80 × 10⁻³ | 2.05 × 10⁻⁴ | 2.33 × 10⁻³ | 1.55 × 10⁻³ | ||
| 4 | Cr | Adults | 3.41 × 10⁻³ | 3.13 × 10⁻⁴ | 4.17 × 10⁻³ | 2.88 × 10⁻³ |
| Children | 5.53 × 10⁻³ | 5.07 × 10⁻⁴ | 6.76 × 10⁻³ | 4.67 × 10⁻³ | ||
| Ni | Adults | 2.80 × 10⁻⁴ | 2.90 × 10⁻⁵ | 3.26 × 10⁻⁴ | 2.30 × 10⁻⁴ | |
| Children | 4.51 × 10⁻⁴ | 4.67 × 10⁻⁵ | 5.25 × 10⁻⁴ | 3.71 × 10⁻⁴ | ||
| Cu | Adults | 3.05 × 10⁻⁴ | 3.90 × 10⁻⁵ | 3.98 × 10⁻⁴ | 2.40 × 10⁻⁴ | |
| Children | 4.92 × 10⁻⁴ | 6.29 × 10⁻⁵ | 6.41 × 10⁻⁴ | 3.87 × 10⁻⁴ | ||
| Cd | Adults | 3.67 × 10⁻⁴ | 3.86 × 10⁻⁴ | 1.47 × 10⁻³ | 6.60 × 10⁻⁵ | |
| Children | 5.94 × 10⁻⁴ | 6.25 × 10⁻⁴ | 2.39 × 10⁻³ | 1.07 × 10⁻⁴ | ||
| Pb | Adults | 1.44 × 10⁻³ | 1.60 × 10⁻⁴ | 1.76 × 10⁻³ | 1.22 × 10⁻³ | |
| Children | 2.32 × 10⁻³ | 2.59 × 10⁻⁴ | 2.84 × 10⁻³ | 1.96 × 10⁻³ |
Disclaimer/Publisher’s Note: The statements, opinions and data contained in all publications are solely those of the individual author(s) and contributor(s) and not of MDPI and/or the editor(s). MDPI and/or the editor(s) disclaim responsibility for any injury to people or property resulting from any ideas, methods, instructions or products referred to in the content. |
© 2023 by the authors. Licensee MDPI, Basel, Switzerland. This article is an open access article distributed under the terms and conditions of the Creative Commons Attribution (CC BY) license (https://creativecommons.org/licenses/by/4.0/).
Share and Cite
MDPI and ACS Style
Yang, D.; Yang, Y.; Hua, Y. Source Analysis Based on the Positive Matrix Factorization Models and Risk Assessment of Heavy Metals in Agricultural Soil. Sustainability 2023, 15, 13225. https://doi.org/10.3390/su151713225
AMA Style
Yang D, Yang Y, Hua Y. Source Analysis Based on the Positive Matrix Factorization Models and Risk Assessment of Heavy Metals in Agricultural Soil. Sustainability. 2023; 15(17):13225. https://doi.org/10.3390/su151713225
Chicago/Turabian StyleYang, Dejun, Yong Yang, and Yipei Hua. 2023. "Source Analysis Based on the Positive Matrix Factorization Models and Risk Assessment of Heavy Metals in Agricultural Soil" Sustainability 15, no. 17: 13225. https://doi.org/10.3390/su151713225
Note that from the first issue of 2016, this journal uses article numbers instead of page numbers. See further details here.