
Land-Use-Change-Induced Cooling and Precipitation Reduction in China: Insights from CMIP6 Models
by
 , , and
Peizhi Tian
1,† ,
,
Binyang Jian
1,2,†,
Jianrui Li
1,
Xitian Cai
1,*,
Jiangfeng Wei
3,* and
Guo Zhang
4 1
Center for Water Resources and Environment, School of Civil Engineering, Sun Yat-sen University, Guangzhou 510275, China
2
School of Physics, Sun Yat-sen University, Guangzhou 510275, China
3
Collaborative Innovation Center on Forecast and Evaluation of Meteorological Disasters, School of Atmospheric Sciences, Nanjing University of Information Science & Technology, Nanjing 210044, China
4
CMA Earth System Modeling and Prediction Centre, China Meteorological Administration, Beijing 100081, China
*
Authors to whom correspondence should be addressed.
†
These authors contributed equally to this work.
Sustainability 2023, 15(16), 12191; https://doi.org/10.3390/su151612191
Submission received: 18 July 2023
/
Revised: 7 August 2023
/
Accepted: 8 August 2023
/
Published: 9 August 2023
(This article belongs to the Section Environmental Sustainability and Applications)
Abstract
:In the 21st century, the effect of land use/land cover change (LULCC) on climate has become an area of active research. To explore the effects of LULCC on temperature and precipitation in China, we used outputs from the BCC-CSM2-MR, CESM2, IPSL-CM6A-LR, and UKESM1 models, which participated in the Land Use Model Intercomparison Project (LUMIP) of the Coupled Model Intercomparison Project Phase 6 (CMIP6). Based on these models, we identified temporal variations in precipitation and near-surface air temperature (hereinafter temperature) with and without historical land use changes and their relation with LULCC in China during 1850–2014. We then determined the significant changing period (1972–2012) and revealed the relation between the spatial distribution of historical change in vegetation cover types, precipitation, and temperature. The results showed that annual historical precipitation decreased faster (132.23 mm/(1000 a) faster), while annual historical temperature increased slower (2.70 °C/(1000 a) slower) than that without LULCC during 1850–2014. LULCC not only influenced surface properties to change local precipitation and temperature distributions and mean values, but also affected other components through atmospheric circulations due to typical monsoon characteristics in China. The relative contribution of grassland change to precipitation variation was the largest, while relatively, cropland change contributed the most to temperature variation. Our study innovatively used new model outputs from LUMIP to analyze the impacts of LULCC on precipitation and temperature, which can help to guide and improve future land use management and predictions of precipitation and temperature.
1. Introduction
Land use/land cover change (LULCC) has emerged as a major factor driving global climate change [1,2]. The rapid change in land cover is often characterized by farmland displacement [3], deforestation [4], loss of cropland [5], and reduction in natural vegetation [6,7]. Currently, LULCC is regarded as the most direct manifestation of the interaction between human activities and the natural environment [8,9]. For example, the expansion of human activities enhances the heat island effect, which then affects the surface heat budget and vertical transport of water vapor and ultimately induces changes in precipitation, temperature, humidity, and evapotranspiration [10,11]. As such, LULCC exerts substantial impacts on regional climate change [12]. Notably, Pielke et al. [13] emphasize the pronounced influence of LULCC on precipitation, while Tomlinson et al. [14] consider temperature as another critical factor for exploring the effects of LULCC on climate. Fang et al. [15] also found that different types of LULCC had different impacts on the changes in water cycle and temperature change. Consequently, further research is warranted to specifically investigate the impacts of LULCC on both temperature and precipitation, as these factors play critical roles in shaping the climate system.
In recent years, land use and land cover in developing countries, especially China, have changed rapidly, thereby posing serious challenges to natural and human environments [16,17,18,19,20]. Although many studies have investigated the impact of LULCC on regional climate change [21,22], more research is needed about the specific effects in China and comparisons with other areas in the world [23]. Various models, including the InVEST model and ALARO model, have been utilized in numerous studies analyzing the influence of LULCC on regional climate and hydrological changes in China to examine parameters such as water yield and purification, soil retention, and land surface albedo [24,25,26,27]. While shedding light on the regional mechanisms through which LULCC affects precipitation and temperature, these studies have been limited to specific regions of China and have primarily focused on a single aspect of either precipitation or temperature. Therefore, there is a need for integrated research that comprehensively evaluates the impact of LULCC on the precipitation and temperature throughout the entire region of China, allowing for a comprehensive understanding of their relationship and validation of previous findings.
For study methods, research on LULCC using remote sensing technology has a long history globally, with significant progress being made [28,29,30,31,32]. In the current era, the advanced climate simulation and prediction capabilities of the Coupled Model Intercomparison Project Phase 6 (CMIP6) are favored by scientists. Within the CMIP6 framework, the Land Use Model Intercomparison Project (LUMIP) has been launched to address LULCC-related challenges. Several studies leveraging the LUMIP have already been completed, evaluating relative contribution of LULCC impacts on temperature [33], analyzing drought characteristics [34], and investigating the relationship between deforestation and desiccation [35]. Furthermore, researchers have called for additional studies on LUMIP to support future research across various fields, such as exploring the relation between land use and precipitation [36], investigating the link between afforestation and temperature [37], and projecting future land use scenarios [38]. These studies have generated numerous research findings and provided valuable suggestions for further developing research on LUMIP. However, there remains a lack of integrated studies focusing on the impacts of LULCC on precipitation and temperature using LUMIP, particularly within the context of China.
To conclude, existing studies on the impacts of LULCC on climate change have identified several key research gaps, including the need for comprehensive studies focusing on China, integration of precipitation and temperature analysis, and better utilization of the LUMIP models. To address these gaps, this study uses four representative LUMIP models to assess the LULCC impacts on precipitation and temperature across China during 1850–2014. The study aims to enhance our understanding of climate change attribution, aiding in the development of reasonable and orderly human land use planning in the future. Specifically, the following scientific questions are addressed in this study: (1) Are the four selected LUMIP models capable of accurately simulating the precipitation and temperature in China? (2) What are the temporal and spatial changes in precipitation and temperature in China, and how does LULCC correspond to these changes during the same period? (3) How does the specific type of LULCC affect precipitation and temperature in China, both in terms of temporal and spatial dimensions, and what are the underlying reasons for these impacts?
2. Data and Methods
2.1. Study Region
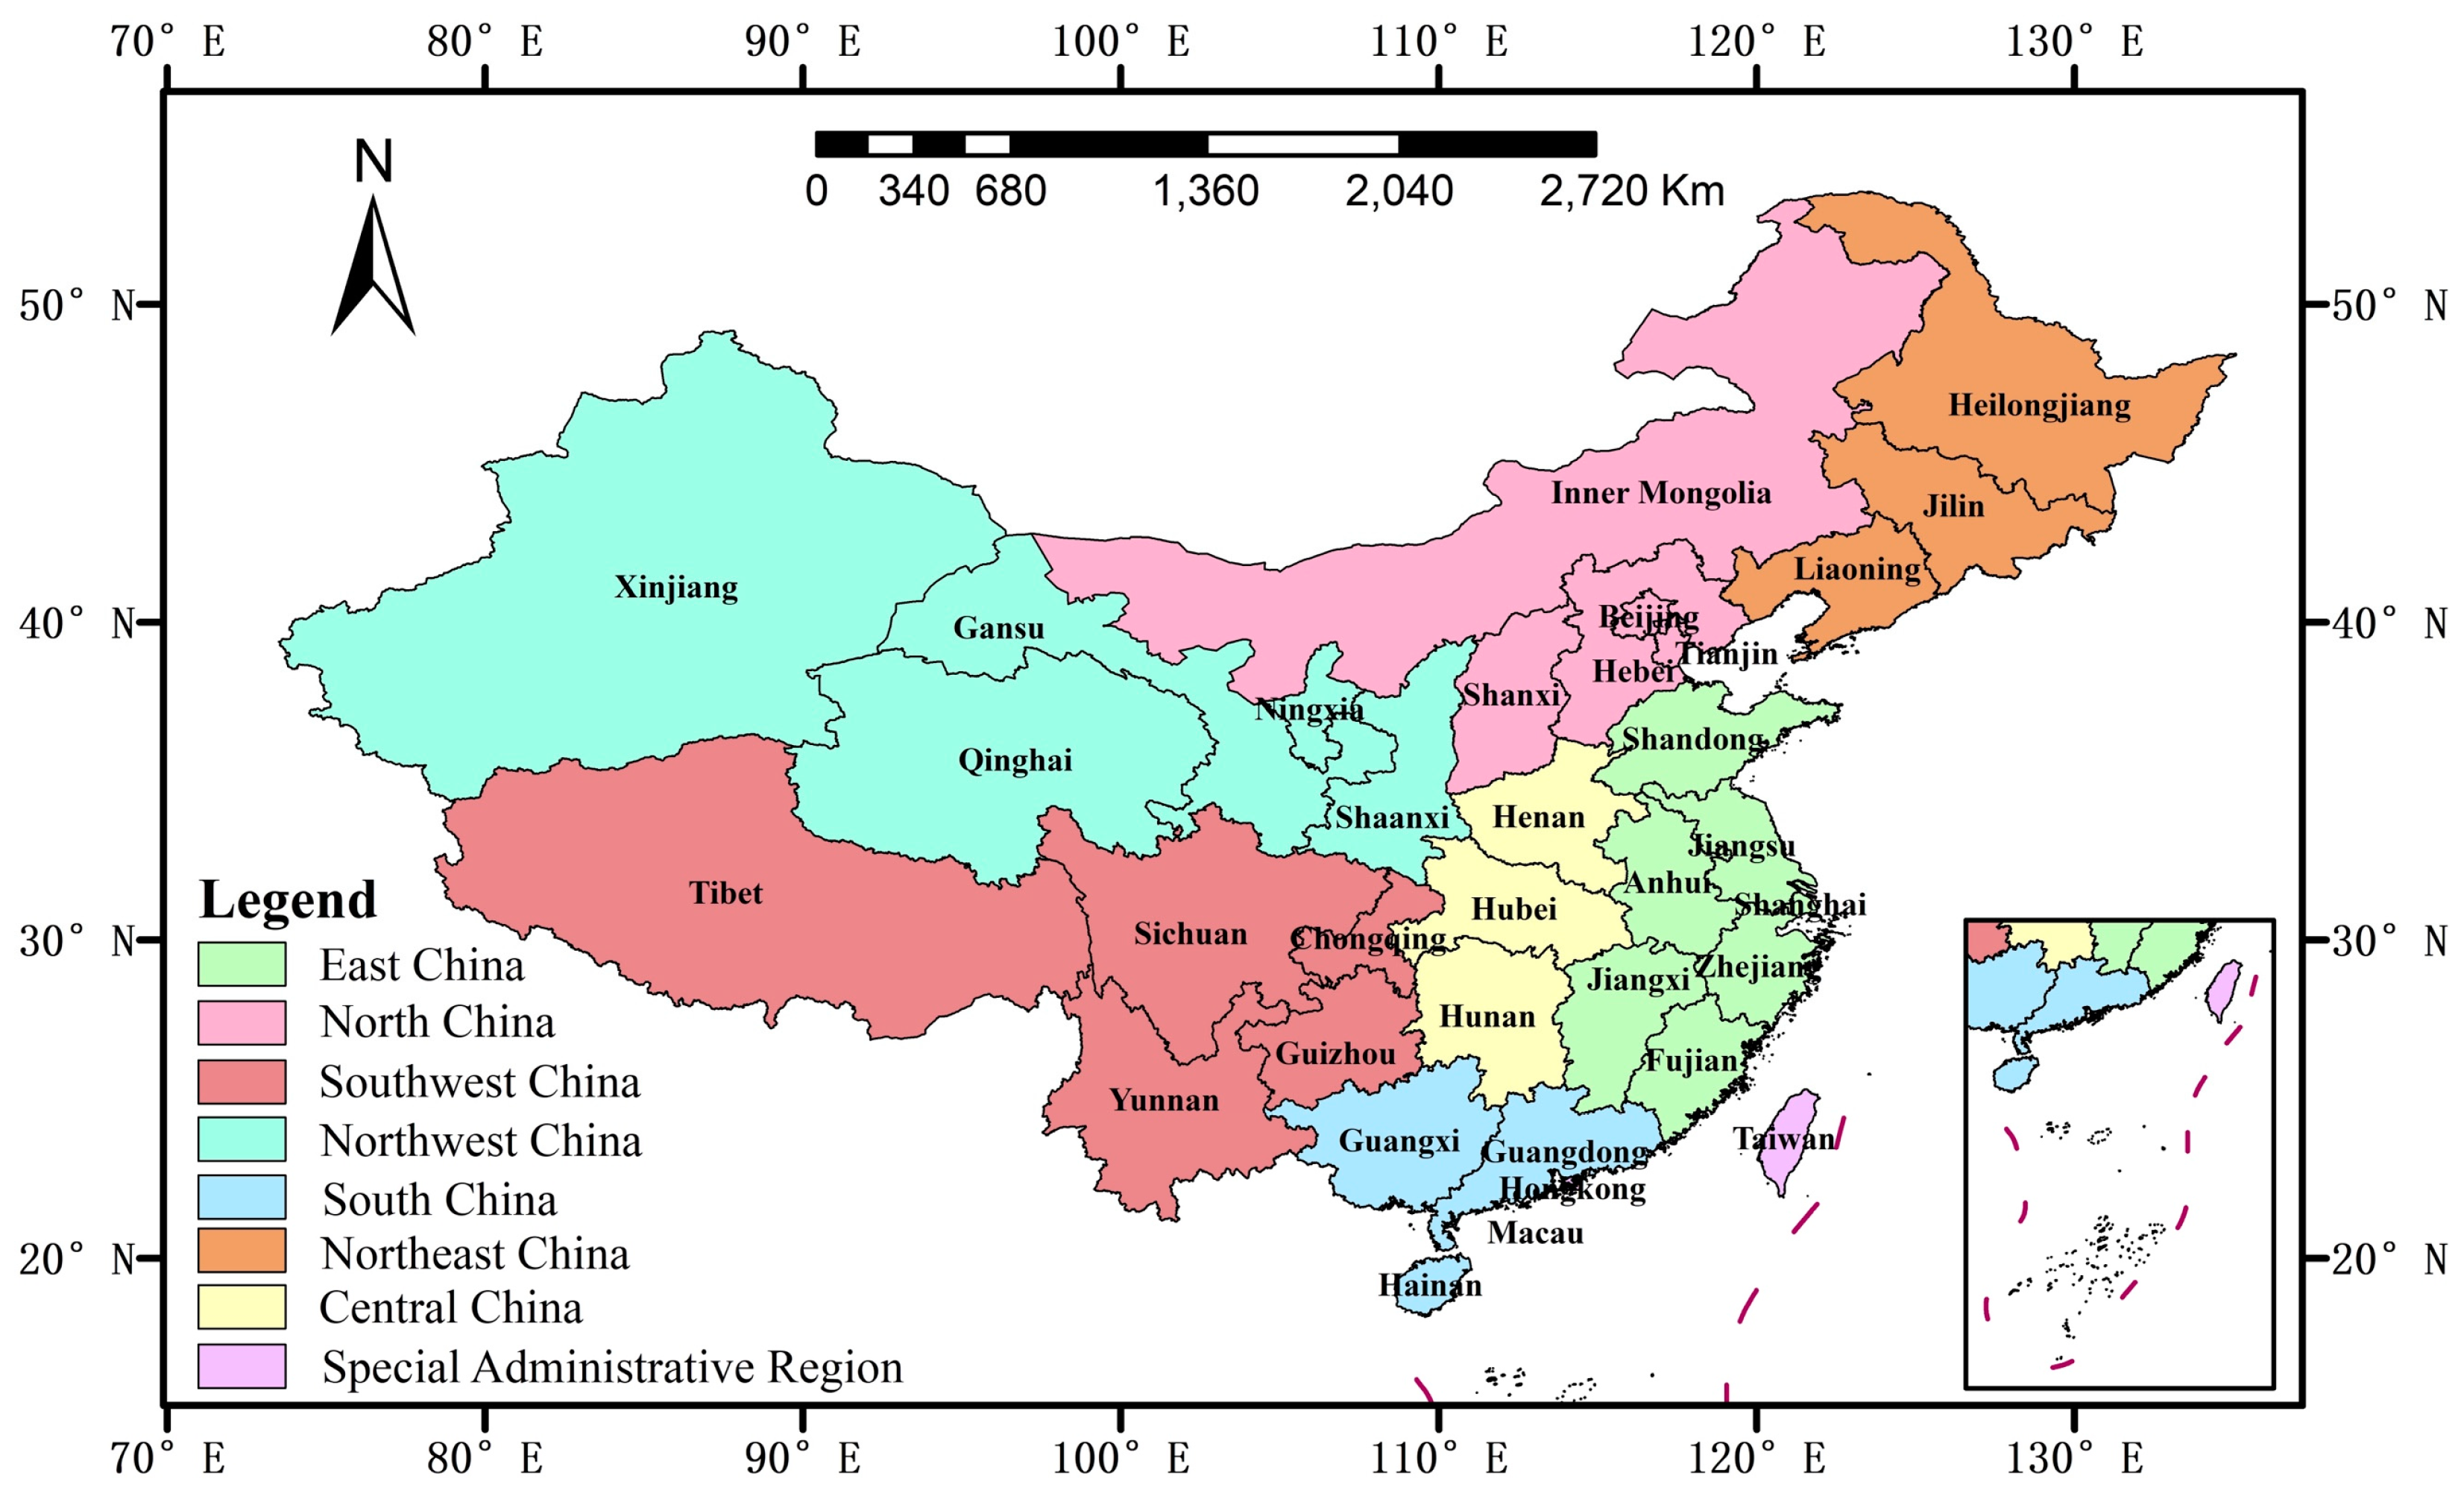
The study focuses on the entire region of China, which is a vast country located in East Asia. China has diverse geographical features, with its eastern and southern provinces bordering the Pacific Ocean, its western region being deep inland, the southernmost region within the tropics, and the northern border near the boreal zone. China encompasses large river basins such as the Yangtze River Basin, Yellow River Basin, and Pearl River Basin, as well as various deserts like the Taklimakan Desert. The complex and diverse topography, along with the differences in the thermodynamic properties of sea and land, the large span of land, contribute to the varied and complex climates across China.
China exhibits rich climate characteristics. In the eastern parts, from the south to the north, three main types of climate can be observed: tropical monsoon climate, subtropical monsoon climate, and temperate monsoon climate. In Western China, the main climate type is temperate continental climate, while the dominant type in the Qinghai–Tibetan Plateau is Alpine climate. Winter temperatures exhibit a substantial difference between the north and south, with variations reaching up to 50 °C. Summers are generally characterized by high temperatures, with average temperatures in July exceeding 20 °C. Precipitation shows uneven distribution both in space and time, with annual rainfall decreasing from the southeastern coastal areas to the northwest inland regions. The majority of precipitation in most areas is concentrated from April to October. Due to the unequal distribution of population, significant disparities exist in terms of precipitation, temperature, and LULCC across different regions of China. To effectively illustrate the spatial distribution of precipitation, temperature, and LULCC throughout the country, this study utilizes a map showing the provincial and administrative geographical divisions of China (Figure 1).
2.2. LUMIP Models
This study utilizes precipitation and temperature simulation outputs from models participating in LUMIP within the CMIP6 framework. LUMIP is a specific project launched as part of CMIP6 to address the challenges associated with LULCC. The LUMIP program focuses on addressing the following three scientific questions [39]: (1) What are the global and regional effects of LULCC on climate and biogeochemical cycling (past–future)? (2) What are the impacts of land management on surface fluxes of carbon, water, and energy? (3) Are there regional land use or land management strategies that have the potential to help mitigate climate change? It is important to note that the term “LUMIP” specifically encompasses land cover changes driven by human activities only [39].
Within LUMIP, each participating climate model conducts control and sensitivity experiments. The two most representative experiments are the historical experiment and the hist-noLu experiment. The historical is the coupled CMIP6 historical experiment that incorporates historical land use, land cover, land management, and transient forcings (e.g., CO2 and nitrogen and aerosol depositions). It utilizes transient land use data that are updated annually. On the other hand, the hist-noLu experiment is the same as the historical experiment except that it does not include land use change. This experiment uses constant land use data with all land state, transition, and management (irrigation, fertilization, wood harvest, and biofuel cultivation) being maintained at the 1850 levels. By comparing the model outputs from these two experiments, we can quantitatively analyze the impacts of LULCC on climate in China. This comparison allows for a better understanding of how LULCC influences changes in precipitation and temperature, while also enabling us to differentiate and evaluate the contributions made by different types of land use changes.
2.3. Data Sources
To assess the simulation capabilities and applicability of four models, this study also incorporates the historical observed precipitation and temperature data. The precipitation observational data comprises monthly precipitation observations from the Global Precipitation Climatology Project, version 2, produced by the Earth System Science Interdisciplinary Center and the Cooperative Institute for Climate and Satellites at the University of Maryland College Park. The dataset has a spatial resolution of 2.5° × 2.5° and covers the time period from January 1979 to October 2021. The historical observed temperature data were derived from the CRU TS3.21 dataset produced by the Climatic Research Unit (CRU) at the University of East Anglia and distributed by the National Centre for Atmospheric Science in the United Kingdom. The dataset has a spatial resolution of 0.5° × 0.5° and covers the time period from January 1901 to December 2012 [40].
Regarding the precipitation and temperature simulation data, out of the approximately 19 models registered to participate in LUMIP [41], this study selected four models for analysis: BCC-CSM2-MR, CESM2, IPSL-CM6A-LR, and UKESM1 (Table 1), based on the data availability at the start of this study and their representativeness due to their diverse affiliations. The research data included historical precipitation and temperature simulations considering historical land use (historical) and simulations with no land use (hist-noLu). The period of these simulations covered 1850–2014.
To study LULCC’s correlation with precipitation and temperature, the historical land use (vegetation cover) data were obtained from the Land Use Harmonization 2 Project (LUH2). LUH2 is a new set of global gridded land use forcing datasets, which was developed to characterize historical land use and future projections in a standard format required by global climate models. This land use harmonization strategy estimates the fractional land use patterns, underlying land use transitions, and key agricultural management information annually for the period 850–2100 at 0.25° × 0.25° resolution [42,43]. In this study, spatial distributions and changes in 16 plant function types (PFT) (Table S1) in China from the LUH2 dataset from 1901 to 2014 were used to assess the relative contribution of each type of land-state change. To simplify and facilitate comparison, we disregarded non-vegetated land (PFT 0) due to its irrelevance to the study and divided the other 15 plant functional types (PFTs) into the following four main land cover groups: forestland (PFTs 1–8), shrub land (PFTs 9–11), grassland (PFTs 12–14), and cropland (PFT 15).
2.4. Overall Methodology
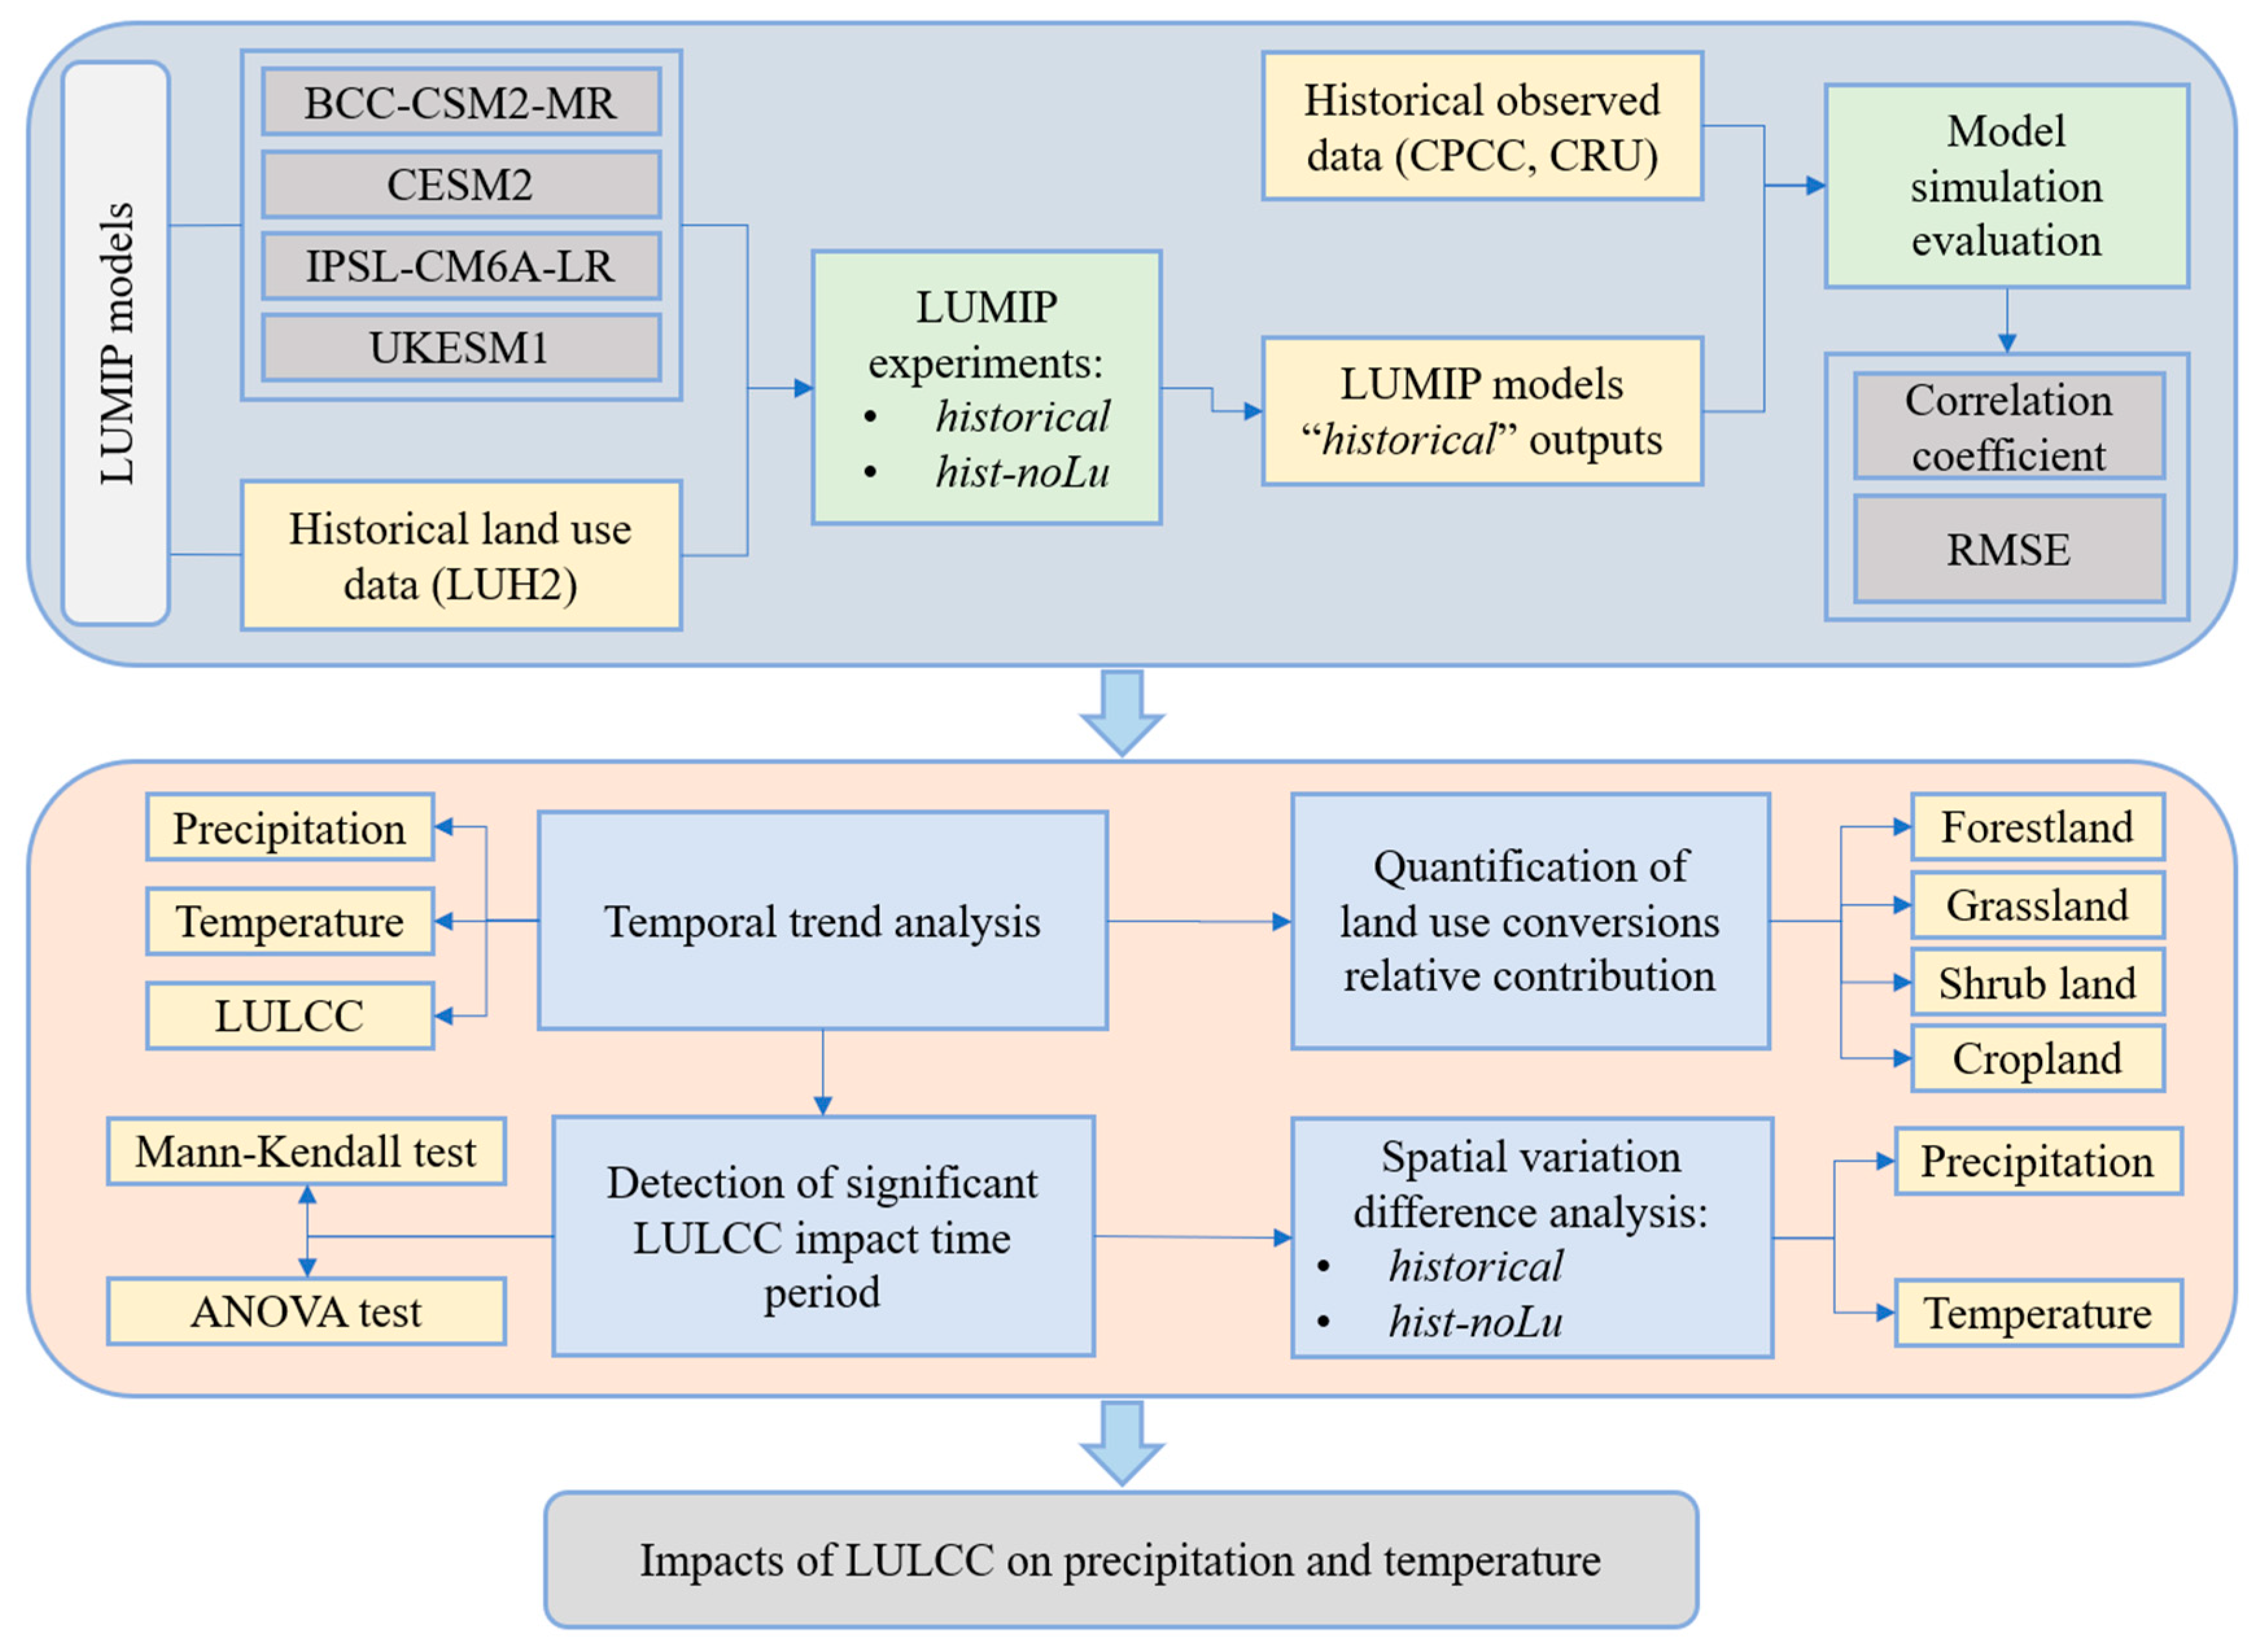
The overall methodology of this study is shown in Figure 2.
First, we compared the spatial distributions of mean annual precipitation and mean annual temperature in China during 1979–2012 from the historical observed data and the four LUMIP models (BCC-CSM2-MR, CESM2, IPSL-CM6A-LR, and UKESM1). This comparison with the calculations of correlation coefficient (CC) and root mean square error (RMSE) helped assess the simulation skill and capability of the models for further research. The CC and RMSE were calculated as follows:
and represent the mean annual observation 1979–2021 precipitation and historical precipitation ensembled from the four models, respectively, while and represent the mean annual observation 1901–2012 precipitation and historical precipitation ensembled from the four models, respectively. The number of years of study period is represented by n.
Second, we analyzed the temporal variations of PFT percentages in the four main land cover groups during 1850–2014. By evaluating the land use variation curves, we identified the trend in LULCC in China and the periods that the main significant changes occurred. We also examined the temporal variations curves of precipitation and temperature from historical simulations and hist-noLu simulations during 1850–2014. These curves allow for the evaluation of the trends in temporal precipitation and temperature variations, the comparison of differences between the historical and hist-noLu experiments, and the identification of periods with significant variations and differences. These curves allow for the evaluation of the trends in temporal precipitation and temperature variations, the comparison of differences between the historical and hist-noLu experiments, and the identification of periods with significant variations and differences.
Third, to quantify the relative contribution (RC) of different types of land use conversions, we established statistical relationships between LULCC and its effects on precipitation and temperature differences between historical and hist-noLu experiments (historical—hist-noLu). Due to multicollinearity between different types of LULCC, we used ridge regression (RR) to avoid these effects. The RR model enables us to estimate the regression coefficients (REC) for each type of LULCC. The RC of each type of vegetation type is calculated by the standardized ratio of (the sum of RC is 100%). Generally, higher regression coefficients have larger impacts on the regression results (dependent variable). This approach, which has been validated in previous studies [44,45,46], allows us to rank the importance of different types of LULCC impacts on precipitation and temperature and better understand their correlation.
Fourth, a Mann–Kendall test was carried out to find the mutation points and significant points of precipitation and temperature temporal variations. Based on this test and the evaluation of the other factors, we determined the period for analyzing spatial changes. Furthermore, to confirm whether this period corresponded to the time when the most significant impacts of LULCC on precipitation and temperature occurred, we performed an ANOVA test.
Fifth, we examined the spatial variations in precipitation, temperature, and land use that were averaged over the study period in China. We analyzed the mean annual precipitation and temperature difference between the historical and hist-noLu experiments (historical—hist-noLu) simulated by the four models. We also investigated the distribution of the changes in the proportion of four main land cover groups in China, and derived the distribution rules.
Finally, the study integrated all the aforementioned results and explored the relationship between precipitation, temperature, and LULCC. We discussed notable phenomena and observations, leading to the formulation of conclusions.
3. Results
3.1. Evaluation of LUMIP Model Outputs
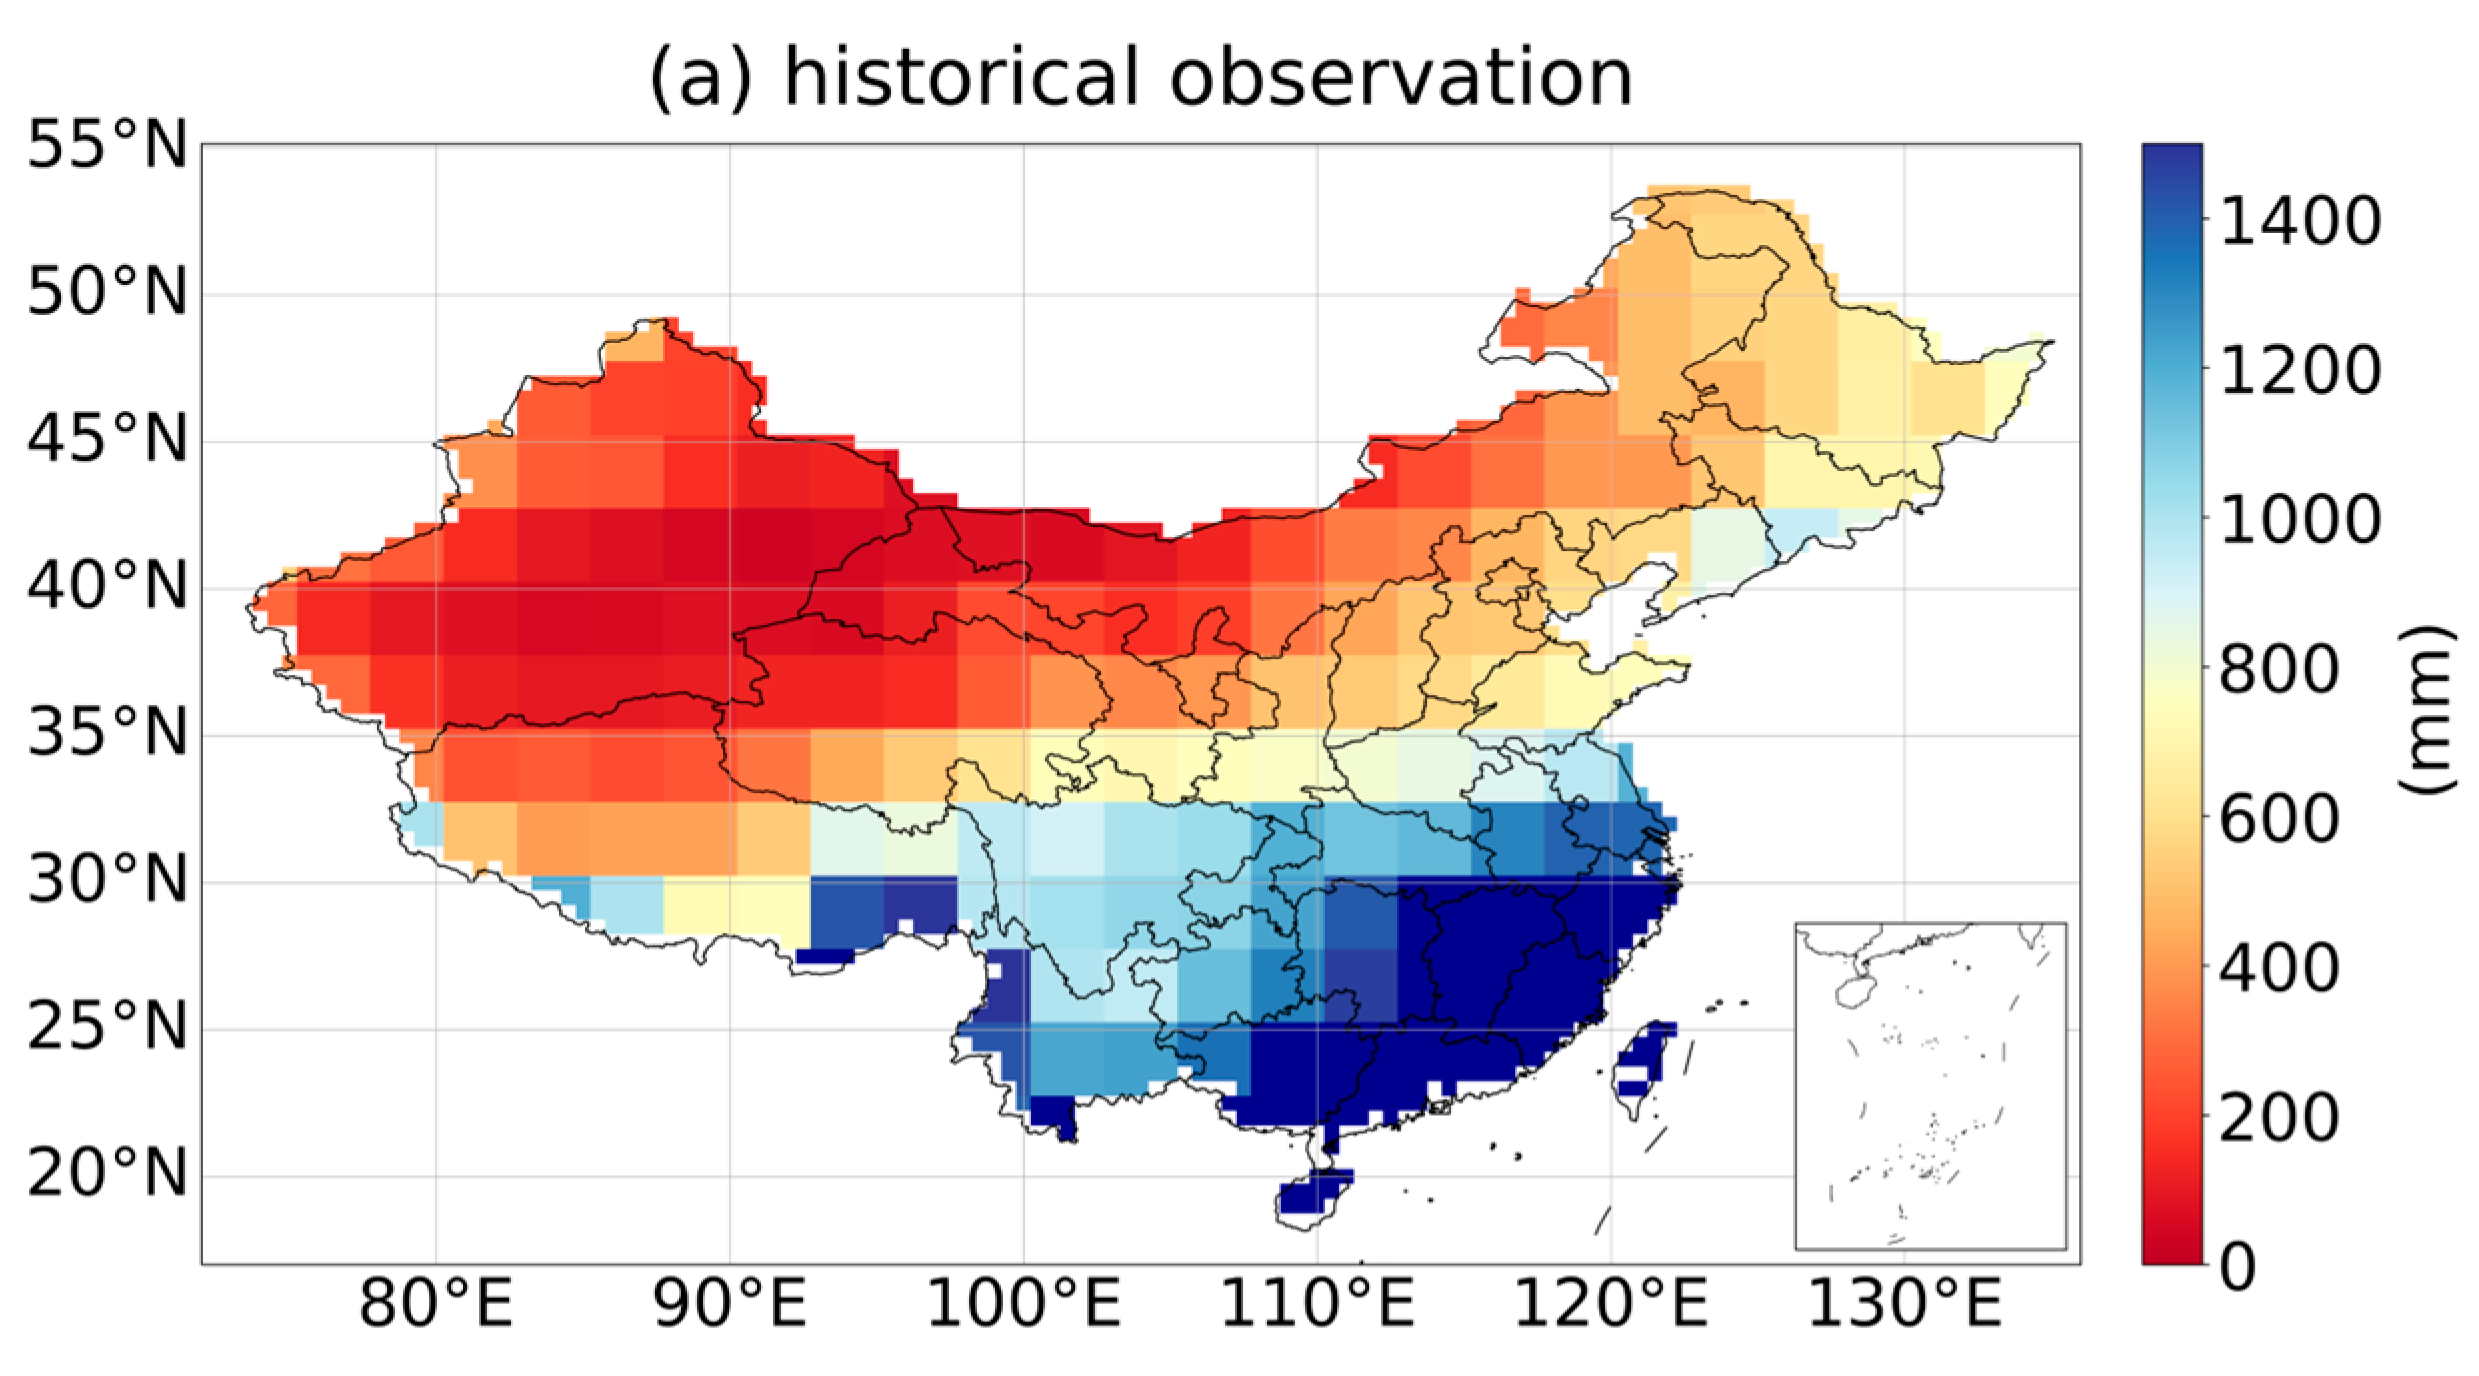
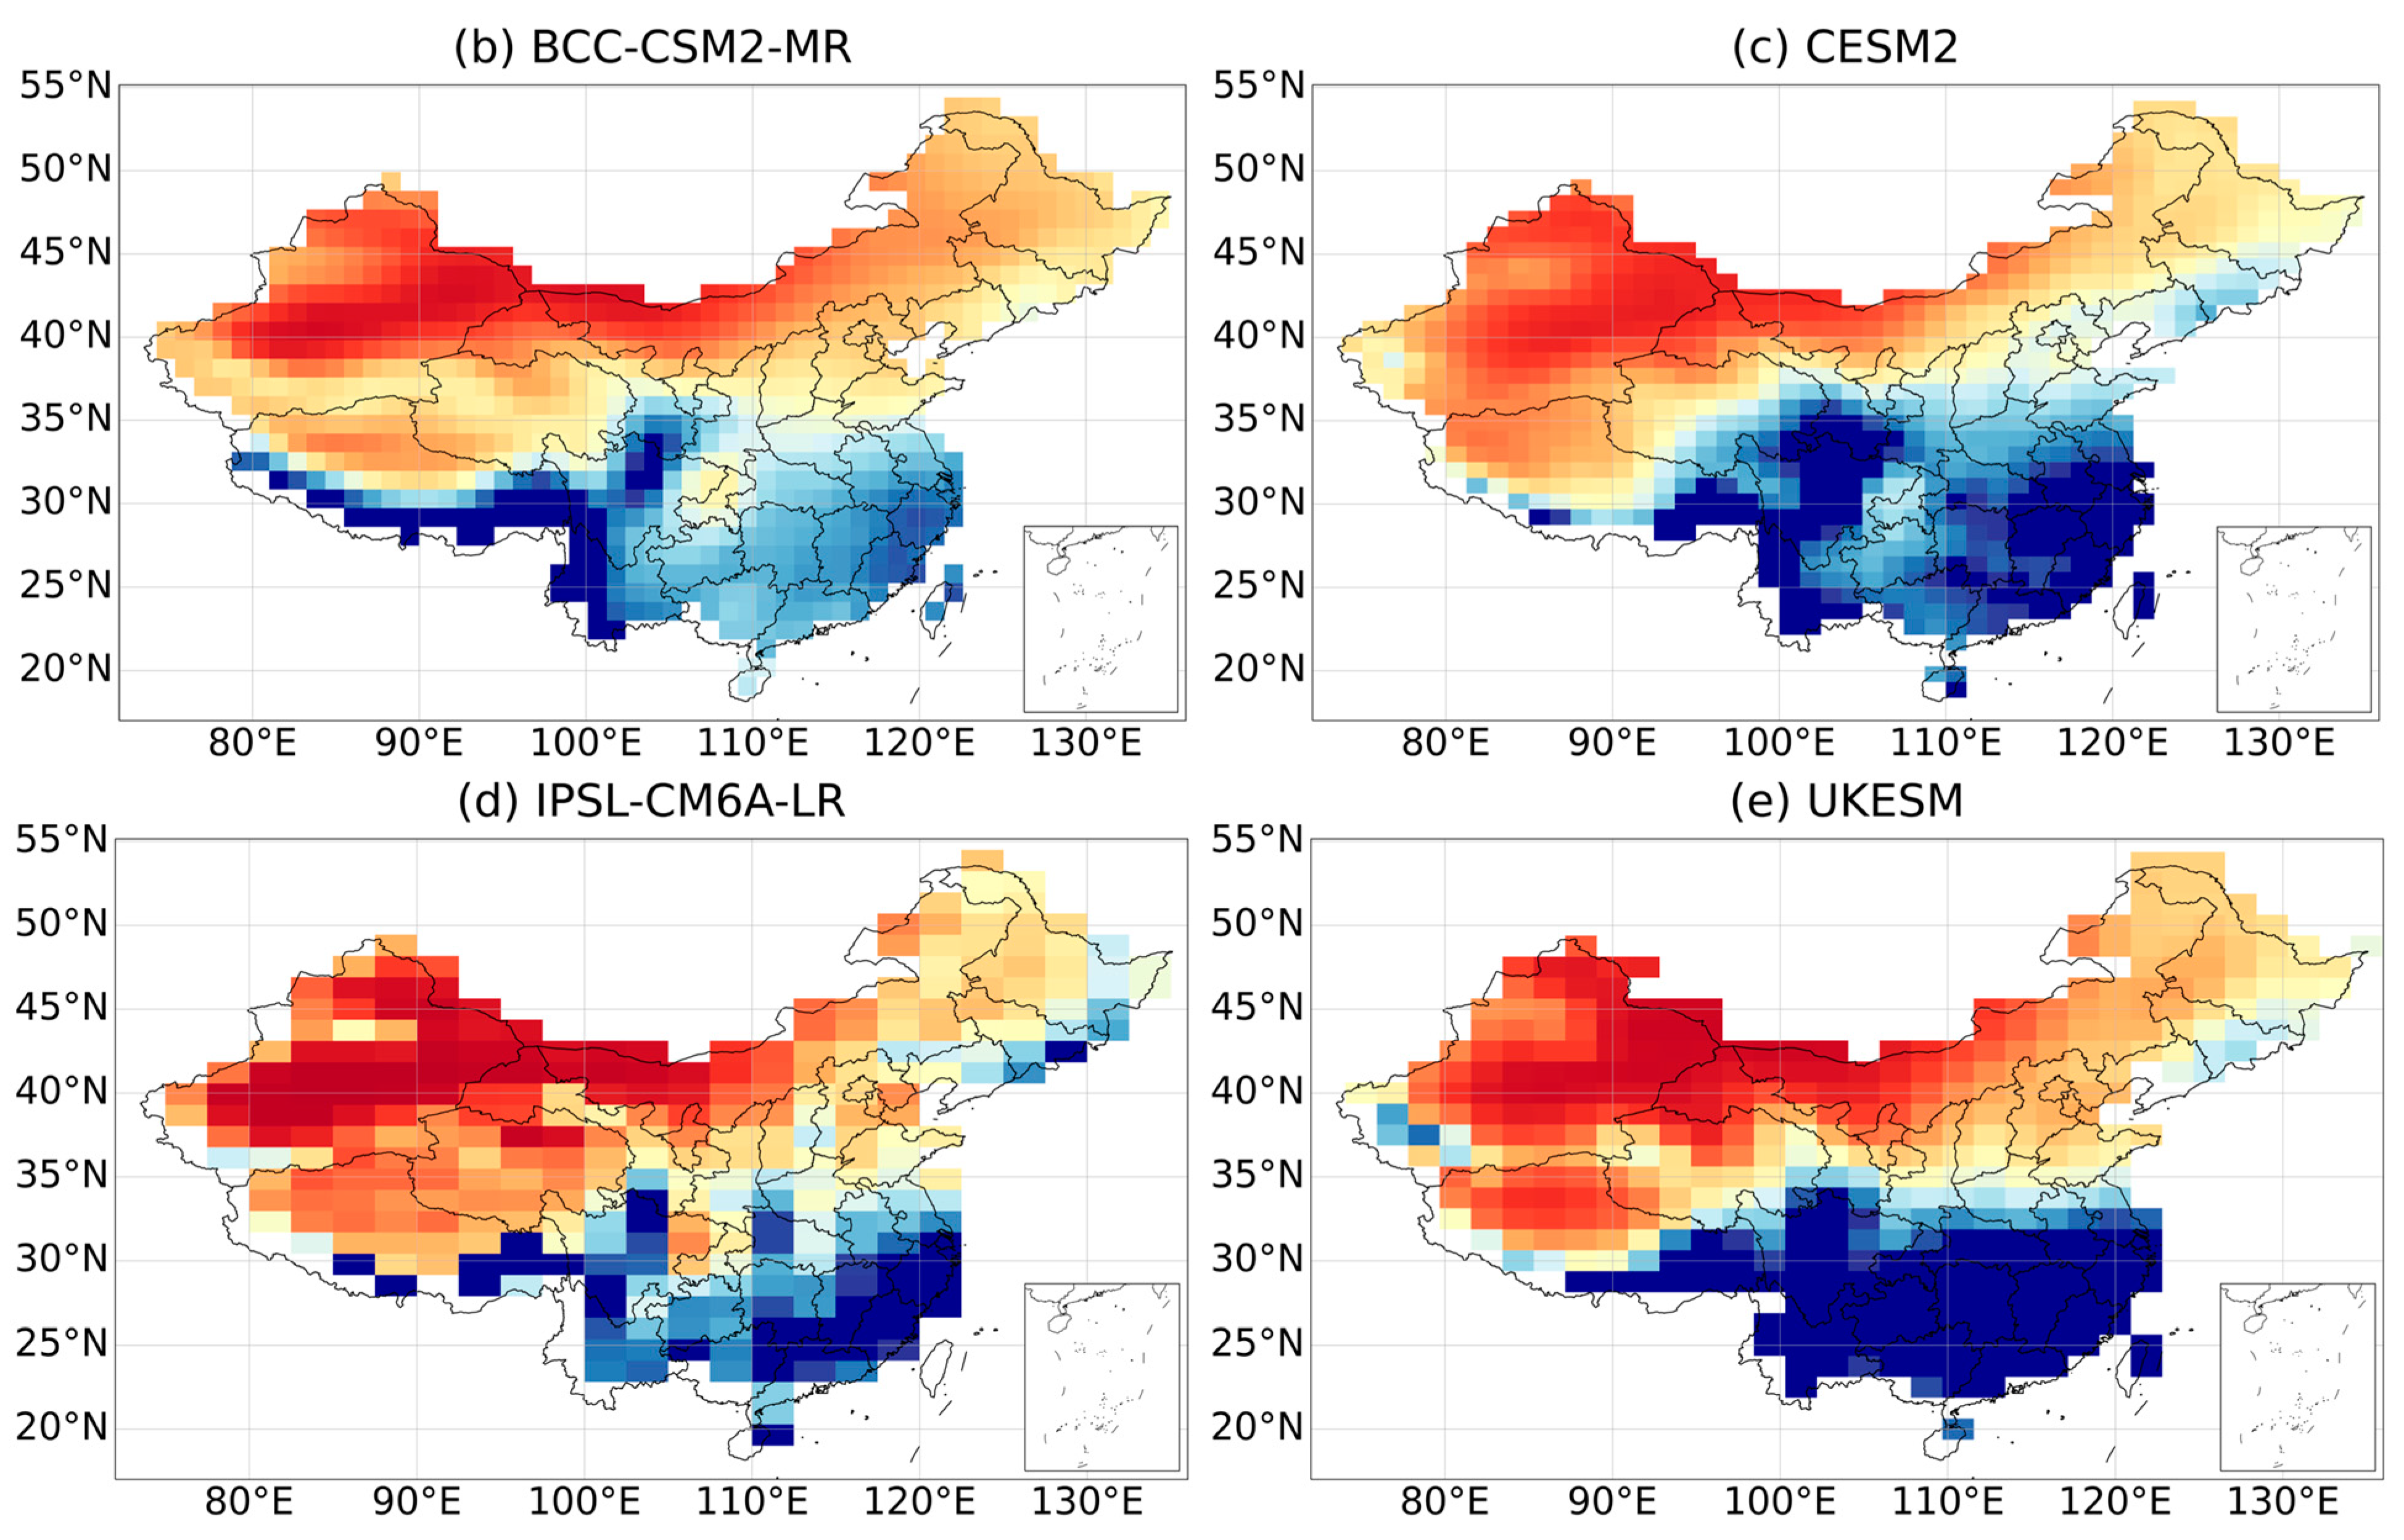
The simulated spatial distribution of historical mean annual precipitation outputs from the four models during 1979–2012 was compared with the observed data (Figure A1). The analysis revealed a CC of 0.274 and an RMSE of 154 mm. The simulated spatial distribution is generally consistent with the observations in Northern and Northwestern China, southeastern coastal areas, and the Central Tibetan area. However, noticeable differences were observed in southern inland parts of China and, to a lesser extent, in western parts of the Himalayas.
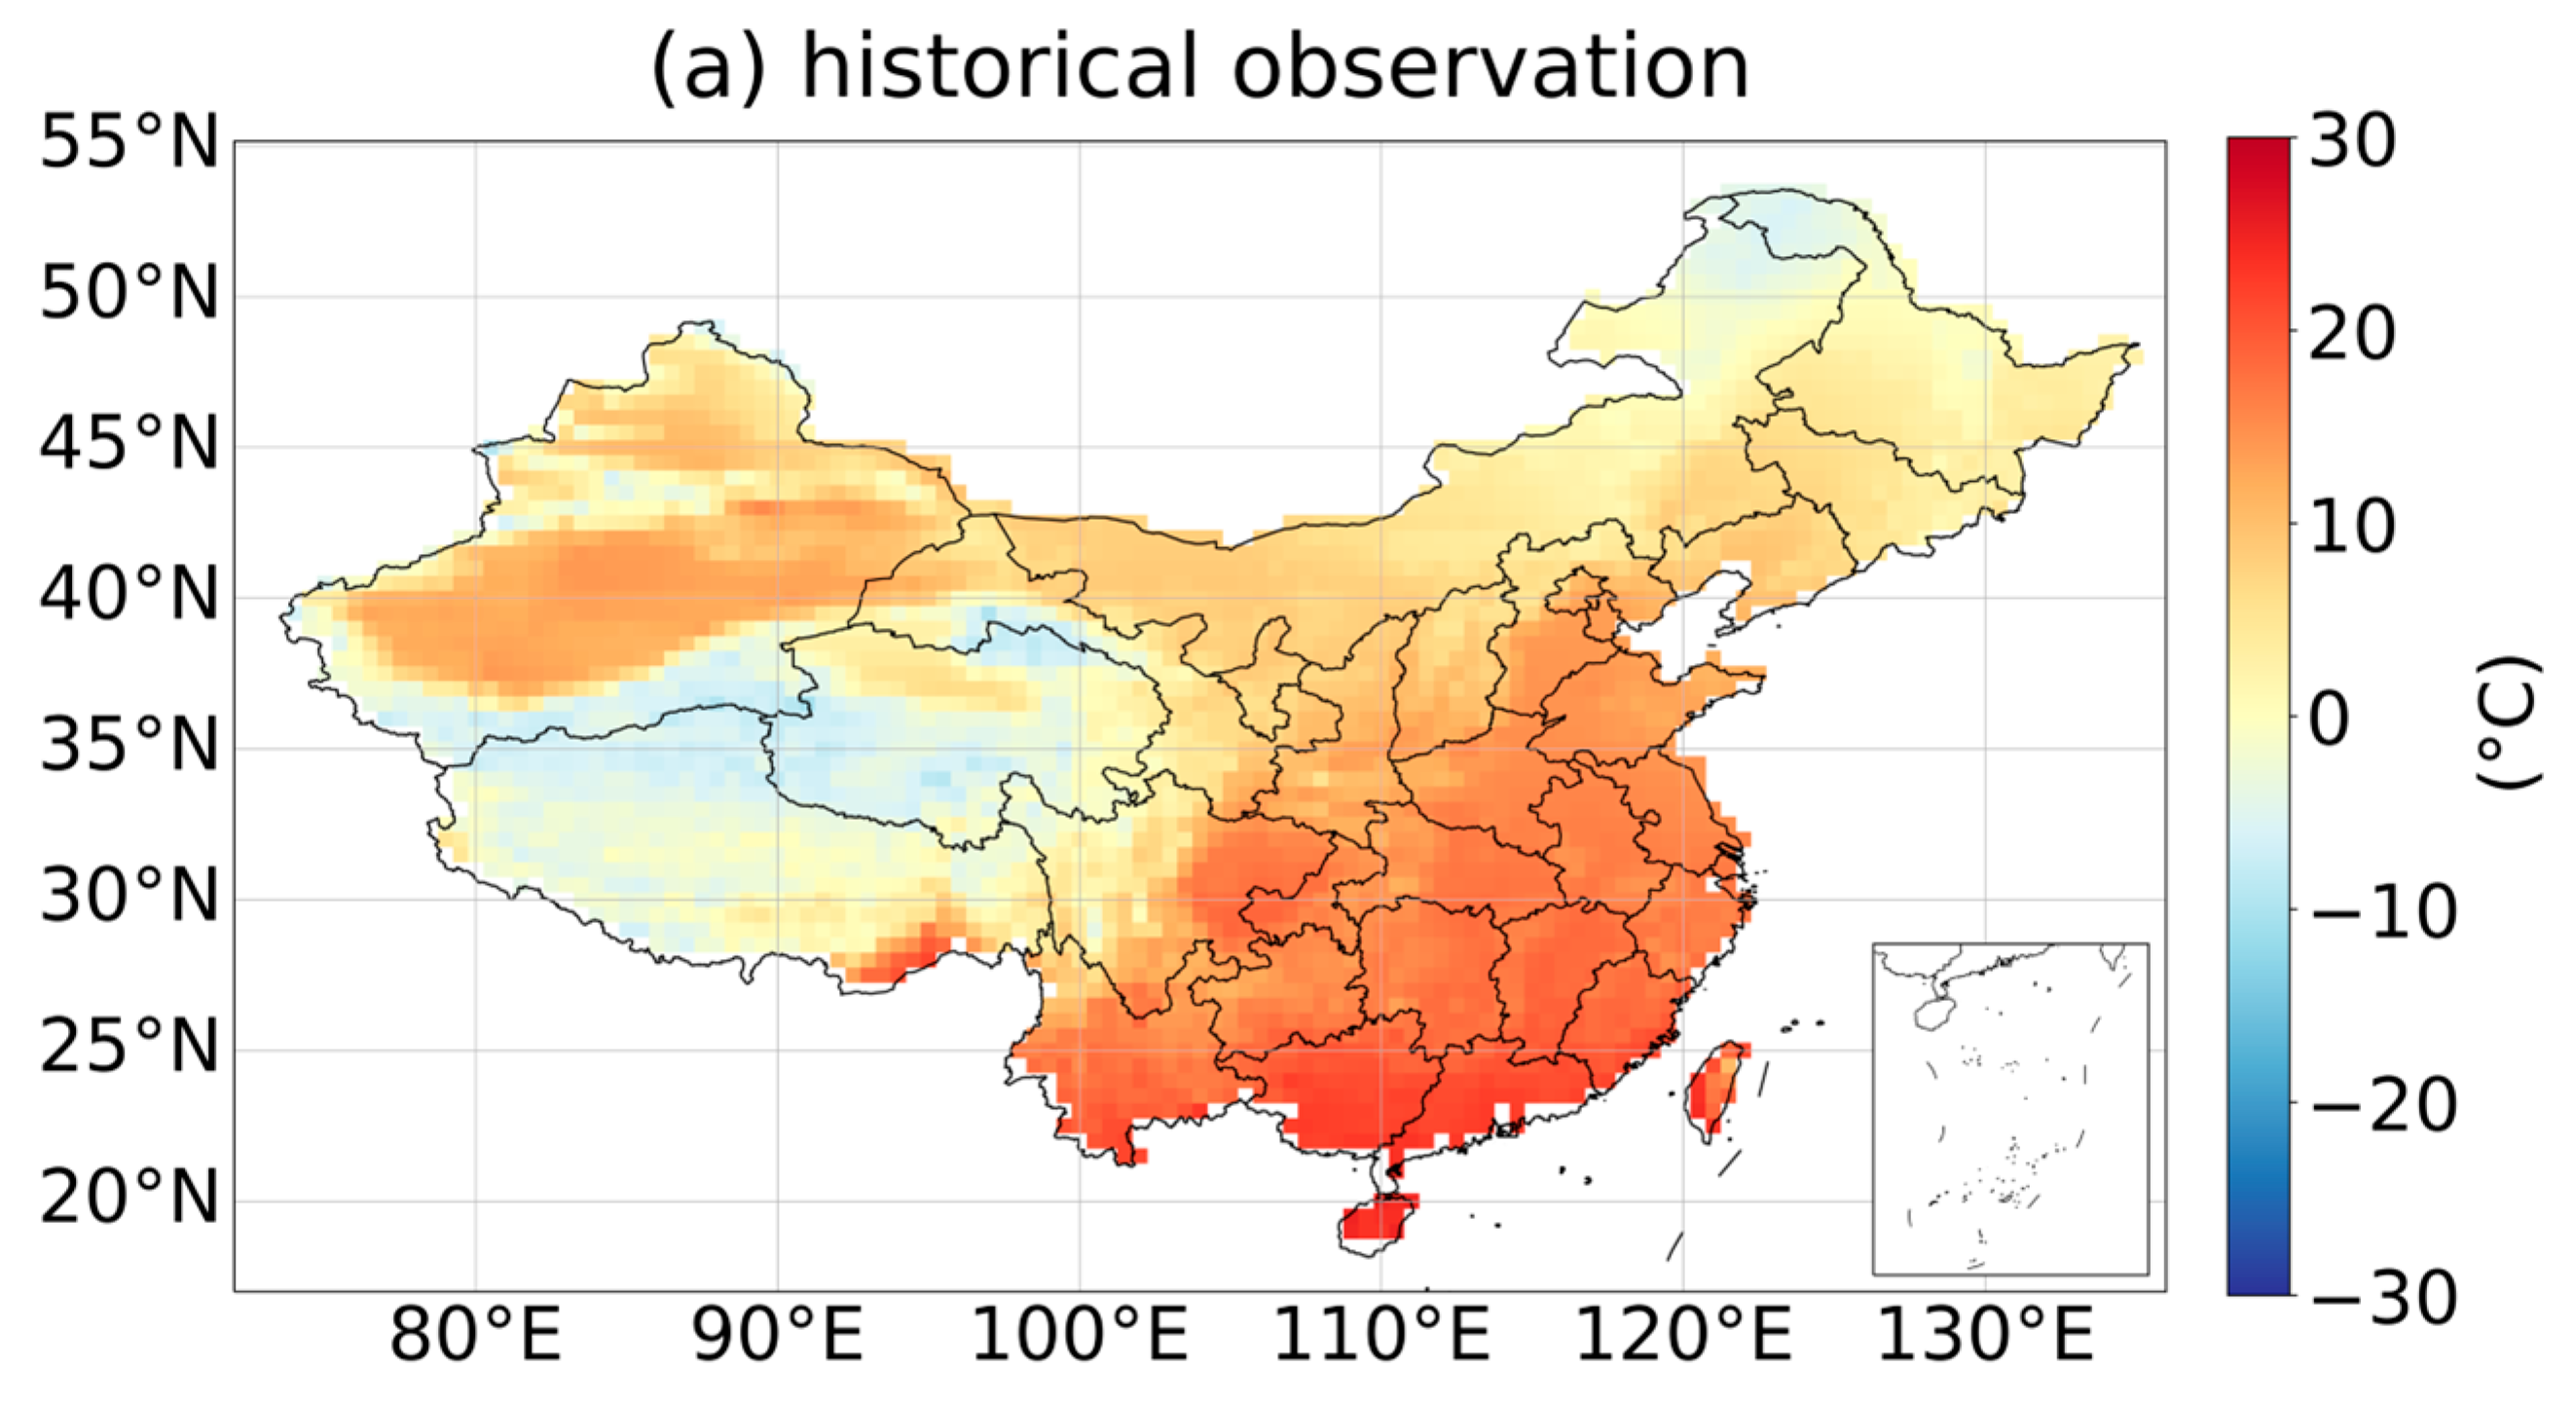
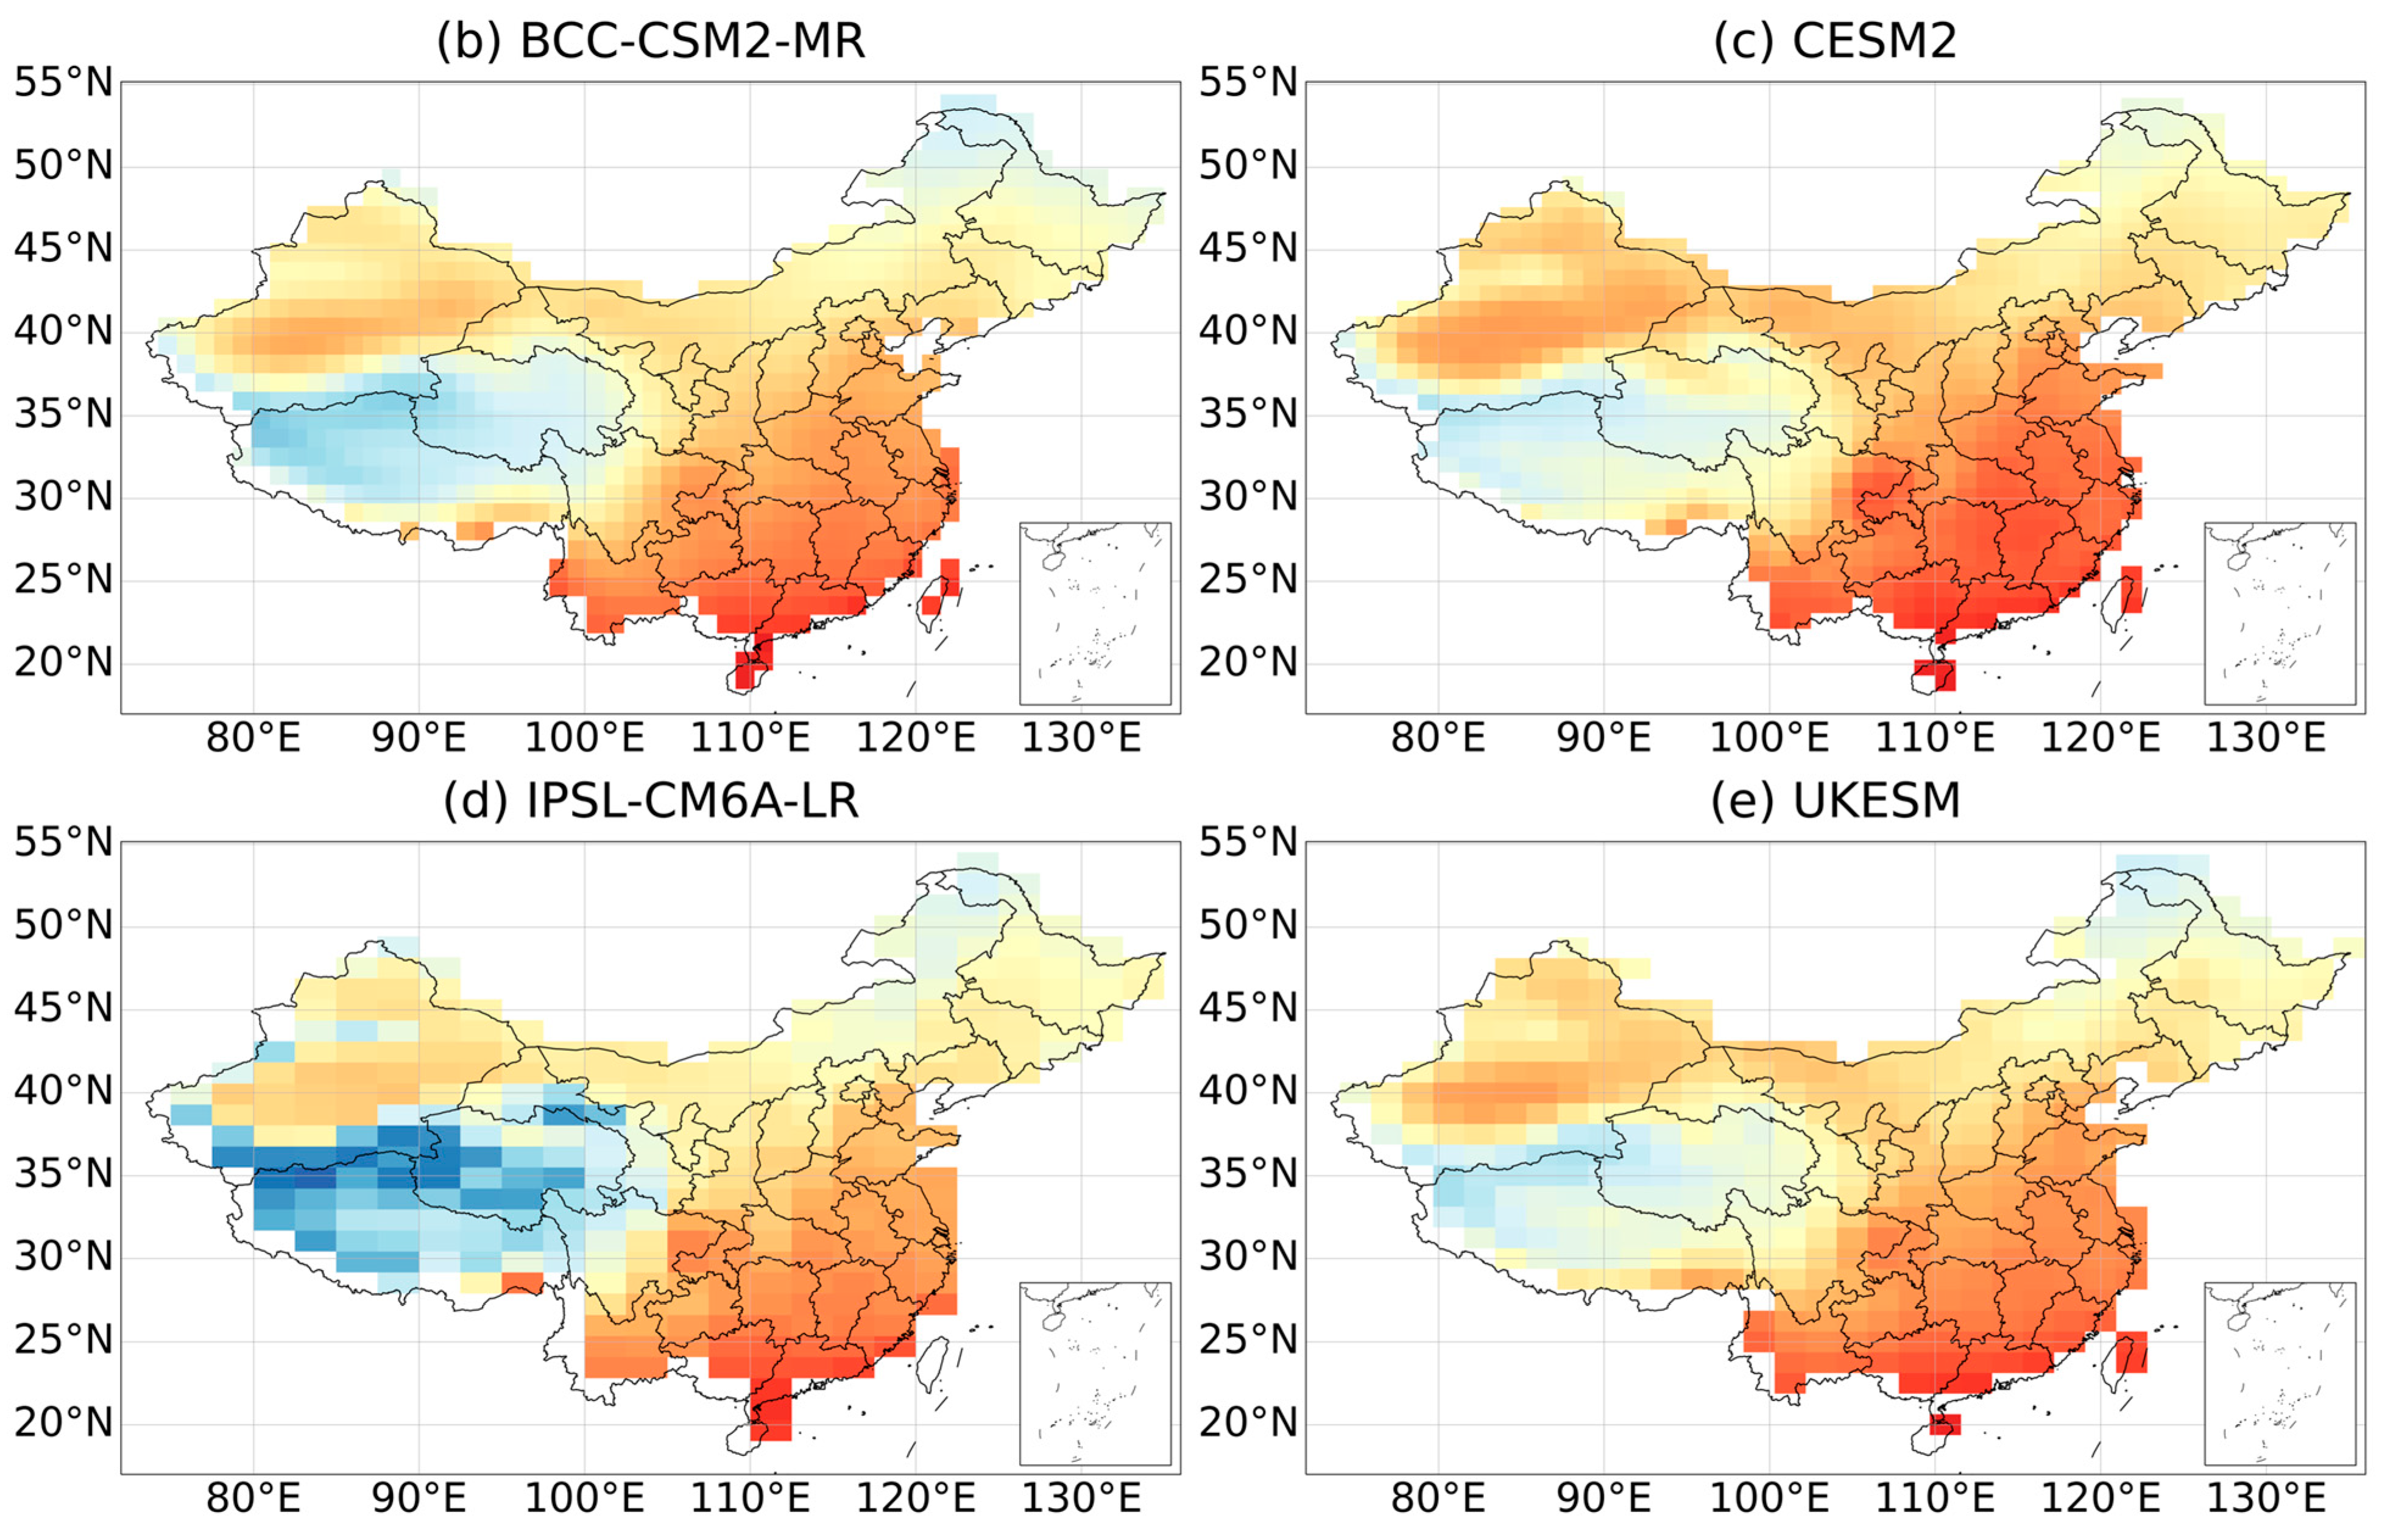
Similarly, the simulated temperature outputs from the four models were compared with the observed data (Figure A2). The analysis revealed a CC of 0.682 and an RMSE of 1.59 °C. The spatial distributions of the observed and simulated historical mean annual temperatures for the period 1980–2012 are generally consistent for most areas of China. The main differences are found in the Tibetan region and the maximum temperature in southern coastal areas.
Based on the evaluation of the model outputs, it can be concluded that the performance of the four models in simulating precipitation and temperature in China is reasonable, with only some differences observed in a few specific areas or regions with more extreme climates. Therefore, the simulation capability of the models was considered adequate for use in this study.
3.2. Temporal Pattern of LULCC
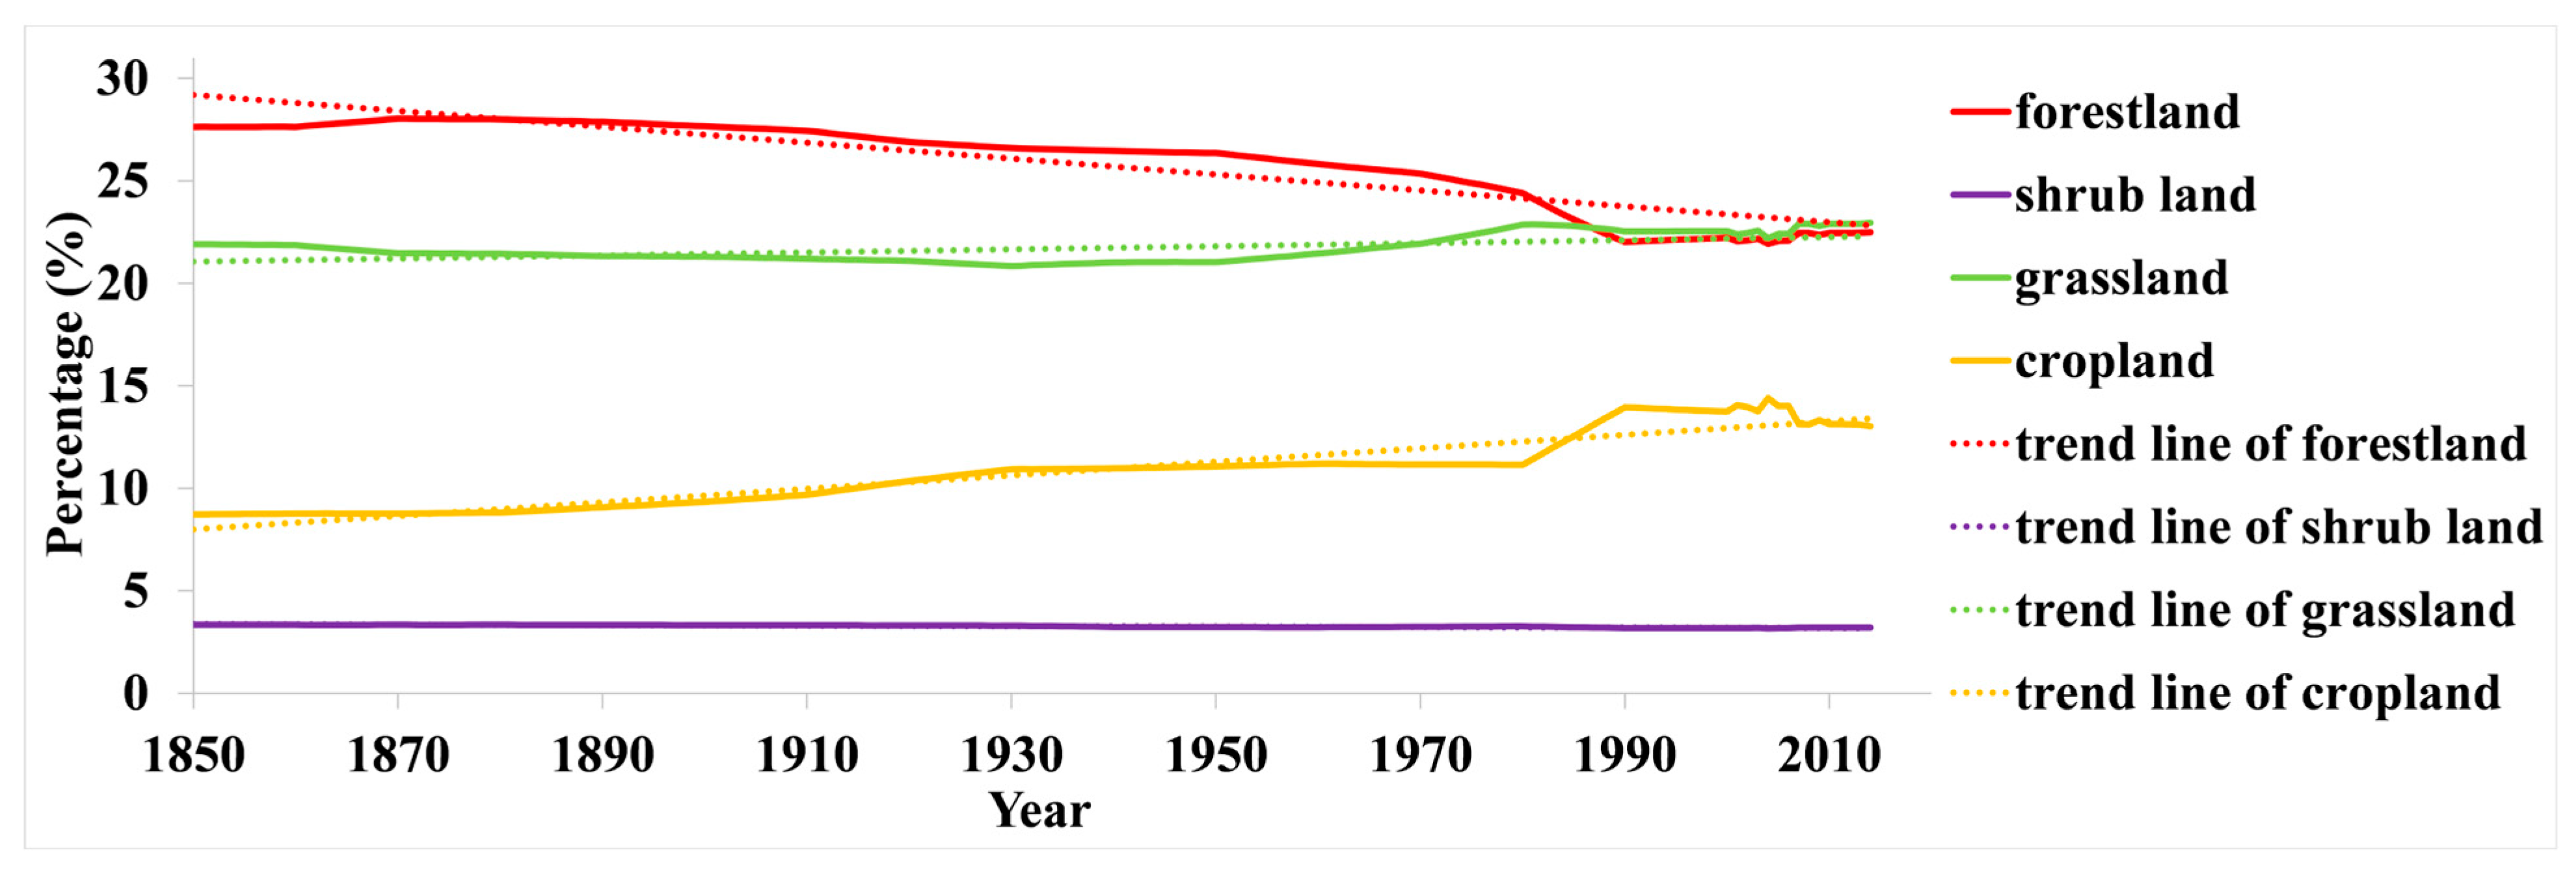
We analyze the temporal changes in the four main land cover groups in China during 1850–2014 (Figure 3). Overall, the proportion of forestland and shrub land decreased, while the proportion of grassland and cropland increased. The proportion of forestland showed a gradual and steady decline during 1850–1980. This decline intensified during 1980–1990 and turned to increase slightly during 1990–2014. The proportion of shrub land consistently experienced a slight decline without any significant mutation points. The proportion of grassland initially decreased and then increased, with a turning point occurring around 1930. Around 1980, the proportion of grassland experienced a slight decline and subsequently from 1990 to 2014. In contrast, the proportion of cropland exhibited a continuous increase, with a surge in the rate of increase around 1980. From around 1990, the proportion of cropland also exhibited fluctuations, and its changing trend was opposite to that of forestland after 1980. Furthermore, changes in land use were significantly more varied after approximately 1980 compared with other periods.
3.3. Temporal Analysis of Precipitation Effects
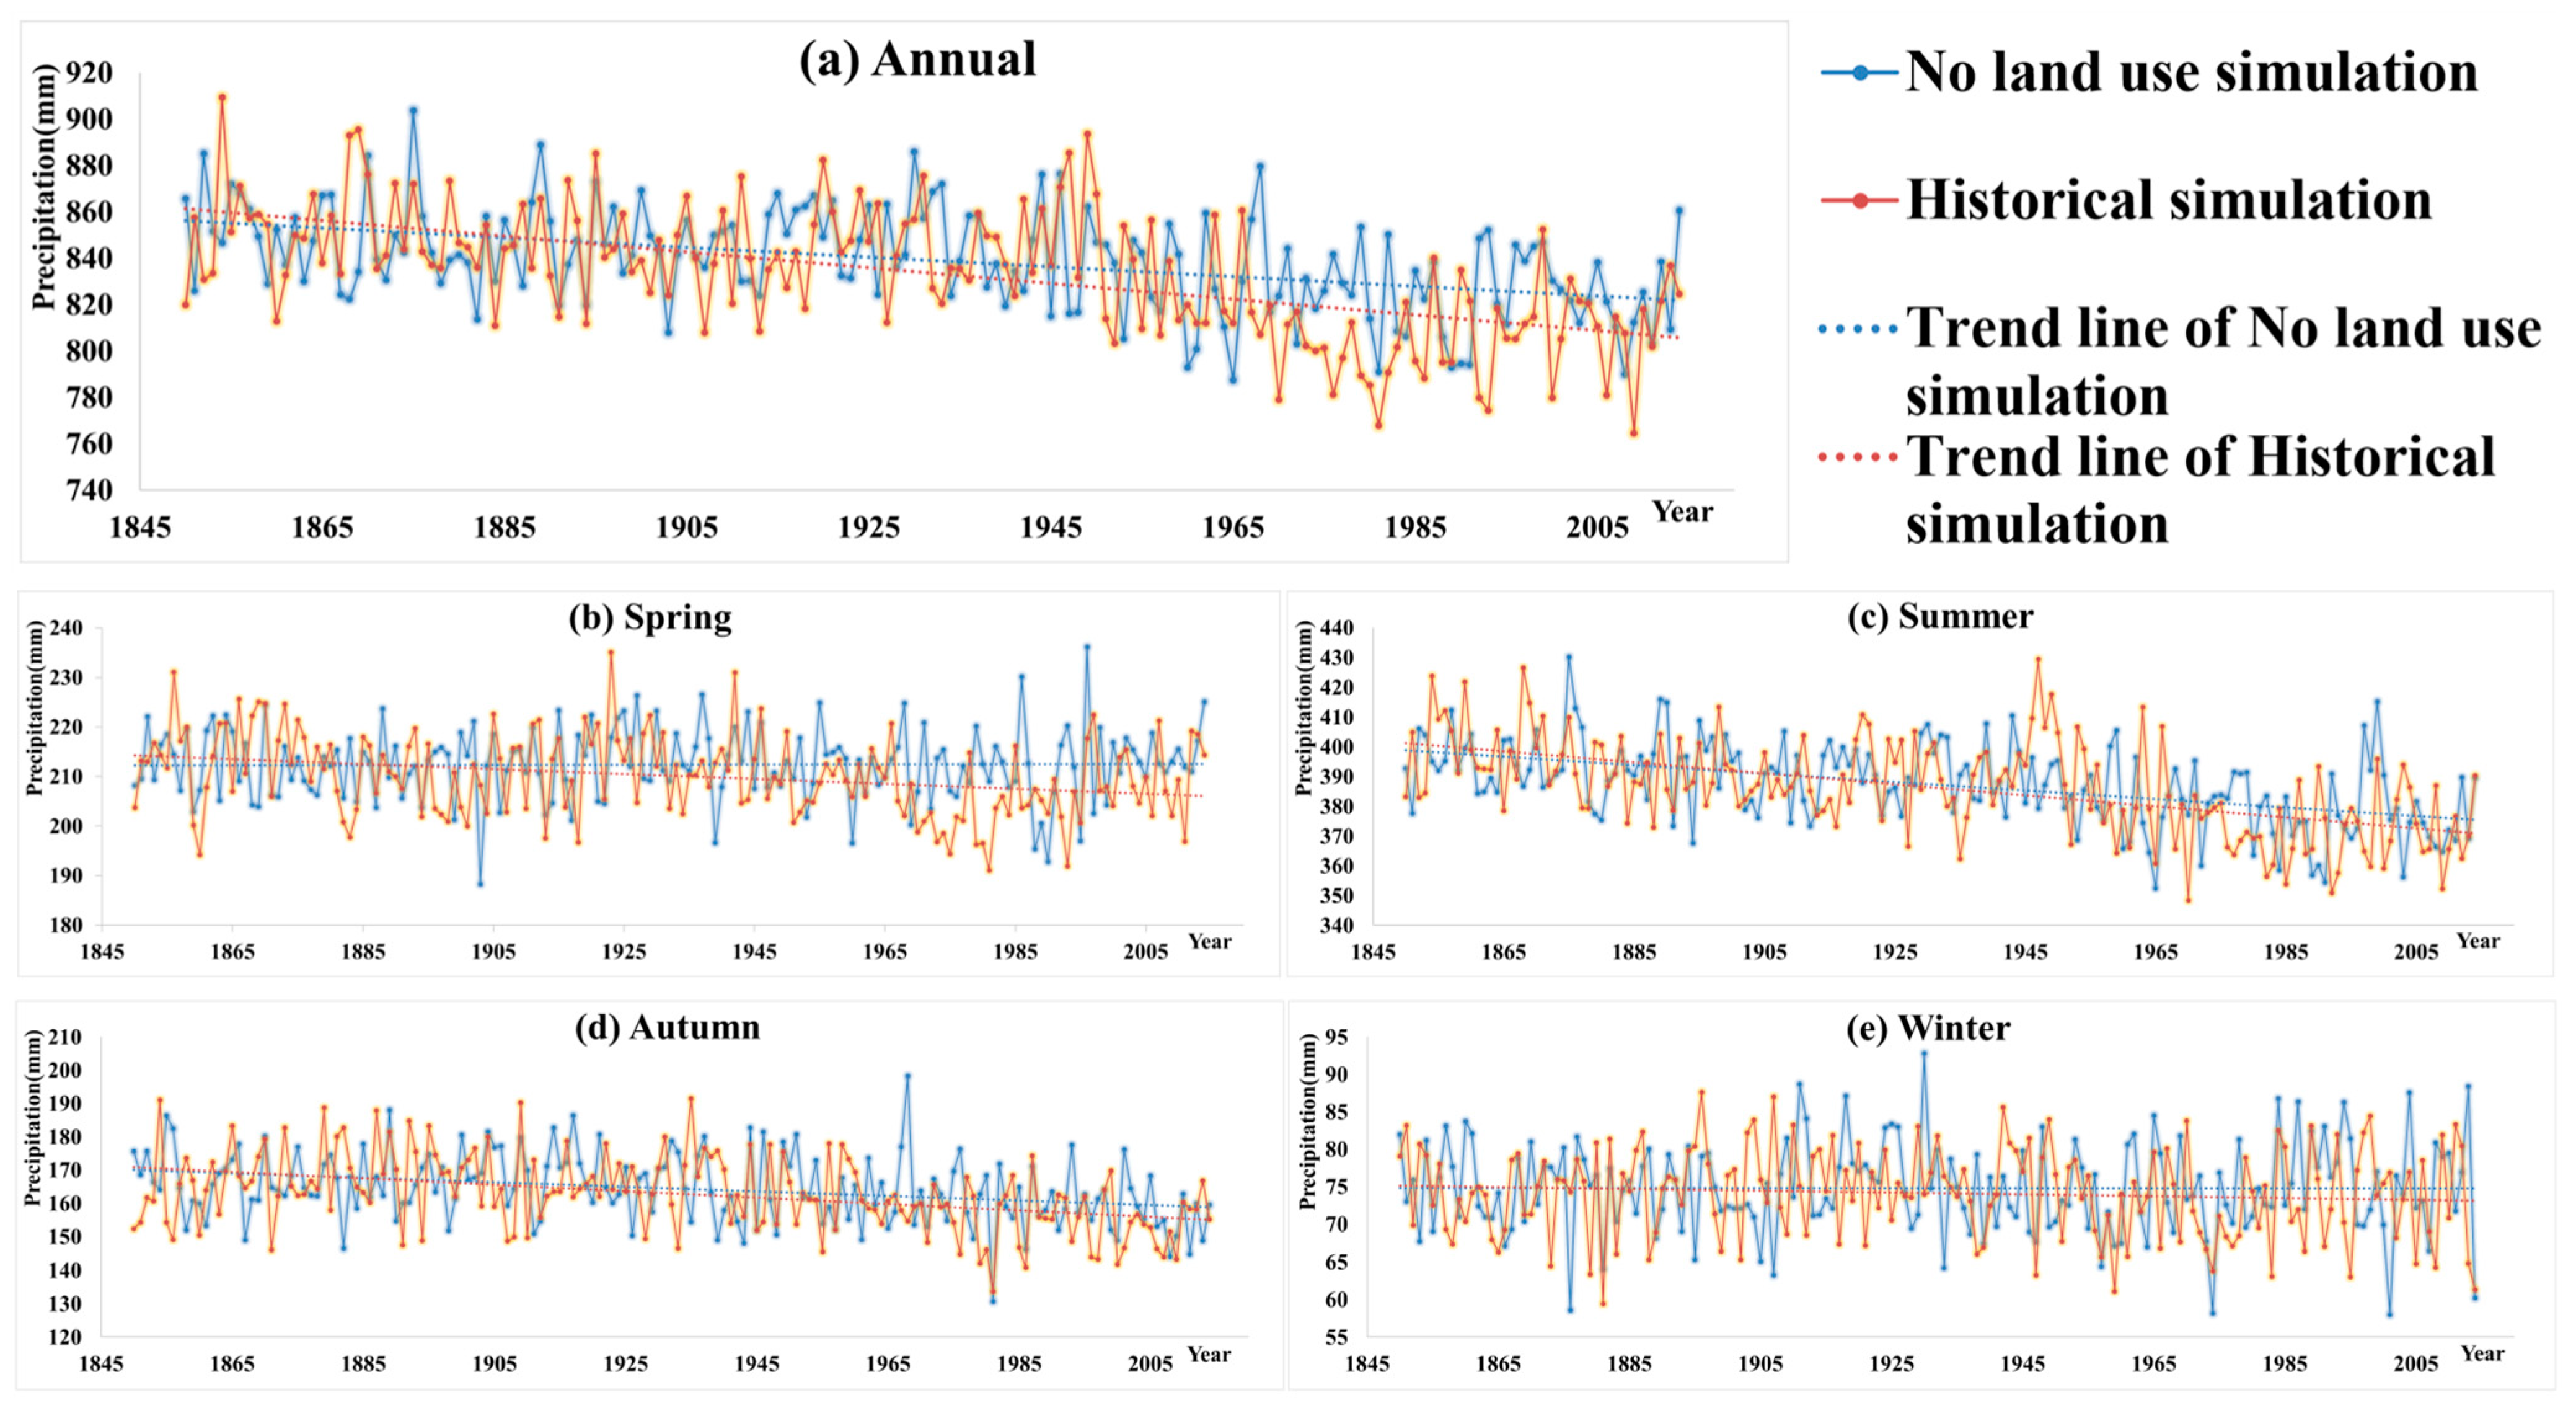
The historical and hist-noLu precipitation simulations during 1850–2014 obtained from the BCC, IPSL, CESM2, and UKESM1 climate models were ensembled. The resulting annual and seasonal mean precipitation variation curves are shown in Figure 4. Overall, precipitation in China exhibited a pattern of fluctuation and decrease over time. However, the rate of decrease varied across different seasons.
In spring, the average value of the simulated hist-noLu precipitation was 212.39 mm, and exhibiting a relatively stable trend with a small increase rate of 1.84 mm/(1000 a). In contrast, the average value of the simulated historical precipitation in spring was 210.18 mm, with a decrease rate of approximately 50.13 mm/(1000 a). The historical precipitation was substantially lower than hist-noLu during 1945–1995, but it returned to the normal level of decrease thereafter.
During summer, the average of the simulated hist-noLu precipitation was 387.16 mm, and the rate of decrease was approximately 142.36 mm/(1000 a) and broadly stable. The average value of the simulated historical precipitation was 386.17 mm, and the rate of decrease was approximately 184.91 mm/(1000 a). Aside from an abrupt increase in precipitation during 1945–1950, the remaining summer precipitation generally decreased steadily.
In autumn, the average value of the simulated autumn hist-noLu precipitation was 164.47 mm, and the rate of decrease was approximately 68.68 mm/(1000 a). The average value of the simulated historical autumn precipitation was 162.97 mm, and the rate of decrease was approximately 96.74 mm/(1000 a). The average value of the simulated autumn hist-noLu precipitation and historical precipitation was broadly stable.
For winter, the average simulated winter hist-noLu precipitation was 74.84 mm, and the rate of increase was approximately 0.153 mm/(1000 a). Except for an abrupt large increase in precipitation during 1985–1995, precipitation in the remaining years was stable and increased slowly. The average value of the simulated historical winter precipitation was 74.15 mm, and the rate of decrease was approximately 0.121 mm/(1000 a); except for a period of low precipitation during 1975–1980, for the remainder of the time, the simulated historical winter precipitation was broadly stable.
The annual simulated historical precipitation decreased at a rate of 340.50 mm/(1000a), and the annual hist-noLu precipitation decreased at a rate of 208.27 mm/(1000a), which was relatively gentle in comparison with the simulated historical decrease, and their trend lines intersected at approximately 1911. The highest value of simulated historical precipitation was approximately 909.4 mm in 1854, and the lowest value was approximately 764.5 mm in 2009. The highest value of annual hist-noLu precipitation (903.7 mm) occurred in 1875, and the lowest value (787.4 mm) occurred in 1965. The simulated historical and hist-noLu precipitation of the entire country reached its peak value during the 1850s to the 1970s and reached its lowest value early in the early 21st century.
A comparison between the simulated historical and hist-noLu simulated precipitation revealed notable discrepancies with notable differences occurring almost every ten years. These differences became more frequent and pronounced after the 1930s and 1940s. Overall, the simulated historical precipitation was generally lower than the hist-noLu simulated precipitation (i.e., most of the differences were negative).
3.4. Temporal Analysis of Temperature Effects
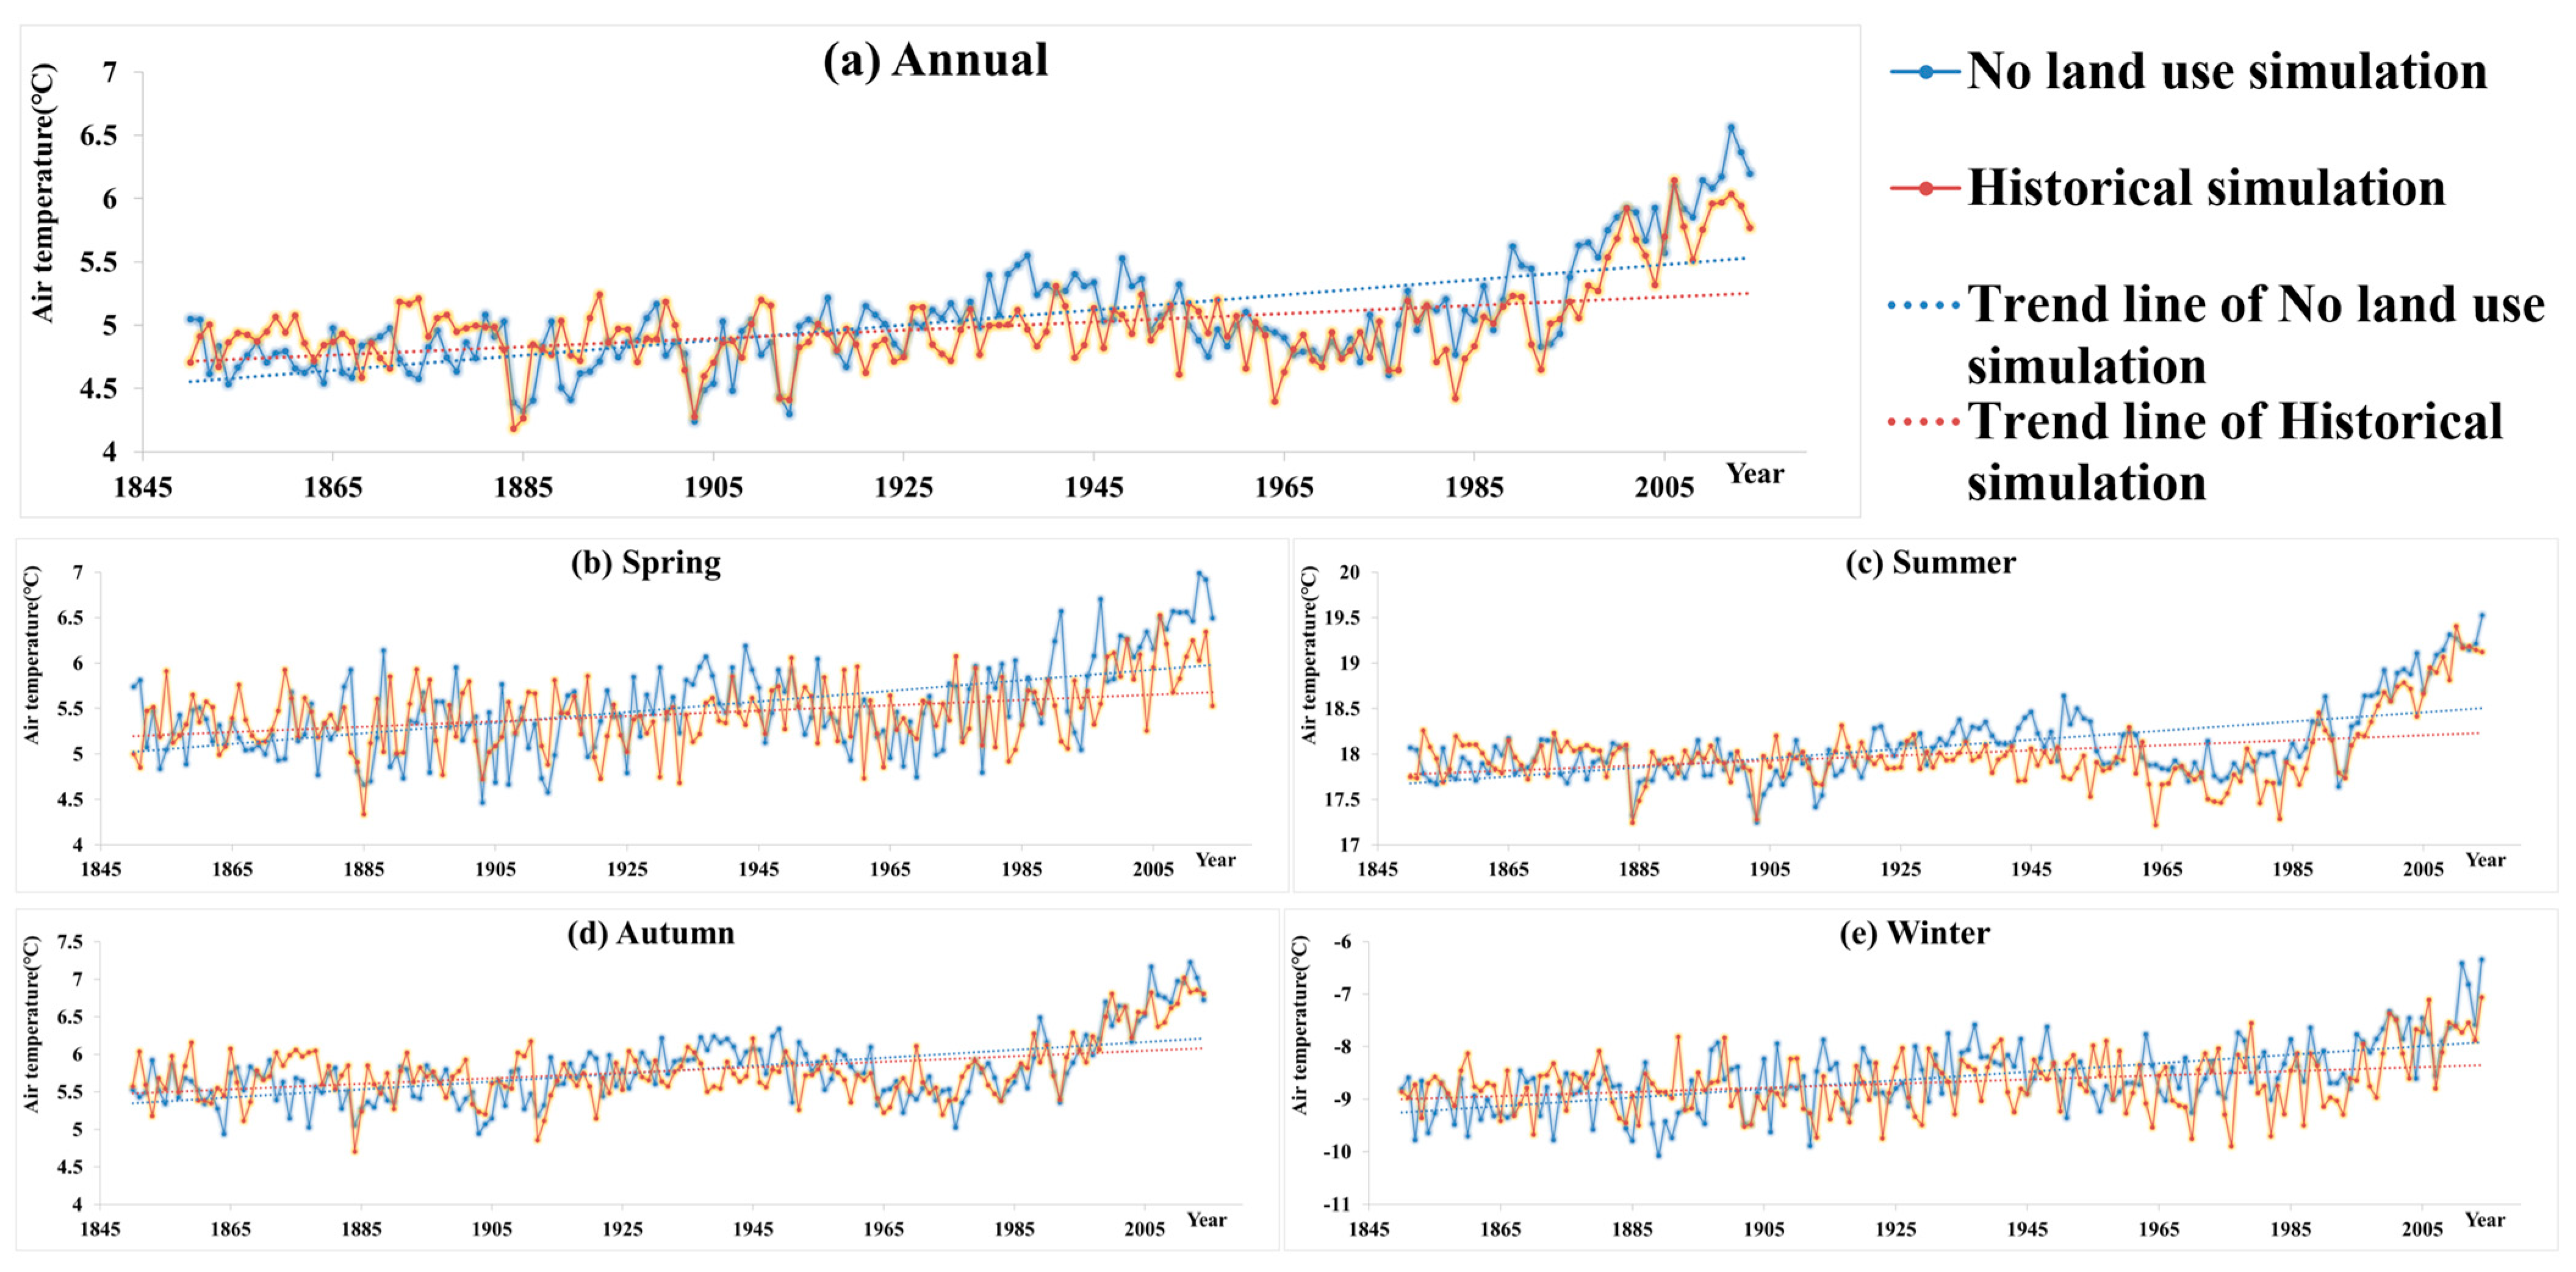
The historical and hist-noLu temperatures simulated by the BCC, IPSL, CESM2, and UKESM1 climate models during 1850–2014 were averaged, and the annual and seasonal mean temperature variation curves are shown in Figure 5. The analysis revealed that both the simulated historical and hist-noLu mean annual temperatures showed approximately increasing trends. Upon analyzing the temperature data for the four seasons, it was observed that temperature and its rate of change varied across seasons, indicating that each season contributed differently to the total annual temperature.
The average simulated hist-noLu temperatures for spring, summer, autumn, and winter were 5.5 °C, 18.09 °C, 5.78 °C, and −8.59 °C, respectively, with corresponding increase rates of 6.10 °C/(1000 a), 4.27 °C/(1000 a), 4.27 °C/(1000 a), and 7.62 °C/(1000 a). In comparison, the average simulated historical temperatures for spring, summer, autumn, and winter were 5.44 °C, 18.00 °C, 5.78 °C, and −8.68 °C, respectively, with increase rates of 1.83 °C/(1000 a), 2.13 °C/(1000 a), 2.74 °C/(1000 a), and 2.74 °C/(1000 a), respectively.
During 1850–2014, the annual simulated historical temperature increased at a rate of 3.26 °C/(1000 a), while the hist-noLu temperature increased at a higher rate of 5.96 °C/(1000 a). If we only evaluate the increase during 1951–2014, the hist-noLu temperature increased at a rate of 21.20 °C/(1000 a) compared to the simulated historical temperature, which had an increase rate of 16.61 °C/(1000 a). Their trend lines intersected at around 1910. The highest annual simulated historical temperature was approximately 6.14 °C in 2006, and the lowest was approximately 4.18 °C in 1884. The highest annual simulated hist-noLu temperature of 6.56 °C occurred in 2012, and the lowest value of 4.24 °C occurred in 1903. The difference between the highest value of the two data series was 0.42 °C.
The differences in precipitation and temperature are associated with the changes in surface properties (e.g., albedo, surface roughness, latent heat, and infiltration capacity) and land–atmosphere interaction induced by LULCC, considering the monsoon climate characteristics in China. These differences are further discussed in Section 4 after the detailed LULCC contribution evaluation and difference analysis in the spatial dimension.
3.5. Relative Contribution of Different Types of LULCC
To reveal a more precise correlation between changes in vegetation cover and precipitation and temperature, the outputs from four LUMIP models during 1850–2014 were used when evaluating RC. As shown in Table 2, to establish the RR model, we first determined K values of the RR model using ridge plots. Once the K values were established, regression analysis was performed on all vegetation cover changes after eliminating significant multicollinearity (variance inflation factor (VIF) < 2). To evaluate the capability of the model, we also examined p values of the RR model, which all met the significance test at the 95% confidence level (p = 0.05). Furthermore, p values of each type of vegetation cover type had also been carried out. The results indicated that all vegetation covers, except shrub land, had significant impacts on precipitation difference between the historical and hist-noLu experiments (historical—hist-noLu) above the 95% confidence level (p < 0.05), while only forestland and grassland significantly influenced the temperature difference (p < 0.05).
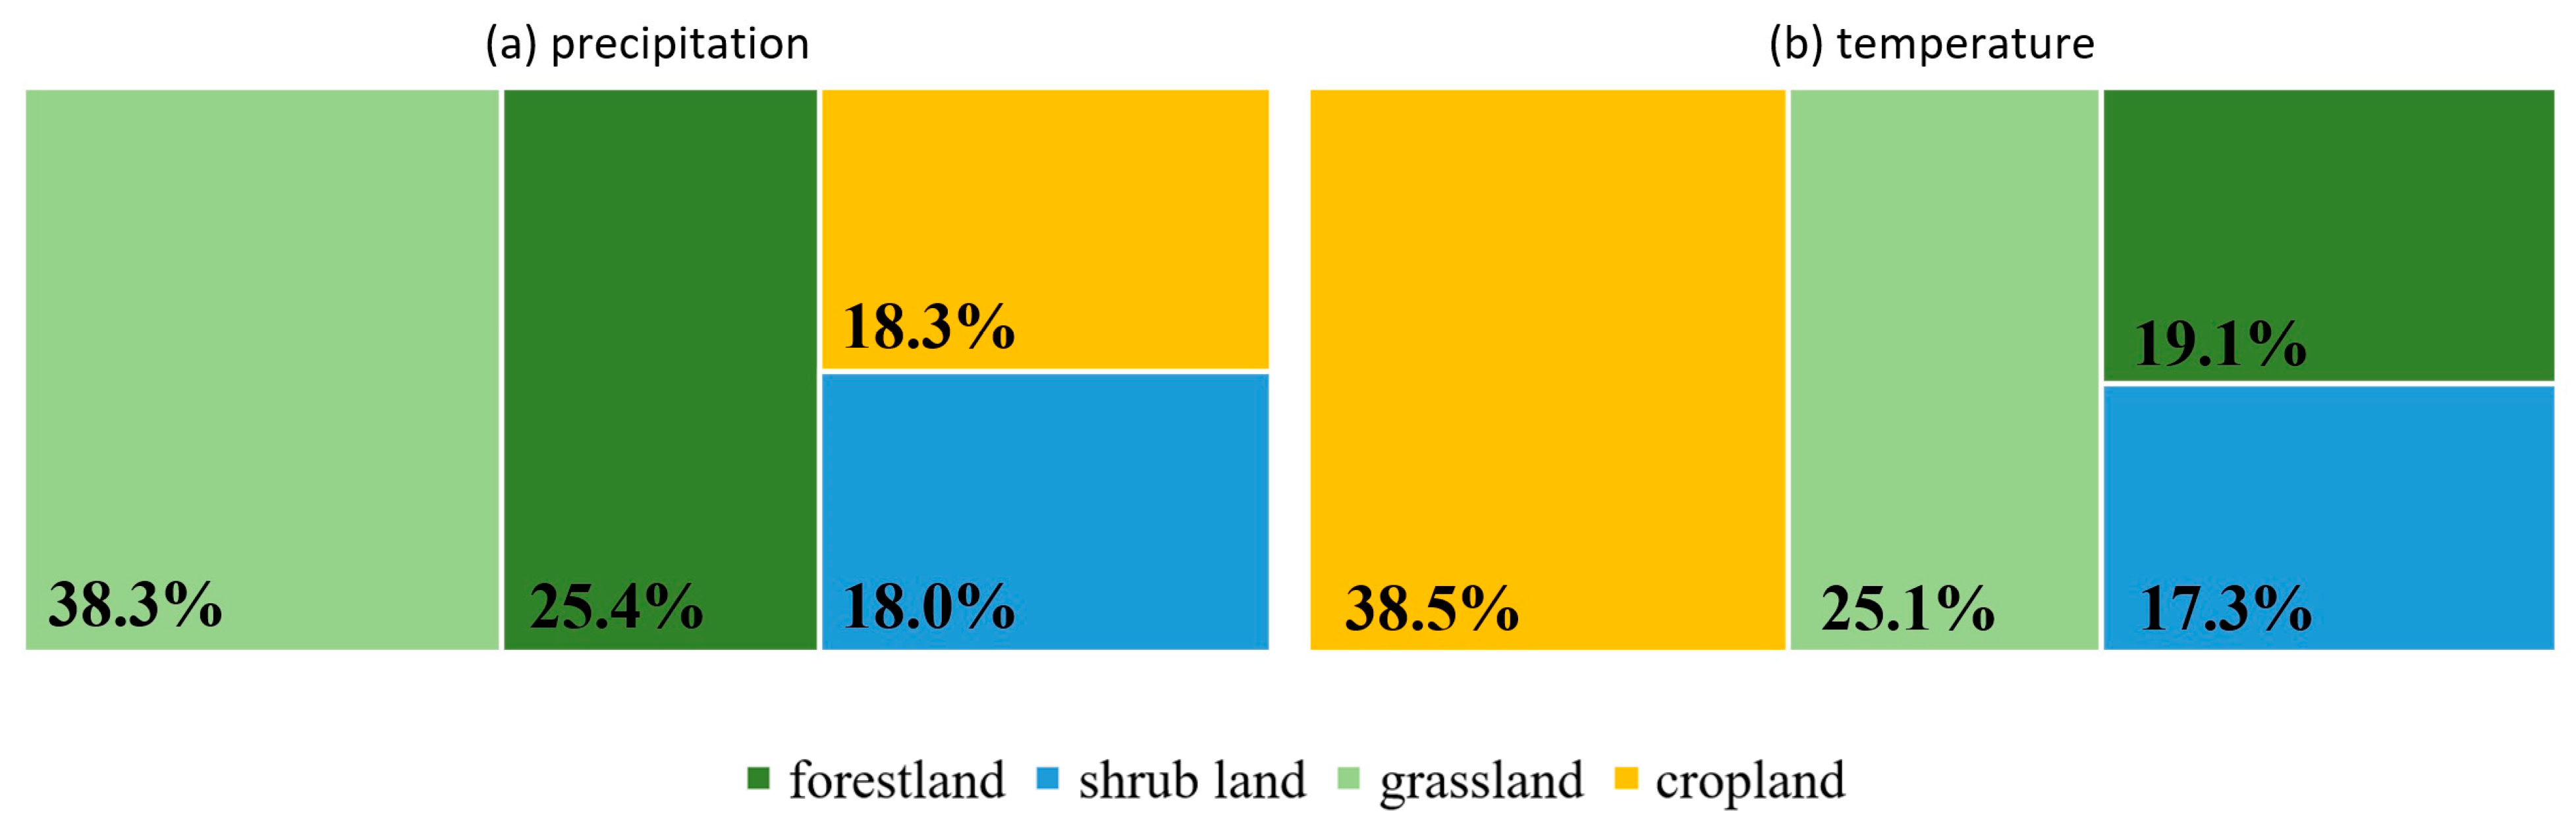
Figure 6a showed that grassland change relatively contributed the most (38.3%) to precipitation difference between the historical and hist-noLu experiments (historical—hist-noLu), followed by forestland (25.4%), cropland (18.3%), and shrub land (18.0%). For impacts on temperature difference (Figure 6b), cropland change had the highest RC, reaching 38.5%, while the RC of other types of vegetation cover was ranked as follows: grassland (25.1%), forestland (19.1%), and shrub land (17.3%). It is worth noting that temporal change in shrub land was minimal and its impacts’ significance test did not meet the criteria at the 95% confidence level (p < 0.05), so the RC of shrub land could be considered negligible since it had relatively little importance compared with other three vegetation cover types.
3.6. Mann–Kendall and ANOVA Significance Tests
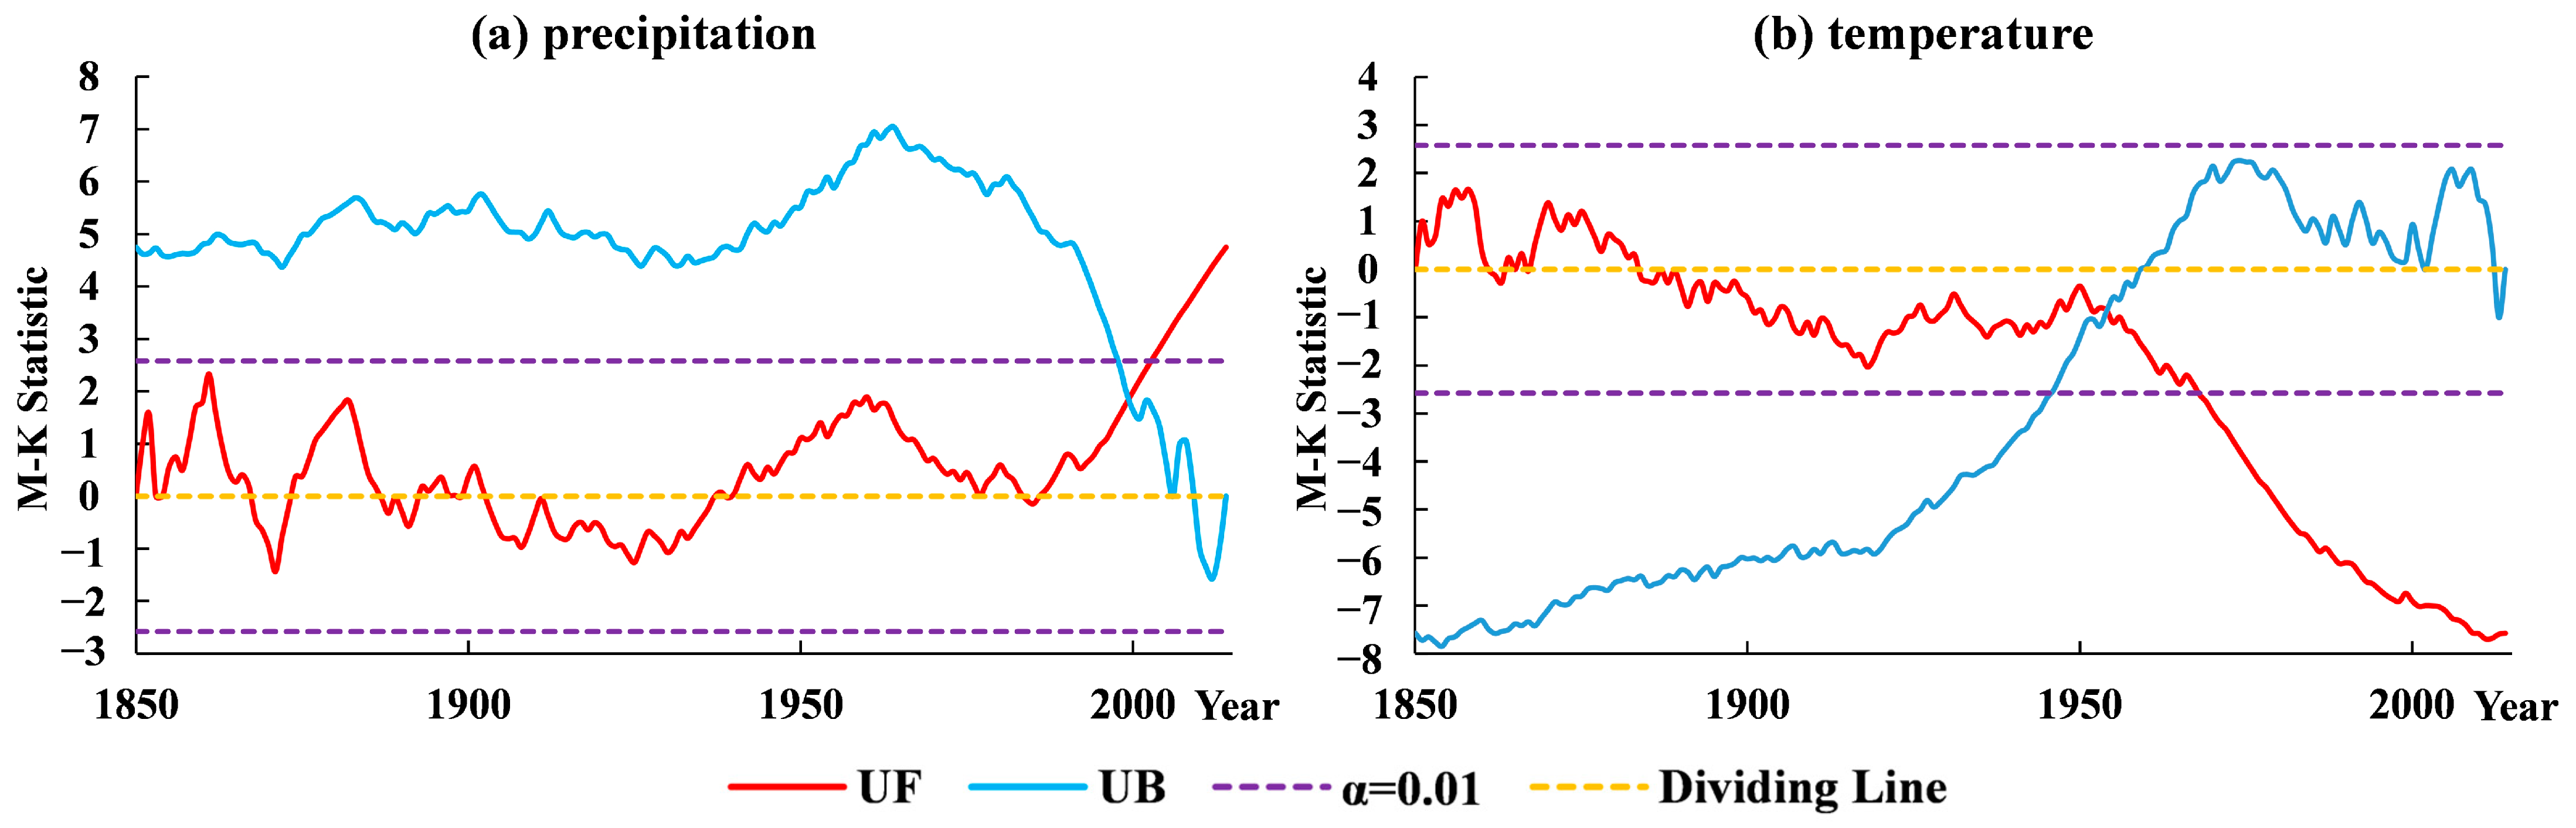
To examine the primary changes in precipitation and temperature attributed to LULCC and investigate the relationship between LULCC and these variables, a Mann–Kendall test was conducted. The test aimed to identify significant monotonic trends and detect mutation points in the precipitation and temperature time series. Figure 7 shows the M-K statistic (UF and UB) curves obtained from the Mann–Kendall test for the precipitation and temperature time series.
Based on Figure 7, the mutation point for precipitation occurred around 1955, with a significant decrease observed from around 1970. The mutation point for temperature was around 2000 and the monotonic increased tendency became significant less than 5 years later. Meanwhile, much more significant changes in land use were also detected during 1980–2014 in this study, as discussed in Section 3.2. It is important to note that China has experienced rapid socio-economic development since the late 20th century, driven by factors such as industrialization, urbanization resulting from the Reform and Open policy, and the implementation of national regional development and ecological protection policies [47]. Additionally, due to the time scale limitation of historical observed data, the evaluation of simulation skill in this study was limited to the period of 1979–2012. Conservatively, we can only confirm the capabilities of the simulations are enough during 1979–2012. Thus, the period between 1979 and 2012, when significant changes in precipitation, temperature, and land use occurred, was selected to study the specific correlation between LULCC and precipitation and temperature.
To further confirm the significance of LULCC impacts on precipitation and temperature data, the mean annual precipitation difference and the mean annual temperature difference between the historical and hist-noLu experiments (historical—hist-noLu) simulated by the four models were compared over China during the period 1979–2012. The precipitation and temperature data for this period both passed the variance homogeneity test (Table 3), and an analysis of variance (ANOVA) significance test could be conducted. As seen from the ANOVA test results in Table 4, the p value of the mean annual precipitation difference between the historical and hist-noLu experiments is 0.003, meeting the significance test at the 99% confidence level (=0.01). Additionally, the p value of the mean annual precipitation difference between the historical and hist-noLu experiments is 0.0528, satisfying the significance test at the 90% confidence level (=0.1). These results suggest that the observed differences are significant, confirming the suitability of the precipitation and temperature data for evaluation purposes.
3.7. Spatial Changes in Precipitation, Temperature, and Land Use
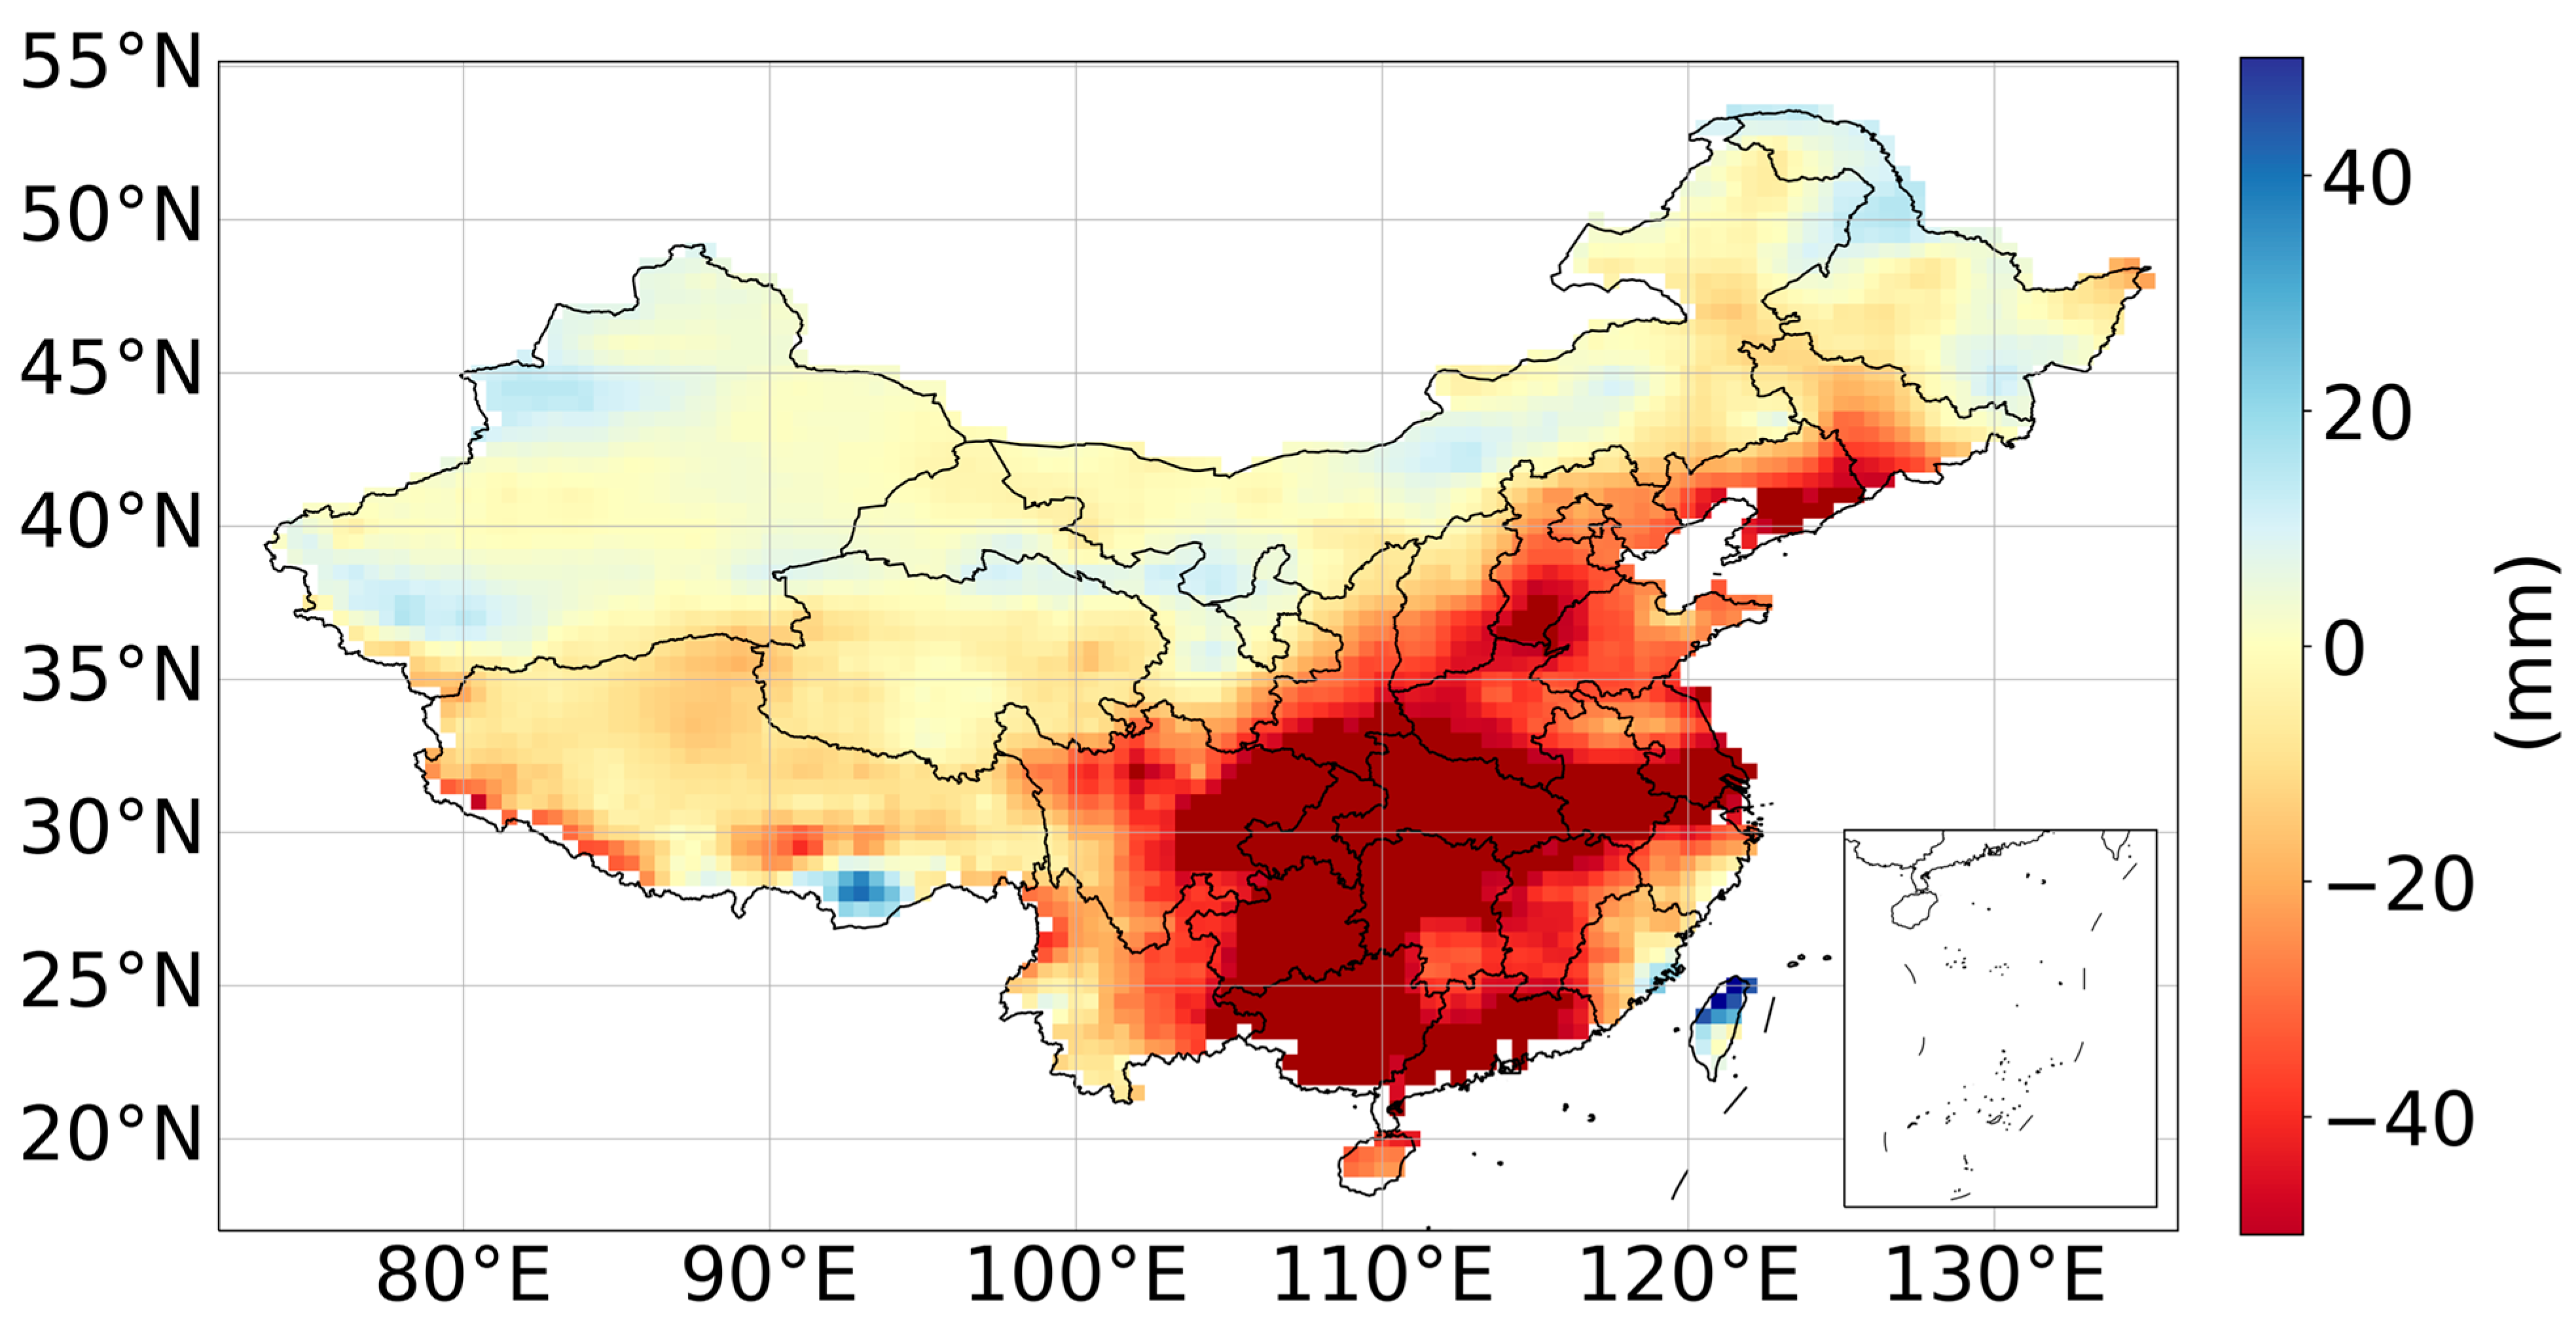
To study the correlation between specific types of LULCC and the changes in precipitation and temperature, we analyze the spatial distribution of these changes. Based on the precipitation data (1979–2012), the spatial distribution of the difference between the historical and hist-noLu experiments is shown in Figure 8. The simulated historical precipitation in most areas of China was less than the hist-noLu precipitation. Large differences were found between the simulated historical and hist-noLu precipitation in Southern China, among which the difference between South China, Central China, and the southern part of East China was the largest (i.e., more than −40 mm). The decrease of 20 mm in eastern parts of Southern China and southern parts of Southwest China were the second largest. The southern parts of the northern region also experienced a large decrease of more than 20 mm. The difference between the northern parts of North China and Northwest China was small, and there was almost no difference in some areas. Overall, the decrease in precipitation showed a moderate trend from Southeastern China to Northwestern China.
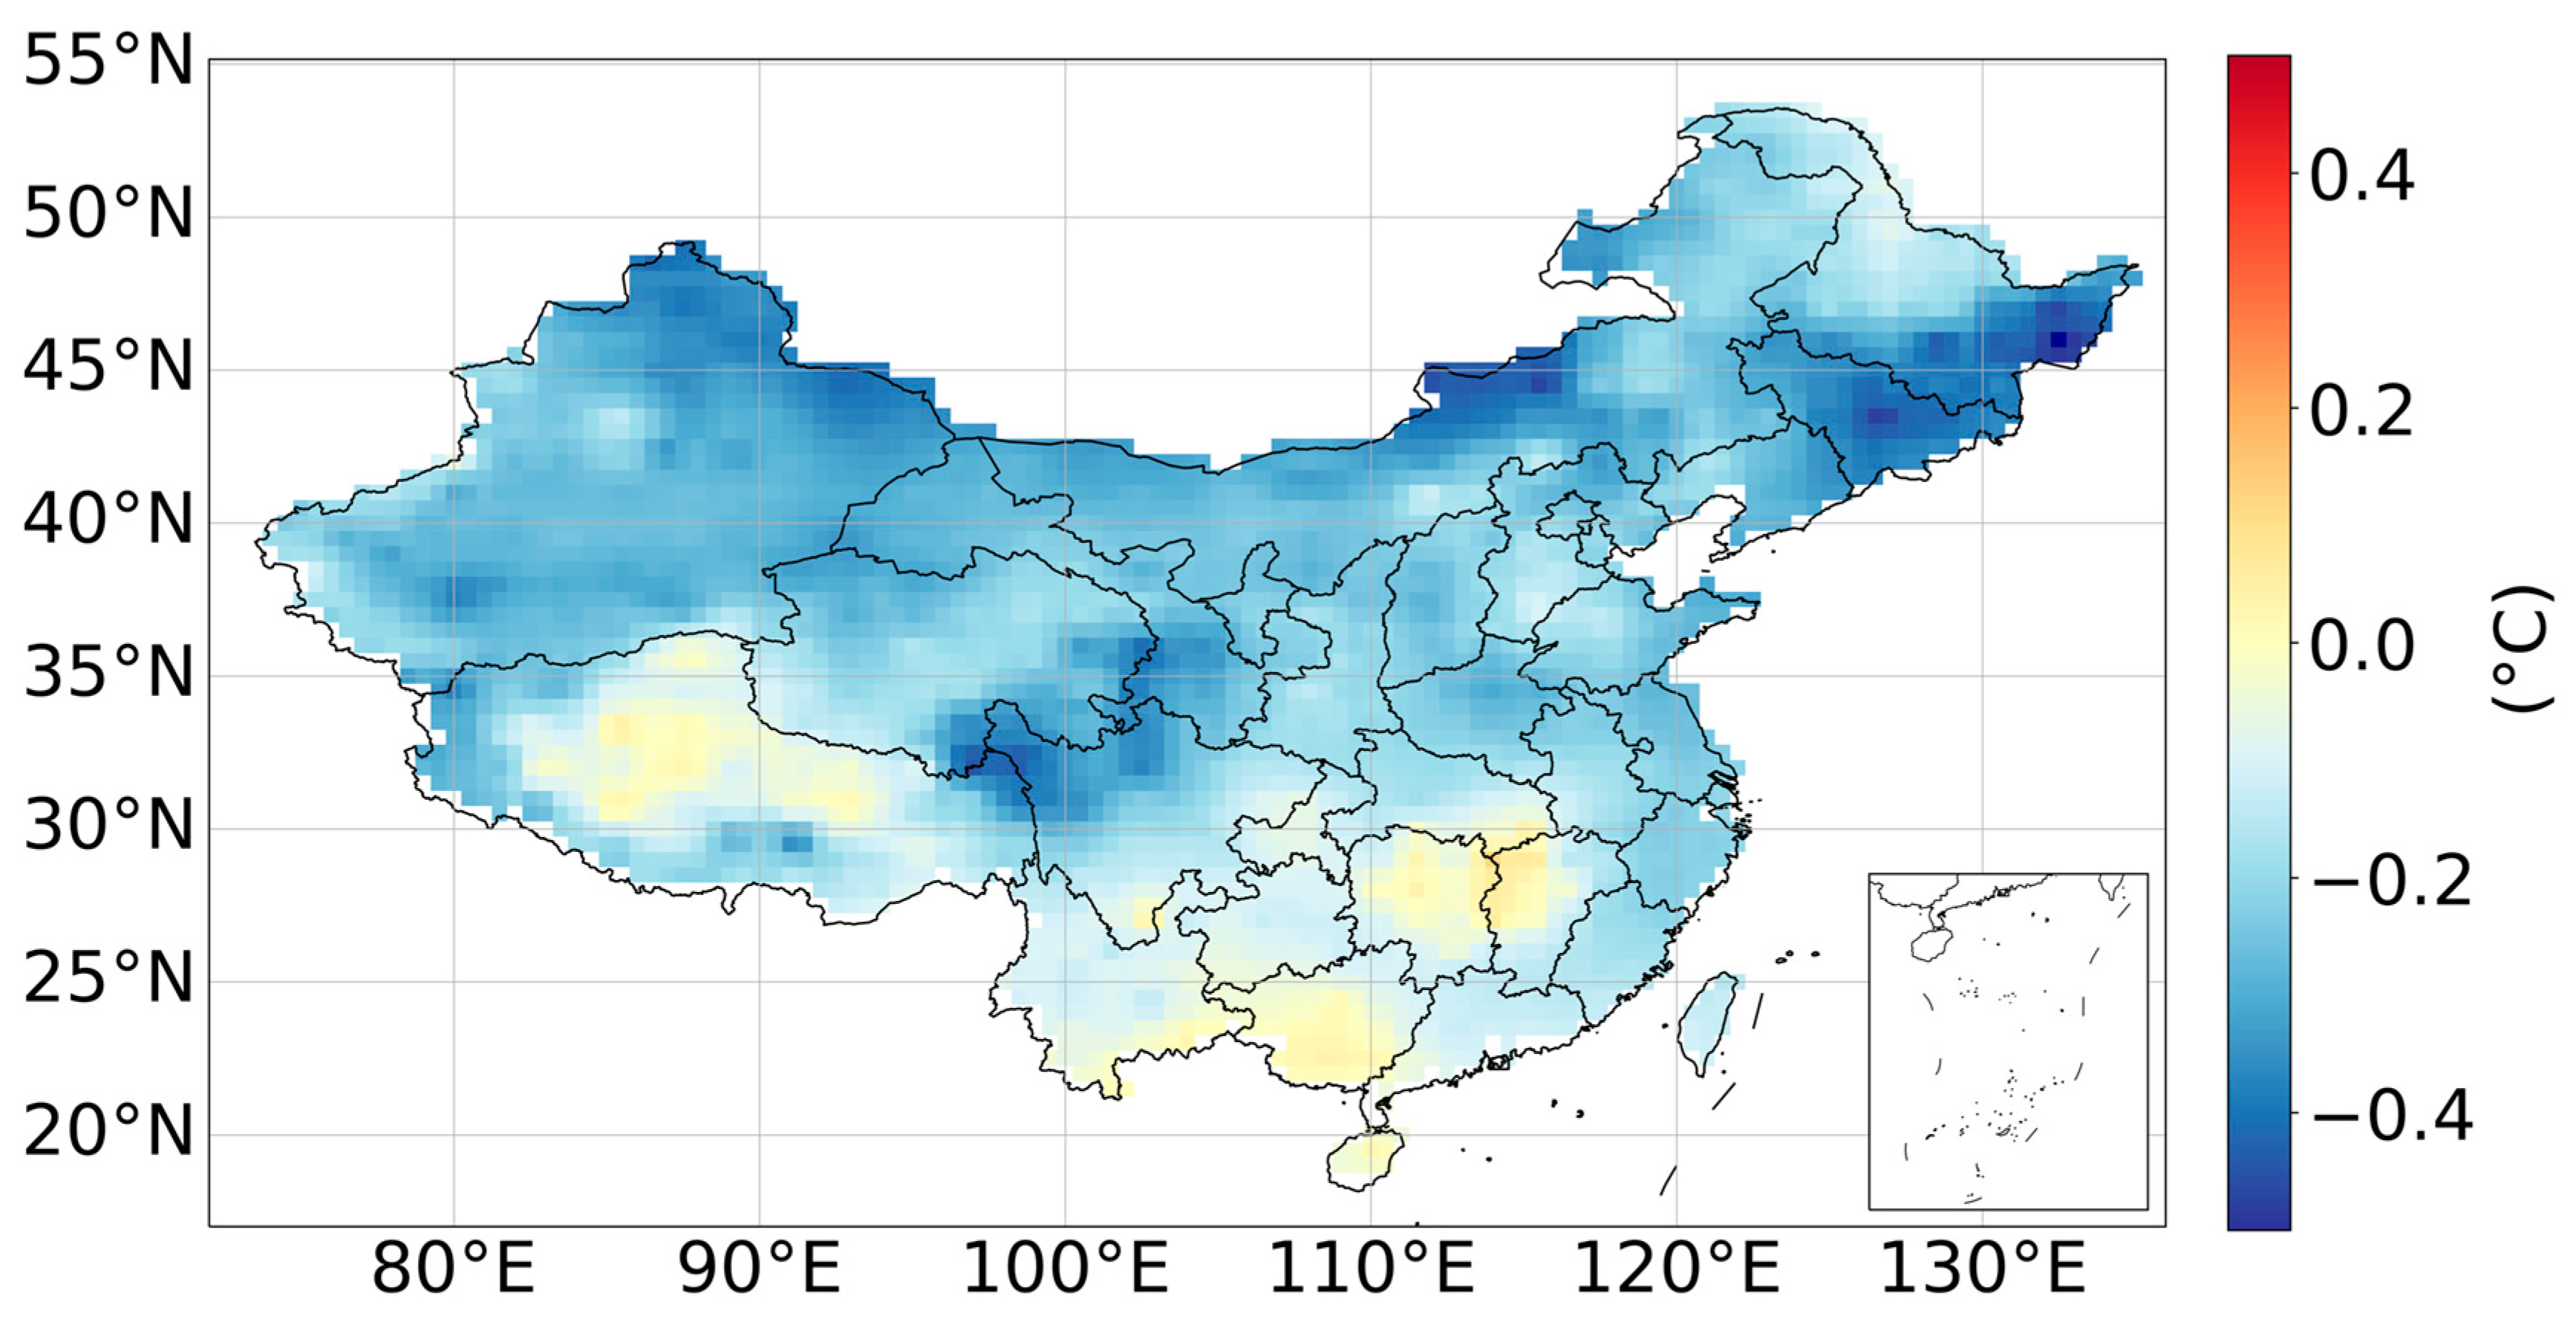
Based on the temperature data (1979–2012), the spatial distribution of the difference is shown in Figure 9. The difference between the simulated historical and the hist-noLu temperature was small (i.e., within −0.4–0.2 °C). Generally, the difference was mostly negative, meaning that the simulated historical temperature was slightly lower than the hist-noLu temperature. However, there were some exceptions, particularly in the central and southern parts of Southern China and the central part of the Tibetan region, which showed a slight increase in temperature; most of the remaining areas showed a decrease, and the rate of decrease generally increased most further north. The border area of Qinghai and Sichuan provinces, eastern parts of Northeast China, and the boundary line of Northern China showed an extremely high decrease of more than 0.4 °C.
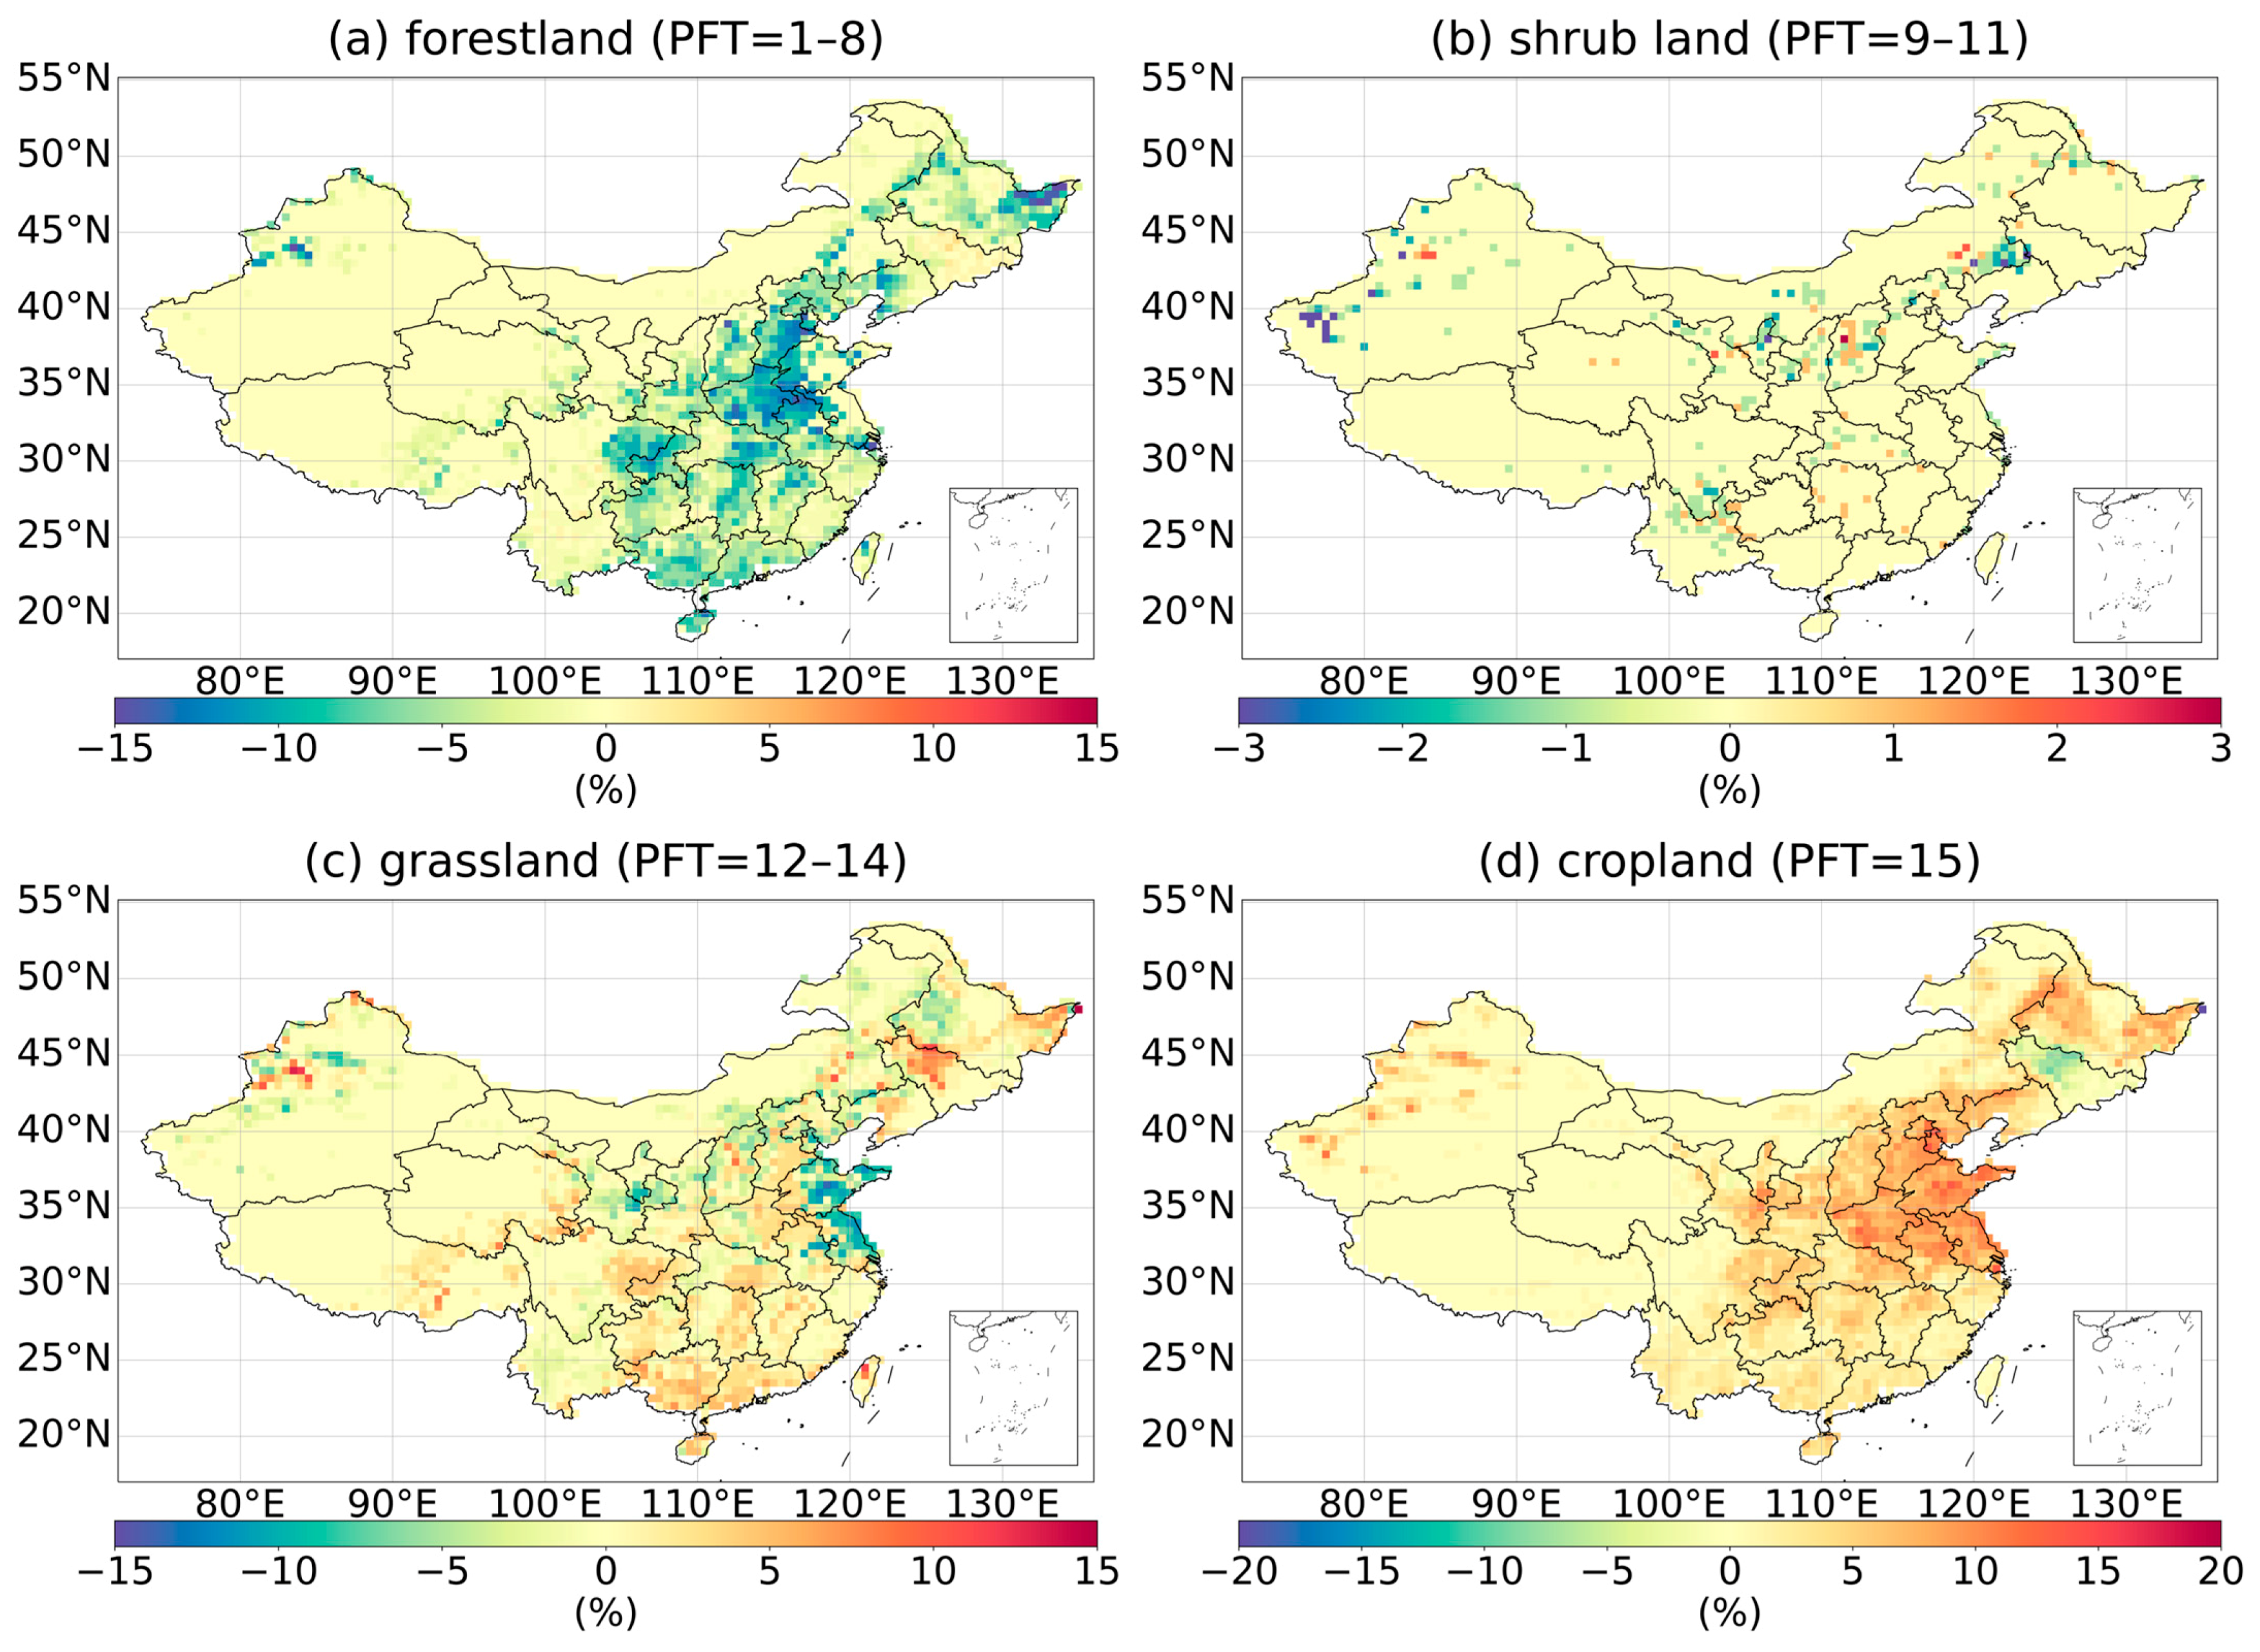
Based on the land use data (1979–2012), the spatial distribution changes in the proportion of five main land cover groups from 1979 to 2012 are shown in Figure 10. The main distribution of the changes for each of the 16 types of vegetation coverage in China during 1979–2012 is summarized in the supplementary materials (Figure S1).
Overall, forestland showed a trend of reduction in areal distribution. The decreases occurred mainly in northern and southern parts of Eastern China, with an average rate of decrease of approximately 10%; however, Central China, Southwest China, North China, and Northeast China (especially eastern parts) had the greatest decrease, that is, >15%. Reduction also occurred in northern parts of Northwest China and eastern parts of the Qinghai–Tibetan Plateau, but the rate of decrease was not as large, that is, approximately only 5–10%.
The area of shrub land in the southern regions showed scattered small increases and decreases at a rate of <2%. The change in northern regions was relatively complex, with decreases of 0–2% in the southern border of Inner Mongolia with Shaanxi, Ningxia, Gansu, Hebei, and Jilin provinces but increases of approximately 1% in the northern parts of Shanxi Province. Small increases and decreases of <2% also occurred in Central China and Southwest China, while a scatter decrease of 0–3% occurred in Northwest China.
The area of grassland increased in Northeast China, Central China, and Southern China at rates of approximately 5–10%. The greatest increases of >10% were in Jilin Province. A small increase of 0–8% also occurred in the eastern parts of the Qinghai–Tibetan Plateau. By contrast, the major decreases occurred in North China and East China. A reduction in areal distribution of >10% occurred in Shandong and Jiangsu provinces. The southern and northeastern parts of Inner Mongolia, Gansu, Ningxia, Shaanxi, and Shanxi provinces had a reduction of approximately 5%, while all other areas, such as Yunnan Province, had a slight reduction of approximately 3%. In Northwestern China, the areal distribution of grassland mainly decreased, but some increases also appeared in northwestern Xinjiang Province.
The area of cropland (PFT 15) was widely distributed in all plains and hilly areas of China in 1979, particularly in North China, East China, and Central China, and it then gradually became more widely distributed. In North China, Northeast China, and northern parts of Central China, the rate of increase in area was the highest (10–20%). In other distribution areas, the rate of increase in Southern China and southeastern parts of Northeast China was 0–10%. By contrast, decrease only appeared in Jilin Province, the rate of decrease was <5%.
Generally, the spatial changes in vegetation type in China during the study period can be summarized as follows. (1) Vegetation cover appeared in some parts of the deserts and plateau areas in Northwest China, while vegetation coverage disappeared in some areas originally covered by vegetation. Moreover, in some regions, increases and decreases in vegetation coverage appeared simultaneously. (2) The decrease in forestland was greater in North China, Northeast China, and western parts of South China. (3) Grassland was widely distributed, and its areal coverage increased in most parts of China, especially in the central and eastern parts of Southern China. However, decreases also occurred in East China. (4) Shrubs only show scatter spatial increase and decrease, with only a slight decrease in the overall proportion of China land use. (5) Among the four main vegetation groups, cropland increased most obviously, mainly in North China and East China, which compressed areas of forestland and grassland space. The overall increase in the area of cropland was large, that is, 10% or more. Moreover, the increases in areas that initially had a smaller proportion of cropland were larger, while the areas with higher cropland proportion increased relatively less. Therefore, the areal distribution became more evenly dispersed.
4. Discussion
4.1. Trends in Precipitation Variation
The temporal variation in precipitation showed that total precipitation tends to decrease regardless of land use (Figure 4). This finding is consistent with Su et al. [48], who also found that the annual averaged precipitation amount shows a weak and insignificant decreasing trend across China using data from 635 ground stations during 1961–2016. However, Liu et al. [49] found that precipitation in China increased by 2% from 1960 to 2000 using observed data from 272 weather stations of the China Meteorological Administration, while the study by Zhang et al. [50] showed unclear temporal variations in precipitation amount over the whole of China from 1951 to 2005. This contradiction might stem from differences in observed data sources and the substantial fluctuation of precipitation in this period, particularly after 1950. Since our study examined a much longer time series (1850–2014) and the decrease rate (0.346 mm/a) was relatively modest, the results of our study can be considered reasonable and more comprehensive. Additionally, both the simulated historical and hist-noLu annual precipitation lines showed obvious interdecadal variations, which are also similar to the findings of previous studies by Zhang et al. [51] and Mao et al. [52], thus validating the credibility of our study.
In our study, all four seasons showed decreased trends in precipitation, albeit at varying rates. Among the four seasons, summer precipitation has the highest decrease rate, contributing the most to the overall decrease in mean annual precipitation. Consequently, the difference between summer precipitation and the other seasons gradually diminished, making it less statistically significant. However, previous studies have reported contradictory findings. Su et al. [48] found robust decreasing trends in autumn precipitation, while Liu et al. [49] observed increasing trends in summer and winter. Zhang et al. [50] suggested that different change patterns occurred over the different regions of China for different seasons. Additionally, a study by Yazdandoost et al. [53] indicated that CMIP6 simulations often miss the mark in capturing summer precipitation in humid zones, which is common in Southern China. However, our study provides a more comprehensive analysis with detailed data from a longer time series. To validate the long-term seasonal change pattern, further confirmation using more precise data is needed in future studies.
Trend analysis also revealed a noticeable point that the simulated historical and hist-noLu annual precipitation was abnormal in the 1970s, when it decreased to a lower value before returning to the normal trend level in the 1980s. Previous studies [54,55,56] attributed this phenomenon to the high-index polarity of the Arctic Oscillation (AO) after the late 1970s. This trend resulted in abnormal warming in the middle and high latitudes of Asia, as well as abnormal cooling in winter and spring in the lower latitudes. Moreover, the Indian and Pacific Oceans in southern and eastern Asia experienced relative warming from winter to summer after the late 1970s. These combined changes in the oceans and land led to a reduction in the summer land–sea contrast in Asia, ultimately weakening the East Asian Summer Monsoon (EASM). As a result, summer rainfall in East Asia experienced an abnormal decrease, which explains why precipitation was below normal in most parts of Eastern China during the 1970s.
4.2. Trends in Temperature Variation
The temporal variation in temperature showed that the mean temperature in China has increased regardless of land use (Figure 5). This increase in mean temperature is evident in all seasons, with the greatest temperature increase in autumn and winter, and the smallest increase in spring. These overall annual and seasonal increase trends are consistent with the findings of Cao et al. [57] and Yin and Sun [58]. It is worth noting that the increase rate of our study was relatively modest (3.26 °C/(1000 a)), compared with 0.23 °C/(10 a) from Yin and Sun [58] and 1.56 °C/(100 a) from Cao et al. [57]. However, the time series we used (1850–2014) were much longer than those beginning in the early 20th century, and the trends concluded from the observed data during 1900–1950 could be less reliable due to the impacts of war and the lack of weather stations. Therefore, our study may have provided more accurate results as we employed models with confirmed simulation skills and higher resolutions. Additionally, the increase rate of mean annual temperature reached 16.61 °C/(1000 a) if we specifically evaluate the increase during 1951–2014, which is consistent with previous studies.
Trend analysis revealed that there was a relatively small variation in the spring, summer, autumn, and mean annual temperature lines during 1949–1979. However, the rate of temperature increase accelerated after 1979, which is consistent with the findings of Argiriou et al. [59] and further confirmed the obvious warming of China’s climate in the last 50 years. Furthermore, Figure 5a also shows obvious interdecadal variations in temperature which is similar to precipitation and to some degree consistent with LULCC. This indicates that LULCC might have impacts on not only the overall trend but also the interdecadal variation, similar to the study by Cao et al. [60].
4.3. Correlation between Vegetation Cover and Precipitation and Temperature
The analysis of temporal variations in precipitation and temperature, as discussed in Section 4.1 and Section 4.2, clearly shows noticeable differences between historical land use and hist-noLu simulations. These differences indicate that LULCC surely have an impact on precipitation and temperature variations, which is consistent with numerous previous studies [61,62,63].
The historical trend lines of annual and all seasonal precipitations exhibit significantly steeper slopes compared to the hist-noLu trend lines (Figure 4). A study [64] investigated the standardized precipitation index (SPI) and ranked land cover types based on mean monthly and annual precipitation, with forestland showing the highest values, followed by grassland and cropland. Similarly, we also found a decrease in overall forestland and an increase in overall grassland and cropland, leading to increasingly higher precipitation in hist-noLu simulations compared with historical simulations. Meanwhile, the RC of forestland (38.3%), grassland change (25.4%), and cropland change (18.3%) to the precipitation difference were statistically significant (p < 0.05). This suggests that the conversion from forestland to grassland and cropland played a significant role in the decrease in mean annual precipitation.
On the contrary, as LULCC became more and more significant over time, the historical trend lines of annual and all seasonal mean temperature exhibited flatter slopes compared to the hist-noLu lines (Figure 5). This can be attributed to the clearing of temperate forests for agriculture, as highlighted by Bonan [65], who explained that croplands and grasslands have a higher albedo than forests, resulting in a decrease in snow albedo masking by trees in winter and an increase in evaporative cooling from crops in summer, which leads to cooling. This supports our finding that the historical LULCC, including a decrease in forestland and an increase in grassland and cropland, caused lower historical temperature during 1850–2014 compared to hist-noLu temperature. Furthermore, another strong support for this explanation is that the RC of cropland change (38.5%) and grassland change (25.1%) to temperature difference were the top two highest contributors and their significance (p < 0.05) confirms their significant impact on temperature variations.
4.4. Influence of LULCC on Spatial Variation in Precipitation
From the comparison between Figure 8 and Figure 10, the strong correlation between land use and precipitation can be obviously observed, particularly in Eastern China, where significant LULCC occurred. The overall spatial decrease in precipitation, compared to hist-noLu precipitation, corresponded with the spatial decrease in forestland, supporting the explanation in Section 4.3 Interestingly, in some coastal areas like Shandong, Jiangsu, Zhejiang and Fujian provinces, where grassland growth was limited or even decreased while cropland expanded, precipitation decrease was relatively less pronounced. Based on Javed et al.’s study [64], grassland and cropland have little differences in albedo and SPI; thus, this phenomenon can be attributed to two facts. First, based on Liu et al.’s study [66], the conversion from croplands to grasslands would result in a decrease in net radiation and latent heat, not only affecting temperature but also reducing the evaporation capacity of the land surface. Second, croplands typically require other forms of human-added water inputs, which would add additional water to the local water cycle. With higher net radiation and latent heat in croplands, this increased water availability leads to more evaporation and, subsequently, more precipitation. Therefore, croplands reversed the decrease in precipitation resulting from the conversion from forestlands to grasslands.
Figure 8 clearly showed that even with no obvious land use change in Northern China, many areas showed that the historical precipitation was higher than the corresponding hist-noLu precipitation. Similar to the study results of Gao et al. [67], their explanation has also provided valuable insights. It is widely recognized that the monsoon was the primary driver of the precipitation patterns from Southeastern China to Northwestern China. We propose that the conversion from forestlands to grasslands and croplands led to a reduction in surface roughness. This reduction intensified surface wind speed, allowing more monsoons to reach Northern China and prolonging their duration, which leads to increased precipitation. This indicates that LULCC has far-reaching effects on precipitation beyond areas directly impacted by land use changes, which further confirms the important role of land–atmosphere interactions in the hydrological cycle found by a study by Wang et al. [68]. Furthermore, this finding further confirmed the complex biophysical effects on precipitation caused by LULCC [69], which need more comprehensive and integrated research.
4.5. Influence of LULCC on Spatial Variation in Temperature
In Section 4.4, we discussed the mechanisms through which LULCC affects temperature variations through altering albedo, net radiation, latent heat, and surface wind speed. From the comparison between Figure 9 and Figure 10, the main spatial differences between historical and hist-noLu temperatures align with these theories. Historical temperature was lower compared to hist-noLu temperature in areas where conversion from forestlands to grasslands and croplands occurred. However, there were also some noticeable phenomena in the spatial differences that warrant further discussion.
First, although the decrease rate in northern and southern parts of Eastern China was similar, compared with the relatively uniform and large differences in Northern China, some provinces in Southern China like Jiangxi, Hunan, Guangxi, Yunnan, and Hainan provinces had almost no difference between historical and hist-noLu temperatures. We attribute this phenomenon to the stronger insolation, larger precipitation, and greater water availability in Southern China, making evaporation effects much more important. Although grassland and cropland did have higher albedo, which reflected more heat from the surface, forestland decrease also led to less evaporation, offsetting the albedo influence and helping to maintain the temperature at almost the same level during 1979–2012. Since these areas are mainly located in low elevation, this explanation is consistent with the finding that evapotranspiration takes advantage of opposing effects of albedo in low elevation by Zeng et al. [70]. A study [71] also found this contradiction in their study, and their explanation was similar to ours as well.
Second, it is interesting to note that even though very few changes in land use occurred in areas north of 40° N, the differences between historical and hist-noLu temperatures were even larger than in some areas with significant LULCC. We propose that these differences can be attributed to large-scale afforestation programs implemented throughout the entire China region, as described by Liu et al. [72]. Although afforestation may not have been primarily concentrated in areas north of 40° N, its effects can extend beyond the geographical boundaries of the planted forests, exerting far-reaching impacts on ecosystems and climate, particularly through the modulation of large-scale atmospheric circulations. This mechanism had been also proved by Yuan et al. [73], indicating that deforestation significantly modifies the land surface by changing vegetation cover and land–atmosphere interactions. Considering China’s monsoon climate characteristics, this view can be considered reasonable, while a study [74] also claimed that this increase in forestland could affect the temperature in northern high latitudes using the global land–atmosphere-coupled climate model (IPSLCM).
4.6. Summary of Discussion
The main findings and explanations from the above discussion are summarized and listed in Table 5, which is more conclusive and concise. They are mainly divided into four parts, including the trend analysis and correlation analysis of precipitation, temperature, and LULCC and the highlights from two analyses.
5. Conclusions
This study examined the relationship between LULCC and precipitation and temperature in China. Our findings were concluded as follows:
- We evaluated the simulation performance of four LUMIP models and found them to be capable of adequately simulating precipitation and temperature.
- Our analysis of temporal changes in land use revealed a decrease in forestland and an increase in grassland and cropland proportions from 1850 to 2014. Precipitation showed a decreasing trend, with summer contributing the most to annual precipitation. Temperature exhibited a slight increase over the study period, with a more significant increase observed from 1951 to 2014.
- LULCC’s effects on the climate were revealed by comparing the results of the four LUMIP models between the historical and hist-noLu experiments. The analysis showed that for precipitation, the annual simulated hist-noLu precipitation decrease (208.27 mm/1000 a) was relatively slow in comparison with the simulated historical decrease (340.50 mm/1000 a). Similarly, for temperature, the annual simulated hist-noLu temperature decrease (3.26 °C/(1000 a)) was relatively gentle in comparison with the simulated historical decrease (5.96 °C/(1000 a)) during 1850–2014.
- The relationship between LULCC and the differences in historical and hist-noLu simulations provided important insights. LULCC affected precipitation and temperature through changes in surface properties such as albedo, roughness, net radiation, and latent heat. Forestland generally exhibited higher precipitation compared to grassland and cropland, while only in Northern China did forestland show higher temperatures. The rankings of the relative contributions of different vegetation covers to precipitation and temperature differences were identified. Cropland, grassland, and forestland emerged as the main influencing factors.
Although we made significant efforts to conduct a thorough study, there are certain limitations that should be acknowledged. Varied data resolutions, limited data availability, and limitations in the accuracy of data and statistical methods prevented us from conducting a more in-depth analysis in different regions of China over extended periods and comprehensively analyzing the specific contributions of individual land use transitions. These limitations highlight areas for future investigation and improvement.
Overall, this study enhances our understanding of the complex interactions between LULCC, precipitation, and temperature. It provides valuable insights for sustainable land use planning and climate change assessments.
Supplementary Materials
The following supporting information can be downloaded at: https://www.mdpi.com/article/10.3390/su151612191/s1, Table S1: The 16 Chinese plant function types in LUH2; Figure S1: Distribution of the change in proportion of 16 plant functional types (PFTs 0–15) in China during 1979–2012.
Author Contributions
Conceptualization, P.T., B.J., J.L. and X.C.; methodology, X.C. and P.T.; software, B.J. and P.T.; validation, X.C., J.W. and G.Z.; formal analysis, P.T. and J.L.; investigation, B.J. and J.L.; resources, P.T. and J.L.; data curation, P.T. and B.J.; writing—original draft preparation, J.L., P.T. and B.J.; writing—review and editing, X.C. and J.W.; visualization, P.T and B.J.; supervision, X.C., J.W. and G.Z.; project administration, X.C.; funding acquisition, X.C. All authors have read and agreed to the published version of the manuscript.
Funding
This work was supported by the Innovation and Entrepreneurship Training Program for College Students of Sun Yat-sen University and the Natural Science Foundation of Guangdong Province, China (2022A1515010676).
Institutional Review Board Statement
Not applicable.
Informed Consent Statement
Not applicable.
Data Availability Statement
The precipitation observational data we used can be downloaded from http://gpcp.umd.edu/ (accessed on 27 September 2021). The historical observed temperature data we used can be downloaded from https://crudata.uea.ac.uk/cru/data/hrg (accessed on 27 September 2021). The historical land use (vegetation cover) data we used can be downloaded from https://luh.umd.edu/data.shtml (accessed on 23 October 2021).
Acknowledgments
The authors would like to acknowledge the valuable comments on the manuscript provided by the editors and anonymous reviewers.
Conflicts of Interest
The authors declare no conflict of interest.
Appendix A
Figure A1.
Spatial distribution of mean annual precipitation during 1979–2012 from observation 1979–2021 and predicted by the four models: (a) historical observation, (b) BCC-CSM2-MR, (c) CESM2, (d) IPSL-CM6A-LR, and (e) UKESM1.
Figure A1.
Spatial distribution of mean annual precipitation during 1979–2012 from observation 1979–2021 and predicted by the four models: (a) historical observation, (b) BCC-CSM2-MR, (c) CESM2, (d) IPSL-CM6A-LR, and (e) UKESM1.


Figure A2.
Spatial distribution of mean annual temperature during 1979–2012 from observation 1901–2012 and predicted by the four models: (a) historical observation, (b) BCC-CSM2-MR, (c) CESM2, (d) IPSL-CM6A-LR, and (e) UKESM1.
Figure A2.
Spatial distribution of mean annual temperature during 1979–2012 from observation 1901–2012 and predicted by the four models: (a) historical observation, (b) BCC-CSM2-MR, (c) CESM2, (d) IPSL-CM6A-LR, and (e) UKESM1.


References
- Gao, C.J.; Zhou, P.; Jia, P.; Liu, Z.Y.; Wei, L.; Tian, H.L. Spatial driving forces of dominant land use/land cover transformations in the Dongjiang River watershed, Southern China. Environ. Monit. Assess. 2016, 188, 84. [Google Scholar] [CrossRef]
- Wu, Y.Y.; Li, S.Y.; Yu, S.X. Monitoring urban expansion and its effects on land use and land cover changes in Guangzhou city, China. Environ. Monit. Assess. 2016, 188, 54. [Google Scholar] [CrossRef] [PubMed]
- Ali, A.M.S. Rice to shrimp: Land use land cover changes and soil degradation in Southwestern Bangladesh. Land Use Policy 2006, 23, 421–435. [Google Scholar] [CrossRef]
- Zhang, Y.; Song, C. Impacts of afforestation, deforestation, and reforestation on forest cover in China from 1949 to 2003. J. For. 2006, 104, 383–387. [Google Scholar]
- Lopez, E.; Bocco, G.; Mendoza, M.; Duhau, E. Predicting land-cover and land-use change in the urban fringe—A case in Morelia city, Mexico. Landsc. Urban Plan 2001, 55, 271–285. [Google Scholar] [CrossRef]
- Swanwick, C.; Dunnett, N.; Woolley, H. Nature, role and value of green space in towns and cities: An overview. Built Environ. 2003, 29, 94–106. [Google Scholar] [CrossRef]
- Kong, F.H.; Nakagoshi, N. Spatial-temporal gradient analysis of urban green spaces in Jinan, China. Landsc. Urban Plan 2006, 78, 147–164. [Google Scholar] [CrossRef]
- Yang, H.F.; Zhong, X.N.; Deng, S.Q.; Xu, H. Assessment of the impact of LUCC on NPP and its influencing factors in the Yangtze River basin, China. Catena 2021, 206, 105542. [Google Scholar] [CrossRef]
- Zhu, Z.P.; Wang, G.Y.; Dong, J.W. Correlation analysis between land use/cover change and air pollutants-a case study in Wuyishan City. Energies 2019, 12, 2545. [Google Scholar] [CrossRef] [Green Version]
- Paeth, H.; Born, K.; Girmes, R.; Podzun, R.; Jacob, D. Regional climate change in Tropical and Northern Africa due to greenhouse forcing and land use changes. J. Clim. 2009, 22, 114–132. [Google Scholar] [CrossRef] [Green Version]
- Cai, X.; Riley, W.J.; Zhu, Q.; Tang, J.; Zeng, Z.; Bisht, G.; Randerson, J.T. Improving representation of deforestation effects on evapotranspiration in the E3SM land model. J. Adv. Model. Earth Syst. 2019, 11, 2412–2427. [Google Scholar] [CrossRef] [Green Version]
- Pitman, A.J.; Zhao, M. The relative impact of observed change in land cover and carbon dioxide as simulated by a climate model. Geophys. Res. Lett. 2000, 27, 1267–1270. [Google Scholar] [CrossRef]
- Pielke, R.; Beven, K.; Brasseur, G.; Calvert, J.; Chahine, M.; Dickerson, R.R.; Entekhabi, D.; Foufoula-Georgiou, E.; Gupta, H.; Gupta, V.; et al. Climate change: The need to consider human forcings besides greenhouse gases. Eos Trans. Am. Geophys. Union 2009, 90, 413. [Google Scholar] [CrossRef]
- Tomlinson, C.J.; Chapman, L.; Thornes, J.E.; Baker, C. Remote sensing land surface temperature for meteorology and climatology: A review. Meteorol. Appl. 2011, 18, 296–306. [Google Scholar] [CrossRef] [Green Version]
- Fang, Z.; Ding, T.; Chen, J.; Xue, S.; Zhou, Q.; Wang, Y.; Wang, Y.; Huang, Z.; Yang, S. Impacts of land use/land cover changes on ecosystem services in ecologically fragile regions. Sci. Total Environ. 2022, 831, 154967. [Google Scholar] [CrossRef] [PubMed]
- Ewane, E.B.; Lee, H.H. Assessing land use/land cover change impacts on the hydrology of Nyong River Basin, Cameroon. J. Mt. Sci. 2020, 17, 50–67. [Google Scholar] [CrossRef]
- Grimm, N.B.; Faeth, S.H.; Golubiewski, N.E.; Redman, C.L.; Wu, J.G.; Bai, X.M.; Briggs, J.M. Global change and the ecology of cities. Science 2008, 319, 756–760. [Google Scholar] [CrossRef] [Green Version]
- Zeng, C.; He, S.W.; Cui, J.X. A multi-level and multi-dimensional measuring on urban sprawl: A case study in Wuhan Metropolitan Area, Central China. Sustainability 2014, 6, 3571–3598. [Google Scholar] [CrossRef] [Green Version]
- Liu, Y.X.; Chen, J.L.; Cheng, W.Y.; Sun, C.; Zhao, S.S.; Pu, Y.X. Spatiotemporal dynamics of the urban sprawl in a typical urban agglomeration: A case study on Southern Jiangsu, China (1983–2007). Front. Earth Sci. 2014, 8, 490–504. [Google Scholar] [CrossRef]
- Guneralp, B.; Perlstein, A.S.; Seto, K.C. Balancing urban growth and ecological conservation: A challenge for planning and governance in China. Ambio 2015, 44, 532–543. [Google Scholar] [CrossRef] [Green Version]
- Liu, F.S.; Tao, F.L.; Liu, J.Y.; Zhang, S.; Xiao, D.P.; Wang, M.; Zhang, H.; Bai, H.Z. Effects of land use/cover change on land surface energy partitioning and climate in Northeast China. Theor. Appl. Climatol. 2016, 123, 141–150. [Google Scholar] [CrossRef]
- Trail, M.; Tsimpidi, A.P.; Liu, P.; Tsigaridis, K.; Hu, Y.; Nenes, A.; Stone, B.; Russell, A.G. Potential impact of land use change on future regional climate in the Southeastern U.S.: Reforestation and crop land conversion. J. Geophys. Res. Atmos. 2013, 118, 11577–11588. [Google Scholar] [CrossRef]
- Liu, J.Y.; Shao, Q.Q.; Yan, X.D.; Fan, J.W.; Zhan, J.Y.; Deng, X.Z.; Kuang, W.H.; Huang, L. The climatic impacts of land use and land cover change compared among countries. J. Geogr. Sci. 2016, 26, 889–903. [Google Scholar] [CrossRef] [Green Version]
- Wang, H.; Wang, W.J.; Liu, Z.; Wang, L.; Zhang, W.; Zou, Y.; Jiang, M. Combined effects of multi-land use decisions and climate change on water-related ecosystem services in Northeast China. J. Environ. Manag. 2022, 315, 115131. [Google Scholar] [CrossRef]
- Zhu, Y.; Zhang, Y.; Zheng, Z.; Liu, Y.; Wang, Z.; Cong, N.; Zu, J.; Tang, Z.; Zhao, G.; Gao, J.; et al. Converted vegetation type regulates the vegetation greening effects on land surface albedo in arid regions of China. Agric. For. Meteorol. 2022, 324, 109119. [Google Scholar] [CrossRef]
- Cai, P.; Hamdi, R.; Luo, G.; He, H.; Zhang, M.; Termonia, P.; De Maeyer, P. Agriculture intensification increases summer precipitation in Tianshan Mountains, China. Atmos. Res. 2019, 227, 140–146. [Google Scholar] [CrossRef]
- Qi, W.; Li, H.; Zhang, Q.; Zhang, K. Forest restoration efforts drive changes in land-use/land-cover and water-related ecosystem services in China’s Han River basin. Ecol. Eng. 2019, 126, 64–73. [Google Scholar] [CrossRef]
- Coppin, P.; Jonckheere, I.; Nackaerts, K.; Muys, B.; Lambin, E. Digital change detection methods in ecosystem monitoring: A review. Int. J. Remote Sens. 2004, 25, 1565–1596. [Google Scholar] [CrossRef]
- Lu, D.; Mausel, P.; Brondizio, E.; Moran, E. Change detection techniques. Int. J. Remote Sens. 2004, 25, 2365–2407. [Google Scholar] [CrossRef]
- Liu, M.L.; Tian, H.Q.; Chen, G.S.; Ren, W.; Zhang, C.; Liu, J.Y. Effects of land-use and land-cover change on evapotranspiration and water yield in China during 1900–2000. JAWRA J. Am. Water Resour. Assoc. 2008, 44, 1193–1207. [Google Scholar] [CrossRef]
- Dewan, A.M.; Yamaguchi, Y. Using remote sensing and GIS to detect and monitor land use and land cover change in Dhaka Metropolitan of Bangladesh during 1960–2005. Environ. Monit. Assess. 2009, 150, 237–249. [Google Scholar] [CrossRef] [PubMed]
- Singh, A. Review article digital change detection techniques using remotely-sensed data. Int. J. Remote Sens. 1989, 10, 989–1003. [Google Scholar] [CrossRef] [Green Version]
- Yu, L.; Leng, G. Global effects of different types of land use and land cover changes on near-surface air temperature. Agric. For. Meteorol. 2022, 327, 109232. [Google Scholar] [CrossRef]
- Li, X.; Fang, G.; Wen, X.; Xu, M.; Zhang, Y. Characteristics analysis of drought at multiple spatiotemporal scale and assessment of CMIP6 performance over the Huaihe River Basin. J. Hydrol. Reg. Stud. 2022, 41, 101103. [Google Scholar] [CrossRef]
- Liang, Y.; Xu, X.Y.; Jia, G.S. Deforestation drives desiccation in Global Monsoon Region. Earths Future 2022, 10, e2022EF002863. [Google Scholar] [CrossRef]
- Gu, Y.; Li, D. A modeling study of the sensitivity of urban heat islands to precipitation at climate scales. Urban Clim. 2018, 24, 982–993. [Google Scholar] [CrossRef]
- Huang, L.; Zhai, J.; Liu, J.; Sun, C. The moderating or amplifying biophysical effects of afforestation on CO2-induced cooling depend on the local background climate regimes in China. Agric. For. Meteorol. 2018, 260–261, 193–203. [Google Scholar] [CrossRef]
- Sohl, T.L.; Wimberly, M.C.; Radeloff, V.C.; Theobald, D.M.; Sleeter, B.M. Divergent projections of future land use in the United States arising from different models and scenarios. Ecol. Model. 2016, 337, 281–297. [Google Scholar] [CrossRef] [Green Version]
- Lawrence, D.M.; Hurtt, G.C.; Arneth, A.; Brovkin, V.; Calvin, K.V.; Jones, A.D.; Jones, C.D.; Lawrence, P.J.; de Noblet-Ducoudre, N.; Pongratz, J.; et al. The Land Use Model Intercomparison Project (LUMIP) contribution to CMIP6: Rationale and experimental design. Geosci. Model Dev. 2016, 9, 2973–2998. [Google Scholar] [CrossRef] [Green Version]
- Harris, I.; Osborn, T.J.; Jones, P.; Lister, D. Version 4 of the CRU TS monthly high-resolution gridded multivariate climate dataset. Sci. Data 2020, 7, 109. [Google Scholar] [CrossRef] [Green Version]
- Wang, A.H.; Miao, Y.; Shi, X.L. Overview and review of CMIP6 land use model comparison program (LUMIP). Adv. Clim. Chang. Res. 2021, 17, 367–373. [Google Scholar]
- Hurtt, G.C.; Chini, L.; Sahajpal, R.; Frolking, S.; Bodirsky, B.L.; Calvin, K.; Doelman, J.C.; Fisk, J.; Fujimori, S.; Goldewijk, K.K.; et al. Harmonization of global land use change and management for the period 850-2100 (LUH2) for CMIP6. Geosci. Model Dev. 2020, 13, 5425–5464. [Google Scholar] [CrossRef]
- Hurtt, G.C.; Chini, L.P.; Frolking, S.; Betts, R.A.; Feddema, J.; Fischer, G.; Fisk, J.P.; Hibbard, K.; Houghton, R.A.; Janetos, A.; et al. Harmonization of land-use scenarios for the period 1500–2100: 600 years of global gridded annual land-use transitions, wood harvest, and resulting secondary lands. Clim. Chang. 2011, 109, 117–161. [Google Scholar] [CrossRef] [Green Version]
- Doetterl, S.; Stevens, A.; Six, J.; Merckx, R.; Van Oost, K.; Casanova Pinto, M.; Casanova-Katny, A.; Muñoz, C.; Boudin, M.; Zagal Venegas, E. Soil carbon storage controlled by interactions between geochemistry and climate. Nat. Geosci. 2015, 8, 780–783. [Google Scholar] [CrossRef]
- Rasmussen, C.; Heckman, K.; Wieder, W.R.; Keiluweit, M.; Lawrence, C.R.; Berhe, A.A.; Blankinship, J.C.; Crow, S.E.; Druhan, J.L.; Hicks Pries, C.E. Beyond clay: Towards an improved set of variables for predicting soil organic matter content. Biogeochemistry 2018, 137, 297–306. [Google Scholar] [CrossRef]
- Oster, E. Unobservable selection and coefficient stability: Theory and evidence. J. Bus. Econ. Stat. 2019, 37, 187–204. [Google Scholar] [CrossRef]
- Liu, J.; Kuang, W.; Zhang, Z.; Xu, X.; Qin, Y.; Ning, J.; Zhou, W.; Zhang, S.; Li, R.; Yan, C.; et al. Spatiotemporal characteristics, patterns and causes of land use changes in China since the late 1980s. Acta Geogr. Sin. 2014, 69, 3–14. [Google Scholar] [CrossRef]
- Su, Y.F.; Zhao, C.F.; Wang, Y.; Ma, Z.S. Spatiotemporal variations of precipitation in China using surface gauge observations from 1961 to 2016. Atmosphere 2020, 11, 303. [Google Scholar] [CrossRef] [Green Version]
- Liu, B.H.; Xu, M.; Henderson, M.; Qi, Y. Observed trends of precipitation amount, frequency, and intensity in China, 1960-2000. J. Geophys. Res. Atmos. 2005, 110, D08103. [Google Scholar] [CrossRef]
- Zhang, Q.; Xu, C.Y.; Zhang, Z.; Chen, Y.D.; Liu, C.L. Spatial and temporal variability of precipitation over China, 1951–2005. Theor. Appl. Climatol. 2009, 95, 53–68. [Google Scholar] [CrossRef]
- Zhang, Y.; Ren, Y.; Ren, G.; Wang, G. Precipitation trends over Mainland China from 1961–2016 after removal of measurement biases. J. Geophys. Res. Atmos. 2020, 125, e2019JD031728. [Google Scholar] [CrossRef]
- Mao, Y.N.; Wu, G.C.; Xu, G.Z.; Wang, K.C. Reduction in precipitation seasonality in China from 1960 to 2018. J. Clim. 2022, 35, 227–248. [Google Scholar] [CrossRef]
- Yazdandoost, F.; Moradian, S.; Izadi, A.; Aghakouchak, A. Evaluation of CMIP6 precipitation simulations across different climatic zones: Uncertainty and model intercomparison. Atmos. Res. 2021, 250, 105369. [Google Scholar] [CrossRef]
- Li, Y.F.; Leung, L.R. Potential impacts of the Arctic on interannual and interdecadal summer precipitation over China. J. Clim. 2013, 26, 899–917. [Google Scholar] [CrossRef]
- Jiang, Z.; Yang, S.; He, J.; Li, J.; Liang, J. Interdecadal variations of East Asian summer monsoon northward propagation and influences on summer precipitation over East China. Meteorol. Atmos. Phys. 2008, 100, 101–119. [Google Scholar] [CrossRef]
- Ju, J.H.; Lu, J.M.; Cao, J.; Ren, J.Z. Possible impacts of the Arctic oscillation on the interdecadal variation of summer monsoon rainfall in East Asia. Adv. Atmos. Sci. 2005, 22, 39–48. [Google Scholar]
- Cao, L.J.; Yan, Z.W.; Zhao, P.; Zhu, Y.N.; Yu, Y.; Tang, G.L.; Jones, P. Climatic warming in China during 1901-2015 based on an extended dataset of instrumental temperature records. Environ. Res. Lett. 2017, 12, 064005. [Google Scholar] [CrossRef] [Green Version]
- Yin, H.; Sun, Y. Anthropogenic influence on temperature change in China over the period 1901–2018. J. Clim. 2023, 36, 2131–2146. [Google Scholar] [CrossRef]
- Argiriou, A.A.; Li, Z.; Armaos, V.; Mamara, A.; Shi, Y.; Yan, Z. Homogenised monthly and daily temperature and precipitation time series in China and Greece since 1960. Adv. Atmos. Sci. 2023, 40, 1326–1336. [Google Scholar] [CrossRef]
- Cao, F.; Dan, L.; Ma, Z.; Gao, T. The impact of land use and land cover change on regional climate over East Asia during 1980–2010 using a coupled model. Theor. Appl. Climatol. 2021, 145, 549–565. [Google Scholar] [CrossRef]
- Bounoua, L.; DeFries, R.; Collatz, G.J.; Sellers, P.; Khan, H. Effects of land cover conversion on surface climate. Clim. Chang. 2002, 52, 29–64. [Google Scholar] [CrossRef]
- Brovkin, V.; Ganopolski, A.; Claussen, M.; Kubatzki, C.; Petoukhov, V. Modelling climate response to historical land cover change. Glob. Ecol. Biogeogr. 1999, 8, 509–517. [Google Scholar] [CrossRef] [Green Version]
- Betts, A.K.; Ball, J.H. Albedo over the boreal forest. J. Geophys. Res. Atmos. 1997, 102, 28901–28909. [Google Scholar] [CrossRef] [Green Version]
- Javed, T.; Yao, N.; Chen, X.G.; Suon, S.; Li, Y. Drought evolution indicated by meteorological and remote-sensing drought indices under different land cover types in China. Environ. Sci. Pollut. Res. 2020, 27, 4258–4274. [Google Scholar] [CrossRef]
- Bonan, G.B. Forests and climate change: Forcings, feedbacks, and the climate benefits of forests. Science 2008, 320, 1444–1449. [Google Scholar] [CrossRef] [Green Version]
- Liu, Z.; Liu, Y.; Baig, M.H.A. Biophysical effect of conversion from croplands to grasslands in water-limited temperate regions of China. Sci. Total Environ. 2019, 648, 315–324. [Google Scholar] [CrossRef] [PubMed]
- Gao, X.; Zhang, D.; Chen, Z.; Pal, J.S.; Giorgi, F. Land use effects on climate in China as simulated by a regional climate model. Sci. China Ser. D Earth Sci. 2007, 50, 620–628. [Google Scholar] [CrossRef]
- Wang, Q.; Cai, X.; Tang, J.; Yang, L.; Wang, J.; Xu, Y. Climate feedbacks associated with land-use and land-cover change on hydrological extremes over the Yangtze River Delta Region, China. J. Hydrol. 2023, 623, 129855. [Google Scholar] [CrossRef]
- Pielke Sr, R.A.; Marland, G.; Betts, R.A.; Chase, T.N.; Eastman, J.L.; Niles, J.O.; Niyogi, D.D.S.; Running, S.W. The influence of land-use change and landscape dynamics on the climate system: Relevance to climate-change policy beyond the radiative effect of greenhouse gases. Philos. Trans. Ser. A Math. Phys. Eng. Sci. 2002, 360, 1705–1719. [Google Scholar] [CrossRef] [PubMed]
- Zeng, Z.Z.; Wang, D.S.; Yang, L.; Wu, J.; Ziegler, A.D.; Liu, M.F.; Ciais, P.; Searchinger, T.D.; Yang, Z.L.; Chen, D.L.; et al. Deforestation-induced warming over tropical mountain regions regulated by elevation. Nat. Geosci. 2021, 14, 23–29. [Google Scholar] [CrossRef]
- Wang, M.; Xiong, Z.; Yan, X. Modeling the climatic effects of the land use/cover change in eastern China. Phys. Chem. Earth Parts A/B/C 2015, 87–88, 97–107. [Google Scholar] [CrossRef]
- Liu, J.; Li, S.; Ouyang, Z.; Tam, C.; Chen, X. Ecological and socioeconomic effects of China’s policies for ecosystem services. Proc. Natl. Acad. Sci. USA 2008, 105, 9477–9482. [Google Scholar] [CrossRef] [PubMed]
- Yuan, K.X.J.; Zhu, Q.; Zheng, S.Y.; Zhao, L.; Chen, M.; Riley, W.J.; Cai, X.T.; Ma, H.X.; Li, F.; Wu, H.Y.; et al. Deforestation reshapes land-surface energy-flux partitioning. Environ. Res. Lett. 2021, 16, 024014. [Google Scholar] [CrossRef]
- Li, Y.; Piao, S.L.; Chen, A.P.; Ciais, P.; Li, L.Z.X. Local and teleconnected temperature effects of afforestation and vegetation greening in China. Natl. Sci. Rev. 2020, 7, 897–912. [Google Scholar] [CrossRef] [PubMed]
Figure 1.
Provinces and administrative geographical divisions of China.

Figure 2.
Schematic representation of the methodology in this study.

Figure 3.
Percentage variation curves for the four main land cover groups in China during 1850–2014.
Figure 3.
Percentage variation curves for the four main land cover groups in China during 1850–2014.

Figure 4.
Annual and seasonal mean precipitation variation curves for historical and hist-noLu experiments in China during 1850–2014 from the four models: (a) annual, (b) spring, (c) summer, (d) autumn, and (e) winter.
Figure 4.
Annual and seasonal mean precipitation variation curves for historical and hist-noLu experiments in China during 1850–2014 from the four models: (a) annual, (b) spring, (c) summer, (d) autumn, and (e) winter.

Figure 5.
Annual and seasonal mean temperature variation curves for the historical and hist-noLu experiments in China during 1850–2014 from the four models: (a) annual, (b) spring, (c) summer, (d) autumn, and (e) winter.
Figure 5.
Annual and seasonal mean temperature variation curves for the historical and hist-noLu experiments in China during 1850–2014 from the four models: (a) annual, (b) spring, (c) summer, (d) autumn, and (e) winter.

Figure 6.
Relative contribution of the change in the proportion of the four main land cover groups to the mean annual precipitation difference (a) and the mean annual temperature difference (b) between the historical and hist-noLu experiments (historical—hist-noLu) during 1850–2014.
Figure 6.
Relative contribution of the change in the proportion of the four main land cover groups to the mean annual precipitation difference (a) and the mean annual temperature difference (b) between the historical and hist-noLu experiments (historical—hist-noLu) during 1850–2014.

Figure 7.
Statistical curves of the Mann–Kendall test of mean annual precipitation (a) and mean annual temperature (b) in China during 1850–2014. Purple dashed horizontal line is the critical value of α = 0.01 significance level.
Figure 7.
Statistical curves of the Mann–Kendall test of mean annual precipitation (a) and mean annual temperature (b) in China during 1850–2014. Purple dashed horizontal line is the critical value of α = 0.01 significance level.

Figure 8.
Mean annual precipitation difference between the historical and hist-noLu experiments (historical—hist-noLu) simulated by the four models over China during 1979–2012.
Figure 8.
Mean annual precipitation difference between the historical and hist-noLu experiments (historical—hist-noLu) simulated by the four models over China during 1979–2012.

Figure 9.
Mean annual temperature difference between the historical and hist-noLu experiments (historical—hist-noLu) simulated by the four models over China during 1979–2012.
Figure 9.
Mean annual temperature difference between the historical and hist-noLu experiments (historical—hist-noLu) simulated by the four models over China during 1979–2012.

Figure 10.
Distribution of the change in the proportion of four main land cover groups in China during 1979–2012.
Figure 10.
Distribution of the change in the proportion of four main land cover groups in China during 1979–2012.


Table 1.
Information on the four CMIP6 climate models used in this study.
| Model | Affiliation | Spatial Resolution (Latitude × Longitude) | Atmosphere Vertical Layers | Atmospheric Model | Ocean Model |
|---|---|---|---|---|---|
| BCC-CSM2-MR | BCC (China) | 1.12° × 1.125° | 40 | BCC_AGCM3_MR | MOM4 |
| CESM2 | NCAR (USA) | 0.9° × 1.25° | 33 | CAM6 | POP2 |
| IPSL-CM6A-LR | IPSL (France) | 1.27° × 2.5° | 75 | LMDZ | NEMO-OPA |
| UKESM1 | MOHC (England) | 1.25° × 1.875° | 75 | MetUM-HadGEM3-GA7.1 | NEMO-HadGEM3-GO6.0 |
Table 2.
The ridge regression models’ evaluation results of precipitation and temperature.
| Variable | k Value | Model p Value | Vegetation Cover Change | Variable p Value | Variance Inflation Factor |
|---|---|---|---|---|---|
| pr | 0.135 | 0.020 | forestland | 0.041 | 0.299 |
| shrub land | 0.349 | 1.152 | |||
| grassland | 0.024 | 0.953 | |||
| cropland | 0.003 | 0.582 | |||
| tas | 0.030 | 0.000 | forestland | 0.018 | 1.130 |
| shrub land | 0.393 | 4.459 | |||
| grassland | 0.047 | 1.599 | |||
| cropland | 0.226 | 2.173 |
Table 3.
Analysis of variance homogeneity of precipitation and temperature.
| Variable | Group | Count | Mean Value | Standard Deviation |
|---|---|---|---|---|
| pr | 1 | 34 | 822.3 | 18.445 |
| 2 | 34 | 805.128 | 19.07 | |
| Pooling | 68 | 813.714 | 18.7601 | |
| Bartlett statistic | 0.0361 | |||
| Degrees of freedom | 1 | |||
| p value | 0.84932 | |||
| tas | 1 | 34 | 5.67178 | 0.46258 |
| 2 | 34 | 5.45358 | 0.44967 | |
| Pooling | 68 | 5.56268 | 0.45617 | |
| Bartlett statistic | 0.02607 | |||
| Degrees of freedom | 1 | |||
| p value | 0.87173 |
Table 4.
ANOVA results of precipitation and temperature.
| Variable | Source | Sums of Squares | Degrees of Freedom | Mean Square | F | p Value (F) |
|---|---|---|---|---|---|---|
| pr | Column | 5013 | 1 | 5012.98 | 14.24 | 0.0003 |
| Error | 23,228.1 | 66 | 351.94 | |||
| Total | 28,241.1 | 67 | ||||
| tas | Column | 0.8094 | 1 | 0.80942 | 3.89 | 0.0528 |
| Error | 13.734 | 66 | 0.20809 | |||
| Total | 14.5434 | 67 |
Table 5.
Summary of the main findings and their explanations discussed in this study.
| Section | Finding | Explanation |
|---|---|---|
| Trend analysis of precipitation and temperature variation | Relatively modest decreased trend in precipitation | A longer time series and more precise data may lead to more reliable results, but the error in CMIP6 also indicates the further confirmation. |
| The highest decrease contribution was in summer | ||
| Relatively modest increased trend in temperature | ||
| Highlights of trend analysis | Abnormal precipitation patterns in the 1970s | High-index polarity of the Arctic Oscillation affecting the East Asian Summer Monsoon. |
| Obvious interdecadal variations in temperature, which is consistent with LULCC | LULCC might have impacts on the interdecadal variation. | |
| Correlation between Vegetation Cover and Precipitation and Temperature | Significant role of the conversion from forestland to grassland and cropland in the decrease in precipitation | The RC of forestland, grassland change, and cropland change to the precipitation and temperature differences was statistically significant, while the properties of these land covers are quite different. |
| Significant impacts of cropland and grassland change on temperature variations | ||
| Highlights of correlation analysis | Relatively modest decreased trend in precipitation in some areas | The higher evaporation capacity and more water input reversed the decrease resulting from the conversion from forestlands to grasslands. |
| Relatively modest difference between historical and hist-noLu temperatures in some areas | The more important evaporation effects in low elevation offset the albedo influence and helped to maintain the temperature. | |
| Precipitation and temperature differences beyond areas directly impacted by LULCC | Land–atmosphere interactions and China’s monsoon climate characteristics led to these far-reaching effects of LULCC. |
Disclaimer/Publisher’s Note: The statements, opinions and data contained in all publications are solely those of the individual author(s) and contributor(s) and not of MDPI and/or the editor(s). MDPI and/or the editor(s) disclaim responsibility for any injury to people or property resulting from any ideas, methods, instructions or products referred to in the content. |
© 2023 by the authors. Licensee MDPI, Basel, Switzerland. This article is an open access article distributed under the terms and conditions of the Creative Commons Attribution (CC BY) license (https://creativecommons.org/licenses/by/4.0/).
Share and Cite
MDPI and ACS Style
Tian, P.; Jian, B.; Li, J.; Cai, X.; Wei, J.; Zhang, G. Land-Use-Change-Induced Cooling and Precipitation Reduction in China: Insights from CMIP6 Models. Sustainability 2023, 15, 12191. https://doi.org/10.3390/su151612191
AMA Style
Tian P, Jian B, Li J, Cai X, Wei J, Zhang G. Land-Use-Change-Induced Cooling and Precipitation Reduction in China: Insights from CMIP6 Models. Sustainability. 2023; 15(16):12191. https://doi.org/10.3390/su151612191
Chicago/Turabian StyleTian, Peizhi, Binyang Jian, Jianrui Li, Xitian Cai, Jiangfeng Wei, and Guo Zhang. 2023. "Land-Use-Change-Induced Cooling and Precipitation Reduction in China: Insights from CMIP6 Models" Sustainability 15, no. 16: 12191. https://doi.org/10.3390/su151612191
Note that from the first issue of 2016, this journal uses article numbers instead of page numbers. See further details here.