

Spatiotemporal Variation of Vegetation Water Use Efficiency and Its Response to Extreme Climate in Northwestern Sichuan Plateau
1
Sichuan Province Agricultural Meteorological Center, Chengdu 610072, China
2
Sichuan Key Laboratory of Water-Saving Agriculture Research in Southern Hilly Area, Chengdu 610066, China
3
Institute of Plateau Meteorology, China Meteorological Administration, Chengdu 610072, China
4
Faculty of Environmental Science, The University of Sydney, Sydney 2006, Australia
5
Meteorological Bureau of Aba, Maerkang 624000, China
*
Author to whom correspondence should be addressed.
Sustainability 2023, 15(15), 11786; https://doi.org/10.3390/su151511786
Submission received: 26 June 2023
/
Revised: 26 July 2023
/
Accepted: 27 July 2023
/
Published: 31 July 2023
(This article belongs to the Special Issue Effects and Atmospheric Processes of Disaster Weather in the Context of Global Climate Change)
Abstract
:The Northwestern Sichuan Plateau, characterised by complex topography, is located on the northeastern edge of the Tibetan Plateau where ecosystems are rapidly changing in response to climate change. However, the spatiotemporal characteristics of water use efficiency (WUE) and its response to climate change remain unclear, especially different responses to changes in climate mean and extremes. In this study, we found that the seasonal variation of WUE for different types of vegetation demonstrates a “unimodal” pattern, with high values during May to September. The variation of WUE is largely dependent on altitude. The annual WUE showed an overall increasing trend from 2001 to 2021 for most types of vegetation, while a decreasing trend was found for wetland, and grassland had a stronger adaptability to altitude and climate change. Mean climatic variables exerted stronger impacts on WUE than climate extremes, and mean temperature change had a stronger impact on WUE than precipitation. However, the synergistic effects of climate extremes and mean climate exerted significant impacts on WUE, with extreme cold events and mean precipitation events generally being unfavourable for an increase in WUE. The WUE of cropland and forest land demonstrated more sensitive responses to climate extremes than other types. The response of the same type of vegetation to climate extremes has obvious regional heterogeneity. However, the diurnal range of temperature, the length of the growing season, and the persistent humidity index had significant influences on the change of WUE for the entire region.
1. Introduction
Vegetation plays a crucial role in terrestrial ecosystems as it is the primary source of productivity. It serves as a significant indicator of global climate change [1,2]. On one hand, vegetation releases water into the atmosphere through transpiration; on the other hand, it absorbs atmospheric carbon dioxide through photosynthesis, converting it into organic carbon and storing it inside [3]. These coupling relationships between the carbon and water cycles of ecosystems are commonly described as water use efficiency (WUE) [4,5]. However, the definition of WUE may vary depending on the specific focus and purpose of research. At the ecosystem level, WUE refers to the quantity of dry matter produced per unit of water consumed by the ecosystem [6,7]. This measure is often expressed as the ratio between the gross primary productivity (GPP) and evapotranspiration (ET) of the ecosystem [8,9]. WUE serves as a vital indicator for the terrestrial carbon–water cycle [6,10], and it is used to assess the sensitivity and response of ecosystems to climate change [11,12].
Previous studies reported that the spatial heterogeneity in WUE is high [13]. The WUE predominantly increased in high-latitude regions and decreased in low-latitude regions from 1982 to 2008 [14]. As for China, Zhang et al. [15] identified that the WUE was high in southeastern China between 1951 and 2000, whereas it was low in northwestern China. The WUE also showed large variations in the same region for different types of vegetation. Tang et al. [16] compared global flux network and MODIS data and discovered that, at the same latitude, forest land showed the highest WUE, followed by farmland, while grassland demonstrated the lowest WUE. Xiao et al. [17] reported that forest and cultivated land demonstrated higher WUE values compared to grassland in China. These studies indicated that WUE had strong temporal and spatial variations and exhibited diversity for different types of vegetation.
Climate is an important driver for temporal and spatial variations of WUE. Mu et al. [18] estimated the global WUE from 2000 to 2010 and concluded that the WUE in warm, low-latitude regions negatively correlates with temperature and vapour pressure deficit during the plant growth season, and positively correlates with the drought index. Zhou et al. [19] investigated WUE in alpine and subalpine areas of southwestern China and found that the WUE in most areas correlates positively with temperature, but negatively with precipitation. Zhang et al. [20] also highlighted that WUE is more significantly affected by temperature than precipitation in Yunnan Province, southwestern China. Generally, WUE showed different responses to different climatic factors and these responses varied across regions.
The Northwestern Sichuan Plateau (NSP), located on the northeastern edge of the Tibetan Plateau, plays a crucial role as an ecological barrier and water conservation area in the upper reaches of the Yangtze River and the Yellow River, and is also considered ecologically fragile and sensitive to climate change [21,22]. Gaining an in-depth understanding of WUE and its changing patterns is of great importance; it not only helps enhance the ability to predict and mitigate the adverse impacts of climate change on the ecosystem, but also promotes the healthy development of the ecological environment. However, there are a limited number of studies on the response of WUE in the NSP to local climatic factors [19,23], with most of them focusing on the relationship between WUE, mean annual temperature, and annual precipitation, while neglecting the investigation of the WUE response to extreme climatic variables. Yet, the impact of extreme climatic variables on the ecological environment is more direct and severe compared to average climate conditions [24]. In recent years, the terrestrial ecosystem of the NSP has been significantly influenced by climate changes [25]. Exploring the contributions of extreme climatic variables to WUE variations in comparison to mean climatic factors remains an unaddressed research gap. Therefore, building upon existing research, this study analyses the spatiotemporal changes in the GPP, ET, and WUE of different types of vegetation in the NSP. Additionally, it evaluates the response of WUE to both mean and extreme climatic variables, aiming to provide valuable insights for the rational planning of regional water resources and the promotion of environmentally sustainable development.
2. Data Sources and Research Methods
2.1. Overview of Study Area
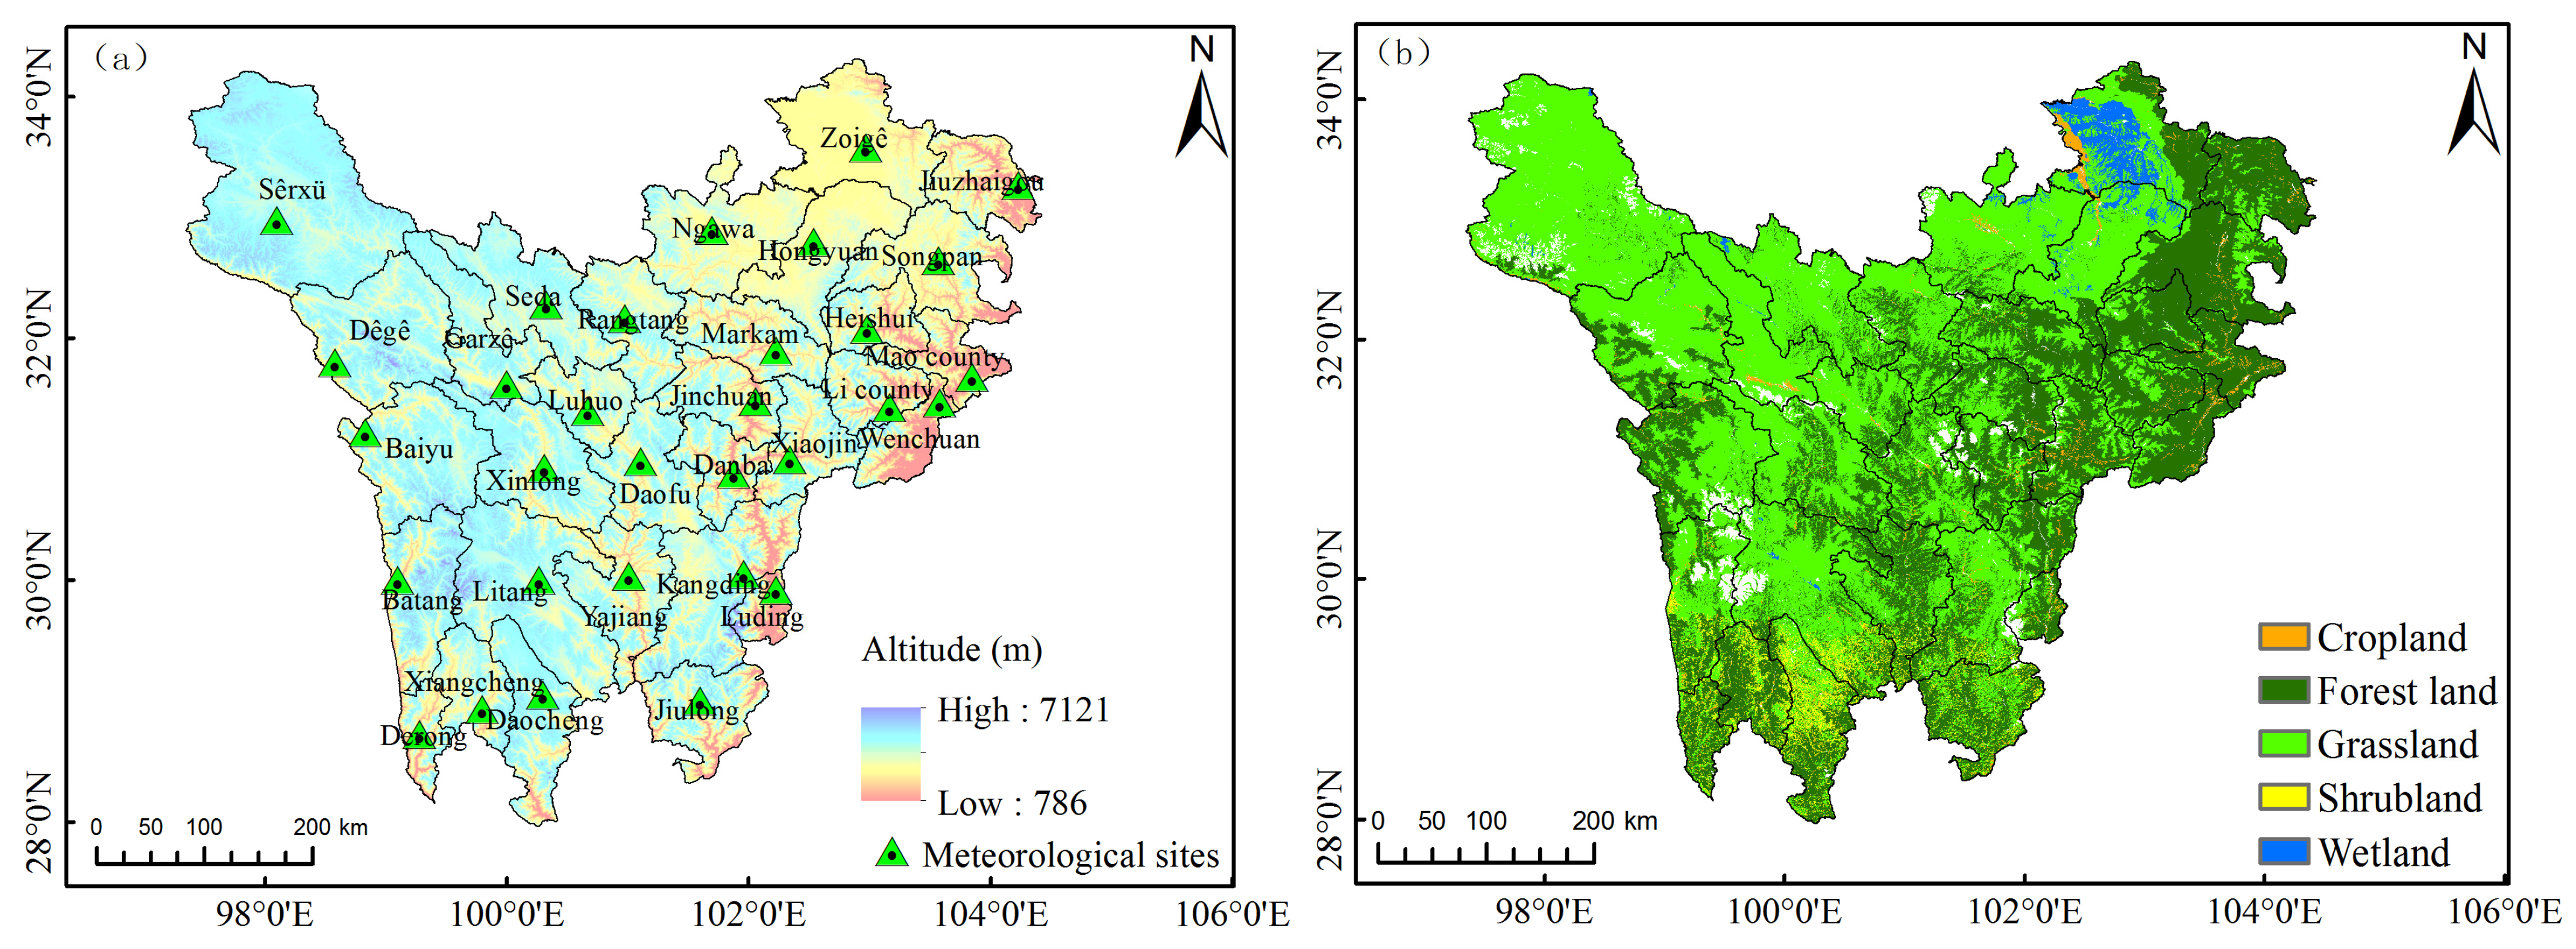
The NSP (97°22′–104°27′ E and 27°57′–34°21′ N) is located on the southeastern edge of the Qinghai–Tibet Plateau. It encompasses 31 counties within the Aba Tibetan–Qiang Autonomous Prefecture and the Garzê Tibetan Autonomous Prefecture in Sichuan Province, with a total area of approximately 237,000 square kilometres. The region exhibits significant variations in altitude, with the average altitude exceeding 3000 m (Figure 1a). It is characterised by a climate featuring cold winters, cool summers, distinct dry and wet seasons, intense radiation, and ample sunshine. The region’s distinctive topography and climate give rise to a rich variety of vegetation types. As one traverses from the valleys to the mountain peaks, a sequence of subtropical, temperate, and frigid vegetation types unfolds, encompassing forests, grasslands, shrubs, farmland, lakes, marshes, deserts, and glaciers, among others, which intermingle with one another [25].
2.2. Data Sources and Preprocessing
The remote sensing data used in this study were obtained from the 6th version of the GPP (MOD17A2H) and ET (MOD16A2GF) products released by the National Aeronautics and Space Administration (NASA) of the United States (http://search.earthdata.nasa.gov/search; accessed on 20 February 2022). The spatial resolution of the data is 500 metres, with an 8-day temporal resolution covering the period from 2001 to 2021. The preprocessing of the remote sensing data involved format conversion, reprojection, composite clipping, and resampling using the HDF-EOS to GeoTIFF Conversion (HEG) tool. The 8-day composite data were transformed into monthly composites using weighted averaging.
Meteorological data were obtained from the Sichuan Meteorological Observation Data Center, including 31 operational meteorological stations in the NSP maintained by the local meteorological administration, covering the period from 2001 to 2021. The meteorological variables included daily accumulated precipitation, daily mean temperature, daily maximum temperature, and daily minimum temperature. The meteorological data are of high quality and were spatially interpolated using the Inverse Distance Weighting (IDW) method in ArcGIS 10.1 to match the spatial reference and resolution of the remote sensing data.
The World Meteorological Organization (WMO) Expert Group on Climate Change Detection and Indicators (ETCCDMI) proposed 27 extreme climate indices. In this study, only six widely used extreme temperature indices and six extreme precipitation indices (see Table 1 for details) were selected to explore the response of WUE to extreme climate events from intensity, frequency, and duration. These indices are calculated by daily temperature and precipitation data through the RClimDex1.0 program, which are developed by the Climate Research Branch Meteorological Service of Canada (Toronto, ON, Canada).
The land surface classification data were produced and released by the Ministry of Natural Resources of China in 2020, including 10 land cover types, with a resolution of 30 m (http://globeland30.org; accessed on 11 May 2021). This study focused on cropland, forest land, grassland, shrubland, and wetland (Figure 1b). The digital elevation model (DEM) data were taken from the National Meteorological Information Center of China, with a resolution of 1:250,000.
2.3. Research Methods
2.3.1. Calculation of WUE
The calculation of WUE in this study used the ecosystem WUE method, which is expressed as the ratio of GPP to ET:
where WUE represents the water use efficiency in units of g·m−2·mm−1, GPP represents gross primary productivity in units of g C·m−2, and ET represents evapotranspiration in units of mm. The GPP and ET are directly derived from MOD17A2H and MOD16A2GF, respectively. A higher WUE value indicates greater water use efficiency, representing the amount of biomass synthesised per unit of water consumed.
WUE = GPP/ET
2.3.2. Hurst Exponent
The Hurst exponent is an effective method for describing self-similarity and long-term dependence. In this study, the Hurst exponent (H) based on the rescaled range (R/S) analysis method [26] was used to predict the trend of WUE.
2.3.3. Geographical Detector
To analyse the influence of different meteorological factors on WUE, the geographical detector was utilised to detect the factors and their interactions. The strength of the influence on WUE was measured by the q value, ranging from 0 to 1. A larger q value indicates a stronger influence of the evaluation index on WUE, while a smaller q value indicates a weaker influence. According to the interactions among the evaluation indices and value of q, the influences of valuation indices on WUE are categorised to nonlinear weaken, one-factor nonlinear weaken, dual-factor enhancement, nonlinear enhancement, and independent. For detailed information, refer to [25].
2.3.4. Other Methods
Pearson correlation coefficient analysis was used to analyse the response of WUE to different extreme climate indices [27]. Trend analysis [25] was included to fit the long-term trend of WUE, where a positive slope of the fitted equation represents an increasing trend and a negative slope indicates a decreasing trend. The significance of the trend was tested using the significance test table for correlation coefficients.
3. Results and Analysis
3.1. Spatiotemporal Evolution of GPP/ET/WUE in the Northwestern Sichuan Plateau
3.1.1. Temporal Variation
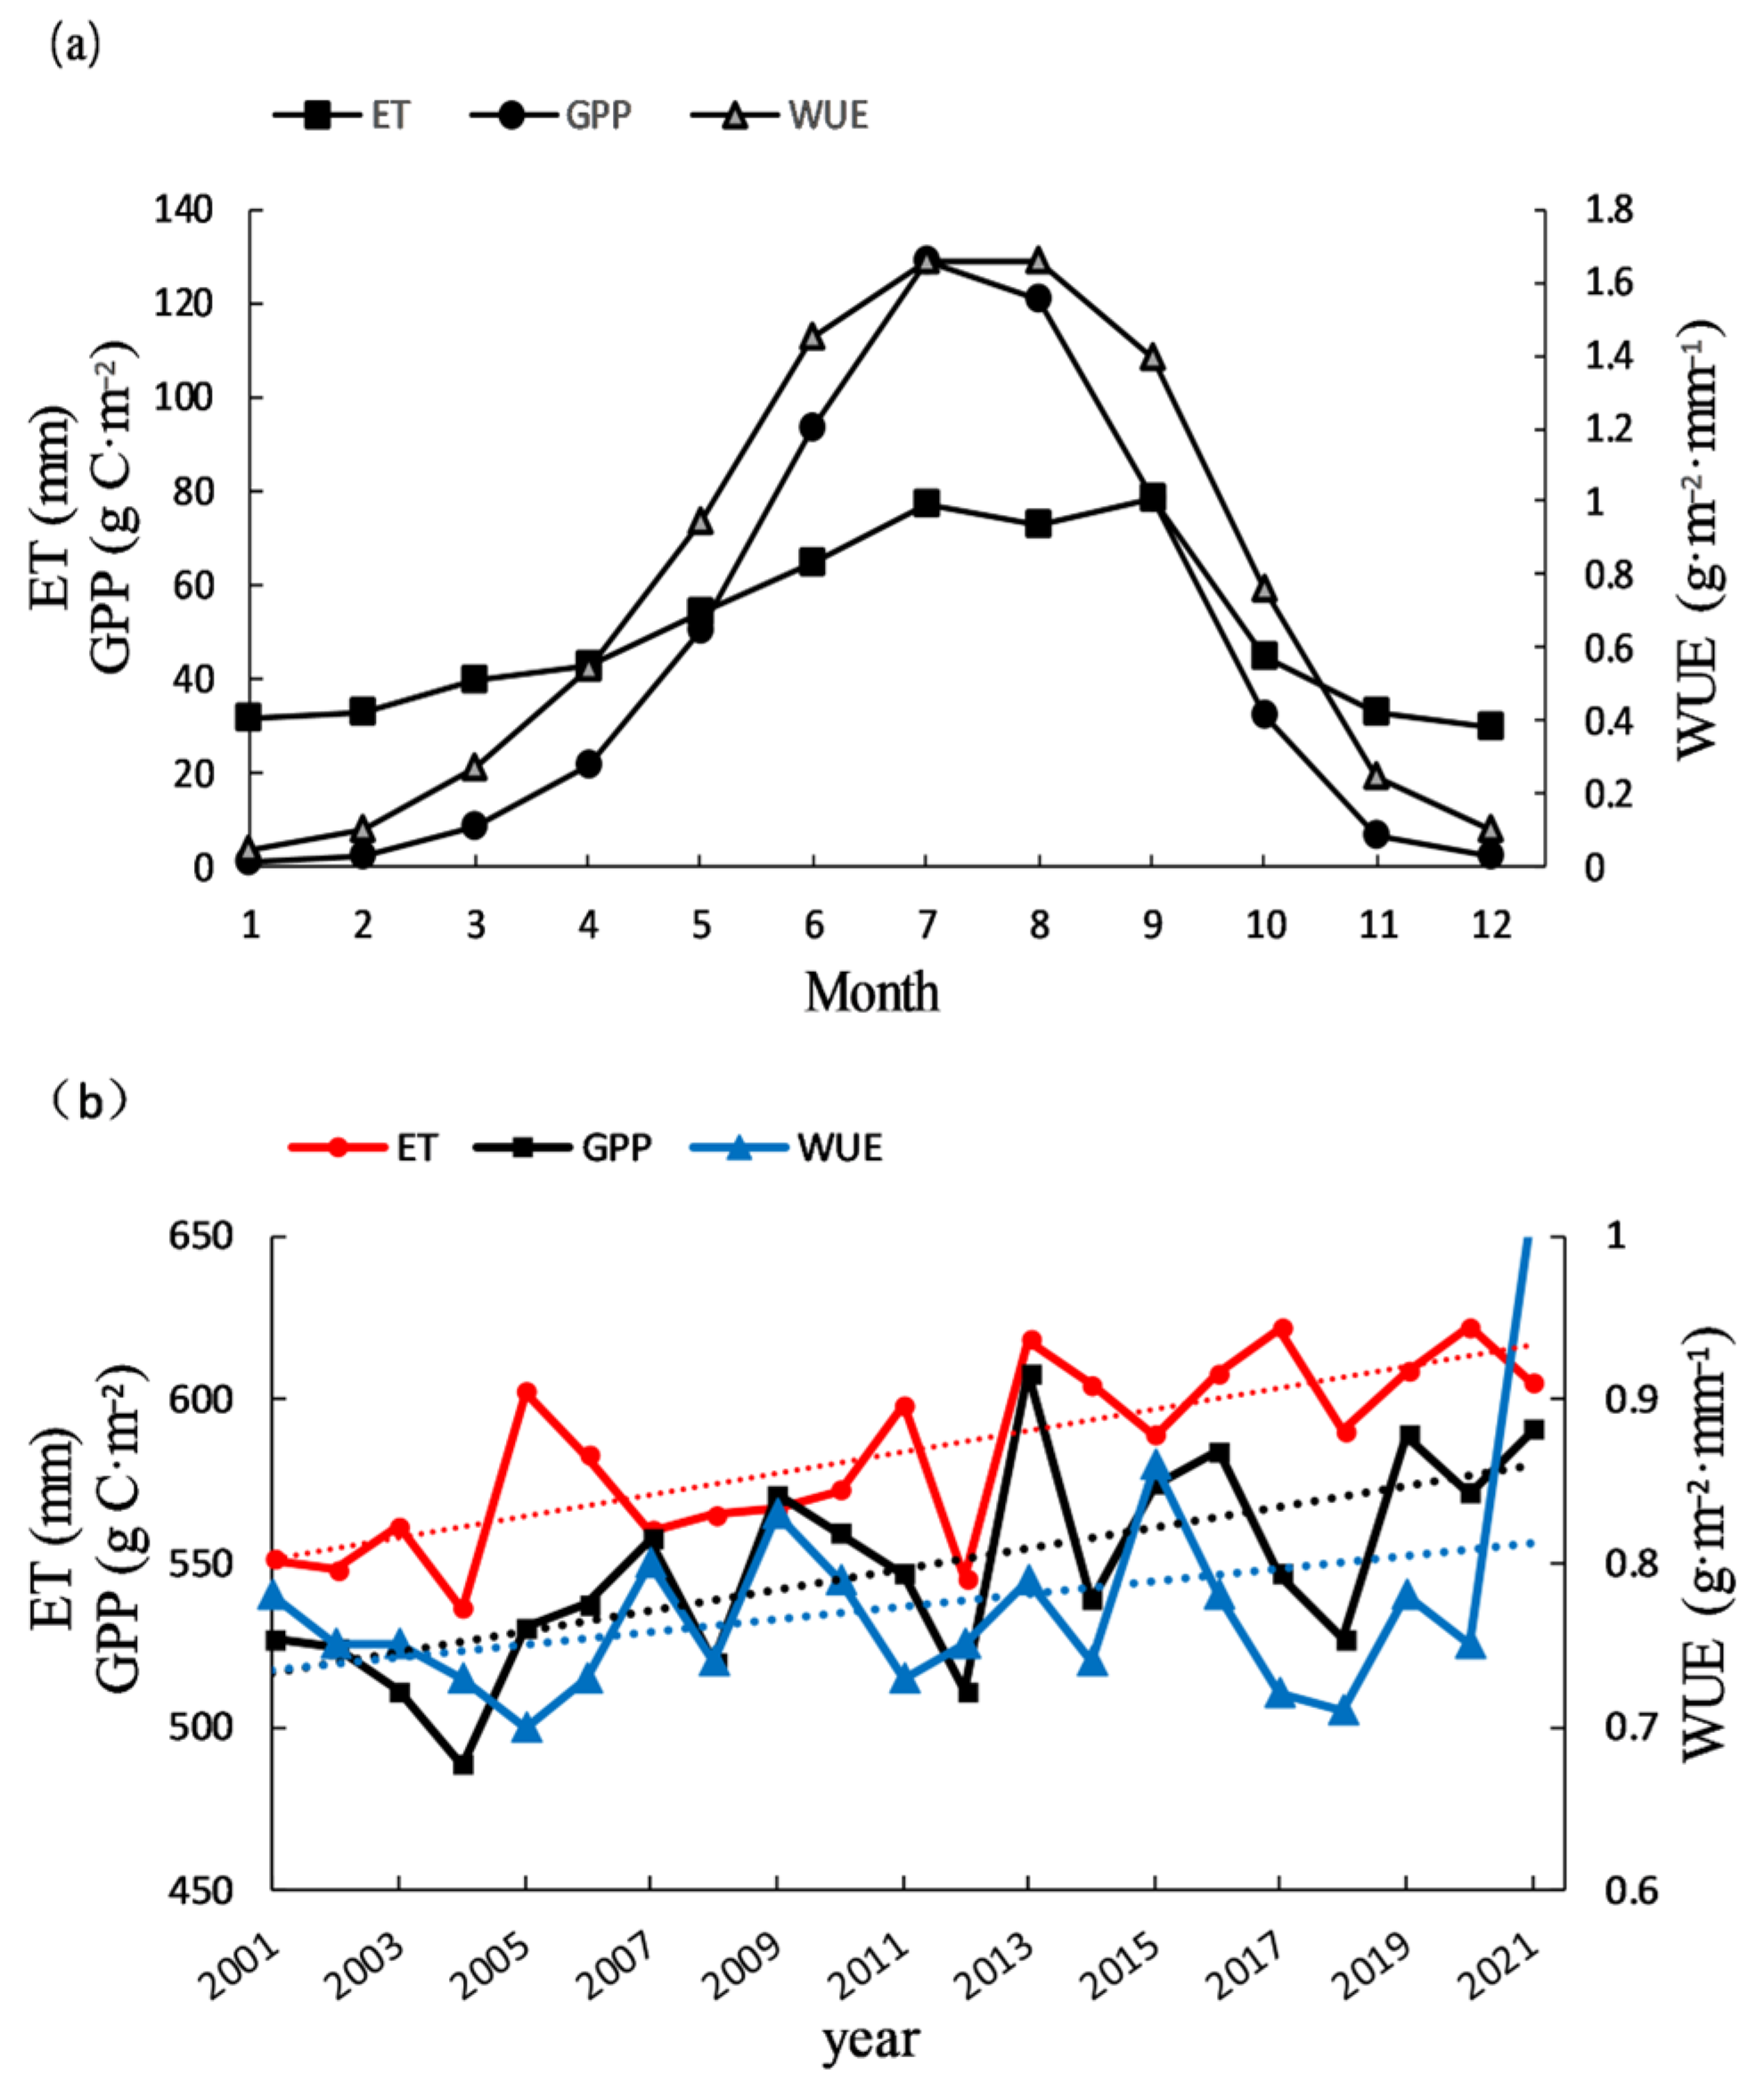
Figure 2a shows monthly GPP, ET, and WUE. It was found that the annual variation of GPP, ET, and WUE showed a similar “unimodal” curve. GPP and WUE showed a similar pattern, reaching their peaks in July and August. GPP reached its highest value in July, while the maximum WUE occurred in July and August. The peak of ET appeared in September. Low temperatures from November to March did not meet the conditions for photosynthesis, resulting in low GPP values and minimal plant transpiration. On the other hand, the ET values were relatively high during the same period due to soil evaporation, leading to the lowest WUE values ranging from 0 to 0.25 g·m−2·mm−1. From April to August, with increasing temperatures, precipitation, and solar radiation, favourable conditions for vegetation growth were present, resulting in a rapid increase in GPP and ET. The increase in GPP was particularly obvious, and the WUE values also increased rapidly. In September and October, as precipitation decreased and temperatures dropped, both the photosynthetic and transpiration capacities of the vegetation decreased, and vegetation growth entered a decay stage. During the growing season (May to September), the WUE values were relatively high, ranging from 0.94 to 1.66 g·m−2·mm−1.
As shown in Figure 2b, the average GPP in the NSP from 2001 to 2021 was 548.12 g C·m−2 and exhibit large interannual variability. The peak value occurred in 2013 at 607.78 g C·m−2, while the lowest value was recorded in 2004 at 488.43 g C·m−2. The GPP showed an increasing trend (p < 0.001). The average ET was 583.51 mm, with the peak occurring in 2020 (621.88 mm) and the trough in 2004 (536.07 mm). ET also demonstrated a significant upward trend. The average WUE was 0.77 g·m−2·mm−1, with the maximum value of 1.02 g·m−2·mm−1 observed in 2021 and the minimum value of 0.70 g·m−2·mm−1 recorded in 2005. This is a small increase in WUE.
3.1.2. Spatial Distribution
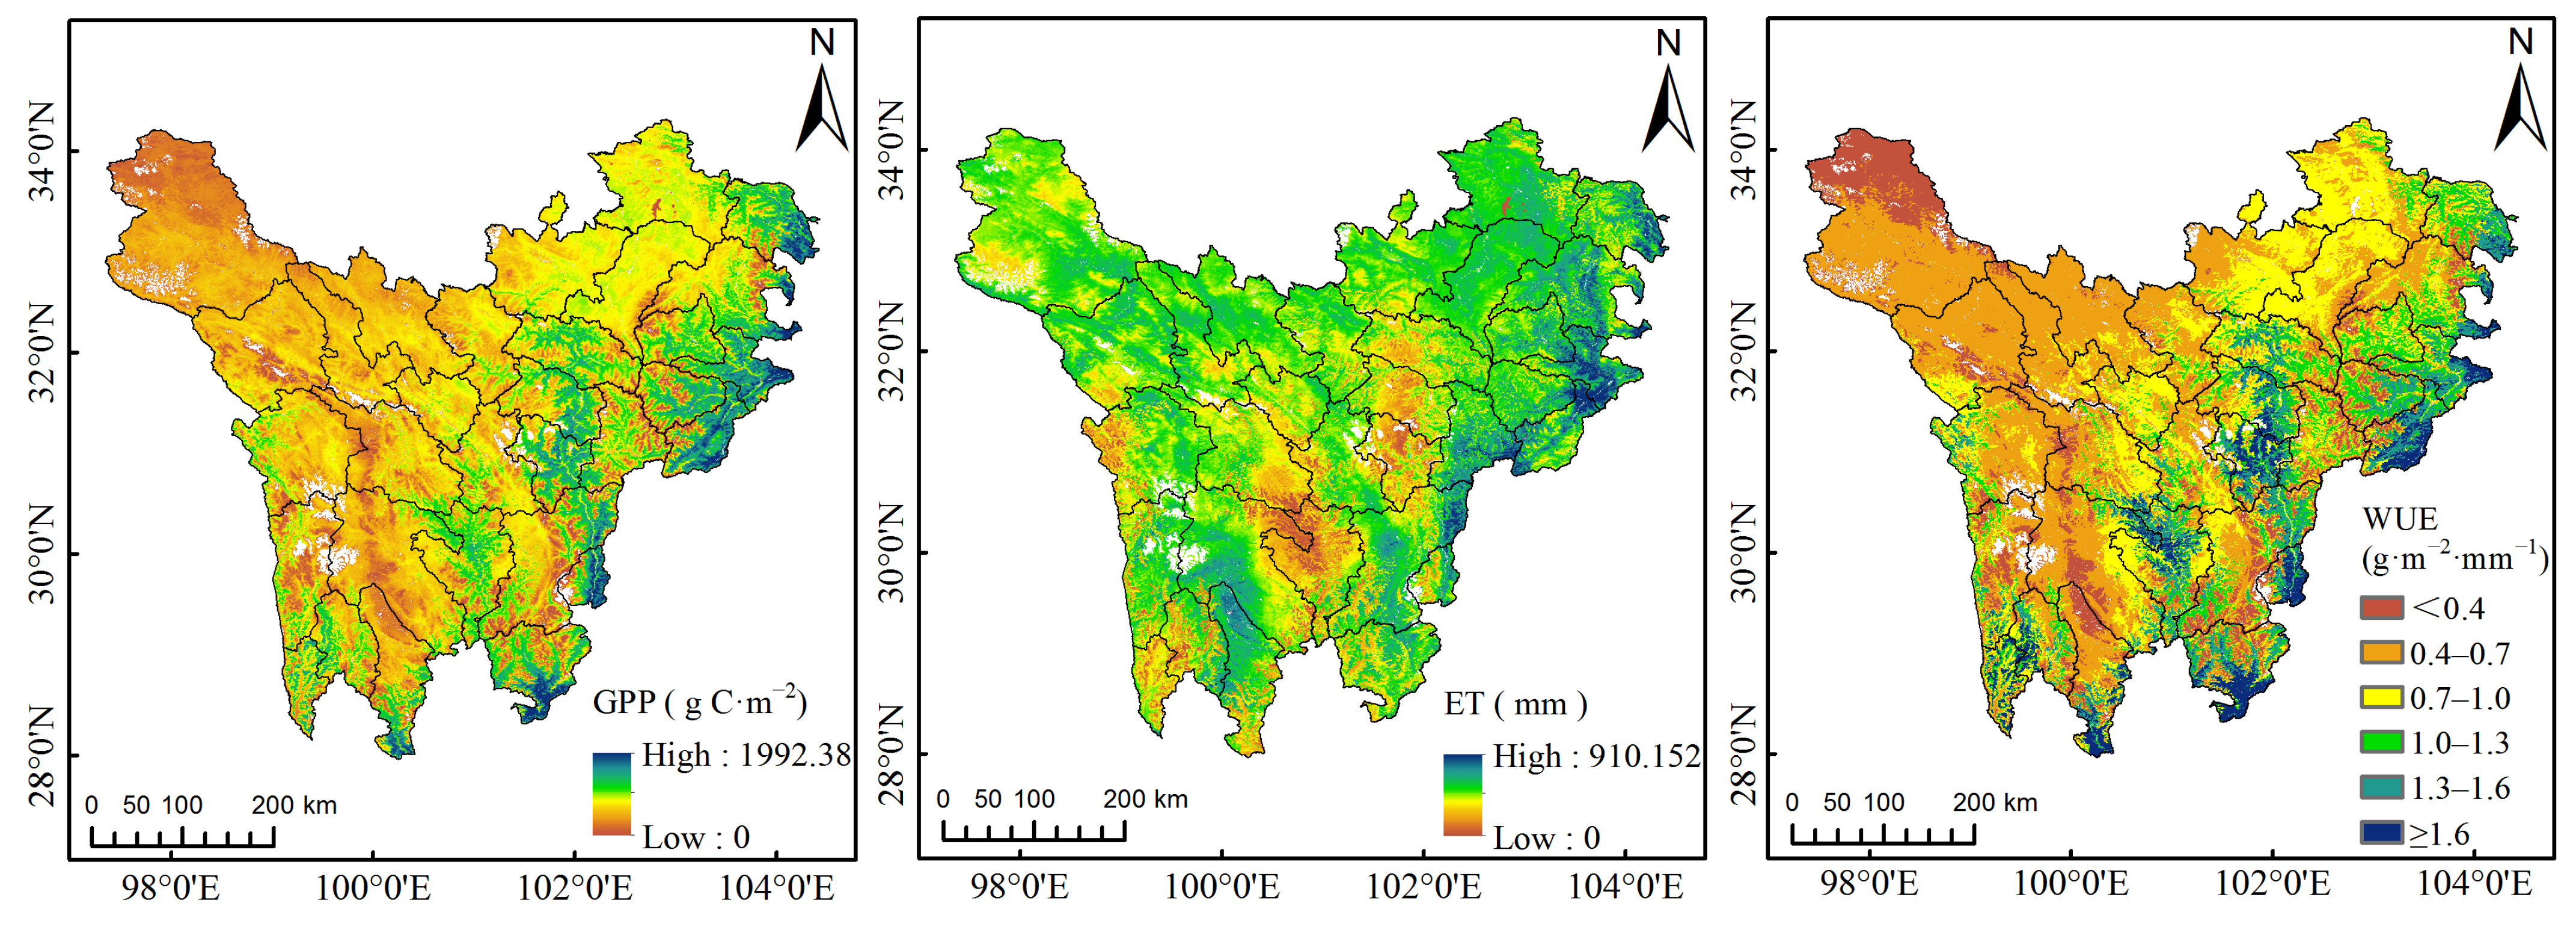
The GPP, ET, and WUE in the NSP showed significant spatial variations (Figure 3). The GPP generally increases from northwest to east. The high-value areas were mainly located in the eastern and southern edges of the NSP, which are predominantly covered by forests; the average GPP in these areas exceeded 700 g C·m−2. On the other hand, the low-value areas were mainly concentrated in the northwestern and central-western NSP, where the average GPP was generally below 500 g C·m−2. These regions consist mostly of grasslands and shrublands with sparse vegetation. In particular, the grassland in Shiqu, northwestern NSP, suffered from severe degradation, resulting in the low-value zone of GPP. The areas with high ET are mainly distributed in the northeastern and southwestern NSP, with forest land as the main vegetation type, including some grasslands and wetlands. The average ET in these areas exceeded 650 mm. The low-value areas were concentrated in the central NSP, where the average ET is below 550 mm. These areas with low ET were mainly found in the forest region of the Dadu River Basin and areas with significant vegetation degradation. As a result, the spatial pattern of WUE was similar to that of GPP, showing an increasing trend from the northwest to the east. Therefore, the variation in GPP had a greater impact on the spatial pattern of WUE than ET in the NSP. The forested areas in the eastern and southern edges of the NSP showed high values of WUE, with average values exceeding 1.2 g·m−2·mm−1. The grassland areas were generally characterised by low WUE, especially in severely degraded grasslands such as the northern Shiqu and Litang County, with average values below 0.5 g·m−2·mm−1.
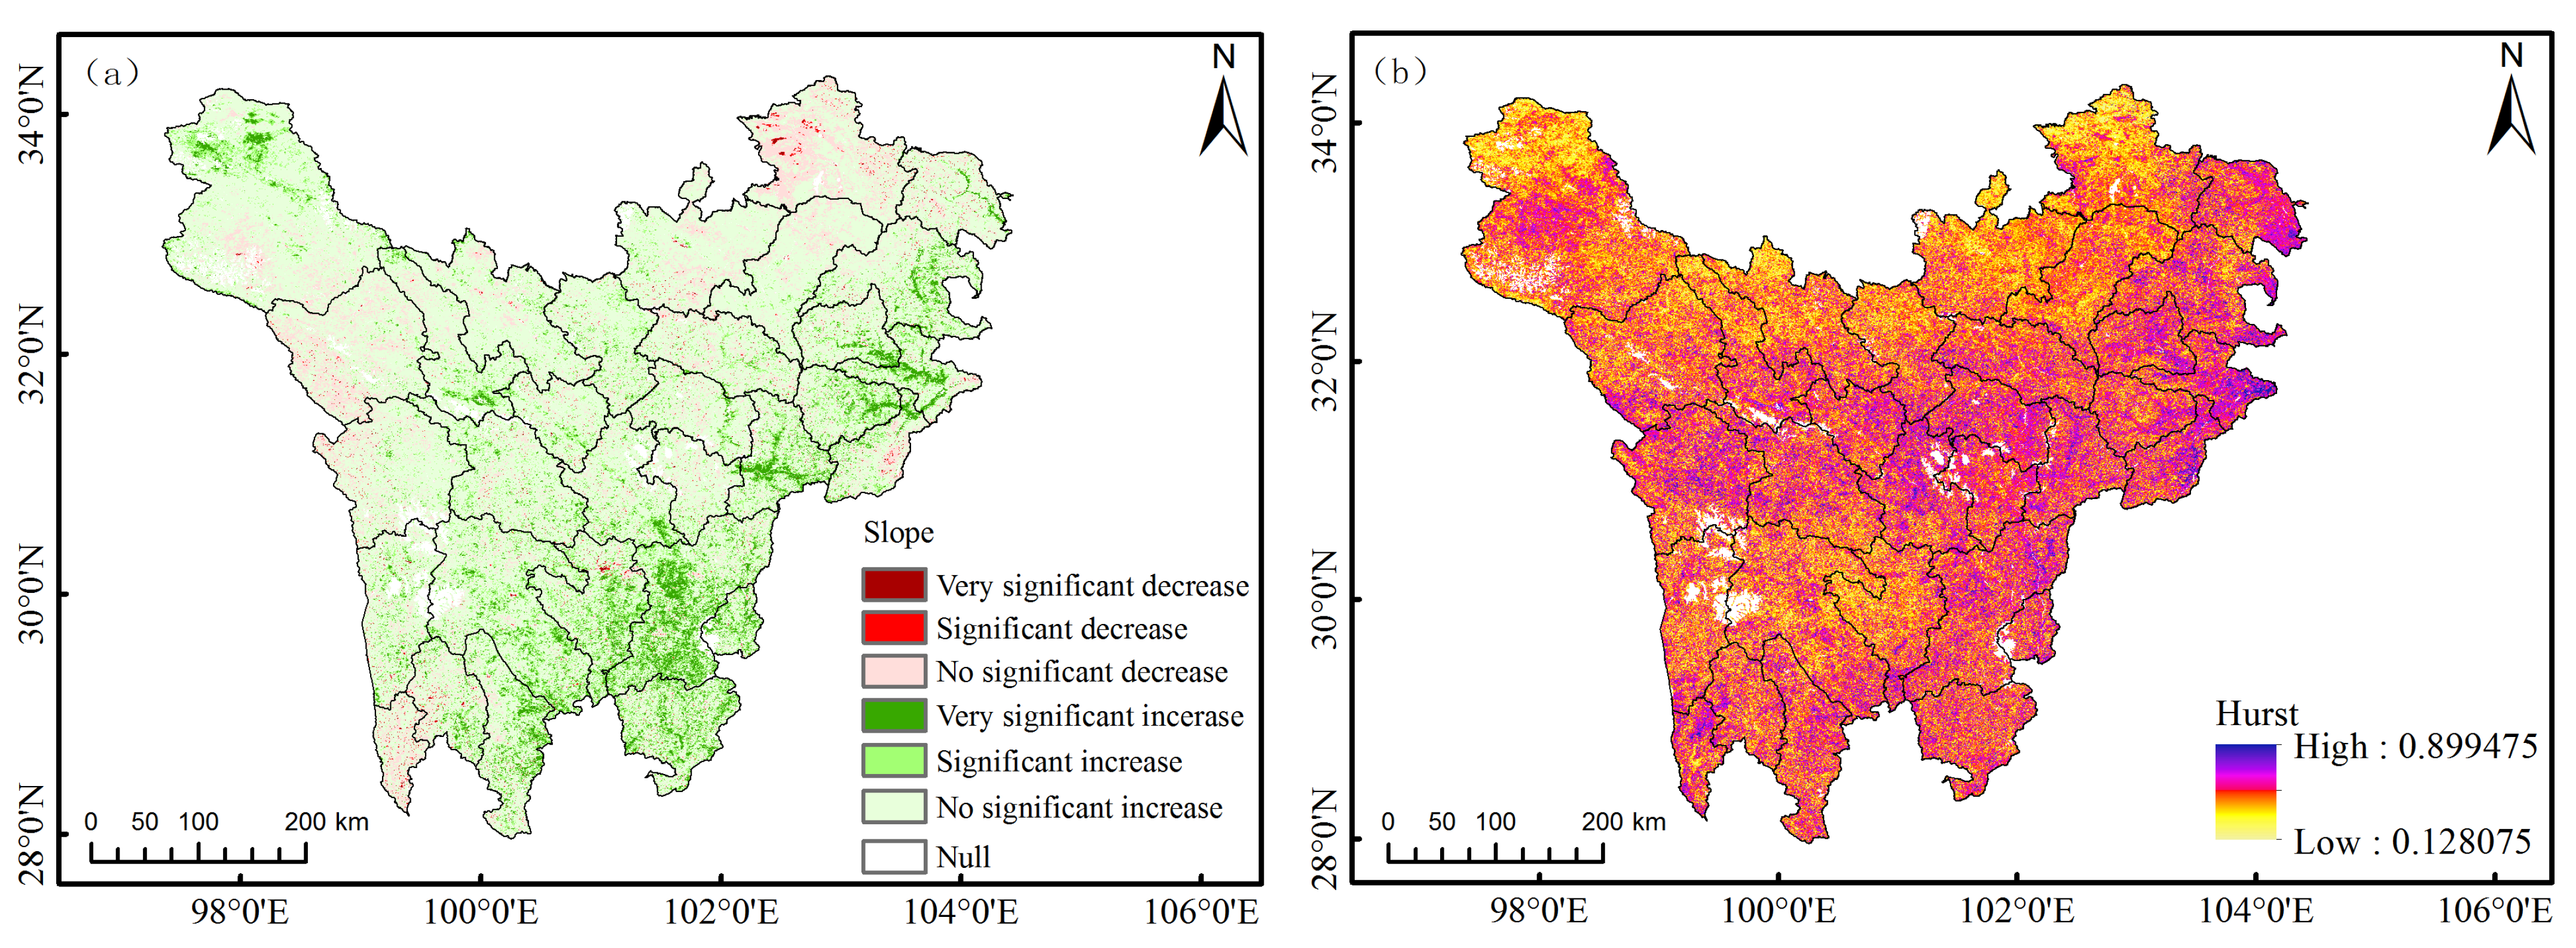
Between 2001 and 2021, approximately 82.8% of the vegetation in the NSP was stable in terms of WUE (p > 0.05, Figure 4a). The areas with an increase in WUE (slope > 0, 0.01 < p < 0.05) were significantly larger than those with a decreasing trend (slope < 0, 0.01 < p < 0.05), accounting for 95.6% of the changing regions. These areas were mostly located in the eastern border and the southeastern NSP, mainly consisting of forest lands, grasslands, and shrublands. The WUE decreased mostly in the northeastern and western border of NSP, with large decreases in the northern parts of Ruoergai County and Yajiang County, mainly consisting of wetland and forest land.
The Hurst index in the NSP ranged from 0.13 to 0.90, with an average value of 0.43 (Figure 4b). The proportion of areas with a Hurst value less than 0.4 was 37.2%, mainly distributed in the northern and central-southern regions of NSP. In these areas, future WUE changes show strong anti-persistence. The current decreasing trend in north will be turned into an increasing trend, while the current increasing trend in the central-southern region will be turned into a decreasing trend. Also, the areas with a Hurst index greater than 0.6 accounted for only 2.2% of the total area, scattered in the northeastern border and sporadic regions of the central part of the NSP. The trend of WUE in these areas is increasing and exhibit strong persistence in the future, maintaining the current increasing trend.
3.2. Variation of WUE for Different Types of Vegetation
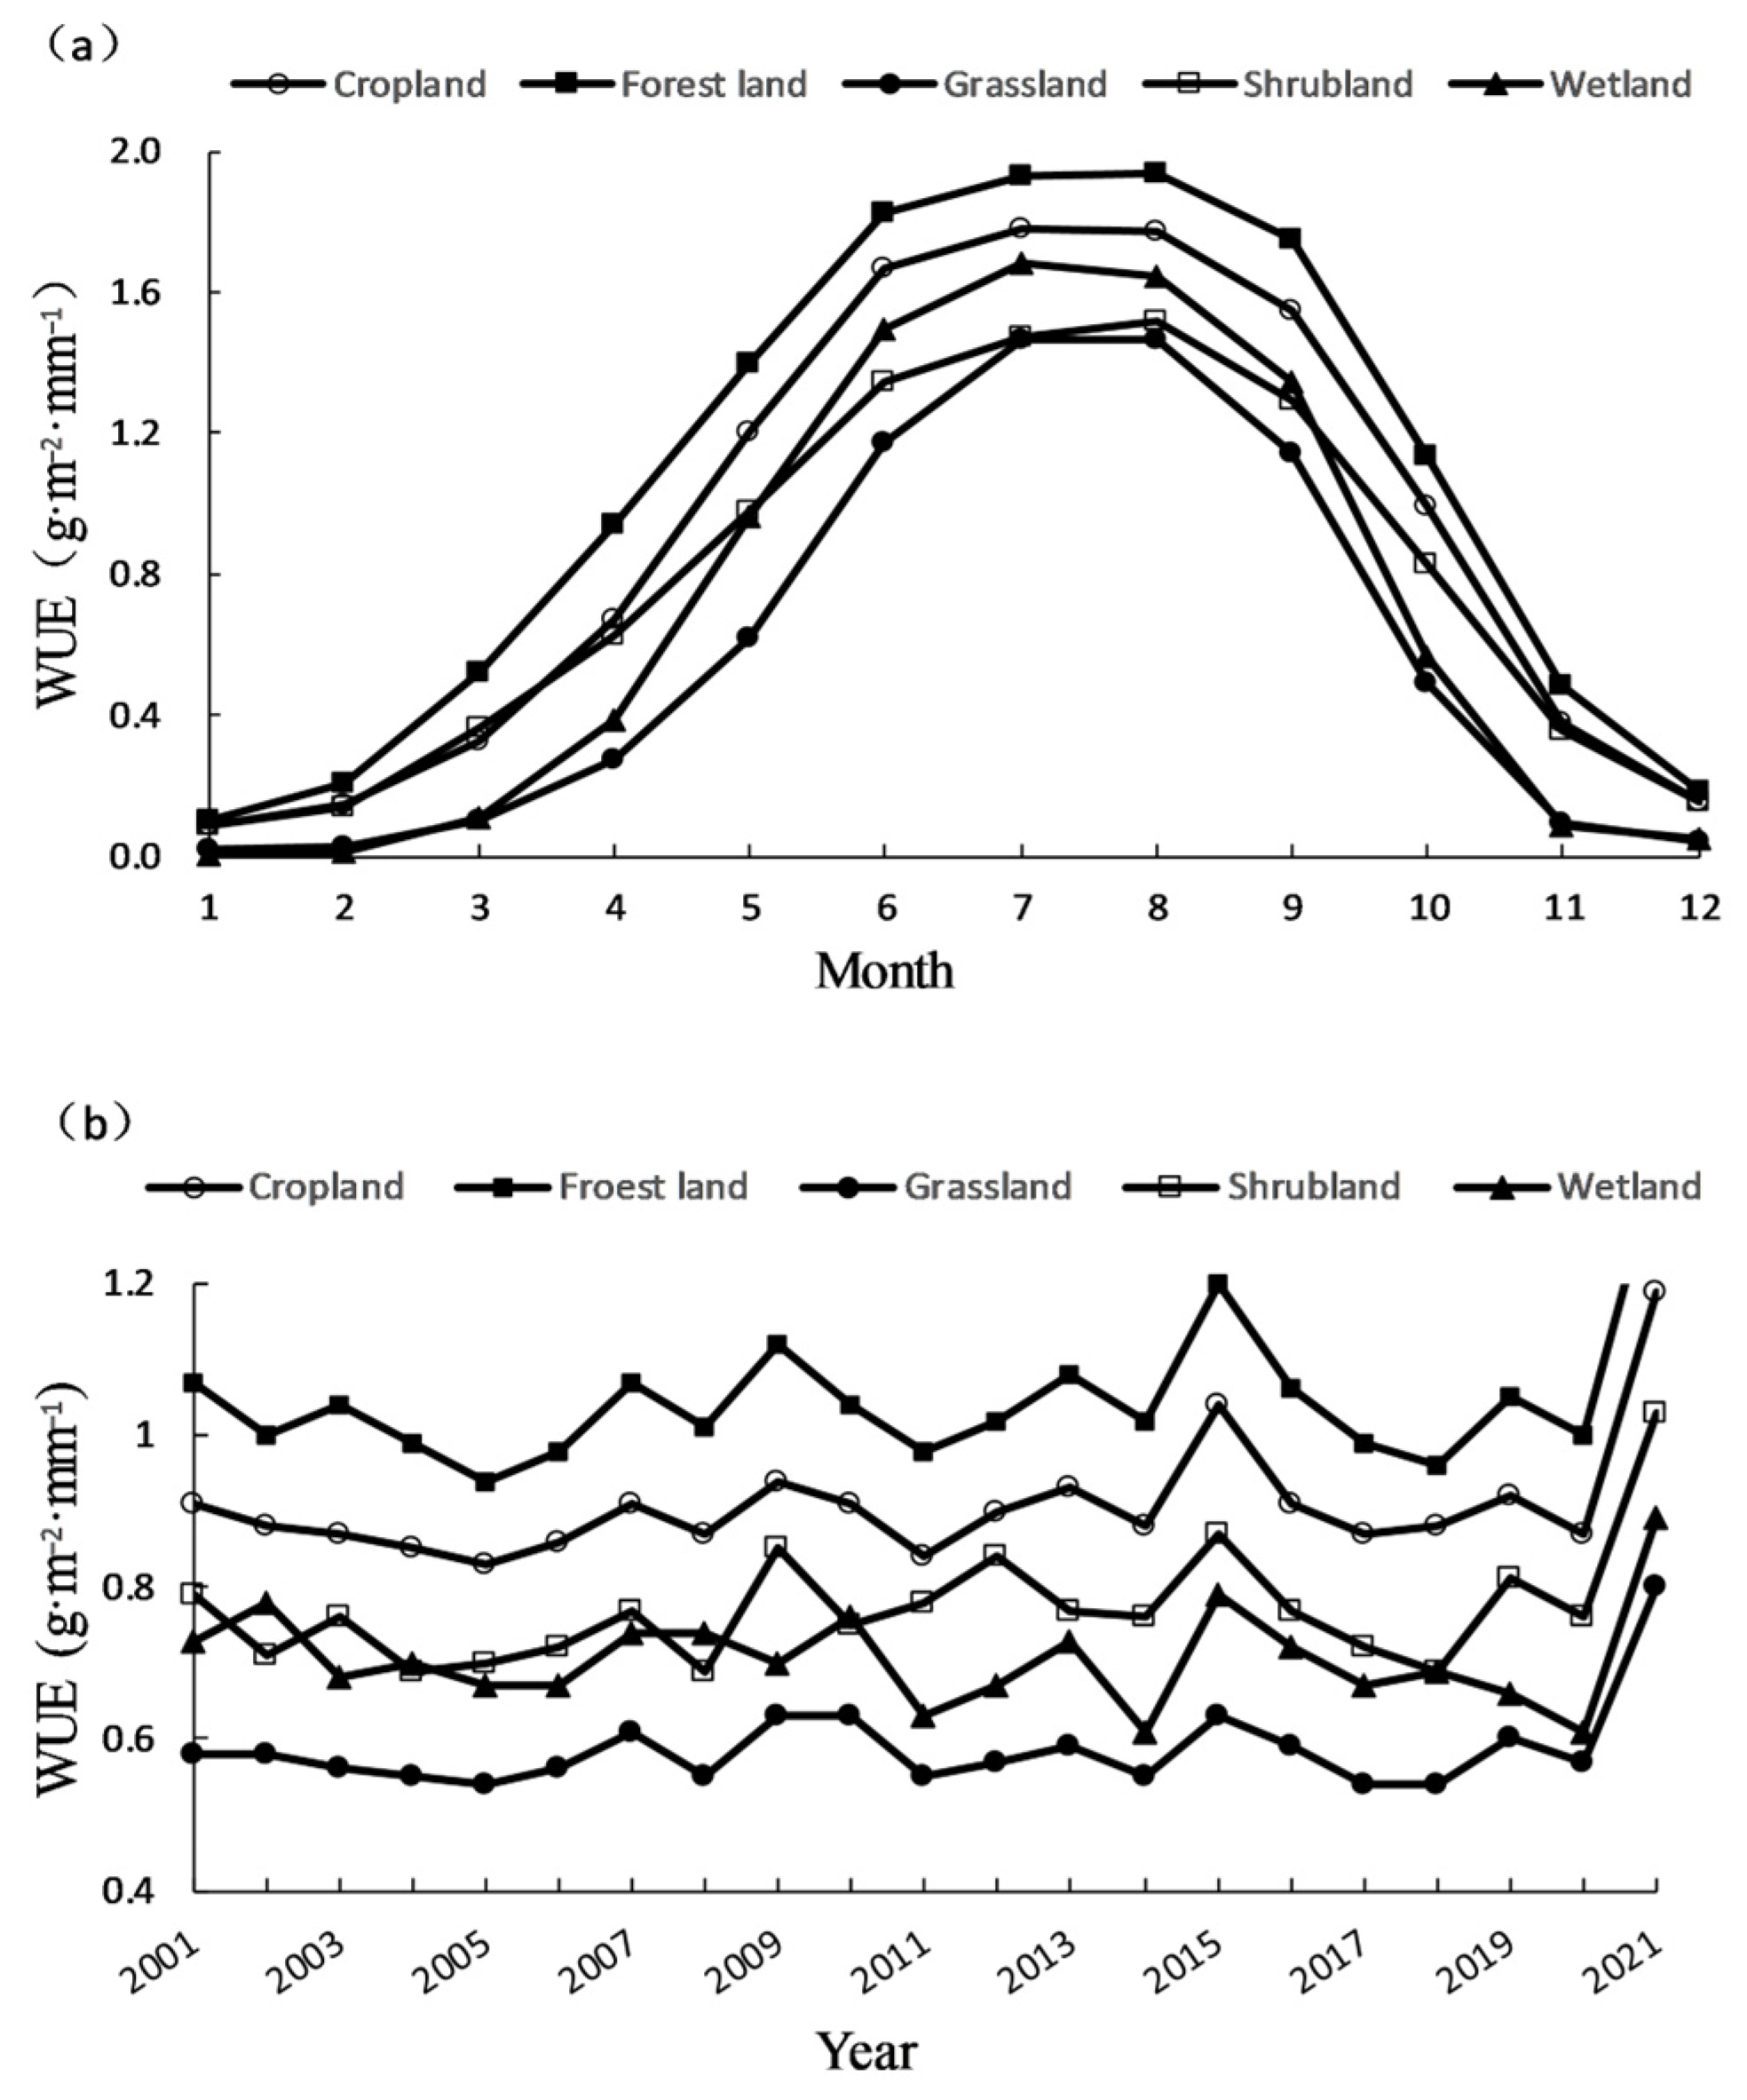
There are apparent differences in GPP, ET, and WUE among various types of vegetation due to the differences in physiological and ecological structures as well as water use strategies. As shown in Figure 5a, the annual cycle of WUE for all vegetation types followed a “unimodal” pattern. The maximum WUE values for croplands and wetlands occurred in July, while forest lands, grasslands, and shrublands reached their peak in August. On average, forest lands had the highest WUE, followed by croplands, shrublands, and wetlands, with grasslands having the lowest WUE. The highest annual average WUE of the forest lands is attributed to the highest GPP value and lowest ET value. The lowest WUE for grasslands is primarily due to the lowest GPP and relatively higher ET. Although both GPP and ET for shrublands were smaller than those of wetlands, shrublands had slightly higher WUE than wetlands.
GPP and ET for all vegetation types showed a significant increasing trend (p < 0.05 or p < 0.001). However, the trends in WUE were relatively complex. Croplands and shrublands showed a significant increasing trend, with forest lands and grasslands increasing insignificantly and wetlands decreasing slightly (Figure 5b). Croplands had the fastest increase rate (0.056 g·m−2·mm−1·10a−1), primarily due to the rapid increase in GPP and relatively slower increase in ET. Wetlands had the slowest increase rate in GPP and the fastest increase rate in ET, resulting in a decreasing trend in WUE.
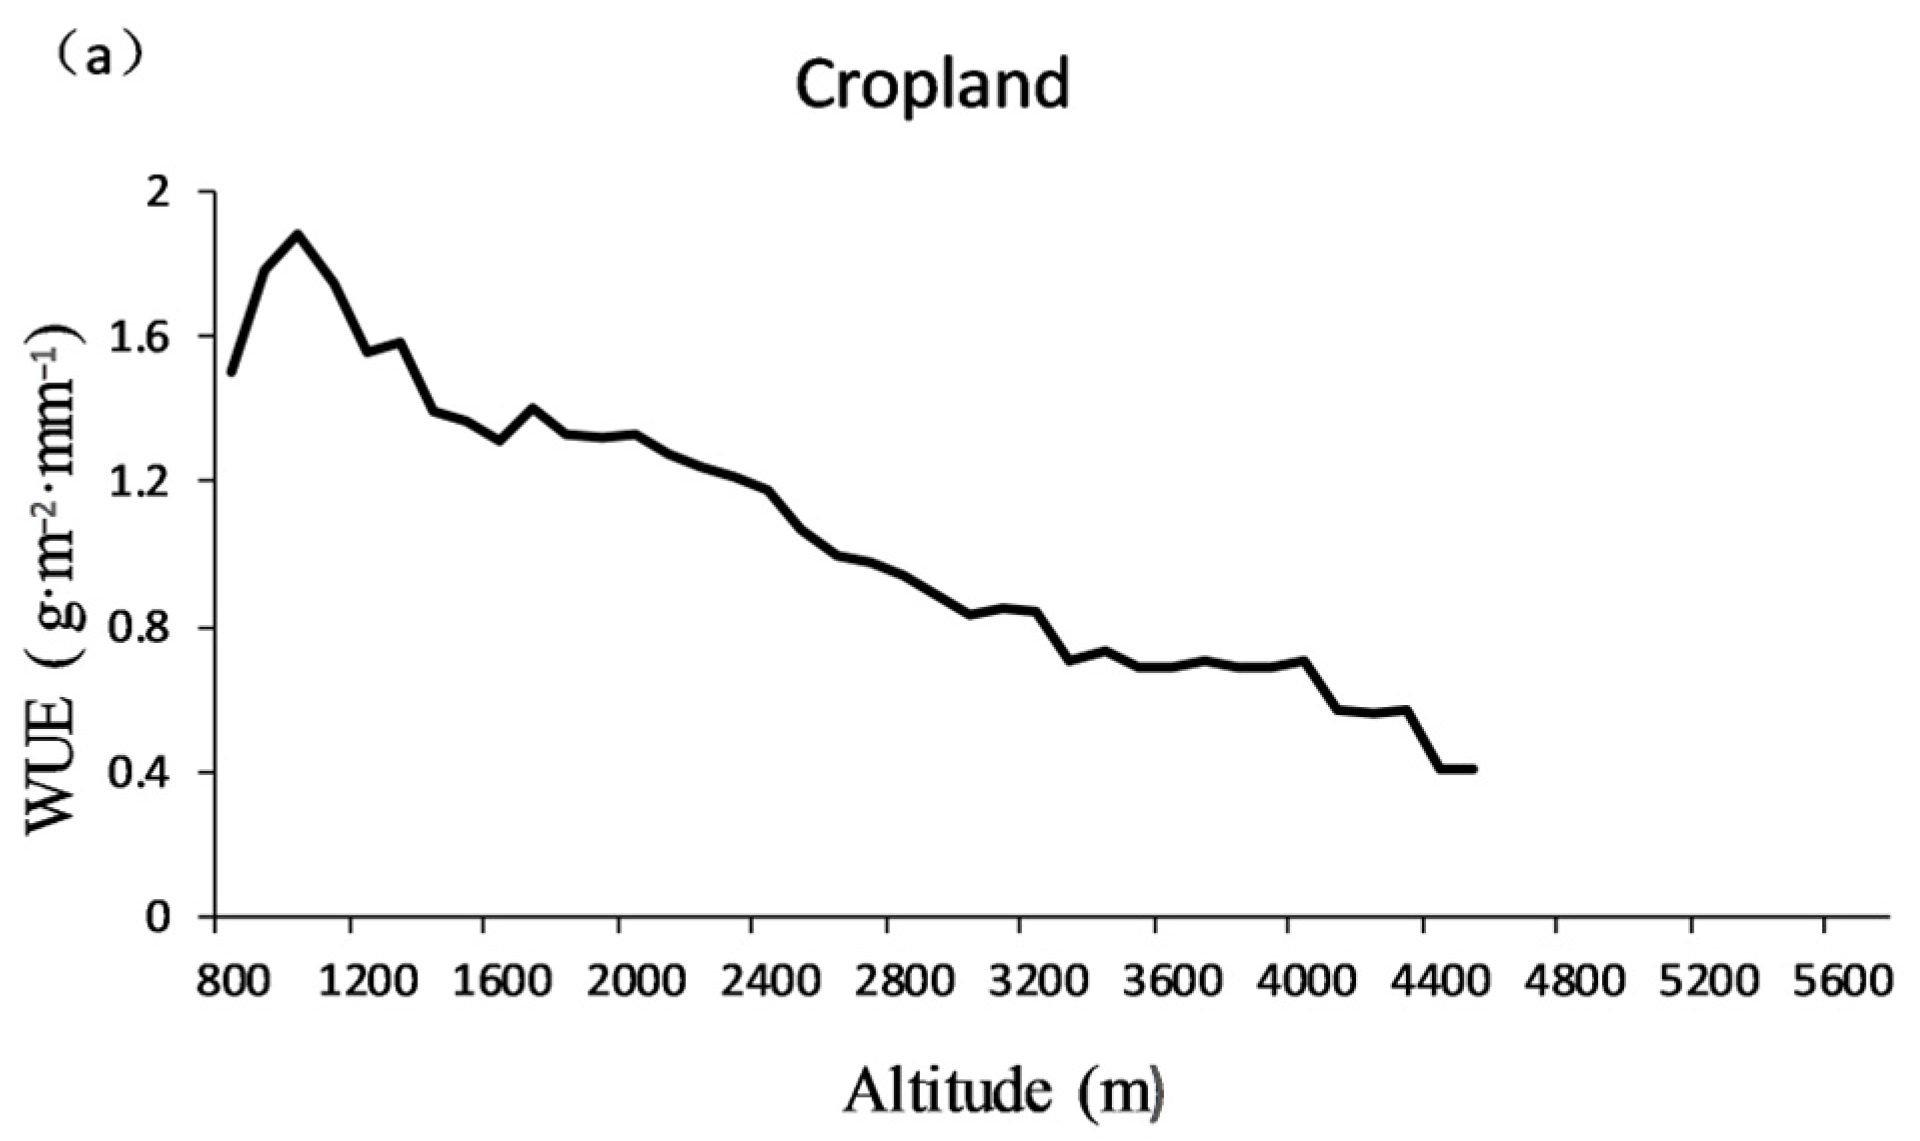
The vegetation in the NSP demonstrated significant variations with altitude. WUE also varied with altitude for different vegetation types (Figure 6). For croplands, WUE initially increased with altitude, and then sharply decreased between 1100 and 1600 m, and finally showed a gradual fluctuating declining trend. Forest lands showed a slow increase in WUE with altitude, followed by a gradual decline between 1100 and 4000 m, and a rapid decrease in the last part. Grasslands experienced a sharp decrease in WUE with increasing altitude, stabilising between 1600 and 2600 m, and then declined slowly. Also, shrublands showed a fluctuating decrease in WUE below 3700 m, followed by a stable decline with increasing altitude. Wetlands showed a highly fluctuating trend in WUE with increasing altitude. The altitude ranges of high WUE value varied among the different vegetation types. The altitude of high WUE for most vegetation types was between 800 and 1800 m, with the exception of wetlands, which had their high WUE in the altitude range between 3100 and 3200 m.
3.3. Response of WUE to Climatic Factors in Northwestern Sichuan Plateau
3.3.1. Geographical Detection Analysis of WUE and Climatic Factors
To investigate the influence of climatic factors on the variation of WUE, we selected 14 climatic factors (Table 1) for detection and interaction analysis. The correlations between regional normalised WUE and climate variables for different vegetation types are shown in Table 2. The WUE of grassland and shrubland were less affected by climatic fluctuations, while temperature indices had a significant influence on the WUE of forest land and cropland, especially mean temperature. The precipitation indices had limited impact on the WUE of forest land. The WUE of wetland was mainly affected by the precipitation indices, especially extreme precipitation indices. Additionally, the diurnal temperature range (DTR) also had a strong influence on the WUE of cropland. Overall, although most vegetation types were greatly influenced by mean temperature indices, extreme climatic variables also had a significant impact on wetland and cropland.
The interaction detector indicates a dual-factor enhancement or nonlinear enhancement effect. Specifically, the interaction of grassland and cropland with climatic factors showed a significant nonlinear enhancement relationship (accounting for 77.5% and 62.5%), while this was not true for forest land, shrubland, or wetland. Among the five types of vegetation, the combination interaction of various factors in wetland was significantly stronger than for other vegetation types, especially the combination interaction of maximum 1-day precipitation (RX1d) and the other extreme climatic variables, mainly manifested as dual-factor enhancement with q values exceeding 0.7. Additionally, the dual-factor enhancement effect between maximum 5-day precipitation (RX5d) and various extreme temperature indices on cropland was also strong, with q values exceeding 0.5. In the remaining three vegetation types, the interaction of the consecutive wet days (CWD) index with extreme climatic variables generally had a considerable impact, with q values ranging from 0.35 to 0.55. The overlay effect of temperature indices on forest land was stronger than the precipitation indices, while the overlay effect of the precipitation indices on grassland and shrubland was stronger than temperature indices. Overall, the effect of single extreme climatic variables on WUE was weak, but the interactions of one extreme single index with mean climate indices or other extreme indices exerted significant effects on WUE.
3.3.2. Relationship between WUE and Climatic Factors in Northwestern Sichuan Plateau
Table 3 shows the correlation between climate factors and the WUE of different vegetation types; only the factors that are significantly correlated (p < 0.05) with at least one vegetation type are presented. It can be seen that the correlation between the WUE and climate factors varied significantly among different vegetation types, and the correlation between different climate factors and the same underlying surface type also differed. The WUE of forest land only significantly and positively correlated with mean air temperature, minimum value of daily minimum temperature (TNN), and growing season length (GSL). The increase in TNN and mean temperature promoted the WUE of forest land; however, it was not sensitive to precipitation. The WUE of shrubland was primarily influenced by precipitation, with extreme precipitation having a promoting effect on WUE. The WUE of cropland showed a significant correlation with extreme climatic variables, with extreme cold temperatures primarily promoting cropland WUE, while the extreme precipitation indices exhibited an inhibitory effect. The WUE of grassland and wetland was not significantly associated with climate factors, and the correlations with the temperature indices were weaker than those of the precipitation indices.
Due to the complex topography of the NSP and spatial heterogeneity in the variation of the climatic variables, the correlation coefficients between the regional mean climate indices and WUE were relatively low. To further explore the relationship between WUE and various climate indices, the pixel-scale correlation of forest land and grassland with WUE is discussed, as they account for 37.0% and 54.4% of the study areas, respectively.
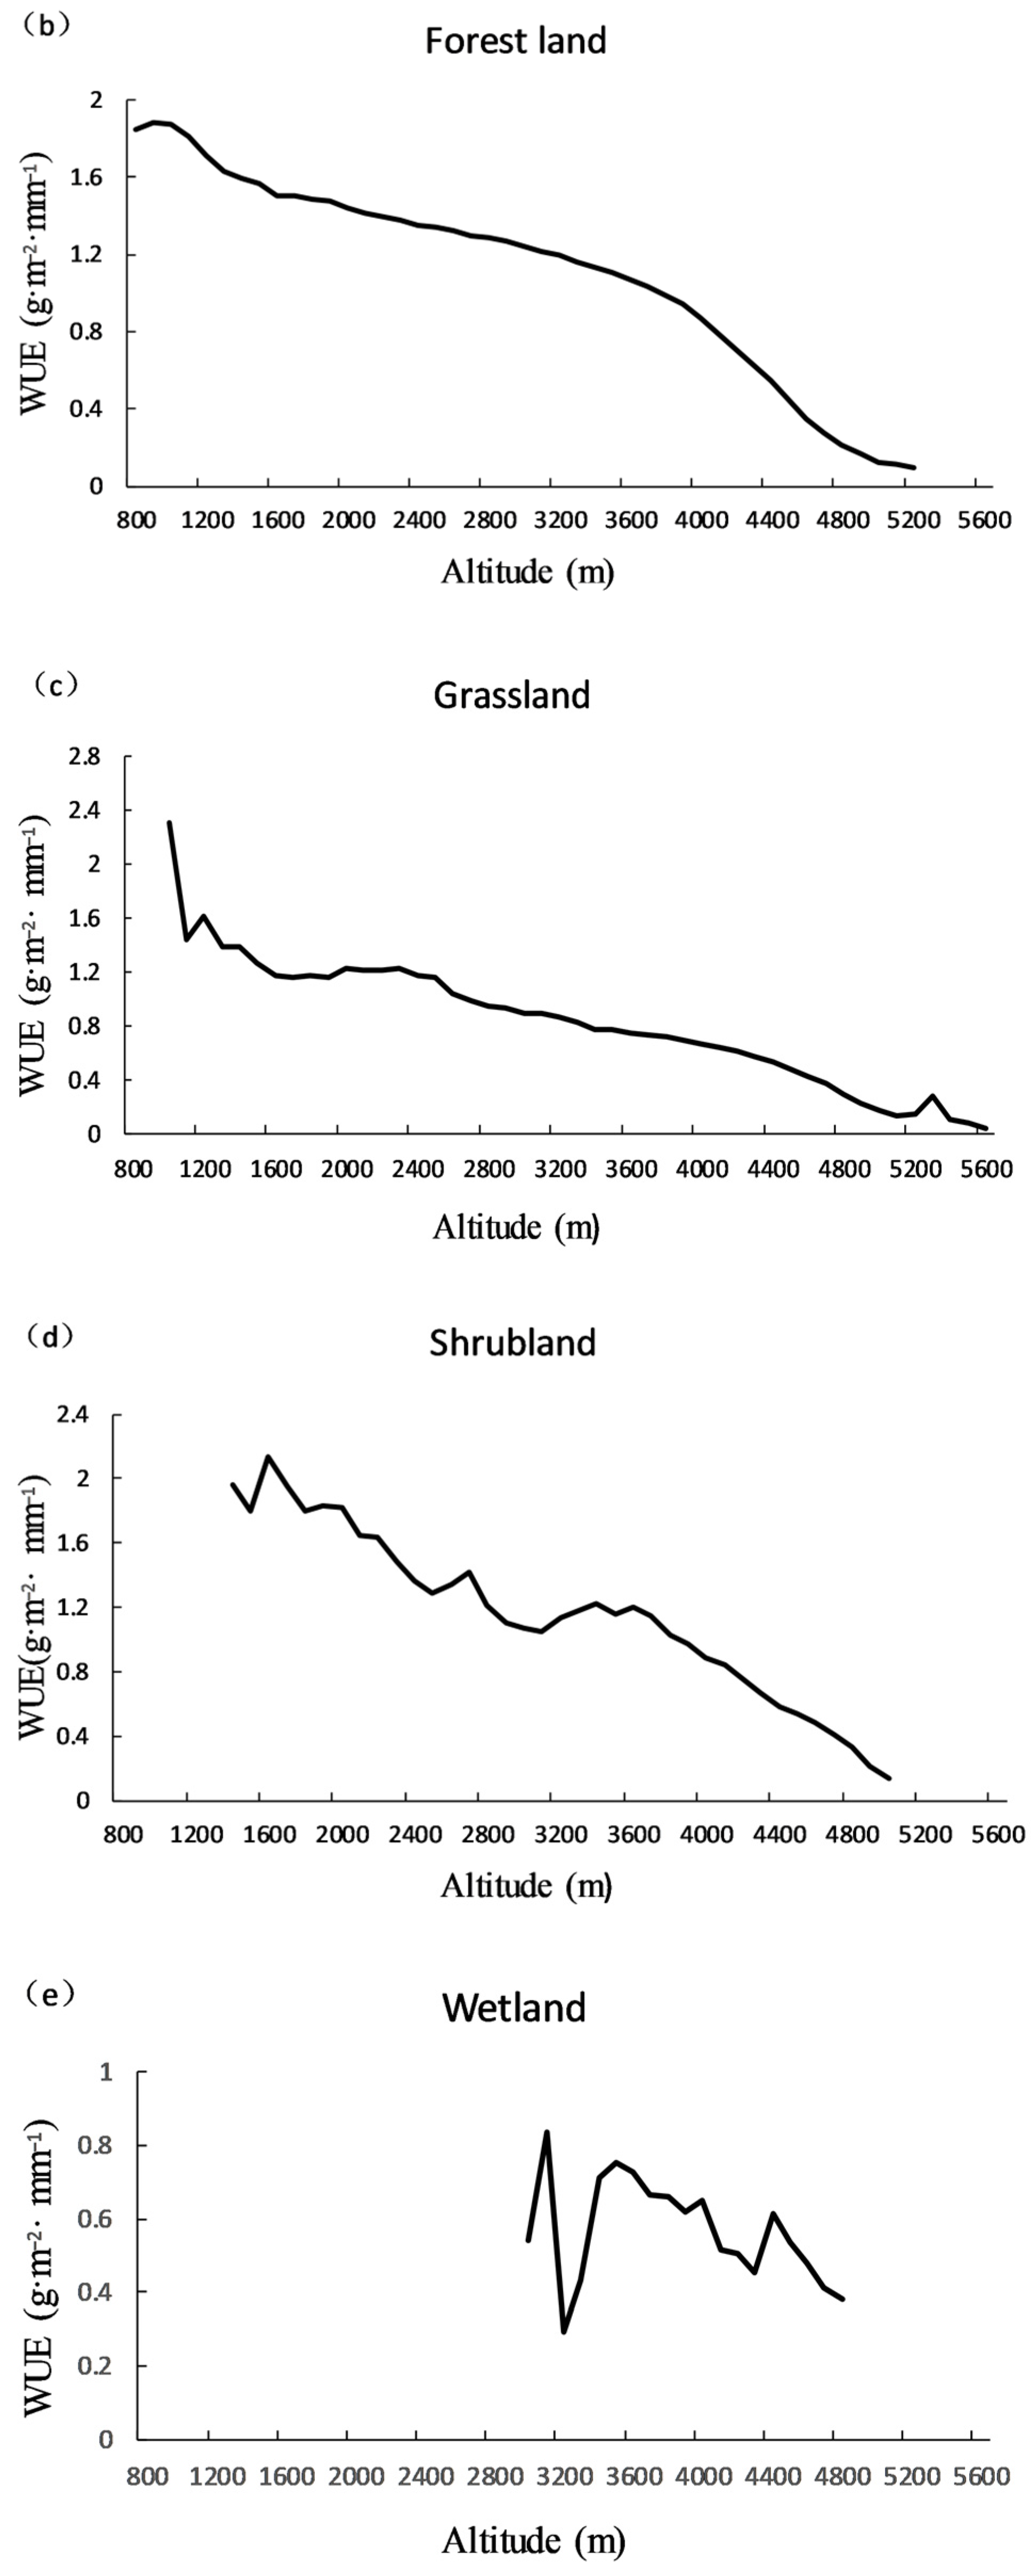
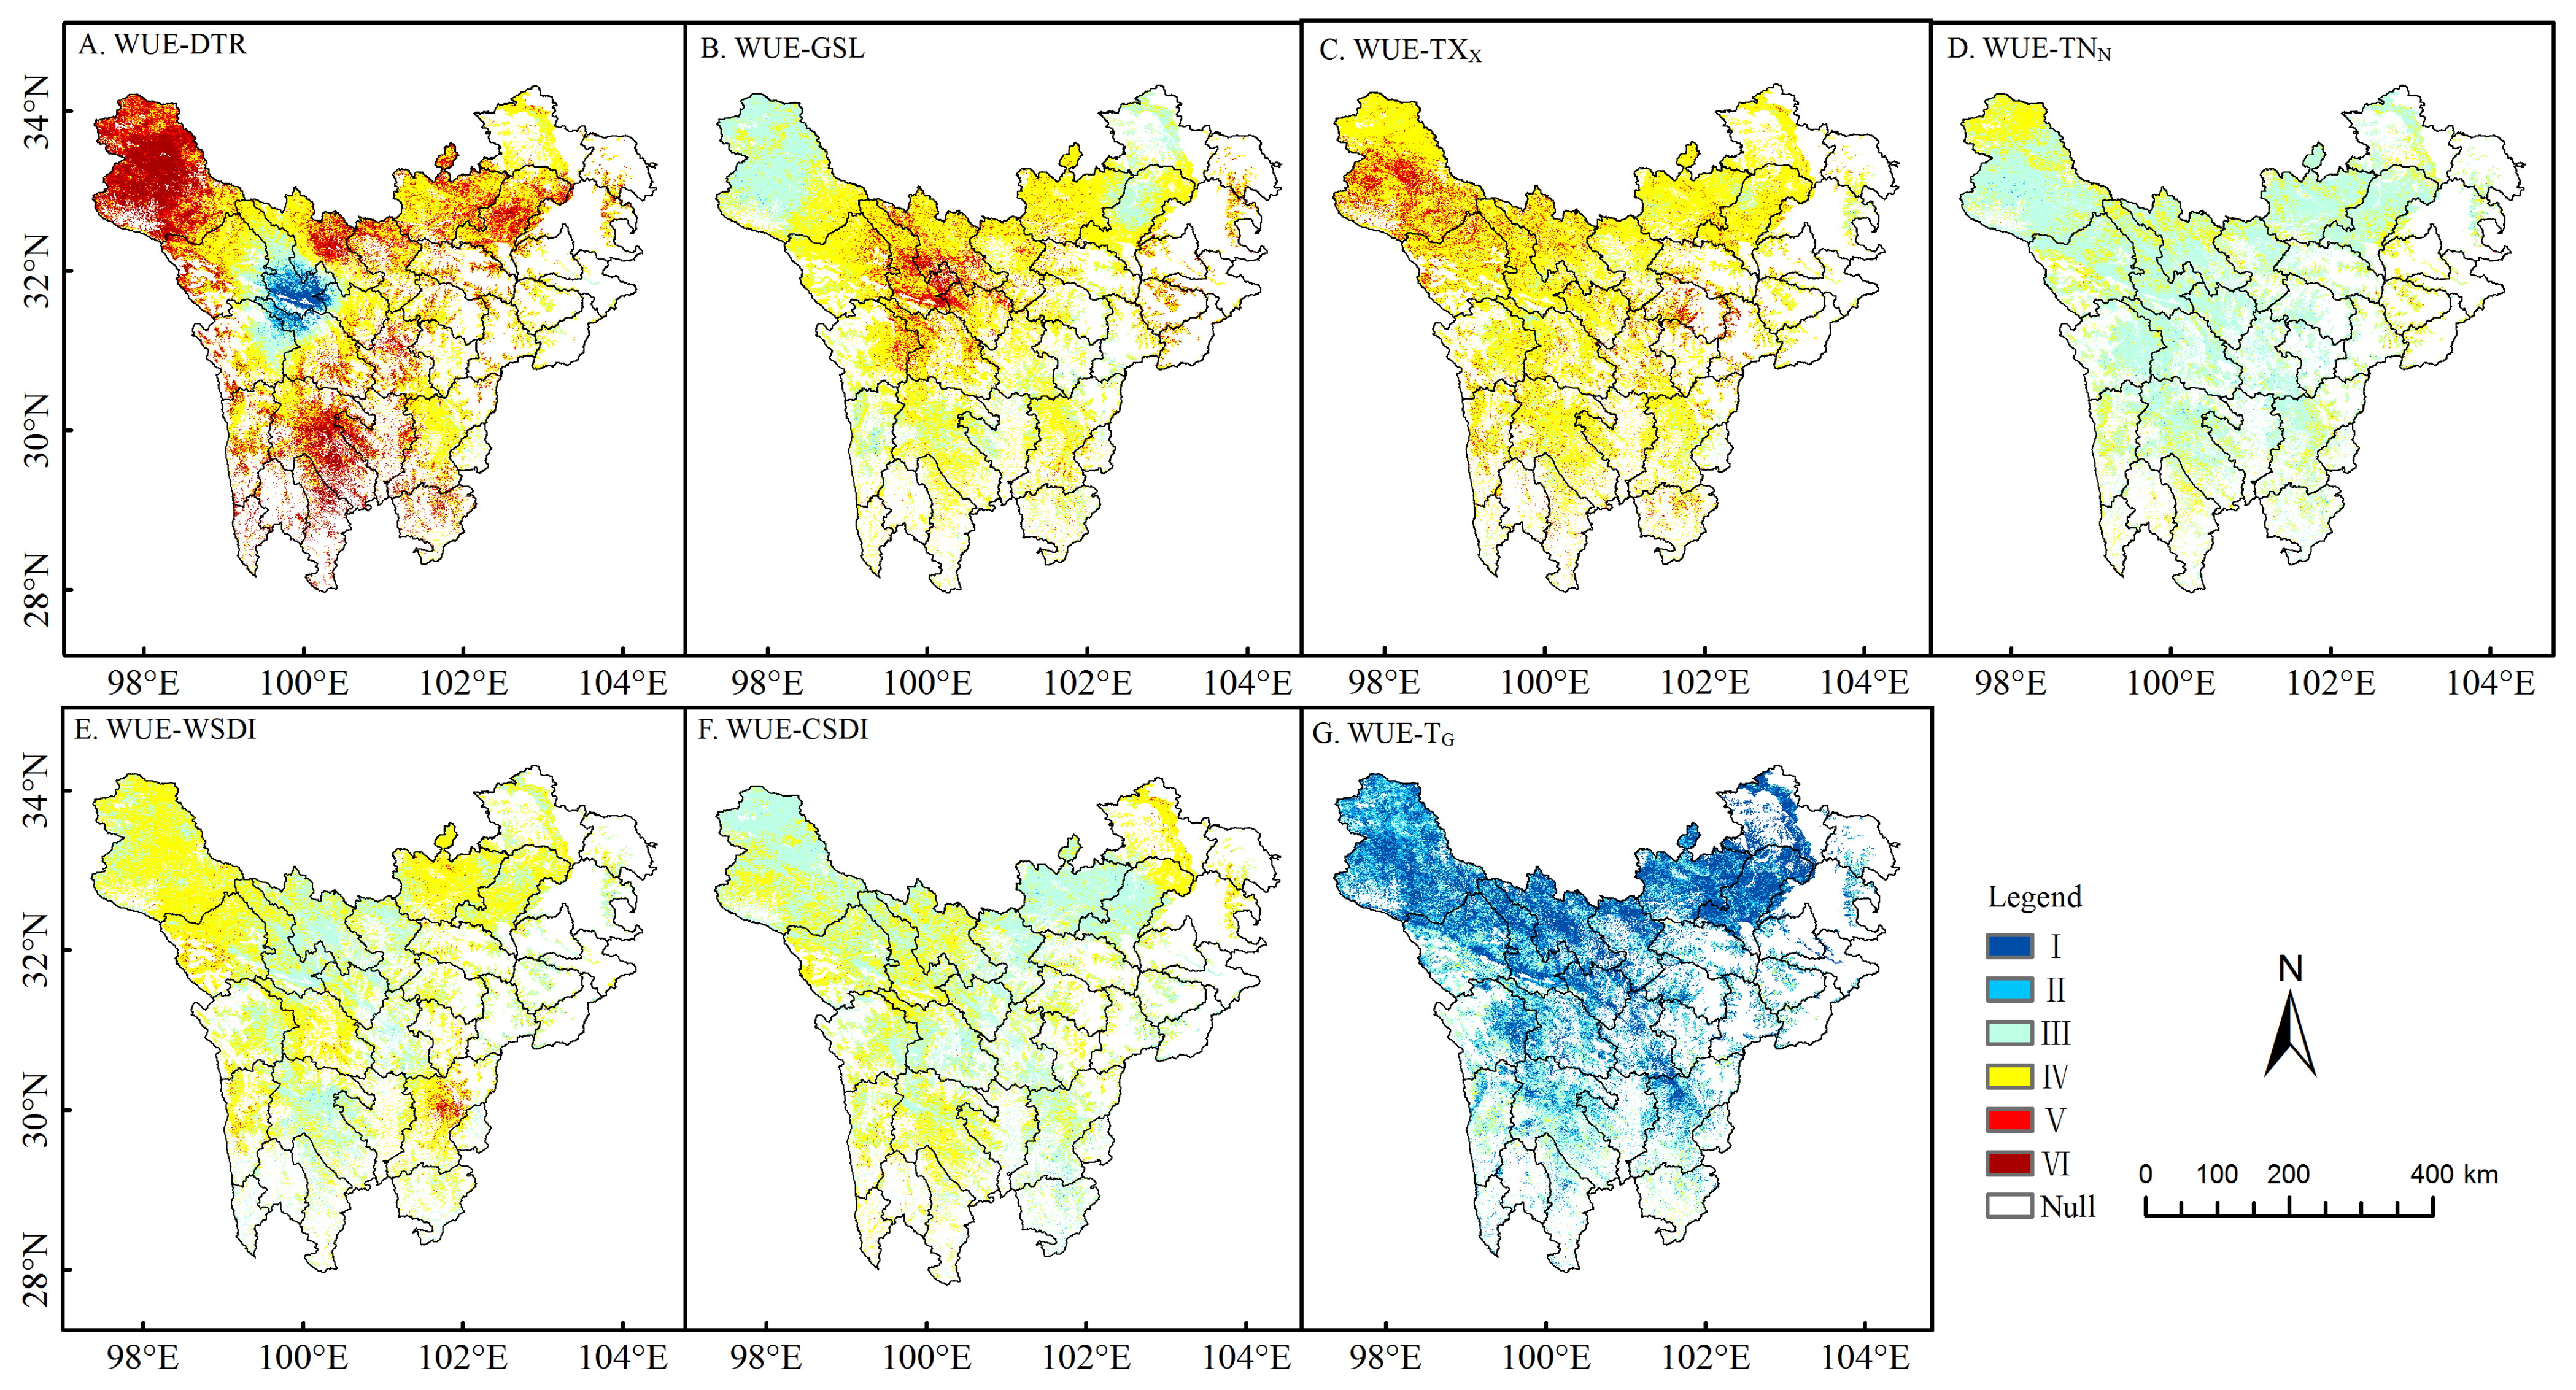
Figure 7 and Figure 8 depict the maps of the correlation between the WUE for the two vegetation types and various temperature indices. The significance level threshold was used to classify the areas into different levels. As shown in Figure 7, the WUE of forest land in most of the NSP significantly correlated with the temperature extremes of diurnal temperature range, growing season length, and maximum value of daily maximum temperature (TXX), accounting for 24.8%, 8.1%, and 7.7% of the NSP. The correlations of WUE for forest land with other extreme temperature indices were insignificant. However, the WUE of forest land negatively correlated with mean temperature, and the correlations were higher and more spatially uniform than those of the extreme temperature indices. The areas with high negative correlation were concentrated in the northeastern forest regions. As shown in Figure 8, the WUE for grassland positively correlated with diurnal temperature range, maximum value of daily maximum temperature, growing season length, and warm spell duration indicator (WSDI), but negatively correlated with TNN and cold spell duration indicator (CSDI). Among them, the correlation with the diurnal temperature range was the strongest, accounting for 36.6% of the areas with significant correlation, mainly distributed in the northwestern and southern NSP. The proportion of areas with a significant positive correlation between WUE and TXX is 10.7%, mainly located in the northwestern NSP. The WUE of grassland was mostly negatively correlated with mean temperature during the growing season, with the correlation for 46.8% of the area being significant, mainly distributed in the northern NSP.
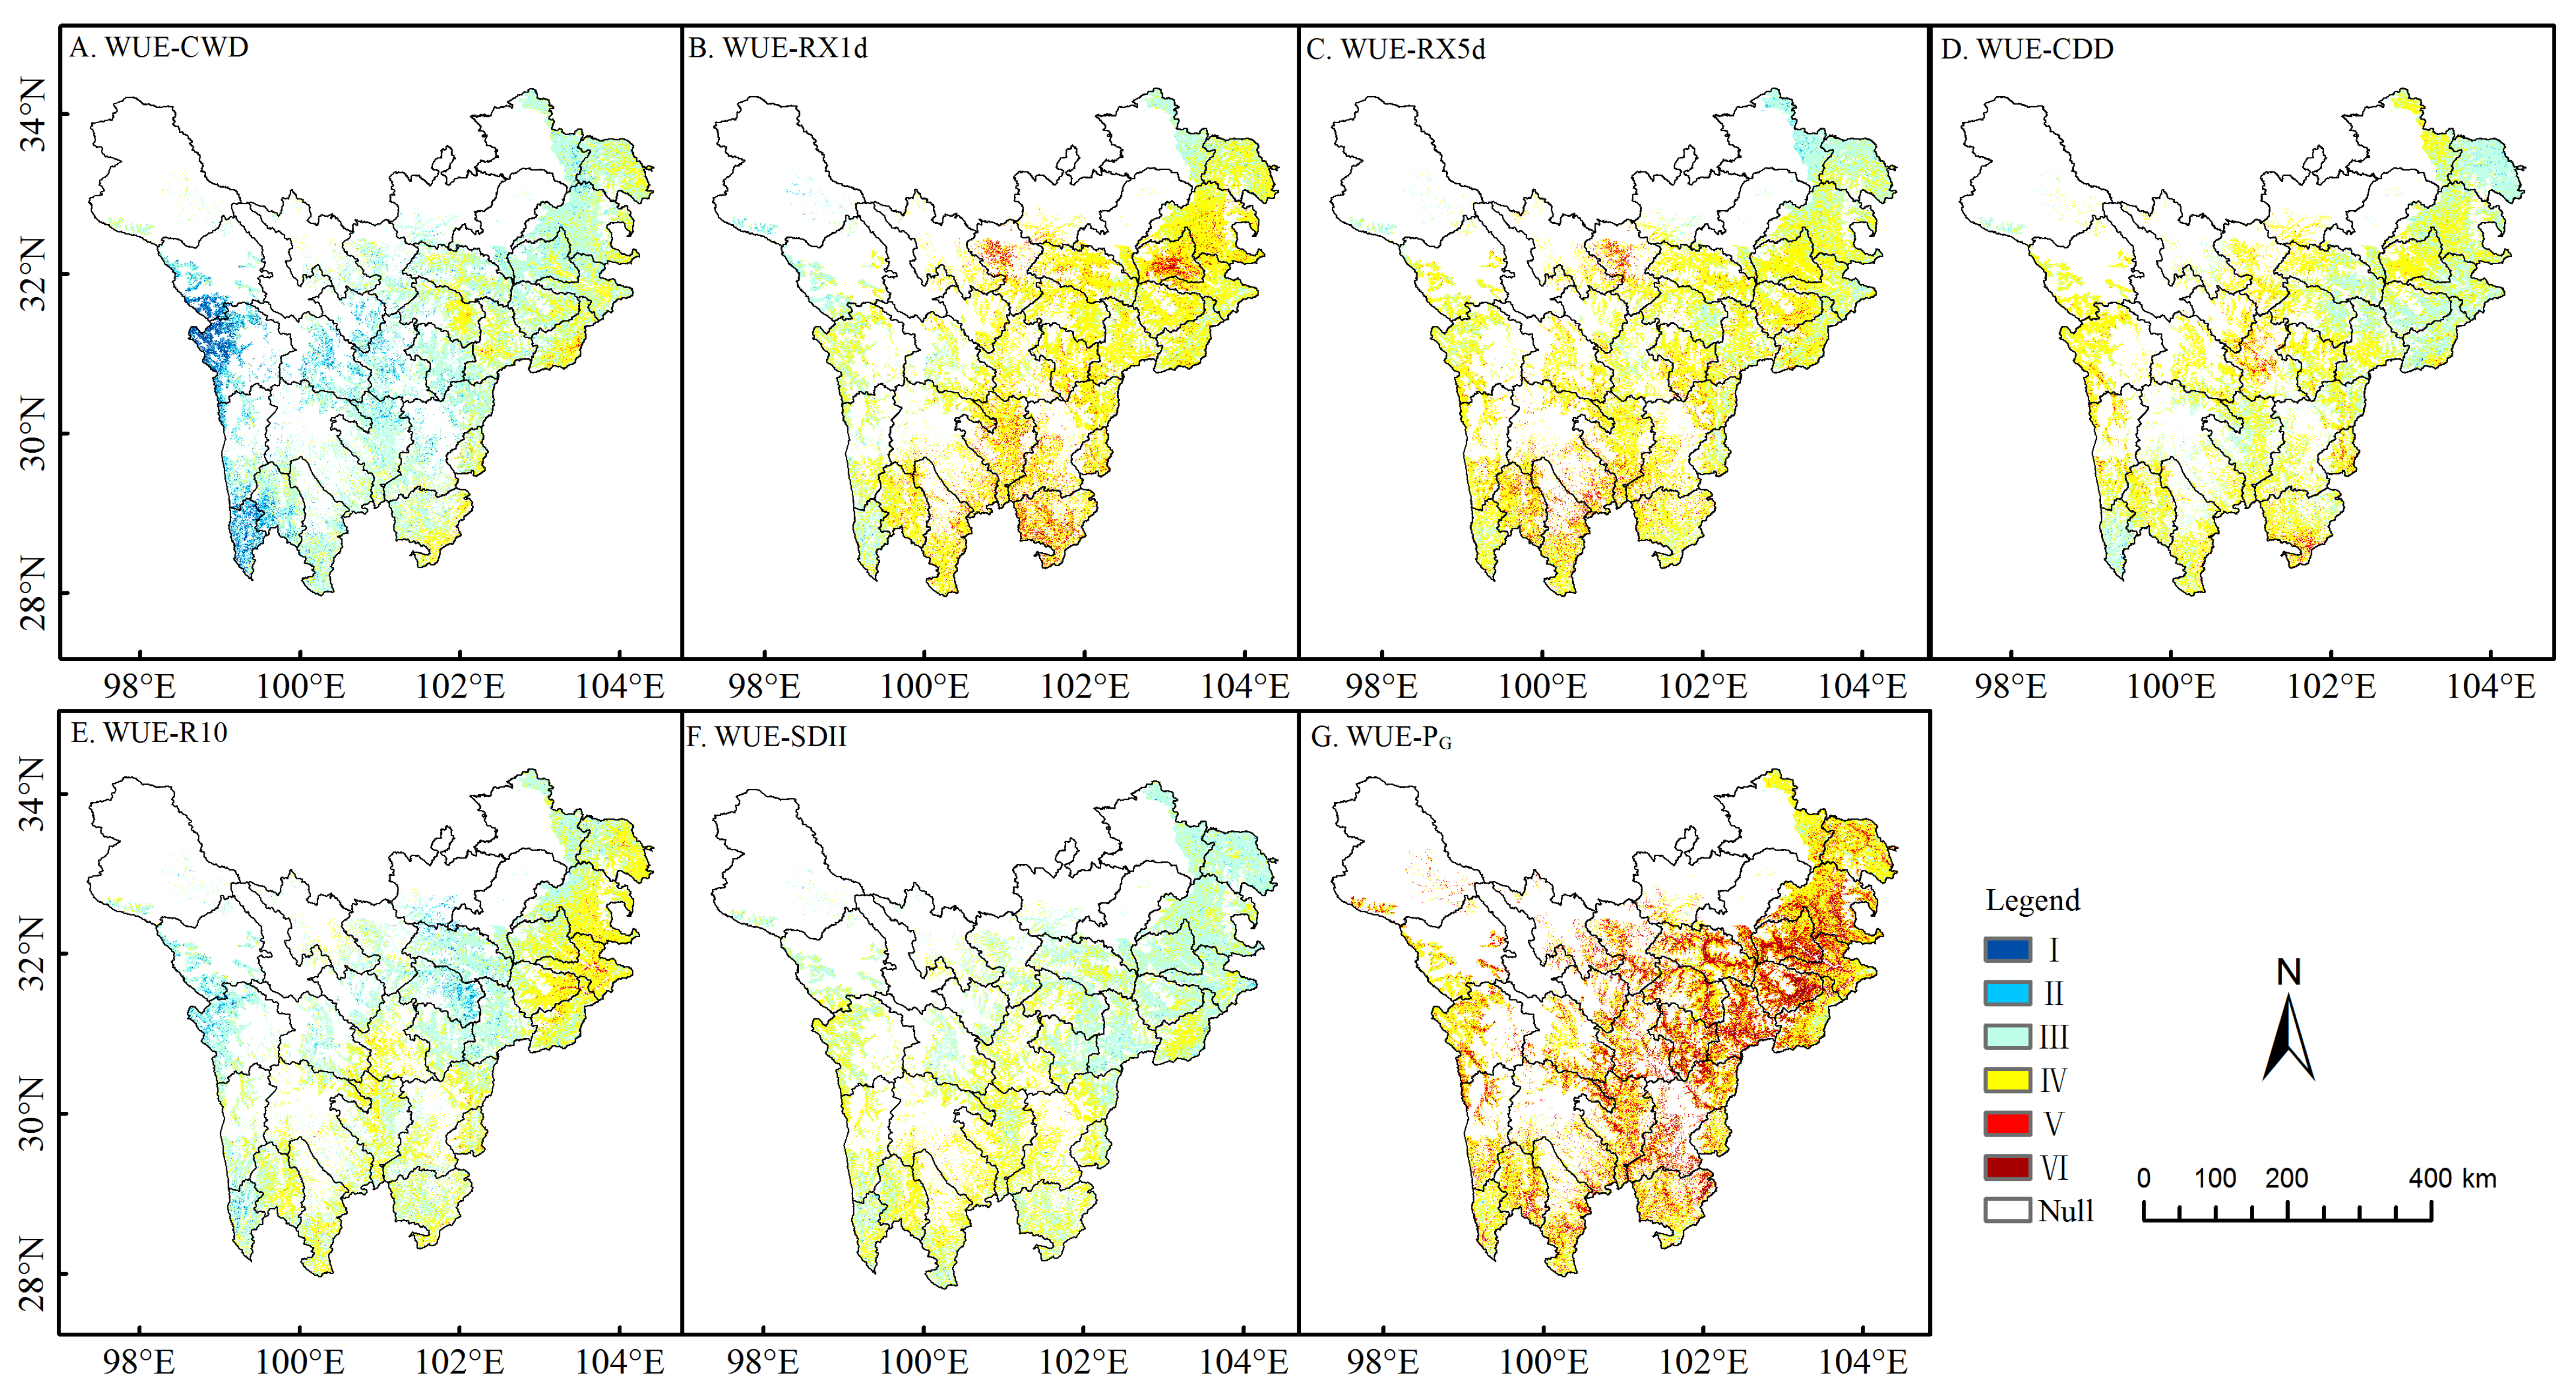
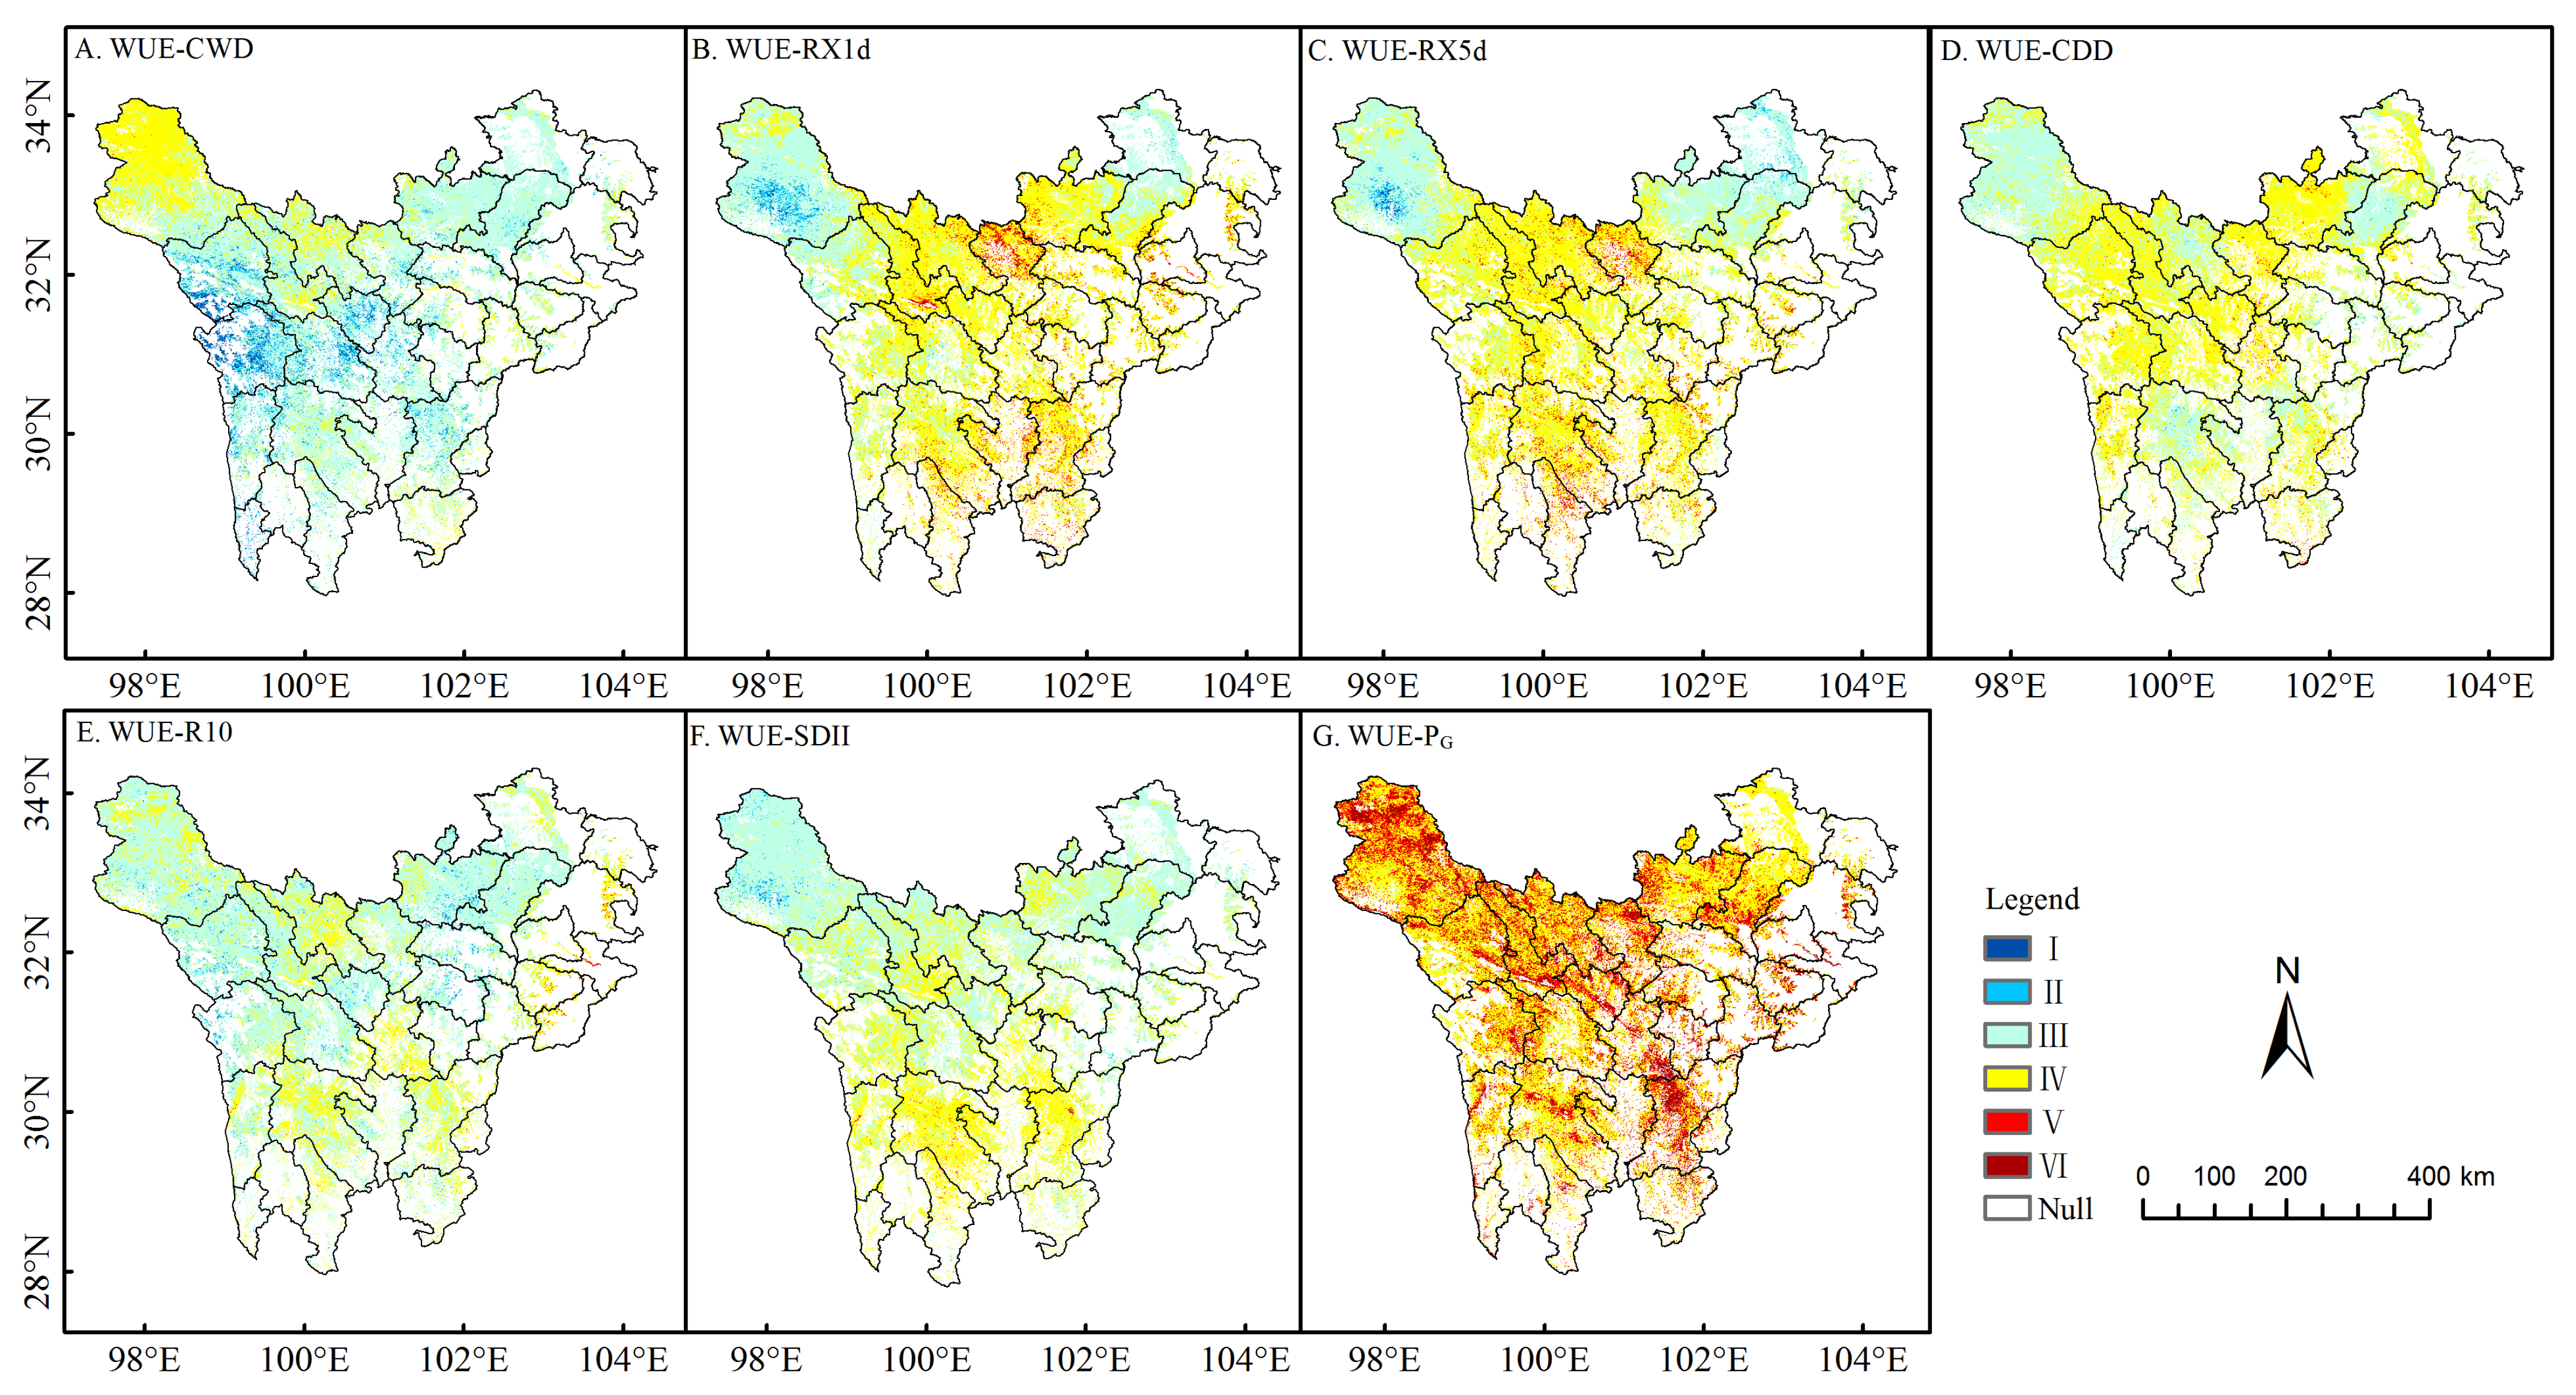
Unlike temperature indices, the correlations between the WUE of forest lands and extreme precipitation indices were generally weaker (Figure 9). The WUE of forest lands was significantly and negatively correlated with the consecutive wet index in the western edge forest areas of the NSP, but was significantly and positively correlated with maximum 1-day precipitation in the northeastern and southeastern NSP, with the maximum 5-day precipitation in the central northern and southern NSP. However, the mean precipitation index positively correlated with the WUE of forest lands, accounting for 93% of the forest areas. The areas with significant correlation are located in the central and eastern forest areas of the NSP. The WUE of the grasslands also showed higher correlation with the consecutive wet index, maximum 1-day precipitation, and maximum 5-day precipitation (Figure 10), but the proportions of areas with significant correlation did not exceed 10%. The significant negative correlation with the consecutive wet index is located in the central and western grassland areas, while the significant positive correlation with the maximum 1-day precipitation and maximum 5-day precipitation indices are distributed in the northern and southern NSP. The correlations of the WUE of grassland with the mean precipitation was stronger than those with the extreme precipitation indices. The areas with significant positive correlations are concentrated in the northern and southeastern NSP.
4. Discussion
4.1. Analysis of the Relationship between Different Types of Vegetation and Altitude
The WUE of most types of vegetation peaks at altitude of 800–1800 m. When the altitude exceeds 1800 m, the decline of WUE with increasing altitude may be related to the low-temperature conditions [28]. The low WUE is caused by high permeability and low transpiration in alpine meadows [29] at high altitude. However, the WUE of wetland shows greater fluctuation with increasing altitude, and peaks at 3100–3200 m (Figure 6e). This may be due to the differentiation in vegetation types in wetland communities in the NSP [30]. In addition, the adaptation of alpine wetlands to altitude differs from that of other vegetation types, as high altitude and low temperature are conducive to the growth of high-altitude wetland vegetation in the Tibetan Plateau [30]. In addition, the WUE of grassland is relatively stable at the altitude of 1600–2600 m (Figure 6c). The decline in WUE with increasing altitude is gradual, indicating that grassland has strong adaptability and resilience to altitude. This differs from the results of Zhou et al. [19], who found a relationship between the WUE of different types of vegetation and altitude in the mountains in southwestern China. This difference may be attributed to variations in the study region, time series, and data sources. Furthermore, forest is one of the two main types of vegetation in the NSP, and the WUE of forest is more sensitive to variations in altitude. A comparison of the changes in WUE with altitude among different types of vegetation also reveals that grassland has greater resilience to climate change than other types.
4.2. Analysis of WUE Response to Extreme Temperature and Precipitation
The response of WUE to climatic factors is dependent on the dominant processes driving plant photosynthesis and ecosystem water loss, which are the relative changes in GPP and ET [31]. Therefore, the correlation between WUE and temperature is mainly determined by the development of vegetation ecosystems [32]. Correlation analysis indicates that the WUE of most vegetation types in the NSP positively correlates with diurnal temperature range, maximum value of daily maximum temperature, and growing season length (Figure 7A–C and Figure 8A–C). This suggests that an increase in diurnal temperature range and extreme temperature promotes WUE. Ni et al. [33] also found a promoting effect of maximum value of daily and diurnal temperature range on vegetation growth in southwestern China. Diurnal temperature range has a regulating effect on plant photosynthetic parts [33], and an increase in the diurnal temperature range helps promote photosynthesis and increase plants’ net photosynthetic accumulation [34,35], thus enhancing WUE. Higher temperatures increase stomatal conductance in plant leaves, extending the growing season of vegetation at high altitudes and promoting WUE [36]. Although warmer climates usually benefit vegetation growth, in regions with relatively high temperatures, excessively high temperatures can cause plant respiration to exceed photosynthesis, hindering plant growth and development. Additionally, higher temperatures can lead to increased vegetation transpiration, with ET increasing at a faster rate than GPP, which is unfavourable for an increase in WUE. Therefore, the response of WUE to extreme temperature factors is partly dependent on the mean temperature. The impact of transient low temperatures on plants is mainly reflected in light inhibition [37], reduced enzyme activity, enzyme reaction limitation [38], and stomatal conductance [39,40], among other factors.
Water is not the primary limiting factor for vegetation growth in the NSP [25]. Zhang et al. [41] also found an insignificant correlation between WUE and precipitation in mountainous southwestern China. Of note is that wetland is an exception, whose WUE is sensitive to precipitation, especially extreme precipitation indices, based on the results of geographical detectors. The WUE is positively correlated with RX1d and RX5d in the northern and southern NSP (Figure 9B,C and Figure 10B,C), where there are favourable warm conditions and short-term heavy rainfall that benefits vegetation growth. This is similar to the findings of Ni et al. [33], who discussed the response of vegetation in southwestern China to daily heavy rainfall. The WUE showed a weak positive correlation with the consecutive dry index (Figure 9E and Figure 10E) as increases in the consecutive dry index leads to higher temperatures, which favours the extension of the plant’s senescence period [42], thereby increasing WUE. As shown in Figure 9 and Figure 10, in some high-altitude areas, an increase in the consecutive wet index is favourable for a decrease in WUE. One possible reason is that temperatures in these areas are low and vegetation water demand is limited, so an increase in precipitation does not have a significant impact on vegetation growth and instead accelerates surface evapotranspiration [32]. In the dry and hot valleys of the southwestern NSP, increases in the consecutive wet index and the number of medium precipitation days is unfavourable for an increase in WUE. In these areas, the temperature causes the rapid evaporation of precipitation, and an increase in precipitation intensity and duration would reduce the photosynthetically active radiation available for carbon absorption by vegetation [43], decreasing photosynthetic rates and GPP while increasing ET, leading to a decrease in WUE. Additionally, in eastern areas with steep terrain and sparse surface cover, an increase in the simple daily intensity index for precipitation is unfavourable for increasing WUE because, in these areas, the ability of soil to retain rainfall is weak, making it difficult to convert extreme heavy rainfall into usable water for vegetation [44], thus limiting the increase in WUE.
The same vegetation type in different areas shows significant differences in the response of WUE to extreme climate variables. The forest lands in the northeastern NSP are more affected by extreme temperature factors, while the forest lands in western and central-southern areas are more sensitive to extreme precipitation indices. The grasslands in the central and western NSP are relatively more influenced by extreme temperature indices, while the grasslands in the north and south are more sensitive to extreme precipitation indices. Excessive moisture is not conducive to improvements in the WUE of grasslands, but short-term heavy precipitation has a promoting effect.
4.3. Analysis of Uncertainty Factors
In this study, MOD17 (GPP) and MOD16 (ET) products were used to estimate WUE. Although these data sources are widely used, there are still uncertainties in the model calculations and parameter settings, and the accuracy of the estimation results needs to be improved.
The algorithm used for the MOD16 data product collection is based on the logic of the Penman–Monteith equation, which includes inputs of daily meteorological reanalysis data along with MODIS remotely sensed data products such as vegetation property dynamics, albedo, and land cover. The uncertainty of the reanalysis data and remotely sensed data causes uncertainty in the calculation of ET. In addition, the Penman–Monteith equation involves some empirical relationships based on observations outside of the study areas. All of these factors can cause uncertainty in ET [45]. This paper uses the R/S analysis method to estimate the Hurst index. Although the estimation results of this method are more reliable than other methods, there are still uncertainties, such as the length of the data sequence, data periodicity, and trend [46].
Moreover, because of the complex terrain and diverse vegetation types, the WUE in the NSP is influenced not only by temperature, precipitation, and topography, but also by other factors, such as CO2 concentration, solar radiation, and leaf area index [47,48]. This study only conducted correlation analysis on the impact of individual factors and did not involve mechanism analysis. Further in-depth discussions on these aspects are needed in future studies. Additionally, the synergistic effects of multiple factors on WUE are also a challenging issue that requires further research.
In view of the uncertainty of MOD16 products, the empirical relationship in the Penman–Monteith equation can be replaced according to observation in the study area in the future to improve the estimation accuracy of ET. In addition, high-resolution satellite data and surface energy balance models can also be considered to improve the estimation accuracy of ET.
As an important indicator of the carbon and water cycles of vegetation ecosystems and a monitoring index for measuring the growth of vegetation, the characteristics of WUE and its response to climate change revealed in this study will help to deeply understand the changes in ecosystems, clarify the response mechanism of ecosystem carbon-water cycles to global climate change, and simulate and predict the development of ecosystem carbon and water processes. All of these results provide information for a better management of water resources and ecosystems in the NSP against the background of global warming.
5. Conclusions
- (1)
- The seasonal cycle of WUE in the NSP exhibits a unimodal fluctuation, with higher values from May to September. The mean WUE from 2001 to 2021 was 0.77 g·m−2·mm−1, showing an insignificant upward trend. The spatial pattern of WUE exhibits lower values in the northwest and higher values in the east, demonstrating a stable and positive upward trend.
- (2)
- From 2001 to 2021, the mean value of WUE for different vegetation types in the NSP showed the following order: forest land > cropland > shrubland > wetland > grassland. The seasonal cycle of WUE for all vegetation types showed a unimodal curve, with peak values occurring in July and August. The WUE of cropland and shrubland exhibited a significant increasing trend, while forest and grassland showed an insignificant increase, and wetland demonstrated an insignificant decreasing trend.
- (3)
- The altitude range of 800 to 1800 m is the most suitable zone for vegetation physiological growth in the NSP, with generally high WUE. Beyond that, WUE decreases with increasing altitude. Compared to other vegetation types, grassland has stronger adaptability to altitude and thus adapts to climate change better.
- (4)
- Water is not the primary limiting factor for vegetation growth in the NSP, which receives abundant precipitation. Thus, WUE is more influenced by temperature. Compared to extreme climatic factors, mean climate factors have a more significant impact on WUE. Overall, an extended growing season and increased diurnal temperature range are beneficial for the increase in WUE, while frequent extreme cold events suppress WUE. Among the extreme climatic factors, DTR, GSL, and CWD exert stronger impacts on WUE than others for the entire NSP.
Author Contributions
Conceptualisation, B.G. and X.W.; methodology, B.G. and X.W.; software, Y.F.; validation, Y.F. and X.W.; formal analysis, B.G. and X.W.; investigation, Y.F. and Y.C.; resources, X.W.; data curation, Y.F. and X.W.; writing—original draft preparation, X.W.; writing—review and editing, B.G. and Y.C.; visualisation, Y.F.; project administration, B.G.; funding acquisition, B.G. and X.W. All authors have read and agreed to the published version of the manuscript.
Funding
This research was supported by the Key Research and Development Project of the Science & Technology Department of Sichuan Province, China, No. 2023YFS0441, and the Key Project of Science & Technology Development of Heavy Rain and Drought–Flood Disasters in Plateau and Basin Key Laboratory of Sichuan Province, China, No. SCKJZD2020001.
Institutional Review Board Statement
Not applicable.
Informed Consent Statement
Not applicable.
Data Availability Statement
The datasets generated during and/or analysed during the current study are available from the corresponding author on reasonable request.
Acknowledgments
The authors are grateful to all those who have provided assistance in this study.
Conflicts of Interest
The authors declare no conflict of interest.
References
- Sun, H.Y.; Wang, C.Y.; Niu, Z.; Bukhosor; Li, B. Analysis of the vegetation cover change and the relationship between NDVI and environmental factors by using NOAA time series data. J. Remote Sens. 1998, 2, 204–210. [Google Scholar]
- Gong, Z.N.; Zhao, S.; Gu, J.Z. Correlation Analysis between Vegetation Coverage and Climate Drought Conditions in North China during 2001–2013. J. Geogr. Sci. 2016, 27, 143–160. [Google Scholar] [CrossRef]
- Liu, X.F.; Feng, X.M.; Fu, B.J. Changes in Global Terrestrial Ecosystem Water Use Efficiency Are Closely Related to Soil Moisture. Sci. Total Environ. 2019, 698, 134–165. [Google Scholar] [CrossRef] [PubMed]
- Fischer, R.A.; Turner, N.C. Plant Productivity in the Arid and Semiarid Zones. Annu. Rev. Plant Physiol. 1978, 29, 277–317. [Google Scholar] [CrossRef]
- Tian, H.Q.; Chen, G.S.; Liu, M.L.; Zhang, C.; Sun, G.; Lu, C.Q.; Xu, X.F.; Ren, W.; Pan, S.F.; Chappelka, A. Model Estimates of Net Primary Productivity, Evapotranspiration, and Water Use Efficiency in the Terrestrial Ecosystems of the Southern United States during 1895–2007. For. Ecol. Manag. 2010, 259, 1311–1327. [Google Scholar]
- Mi, Z.R.; Chen, L.T.; Zhang, Z.H.; He, J.S. Alpine grassland water use efficiency based on annual precipitation, growing season precipitation and growing season evapotranspiration. Chin. J. Plant Ecol. 2015, 39, 649–660. [Google Scholar] [CrossRef]
- Gao, Y.; Zhu, X.J.; Yu, G.R.; He, N.P.; Wang, Q.F.; Tian, J. Water Use Efficiency Threshold for Terrestrial Ecosystem Carbon Sequestration in China under Afforestation. Agric. For. Meteorol. 2014, 195–196, 32–37. [Google Scholar] [CrossRef]
- Yu, G.R.; Song, X.; Wang, Q.F.; Liu, Y.F.; Guan, D.X.; Yan, J.H.; Sun, X.M.; Zhang, L.M.; Wen, X.F. Water-Use Efficiency of Forest Ecosystems in Eastern China and Its Relations to Climatic Variables. New Phytol. 2008, 177, 927–937. [Google Scholar] [CrossRef]
- de Oliveira, G.; Brunsell, N.A.; Moraes, E.C.; Shimabukuro, Y.E.; Bertani, G.; dos Santos, T.V.; Aragao, L.E.O.C. Evaluation of MODIS-Based Estimates of Water-Use Efficiency in Amazonia. Int. J. Remote Sens. 2017, 38, 5291–5309. [Google Scholar] [CrossRef]
- Hu, Z.M.; Yu, G.R.; Wang, Q.F.; Zhao, F.H. Ecosystem level water use efficiency: A review. Acta Ecol. Sin. 2009, 29, 1498–1507. [Google Scholar] [CrossRef]
- Gang, C.C.; Wang, Z.Q.; Chen, Y.Z.; Yang, Y.; Li, J.; Cheng, J.M.; Qi, J.G.; Odeh, I. Drought-Induced Dynamics of Carbon and Water Use Efficiency of Global Grasslands from 2000 to 2011. Ecol. Indic. 2016, 67, 788–797. [Google Scholar] [CrossRef]
- Ponce Campos, G.E.; Moran, M.S.; Huete, A.; Zhang, Y.; Bresloff, C.; Huxman, T.E.; Eamus, D.; Bosch, D.D.; Buda, A.R.; Gunter, S.A. Ecosystem Resilience despite Large-Scale Altered Hydroclimatic Conditions. Nature 2013, 494, 349–352. [Google Scholar] [CrossRef] [PubMed]
- Xue, B.L.; Guo, Q.H.; Otto, A.; Xiao, J.F.; Tao, S.L.; Li, L. Global patterns, trends, and drivers of water use efficiency from 2000 to 2013. Ecosphere 2015, 6, 174. [Google Scholar] [CrossRef]
- Huang, M.T.; Piao, S.L.; Sun, Y.; Ciais, P.; Cheng, L.; Mao, J.F.; Poulter, B.; Shi, X.Y.; Zeng, Z.Z.; Wang, Y.P. Change in Terrestrial Ecosystem Water-Use Efficiency over the Last Three Decades. Glob. Change Biol. 2015, 21, 2366–2378. [Google Scholar] [CrossRef] [PubMed]
- Zhang, Z.; Jiang, H.; Liu, J.X.; Zhou, G.M.; Zhang, X.Y. Assessment on Water Use Efficiency under Climate Change and Heterogeneous Carbon Dioxide in China Terrestrial Ecosystems. Procedia Environ. Sci. 2012, 13, 2031–2044. [Google Scholar] [CrossRef] [Green Version]
- Tang, X.G.; Li, H.P.; Desai, A.R.; Nagy, Z.; Luo, J.H.; Kolb, T.E.; Olioso, A.; Xu, X.B.; Yao, L.; Kutsch, W.; et al. How Is Water-Use Efficiency of Terrestrial Ecosystems Distributed and Changing on Earth? Sci. Rep. 2014, 4, 7483. [Google Scholar] [CrossRef] [Green Version]
- Xiao, J.F.; Sun, G.; Chen, J.Q.; Chen, H.; Chen, S.P.; Dong, G.; Gao, S.H.; Guo, H.Q.; Guo, J.X.; Han, S.J. Carbon Fluxes, Evapotranspiration, and Water Use Efficiency of Terrestrial Ecosystems in China. Agric. For. Meteorol. 2013, 182–183, 76–90. [Google Scholar] [CrossRef]
- Mu, Q.Z.; Zhao, M.S.; Running, S.W. Evolution of Hydrological and Carbon Cycles under a Changing Climate. Part III: Global Change Impacts on Landscape Scale Evapotranspiration. Hydrol. Process. 2011, 25, 4093–4102. [Google Scholar] [CrossRef]
- Zhou, X.; Sun, P.S.; Zhang, M.F.; Liu, S.R. Spatio-temporal characteristics of vegetation water use efficiency and their relationships with climatic factors in alpine and subalpine area of southwestern China. Chin. J. Plant Ecol. 2020, 44, 628–641. [Google Scholar] [CrossRef]
- Zhang, Y.Y.; Shui, W.; Sun, X.R.; Sun, X. Spatiotemporal variation and influencing factors of vegetation water use efficiency in Yunnan Province. Acta Ecol. Sin. 2022, 42, 2405–2417. [Google Scholar] [CrossRef]
- Zheng, Z.J.; Zeng, Y.; Zhao, Y.J.; Gao, W.W.; Zhao, D.; Wu, B.F. Analysis of land cover changes in southwestern China since the 1990s. Acta Ecol. Sin. 2016, 36, 7858–7869. [Google Scholar] [CrossRef] [Green Version]
- Rao, E.M.; Xiao, Y. Spatial characteristics and effects of soil conservation service in Sichuan Province. Acta Ecol. Sin. 2018, 38, 8741–8749. [Google Scholar] [CrossRef]
- Cui, X.L.; He, Y.L.; Li, Z.S. Spatial-temporal variation of vegetation water use efficiency and its relationship with climate factors over the Qinghai-Tibet Plateau, China. Chin. J. Appl. Ecol. 2022, 33, 1525–1532. [Google Scholar] [CrossRef]
- Easterling, D.R.; Meehl, G.A.; Parmesan, C.; Changnon, S.A.; Karl, T.R.; Mearns, L.O. Climate Extremes: Observations, Modeling, and Impacts. Science 2019, 289, 2068–2074. [Google Scholar] [CrossRef] [PubMed] [Green Version]
- Wang, X.; Wang, M.T.; Feng, Y.; Zou, Y.J.; Guo, B. Variation characteristics of normalized difference vegetation index in Northwestern Sichuan Plateau and its response to extreme climate during 2001–2020. Chin. J. Appl. Ecol. 2022, 33, 1957–1965. [Google Scholar] [CrossRef]
- Wang, G.G.; Zhou, K.F.; Sun, L.; Qin, Y.F.; Li, X.F. Study on the Vegetation Dynamic Change and R/S Analysis in the Past Ten Years in Xinjiang. Remote Sens. Technol. Appl. 2011, 25, 84–90. [Google Scholar] [CrossRef]
- Chen, Y. Mathematical methods for geography: Foundations and applications. In Mathematical Methods for Geography: Foundations and Applications; Sciencepress: Beijing, China, 2011; pp. 40–43. [Google Scholar]
- Hu, Z.M.; Yan, G.R.; Fan, J.W.; Zhong, H.P.; Wang, S.Q.; Li, S.G. Precipitation-Use Efficiency along a 4500-Km Grassland Transect. Glob. Ecol. Biogeogr. 2010, 19, 842–851. [Google Scholar] [CrossRef]
- Cui, J.; An, S.Q.; Wang, Z.S.; Fang, C.M.; Liu, Y.L.; Yang, H.B.; Xu, Z.; Liu, S.R. Using Deuterium Excess to Determine the Sources of High-Altitude Precipitation: Implications in Hydrological Relations between Sub-Alpine Forests and Alpine Meadows. J. Hydrol. 2009, 373, 24–33. [Google Scholar] [CrossRef]
- Tang, M.K.; Mao, Y.J.; Liu, K.Y.; Huang, W.J.; Wang, J.P.; Liu, Y.; Sun, Z.Y. A Preliminary Survey on Flora and Phytocoenosium of Wetland in the Northwest Plateau of Sichuan Province. J. Sichuan For. Sci. Technol. 2018, 39, 71–78. [Google Scholar] [CrossRef]
- Zheng, H.; Lin, H.; Zhou, W.; Bao, H.; Zhu, X.; Jin, Z.; Song, Y.; Wang, Y.; Liu, W.; Tang, Y. Revegetation Has Increased Ecosystem Water-Use Efficiency during 2000–2014 in the Chinese Loess Plateau: Evidence from Satellite Data. Ecol. Indic. 2019, 102, 507–518. [Google Scholar] [CrossRef]
- Peng, D.W.; Zhou, Q.W.; Wei, X.C.; Li, H.G.; Tang, X.; Yan, W.H. Change of water use efficiency and its response to meteorological factors in karst area of Southwest China. Acta Ecol. Sin. 2021, 41, 9470–9480. [Google Scholar] [CrossRef]
- Ni, M.; Zhang, X.-Y.; Jiang, C.; Wang, H.-S. Responses of vegetation to extreme climate events in southwestern China. Chin. J. Plant Ecol. 2021, 45, 626–640. [Google Scholar] [CrossRef]
- Jiang, A.L.; Chen, S.B.; Gong, S.X. Characteristics of diurnal temperature range in Xishuangbanna and its significance in Agriculture. Chin. J. Agrometeorol. 1990, 11, 44–46+15. [Google Scholar]
- Zheng, W.J.; Guo, Z.X.; Wang, Z.; He, S.L. Effects of day-night temperature difference on the growth of Oncidium Plantlets in vitro. J. Northwest For. Univ. 2011, 26, 137–141. [Google Scholar]
- Sun, Y.; Piao, S.L.; Huang, M.T.; Ciais, P.; Zeng, Z.Z.; Cheng, L.; Li, X.R.; Zhang, X.P.; Mao, J.F.; Peng, S.S.; et al. Global Patterns and Climate Drivers of Water-use Efficiency in Terrestrial Ecosystems Deduced from Satellite-based Datasets and Carbon Cycle Models. Glob. Ecol. Biogeogr. 2016, 25, 311–323. [Google Scholar] [CrossRef] [Green Version]
- Takahashi, S.; Murata, N. How Do Environmental Stresses Accelerate Photoinhibition? Trends Plant Sci. 2008, 13, 178–182. [Google Scholar] [CrossRef]
- Aroca, R.; Irigoyen, J.J.; Sanchez-Diaz, M. Photosynthetic Characteristics and Protective Mechanisms against Oxidative Stress during Chilling and Subsequent Recovery in Two Maize Varieties Differing in Chilling Sensitivity. Plant Sci. 2001, 161, 719–726. [Google Scholar] [CrossRef]
- Farquhar, G.D.; Sharkey, T.D. Stomatal Conductance and Photosynthesis. Annu. Rev. Plant Physiol. 1982, 33, 317–345. [Google Scholar] [CrossRef]
- Medlyn, B.E.; Dreyer, E.; Ellsworth, D.; Forstreuter, M.; Harley, P.C.; Kirschbaum MU, F.; Le Roux, X.; Montpied, P.; Strassemeyer, J.; Walcroft, A.; et al. Temperature Response of Parameters of a Biochemically Based Model of Photosynthesis. II. A Review of Experimental Data. Plant Cell Environ. 2002, 25, 1167–1179. [Google Scholar] [CrossRef] [Green Version]
- Zhang, Y.D.; Pang, R.; Gu, X.F.; Liu, S.R. Temporal-spatial variations of WUE and its response to climate change in alpine area of southwestern China. Acta Ecol. Sin. 2016, 36, 1515–1525. [Google Scholar] [CrossRef]
- Yuan, M.X.; Zhao, L.; Li, X.X.; Lin, A.W. Divers responses of end of growing season to extreme climate events in different grasslands in temperate China during 1981–2015. Acta Ecol. Sin. 2023, 43, 1–18. [Google Scholar]
- Heitman, J.L.; Horton, R.; Sauer, T.J.; Desutter, T.M. Sensible Heat Observations Reveal Soil-Water Evaporation Dynamics. J. Hydrometeorol. 2008, 9, 165–171. [Google Scholar] [CrossRef] [Green Version]
- Feng, L.; Yang, D.; Huang, Y.Y. Vegetation NDVI Characteristics and Response to Extreme Climate in Sichuan and Chongqing from 2000 to 2017. Chin. J. Ecol. 2020, 39, 2316–2326. [Google Scholar] [CrossRef]
- Kim, H.W.; Hwang, K.; Mu, Q.Z.; Lee, S.O.; Choi, M. Validation of MODIS 16 Global Terrestrial Evapotranspiration Products in Various Climates and Land Cover Types in Asia. KSCE J. Civ. Eng. 2012, 16, 229–238. [Google Scholar] [CrossRef]
- Jiang, T.H.; Deng, L.T. Some problems in estimating a Hurst exponent-A case study of applicatings to climatic change. Sci. Geogr. Sin. 2004, 24, 177–182. [Google Scholar] [CrossRef]
- Du, X.Z.; Zhao, X.; Wang, H.Y.; He, B. Responses of terrestrial ecosystem water use efficiency to climate change: A review. Acta Ecol. Sin. 2018, 38, 8296–8305. [Google Scholar]
- Chang, X.G.; Wang, Z.H.; Xiao, P.Q.; Wei, F.Y.; Zhang, P.; Ma, L. Spatial variation patterns of dynamics of water use efficiency of ecosystem and its drivers on the Chinese Loess Plateau. Res. Soil Water Conserv. 2022, 29, 244–252. [Google Scholar] [CrossRef]
Figure 1.
Altitude (a) and land use type (b) of the study area.

Figure 2.
Inter-annual (a) and monthly (b) variation of gross primary productivity (GPP), evapotranspiration (ET) and water use efficiency (WUE) in northwestern Sichuan Plateau.
Figure 2.
Inter-annual (a) and monthly (b) variation of gross primary productivity (GPP), evapotranspiration (ET) and water use efficiency (WUE) in northwestern Sichuan Plateau.

Figure 3.
Spatial distribution of water use efficiency in northwestern Sichuan Plateau from 2001 to 2021.
Figure 3.
Spatial distribution of water use efficiency in northwestern Sichuan Plateau from 2001 to 2021.

Figure 4.
Spatial distribution of linear trend (a) and Hurst index (b) of vegetation water use efficiency in northwestern Sichuan Plateau.
Figure 4.
Spatial distribution of linear trend (a) and Hurst index (b) of vegetation water use efficiency in northwestern Sichuan Plateau.

Figure 5.
Inter-annual (a) and monthly (b) variation of water use efficiency over different vegetation types.
Figure 5.
Inter-annual (a) and monthly (b) variation of water use efficiency over different vegetation types.

Figure 6.
Relationships between water use efficiency of different vegetation types and altitude in Northwestern Sichuan Plateau ((a) Cropland, (b) Forest land, (c) Grassland, (d) Shrubland, (e) Wetland).
Figure 6.
Relationships between water use efficiency of different vegetation types and altitude in Northwestern Sichuan Plateau ((a) Cropland, (b) Forest land, (c) Grassland, (d) Shrubland, (e) Wetland).


Figure 7.
Spatial distribution of correlation coefficients between water use efficiency and temperature indices in forest land of Northwestern Sichuan Plateau ((A) DTR, (B) GSL, (C) TXX, (D) TNN, (E) WSDI, (F) CSDI, (G) TG). I: r ≤ −0.537, p < 0.01; II: −0.537 < r ≤ −0.423, p < 0.05; III: −0.423 < r ≤ 0; IV: 0 < r ≤ 0.423; V: 0.423 < r ≤ 0.537, p < 0.05; VI: r > 0.537, p < 0.01. The same below.

Figure 8.
Spatial distribution of correlation coefficients between water use efficiency and temperature indices in grassland of Northwestern Sichuan Plateau ((A) DTR, (B) GSL, (C) TXX, (D) TNN, (E) WSDI, (F) CSDI, (G) TG).
Figure 8.
Spatial distribution of correlation coefficients between water use efficiency and temperature indices in grassland of Northwestern Sichuan Plateau ((A) DTR, (B) GSL, (C) TXX, (D) TNN, (E) WSDI, (F) CSDI, (G) TG).

Figure 9.
Spatial distribution of correlation coefficients between water use efficiency and precipitation indices in forest land of Northwestern Sichuan Plateau ((A) CWD, (B) RX1d, (C) RX5d, (D) CDD, (E) R10, (F) SDII, (G) PG).
Figure 9.
Spatial distribution of correlation coefficients between water use efficiency and precipitation indices in forest land of Northwestern Sichuan Plateau ((A) CWD, (B) RX1d, (C) RX5d, (D) CDD, (E) R10, (F) SDII, (G) PG).

Figure 10.
Spatial distribution of correlation coefficients between water use efficiency and precipitation indices in grassland of Northwestern Sichuan Plateau ((A) CWD, (B) RX1d, (C) RX5d, (D) CDD, (E) R10, (F) SDII, (G) PG).
Figure 10.
Spatial distribution of correlation coefficients between water use efficiency and precipitation indices in grassland of Northwestern Sichuan Plateau ((A) CWD, (B) RX1d, (C) RX5d, (D) CDD, (E) R10, (F) SDII, (G) PG).


Table 1.
Selection of and definitions on climate variables.
| Climate Variables | Abbreviation (Units) | Definition |
|---|---|---|
| Mean temperature of growing season | TG (°C) | Mean air temperature from April to September |
| Maximum value of daily maximum air temperature | TXX (°C) | Yearly maximum value of daily maximum air temperature |
| Minimum value of daily minimum air temperature | TNN (°C) | Yearly minimum value of daily maximum air temperature |
| Growing season length | GSL (d) | Annual count between first span of at least 6 days with daily mean air temperature > 5 °C and first span after June 1st of 6 days with daily mean air temperature < 5 °C |
| Dirunal temperature range | DTR (°C) | Yearly mean difference between daily maximum air temperature and daily minimum air temperature |
| Warm spell duration indicator | WSDI (d) | Annual count of days with at least 6 consecutive days when daily maximum air temperature > 90th percentile |
| Cold spell duration indicator | CSDI (d) | Annual count of days with at least 6 consecutive days when daily minimum air temperature < 10th percentile |
| Growing season precipitation | PG (mm) | Total precipitation on all precipitation days from April to September |
| Simple daily intensity index for precipitation | SDII (mm·d−1) | Annual total precipitation divided by the number of wet days (defined as daily precipitation ≥ 1.0 mm) in the year |
| Maximum 1-day precipitation | RX1d (mm) | Yearly maximum value of daily precipitation |
| Maximum 5-day precipitation | RX5d (mm) | Yearly maximum 5-day consecutive precipitation |
| Number of medium precipitation days | R10 (d) | Annual count of days when daily precipitation ≥ 10 mm |
| Consecutive wet index | CWD (d) | Yearly maximum number of consecutive days with a daily precipitation ≥ 1 mm |
| Consecutive dry index | CDD (d) | Yearly maximum number of consecutive days with daily precipitation < 1 mm |
Table 2.
Correlations between regional average normalised differential vegetation water use efficiency and climate variables in Northwestern Sichuan Plateau.
Table 2.
Correlations between regional average normalised differential vegetation water use efficiency and climate variables in Northwestern Sichuan Plateau.
| Climate Variables | Vegetation WUE of Different Underlying Surface Types | ||||
|---|---|---|---|---|---|
| Forest Land | Grassland | Wetland | Shrubland | Cropland | |
| TG (°C) | 0.313 | 0.132 | 0.154 | 0.109 | 0.378 |
| TXX (°C) | 0.169 | 0.053 | 0.013 | 0.090 | 0.156 |
| TNN (°C) | 0.284 | 0.124 | 0.195 | 0.123 | 0.303 |
| GSL (d) | 0.272 | 0.119 | 0.142 | 0.093 | 0.294 |
| DTR (°C) | 0.135 | 0.050 | 0.303 | 0.094 | 0.276 |
| WSDI (d) | 0.087 | 0.043 | 0.088 | 0.094 | 0.180 |
| CSDI (d) | 0.114 | 0.046 | 0.188 | 0.135 | 0.255 |
| PG (mm) | 0.111 | 0.132 | 0.310 | 0.131 | 0.175 |
| SDII (mm·d−1) | 0.126 | 0.150 | 0.299 | 0.026 | 0.191 |
| RX1d (mm) | 0.092 | 0.162 | 0.566 | 0.059 | 0.125 |
| RX5d (mm) | 0.178 | 0.119 | 0.315 | 0.118 | 0.280 |
| R10 (d) | 0.090 | 0.119 | 0.387 | 0.103 | 0.136 |
| CWD (d) | 0.182 | 0.136 | 0.272 | 0.269 | 0.157 |
| CDD (d) | 0.043 | 0.082 | 0.483 | 0.101 | 0.063 |
Table 3.
Correlations between regional average normalised differential vegetation water use efficiency and climate variables in Northwestern Sichuan Plateau.
Table 3.
Correlations between regional average normalised differential vegetation water use efficiency and climate variables in Northwestern Sichuan Plateau.
| Climate Variables | Vegetation WUE of Different Underlying Surface Types | ||||
|---|---|---|---|---|---|
| Forest Land | Grassland | Wetland | Shrubland | Cropland | |
| TG (°C) | 0.444 * | 0.174 | 0.000 | 0.228 | 0.551 ** |
| TNN (°C) | 0.446 * | 0.162 | −0.060 | 0.323 | 0.522 * |
| GSL (d) | 0.439 * | 0.180 | −0.011 | 0.295 | 0.516 * |
| CSDI (d) | 0.281 | 0.002 | 0.193 | −0.324 | 0.484 * |
| CWD (d) | −0.321 | −0.325 | −0.268 | 0.531 * | −0.445 * |
Definitions of climate variables see Table 1. *, p < 0.05; **, p < 0.01.
Disclaimer/Publisher’s Note: The statements, opinions and data contained in all publications are solely those of the individual author(s) and contributor(s) and not of MDPI and/or the editor(s). MDPI and/or the editor(s) disclaim responsibility for any injury to people or property resulting from any ideas, methods, instructions or products referred to in the content. |
© 2023 by the authors. Licensee MDPI, Basel, Switzerland. This article is an open access article distributed under the terms and conditions of the Creative Commons Attribution (CC BY) license (https://creativecommons.org/licenses/by/4.0/).
Share and Cite
MDPI and ACS Style
Wang, X.; Feng, Y.; Cui, Y.; Guo, B. Spatiotemporal Variation of Vegetation Water Use Efficiency and Its Response to Extreme Climate in Northwestern Sichuan Plateau. Sustainability 2023, 15, 11786. https://doi.org/10.3390/su151511786
AMA Style
Wang X, Feng Y, Cui Y, Guo B. Spatiotemporal Variation of Vegetation Water Use Efficiency and Its Response to Extreme Climate in Northwestern Sichuan Plateau. Sustainability. 2023; 15(15):11786. https://doi.org/10.3390/su151511786
Chicago/Turabian StyleWang, Xin, Yong Feng, Yidan Cui, and Bin Guo. 2023. "Spatiotemporal Variation of Vegetation Water Use Efficiency and Its Response to Extreme Climate in Northwestern Sichuan Plateau" Sustainability 15, no. 15: 11786. https://doi.org/10.3390/su151511786
Note that from the first issue of 2016, this journal uses article numbers instead of page numbers. See further details here.