Article

Supposed Effects of Wetland Restoration on Hydrological Conditions and the Provisioning Ecosystem Services—A Model-Based Case Study at a Hungarian Lowland Catchment

1
Department of Sanitary and Environmental Engineering, Budapest University of Technology and Economics, Műegyetem rkp. 3, H-1111 Budapest, Hungary
2
MTA-MATE Agroecology Research Group, Department of Plant Physiology and Plant Ecology, Hungarian University for Agriculture and Life Sciences, H-2100 Gödöllő, Hungary
3
Institute for Soil Sciences, Centre for Agricultural Research, Herman Ottó út 15, H-1022 Budapest, Hungary
4
Faculty of Forestry, Institute of Geomatics and Civil Engineering, University of Sopron, H-9400 Sopron, Hungary
5
Institute for Geological and Geochemical Research, Research Centre for Astronomy and Earth Sciences, H-1112 Budapest, Hungary
6
Research Centre for Astronomy and Earth Sciences, MTA Centre of Excellence, Konkoly Thege Miklós út 15-17, H-1121 Budapest, Hungary
7
Department of Physical Geography, Eötvös Loránd University, Pázmány Péter Sétány 1/C, H-1117 Budapest, Hungary
*
Author to whom correspondence should be addressed.
Sustainability 2023, 15(15), 11700; https://doi.org/10.3390/su151511700
Submission received: 14 June 2023 / Revised: 17 July 2023 / Accepted: 18 July 2023 / Published: 28 July 2023
(This article belongs to the Special Issue Assessment of Ecosystem Services at Different Scales)

Abstract

:
Climate change and water scarcity increase the vulnerability of crop production and other ecosystem services (ES) in flood-protected lowlands under a continental climate. Restoration of wetlands leads to a higher water-buffering capacity of the landscape, strengthening various ecosystem services, and fostering adaptation to climatic, ecological, and agricultural challenges. Such restoration efforts require extensive land-use change, leading to trade-offs in provisioning and regulating ES. However, knowledge is limited about these situations, especially in the case of lowland areas. Here, we introduce a hydrological analysis in a 243 km2 flood-protected catchment in the Great Hungarian Plain, mapping the potential hydrological effects of water-retention scenarios on groundwater levels. We point out how the simulated groundwater levels will be used for estimating the changes in crop yields and tree growth (provisioning services). The introduced hydrological analysis and preliminary results for crop-yield estimates suggest a significant and scalable capacity for a nature-based hydrological adaptation: the extent of inundated areas could be increased stepwise and water retention could locally compensate dry periods due to the buffering effect of inundated meanders.

1. Introduction

Climate change and anthropogenic activities pose significant challenges to biodiversity conservation and ecosystem services (ES) [1]. Within a given geographical condition, land-use types provide various types of ES [2,3,4]. Land-use patterns have undergone significant changes worldwide throughout history [1] leading to the expansion of agricultural land use [1,5,6,7]. As a result of this trade-off [8], especiallythe regulating ES are threatened by these human activities [9], which focus on maximizing the provisioning ES [1]. Nothing highlights this process more than wetlands, as these habitats are often drained and converted for agricultural purposes, resulting in the loss of many vital services [5,10].
Wetlands have been lost and degraded at alarming rates globally [5,11,12,13]. Around 3.4 million km2 of wetlands have been lost since 1700 and most were turned into croplands. This trend is especially relevant in the alluvial plains [7]. In the short term, this process may be still rational. Drained wetlands provide a high potential for provisioning ecosystem services as high groundwater levels and adequate soil moisture lead to higher crop yields [14]. The price of rising flood risk due to draining wetlands is underestimated frequently [15,16]. However, the large amount of plant nutrients released through agricultural cultivation is a significant source of diffuse emissions to surface water bodies [17,18,19]. Furthermore, the loss and degradation of wetlands and free-flowing floodplains have significant consequences for biodiversity, carbon sequestration, and water regulation and can exacerbate the impacts of climate change [20,21,22,23,24]. Efforts to conserve and restore wetlands (including natural floodplains) are, therefore, crucial for maintaining the ecosystem services provided by these important habitats [25,26].
To balance the goals of agriculture, forestry and environmental protection, sustainable land use practices are required that prioritize conservation and ecosystem restoration [27,28,29]. Nature-based solutions that promote the conservation and restoration of natural environments are gaining recognition as effective strategies for mitigating and adapting to climate change [30,31]. Wetland agriculture, which is the cultivation of crops in and around wetland areas, offers an example of a nature-based solution that can provide a synergy of ESs [8]. This land-use approach offers a great variety of regulating ecosystem services [32] while also providing better water availability conditions for agricultural/forestry production [23,33]. These could lead to multiple benefits for society: improved food security, crescent biodiversity, better filtration of nutrients, mitigated erosion, and managed aquifer recharge [34]. Controlled and designed floodplain or wetland agriculture can be a sustainable way to use these ecosystems while also preserving their ecological functions [23].
In the 18th and 19th centuries, the Habsburg monarchy initiated large-scale flood-control projects in Hungary, including the regulation of the Tisza and Danube rivers and their tributaries, which involved the dredging and widening of river channels and construction of levees and dams [35,36]. As a result of the great river regulations, crop production increased significantly in the 19–20th centuries. However, a number of negative impacts have also been observed and identified [7] and, in the long run, agriculture also might be among the losers of the process [14].
The Great Hungarian Plain (GHP) is a key crop-producing area within Central Europe [37]. This alluvial plain is characterized by flat topography and relatively shallow groundwater tables, making it susceptible to drought, fluvial floods, and inland excess water inundation (IEW, periodical surface water coverage or nearly saturated topsoil) [38,39]. The management of water resources has been a priority for policymakers in this region and several large-scale projects have been implemented to improve water management and mitigate the impacts of floods and droughts [36]. These include the construction of emergency flood reservoirs and artificial lakes, the small-scale restoration of wetlands, and the improvement of irrigation infrastructure [40]. On the contrary, some claim that the extent of crop production in these former wetlands is a suboptimal land use. Furthermore, it is—partially—sustained through national and European subsidies and by the governmental maintenance of the flood defence–drainage system [41].
Nowadays, wetland and floodplain restoration and nature-based solutions are starting to gain popularity as potential solutions for water management issues in Hungary, particularly in the GHP region [40]. The extensive restoration of former wetlands and floodplains for sustainable agricultural use could potentially mitigate a major part of the negative effects of the warming climate on crop production in the surrounding landscape, supporting cropland–wetland conversion as an economically reasonable option. As a promising approach, it also has the potential to mitigate the conflict between agriculture, forest management, and environmental protection [23,42,43]. However, restoration efforts require a collaborative effort from policymakers, land managers, and farmers to ensure the long-term success of these restoration projects while also protecting the valuable ecosystem services of wetlands [23,44]. A multiobjective assessment of land-use practice may be necessary to exploit provisioning and regulating ES synergies. A reasonable approach to assessment is (i) the spatially explicit quantification of the hydrological cycle and the components of the water balance and, based on this, (ii) to map various water-related ESs. The effects of certain land-use interventions should be a priori assessed, as the availability of water is essential for maximizing the total ES provided by an area. Without such knowledge, even popular land-management trends like afforestation can lead to contraproductive results [45].
Plant productivity, such as crop yield or tree growth, is largely driven by water availability [46,47]. In semiarid regions like the GHP, the soil-moisture surplus provided by shallow groundwater can be a crucial source of water for crops [14], especially in rain-fed arable lands. In addition to the temporal presence of open water surfaces and increased actual evapotranspiration, an expected consequence of landscape-scale water-retention measures is the alteration of the current groundwater regime [48]. According to our hypothesis, in the vicinity of the inundated low-lying areas, groundwater levels will increase. The higher groundwater table in these zones contributes to higher crop yields and tree growth, and, therefore, to enhancing the provisioning of ESs in the area.
The main objective of our research is to estimate the hydrological and ES effects of inundations in different scenarios in a lowland catchment next to the Tisza River. This paper introduces a hydrological analysis of the area as well as an estimation for changing crop yields based on simulated groundwater levels. The analysis presented here is part of a four-year research project, where we also aim to use hydrological model results to support tree growth estimates.

2. Materials and Methods
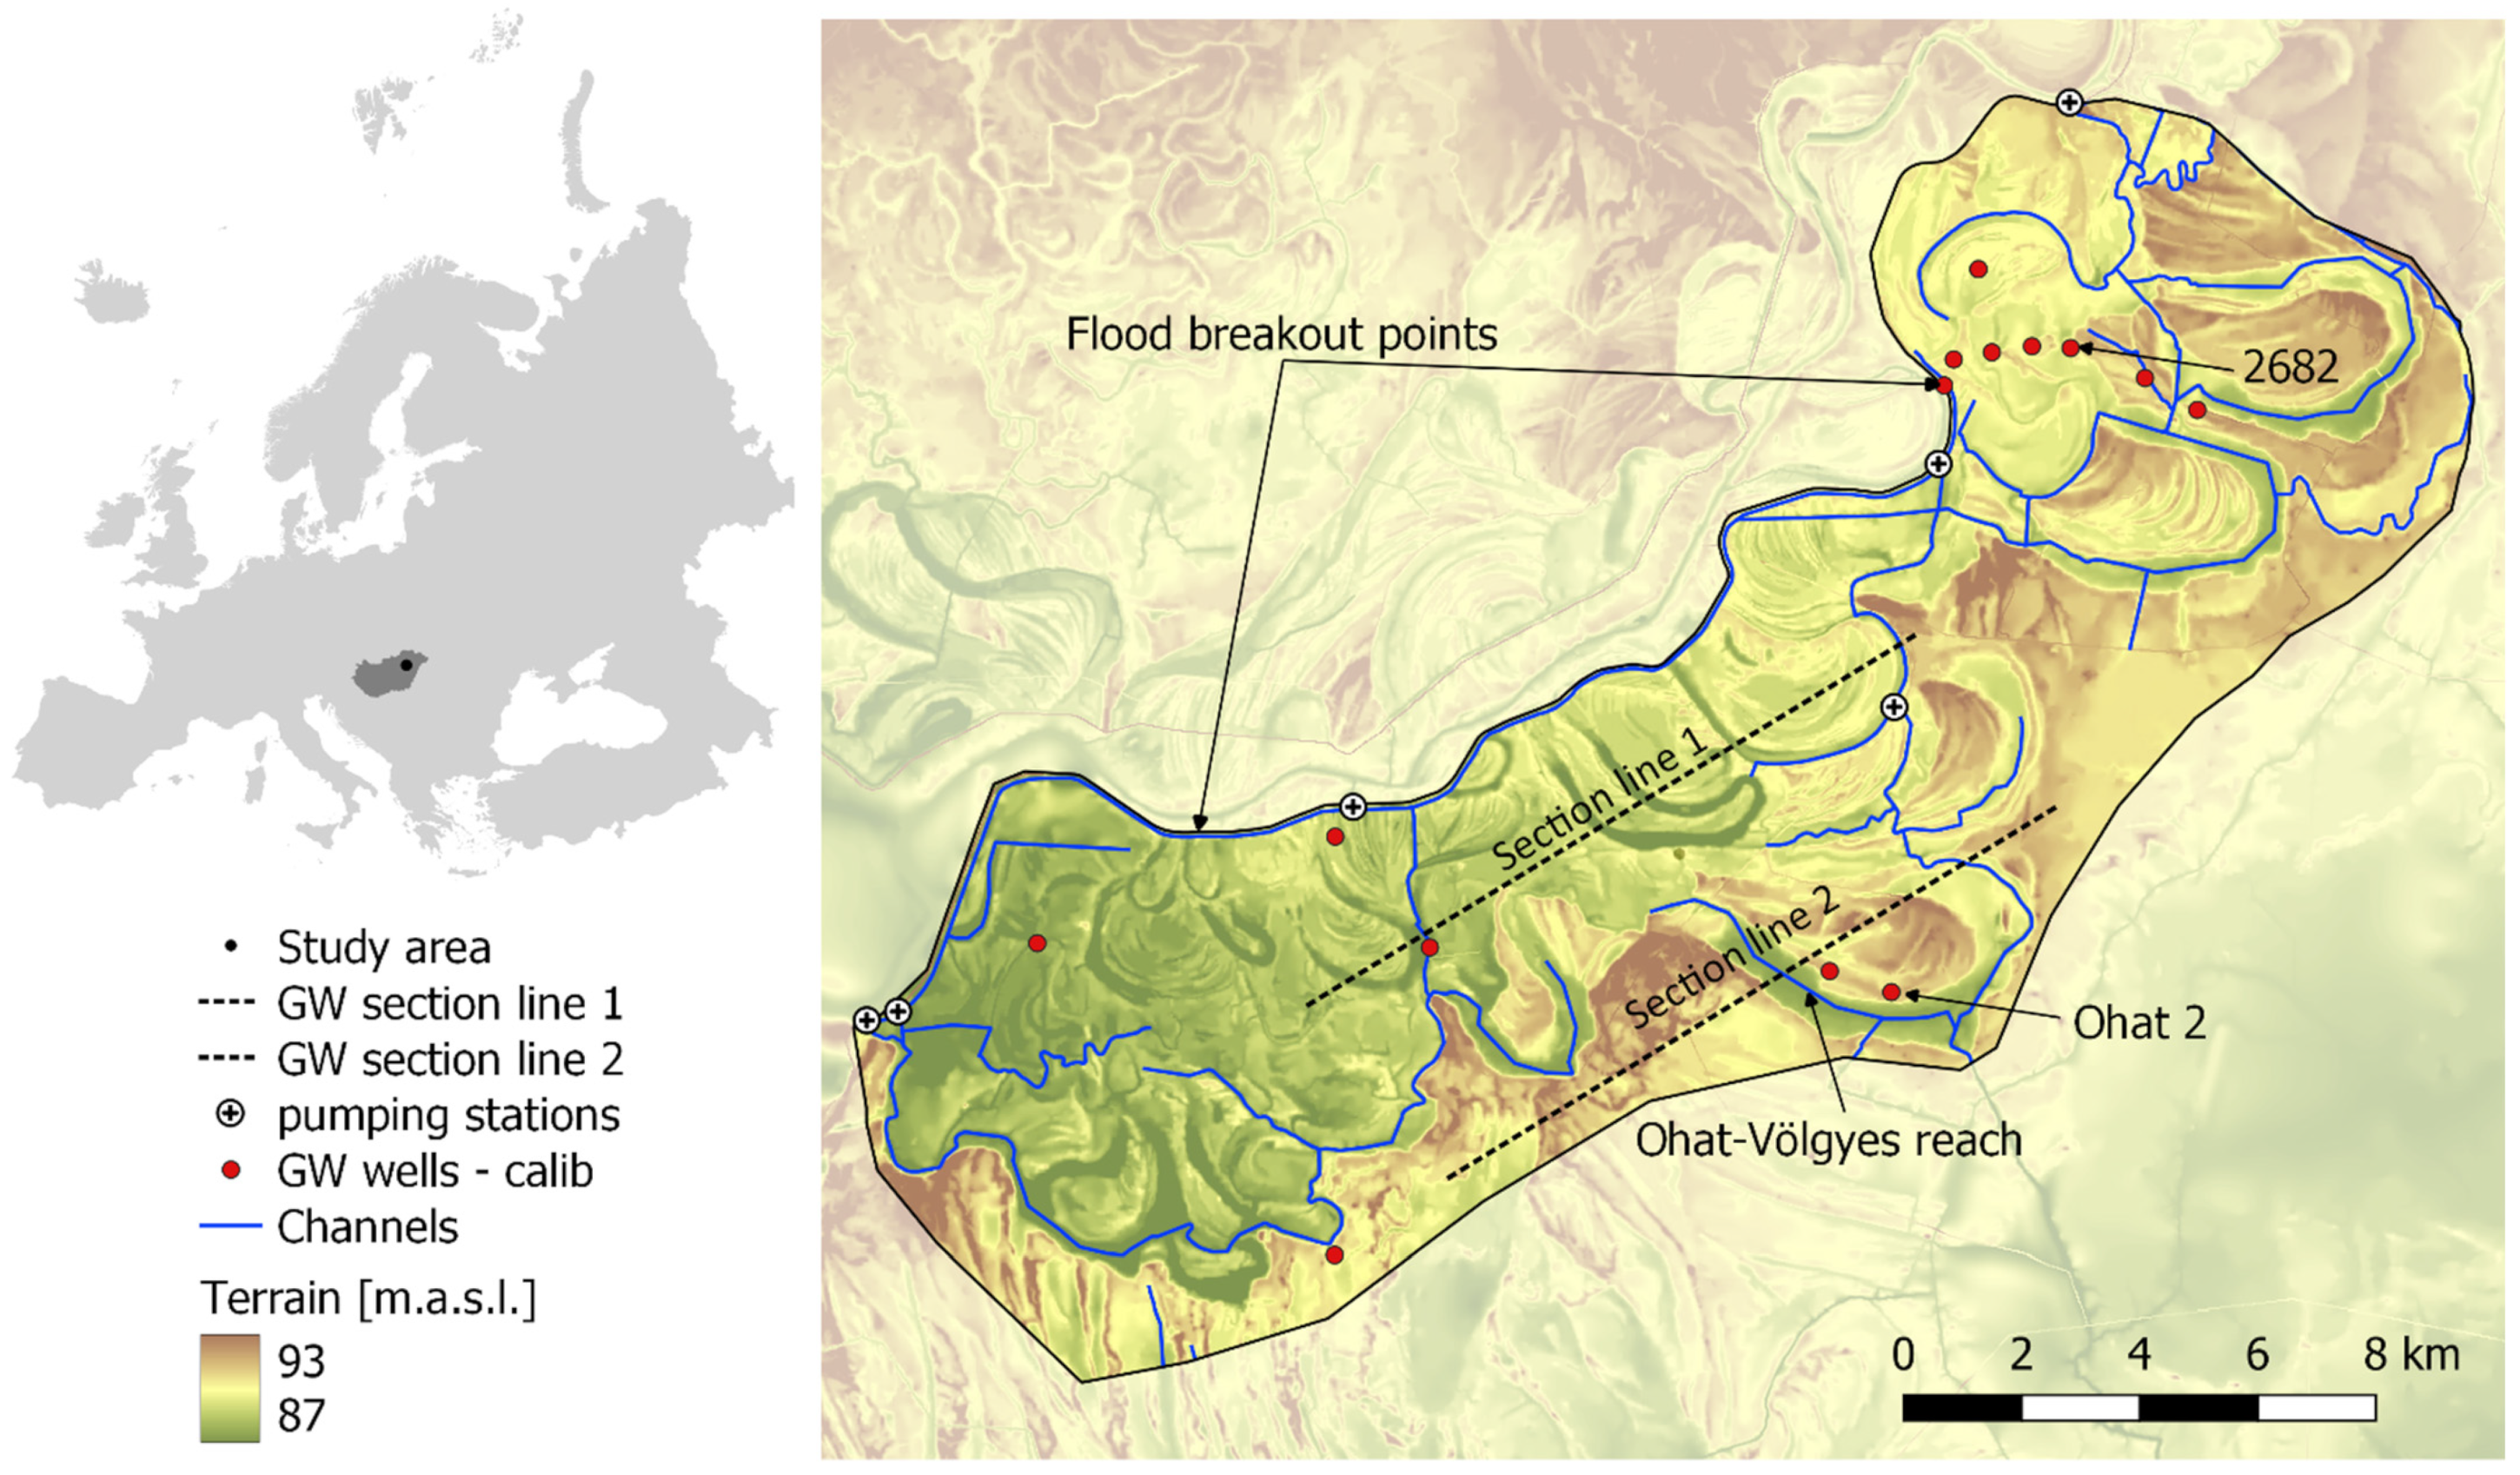
This analysis has two main parts: First, hydrological conditions are simulated using the MIKE She hydrological model along three water-governance scenarios in a lowland catchment (for an 11-year-long period). The aim of these scenarios was to evaluate the role of the drainage system and to compare the current practice with alternative water governance strategies focusing on water retention.
Second, we present the results of a provisioning ES evaluation method, which will use the simulated hydrological conditions as inputs for estimating crop yields with a process-based biogeochemical model (Biome-BGCMuSo). In the present paper, this tool was tested with data typical to the study area; maize yields were estimated for three soil profiles using site-specific meteorology and different groundwater regimes as forcing boundary conditions.

2.1. Study Area

We analyzed a 243 km2 flood-protected floodplain area (latitude and longitude of the centroid are 47.6731° N and 20.9432° E, respectively), located along the Hungarian section of the Tisza River (typical low, mean, and peaking flow rates are 170, 800, and 3400 m3/s respectively); thus, its morphology and soils were formed mainly by alluvial processes [49]. Even though the terrain is relatively flat, it has a complex landscape. The area can be divided into three distinct zones: deep floodplains (including former meanders) prone to regular inundations, practically flood-free terraces, and transitional regions between the former two (Figure 1). The total elevation range is only ~7 m; however, this difference can occur suddenly at erosional escarpments, where the terraces or natural levees were cut off by subsequent meanders. Two of the eight historical flood breakout points are located within the study domain. These breakout points were identified by Timár and Gábris [50] along the Tisza as places, where floods regularly breached through the natural embankments of the river and diverted a significant portion (the flow through each breakout point was typically several 100 m3/s) of the water surplus into natural flood-conveying channels. Due to inundation-related sedimentation, the area is dominated by loamy, silty clay loam and clay soils near the surface (0–2 m), while sandy layers also appear within more fine textured layers, resulting in a complex geological structure of the topmost aquifer [51].
The area was a wetland before it was separated from the Tisza River with dykes [49,52]. With extensive efforts, the water-dominated habitat was drained and turned into an agricultural landscape during the great river regulation works in the 19–20th centuries. A complex channel network provides a continuous drawdown effect on the groundwater and removes the occasionally occurring inland excess water [38,53]. The drainage network consists mainly of unlined earth channels, characterized by minimal slopes and looping branches within the network. Water governance is provided by several hydraulic structures (weirs, culverts, and bridges), having various maintenance statuses. The drainage system diverts water from the landscape into the Tisza River. Here, the flow is only temporally gravitational. During the flooding of the Tisza, the drained water is forced into the river with four pumping stations. Sedimentation and vegetation succession can temporally also limit the conveying capacity of the channels. The maintainer, the Trans Tisza Water Directorate, carries out vegetation control and mud dredging occasionally; no precise information was available about this. Therefore, the efficiency of the drainage network is erratic. The directorate maintains surface–subsurface hydrographical monitoring, which offers pointwise information on the hydrological processes of the region.
The cropland-dominated landscape still has a few seminatural meadows, forests, and wetland habitats, some of which also have a nature conservation status. One of the most valuable of these is a rare and threatened salt steppic oak-forest remnant (Ohat Forest) situated on a sediment terrace. As the hydrological behaviour of these wooded areas offer valuable insight into the possible effect of an extensive afforestation, two groundwater monitoring wells were installed here recently as part of our research [54].

2.2. Hydrological Simulations

2.2.1. Model Setup

Using the renowned MIKE Zero software (Release 2022, Update 1, [55]) the hydrological regime of the study area was described and the effects of water-retention measures were predicted. The most important processes of the near-surface terrestrial water cycle, snow hydrology, interception, vegetation root water uptake and evapotranspiration, surface flow, unsaturated zone seepage, and groundwater flow, were simulated with the MIKE She integrated hydrological model (IHM). The channel–terrain and channel–groundwater interactions were simulated by the dynamically coupled MIKE She IHM and the MIKE Hydro River modules.
All spatial and temporal data were gathered from open sources and used for model configuration and for model adjustment. These are:
  • Digital elevation model (original horizontal resolution: 5 m; cell size in the model: 50 m, [56]);
  • Meteorology: daily open-air precipitation [mm/day], air temperature [°C], potential evapotranspiration [mm/day] (estimated with the Penman–Monteith equation, [57]);
  • Hydrography (geometry and auxiliary) data for the channels and the pumping stations of the drainage network [58];
  • Hydrology: pumped water volumes [m3/year], groundwater-level time series [m.a.s.l] and estimated actual evapotranspiration [mm/day] [58,59];
  • Land-use conditions: Corine Land Cover 2006 database [53] for characterizing the spatial distribution of vegetation cover, time-dependent leaf area index, and root depth for the different major land use categories to account for seasonal changes ([60,61,62]);
  • Soil properties of the topmost 2 m soil layer (expressed with Mualem–van Genuchten soil hydraulic functions for USDA soil textural classes [63]);
  • Geologic layers of the topmost 10 m unconfined aquifer [51,64];
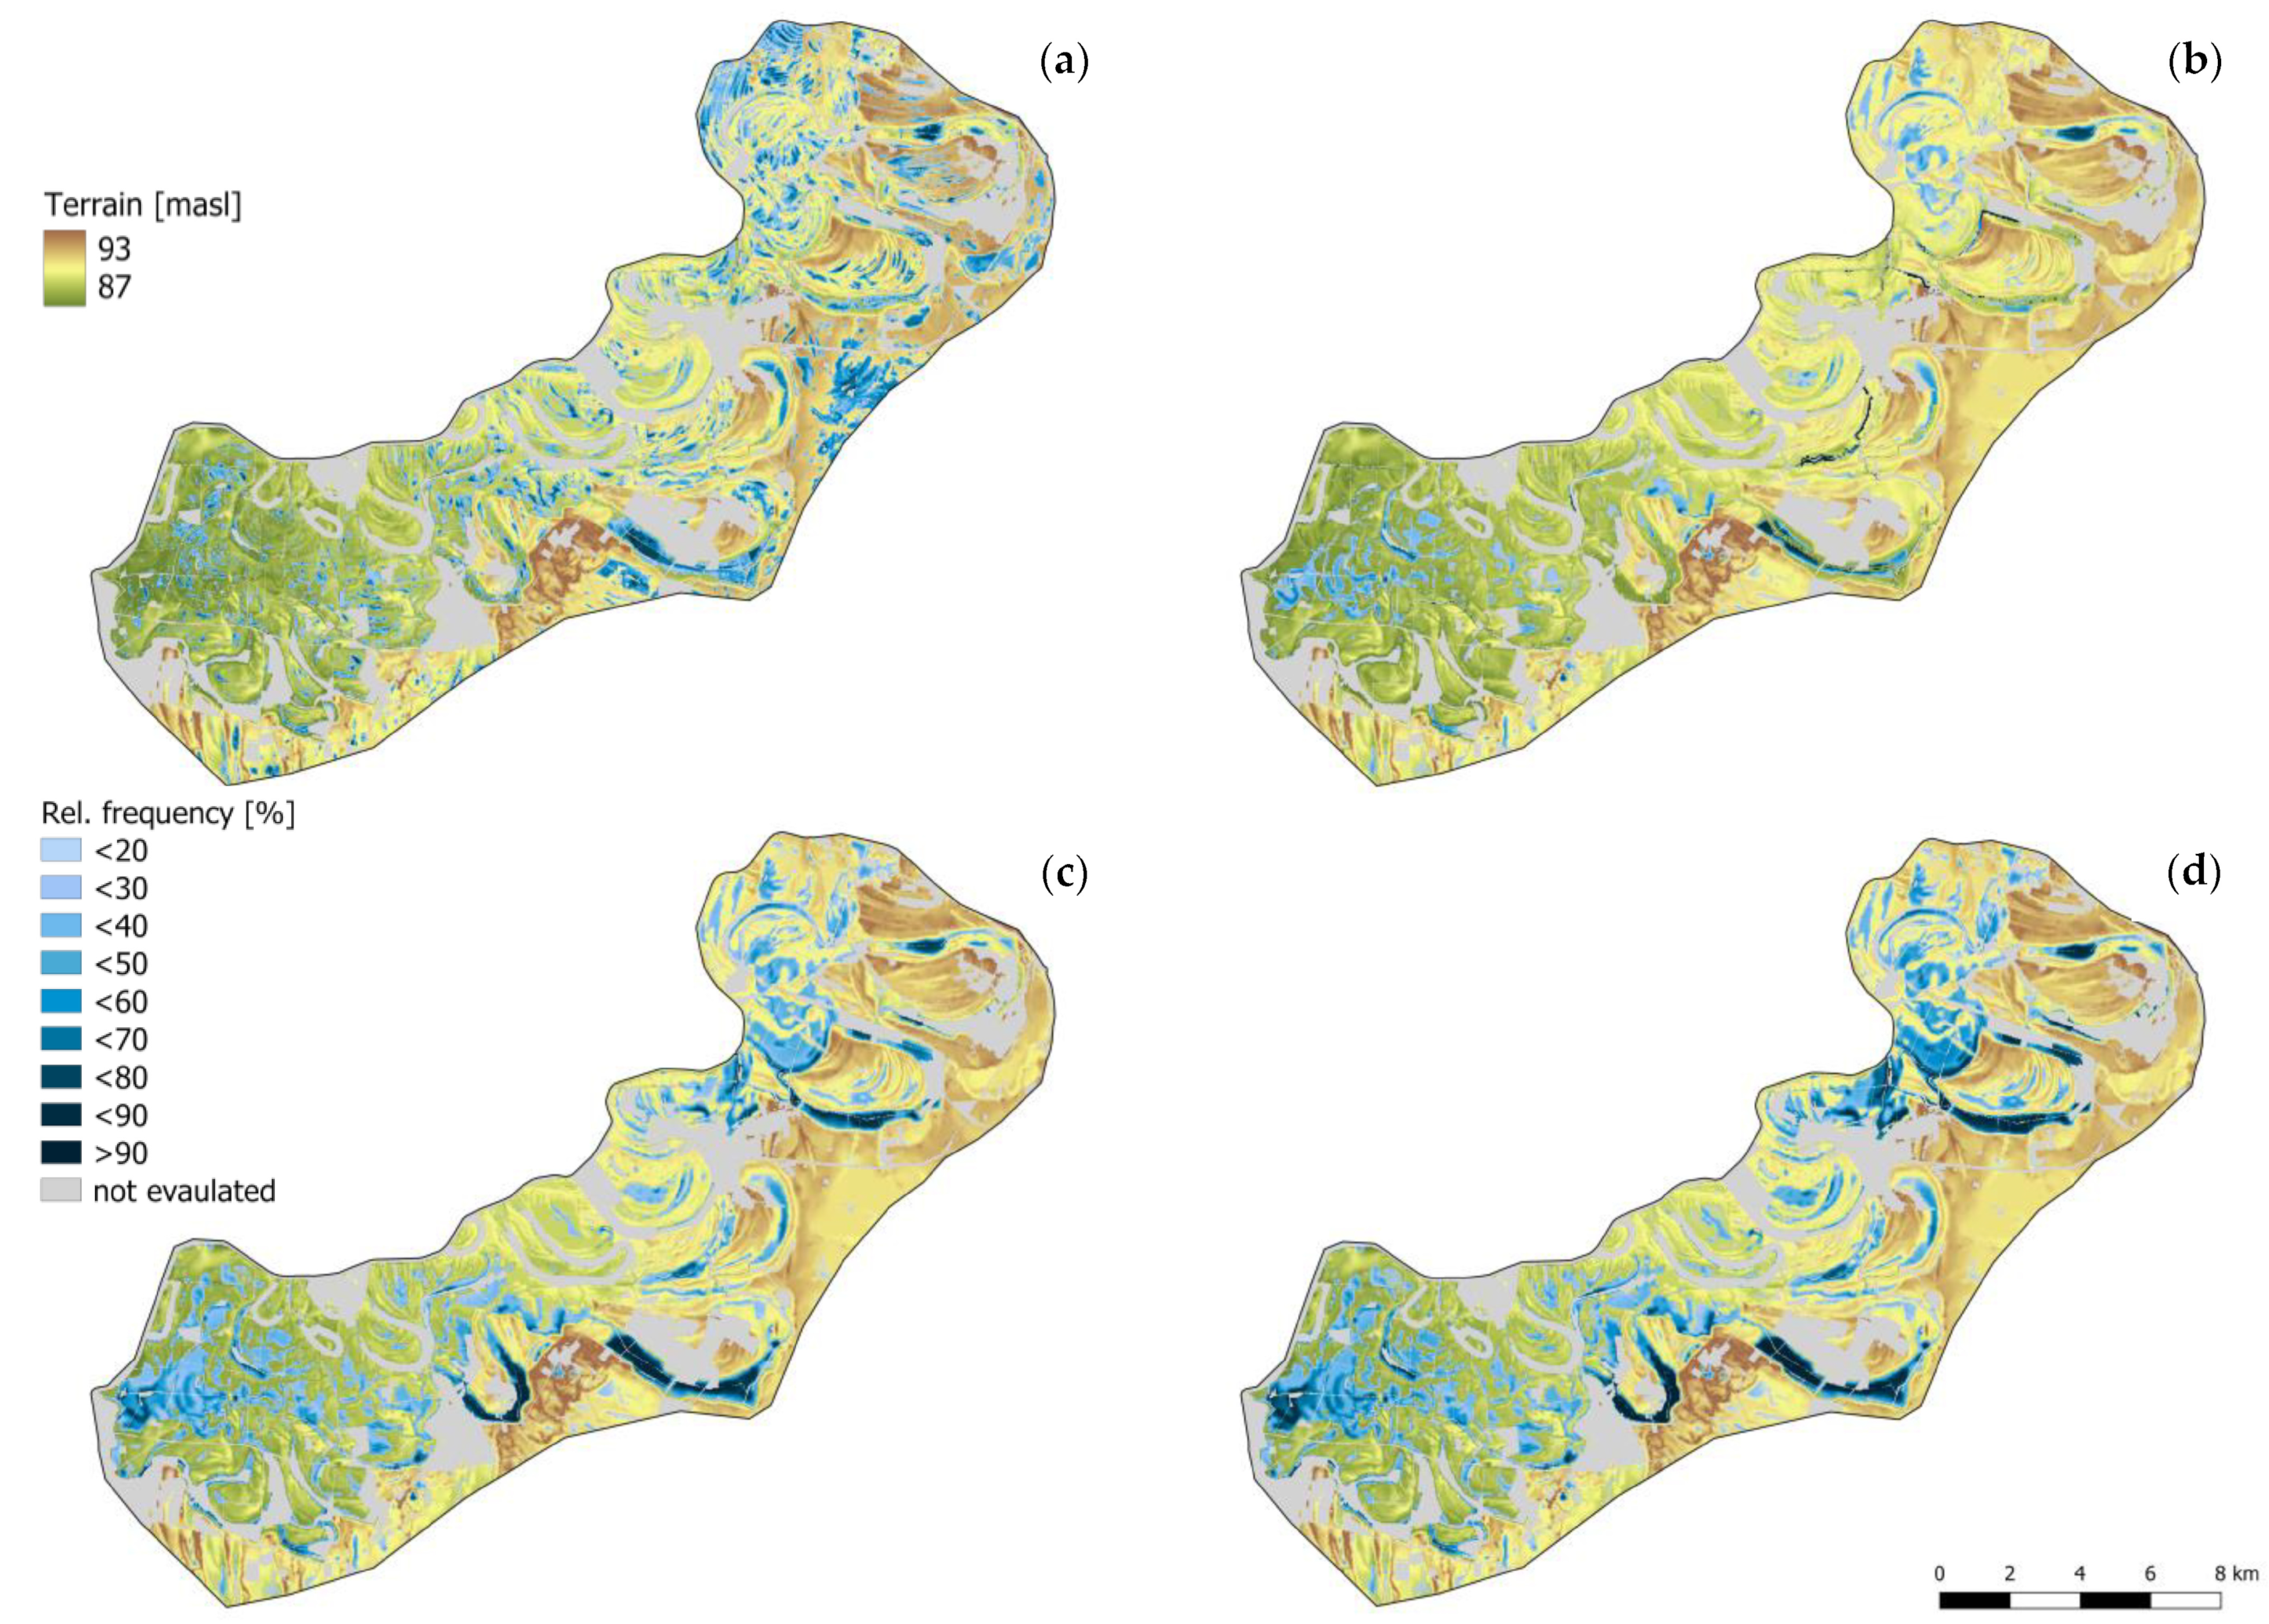
  • Satellite image-based inland excess water frequency map [53].
The model domain was delineated based on terrain morphology and then the boundary was slightly modified to incorporate a larger portion of the surrounding terraces, as it was assumed that water retention may affect the GW regime also in these areas.
The channel network was represented by its longitudinal and cross-sectional geometry. There was no precise information about the recent condition and the exact operation of the flow-regulation hydraulic structures (weirs, culverts, bridges, etc.); therefore, only the pump stations with a generalized operation scheme were considered.
The soil conditions were mapped by 100 × 100 m grid cells of a 3D soil database in six standard soil layers yielding 407 different vertical combinations of USDA soil-texture classes [65]. We clustered these soil profiles with a functional soil-classification method [66], which resulted in 10 functional soil groups. The soil hydraulic parametrization of these soil groups was based on the mean values derived for soil textural classes of the Martha database [67].
Secondly, we assumed that the physically based algorithm used requires a moderate adjustment of the parameters. In the first stage, a simplified version of the full model was used for parameter optimization over a three-year-long period in parallel computation mode. This model version had a coarser spatial resolution (100 m) and the channel network was not simulated. This approach led to roughly a 50-fold increase in the number of simulations and made automatic calibration feasible. Measured and simulated groundwater-level time series were compared using standard model-efficiency measures (Nash–Sutcliffe efficiency—NSE, root mean square error—RMSE, squared Pearson correlation coefficient—R2, [68]). As the channel network was neglected in this stage, we selected mostly those GW monitoring wells which are not influenced significantly by excess water drainage. To minimize the difference of measured/simulated GW levels, the following parameters were automatically adjusted: (i) hydraulic conductivity of the two most extensive geological layers, (ii) parameters of the soil-moisture retention curve and hydraulic conductivity of the two most common topsoil types, the C3 evapotranspiration coefficient of the crops on arable lands.
The second stage of model adjustment was manual fine-tuning based on trial and error. Here, we carried out simulations with the fully coupled model configuration for the whole period and, then, compared the measured and simulated GW time series and a remote-sensing-based excess water frequency map with the simulated durations of surface water coverage. Simulation results for the pumped water volume and the annual actual evapotranspiration were also compared with observations/literature data [59] to check the validity of the calculated water budget.

2.2.2. Scenarios

Three water governance scenarios were investigated. The reference scenario (REF) represented the current water-management conditions where the drainage network actively diverts inland excess water away from the protected floodplain. This approach aims to maximize the size of arable lands and the dominant provisioning ES, the crop production. Depending on the water-level difference between the drainage channels and the Tisza, gravity flow or pumping stations drive water into the receiving Tisza River.
Then, the excess water-retention scenario (EWR) was set up to evaluate the effects of the drainage network at this site [69] and the consequences of an extensive inundation of the deep floodplain zone [41]. The drainage channels and the pumping stations were both removed from the model, as a rough simplified representation of the case, when the local water authority would stop the maintenance of the defence infrastructure.
Finally, in the third scenario (FLOOD), a combined intervention of nature-based flood-risk mitigation and managed aquifer recharge was investigated [40,70,71]. During this, along with the retained inland excess water, an additional ~33 million m3 of water was released into the study area from the flood waves of the Tisza River in Spring 2003.
For the sake of comparability, except for water governance, all other model configurations were the same for the three scenarios. The simulations covered the 2000–2010 time period with daily time steps. The period was selected so that it represents recent environmental conditions and includes some characteristic hydrometeorological extremities that hit the GHP: severe inland excess waters (2000, 2006, and 2010), floods (2000 and 2006), and droughts (2002, 2003, 2007, and 2009).

2.3. Estimation of Water Dependent Provisioning Service—Crop Yield

Testing the main hypothesis, maize yields were simulated under different groundwater conditions by using the Biome-BGCMuSo biogeochemical model (hereinafter MuSo, [72]). MuSo calculates surface hydrological processes (e.g., surface ponding, runoff, and infiltration), water movement in a soil profile, carbon and nutrient fluxes, the accounts material mass/volume in various storages (e.g., soil, plant, and surface), and the effects of shallow groundwater on soil hydrology and the affected biochemical processes [73].
No site-specific information is available on the proportions of different crops grown in the catchment; however, in Hajdú-Bihar County, enveloping the study area, maize is the dominant crop with 50–61% of all harvested area in the arable lands [74]. Phenological and management-model parameters were taken from a former country-wide crop-yield assessment [75]. Then, based on the soil conditions and the lito-stratigraphy of the area, three 10 m deep heterogeneous soil profiles differing inthe dominant soil type (loam, clay, and sand) of the top 2 m were compiled. The bottom 8 m was uniform sand for all profiles. Hydraulic parameters (e.g., hydraulic conductivity and capillary fringe) of the layers were adopted from the hydrological model and were estimated by the MuSo based on the sand, silt, and clay content of the soils.
The simulations covered the 2000–2010 period, with a multiyear spin-up aiming at minimizing the effects of the initial conditions of soil moisture, nutrient and organic matter content, and distribution in the soil profiles. For the current analysis, measured GW levels of three monitoring wells in the study area served as time-variant (variable head type) bottom boundary conditions for the hydrological module of the MuSo. The applied GW time series represent different topographical conditions: (i) near-surface GW table at low-lying areas, (ii) medium GW depth in transition zones between mounds and depressions, and (iii) deep GW table characteristic for higher elevation zones. The 10-year average GW depths were 121 cm, 243 cm, and 395 cm below ground, respectively, while GW fluctuations in the wells showed a high degree of similarity (correlation coefficients ranged between 0.76 and 0.93).
As a reference for the simulations, an additional bottom boundary condition of free drainage was also applied, representing site conditions where precipitation is the sole source of water for plants. By combining the three soil columns and the four bottom boundary conditions, maize yields were simulated for 12 model variants. The impact of GW on maize yields were expressed as the ratio of calculated yields for the model variants with groundwater bottom boundaries and the reference case with free drainage.

3. Results

3.1. Model Adjustment Results

The calibration resulted in varying agreement between the different observed and simulated state variables. The annual sum of actual evapotranspiration showed good agreement with available estimates from the literature [59]; the ratio of the two calculated evapotranspiration sums for 2000–2009 was 0.95. This indicates the appropriate representation of territorial evapotranspiration, one of the defining forcing factors of lowland catchment processes. Pumped volumes were underestimated by 33%, which can be explained by (i) the somewhat arbitrary nature of real-life defence operations that is hard to represent with numerical models and with (ii) the lack of information on actual channel conditions and upstream inflows, which are crucial input data of the surface-water simulations. Nevertheless, the order of magnitude and the timing of real-world pumping were adequately represented by the model (Table 1).
IEW is a temporary hectic process characterized by the irregular appearance of water coverage and soil saturation and long periods with an absence of the phenomenon. A common way to illustrate and quantify the spatial patterns is the use of IEW hazard maps [38]. These maps—analogous to flood hazard maps—show the spatial variation of relative observed or estimated IEW frequency. Figure 2 compares such hazard maps for the study area. Figure 2a is an observation, a satellite image-based frequency map derived for 1998–2016 (including 4–5 observed IEW events) [53]. Figure 2b–d are the hydrological simulation-based hazard maps for the three scenarios, showing the relative number of days with surface water coverage for the 2000–2010 period.
The simulated GW-level time series matched measured data with varying accuracy. The NSE was negative or ~0.0 for three monitoring wells, while above 0.5 for four wells. Wells with negative values (poor agreement) were located next to drainage channels (GW wells: 2583 and 2677, see Figure 1), where the lack of information on the operational water management hindered the accurate process description. Wells with NSE values above 0.5 indicate precise simulation of GW dynamics.

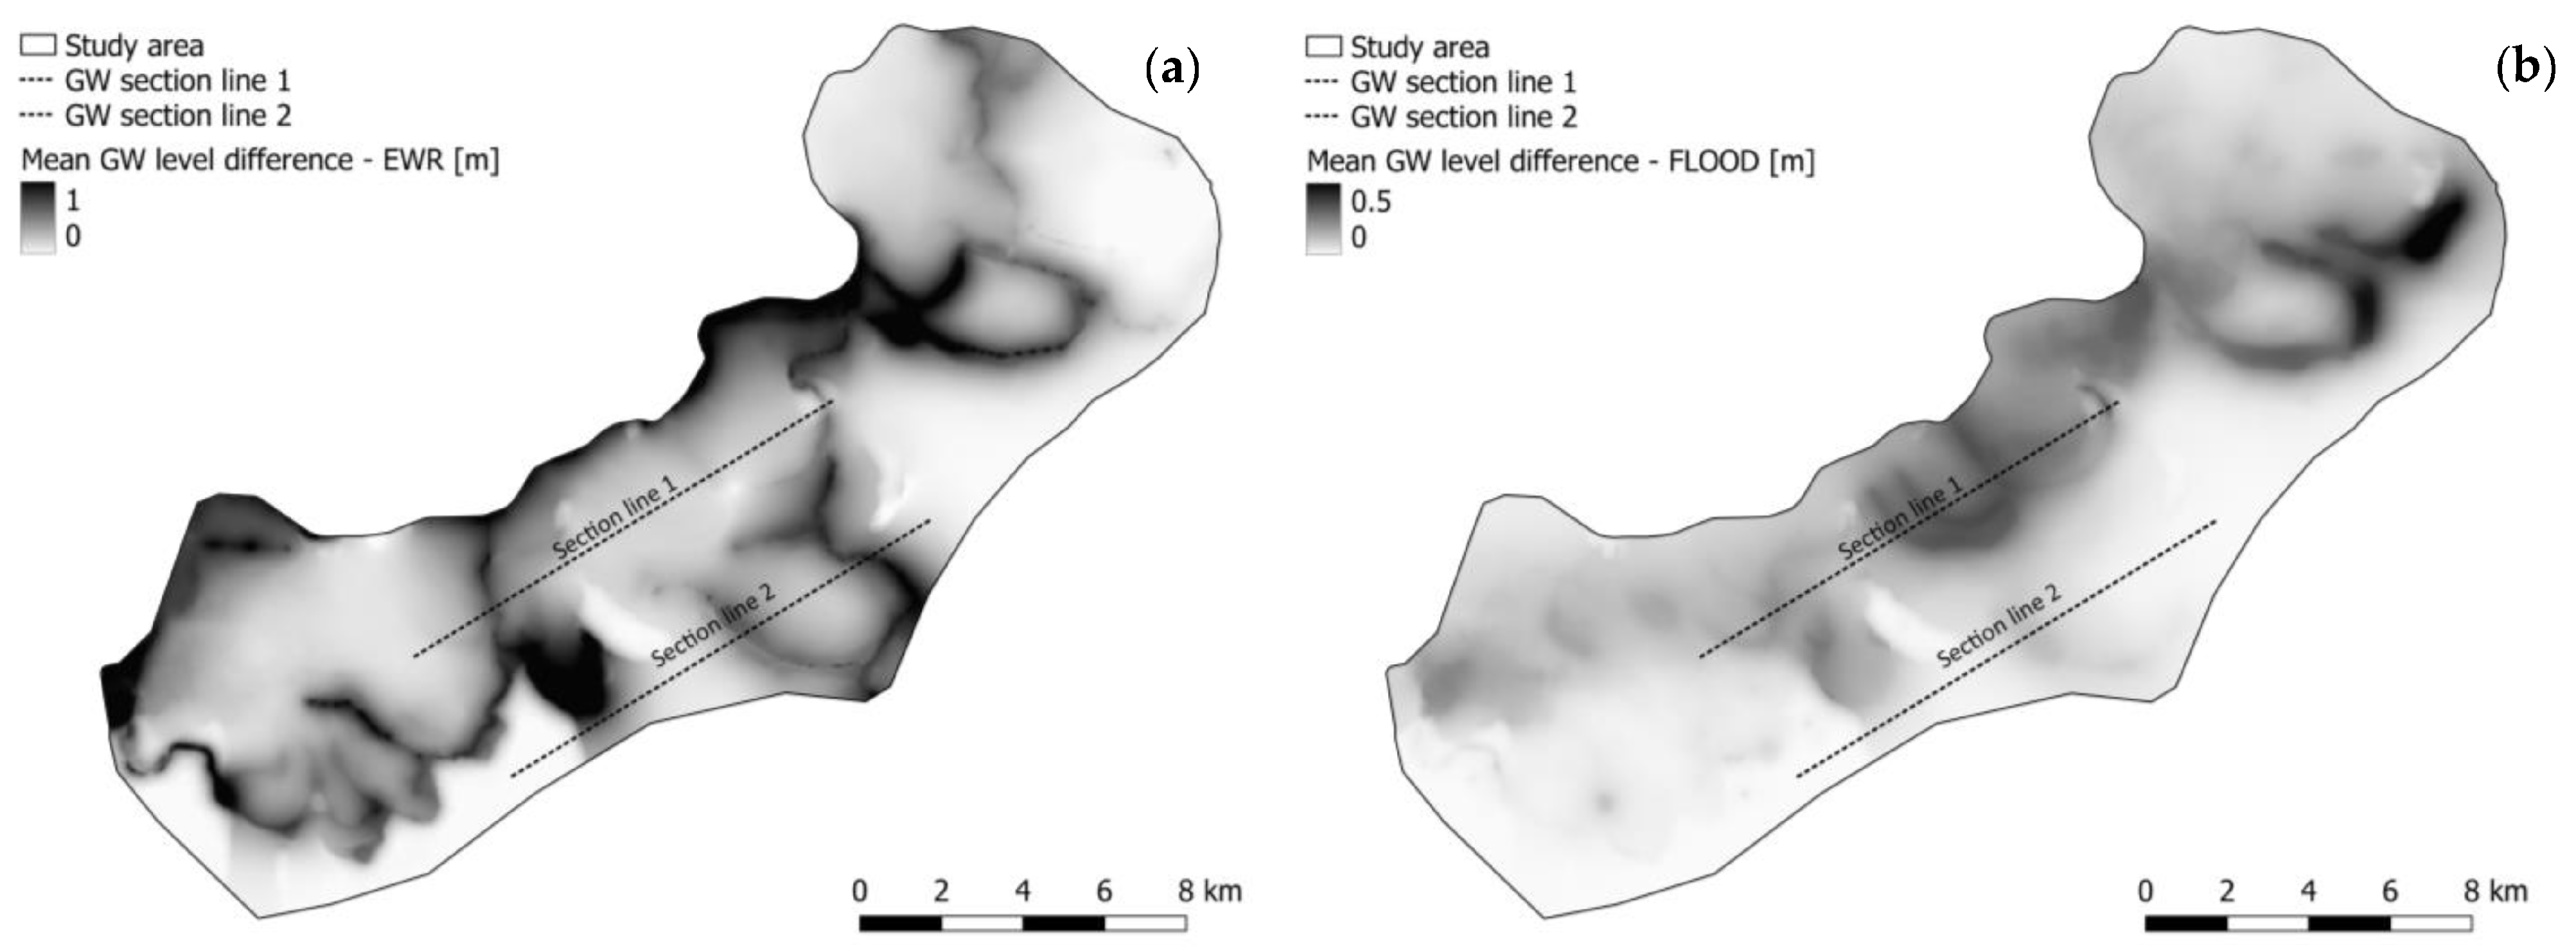
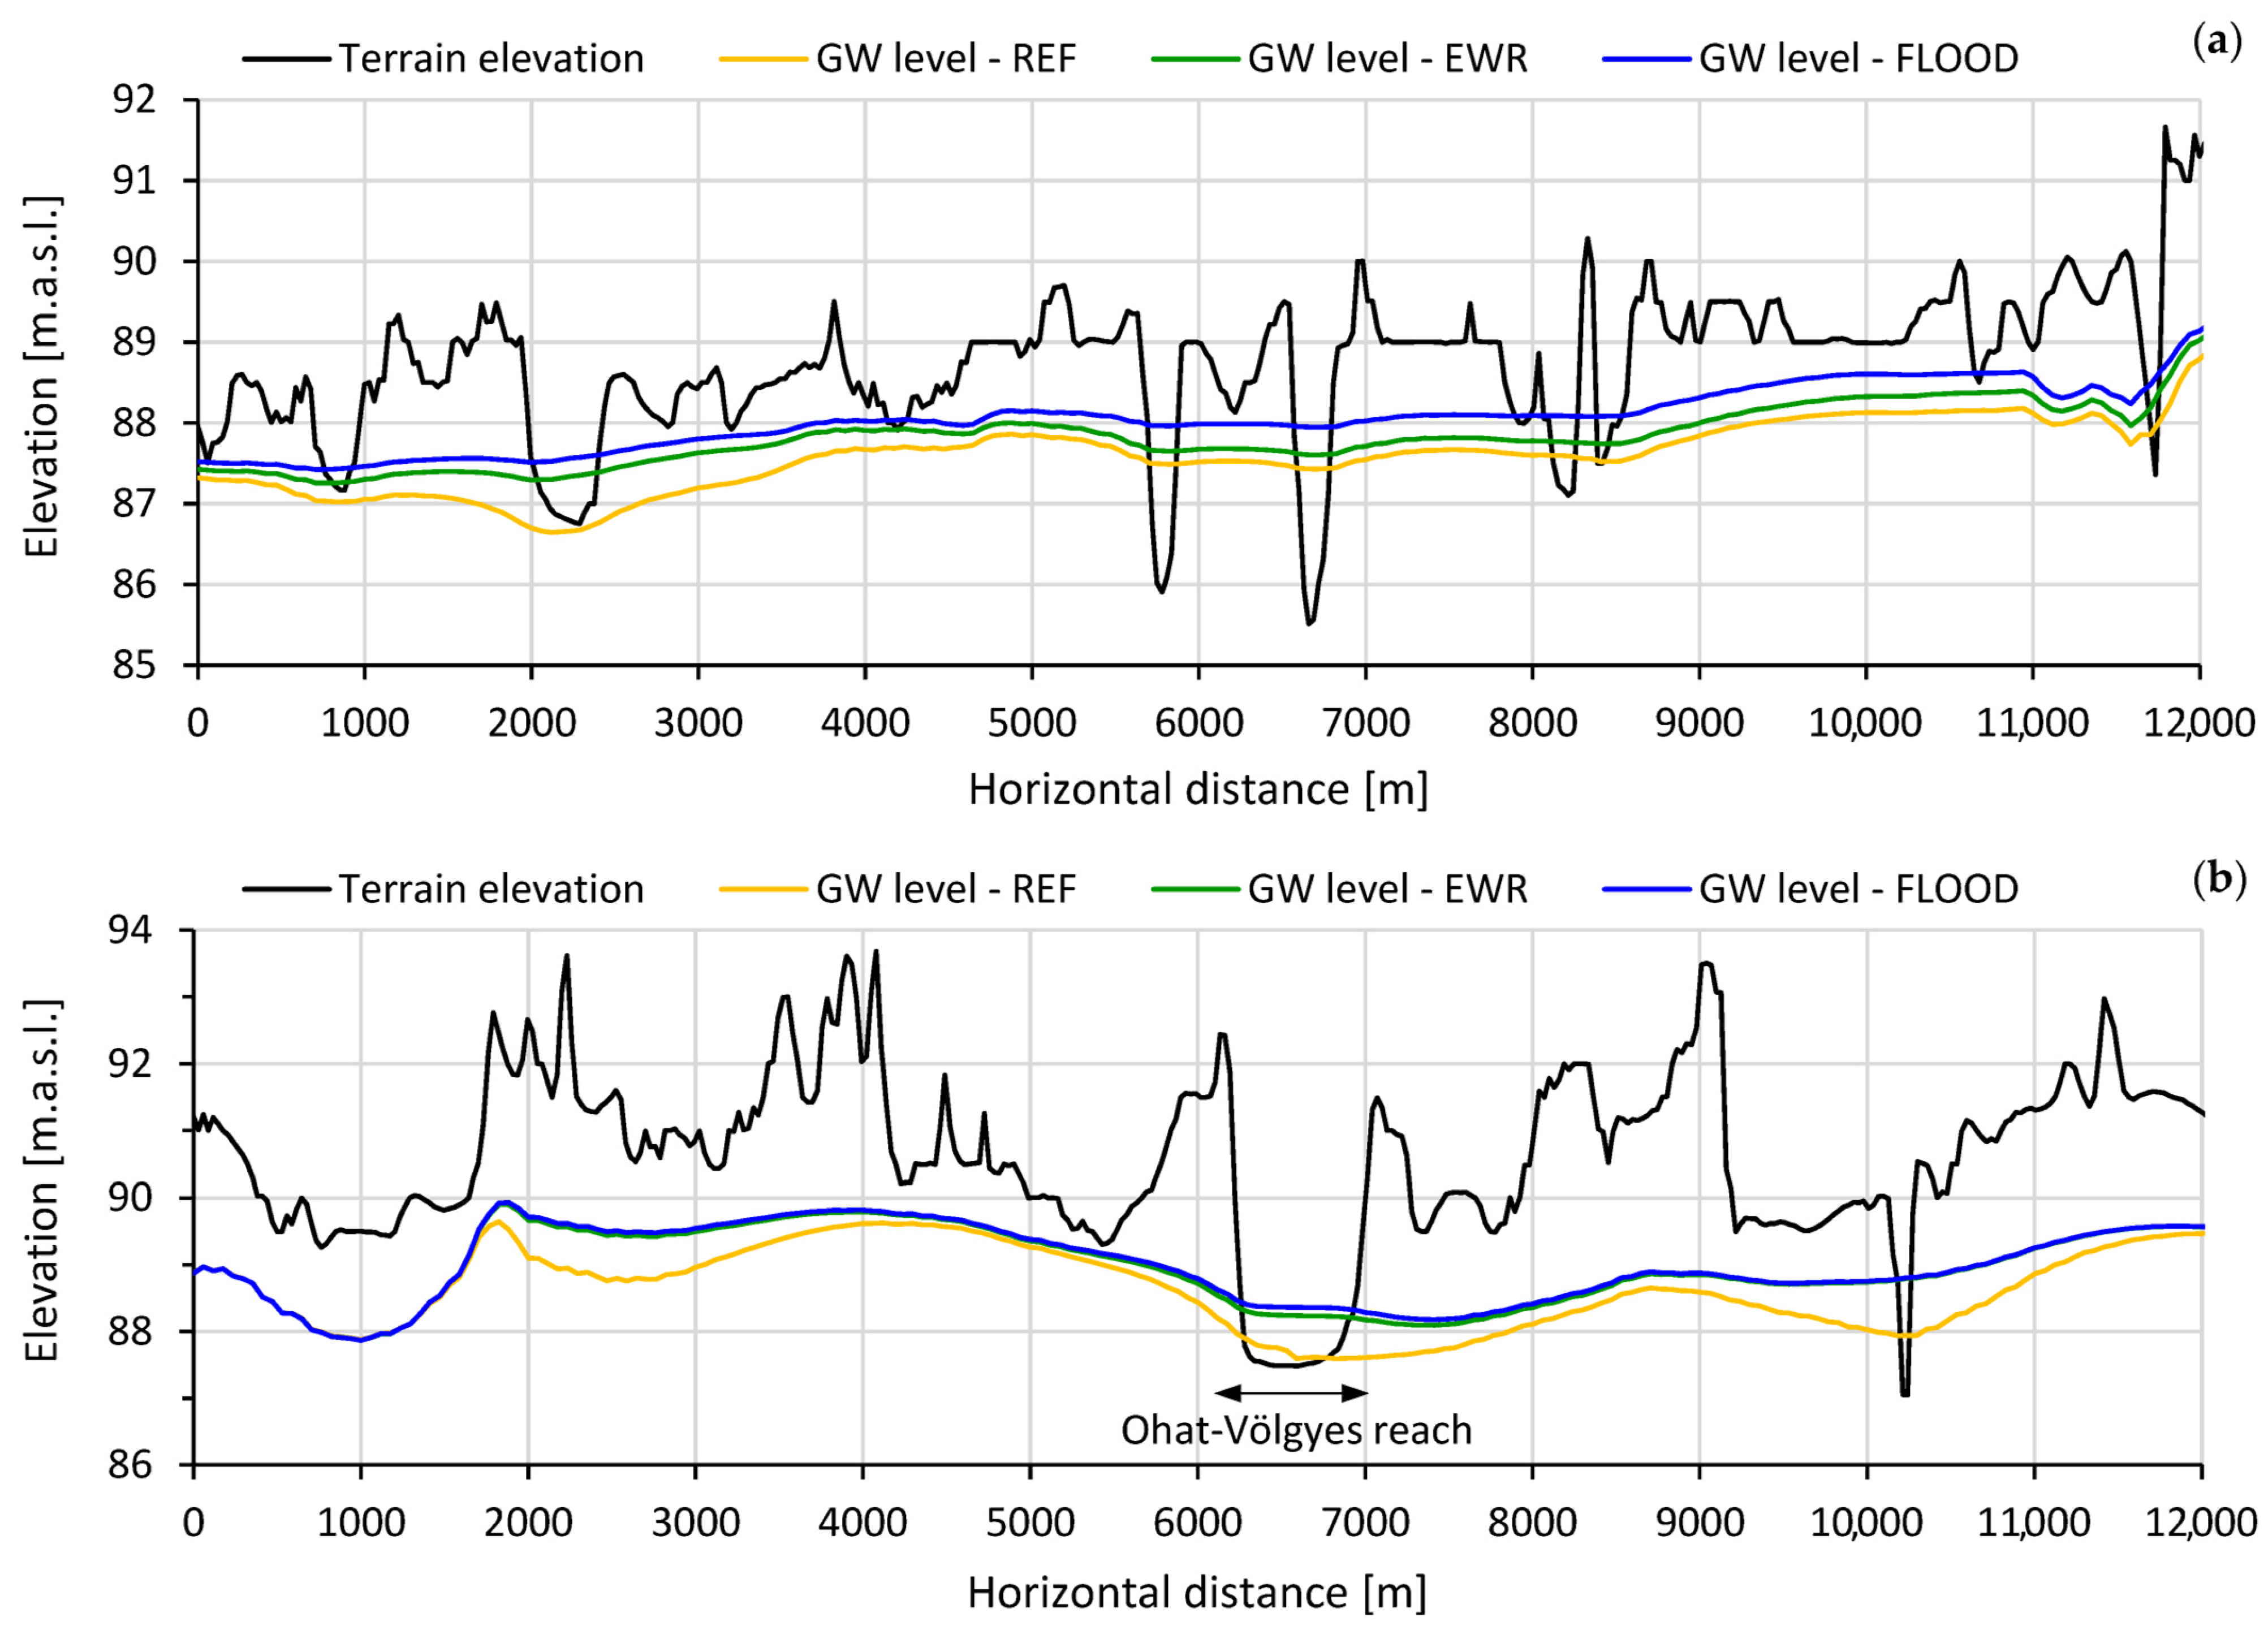
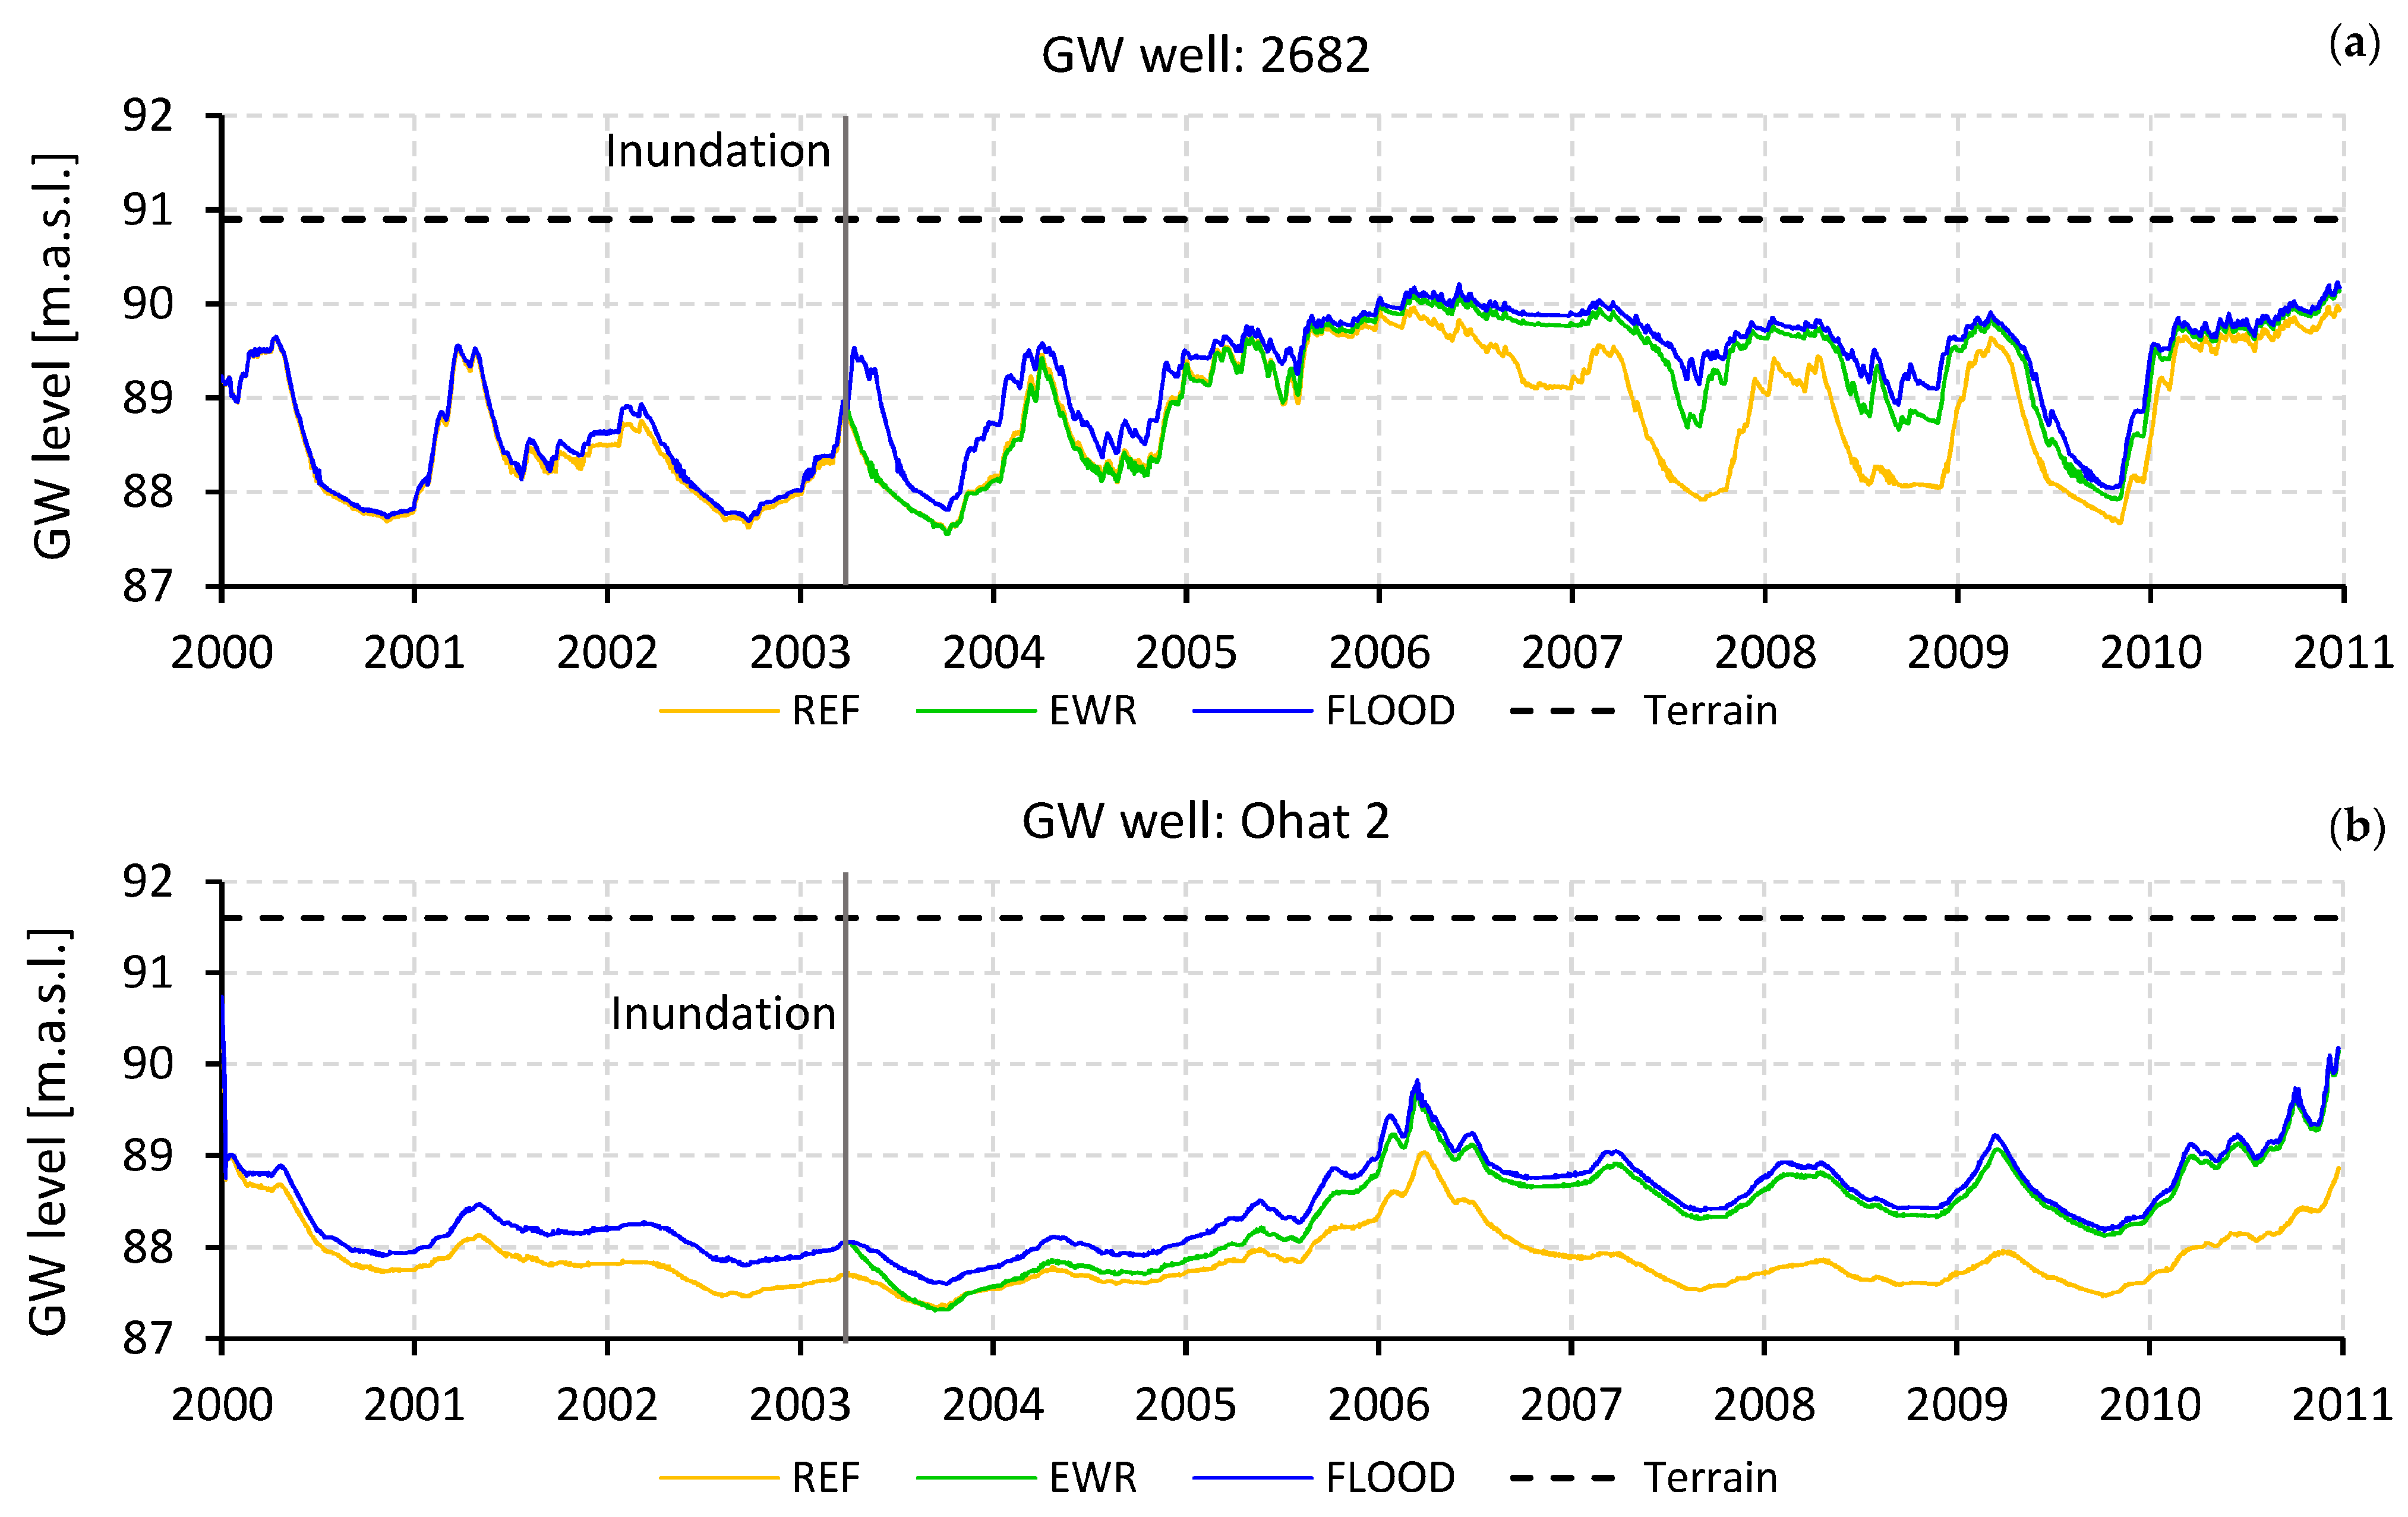
3.2. Scenario Results

Integrated hydrological model simulations yield a vast array of results for several hydrological variables. From these, we introduce the most relevant both for lowland catchment behaviour and for the hypothesis about crop production: the duration of surface water coverage and groundwater levels. Figure 2b–d show the impact of the different scenarios on surface waters. For the model results, the duration of water coverage is expressed as the percentage of days with at least 1 cm of simulated overland water over the whole simulation period. For surface waters, notable differences can be identified between the reference and the water-retention cases. Major changes in the duration of water coverage occurred in the deeper flat parts of the catchment and mostly in the vicinity of the drainage channels. The area influenced with frequent (>20%) overland water doubled, when excess water retention (EWR, affected area: ~71 km2) was simulated instead of drainage (REF, affected area: ~34 km2). Interestingly, only a minor increase occurred when the additional inundation was introduced (FLOOD, affected area: ~81 km2). The extra water volume mostly accumulated in the depressions and was characterized by high surface-water presence.
The comparison of the REF and EWR scenarios resulted in a significant change not only in the duration of water coverage but also in time-averaged GW levels. The termination of drainage led to an overall 54 cm increase but with notable spatial differences. Similar to the case of surface water coverage, the change between EWR and FLOOD scenarios was less defining with an additional 9 cm GW-level increase (Figure 3 and Table 2). The estimated 10.1 million and 12.9 million m3 difference in GW storage is equivalent to 41 mm and 52 mm of water over the whole study site, respectively, or 7% and 9% of the annual precipitation sum in the region.
The cross sections of Figure 4 illustrate the terrain morphology, as well as the temporary averaged GW levels, along two profile lines (see Figure 1) for the three analyzed scenarios. The Section lines were selected to represent the two distinct parts of the study site: (1) a mostly deep region with minor elevation changes except for the channels and (2) a more diverse part with terraces and former meanders. In Figure 4b, the Ohat–Völgyes reach is also highlighted as a domain of interest.
Figure 3 and Figure 4 present a remarkable difference between the low-lying flats and the more segmented terrace regions. The deeper parts of the study area (e.g., Section line 1) are affected heavily by the drawdown effect of the drainage network. Here the difference between the average GW levels of the scenarios is evenly distributed and there is a 91% difference between EWR and FLOOD. In the case of the segmented morphology along Section line 2, GW levels show a more diverse pattern (see standard deviations in Table 2 also) and follow the terrain in a strongly smoothed way. Here, the two alternative scenarios led to similar results regarding the change in GW levels. The effect of water retention was more obvious near the channels and meanders and less significant in the terrace regions. The Ohat–Völgyes reach was inundated over most of the time. In the terrace region, the drawdown effect of the channels can extend over a 1 km distance.
In addition to the diverse spatial patterns, the GW levels show a remarkable temporal fluctuation as well, where the effect of dry and wet periods can be clearly identified. For instance, the droughts of 2003, 2007, and 2009 led to minimum levels of GW, while the wet year of 2006, and especially the extreme 2010, caused GW peaks in the two wells (Figure 5). The time series also indicate the influence of excess water retention and additional inundation of the catchment. These water-retention measures caused major changes after the severe IEW of 2006 and were able to buffer the following two summer periods. However, in the case of the cropland region (Figure 5a), the drought of 2009 almost completely eliminated the retained water and GW levels approximated the levels of the REF scenario. In the Ohat 2 region (Figure 5b) water retention could compensate for every dry period due to the buffering effect of the adjacent inundated meander (“Ohat-Völgyes reach”).

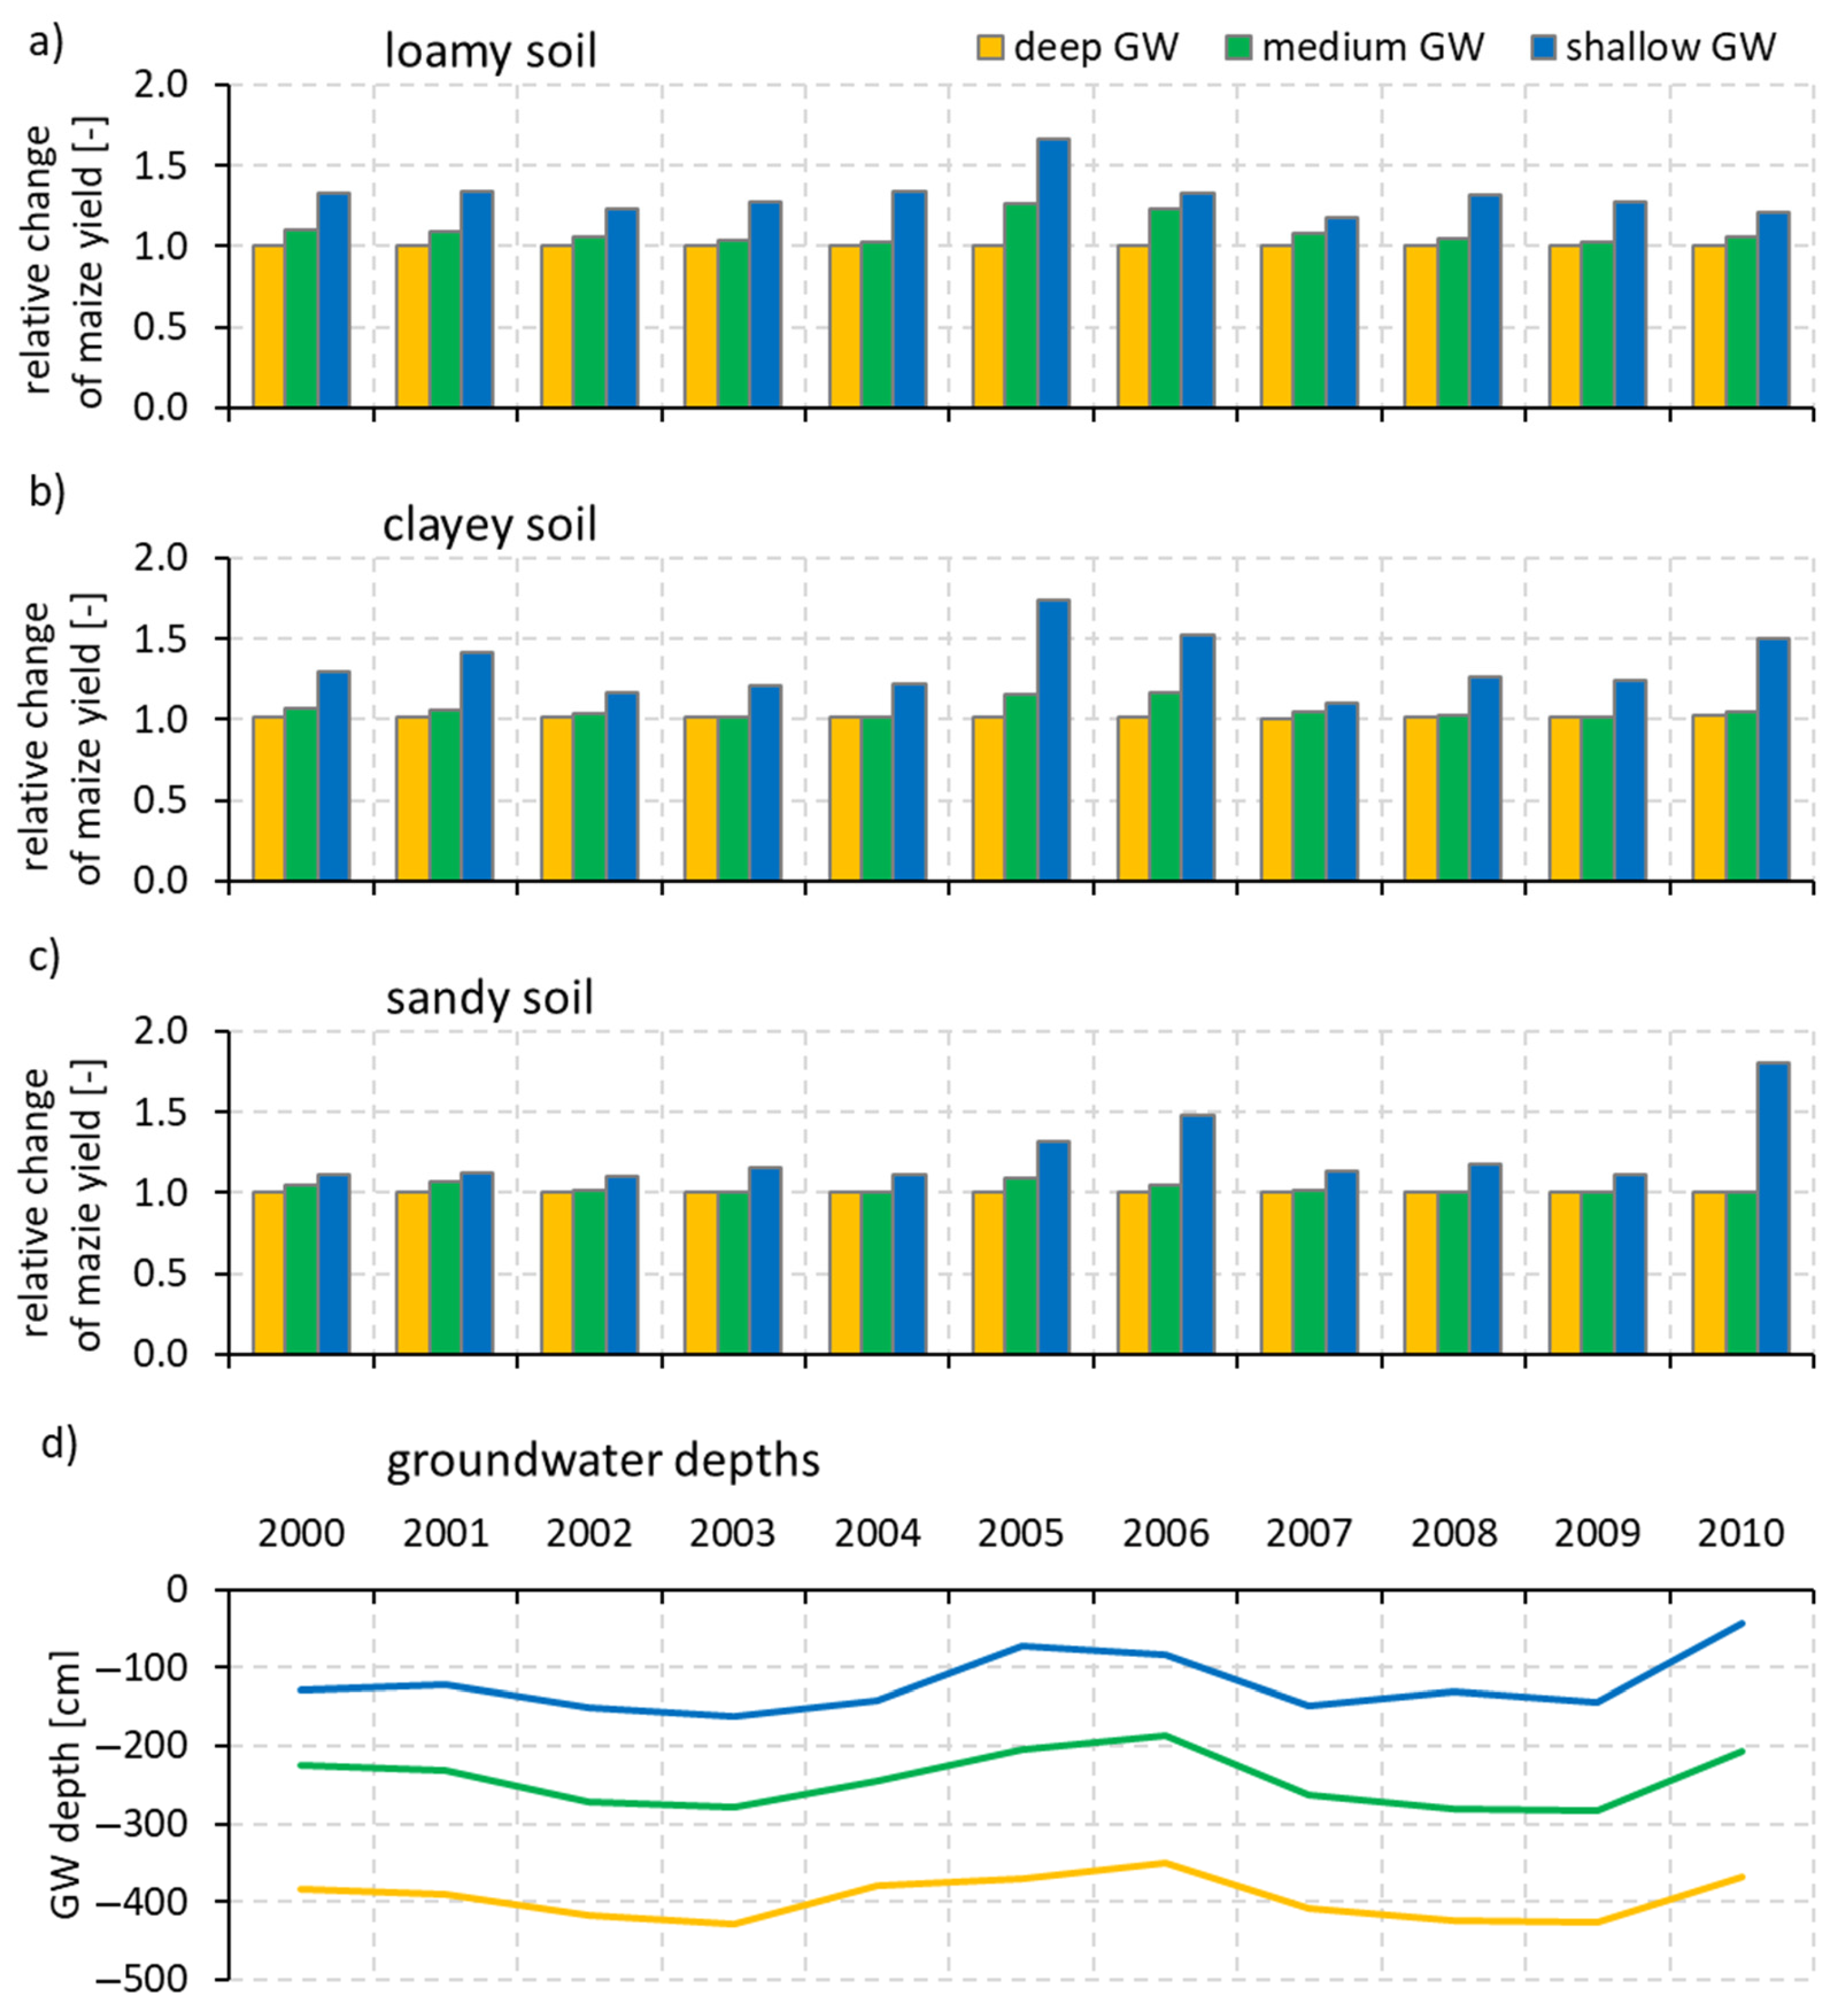
3.3. Crop Yield Results

Deep GW levels did not have a detectable effect on maize yields for any of the analyzed soil profiles, which can be attributed to the low capillarity of the homogeneous sand layer below 2 m (Figure 6) which prohibited the plants from utilizing groundwater.
Maize started to benefit from the availability of GW in the medium GW-depth scenario. The strongest effect was observable in the case of the loamy profile, where the high capillarity combined with a relatively good hydraulic conductivity allowed for the most root water uptake from groundwater and resulted in an average 9% crop-yield growth with only 3 years (2003, 2004, and 2009) when yield increase was lower than 5%. On the contrary, in the clayey and sandy profiles, GW could provide a considerable amount of water for root uptake only in years when GW levels were higher than the average (2000, 2001, 2005, 2006, and 2010); thus, crop-yield growth was lower (on average 6% and 3%, respectively) than for the loamy profile. The factors limiting moisture transfer from GW to the plants’ root zone were the low hydraulic conductivity of clay and the low capillarity of sand.
Maize yields increased by at least 10% in all years when the GW table was shallow and mean yield changes in the examined period were 32%, 35%, and 24% for the loamy, clayey, and sandy profiles, respectively. At the same time, differences in the change variances were considerable. While yield growth varied between 18% and 66% for the loamy profile, the range was wider in the case of clay (between 10% and 74%) and expanded further in the sandy profile, where the minimum growth was 10% and the maximum reached 81% in the extremely wet year of 2010 when record-high GW levels were measured in the area. These results suggest that maize grown in sand is the most sensitive to GW availability. Surprisingly, not the same year but 2005 brought the highest yield growth for loam and clay in the examined period. This unexpected result may be attributed to the complex interactions among water stress, nitrogen stress, and productivity.

4. Discussion

4.1. The Challenge of Lowland Hydrological Modelling

To put our results into context, hydrological modelling of drained lowland catchments is a challenging and complex task [69,76,77,78,79,80,81]. In general, calibration can be carried out for several hydrological variables; however, it is also limited by several factors which justify the relatively lower model accuracy. Though simulation of IEW is usually done with physically based models, there are still multiple adjustable, site-specific vegetation and soil parameters. The calibration of these parameters can potentially lead to model overfitting. The high time demand of the simulations technically hinders successful formal calibration and sensitivity analysis. This time constraint poses a limitation also for the applicable spatial resolution and/or spatial extent, as time demand increases exponentiated with cell number. In the case of mid- and large-sized catchments, this will lead to the necessary negligence of microtopography, a defining factor for infiltration, surface runoff, and storage and, in general, for hydrological and related environmental processes within lowland conditions [76,78]. Furthermore, in our analysis, data uncertainty was high, both for the input and for control variables. Hydrological applications of remote-sensing technology went through major improvements in recent years and became the dominant method for monitoring IEW but there are still challenges to improve classification accuracy [82]. The applied IEW hazard map based on satellite observations offers high spatial resolution and country-wide coverage but it has still uncertain information content [69]. Precise information on the drainage-network status and operation scheme was limited.
Taking all these factors into account, the introduced modelling aims to describe the general characteristics of hydrological behaviour in the catchment and not as a precise reproduction of recent processes. Furthermore, for the sake of manageable complexity, in the present conceptual study, we did not account for the small-scale, fine details of built infrastructure (i.e., settlements, transportation, industrial and recreational facilities, etc.), which pose obvious constraints to water management and landscape design. These discussed uncertainties and limitations of hydrological modelling can possibly propagate in a cascading manner through the whole process-based ES mapping methodology [83], which points out a major future research direction.

4.2. Comparison of Hydrological Scenarios

The reference scenario represented the current water-management practice aiming at cropland area maximization, while the two alternative scenarios have strong implications not only for provisioning but also regulating Ess; in the drought-prone GHP, water availability is a limiting factor for both crop production and tree growth. The major drought of 2022 not only underlined this [84] but also proved the limited capacity of the water-management sector to cope with this issue using only conventional methods. As part of a long-awaited paradigm change in Hungarian water management, water retention and groundwater recharge can positively influence these ES locally.
The comparison of the three simulated water-management scenarios allowed us to draw site-specific conclusions about the studied lowland hydrological regimes. The effect of the drainage network (EWR versus REF) turned out to be significant both for surface and subsurface hydrological conditions (Figure 2, Figure 3, Figure 4 and Figure 5). According to our calculations, the area affected by IEW would double without drainage and the subsurface storage would increase significantly with a volume equivalent to 7–9% of annual precipitation (Table 2).
This outcome deviates from our previous experience gained at other parts of the GHP, where the drainage channels had a lower capacity to influence IEW [69,79]. It also differs from the general experience of Hungarian water management which states that the drainage network has a significant influence only on IEW duration but not on maximal spatial extent [85]. This site-specific outcome can be explained by the different environmental conditions and underlines the diverse nature of lowland catchments and IEW processes within the GHP [38,86]. Channel network density can serve as an indirect empirical justification for this experience. The defence system was designed to maximize the proportion of arable land by draining as much area (including protected floodplains and wetlands) as possible by mostly using empirical design formulas. As a rule of thumb, the denser the drainage network, the less specific impact a single channel section has. While the average channel density is 2.31 km/km2 for the site in [69], ~1 km/km2 for the whole GHP and specifically also for the site in [79] and it is only 0.67 km/km2 for the Ohat study area, indicating the above average effectiveness of the local system. Considering the ES approach, this enhanced capacity of the drainage system is not only favourable from the perspective of a conventional water-management paradigm but may also serve as an opportunity for effective water retention and adaptive landscape management. This is also supported by another outcome of the analysis: the area of influence and the drawdown effect of the channels is relatively large in the case of the deep floodplain (Figure 4.) but—somewhat surprisingly—it is more limited in the case of the meander–terrace regions. In other words, the terrain morphology can partially serve as a natural water infrastructure to divert and buffer the temporal water surplus, resulting in a few well-defined, distinct regions with different hydrological regimes. This offers the potential for a more sustainable land management adapting to these inherent landscape characteristics by seeking ES synergies at the catchment scale [41,87].
According to the FLOOD–EWR scenario comparison, a moderate (33 million m3 or ~140 mm precipitation equivalent) and single deep floodplain inundation would not redraw the conditions achieved by continuous excess water retention over the simulated 11-year period. The flood water diverted to the catchment accumulates mostly in the depressions and contributes to subsurface recharge (Figure 2 and Figure 3). This is a favourable outcome as it indicates that the already IEW-affected areas would serve as a suitable buffer space, and only minimal land-use change would be required to support the additional riverine water retention. However, one must keep in mind that the FLOOD scenario accounted only for a single inundation event with moderate water volume. More extensive and/or more frequent inundations would obviously have more significant hydrological impacts. This points to the scalable nature of the proposed riverine water retention instead of a simple binary option (complete drainage and water diversion or full deep floodplain inundation), where the stakeholders and decisionmakers have the option to define the scale of water retention by weighing multiple factors.

4.3. Expected Changes in Crop Yields and Ecosystem Services

The results of the crop-yield simulations pointed out that maize yields in the higher elevation parts of the study area are limited by the amount of available water. In general terms, surplus water supplied by near-surface GW for maize can have a positive effect on maize production, an outcome supported by empirical data from Hungary [14]. Even though only a limited number of soil–GW combinations were simulated, our results suggest that maize-yield growth may reach some 30–35% in medium to deep GW areas if GW conditions would be ideal. These findings support our initial hypothesis that alterations of the present water governance aiming at water-retention-induced GW-level increase may enhance the provisioning ES of maize production lands in the vicinity of presumed wetlands.
However, contradictory effects (e.g., nitrogen deficiency) may amplify simultaneously with improving the water supply as a result of increasing soil moisture content in the plant’s root zone, which may limit yield growth. The outcomes of this analysis do not allow for well-founded conclusions in this regard and yet no optimal GW levels can be appointed for maize production. The effects of the complex and interacting processes of water, carbon, and nutrient flow on crop yields require indepth analyses, with a special focus on the role and importance of relevant model parameters. In the next step of our analysis, GW levels calculated with the hydrological model set up for the Ohat site will serve as bottom boundary conditions for the hydrological module of the Biome-BGSMuSo. This will allow a more detailed water management–land use scenario analysis and ES mapping at the study site.
Regarding our initial hypothesis, the calculations showed that the rising GW table may increase maize yields in these zones; hence, measures aiming at improving the GW supply of ecosystems may contribute to the provisioning ES of arable lands in the study area. At the same time, the current land use of the cultivated croplands in the topographical depressions would inevitably change and, therefore, presumably cut back the total crop production in the study area, raising the issue of ES trade-offs. While these areas usually have the lowest agroecological potential considering crop cultivation, these could offer other provisioning services (plant biomass, animal husbandry, etc.) as well as a series of enhanced regulating services (flood control, microclimate regulation, groundwater recharge, water quality control, gene pool, etc.). To consider all relevant information, the different land-use scenarios must be assessed in the ES framework involving detailed economic analyses to evaluate the trade-offs at study area scale. Only a few ES assessments of such complexity were made for the GHP. At a study site similar in size, Kozma et al. [69] showed that the water-retention approach would lead to a more beneficial outcome for the whole community compared to the current land use–water governance. According to Pinke et al. [41], if systematic water retention would be implemented at the GHP scale, the economic benefits of flood regulation alone could compensate the society for the loss of cropland area.

5. Conclusions

In the present study, we used hydrological modelling and crop-yield estimation to test our work hypothesis: wetland restoration would have a positive impact on provisioning ES through increased groundwater levels and better water availability. We showed that the simulation of surface–subsurface water movements in lowland catchments offers useful site-specific insights into the processes underlying different ES. Our detailed hydrological analysis of alternative water governance scenarios in the Ohat study area proved that retention of excess water in former wetlands and the release of floods from the Tisza River would have a significant effect on the groundwater regime, particularly in the adjacent zones of controlled inundations. The induced groundwater recharge would have the potential to moderately increase crop yields. With proper water governance, the hydrological effects are scalable and should be designed as part of a detailed land-use planning.

Author Contributions

Conceptualization, Z.K. (Zsolt Kozma), T.Á. and Z.P.; Data curation, Z.K. (Zsolt Kozma), D.H., M.Á. and P.K.; Formal analysis, Z.K. (Zsolt Kozma) and T.Á.; Funding acquisition, Z.P.; Methodology, Z.K. (Zsolt Kozma), T.Á. and D.H.; Project administration, Z.P.; Resources, Z.K. (Zsolt Kozma), M.K.K. and M.Á.; Software, Z.K. (Zsolt Kozma), T.Á. and D.H.; Validation, B.D., M.Á., Z.K. (Zoltán Kern) and Z.P.; Visualization, Z.K. (Zsolt Kozma), T.Á. and B.D.; Writing—original draft, Z.K. (Zsolt Kozma) and T.Á.; Writing—review and editing, B.D., M.K.K., D.H., P.K., Z.K. (Zoltán Kern) and Z.P. All authors have read and agreed to the published version of the manuscript.

Funding

The project FK20-134547 has been implemented with the support provided by the National Research, Development and Innovation Fund of Hungary.

Data Availability Statement

Data presented in this study are openly available at https://doi.org/10.6084/m9.figshare.23290907.v1 (accessed on 20 July 2023). Restrictions apply to the availability of some data used for this research. Satellite-image-based inland excess water hazard data was obtained from Lechner Nonprofit Kft. and are available at http://www.map.fomi.hu/copernicus/ (accessed on 20 July 2023) with the permission of Lechner Nonprofit Kft. Hydrological and hydrography data was obtained from Trans Tisza Water Directorate. A digital elevation model was obtained from the General Directorate of Water Management, Hungary.

Acknowledgments

We are grateful to the Lechner Nonprofit Kft., Department of Remote Sensing and Land Offices for providing us with their excess water hazard map based on satellite imagery for the study area. We also thank the data contribution of the Trans Tisza Water Directorate and the General Directorate of Water Management.

Conflicts of Interest

The authors declare no conflict of interest. The funders had no role in the design of the study; in the collection, analyses, or interpretation of data; in the writing of the manuscript; or in the decision to publish the results.

References

  1. Foley, J.A.; DeFries, R.; Asner, G.P.; Barford, C.; Bonan, G.; Carpenter, S.R.; Chapin, F.S.; Coe, M.T.; Daily, G.C.; Gibbs, H.K.; et al. Global Consequences of Land Use. Science 2005, 309, 570–574. [Google Scholar] [CrossRef] [PubMed] [Green Version]
  2. Xu, X.; Chen, M.; Yang, G.; Jiang, B.; Zhang, J. Wetland Ecosystem Services Research: A Critical Review. Glob. Ecol. Conserv. 2020, 22, e01027. [Google Scholar] [CrossRef]
  3. Zhao, Y.; Liu, Z.; Wu, J. Grassland Ecosystem Services: A Systematic Review of Research Advances and Future Directions. Landsc. Ecol. 2020, 35, 793–814. [Google Scholar] [CrossRef]
  4. Bennett, E.M.; Peterson, G.D.; Gordon, L.J. Understanding Relationships among Multiple Ecosystem Services. Ecol. Lett. 2009, 12, 1394–1404. [Google Scholar] [CrossRef]
  5. Fluet-Chouinard, E.; Stocker, B.D.; Zhang, Z.; Malhotra, A.; Melton, J.R.; Poulter, B.; Kaplan, J.O.; Goldewijk, K.K.; Siebert, S.; Minayeva, T.; et al. Extensive Global Wetland Loss over the Past Three Centuries. Nature 2023, 614, 281–286. [Google Scholar] [CrossRef]
  6. Biró, M.; Molnár, Z.; Öllerer, K.; Demeter, L.; Bölöni, J. Behind the General Pattern of Forest Loss and Gain: A Long-Term Assessment of Semi-Natural and Secondary Forest Cover Change at Country Level. Landsc. Urban Plan. 2022, 220, 104334. [Google Scholar] [CrossRef]
  7. Biró, M.; Bölöni, J.; Molnár, Z. Use of Long-term Data to Evaluate Loss and Endangerment Status of Natura 2000 Habitats and Effects of Protected Areas. Conserv. Biol. 2018, 32, 660–671. [Google Scholar] [CrossRef] [PubMed] [Green Version]
  8. Maes, J.; Crossman, N.D.; Burkhard, B. Mapping Ecosystem Services; Pensoft Publishers: Sofia, Bulgaria, 2018; ISBN 9789546428295. [Google Scholar]
  9. Kardos, M.K.; Clement, A. Predicting Small Water Courses’ Physico-Chemical Status from Watershed Characteristics with Two Multivariate Statistical Methods. Open Geosci. 2020, 12, 71–84. [Google Scholar] [CrossRef] [Green Version]
  10. Mitsch, W.J.; Bernal, B.; Hernandez, M.E. Ecosystem Services of Wetlands. Int. J. Biodivers. Sci. Ecosyst. Serv. Manag. 2015, 11, 1–4. [Google Scholar] [CrossRef] [Green Version]
  11. Davidson, N.C. How Much Wetland Has the World Lost? Long-Term and Recent Trends in Global Wetland Area. Mar. Freshw. Res. 2014, 65, 934–941. [Google Scholar] [CrossRef] [Green Version]
  12. Junk, W.J.; An, S.; Finlayson, C.M.; Gopal, B.; Květ, J.; Mitchell, S.A.; Mitsch, W.J.; Robarts, R.D. Current State of Knowledge Regarding the World’s Wetlands and Their Future under Global Climate Change: A Synthesis. Aquat. Sci. 2013, 75, 151–167. [Google Scholar] [CrossRef] [Green Version]
  13. Kingsford, R.T.; Basset, A.; Jackson, L. Wetlands: Conservation’s Poor Cousins. Aquat. Conserv. Mar. Freshw. Ecosyst. 2016, 26, 892–916. [Google Scholar] [CrossRef] [Green Version]
  14. Pinke, Z.; Decsi, B.; Kozma, Z.; Vári, Á.; Lövei, G.L.L. A Spatially Explicit Analysis of Wheat and Maize Yield Sensitivity to Changing Groundwater Levels in Hungary, 1961–2010. Sci. Total Environ. 2020, 715, 136555. [Google Scholar] [CrossRef]
  15. Flyvbjerg, B.; Bruzelius, N.; Rothengatter, W. Megaprojects and Risk: An Anatomy of Ambition; Cambridge University Press: Cambridge, UK, 2003; ISBN 9780521009461. [Google Scholar]
  16. Wing, O.E.J.; Bates, P.D.; Smith, A.M.; Sampson, C.C.; Johnson, K.A.; Fargione, J.; Morefield, P. Estimates of Present and Future Flood Risk in the Conterminous United States. Environ. Res. Lett. 2018, 13, 34023. [Google Scholar] [CrossRef]
  17. Evans, A.E.V.; Mateo-Sagasta, J.; Qadir, M.; Boelee, E.; Ippolito, A. Agricultural Water Pollution: Key Knowledge Gaps and Research Needs. Curr. Opin. Environ. Sustain. 2019, 36, 20–27. [Google Scholar] [CrossRef]
  18. Sharpley, A.N.; Bergström, L.; Aronsson, H.; Bechmann, M.; Bolster, C.H.; Börling, K.; Djodjic, F.; Jarvie, H.P.; Schoumans, O.F.; Stamm, C.; et al. Future Agriculture with Minimized Phosphorus Losses to Waters: Research Needs and Direction. Ambio 2015, 44, 163–179. [Google Scholar] [CrossRef] [Green Version]
  19. Mateo-Sagasta, J.; Zadeh, S.M.; Turral, H.; Burke, J. Water Pollution from Agriculture: A Global Review. Executive Summary; Pensoft Publishers: Sofia, Bulgaria, 2017. [Google Scholar]
  20. Gulbin, S.; Kirilenko, A.P.; Kharel, G.; Zhang, X. Wetland Loss Impact on Long Term Flood Risks in a Closed Watershed. Environ. Sci. Policy 2019, 94, 112–122. [Google Scholar] [CrossRef]
  21. Donnelly, J.P.; Moore, J.N.; Casazza, M.L.; Coons, S.P. Functional Wetland Loss Drives Emerging Risks to Waterbird Migration Networks. Front. Ecol. Evol. 2022, 10, 844278. [Google Scholar] [CrossRef]
  22. Were, D.; Kansiime, F.; Fetahi, T.; Cooper, A.; Jjuuko, C. Carbon Sequestration by Wetlands: A Critical Review of Enhancement Measures for Climate Change Mitigation. Earth Syst. Environ. 2019, 3, 327–340. [Google Scholar] [CrossRef]
  23. Verhoeven, J.T.A.; Setter, T.L. Agricultural Use of Wetlands: Opportunities and Limitations. Ann. Bot. 2010, 105, 155–163. [Google Scholar] [CrossRef] [Green Version]
  24. Ferraz, G.; Krámer, T. Surface Water–Groundwater Interactions and Bank Storage during Flooding: A Review. Period. Polytech. Civ. Eng. 2022, 66, 149–163. [Google Scholar] [CrossRef]
  25. Cui, B.; Yang, Q.; Yang, Z.; Zhang, K. Evaluating the Ecological Performance of Wetland Restoration in the Yellow River Delta, China. Ecol. Eng. 2009, 35, 1090–1103. [Google Scholar] [CrossRef]
  26. Scholte, S.S.K.; Todorova, M.; van Teeffelen, A.J.A.; Verburg, P.H. Public Support for Wetland Restoration: What Is the Link With Ecosystem Service Values? Wetlands 2016, 36, 467–481. [Google Scholar] [CrossRef] [Green Version]
  27. Crespin, S.J.; Simonetti, J.A. Reconciling Farming and Wild Nature: Integrating Human–Wildlife Coexistence into the Land-Sharing and Land-Sparing Framework. Ambio 2019, 48, 131–138. [Google Scholar] [CrossRef]
  28. Young, J.; Watt, A.; Nowicki, P.; Alard, D.; Clitherow, J.; Henle, K.; Johnson, R.; Laczko, E.; McCracken, D.; Matouch, S.; et al. Towards Sustainable Land Use: Identifying and Managing the Conflicts between Human Activities and Biodiversity Conservation in Europe. Biodivers. Conserv. 2005, 14, 1641–1661. [Google Scholar] [CrossRef]
  29. Decsi, B.; Vári, Á.; Kozma, Z. The Effect of Future Land Use Changes on Hydrologic Ecosystem Services: A Case Study from the Zala Catchment, Hungary. Biol. Futur. 2020, 71, 405–418. [Google Scholar] [CrossRef]
  30. Seddon, N.; Smith, A.; Smith, P.; Key, I.; Chausson, A.; Girardin, C.; House, J.; Srivastava, S.; Turner, B. Getting the Message Right on Nature-Based Solutions to Climate Change. Glob. Chang. Biol. 2021, 27, 1518–1546. [Google Scholar] [CrossRef] [PubMed]
  31. Kabisch, N.; Frantzeskaki, N.; Pauleit, S.; Naumann, S.; Davis, M.; Artmann, M.; Haase, D.; Knapp, S.; Korn, H.; Stadler, J.; et al. Nature-Based Solutions to Climate Change Mitigation and Adaptation in Urban Areas. Ecol. Soc. 2016, 21, 39. [Google Scholar] [CrossRef] [Green Version]
  32. Vári, Á.; Kozma, Z.; Pataki, B.; Jolánkai, Z.; Kardos, M.; Decsi, B.; Pinke, Z.; Jolánkai, G.; Pásztor, L.; Condé, S.; et al. Disentangling the Ecosystem Service ‘Flood Regulation’: Mechanisms and Relevant Ecosystem Condition Characteristics. Ambio 2022, 51, 1855–1870. [Google Scholar] [CrossRef]
  33. Cook, H.F. Floodplain Agricultural Systems: Functionality, Heritage and Conservation. J. Flood Risk Manag. 2010, 3, 192–200. [Google Scholar] [CrossRef]
  34. Levintal, E.; Kniffin, M.L.; Ganot, Y.; Marwaha, N.; Murphy, N.P.; Dahlke, H.E. Agricultural Managed Aquifer Recharge (Ag-MAR)—A Method for Sustainable Groundwater Management: A Review. Crit. Rev. Environ. Sci. Technol. 2023, 53, 291–314. [Google Scholar] [CrossRef]
  35. Somogyi, S. Természeti És Társadalmi Hatások a Duna Mai Vízrendszerében (Natural and Social Impacts in Catchment of Danube). Hung. Geogr. Bull. Értesítő 2001, 50, 299–310. [Google Scholar]
  36. Schindler, S.; O’Neill, F.H.; Biró, M.; Damm, C.; Gasso, V.; Kanka, R.; van der Sluis, T.; Krug, A.; Lauwaars, S.G.; Sebesvari, Z.; et al. Multifunctional Floodplain Management and Biodiversity Effects: A Knowledge Synthesis for Six European Countries. Biodivers. Conserv. 2016, 25, 1349–1382. [Google Scholar] [CrossRef] [Green Version]
  37. Schils, R.; Olesen, J.E.; Kersebaum, K.-C.; Rijk, B.; Oberforster, M.; Kalyada, V.; Khitrykau, M.; Gobin, A.; Kirchev, H.; Manolova, V.; et al. Cereal Yield Gaps across Europe. Eur. J. Agron. 2018, 101, 109–120. [Google Scholar] [CrossRef]
  38. Bozán, C.; Takács, K.; Körösparti, J.; Laborczi, A.; Túri, N.; Pásztor, L. Integrated Spatial Assessment of Inland Excess Water Hazard on the Great Hungarian Plain. Land Degrad. Dev. 2018, 29, 4373–4386. [Google Scholar] [CrossRef]
  39. Mezősi, G.; Bata, T.; Meyer, B.C.; Blanka, V.; Ladányi, Z. Climate Change Impacts on Environmental Hazards on the Great Hungarian Plain, Carpathian Basin. Int. J. Disaster Risk Sci. 2014, 5, 136–146. [Google Scholar] [CrossRef] [Green Version]
  40. Murányi, G.; Koncsos, L. Analysis of Nature Based Flood Management in the Tisza River Valley, Hungary. Pollack Period. 2022, 17, 83–88. [Google Scholar] [CrossRef]
  41. Pinke, Z.; Kiss, M.; Lövei, G.L. Developing an Integrated Land Use Planning System on Reclaimed Wetlands of the Hungarian Plain Using Economic Valuation of Ecosystem Services. Ecosyst. Serv. 2018, 30, 299–308. [Google Scholar] [CrossRef]
  42. Ungvári, G. Combining Flood Risk Mitigation and Carbon Sequestration to Optimize Sustainable Land Management Schemes: Experiences from the Middle-Section of Hungary’s Tisza River. Land 2022, 11, 985. [Google Scholar] [CrossRef]
  43. Honti, M.; Gao, C.; Istvánovics, V.; Clement, A. Lessons Learnt from the Long-Term Management of a Large (Re)Constructed Wetland, the Kis-Balaton Protection System (Hungary). Water 2020, 12, 659. [Google Scholar] [CrossRef] [Green Version]
  44. Warachowska, W.; Ungvári, G.; Kis, A.; Matczak, P.; Zwoliński, Z. Social, Economic, and Legal Aspects of Polder Implementation for Flood Risk Management in Poland and Hungary. J. Flood Risk Manag. 2023, e12897. [Google Scholar] [CrossRef]
  45. Tölgyesi, C.; Hábenczyus, A.A.; Kelemen, A.; Török, P.; Valkó, O.; Deák, B.; Erdős, L.; Tóth, B.; Csikós, N.; Bátori, Z. How to Not Trade Water for Carbon with Tree Planting in Water-Limited Temperate Biomes? Sci. Total Environ. 2023, 856, 158960. [Google Scholar] [CrossRef]
  46. Kern, A.; Barcza, Z.; Marjanović, H.; Árendás, T.; Fodor, N.; Bónis, P.; Bognár, P.; Lichtenberger, J. Statistical Modelling of Crop Yield in Central Europe Using Climate Data and Remote Sensing Vegetation Indices. Agric. For. Meteorol. 2018, 260–261, 300–320. [Google Scholar] [CrossRef]
  47. Pinke, Z.; Decsi, B.; Kardos, M.K.; Kern, Z.; Kozma, Z.; Pásztor, L.; Ács, T. Changing Patterns of Soil Water Content and Relationship with National Wheat and Maize Production in Europe. Eur. J. Agron. 2022, 140, 126579. [Google Scholar] [CrossRef]
  48. Salem, A.; Abduljaleel, Y.; Dezső, J.; Lóczy, D. Integrated Assessment of the Impact of Land Use Changes on Groundwater Recharge and Groundwater Level in the Drava Floodplain, Hungary. Sci. Rep. 2023, 13, 5061. [Google Scholar] [CrossRef]
  49. Mezősi, G. The Physical Geography of Hungary; Springer International Publishing: Berlin/Heidelberg, Germany, 2017; ISBN 978-3-319-45182-4. [Google Scholar]
  50. Timár, G.; Gábris, G. Estimation of Water Conductivity of the Natural Flood Channels on the Tisza Flood-Plain, the Great Hungarian Plain. Geomorphology 2008, 98, 250–261. [Google Scholar] [CrossRef]
  51. Rónai, A. The Quaternary of the Great Hungarian Plain. Geol. Hung.-Ser. Geol. 1985, 21, 413–445. [Google Scholar]
  52. Timár, G.; Molnár, G.; Székely, B.; Biszak, S.; Varga, J.; Jankó, A. Digitized Maps of the Habsburg Empire—The Map Sheets of the Second Military Survey and Their Georeferenced Version; Arcanum: Budapest, Hungary, 2006; ISBN 963-7374-33-7. [Google Scholar]
  53. Lechner Knowledge Centre Regional. Databases of Copernicus Land Monitoring Services. Available online: https://lechnerkozpont.hu/en/oldal/copernicus-land-monitoring (accessed on 21 January 2023).
  54. Kiss, C.L.; Gribovszki, Z.; Pinke, Z.; Ács, T.; Kozma, Z.; Kalicz, P. Groundwater Uptake Dynamics of a Lowland Oak Forest in the Great Hungarian Plain. In Proceedings of the EGU General Assembly 2022, Vienna, Austria, 23–28 April 2022. [Google Scholar]
  55. Refsgaard, J.C.; Erlich, M.; Bathurst, J. Hydroinformatics Impact on Hydrological Modelling. In Michael Abbott’s Hydroinformatics Poiesis New Relationships with Water; IWA Publishing: London, UK, 2022; pp. 45–56. [Google Scholar]
  56. General Directorate of Water Management Digital Elevation Model Data Communication; General Directorate of Water Management: Budapest, Hungary, 2003.
  57. Hungarian Meteorological Service Meteorological Database, OMSZ. Available online: https://odp.met.hu/ (accessed on 21 January 2023).
  58. Trans Tisza Water Directorate (TIVIZIG) Hydrographical Data Communication; Online Data Transfer; Trans Tisza Water Directorate Intranet: Lower-Tisza, Hungary, 2021.
  59. Szilágyi, J.; Kovács, Á. Complementary-Relationship-Based Evapotranspiration Mapping (Cremap) Technique for Hungary. Period. Polytech. Civ. Eng. 2010, 54, 95–100. [Google Scholar] [CrossRef]
  60. Anda, A.; da Silva, J.A.T.; Soos, G. Evapotranspiration and Crop Coefficient of Common Reed at the Surroundings of Lake Balaton, Hungary. Aquat. Bot. 2014, 116, 53–59. [Google Scholar] [CrossRef]
  61. Breuer, L.; Eckhardt, K.; Frede, H.G. Plant Parameter Values for Models in Temperate Climates. Ecol. Modell. 2003, 169, 237–293. [Google Scholar] [CrossRef]
  62. DHI. Mike She User Manual; Reference Guide; DHI: Kuala Lumpur, Malaysia, 2007; Volume 2. [Google Scholar]
  63. Van Genuchten, M.T. A Closed-Form Equation for Predicting the Hydraulic Conductivity of Unsaturated Soils. Soil Sci. Soc. Am. J. 1980, 44, 892–898. [Google Scholar] [CrossRef] [Green Version]
  64. Bakacsi, Z.; Kuti, L.; Pásztor, L.; Vatai, J.; Szabó, J.; Müller, T. Method for the Compilation of a Stratified and Harmonized Soil Physical Database Using Legacy and Up-to-Date Data Sources. Agrokémia Talajt. 2010, 59, 39–46. [Google Scholar] [CrossRef]
  65. Pásztor, L.; Laborczi, A.; Takács, K.; Illés, G.; Szabó, J.; Szatmári, G. Progress in the Elaboration of GSM Conform DSM Products and Their Functional Utilization in Hungary. Geoderma Reg. 2020, 21, e00269. [Google Scholar] [CrossRef]
  66. Kozma, Z.; Decsi, B.; Ács, T.; Kardos, M.K.; Pinke, Z.; Pásztor, L.; Laborczi, A.; Szabó, B. Structural heterogeneity versus functional homogeneity—Soil profile classification at a hungarian lowland site. In Proceedings of the GeoMATES ’22 International Congress on Geomathematics in Earth- and Environmental Sciences: The 22nd Congress of Hungarian Geomathematicians; Hatvani, I.G., Erdélyi, D., Fedor, F., Eds.; MTA Pécsi Akadémiai Bizottság (MTA PAB): Pécs, Hungary, 2022; p. 48. [Google Scholar]
  67. Makó, A.; Tóth, B.; Hernádi, H.; Farkas, C.; Marth, P. Introduction of the Hungarian Detailed Soil Hydrophysical Database (MARTHA) and Its Use to Test External Pedotransfer Functions. Agrokémia Talajt. 2010, 59, 29–38. [Google Scholar] [CrossRef] [Green Version]
  68. Harmel, R.D.; Baffaut, C.; Douglas-Mankin, K. Review and Development of ASABE Engineering Practice 621: “Guidelines for Calibrating, Validating, and Evaluating Hydrologic and Water Quality Models”. Trans. ASABE 2018, 61, 1393–1401. [Google Scholar] [CrossRef]
  69. Kozma, Z.; Jolánkai, Z.; Kardos, M.K.; Muzelák, B.; Koncsos, L. Adaptive Water Management-Land Use Practice for Improving Ecosystem Services—A Hungarian Modelling Case Study. Period. Polytech. Civ. Eng. 2022, 66, 256–268. [Google Scholar] [CrossRef]
  70. Koncsos, L.; Balogh, E. Flood Damage Calculation Supported by Inundation Model in the Tisza Valley. In Proceedings of the 32nd Congress of the International Association of Hydrolic Engineering and Research; Di Silvio, G., Stefano, L., Eds.; IAHR: Venice, Italy, 2007; p. 10. [Google Scholar]
  71. Derts, Z.; Koncsos, L. Ecosystem Services and Land Use Zonation in the Hungarian Tisza Deep Floodplains. Pollack Period. 2012, 7, 79–90. [Google Scholar] [CrossRef]
  72. Hidy, D.; Barcza, Z.; Haszpra, L.; Churkina, G.; Pintér, K.; Nagy, Z. Development of the Biome-BGC Model for Simulation of Managed Herbaceous Ecosystems. Ecol. Modell. 2012, 226, 99–119. [Google Scholar] [CrossRef]
  73. Hidy, D.; Barcza, Z.; Hollós, R.; Dobor, L.; Ács, T.; Zacháry, D.; Filep, T.; Pásztor, L.; Incze, D.; Dencső, M.; et al. Soil-Related Developments of the Biome-BGCMuSo v6.2 Terrestrial Ecosystem Model. Geosci. Model Dev. 2022, 15, 2157–2181. [Google Scholar] [CrossRef]
  74. Office, H.C.S. Cereals by County and Region. Available online: https://www.ksh.hu/stadat_files/mez/hu/mez0070.html (accessed on 21 January 2023).
  75. Fodor, N.; Pásztor, L.; Szabó, B.; Laborczi, A.; Pokovai, K.; Hidy, D.; Hollós, R.; Kristóf, E.; Kis, A.; Dobor, L.; et al. Input Database Related Uncertainty of Biome-BGCMuSo Agro-Environmental Model Outputs. Int. J. Digit. Earth 2021, 14, 1582–1601. [Google Scholar] [CrossRef]
  76. Jolánkai, Z.; Koncsos, L. The Effects of Terrain Morphology Model on Excess Water Inundation and Phosphorus Transport Modeling. J. Environ. Sci. Eng. B 2013, 2, 728–735. [Google Scholar]
  77. Právetz, T.; Sipos, G.; Benyhe, B.; Blanka, V. Modelling Runoff on a Small Lowland Catchment, Hungarian Great Plains. J. Environ. Geogr. 2015, 8, 49–58. [Google Scholar] [CrossRef] [Green Version]
  78. Van Leeuwen, B.; Právetz, T.; Liptay, Z.Á.; Tobak, Z. Physically Based Hydrological Modelling of Inland Excess Water. Carpathian J. Earth Environ. Sci. 2016, 11, 497–510. [Google Scholar]
  79. Ungvári, G.; Jolánkai, Z.; Kis, A.; Kozma, Z. The Feasibility of Cooperation to Comply with Land Use Change Obligations in the Marosszög Area of South Hungary. J. Environ. Geogr. 2018, 11, 37–47. [Google Scholar] [CrossRef] [Green Version]
  80. Tran Quang, H.; Zoltán Fehér, Z. Estimation of the Water Regime under Different Climate Scenarios and the Importance of the Thoroughness of the Soil as Input Layer in a Small Watershed in Central-Hungary. Vietnam. J. Hydrometeorol. 2022, 3, 39–56. [Google Scholar] [CrossRef]
  81. Guillaumot, L.; Smilovic, M.; Burek, P.; de Bruijn, J.; Greve, P.; Kahil, T.; Wada, Y. Coupling a Large-Scale Hydrological Model (CWatM v1.1) with a High-Resolution Groundwater Flow Model (MODFLOW 6) to Assess the Impact of Irrigation at Regional Scale. Geosci. Model Dev. 2022, 15, 7099–7120. [Google Scholar] [CrossRef]
  82. Kajári, B.; Bozán, C.; Van Leeuwen, B. Monitoring of Inland Excess Water Inundations Using Machine Learning Algorithms. Land 2023, 12, 36. [Google Scholar] [CrossRef]
  83. Faramarzi, M.; Khalili, P.; Zaremehrjardy, M.; Silwal, G.; Masud, M.B. The Cascade of Uncertainties in Agro-Hydrological Model Projections: Implications for Future Water-Food Nexus in Snow-Dominated Regions. In Proceedings of the AGU Fall Meeting Abstracts, San Francisco, CA, USA, 1 December 2019; Volume 2019, p. H31M-1919. [Google Scholar]
  84. Mohammed, S.; Alsafadi, K.; Enaruvbe, G.O.; Bashir, B.; Elbeltagi, A.; Széles, A.; Alsalman, A.; Harsanyi, E. Assessing the Impacts of Agricultural Drought (SPI/SPEI) on Maize and Wheat Yields across Hungary. Sci. Rep. 2022, 12, 8838. [Google Scholar] [CrossRef]
  85. Bíró, T. A Hazai Belvízkutatás Néhány Időszerű Kérdése. Hungarian J. Hydrol. 2016, 96, 5–12. [Google Scholar]
  86. Barta, K.; Bata, T.; Benyhe, B.; Miograd, B. Inland Excess Water; University of Szeged–University u Novi Sadu: Belgrade, Serbia, 2013; ISBN 9789633062630. [Google Scholar]
  87. Balogh, P. The Concept of Floodplain Landscape Management (Preliminary Proposal)—Az Ártéri Tájgazdálkodás Koncepciója (Előleges Javaslat). Földrajzi Közlemények 2001, 3, 249–270. (In Hungarian) [Google Scholar]
Figure 1. Overview map of the study area.
Sustainability 15 11700 g001
Figure 2. Maps of the observed and simulated surface-water coverage: (a) frequency of IEW over the 1998–2016 period on satellite observations. (b) simulated reference (REF) scenario; (c) simulated excess water retention (EWR) scenario, (d) simulated floodplain inundation (FLOOD) scenario. Nonagricultural areas were masked with grey (settlements, forests, wetlands, and standing waters).
Sustainability 15 11700 g002
Figure 3. Increase in average groundwater levels (a) the scenario of excess water retention (EWR) compared to the reference (REF) scenario; (b) and the scenario of floodplain inundation (FLOOD) compared to the EWR scenario. Blackish colours indicate areas where the average GW level increased.
Sustainability 15 11700 g003
Figure 4. Temporal average of groundwater levels for the three scenarios along (a) Section line 1 illustrating a deep part of the study area and (b) Section line 2 presenting the conditions of terraces and meanders.
Sustainability 15 11700 g004
Figure 5. Time series of GW levels at two locations of the study area (a) a moderately deep floodplain region with cropland and (b) the edge of a terrace region at the Ohat steppic oak forest. Vertical grey lines indicate the timing of riverine inundation in 2003.
Sustainability 15 11700 g005
Figure 6. Effect of groundwater on maize yield for profiles with (a) loamy topsoil, (b) clayey topsoil, and (c) sandy topsoil, and (d) the groundwater levels for the 3 groundwater scenarios. Relative changes in maize yield are expressed as the ratio of calculated yields for the model variants with groundwater bottom boundaries and the reference case with free drainage.
Sustainability 15 11700 g006
Table 1. Results of model adjustment. Inland excess water hazard map accuracy was calculated on a 10 m cell basis (aligned to the satellite-based dataset). For groundwater levels, the first numbers are the averages, while the numbers in curly brackets are the ranges for 11 monitoring wells. NSE—Nash–Sutcliffe efficiency; RMSE—root mean square error; R2—square of Pearson correlation coefficient.
Inland Excess Water hazard map accuracyagreement72.5%
difference27.5%
Annual actual evapotranspirationsim/act ratio0.95
Pumped water volumesim/act ratio0.66
Groundwater levelsNSE0.39 {−2.16; 0.72}
RMSE0.38 m {0.29 m; 0.57 m}
R20.89 {0.70; 0.95}
Table 2. Difference between the reference and alternative scenarios’ groundwater levels and groundwater storages.
Compared
Scenarios
Excess Water Retention (EWR) versus Reference (REF)Floodplain Inundation (FLOOD) versus Reference (REF)
Compared
Variables
GW-Level
Difference [m]
GW Storage Difference
[106 m3]
GW-Level
Difference [m]
GW-Storage
Difference
[106 m3]
MeanStandard DeviationMeanStandard Deviation
Section line 10.240.1310.10.460.1312.9
Section line 20.310.230.350.24
Study area0.540.430.630.46
Disclaimer/Publisher’s Note: The statements, opinions and data contained in all publications are solely those of the individual author(s) and contributor(s) and not of MDPI and/or the editor(s). MDPI and/or the editor(s) disclaim responsibility for any injury to people or property resulting from any ideas, methods, instructions or products referred to in the content.

