

The Impact of Service Quality on Customer Loyalty through Customer Satisfaction in Mobile Social Media

College of Business, Seoul National University, Gwanak-ro 1, Gwanak-gu, Seoul 08826, Republic of Korea
*
Author to whom correspondence should be addressed.
Sustainability 2023, 15(14), 11214; https://doi.org/10.3390/su151411214
Submission received: 21 June 2023
/
Revised: 13 July 2023
/
Accepted: 17 July 2023
/
Published: 18 July 2023
(This article belongs to the Special Issue Sustainability Marketing: Customer Satisfaction and Brand Equity)
Abstract
:In today’s emerging and competitive mobile social media market, companies continuously endeavor to improve service quality and customer satisfaction in order to gain a competitive advantage and ensure long-term sustainability. The objective of this study is to identify the relationship between service quality, customer satisfaction, and customer loyalty in mobile social media. Moreover, this study examines the role of customer satisfaction as a mediator. The proposed research model consists of four dimensions of mobile service quality (usefulness, convenience, design, and security/privacy) as well as customer satisfaction and customer loyalty. The survey used the self-administrated method. A total of 256 responses were used in the data analysis. We estimated the hypothesized relationships of the research model using a structural equation modeling technique. The results are as follows: first, usefulness, convenience, design, and security/privacy significantly and positively affect customer satisfaction. Second, customer satisfaction has a significant and positive impact on customer loyalty. Third, customer satisfaction mediates the relationship between service quality and customer loyalty; in particular, convenience, design, and security/privacy are completely mediated while usefulness is partially mediated. These results can serve as a valuable reference for mobile social media providers to manage services and improve service quality and customer satisfaction.
1. Introduction
The smartphone market has experienced steady growth in recent years, becoming increasingly prevalent as people rely on smartphones for various tasks, including communication, gaming, navigation, and social networking. ResearchAndMarkets.com [1] reported that the smartphone market reached a volume of 1277.70 million units in 2022. The report also projects a Compound Annual Growth Rate (CAGR) of 3.5% for the market, with an estimated volume of approximately 1570.62 million units by 2028.
People use smartphones to connect with people both locally and globally through their social networks. Social networks are online platforms that allow people to connect and share information with others [2,3]. Social networks offer numerous advantages, such as the ability to connect with people worldwide, to share information quickly and easily, and to discover new opportunities for personal and professional growth [4]. However, there are also some disadvantages to using social networks. One of the primary concerns is privacy. Social networks have the potential to collect users’ personal information, which can then be used for targeted advertising or other purposes [4].
With the popularization of smartphone use, the social network or social media market is rapidly expanding, and the number of companies providing relevant services is increasing. As the market has recently become consumer-centered, users have been demanding improvements in service quality (SQ), service variety, and customization with consideration of their preferences. They also want to enhance their security and privacy in mobile environments. Meanwhile, companies are interested in SQ and customer satisfaction (CS) as ways to respond to customer needs and secure a competitive advantage and ensure sustainability.
SQ, CS, and customer loyalty (CL) are three variables permanently associated with electronic commerce. SQ is defined as the extent to which a website facilitates efficient and effective shopping, purchasing, and delivery [5]. CS is the degree to which a customer is satisfied with a product or service [6]. CL is the willingness of a customer to continue doing business with a company [7]. The three variables are interconnected. SQ is a crucial factor affecting CS and is closely related to company performance. Improving SQ enhances CS, increases CL, and reduces brand switching. The higher the CL, the more transactions occur, and the longer the relationship period with customers [8]. If customer lifetime value increases, companies can secure a stable customer base, reduce marketing costs, and increase price premiums. Loyal customers do not easily fall for competitors’ promotional strategies, and they contribute to company sales and profits by frequently purchasing products or using services and spreading positive word-of-mouth. Therefore, a company with many loyal customers can maintain its competitiveness even in highly competitive situations [9].
Prior research on SQ and CS has been conducted in various fields [10,11,12,13]. SQ is a primary factor of CS, and CS is a leading variable of CL [8,14]. However, these results are not easily applicable to social media as limited research has been conducted on SQ and CS in the context of social media. In particular, mobile social media is utilized on small devices that provide a user experience that differs from that offered by prevalent computer-based services. In addition, mobile social media requires high-quality privacy and security because users can easily and quickly share and spread information with various other users. These differences may lead to variations in results and thus require further validation. The current research on SQ and CS attempts to fill the research gap. Herein, we mainly consider CS as a mediator of SQ and CL.
The proposed research model consists of four dimensions of mobile service quality (usefulness, convenience, design, and security/privacy), customer satisfaction, and customer loyalty. The model is built upon a combination/extension of the Loyalty Model [6] and SERVQUAL [15,16]. In this study, the research questions focus on which SQ dimensions significantly affect CS and CL, and whether CS significantly mediates between SQ and CL.
This study has three objectives: (1) to design a scale for measuring the SQ of mobile social media, (2) to identify the structural relationship between SQ, CS, and CL, and (3) to examine the role of CS as a mediator. This study contributes as follows. First, it suggests a scale for measuring the SQ of mobile social media. Second, it is the first study to provide valuable insights into the importance of SQ as a critical factor in driving CS and CL in the context of social media. Finally, it is also the first study to examine the mediating role of CS in the mobile context. Our results can serve as a helpful reference for establishing service strategies and policies for mobile social media.
The following parts of this paper are organized as follows: first, we describe the literature review of the study. Second, we propose our research model and hypotheses. Third, we perform empirical analysis with data. Finally, we discuss the research results and implications of our study.
2. Literature Review
2.1. Mobile Social Media
Social media is a network service that allows people to simultaneously connect and share information with anyone and with multiple people all over the world. With social media, users can perform various activities, including posting reviews, photo/video sharing, blogging, social gaming, and social networking. It is used to keep in touch with family or friends, find people with similar interests, and share one’s thoughts and feelings [17]. Representative social media networks include YouTube, Facebook, Snapchat, Instagram, and Twitter. The popularization of smartphones has led to the broad use of social media on personal smartphones, which are mobile environments, rather than desktop computers.
Mobile social media has the following features. First, users can access services anytime and anywhere. They can also conveniently produce information without requiring professional skills. Second, users can check the online status of other users and interact through an immediate connection if necessary. Third, users can easily share information and opinions with other users and spread them quickly. Fourth, users can strengthen their social relationships through their participation in various communities. Finally, users can decide whether to maintain relationships with others through various reputation systems, such as the number of friends and favorite lists [18].
2.2. Mobile Service Quality
As customers evaluate SQ, perceived quality is more important than absolute quality. Parasuraman et al. [16] defined SQ as an overall judgment or attitude related to the excellence or superiority of a service. They mentioned that the difference between expectations and performance determines SQ. Furthermore, they proposed SERVQUAL, which reflects the concept of “performance expectation”, with five dimensions for measuring SQ: reliability, responsiveness, empathy, assurance, and tangibles. Cronin and Taylor [14] mentioned that the difference between performance and expectations is not an appropriate way to measure SQ. They suggested SERVPERF, which reflects the concept that “service quality is performance”. Various scales applying the SERVEQUAL were later proposed in succeeding research.
As internet services have prospered, e-service quality measurements reflecting the characteristics of the internet have been widely studied. Wolfinbarger and Gilly [19] developed EtailQ with four dimensions: fulfillment/reliability, website design, customer service, and security/privacy. Parasuraman et al. [5] presented two scales: E-S-QUAL, with four dimensions (efficiency, fulfillment, system availability, and privacy), for website SQ, and E-Res-QUAL, with three dimensions (compensation, responsiveness, and contact), for recovery SQ. These scales have been used in various studies for e-service quality evaluation.
With the increasing popularity of mobile services, mobile SQ measurement reflecting the characteristics of mobile devices, such as mobility, anytime and anywhere computing, and sociality, have been widely studied. Table 1 presents the dimensions used to measure mobile SQ. This study uses usefulness, convenience, design, and security/privacy as mobile SQ dimensions. These dimensions are extracted from previous research on the characteristics of mobile social media: usefulness reflecting efficiency and sociality [20,21], convenience reflecting ubiquity and accessibility [20,21,22,23,24], design reflecting diverse and complex contents on a small screen [23,24,25], and security/privacy reflecting weak security and privacy [21,23,24,25].
2.3. Customer Satisfaction and Loyalty
Prior research has explored CS. Sivadas and Baker-Prewitt [26] noted that CS is essential to a company’s success and significantly impacts behavior, repurchase, and word-of-mouth communication. Oliver [27] defined CS as a customer’s cognitive assessment of the discrepancy between the quality or performance expected and the quality or performance received. Meanwhile, the expectation–disconfirmation model has become the primary basis for subsequent research. Babin and Mitch [28] stated that CS is an emotion induced by evaluating a series of experiences, including inconsistencies and perceived performance. Kotler and Keller [29] stated that CS is a customer’s perception of happiness or frustration resulting from the comparison between the performance of a product or service and expectations. Customers become satisfied when quality meets or exceeds the expectations created by their needs and desires; otherwise, customers become dissatisfied.
CL is an important factor influencing a company’s sustainable performance and growth [30]. Lovelock and Wirtz [31] defined loyalty as the willingness to maintain a long-term relationship with a company and recommend its products or services to others. Oliver [32] defined CL as a deep commitment to a brand that facilitates the continuous repurchase of preferred products or services. Customers who are satisfied with a product or service tend to be loyal and make repeated purchases even if situational influences or marketing efforts cause switching behavior. Reichheld and Schefter [33] stated that loyal customers are less price sensitive and reduce the cost of attracting new customers, resulting in increased profits and positive added value. Therefore, companies strive to make ordinary customers increasingly loyal.
3. Research Method
3.1. Development of the Research Hypothesis
3.1.1. Relationship between Mobile Service Quality and Customer Satisfaction
Traditionally, SQ is defined as a significant determinant of CS. Improving SQ increases CS [34,35]. This relationship has been verified in several web and mobile contexts. Chang et al. [36] found that SQ significantly influences CS in e-marketing, Szymanski and Hise [37] in e-retailing, and Cristobal et al. [38] in websites. Kuo et al. [39] and Zhao et al. [40] revealed that SQ significantly affects CS in mobile value-added services, and Yeh and Li [41] revealed the same in mobile commerce. Consequently, the current study proposes the following hypotheses to understand the relationship between SQ and CS in mobile social media:
Hypothesis 1 (H1).
SQ in mobile social media is positively related to CS.
Hypothesis 1-a (H1-a).
Usefulness in mobile social media is positively related to CS.
Hypothesis 1-b (H1-b).
Convenience in mobile social media is positively related to CS.
Hypothesis 1-c (H1-c).
Design in mobile social media is positively related to CS.
Hypothesis 1-d (H1-d).
Security/privacy in mobile social media is positively related to CS.
3.1.2. Relationship between Customer Satisfaction and Loyalty
The relationship between CS and CL affects performance. The higher the level of satisfaction with a product or service, the higher the level of brand loyalty. Loyal customers not only frequently purchase goods or services but also spread positive word-of-mouth and recommend them to others. Hence, CL increases a company’s sales and profits [31]. In line with this connection, the analysis of the relationship between CS and CL is essential. Several researchers have discovered a positive relationship between CS and CL [42]. This relationship has also been identified in several web and mobile contexts. For example, Sagib and Zapan [21] and Wang and Liao [43] showed that CS positively influences CL in mobile banking and commerce, respectively. In the current study, we propose the following hypothesis to understand the relationship between CS and CL in mobile social media:
Hypothesis 2.
CS in mobile social media is positively related to CL.
3.1.3. Relationship between Mobile Service Quality and Customer Loyalty
For SQ and CL, conflicting findings have been reported regarding their relationship. Zeithaml et al. [44] found that SQ influences customers’ behavioral intentions in four different industries. Wong and Sohal [45] reported a positive association between SQ and CL in a large department store chain. Meanwhile, Cronin and Talor [14] stated that in four industries, SQ has less effect on repurchase intention than CS. In the mobile context, Rajaobelina et al. [46] found that usability, value-added features, and security/privacy of SQ dimensions positively influence CL in mobile banking applications and that interactivity does not. Consequently, the current study proposes the following hypotheses to understand the relationship between SQ and CL in mobile social media:
Hypothesis 3 (H3).
SQ in mobile social media is positively related to CL.
Hypothesis 3-a (H3-a).
Usefulness in mobile social media is positively related to CL.
Hypothesis 3-b (H3-b).
Convenience in mobile social media is positively related to CL.
Hypothesis 3-c (H3-c).
Design in mobile social media is positively related to CL.
Hypothesis 3-d (H3-d).
Security/privacy in mobile social media is positively related to CL.
3.1.4. Customer Satisfaction as a Mediator of the Relationship between Mobile Service Quality and Customer Loyalty
Several researchers have demonstrated CS as a mediator in the relationship between SQ and CL. Caruana [47], Olorunniwo et al. [48], and Fatima et al. [49] asserted that CS plays a mediating role in the link between SQ and CL in retail banking, the hotel industry, and hospital healthcare services, respectively. Keating et al. [50] found that CS partially mediates the relationship in the context of online services. However, the mediation effect of the relationship between SQ and CL has never been investigated in the mobile context. Therefore, the current study proposes the following hypotheses to understand CS as a mediator of the relationship between SQ and CL in mobile social media:
Hypothesis 4 (H4).
CS in mobile social media mediates the impact of SQ on CL.
Hypothesis 4-a (H4-a).
CS in mobile social media mediates the impact of usefulness on CL.
Hypothesis 4-b (H4-b).
CS in mobile social media mediates the impact of convenience on CL.
Hypothesis 4-c (H4-c).
CS in mobile social media mediates the impact of design on CL.
Hypothesis 4-d (H4-d).
CS in mobile social media mediates the impact of security/privacy on CL.
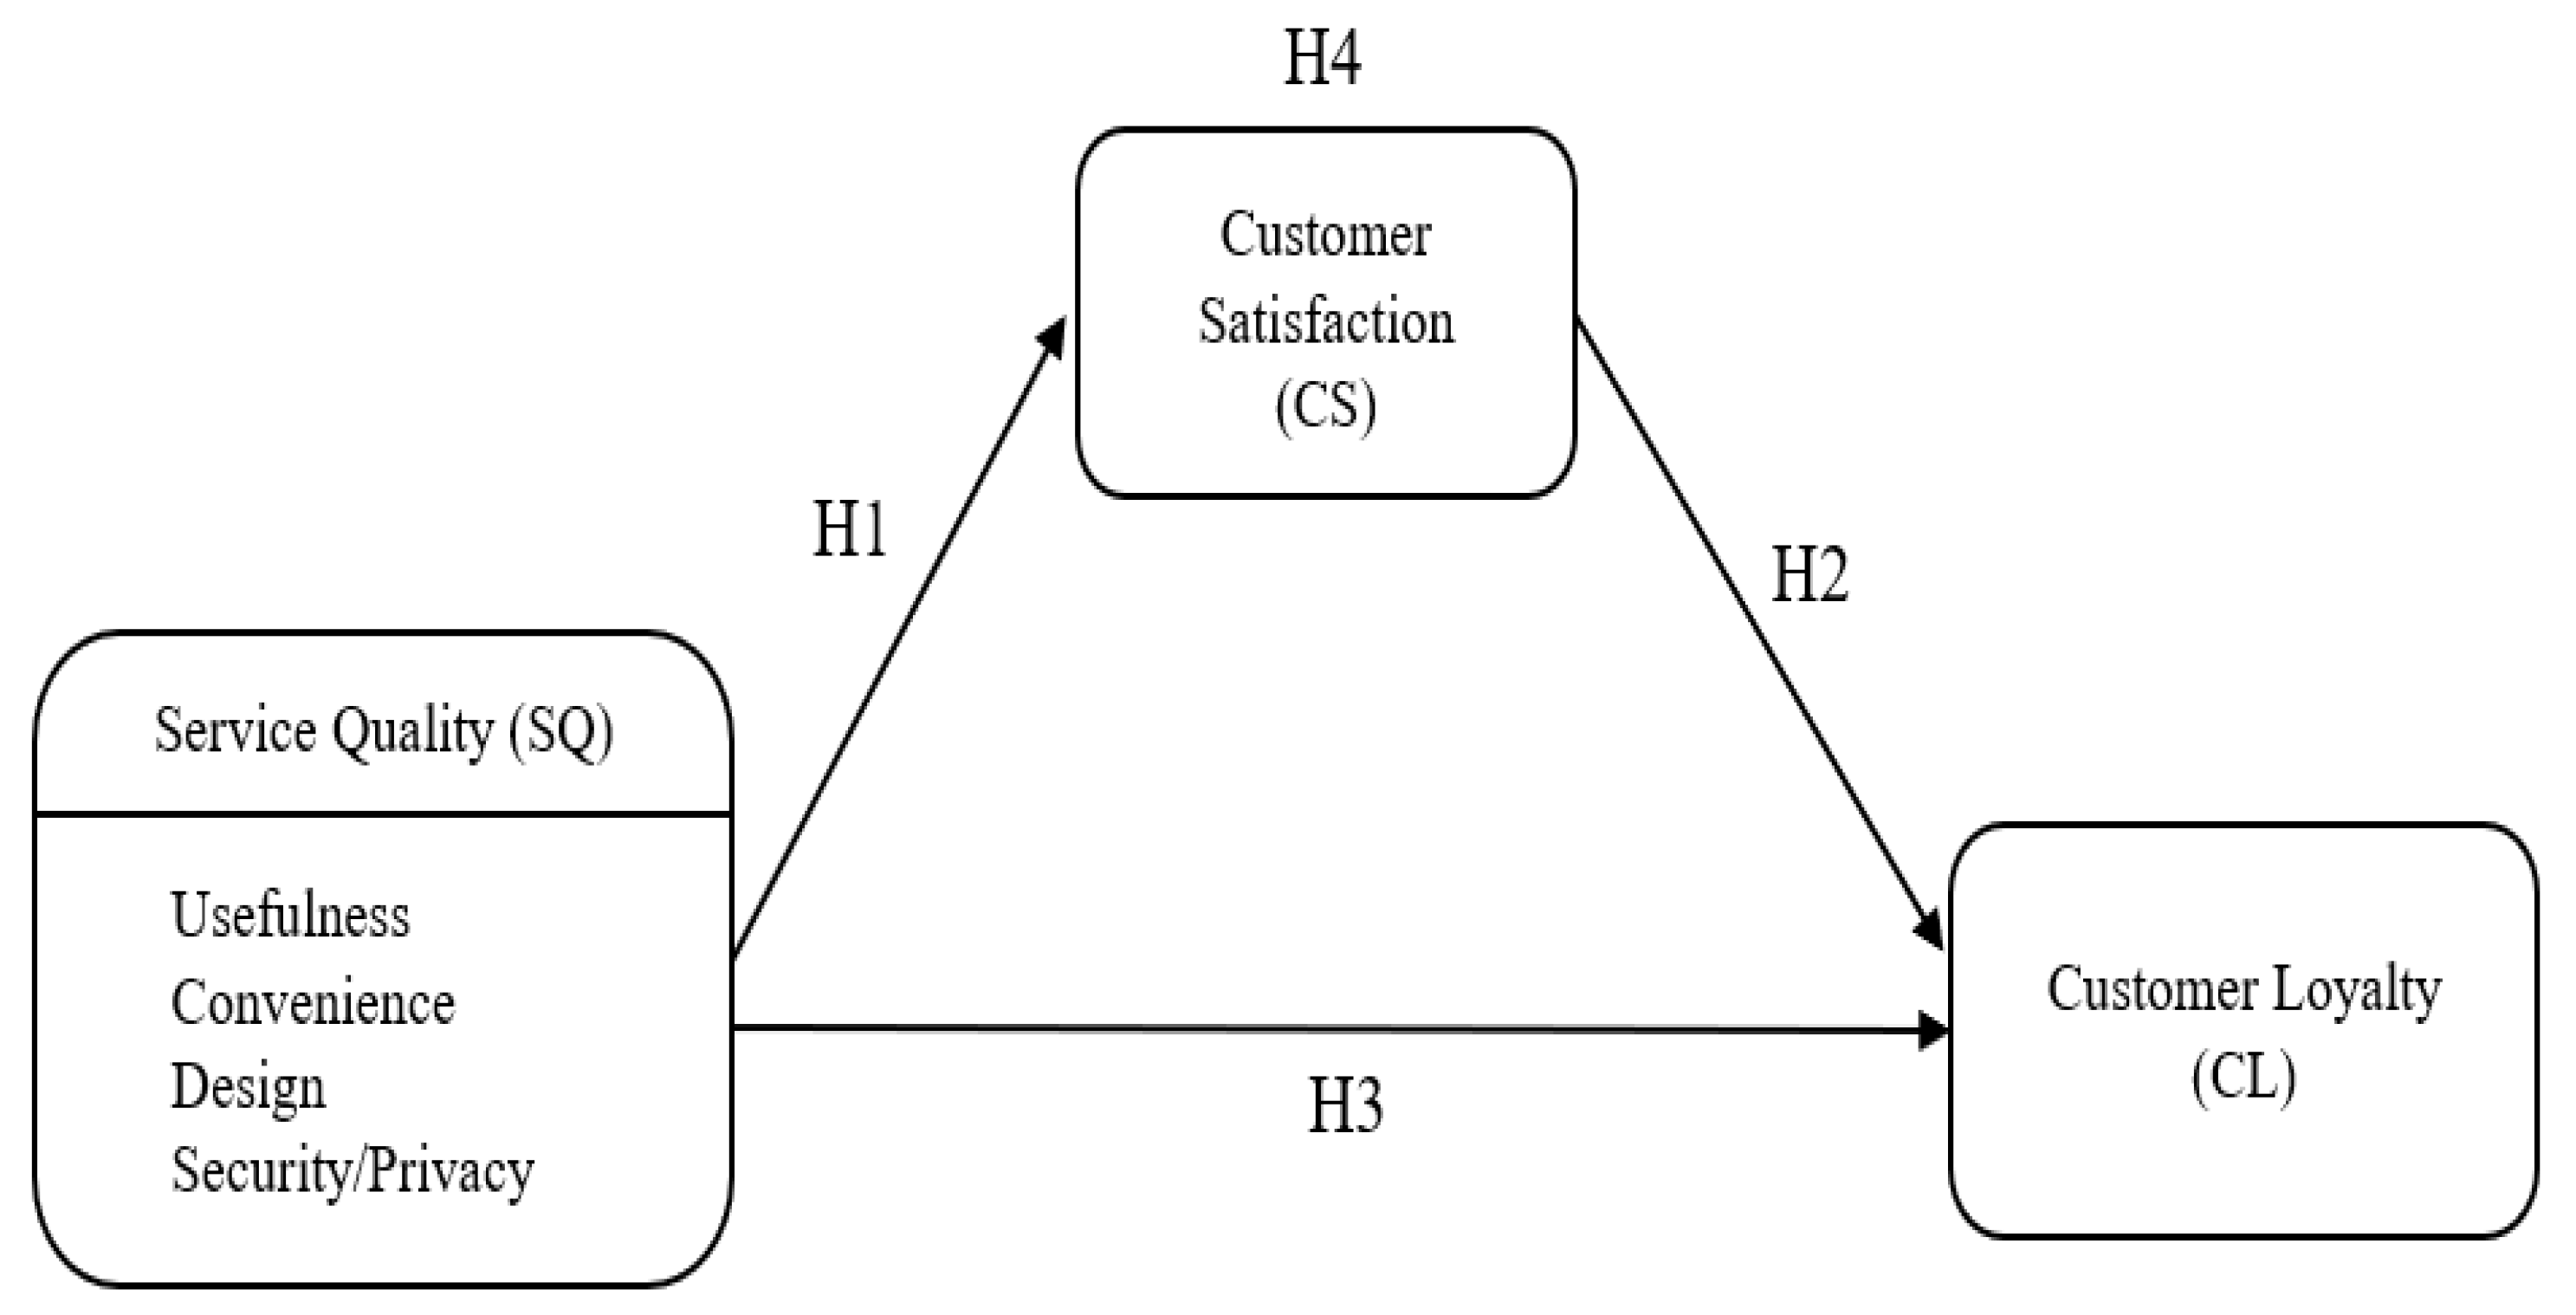
This study investigates the relationship between SQ, CS, and CL in mobile social media, focusing on the role of CS as a mediating variable. Figure 1 presents the research model and corresponding hypotheses.
3.2. Operational Definition and Measurement of Variables
We defined the variables in this study by adapting the measurement variables used in previous research to suit the characteristics of mobile social media. The four dimensions of mobile SQ were defined as follows: usefulness refers to the degree to which the service enhanced work efficiency and strengthened social relationships; convenience refers to the degree of ease and simplicity of usage regardless of time and place; design refers to the degree of attractiveness of the screen layout and provision of in-depth information; security/privacy refer to the degree of protection of personal information and usage record management. CS was defined as the emotional perception of the difference between expectations created by needs or desires before using services and the actual performance experienced. CL was defined as the positive attitude of customers toward continuously using mobile social media and recommending it to others.
Based on previous research [23,24], the measurement items for mobile SQ were set to three questions for each construct, for a total of twelve questions. The measurement items for CS and CL were set to four and three questions, respectively, developed by Ribbink et al. [51]. Table A1 of Appendix A shows the measurement items. The current study used a 5-point Likert scale, ranging from 1 = completely disagree to 5 = completely agree, for all measures.
3.3. Data Collection and Analysis Method
We conducted a self-administered survey among users who utilize mobile social media in the province of Gwanak, South Korea. The questionnaires were distributed using online platforms. The survey was conducted over 5 months from August 2021. Prior to the survey, respondents were provided with sufficient information regarding the purpose and contents of the study, and their consent was obtained. A total of 256 responses were used in the data analysis. The collected data were analyzed using SPSS and Amos 29.0. First, the skewness and kurtosis values of the measurement items were calculated to assess the normality of the data [52]. The skewness values ranged from −0.498 to 0.529, while the kurtosis values ranged from −0.877 to 0.644, both falling within the acceptable range of −2 to +2 [53]. Based on these findings, it can be concluded that the collected data exhibit a normal distribution. Second, a frequency analysis was conducted to identify the demographic characteristics of the respondents in the following section. Third, confirmatory factor analysis (CFA) was performed to verify the reliability and validity of the constructs. Finally, structural equation modeling (SEM) was conducted to verify the relationship among variables.
SEM is a statistical analysis method used to describe the relationship model among variables [54]. There are three main reasons underlying the use of SEM. First, SEM has the ability to estimate the relationships between variables that have dual relations. Second, SEM can describe relationship patterns between latent constructs and manifest variables. Finally, this study includes intervening variables, which can be effectively examined using SEM [55]. In this study, a reflective measurement model utilizing SEM was applied.
3.4. Demographic Characteristics of the Sample
The gender, age, occupation, and educational background of each respondent were surveyed as demographic items. Table 2 shows the respondents’ characteristics. The sex distribution showed a similar ratio of 125 males (48.8%) and 131 females (51.1%). Regarding age distribution, 21 people (8.5%) were below 20 years old, 87 (33.9%) were in their 20s, 84 (32.8%) were in their 30s, 30 (11.7%) were in their 40s, and 34 (13.2%) were over 50 years old. The proportion of people in their 20s and 30s was relatively high. In terms of occupation types, 148 people (57.8%) were employed, followed by 55 people (21.4%) who were self-employed, 33 people (12.8%) who were students, and 20 people (7.8%) with other occupations. Regarding education level, 138 people (53.9%) held a bachelor’s degree, followed by 59 people (23.0%) in high school or below, 50 people (19.5%) with postgraduate degrees, and 9 people (3.5%) who attended a two-year college program.
4. Empirical Analysis
4.1. Reliability and Validity Analysis
Most of the questionnaire items used in this study were based on the literature on mobile SQ. However, the current study measures the new concept of mobile social media, which requires a reliability and validity check. Table 3 shows the results of reliability and convergent validity. To measure the internal consistency of the measurement items, we analyzed the reliability by using Cronbach’s α. All values of the constructs were greater than 0.765, thus exceeding the acceptable threshold of 0.60. This finding showed the good reliability of the measures. To estimate the convergent validity of the measures, we conducted a CFA and found that all the items had factor loadings above 0.644, which exceeds the minimum threshold of 0.60. The composite reliability (CR) values varied between 0.848 and 0.957, thus exceeding the recommended threshold of 0.70. The average variance extracted (AVE) for each construct ranged from 0.653 to 0.848, thus exceeding the threshold of 0.50. These indicators showed the good convergent validity of the measures. The indices of the measurement model indicated a good fit with the data (χ2 = 195.961; d.f. = 137; χ2/d.f. = 1.430; normal fit index (NFI) = 0.923; comparative fit index (CFI) = 0.975; root mean square error of approximation (RMSEA) = 0.041). An χ2/d.f. = 1.430 (recommended level under 3.00) indicated that the proposed model was adequate. According to the parameters recommended by Hu and Bentler [56] for the NFI (cutoff value of 0.90), CFI (cutoff value of 0.95), and RMSEA (cutoff value of less than 0.06) to supplement the chi-square tests, the model fitted the data well. Table 4 shows the results of discriminant validity. The square root AVE of each construct was greater than the correlation coefficients between the constructs, thereby implying discriminant validity [57]. These results demonstrate that the reliability and validity criteria were satisfied.
4.2. Hypothesis Test Results
The hypothesized relationships were estimated using a structural equation modeling technique. Table 5 presents the parameter estimates for the hypothesized relationships and indices of the structural model. The adequacy of the structural model for the data was verified with good fit indices (χ2/d.f. = 1.430, NFI = 0.923, CFI = 0.975, RMSEA = 0.041), which satisfied the recommended thresholds [56]. The standardized coefficients (β) of SQ on CS were as follows: usefulness (β = 0.166, p = 0.019), convenience (β = 0.372, p = 0.000), design (β = 0.167, p = 0.016), and security/privacy (β = 0.195, p = 0.009). Thus, H1-a, H1-b, H1-c, and H1-d were supported. In particular, usefulness, convenience, design, and security/privacy had significant and positive effects on CS. Among them, convenience (β = 0.372) greatly affects CS. The coefficient of CS on CL was 0.484 (β = 0.484, p = 0.000). H2 was thus supported. Specifically, CS had a significant and positive effect on CL. The coefficients of SQ on CL are as follows: usefulness (β = 0.237, p < 0.001), convenience (β = 0.041, p = 0.616), design (β = 0.126, p = 0.073), and security/privacy (β = 0.079, p = 0.297). H3-a was thus supported, whereas H3-b, H3-c, and H3-d were not supported. We also found that only usefulness had a significant and positive effect on CL. This finding highlights the need for further experiments on the role of CS as a mediator.
The bootstrap method developed for nonparametric resampling tests was used to identify the role of CS as a mediator [58]. In total, 1000 bootstrapping procedures were performed. Table 6 shows the total, direct, and indirect effects on the relationships between SQ and CL through CS. First, the indirect effect of usefulness on CL through CS was significant (β = 0.080, p = 0.017; H4-a was supported). The direct effect of usefulness was also significant (β = 0.237, p = 0.001). Hence, usefulness partially affects CL through CS and partially and directly affects CL. Second, the indirect effects of convenience (β = 0.181, p = 0.004), design (β = 0.081, p = 0.025), and security/privacy (β = 0.095, p = 0.013) on CL through CS were significant (H4-b, H4-c, and H4-d were thus supported). Meanwhile, the direct effects of convenience (β = 0.041, p = 0.616), design (β = 0.126, p = 0.073), and security/privacy (β = 0.079, p = 0.297) were not significant. This result indicates that convenience, design, and security/privacy affect CL through CS. Consequently, H4-a~H4-d were supported. In this study, CS served as a mediating variable in the relationship between SQ and CL in mobile social media.
5. Discussion and Implementations
5.1. Discussion of Research Results
We designed a scale (comprising four dimensions: usefulness, convenience, design, and security/privacy) for measuring SQ of mobile social media by referring to prior research. A research model was proposed through the development of research hypotheses. The study empirically investigated the relationship between SQ, CS, and CL in mobile social media, as well as the mediating role of CS.
The results show a significant positive relationship between SQ and CS, indicating that enhancing SQ of mobile social media applications can increase CS. This finding is consistent with previous studies by Yeh and Li [41] in the field of mobile commerce. Moreover, similar results were observed in mobile value-added services by Kuo et al. [39] and Zhao et al. [40]. Among the four dimensions of mobile SQ, convenience had the most significant impact on CS, indicating that efforts should be directed toward improving convenience above other dimensions of mobile SQ to enhance CS.
Furthermore, the study reveals that CS has a significant positive effect on CL, meaning that improving CS can lead to increased CL. This is consistent with previous research that has identified CS as a leading variable of CL. Sagib and Zapan [21] and Wang and Liao [43] also found similar results in mobile banking and mobile commerce, respectively. The study further reveals that among the mobile SQ dimensions, only usefulness has a significant positive effect on CL, implying that usefulness can directly increase CL. Additionally, CS played a mediating role in the relationship between SQ and CL, with usefulness partially mediated, and convenience, design, and security/privacy completely mediated. The findings imply that usefulness is not sensitive to CS regarding its impact on CL. The above findings suggest that improving SQ can enhance CS and CL in the context of mobile social media.
5.2. Theoretical Implications
This study makes several contributions to the literature on SQ and CS. First, it suggests a scale for measuring SQ of mobile social media, drawing on previous research. This scale, which includes convenience, design, usefulness, and security/privacy, can be used to measure mobile service quality in various areas. Second, it is the first study to provide valuable insights into the importance of SQ as a critical factor in driving CS and CL in the context of social media. It emphasizes that improving SQ is essential to enhance CS and CL. Third, it reveals that usefulness has an impact on CL in the context of social media. However, the relationship between SQ and CL has conflicting results, as previously mentioned in the study. This finding contributes to the existing literature on CL in the mobile context by highlighting the significance of usefulness. Finally, this study provides a better understanding of the mechanism among CS, SQ, and CL. CS plays a mediating role in the relationship between SQ and CL in the context of mobile social media. A virtuous cycle exists in the relationship between the CS, SQ, and CL wherein improving SQ leads to increased CS, which serves as a mediator and ultimately enhances CL.
5.3. Managerial Implications
Managers should recognize that SQ improvement or innovation should be prioritized to enhance CS, which is a vital management goal in the context of mobile social media. SQ is the source of CS and CL. Improving SQ requires a thorough analysis of customers’ requirements for the mobile SQ dimensions on the basis of information technology. The management implications of this study in the current market environment are as follows.
First, convenience was found to have the greatest influence on CS among the mobile SQ dimensions. Therefore, managers should pay special attention to improving convenience. As portable devices provide mobile social media services through small screens and keyboards, users often experience discomfort. To resolve this issue, developers should provide alternative input functions so that customers can use the services easily.
Second, security and privacy must be strengthened. As services are provided through a wireless connection, service providers must focus on relieving the anxiety about personal information leakage and hacking. Personal information protection can be improved by strengthening user authentication and user protection terms and conditions. In addition, comprehensive information management should be conducted, and continuous efforts should be made to develop network security and encryption technologies. The design of the user interface should be improved to ensure that it has a comfortable and sophisticated feel. Moreover, it should be designed to increase interest and immersion while preventing vision deterioration owing to extended use. Customized designs that suit the characteristics of each customer may also be beneficial. Efforts should be made to strengthen social communication and develop the content of various functions, such as collaboration with other services. Other services can include financial and information-providing services that assist with daily activities.
Finally, CS, a measure of management performance, is an essential factor linking SQ and CL. CS-oriented management grants a competitive advantage and ensures sustainability. The proposed managerial implications can help establish well-designed SQ strategies and policies, and develop mobile social media applications that provide good SQ.
5.4. Limitations and Future Directions
This study has several limitations. First, the subjects of the study were limited to domestic mobile social media users. Therefore, to provide generalizable results and implications, future studies should target a wider range of mobile social media users. Second, the model in this study considered a single mediator (CS) only. Hence, in future research, the model should be expanded to include other potential mediators, such as customer value and trust, which may affect the relationships studied. The mediating roles of customer value and trust between SQ and CL are topics that have been studied in various fields [59,60,61,62,63]. Third, the study was limited to the mobile context of social media. Future research may expand the scope by examining shoppable social media platforms, live streams, business platforms, and inspirational platforms.
Author Contributions
Conceptualization, K.Y. and B.Y.; Methodology, K.Y.; Validation, B.Y.; Formal analysis, K.Y.; Investigation, K.Y. and B.Y; Data curation, K.Y.; Writing—original draft, K.Y.; Writing—review and editing, B.Y.; Supervision, B.Y. All authors have read and agreed to the published version of the manuscript.
Funding
This research received no external funding.
Institutional Review Board Statement
Not applicable.
Informed Consent Statement
Informed consent was obtained from all subjects involved in the study.
Data Availability Statement
The data presented in this study are available on request from the corresponding author.
Conflicts of Interest
The author declares no conflict of interest.
Appendix A

Table A1.
Measurement items.
| Item Code | Descriptions | Sources |
|---|---|---|
| Service Quality Dimensions | [23,24] | |
| UF: Item1 | The use of mobile social media improves my task performance. | |
| UF: Item2 | Mobile social media enhances my social interactions. | |
| UF: Item3 | Using mobile social media makes me more effective in completing my tasks. | |
| CV: Item4 | It is easy to do what I want to do on mobile social media. | |
| CV: Item5 | Mobile social media is easily accessible anytime, anywhere. | |
| CV: Item6 | Navigating and finding what I’m looking for on mobile social media is easy. | |
| DS: Item7 | Mobile social media has an attractive design. | |
| DS: Item8 | Mobile social media has diverse and complex content that are well-designed. | |
| DS: Item9 | Mobile social media is visually appealing. | |
| SP: Item10 | Overall, I trust the security of mobile social media. | |
| SP: Item11 | I believe my information and work are protected on mobile social media. | |
| SP: Item12 | I trust that mobile social media will not misuse my personal information. | |
| Customer Satisfaction | [51] | |
| CS: Item13 | I am generally pleased with mobile social media. | |
| CS: Item14 | I enjoy using mobile social media. | |
| CS: Item15 | I am very satisfied with the services of mobile social media. | |
| CS: Item16 | I am happy with mobile social media. | |
| Customer Loyalty | [51] | |
| CL: Item17 | I would recommend mobile social media to others. | |
| CL: Item18 | I intend to continue using mobile social media. | |
| CV: Item19 | I prefer mobile social media over other options. | |
References
- Mordor Intelligence, Smartphone Market—Mobile, Cell Phone Industry Analysis & Size. Available online: https://www.mordorintelligence.com/industry-reports/smartphones-market (accessed on 10 July 2023).
- Kapoor, K.K.; Tamilmani, K.; Rana, N.P.; Patil, P.; Dwivedi, Y.K.; Nerur, S. Advances in Social Media Research: Past, Present and Future. Inf. Syst. Front. 2018, 20, 531–558. [Google Scholar] [CrossRef] [Green Version]
- Ratten, V. The Evolution of Mobile Social Networks through Technological Innovation. In Evolution of Innovation Management; Brem, A., Viardot, É., Eds.; Palgrave Macmillan: London, UK, 2013. [Google Scholar] [CrossRef]
- Mohammad, S.; Arash, N. Social Networking on Smartphones: When Mobile Phones Become Addictive. Comput. Hum. Behav. 2013, 29, 2632–2639. [Google Scholar] [CrossRef]
- Parasuraman, A.; Zeithaml, V.A.; Malhotra, A. E-S-QUAL: A Multiple-Item Scale for Assessing Electronic Service Quality. J. Serv. Res. 2005, 7, 213–233. [Google Scholar] [CrossRef] [Green Version]
- Oliver, R.L. Satisfaction: A Behavioral Perspective on the Consumer; The McGraw-Hill Companies, Inc.: New York, NY, USA, 1997. [Google Scholar]
- Zhou, R.; Wang, X.; Shi, Y.; Zhang, R.; Zhang, L.; Guo, H. Measuring e-service quality and its importance to customer satisfaction and loyalty: An empirical study in a telecom setting. Electron. Commer. Res. 2019, 19, 477–499. [Google Scholar] [CrossRef]
- Edvardsson, B.; Johnson, M.D.; Gustafsson, A.; Strandvik, T. The effects of satisfaction and loyalty on profits and growth: Products versus services. Total. Qual. Manag. 2000, 11, 917–927. [Google Scholar] [CrossRef] [Green Version]
- Anderson, E.W.; Mittal, V. Strengthening the Satisfaction-Profit Chain. J. Serv. Res. 2000, 3, 107–120. [Google Scholar] [CrossRef]
- Collier, J.E.; Bienstock, C.C. Measuring Service Quality in E-Retailing. J. Serv. Res. 2006, 8, 260–275. [Google Scholar] [CrossRef]
- Pollack, B.L. Linking the hierarchical service quality model to customer satisfaction and loyalty. J. Serv. Mark. 2009, 23, 42–50. [Google Scholar] [CrossRef]
- Wang, C.K.; Masukujjaman, M.; Alam, S.S.; Ahmad, I.; Lin, C.Y.; Ho, Y.H. The Effects of Service Quality Performance on Customer Satisfaction for Non-Banking Financial Institutions in an Emerging Economy. Int. J. Financ. Stud. 2023, 11, 33. [Google Scholar] [CrossRef]
- Gonu, E.; Agyei, P.M.; Richard, O.K.; Asare-Larbi, M. Customer orientation, service quality and customer satisfaction interplay in the banking sector: An emerging market perspective. Cogent Bus. Manag. 2023, 10, 2163797. [Google Scholar] [CrossRef]
- Cronin, J.J.J.; Taylor, S.A. Measuring Service Quality: A Reexamination and Extension. J. Mark. 1992, 56, 55–68. [Google Scholar] [CrossRef]
- Parasuraman, A.; Zeithaml, V.A.; Berry, L.L. A Conceptual Model of Service Quality and Its Implications for Future Research. J. Mark. 1985, 49, 41–50. [Google Scholar] [CrossRef]
- Parasuraman, A.; Zeithaml, V.A.; Berry, L.L. SERVQUAL: A Multiple-Item Scale For Measuring Consumer Perceptions of Service Quality. J. Retail. 1988, 64, 12–40. [Google Scholar]
- Carr, C.T.; Hayes, R.A. Social Media: Defining, Developing, and Divining. Atl. J. Commun. 2015, 23, 46–65. [Google Scholar] [CrossRef]
- Kietzmann, J.H.; Hermkens, K.; McCarthy, I.P.; Silvestre, B.S. Social media? Get serious! Understanding the functional building blocks of social media. Bus. Horiz. 2011, 54, 241–251. [Google Scholar] [CrossRef] [Green Version]
- Wolfinbarger, M.; Gilly, M.C. eTailQ: Dimensionalizing, measuring and predicting etail quality. J. Retail. 2003, 79, 183–198. [Google Scholar] [CrossRef]
- Tan, F.B.; Chou, J.P.C. The Relationship Between Mobile Service Quality, Perceived Technology Compatibility, and Users’ Perceived Playfulness in the Context of Mobile Information and Entertainment Services. Int. J. Hum.–Comput. Interact. 2008, 24, 649–671. [Google Scholar] [CrossRef]
- Sagib, G.K.; Zapan, B. Bangladeshi Mobile Banking Service Quality and Customer Satisfaction and Loyalty. Manag. Mark. 2014, 9, 331–346. [Google Scholar]
- Özer, A.; Argan, M.T.; Argan, M. The Effect of Mobile Service Quality Dimensions on Customer Satisfaction. Procedia-Soc. Behav. Sci. 2013, 99, 428–438. [Google Scholar] [CrossRef] [Green Version]
- Trabelsi-Zoghlami, A.; Berraies, S.; Ben Yahia, K. Service quality in a mobile-banking-applications context: Do users’ age and gender matter? Total. Qual. Manag. Bus. Excel. 2018, 31, 1639–1668. [Google Scholar] [CrossRef]
- Kaatz, C. Retail in my pocket–replicating and extending the construct of service quality into the mobile commerce context. J. Retail. Consum. Serv. 2020, 53, 101983. [Google Scholar] [CrossRef]
- Arcand, M.; Promtep, S.; Brun, I.; Rajaobelina, L. Mobile banking service quality and customer relationships. Int. J. Bank Mark. 2017, 35, 1068–1089. [Google Scholar] [CrossRef]
- Sivadas, E.; Baker-Prewitt, J.L. An examination of the relationship between service quality, customer satisfaction, and store loyalty. Int. J. Retail. Distrib. Manag. 2000, 28, 73–82. [Google Scholar] [CrossRef]
- Oliver, R.L. Cognitive, Affective, and Attribute Bases of the Satisfaction Response. J. Consum. Res. 1993, 20, 418–430. [Google Scholar] [CrossRef]
- Babin, B.J.; Griffin, M. The Nature of Satisfaction: An Updated Examination and Analysis Variance Extracted. J. Bus. Res. 1998, 41, 127–136. [Google Scholar] [CrossRef]
- Kotler, P.; Keller, K.L. Marketing Management, 15th ed.; Pearson: London, UK, 2016. [Google Scholar]
- Heskett, J.L.; Jones, T.O.; Loveman, G.W.; Sasser, W.E.; Schlesinger, L.A. Putting the Service-Profit Chain to Work. Harv. Bus. Rev. 1994, 72, 164–174. [Google Scholar]
- Lovelock, C.H.; Wirtz, J. Services Marketing People, Technology, Strategy, 7th ed.; Pearson: London, UK, 2011. [Google Scholar]
- Oliver, R.L. Whence Consumer Loyalty? J. Mark. 1999, 63, 33–44. [Google Scholar] [CrossRef]
- Reichheld, F.F.; Schefter, P. E-Loyalty: Your Secret Weapon on the Web. Harv. Bus. Rev. 2000, 78, 105–113. [Google Scholar]
- Anderson, E.W.; Fornell, C.; Lehmann, D.R. Customer Satisfaction, Market Share, and Profitability: Findings from Sweden. J. Mark. 1994, 58, 53–66. [Google Scholar] [CrossRef] [Green Version]
- Li, X.; Xu, M.; Zeng, W.; Tse, Y.K.; Chan, H.K. Exploring customer concerns on service quality under the COVID-19 crisis: A social media analytics study from the retail industry. J. Retail. Consum. Serv. 2023, 70, 103157. [Google Scholar] [CrossRef]
- Chang, H.H.; Wang, Y.-H.; Yang, W.-Y. The impact of e-service quality, customer satisfaction and loyalty on e-marketing: Moderating effect of perceived value. Total. Qual. Manag. 2009, 20, 423–443. [Google Scholar] [CrossRef]
- Szymanski, D.M.; Hise, R.T. E-satisfaction: An initial examination. J. Retail. 2000, 76, 309–322. [Google Scholar] [CrossRef]
- Cristobal, E.; Flavián, C.; Guinalíu, M. Perceived E-Service Quality (PeSQ) measurement validation and effects on consumer satisfaction and web site loyalty. J. Serv. Theory Pract. 2007, 13, 317–340. [Google Scholar] [CrossRef]
- Kuo, Y.-F.; Wu, C.-M.; Deng, W.-J. The relationships among service quality, perceived value, customer satisfaction, and post-purchase intention in mobile value-added services. Comput. Hum. Behav. 2009, 25, 887–896. [Google Scholar] [CrossRef]
- Zhao, L.; Lu, Y.; Zhang, L.; Chau, P.Y.K. Assessing the effects of service quality and justice on customer satisfaction and the continuance intention of mobile value-added services: An empirical test of a multidimensional model. Decis. Support Syst. 2012, 52, 645–656. [Google Scholar] [CrossRef]
- Yeh, Y.S.; Li, Y. Building trust in m-commerce: Contributions from quality and satisfaction. Online Inf. Rev. 2009, 33, 1066–1086. [Google Scholar] [CrossRef] [Green Version]
- Liu, C.-T.; Guo, Y.M.; Lee, C.-H. The effects of relationship quality and switching barriers on customer loyalty. Int. J. Inf. Manag. 2011, 31, 71–79. [Google Scholar] [CrossRef]
- Wang, Y.-S.; Liao, Y.-W. The conceptualization and measurement of m-commerce user satisfaction. Comput. Hum. Behav. 2007, 23, 381–398. [Google Scholar] [CrossRef]
- Zeithaml, V.A.; Berry, L.L.; Parasuraman, A. The Behavioral Consequences of Service Quality. J. Mark. 1996, 60, 31–46. [Google Scholar] [CrossRef]
- Wong, A.; Sohal, A. Service quality and customer loyalty perspectives on two levels of retail relationships. J. Serv. Mark. 2003, 17, 495–513. [Google Scholar] [CrossRef]
- Rajaobelina, L.; Tep, S.P.; Arcand, M.; Ricard, L. The relationship of brand attachment and mobile banking service quality with positive word-of-mouth. J. Prod. Brand Manag. 2021, 30, 1162–1175. [Google Scholar] [CrossRef]
- Caruana, A. Service loyalty: The Effects of Service Quality and the Mediating Role of Customer Satisfaction. Eur. J. Mark. 2002, 36, 811–828. [Google Scholar] [CrossRef] [Green Version]
- Olorunniwo, F.; Hsu, M.K.; Udo, G.J. Service quality, customer satisfaction, and behavioral intentions in the service factory. J. Serv. Mark. 2006, 20, 59–72. [Google Scholar] [CrossRef]
- Fatima, T.; Alam Malik, S.; Shabbir, A. Hospital healthcare service quality, patient satisfaction and loyalty: An Investigation in the Context of Private Healthcare Systems. Int. J. Qual. Reliab. Manag. 2018, 35, 1195–1214. [Google Scholar] [CrossRef]
- Keating, B.W.; Alpert, F.; Kriz, A.; Quazi, A. Mediating Role of Relationship Quality in Online Services. J. Comput. Inf. Syst. 2011, 52, 33–41. [Google Scholar] [CrossRef]
- Ribbink, D.; Riel, A.C.R.V.; Liljander, V.; Streukens, S. Comfort your online customer: Quality, trust and loyalty on the internet. Manag. Serv. Qual. Int. J. 2004, 14, 446–456. [Google Scholar] [CrossRef] [Green Version]
- Byrne, B.M. Structural Equation Modeling with AMOS: Basic Concepts, Applications, and Programming, 3rd ed.; Routledge Taylor & Francis Group: New York, NY, USA, 2010. [Google Scholar]
- George, D.; Mallery, P. IBM SPSS Statistics 26 Step by Step: A Simple Guide and Reference, 16th ed.; Routledge Taylor & Francis Group: New York, NY, USA, 2020. [Google Scholar]
- Hoyle, R.H. Handbook of Structural Equation Modeling; The Guilford Press: New York, NY, USA, 2012. [Google Scholar]
- Schumacker, R.E.; Lomax, R.G. A Beginner’s Guide to Structural Equation Modeling, 4th ed.; Routledge: New York, NY, USA, 2015. [Google Scholar]
- Hu, L.T.; Bentler, P.M. Cutoff criteria for fit indexes in covariance structure analysis: Conventional criteria versus new alternatives. Struct. Equ. Model. Multidiscip. J. 1999, 6, 1–55. [Google Scholar] [CrossRef]
- Fornell, C.; Larcker, D.F. Structural equation models with unobservable variables and measurement error: Algebra and statistics. J. Mark. Res. 1981, 18, 382–388. [Google Scholar] [CrossRef]
- Preacher, K.J.; Hayes, A.F. Asymptotic and Resampling Strategies for Assessing and Comparing Indirect Effects in Multiple Mediator Models. Behav. Res. Methods 2008, 40, 879–891. [Google Scholar] [CrossRef]
- Marcos, A.M.B.D.F.; Coelho, A.F.D.M. Service quality, customer satisfaction and customer value: Holistic determinants of loyalty and word-of-mouth in services. TQM J. 2022, 34, 957–978. [Google Scholar] [CrossRef]
- Mbango, P. The role of perceived value in promoting customer satisfaction: Antecedents and consequences. Cogent Soc. Sci. 2019, 5, 1684229. [Google Scholar] [CrossRef]
- Al Chalabi, H.S.; Turan, A. The Mediating Role of Perceived Value on the Relationship between Service Quality and Customer Service Loyalty: An Explanatory Study for Iraqi Private Banking Sector. Glob. Bus. Manag. Res. Int. J. 2017, 9, 37–66. [Google Scholar] [CrossRef] [Green Version]
- Purwanto, E.; Deviny, J.; Mutahar, A.M. The Mediating Role of Trust in the Relationship Between Corporate Image, Security, Word of Mouth and Loyalty in M-Banking Using among the Millennial Generation in Indonesia. Manag. Mark. 2020, 15, 255–274. [Google Scholar] [CrossRef]
- Kalia, P.; Kaushal, R.; Singla, M.; Parkash, J. Determining the role of service quality, trust and commitment to customer loyalty for telecom service users: A PLS-SEM approach. TQM J. 2021, 33, 377–396. [Google Scholar] [CrossRef]
Figure 1.
Research model.

Table 1.
Dimensions of mobile service quality in previous research.
| Previous Research | Context | Mobile Service Quality Dimensions |
|---|---|---|
| Tan and Chou [20] | mobile information and entertainment services | usefulness, ease of use, content, personalization, variety, feedback, experimentation |
| Sagib and Zapan [21] | mobile banking | efficiency, convenience, ease of operation, security, reliability, responsiveness, assurance |
| Özer et al. [22] | mobile services | availability, ease of use, perceived risk, compatibility of mobile devices, entertainment services |
| Trabelsi-Zoghlami et al. [23] | mobile banking | information quality, ease of use, reliability, design, security/privacy |
| Kaatz [24] | mobile commerce | ubiquity, fulfillment, design, security/privacy, customer service |
| Arcand et al. [25] | mobile banking | practicality, design/aesthetics, security/privacy, sociality, enjoyment |
Table 2.
Characteristics of respondents.
| Variable | Category | Frequency | Percentage |
|---|---|---|---|
| Gender | male | 125 | 48.8 |
| female | 131 | 51.1 | |
| Age | below 20 | 21 | 8.5 |
| 20–29 | 87 | 33.9 | |
| 30–39 | 84 | 32.8 | |
| 40–49 | 30 | 11.7 | |
| over 50 | 34 | 13.2 | |
| Occupation | employed | 148 | 57.8 |
| self-employed | 55 | 21.4 | |
| student | 33 | 12.8 | |
| others | 20 | 7.8 | |
| Education level | high school or below | 59 | 23.0 |
| college | 9 | 3.5 | |
| bachelor’s degree | 138 | 53.9 | |
| postgraduate degree | 50 | 19.5 |
Table 3.
Reliability and convergent validity.
| Construct | No. of Items | Factor Loading | CR | AVE | Cronbach’s α |
|---|---|---|---|---|---|
| Usefulness | 3 | 0.644 | 0.848 | 0.653 | 0.798 |
| 0.879 | |||||
| 0.753 | |||||
| Convenience | 3 | 0.749 | 0.856 | 0.664 | 0.781 |
| 0.752 | |||||
| 0.720 | |||||
| Design | 3 | 0.831 | 0.915 | 0.783 | 0.865 |
| 0.861 | |||||
| 0.797 | |||||
| Security/ Privacy | 3 | 0.819 | 0.859 | 0.670 | 0.864 |
| 0.798 | |||||
| 0.859 | |||||
| CS | 4 | 0.777 | 0.957 | 0.848 | 0.916 |
| 0.907 | |||||
| 0.881 | |||||
| 0.857 | |||||
| CL | 3 | 0.771 | 0.863 | 0.679 | 0.765 |
| 0.691 | |||||
| 0.710 |
Indices of the measurement model: χ2 = 195.961, d.f. = 137, χ2/d.f. = 1.430, NFI = 0.923, CFI = 0.975, RMSEA = 0.041.
Table 4.
Discriminant validity.
| Construct | Usefulness | Convenience | Design | Security/Privacy | CS | CL |
|---|---|---|---|---|---|---|
| Usefulness | 0.808 | |||||
| Convenience | 0.095 | 0.814 | ||||
| Design | 0.020 | 0.208 | 0.884 | |||
| Security/privacy | 0.304 | 0.182 | 0.203 | 0.818 | ||
| CS | 0.257 | 0.389 | 0.281 | 0.211 | 0.920 | |
| CL | 0.387 | 0.263 | 0.282 | 0.272 | 0.613 | 0.824 |
Note: The diagonal value is the square root of the AVE.
Table 5.
Parameter estimates for hypothesized relationships.
| Relationship | β | SE. | CR. | p | Result |
|---|---|---|---|---|---|
| H1-a. Usefulness → CS | 0.166 | 0.066 | 2.339 | 0.019 * | supported |
| H1-b. Convenience → CS | 0.372 | 0.082 | 4.762 | 0.000 *** | supported |
| H1-c. Design → CS | 0.167 | 0.067 | 2.410 | 0.016 * | supported |
| H1-d. Security/privacy → CS | 0.195 | 0.052 | 2.630 | 0.009 ** | supported |
| H2. CS → CL | 0.484 | 0.069 | 5.847 | 0.000 *** | supported |
| H3-a. Usefulness → CL | 0.237 | 0.058 | 3.205 | 0.001 ** | supported |
| H3-b. Convenience → CL | 0.041 | 0.071 | 0.502 | 0.616 | not supported |
| H3-c. Design → CL | 0.126 | 0.057 | 1.790 | 0.073 | not supported |
| H3-d. Security/privacy → CL | 0.079 | 0.045 | 1.042 | 0.297 | not supported |
Note: * p < 0.05, ** p < 0.01, *** p < 0.001.
Table 6.
Total, direct, and indirect effects.
| Relationship | Total Effect | Direct Effect | Indirect Effect | Result | |||
|---|---|---|---|---|---|---|---|
| β | p | β | p | β | p | ||
| H4-a. Usefulness → CS → CL | 0.153 | 0.003 ** | 0.237 | 0.001 ** | 0.080 | 0.017 * | Supported |
| H4-b. Convenience → CS → CL | 0.396 | 0.010 ** | 0.041 | 0.616 | 0.181 | 0.004 ** | Supported |
| H4-c. Design → CS → CL | 0.164 | 0.009 ** | 0.126 | 0.073 | 0.081 | 0.025 * | Supported |
| H4-d. Security/Privacy → CS → CL | 0.138 | 0.043 * | 0.079 | 0.297 | 0.095 | 0.013 * | Supported |
Note: * p < 0.05, ** p < 0.01. The level of confidence for all bias-corrected confidence intervals is 95%.
Disclaimer/Publisher’s Note: The statements, opinions and data contained in all publications are solely those of the individual author(s) and contributor(s) and not of MDPI and/or the editor(s). MDPI and/or the editor(s) disclaim responsibility for any injury to people or property resulting from any ideas, methods, instructions or products referred to in the content. |
© 2023 by the authors. Licensee MDPI, Basel, Switzerland. This article is an open access article distributed under the terms and conditions of the Creative Commons Attribution (CC BY) license (https://creativecommons.org/licenses/by/4.0/).
Share and Cite
MDPI and ACS Style
Yum, K.; Yoo, B. The Impact of Service Quality on Customer Loyalty through Customer Satisfaction in Mobile Social Media. Sustainability 2023, 15, 11214. https://doi.org/10.3390/su151411214
AMA Style
Yum K, Yoo B. The Impact of Service Quality on Customer Loyalty through Customer Satisfaction in Mobile Social Media. Sustainability. 2023; 15(14):11214. https://doi.org/10.3390/su151411214
Chicago/Turabian StyleYum, Kyeongmin, and Byungjoon Yoo. 2023. "The Impact of Service Quality on Customer Loyalty through Customer Satisfaction in Mobile Social Media" Sustainability 15, no. 14: 11214. https://doi.org/10.3390/su151411214
Note that from the first issue of 2016, this journal uses article numbers instead of page numbers. See further details here.