

Study on the Dynamic Mechanism of the Desiccation Crack Initiation and Propagation in Red Clay

School of Architecture and Transportation Engineering, Guilin University of Electronic Technology, Guilin 541004, China
*
Authors to whom correspondence should be addressed.
Sustainability 2023, 15(14), 11156; https://doi.org/10.3390/su151411156
Submission received: 6 June 2023
/
Revised: 21 June 2023
/
Accepted: 12 July 2023
/
Published: 18 July 2023
(This article belongs to the Special Issue Advances in Rock Mechanics and Geotechnical Engineering)
Abstract
:Red clay is susceptible to cracking in desiccating environments, with resulting crisscrossing cracks that compromise the soil structure and increase the likelihood of geological hazards. To investigate the dynamic mechanism of the initiation and propagation of soil desiccation cracks under natural hygrothermal conditions, a desiccation test was conducted on a red clay slurry using three-dimensional digital image correlation (3D DIC) technology. The evolution behaviour of desiccation cracks was analysed, and the dynamic relationships between moisture content, displacement field, strain field, and soil desiccation cracking were explored. The test results showed that the Atterberg limits of red clay are correlated with desiccation cracking. Cracks tend to initiate in areas where tensile strain is concentrated or significant displacement differences exist. Following crack initiation, the surrounding strain and displacement fields redistribute, influencing the propagation direction, development rate, and morphology of subsequent cracks nearby. Additionally, the relative displacement and strain at the edges of cracks are related to the crack propagation direction. Earlier crack initiation usually corresponds to a larger relative displacement and strain at the crack edges, while the displacement and strain at the soil clod centre are typically smaller than those at the crack edges. DIC technology can quickly and accurately obtain dynamic information about displacement and strain fields, providing feasible technical support for analysing the dynamic mechanism behind soil desiccation cracking. It has potential value in engineering hazard prevention and sustainable development.
1. Introduction
Red clay is susceptible to cracking in desiccating environments due to its sensitivity to ambient humidity. The resulting desiccation cracks threaten the strength and stability of the soil, negatively impacting its permeability and hydraulic characteristics, leading to a range of engineering challenges. The crack initiation and propagation facilitate rainwater infiltration into the soil, causing engineering hazards such as foundation deformation, slope collapse, landslides, failure of landfill barrier function, and dam instability [1,2,3,4,5,6,7,8]. The existence of soil cracks in agricultural engineering diminishes moisture and fertilizer utilisation efficiency, amplifies soil erosion and pollution, and deepens soil weathering, consequently reducing crop yields. In environmental science, cracks facilitate the weathering and erosion of rocks and soils, resulting in land desertification and ecological environment disruption, compromising the sustainability of human and natural development. Therefore, a systematic study of the dynamic mechanism of desiccation cracking in red clay is crucial for effectively preventing and controlling engineering problems caused by cracking, thereby promoting sustainable development.
Desiccation cracking of clayey soil is the result of soil shrinkage caused by moisture evaporation, which is influenced by boundary restriction and uneven shrinkage [9], resulting in the formation and development of the soil stress–strain field. Once the tensile stress exceeds the maximum tensile strength of the soil, cracks initiate and continue to propagate during evolution [10,11]. The resulting cracks increase the soil surface area, promoting moisture evaporation, exacerbating the desiccation, shrinkage, and further development of cracks [12,13]. Thus, crack development, moisture content, and shrinkage deformation are mutually influential and dynamically develop.
Moisture evaporation induces desiccation cracking. Liu et al. [14] investigated the failure mechanism of red clay slopes. They found that soil shrinkage and cracking result from matric suction differences between the upper and lower soil layers induced by the moisture content gradient. Moisture content changes play a crucial role in the initiation and propagation of cracks. Researchers have identified the critical moisture content (wc) as a constant parameter for soil cracking [15,16]. They have also explored the relationship between crack evolution and moisture content [17,18]. However, wc is related to soil properties and external environmental factors, and further comprehensive study is needed to explore the relationship between moisture evaporation and crack evolution.
Researchers have investigated the mechanisms underlying the initiation of desiccation cracks [19,20,21]. It is commonly accepted that the uneven tensile stress caused by soil desiccation results in stress concentration in areas where soil deformation is limited, leading to cracking when the tensile stress exceeds the maximum tensile strength. However, conventional methods for determining soil tensile strength have limitations. Conventional tensile tests measure the tensile strength of the weakest point in a compacted sample at a specific moisture content and dry density [22,23]. Actually, matric suction increases as moisture evaporates, causing a redistribution of moisture and pores that may alter the initial conditions for desiccation crack initiation. Furthermore, tensile strength is a macroscopic mechanical indicator, and the uneven shrinkage deformation of clayey soils makes it difficult for conventional tests to accurately reflect the unevenness of the interparticle cohesive force at the micro level.
Previous researchers have attempted to establish relationships between strain, displacement, and crack evolution. For example, they conducted shrinkage tests and used Vernier callipers to measure soil strain, evaluating the total tensile stress when soil cracks initiate [24]. They also monitored the real-time stress and displacement of slopes using pressure gauges and displacement meters to examine the evolution of slope cracks from the perspective of crack–stress–displacement [25]. However, these methods require direct contact between the measuring instruments and soil, leading to the disturbance of the original structure and constraint conditions of the soil, and cannot provide complete information about soil stress, strain, and displacement. Therefore, the development and adoption of high-precision, contactless, fast, and dynamic testing techniques offer a promising direction to address these limitations.
Digital image correlation (DIC) technology is an optical non-contact technique that can measure the 3D displacement and strain of an object surface [26]. It can monitor the evolution of all cracks in a testing area and detect subtle changes in civil engineering materials in real time, allowing for the analysis of displacement and strain evolution. DIC technology is mostly applied to materials such as metals, reinforced concretes, rocks, polymers, and biological tissues. Studies have reported the real-time measurement of the surface strain and displacement of these materials on the micro- and macroscale. Lei et al. [27] proposed an approach for investigating the planar strain distribution in polycrystalline materials at the grain scale by combining DIC technology with microscopy and verified its feasibility for studying the micromechanical behaviour of a Ni-based alloy specimen. Francic et al. [28] compared the accuracy of 2D DIC technology and LVDT sensors in measuring the crack width and vertical displacement of reinforced concrete and found DIC technology had higher precision. Han et al. [29] used a split Hopkinson pressure bar (SHPB) system and DIC technology to monitor the deformation, vertical displacement, and maximum principal strain of sandstone during the impact loading process and conducted dynamic fracture analysis. Wang et al. [30] used DIC technology to obtain the heterogeneous deformation fields of polyurethane foam samples during compression and revealed the evolution of surface deformation textures of open-cell polyurethane foam samples with different relative densities. Zhang et al. [31] used DIC technology to measure the mechanical properties of biological tissues. Despite DIC technology having been applied to various materials, there are limited studies on its application in the research on soil crack evolution, and few reports discuss the relationship between crack evolution and deformation (displacement and strain). Consequently, applying DIC technology to study the relationship between crack evolution and soil deformation presents significant advantages and provides an opportunity for a comprehensive analysis of the dynamic mechanism of crack initiation and propagation.
In this study, 3D DIC technology was utilised to dynamically monitor red clay desiccation cracking in indoor desiccating tests. The relationships between moisture content, strain, displacement, and crack evolution were analysed with soil moisture monitoring and surface crack identification. The dynamic mechanism of soil desiccation crack initiation and propagation was studied. These study results can contribute to a deeper understanding of the dynamic mechanism of soil desiccation cracking.
2. Materials and Methods
2.1. Soil Samples
The investigated soil was red clay at a depth of 2.5–4.0 m, which was recovered from Shaoyang, Hunan province, China. According to the Test Methods of Soils for Highway Engineering in China (JTG3430-2020) [32], the basic physical properties were determined by laboratory tests and are given in Table 1. The soil liquid limit is higher than 50%, the plasticity index is higher than 35%, and the percentage of soil particles larger than 0.075 mm is less than 25%. The particle composition and plasticity index indicate that the soil belonged to the high-liquid-limit clay group.
2.2. Sample Preparation
The soil was air-dried, crushed with a rubber mallet, and sieved through a 2 mm sieve. The sieved soil was then placed into a 200 mm diameter circular container, and distilled water was added to prepare a saturated slurry with a moisture content of 120%. Air bubbles were removed from the slurry sample by stirring and vibrating and leaving it to set for at least 48 h for sedimentation. Finally, the pure water above the slurry surface was removed, resulting in a circular slurry sample with an initial thickness of 15 mm and an initial moisture content of 87.3%.
To obtain soil surface information using DIC technology, the soil surface must have recognisable characteristics [33]. According to the characteristics of the tested soil and the requirements for crack identification using DIC technology, white paint and coal particles were used as base materials and speckles, respectively. A layer of white paint was uniformly applied to cover the soil surface, followed by the random placement of coal particles (with diameters ranging from 0.2 to 1 mm) on the white paint. The thickness of the white paint layer was approximately 0.1 mm, which did not increase the soil cohesive strength and affect soil-cracking behaviour. The influence of the coal particles on the experimental characteristics of the sample was considered negligible due to their small diameter.
2.3. Experimental Device and Procedures
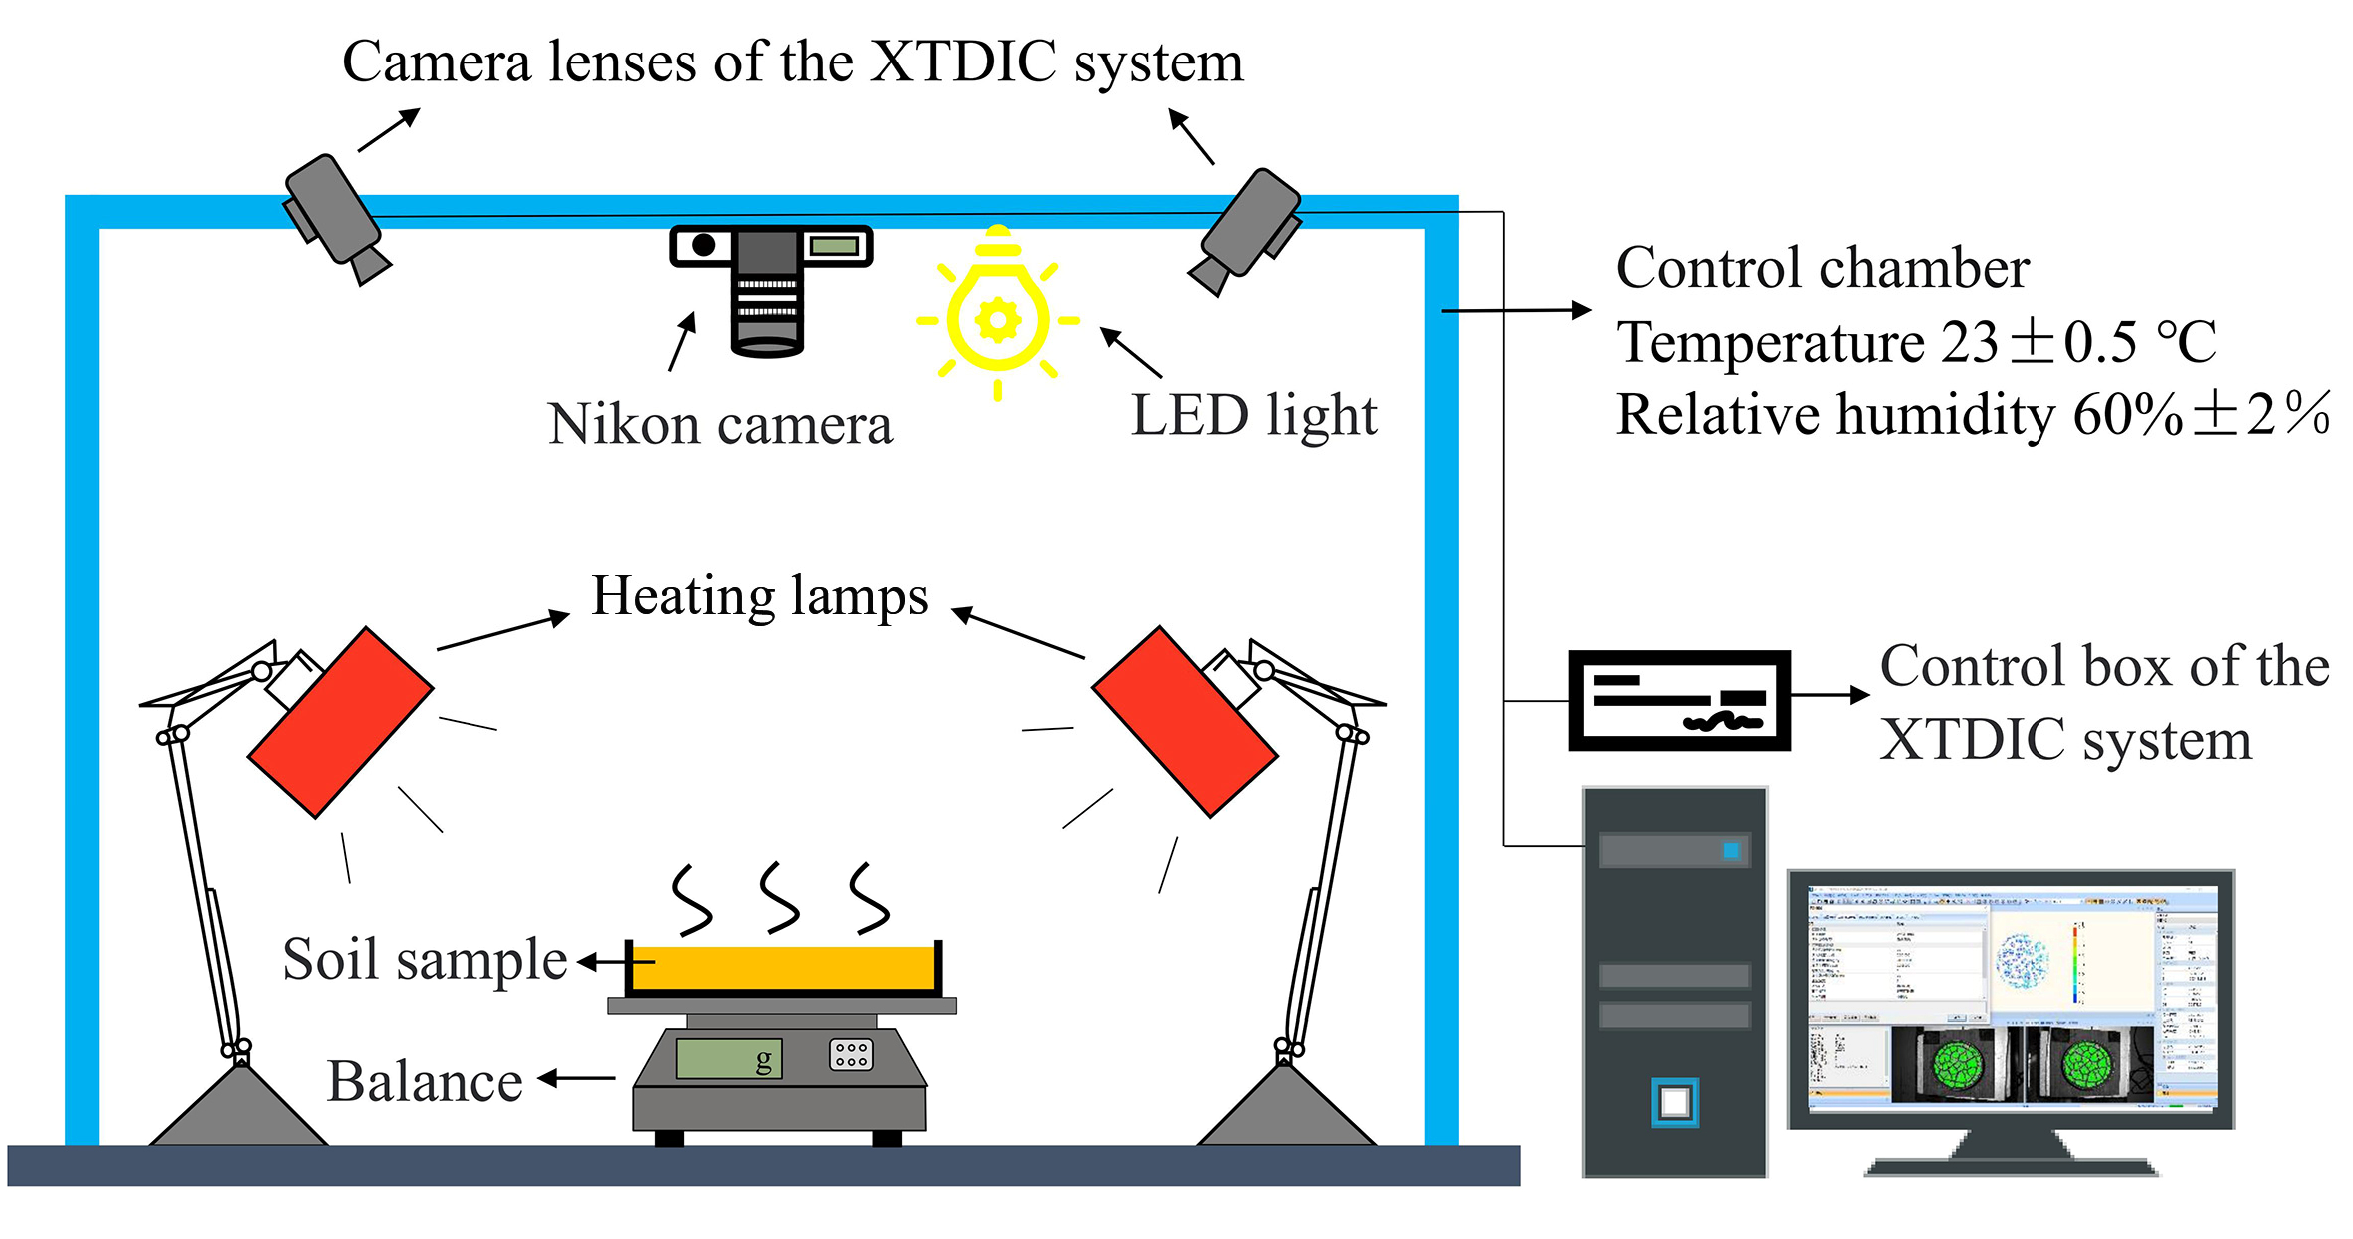
A self-designed device (Figure 1) was used to desiccate the soil sample in this test. This device can also obtain the sample mass, surface crack morphology, displacement, and strain at different time intervals.
The 3D optical non-contact deformation measurement system (XTDIC) was developed in China by Xi’an Xintuo Three-Dimension Photometry Technology Corporation (Xi’an, China). The system comprised two adjustable high-precision camera lenses, a control box, and a high-performance computer. The two lenses and LED light of the XTDIC system were mounted on a horizontal beam secured with an adjustable-height steel bracket. It combined DIC technology and binocular stereo vision technology [33]. Two cameras positioned at different angles were used to capture speckle patterns on the sample’s surface, and 3D spatial information was obtained through calibration. The captured images were analysed using the DIC algorithm to reconstruct the 3D coordinates of the points of the sample’s surface before and after deformation and to obtain the dynamic 3D deformation information of the sample. The sample was illuminated by two heating lamps with a design illumination intensity of 600 W/m2. The laboratory temperature was maintained at 23 ± 0.5 °C, and the relative humidity was 60 ± 2%. A camera (Nikon D5100, Nikon corporation, Tokyo, Japan) was placed above the soil sample to capture the sample for the extraction of crack parameters.
The sample initial mass was measured using an electronic balance (accuracy 0.1 g), and the sample initial state was simultaneously captured using the XTDIC system and camera. During the test, the heating lamps illuminated the sample surface, and the electronic balance automatically recorded the sample mass. The XTDIC system and camera automatically captured images at intervals of 10 min. The test was completed when the electronic balance showed that the difference between two adjacent readings was less than 0.5 g.
MATLAB was used to perform image digitalisation on crack photos taken at different times [34], including image binarisation, morphological processing, filtration, skeleton extraction, and deburring, as shown in Figure 2. Image binarisation enables the differentiation of crack and non-crack areas by assigning black and white pixels. Morphological processing is used to modify pixel values to enhance the cracks in the image. Filtration effectively eliminates image noise, such as coal particles, to obtain the crack area of the image. Skeleton extraction refines the cracks and extracts the skeleton of single-pixel-width cracks. Deburring yields a smooth crack photo, providing the total crack length. From these processes, the crack ratio [35], average crack width, and total crack length versus time were obtained. In addition, the moisture content of the sample versus time was obtained by analysing the electronic balance readings at different times.
3. Results and Discussion
3.1. The Influence of Moisture Content on Crack Development
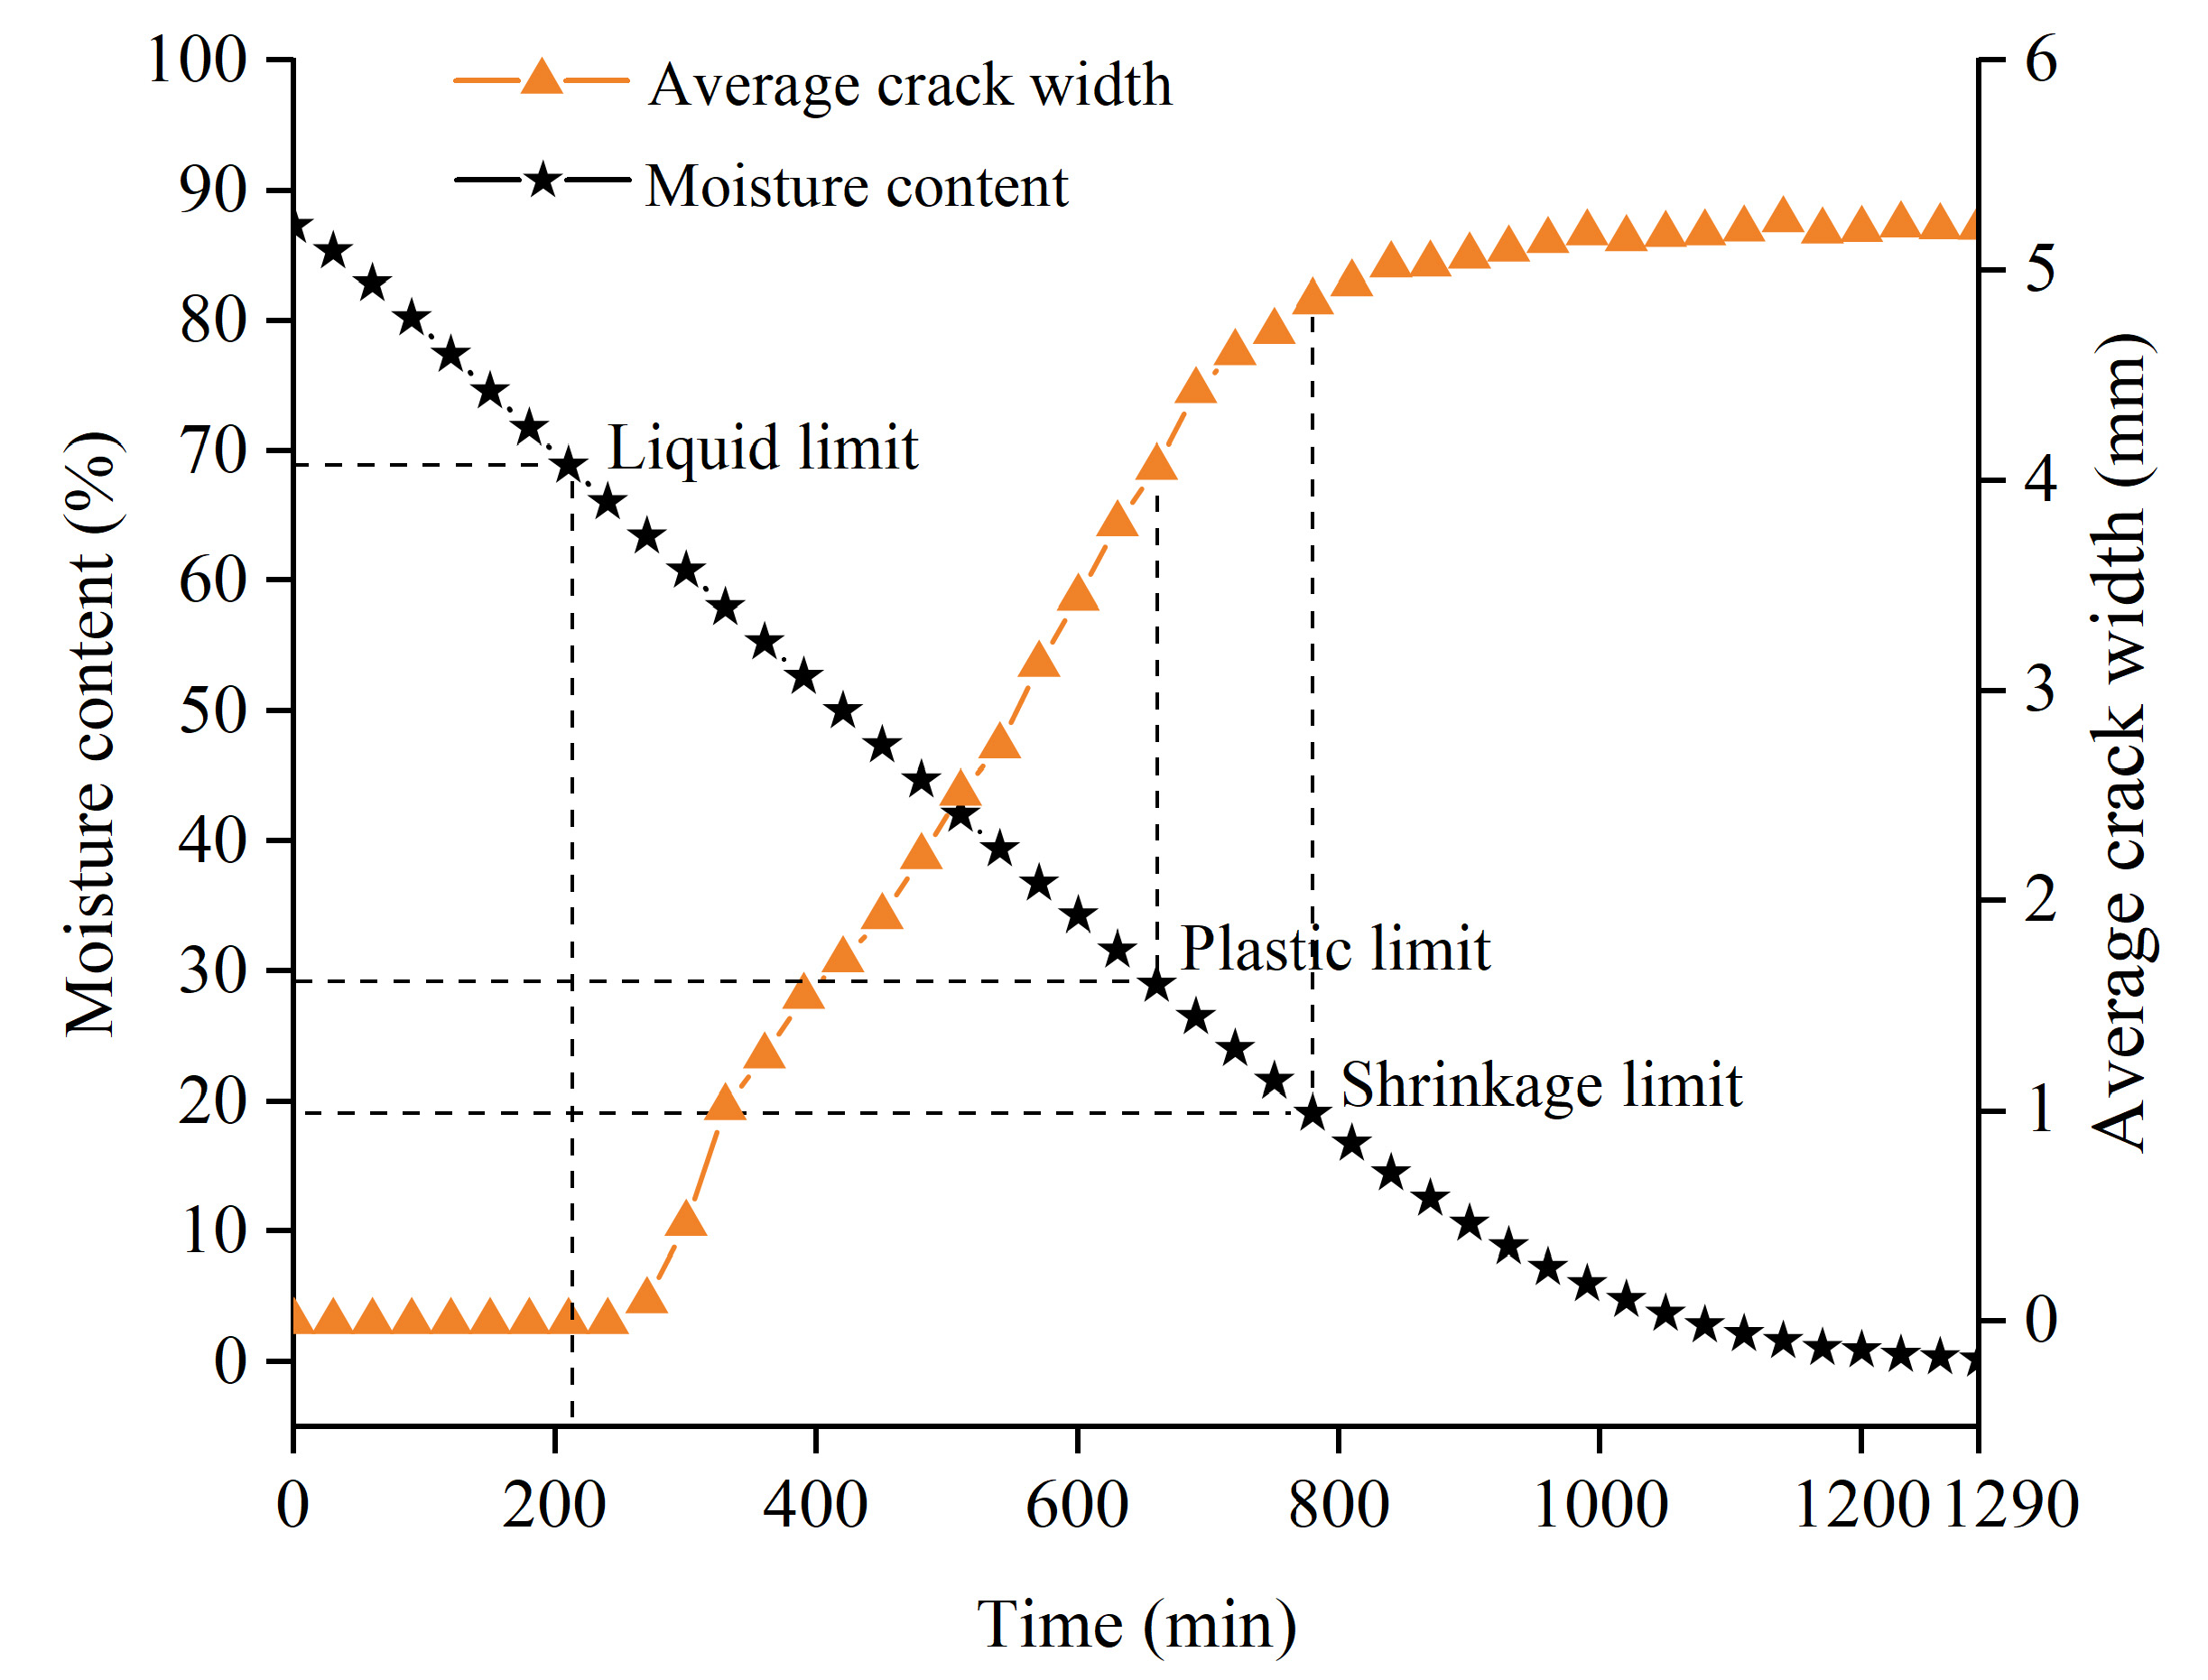
The various relationships of moisture content and crack parameters versus time are shown in Figure 2, Figure 3 and Figure 4. The relationship between moisture content (w) in percentage and time (t) in hours can be expressed as a function [36]: . The moisture content curve presented in Figure 3 can be divided into the constant rate stage (0–800 min), the falling rate stage (800–1200 min), and the stable stage (1200–1290 min). The moisture content decreased linearly versus time before 800 min. The evaporation rate was mainly affected by environmental conditions. The decreasing trend of moisture content slowed from 800 min to 1200 min. After 1200 min, the moisture content tended to stabilise, with a residual moisture content of 0.5%. An earlier study by An et al. [37] on the moisture content curve of clay slurry samples of different thicknesses obtained similar results, albeit with a different residual moisture content due to differences in soil properties and external temperature conditions.
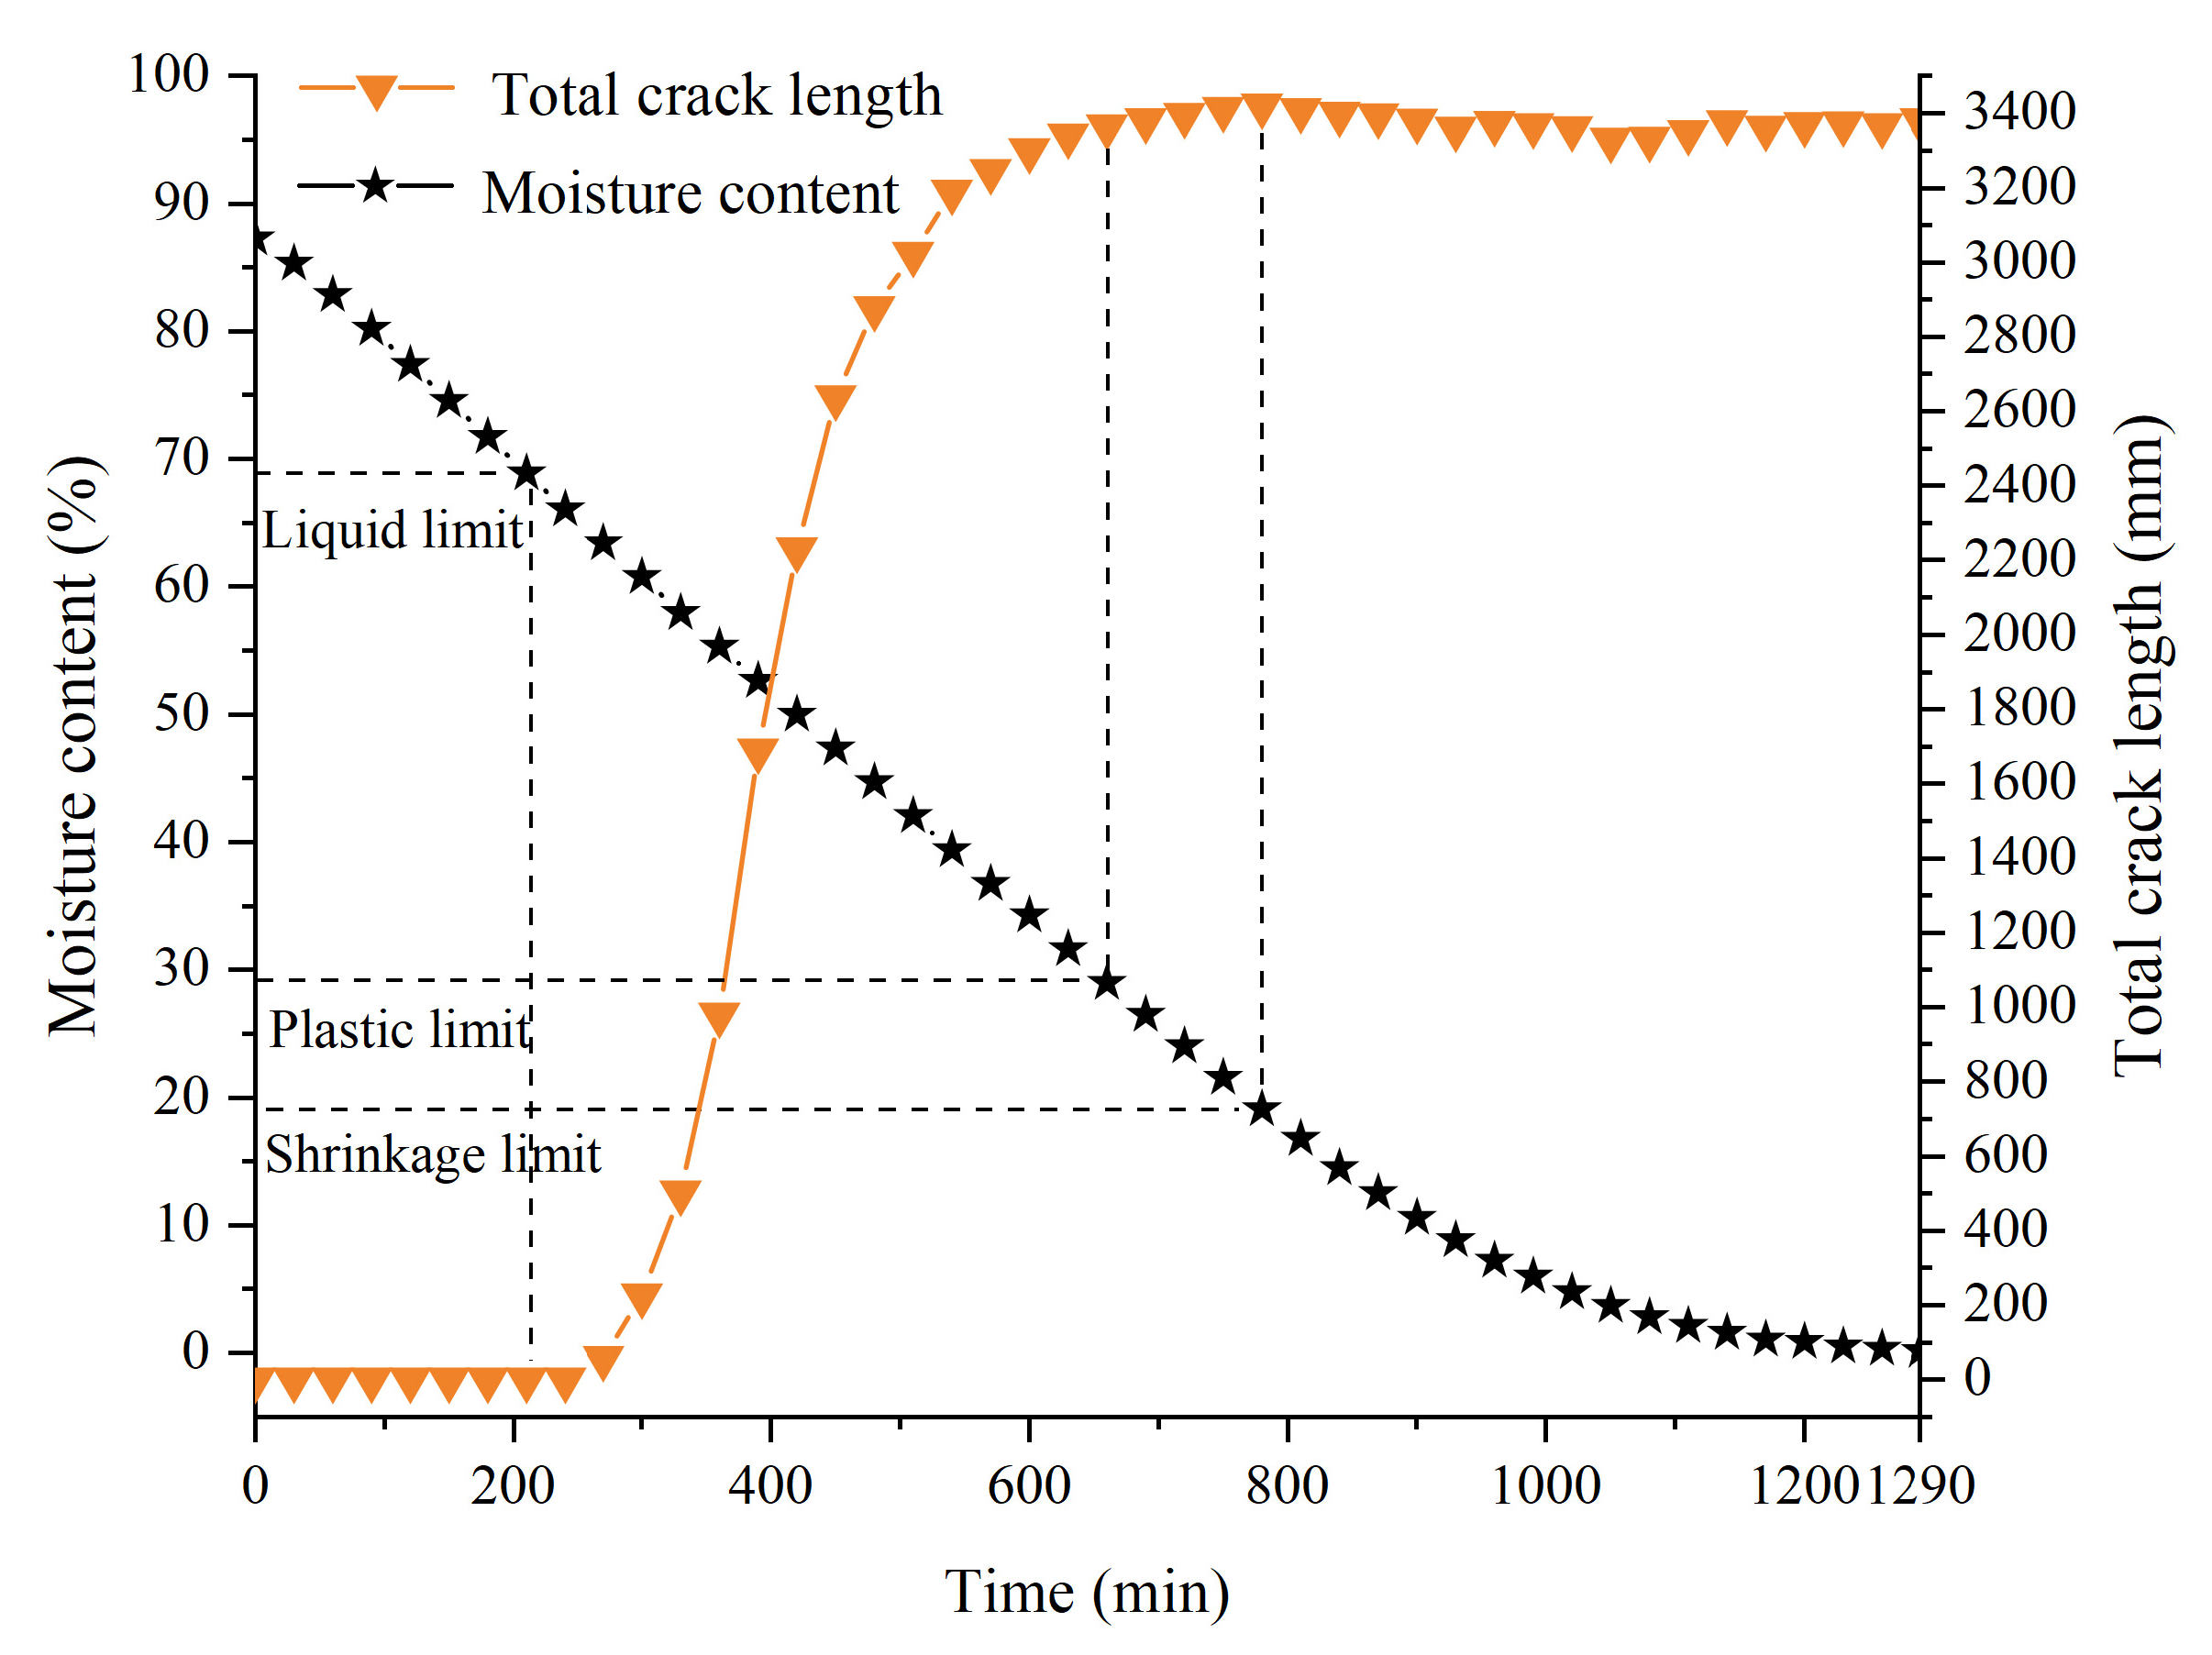
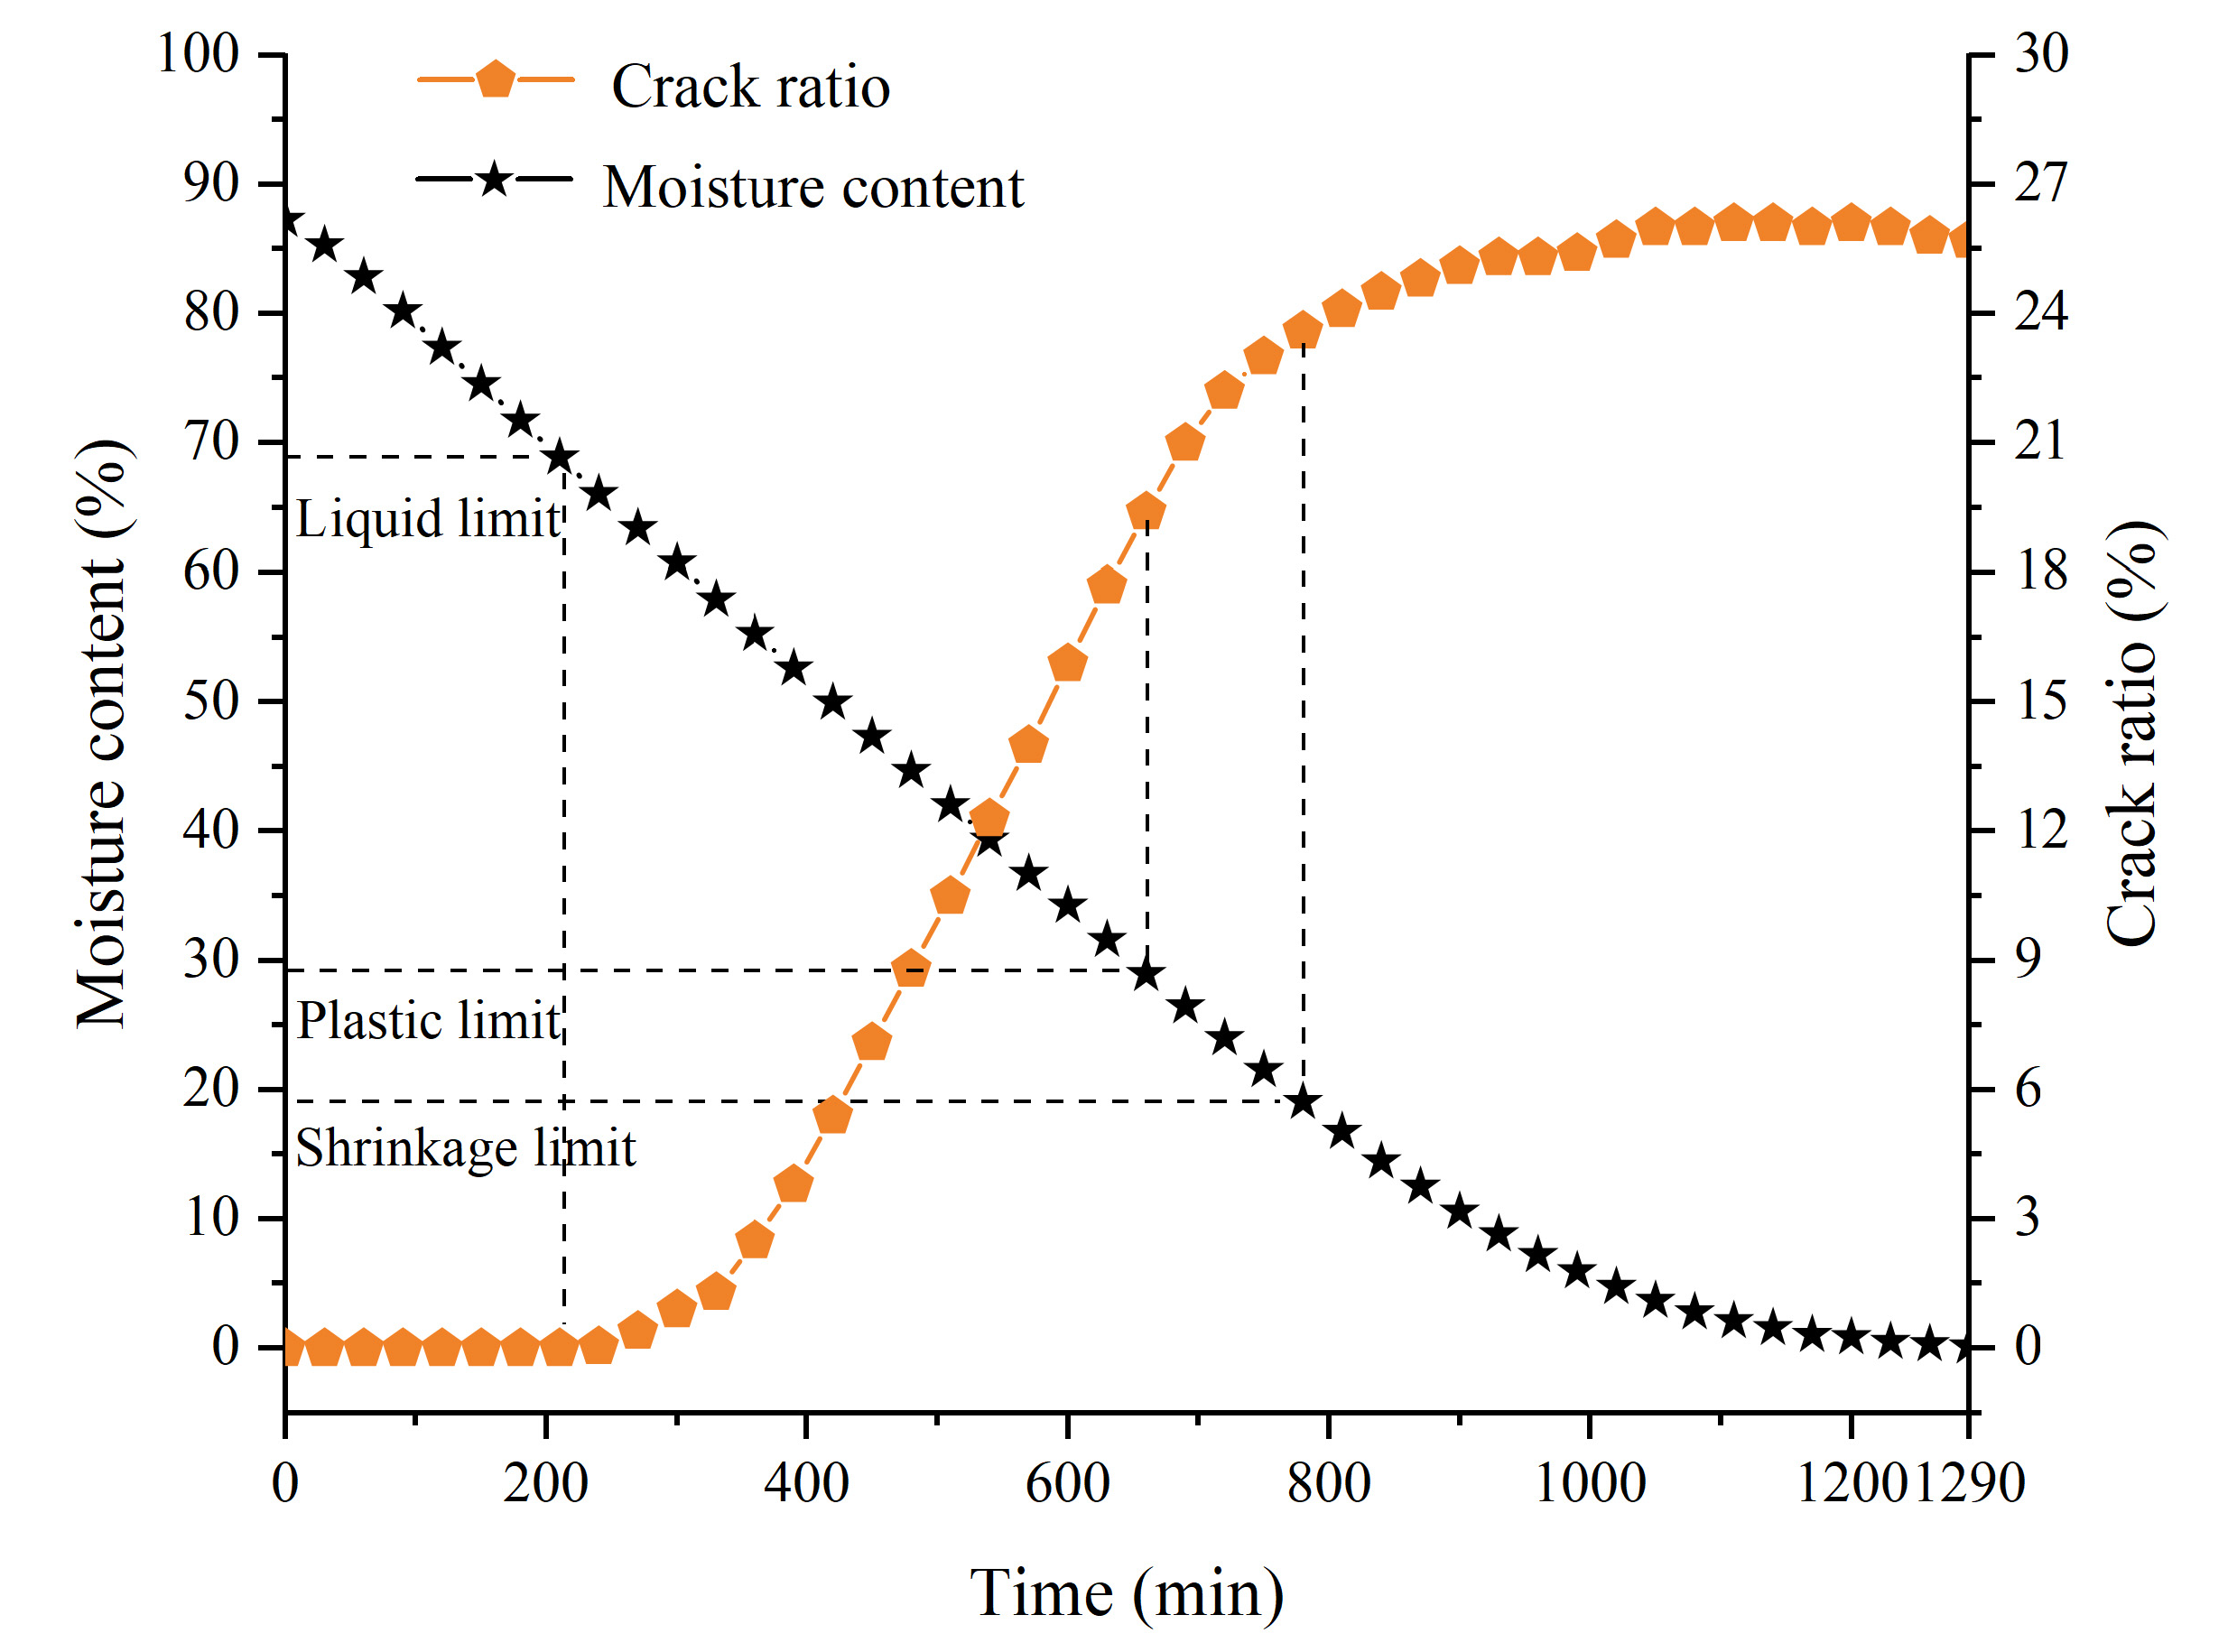
There was a certain relationship between the Atterberg limits and crack development. Such that the cracks began to initiate when the moisture content dropped to the liquid limit (67.7%), the crack length gradually stabilised when the moisture content approached the plastic limit (28.3%), and the crack length did not significantly increase when the moisture content fell below the shrinkage limit (18.8%). Combined with Figure 2, Figure 3 and Figure 4 and the crack evolution (Figure 5(a1–a6)), the relationship between crack evolution and moisture content can be verified. The first crack appeared around 270 min when the moisture content was near the liquid limit. The moisture content approached the plastic limit at 650 min. Compared to Figure 5(a5,a6), crack development slowed, crack length was basically stable, and no new cracks were formed. Instead, with moisture evaporating, crack width and depth continued to increase. The moisture content neared the shrinkage limit at 800 min, the crack length stabilised, and the crack width increase was small, indicating that crack development had gradually stabilised. In fact, the relationship between crack development and moisture content is influenced by the coupling effect of sample shape, thickness, and interface roughness [39]. Therefore, there may be discrepancies between laboratory tests and field tests.
As shown in Figure 2, Figure 3 and Figure 4, there were no significant changes in the curves of total crack length, average crack width, and crack ratio before 270 min. Subsequently, as cracks initiated and propagated, the total length, average crack width, and crack ratio increased rapidly before stabilising, but the increase rate was not constant. The total crack length stabilised earliest at 660 min, while the crack ratio and average crack width continued to increase at a slower rate until stabilising at 800 min, indicating that the increase in crack ratio was primarily attributed to the increase in crack width. The crack parameters are influenced by the sample size and initial moisture content [38], yet the overall development trend is still similar.
In addition, when the initial moisture content is greater than a certain value, overall shrinkage will occur before the cracks initiate [40]. This study took a circular slurry sample with a 200 mm diameter and 15 mm thickness as the research object. Because the cohesive force between the sample and the bottom surface of the container was greater than the shrinkage stress, there was no overall centripetal shrinkage during the desiccation process. Hence, it is speculated that the critical moisture content is meaningful only for saturated soil, and the initial moisture content of unsaturated soil is the critical moisture content.
3.2. Interaction between Displacement Changes and Crack Evolution
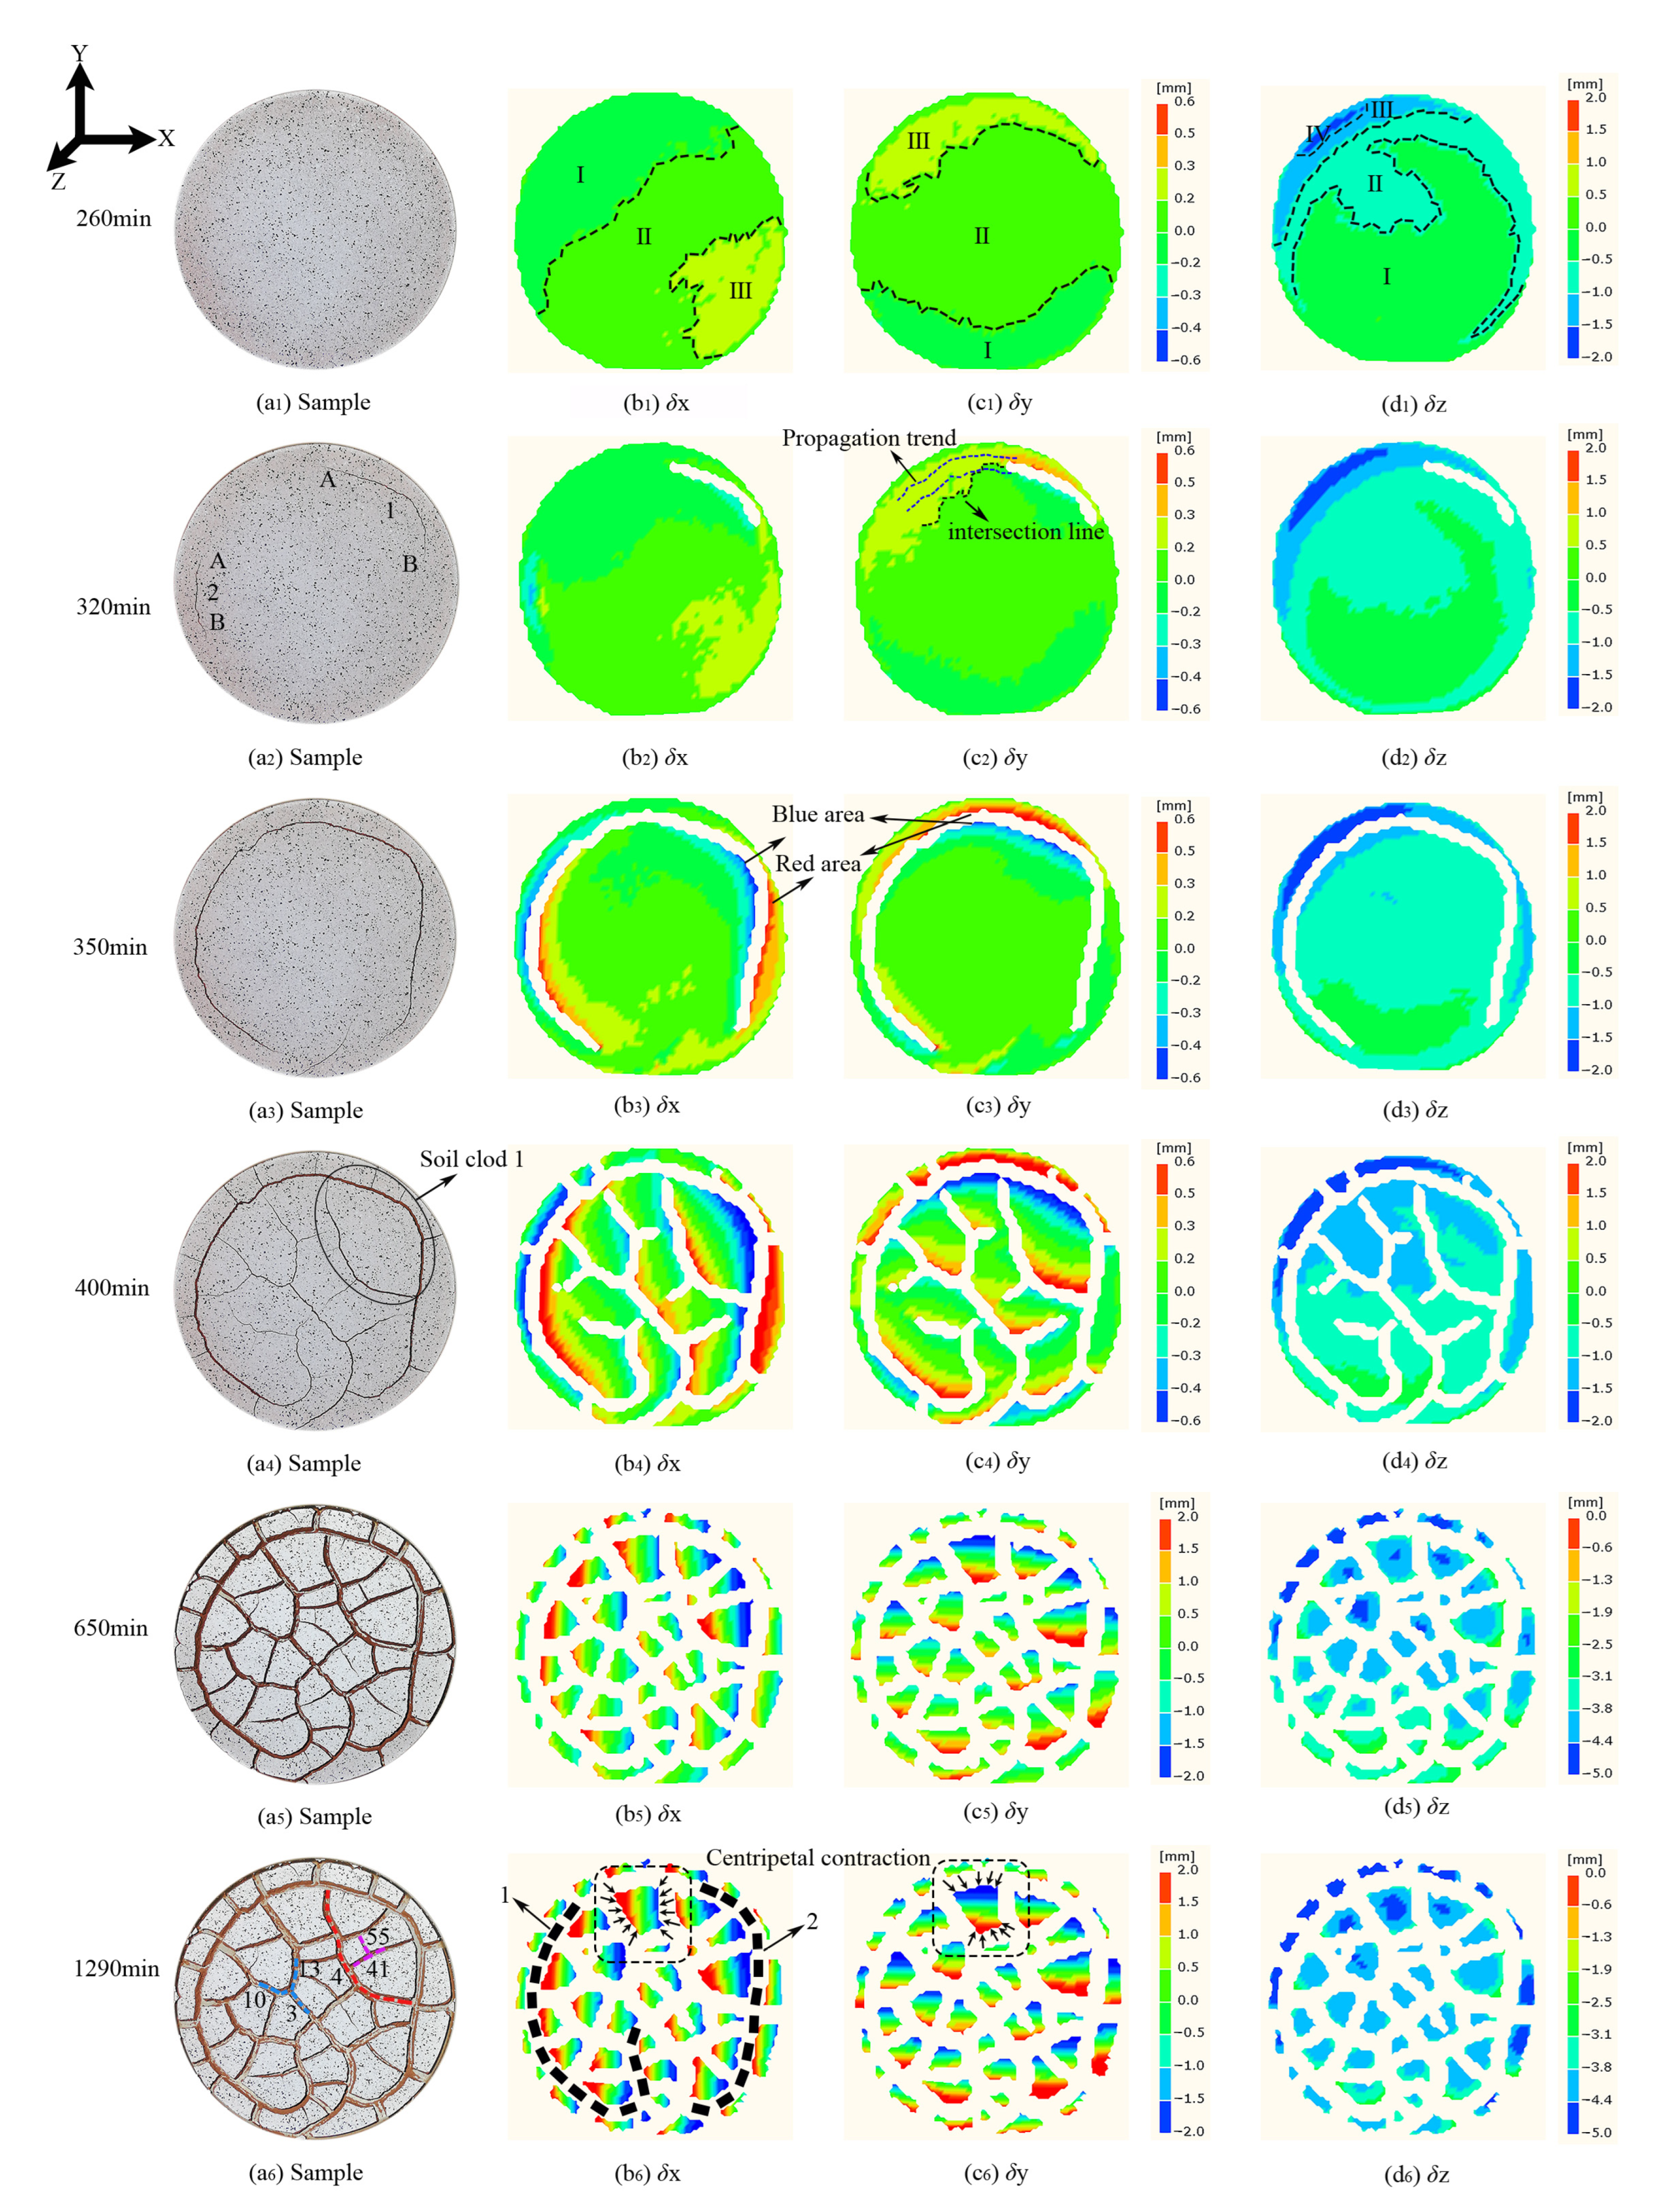
Figure 5 shows the crack photos and displacement images of the sample at different times. The horizontal transverse displacement, horizontal longitudinal displacement, and vertical displacement are represented by δx, δy, and δz, respectively. The X-axis represents the horizontal transverse direction, the Y-axis represents the horizontal longitudinal direction, and the Z-axis represents the vertical direction (positive upwards and negative downwards).
As shown in Figure 5(b1–d1), cracks have not yet initiated at 260 min, and the displacement fields could be divided into 3–4 areas which distributed more evenly than in later stages. The vertical displacement (δz) was negative, indicating a single-directional contraction trend, with a greater magnitude compared to the horizontal displacements (δx and δy). From 320 min to 650 min, opposite-directional horizontal displacements appeared on both sides of the cracks as cracks widened, which increased rapidly with time. The red and blue areas on both sides of the cracks in Figure 5(b3,c3) showed a faster increase in displacement compared to the non-cracked areas. At 1290 min, multiple displacement fields with different colours existed on the small soil clod when the displacement field stabilised (Figure 5(b6–d6)). The horizontal displacement decreased from the edges of the soil clod towards the centre, while the vertical displacement showed an opposite trend. Such as the small soil clod in Figure 5(b6,c6), the arrows represent the direction of the soil clod shrinkage. According to the displacement field evolution of the small soil clod, it can be observed that the shrinkage deformation of the small soil clod could present the phenomenon of centripetal shrinkage, and the shrinkage centre of the small soil clod also changed with time [41].
The direct cause of crack initiation is the relative displacement between adjacent displacement fields caused by uneven soil shrinkage, and crack initiation can be explored by analysing the relative displacement. Soil desiccation cracks were typical tensile cracks that initiated when the relative displacement at the intersection of different displacement fields exceeded the soil limiting value. As the tensile stress is greater in the upper layer than the lower layer of the soil, cracks usually propagate from the surface downwards [42]. By analysing the relative displacement on both sides of the cracks and the potential positions of cracks, the minimum relative displacement for crack initiation in the tested soil sample was preliminarily determined to be 0.2–0.25 mm. As shown in Figure 5(c1), the δy on both sides of crack 1 (Figure 5(a2)) was approximately 0.2 mm before it initiated.
The relative displacements in different directions between adjacent displacement fields influence the trend and rate of soil crack development. Comparing Figure 5(b2–d2), the initiation of crack 1 at the intersection of the displacement fields in Figure 5(a2) was mainly due to the influence of δy, but it was also influenced by δx and δz during its development process because crack 1 did not always develop along the intersection line of the yellow and green displacement fields in the Y direction shown in Figure 5(c2). The larger the relative displacement, the faster the crack develops. Near the A-ends of cracks 1 and 2 in Figure 5(a2), the relative displacement in all directions was greater than near the B-ends, leading to the A-ends developing faster than the B-ends. When the soil displacements on both sides of the crack were different, the crack extended towards the larger displacement side, resulting in a Y-shaped or arc-shaped crack, such as arc crack 4 (red) and the Y-shaped crack (blue) formed by cracks 3, 10, and 13 in Figure 5(a6). Conversely, when the soil displacements on both sides of the crack were equal, the crack propagated in a straight line and intersected with the previous cracks to form a T-shaped crack, such as the T-shaped crack (purple) formed by cracks 41 and 55 in Figure 5(a6).
The initiation and propagation of cracks cause changes in the distribution and magnitude of the displacement fields around the cracks. As cracks propagate, moisture evaporates faster from the edges of soil clods and induces more pronounced centripetal shrinkage, leading to greater changes in the displacement fields on both sides of cracks than in the centre of small soil clods (Figure 5(b4–b6,c4–c6)). However, this effect appears to have little influence on vertical displacement fields (Figure 5(d4–d6)). The increase rate of horizontal displacement around the crack is greater when the crack initiates earlier, requiring more time to reach stability and resulting in larger values after stabilisation. For example, the δx and δy of early soil clods around cracks 1 and 2 are generally larger than those of late soil clods in other areas shown in Figure 5(b6). Moreover, the shape, size, and centre position of soil clods change with time, and early formed soil clods may form cracks and divide into smaller soil blocks later. Only the displacements of the central area of the final formed soil clods were smaller than that of their edges. Refer to the displacement field evolution of small soil clod 1 in Figure 5(a4).
3.3. Interaction between Strain Changes and Crack Evolution
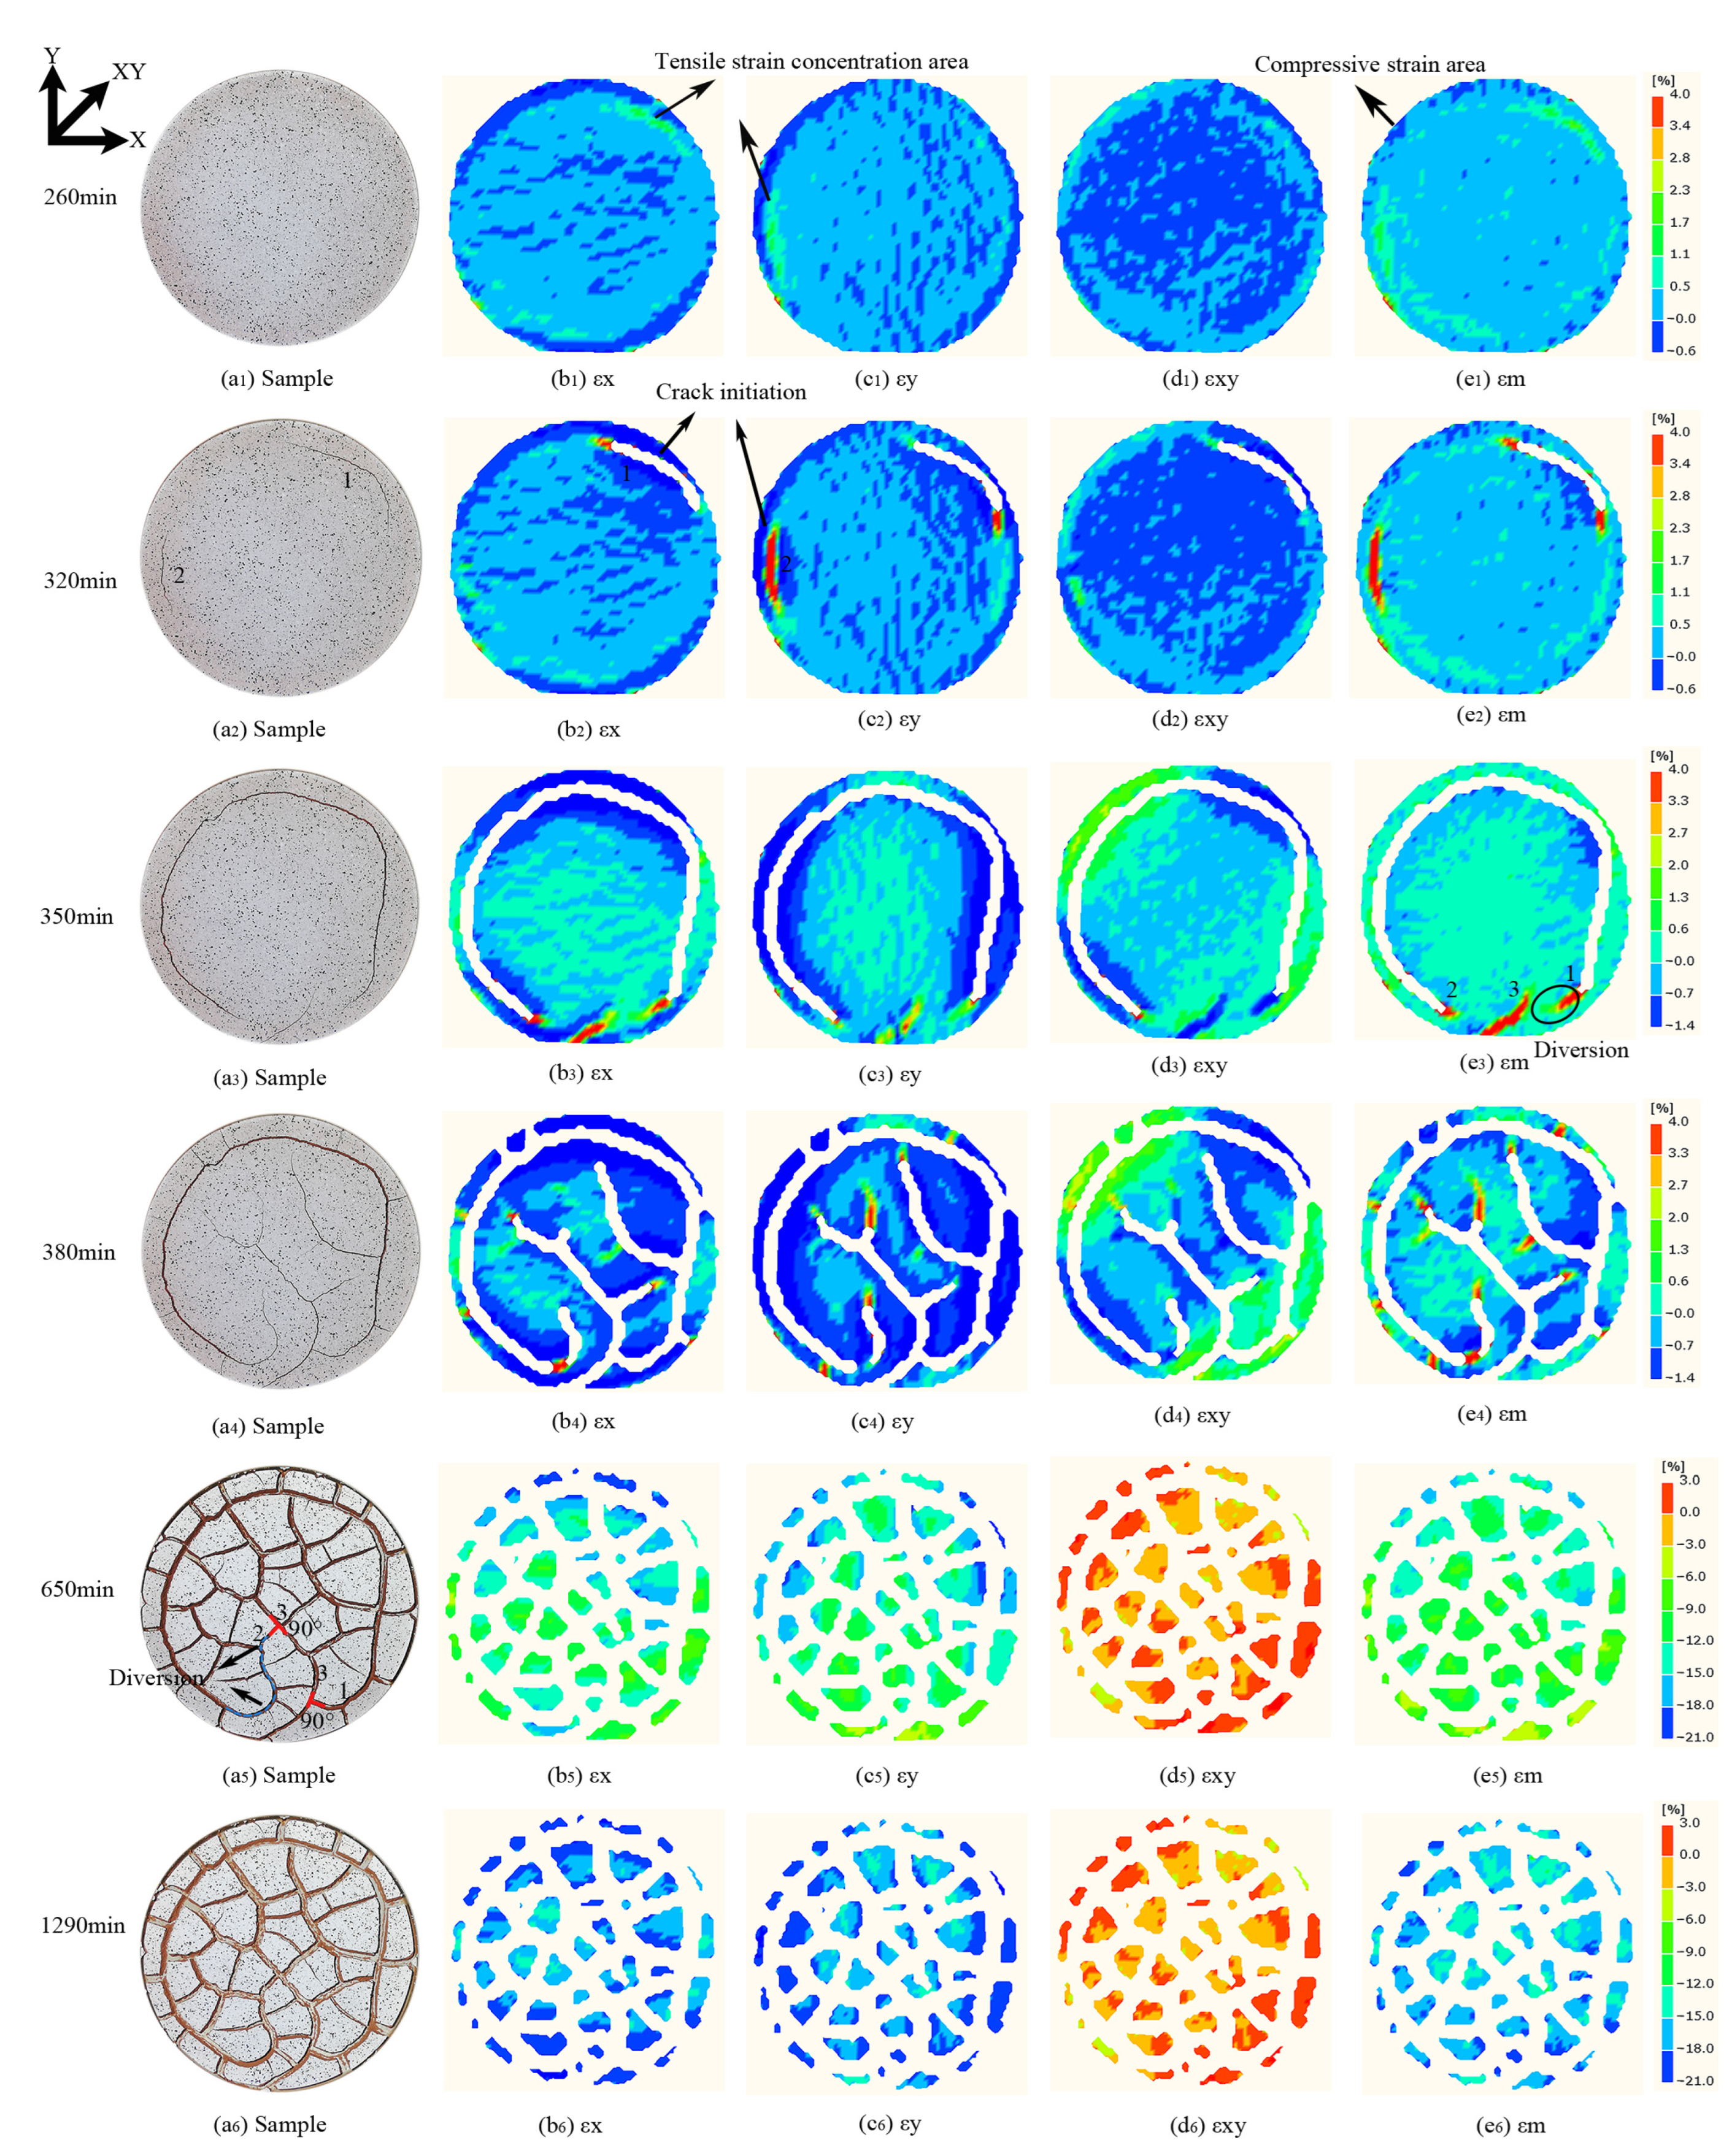
Figure 6 shows the crack photos and strain images at different times. The horizontal transverse strain, horizontal longitudinal strain, shear strain, and maximum principal strain are represented by εx, εy, εxy, and εm, respectively. Positive values indicate a tensile strain, while negative values indicate a compressive strain.
At 260 min, tensile strain predominated on the soil surface, while compressive strain was concentrated in a few areas along the container edge (Figure 6(e1)). Starting from 320 min, tensile strain gradually increased and was quickly concentrated at the crack tip. Beginning at 350 min, new cracks began to propagate towards the sample centre, accompanied by high compressive strain around the cracks. The tensile strain gradually changed to compressive strain until it stabilised at 650 min, where the entire soil surface was under compressive strain (Figure 6(e5)). The changes in εx and εy were similar to εm, and εxy changed from a compressive state to a tensile state.
The strain parallel to the crack direction was greater than that perpendicular to the crack direction. Such as crack 2 was parallel to the Y-axis, so εy was significantly larger than εx. The strain distribution was usually uneven due to the uneven soil shrinkage, leading to concentration areas of tensile and compressive strain in the strain images. When the strain stabilised, εxy was significantly smaller than εx and εy.
According to the concentration areas of tensile strain, the subsequent crack initiation and propagation can be preliminarily predicted. In Figure 6(b1,c1), two green areas of tensile strain concentration appeared approximately parallel to the container wall due to boundary effects [43]. Subsequently, cracks 1 and 2 initiate in this area, as shown in Figure 6(a2). It can be inferred from Figure 6(e1–e5) that cracks may initiate when the εm in an area exceeds 2.3%. Once the cracks initiated, the accumulated local tensile strain energy was released, with tensile stress concentrating on the crack tip and directing the crack propagation. For example, εm near the tip of cracks 1 and 2 in Figure 6(e1) is close to 2.3%.
The crack initiation and propagation were influenced by the surrounding strain fields, which also reacted on the evolution of the surrounding strain fields. Crack 1 was influenced by the strain field near the newly formed crack 3 (Figure 6(e3)), resulting in a change in its original circular propagation trend and intersecting with crack 3 at 90°, whereas crack 2 intersected with crack 3 near 90° after several diversions (Figure 6(a5)). When the sample thickness exceeds 4 mm, the cracks intersect at 90°, whereas if it is less than 4 mm, cracks typically intersect at 120° [44].
The evolution of the maximum principal strain near cracks 1–3 in Figure 6(e3,e4) shows that the initiation of adjacent crack 3 releases the previously accumulated strain energy, leading to the local rearrangement of the strain field [45], which influences the propagation trends of cracks 1 and 2 by altering the stress fields around them. As moisture evaporates, the cracks widen causing the surrounding soil to be compressed. The tensile strain areas on the sides of the cracks gradually transform into compressive strain areas, but the influence of this transition does not extend to the strain fields around the non-crack areas. Therefore, the tensile strain areas gradually decrease as the number of cracks increases, and the compressive strain areas expand.
3.4. Relationship between the Temporal and Spatial Evolution of Soil Surface Deformation and Cracks
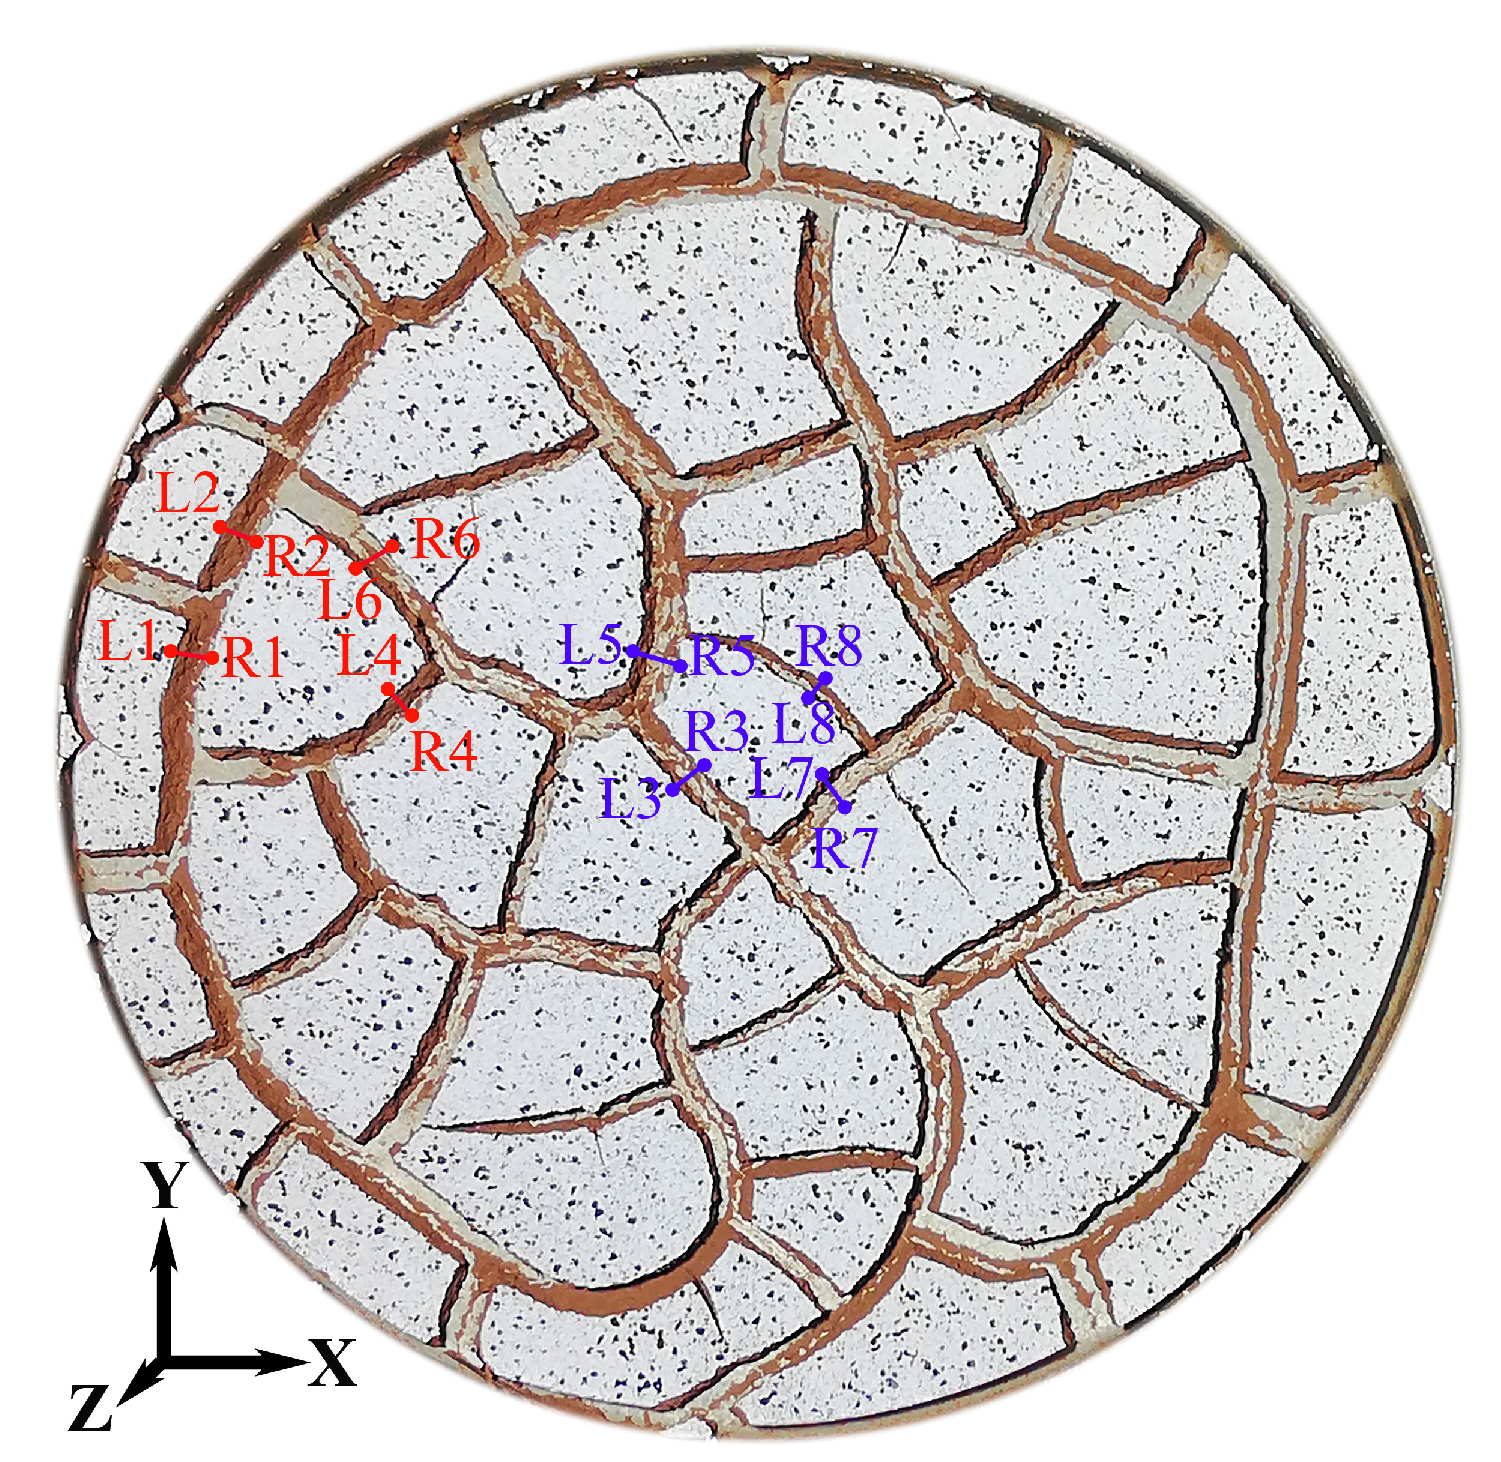
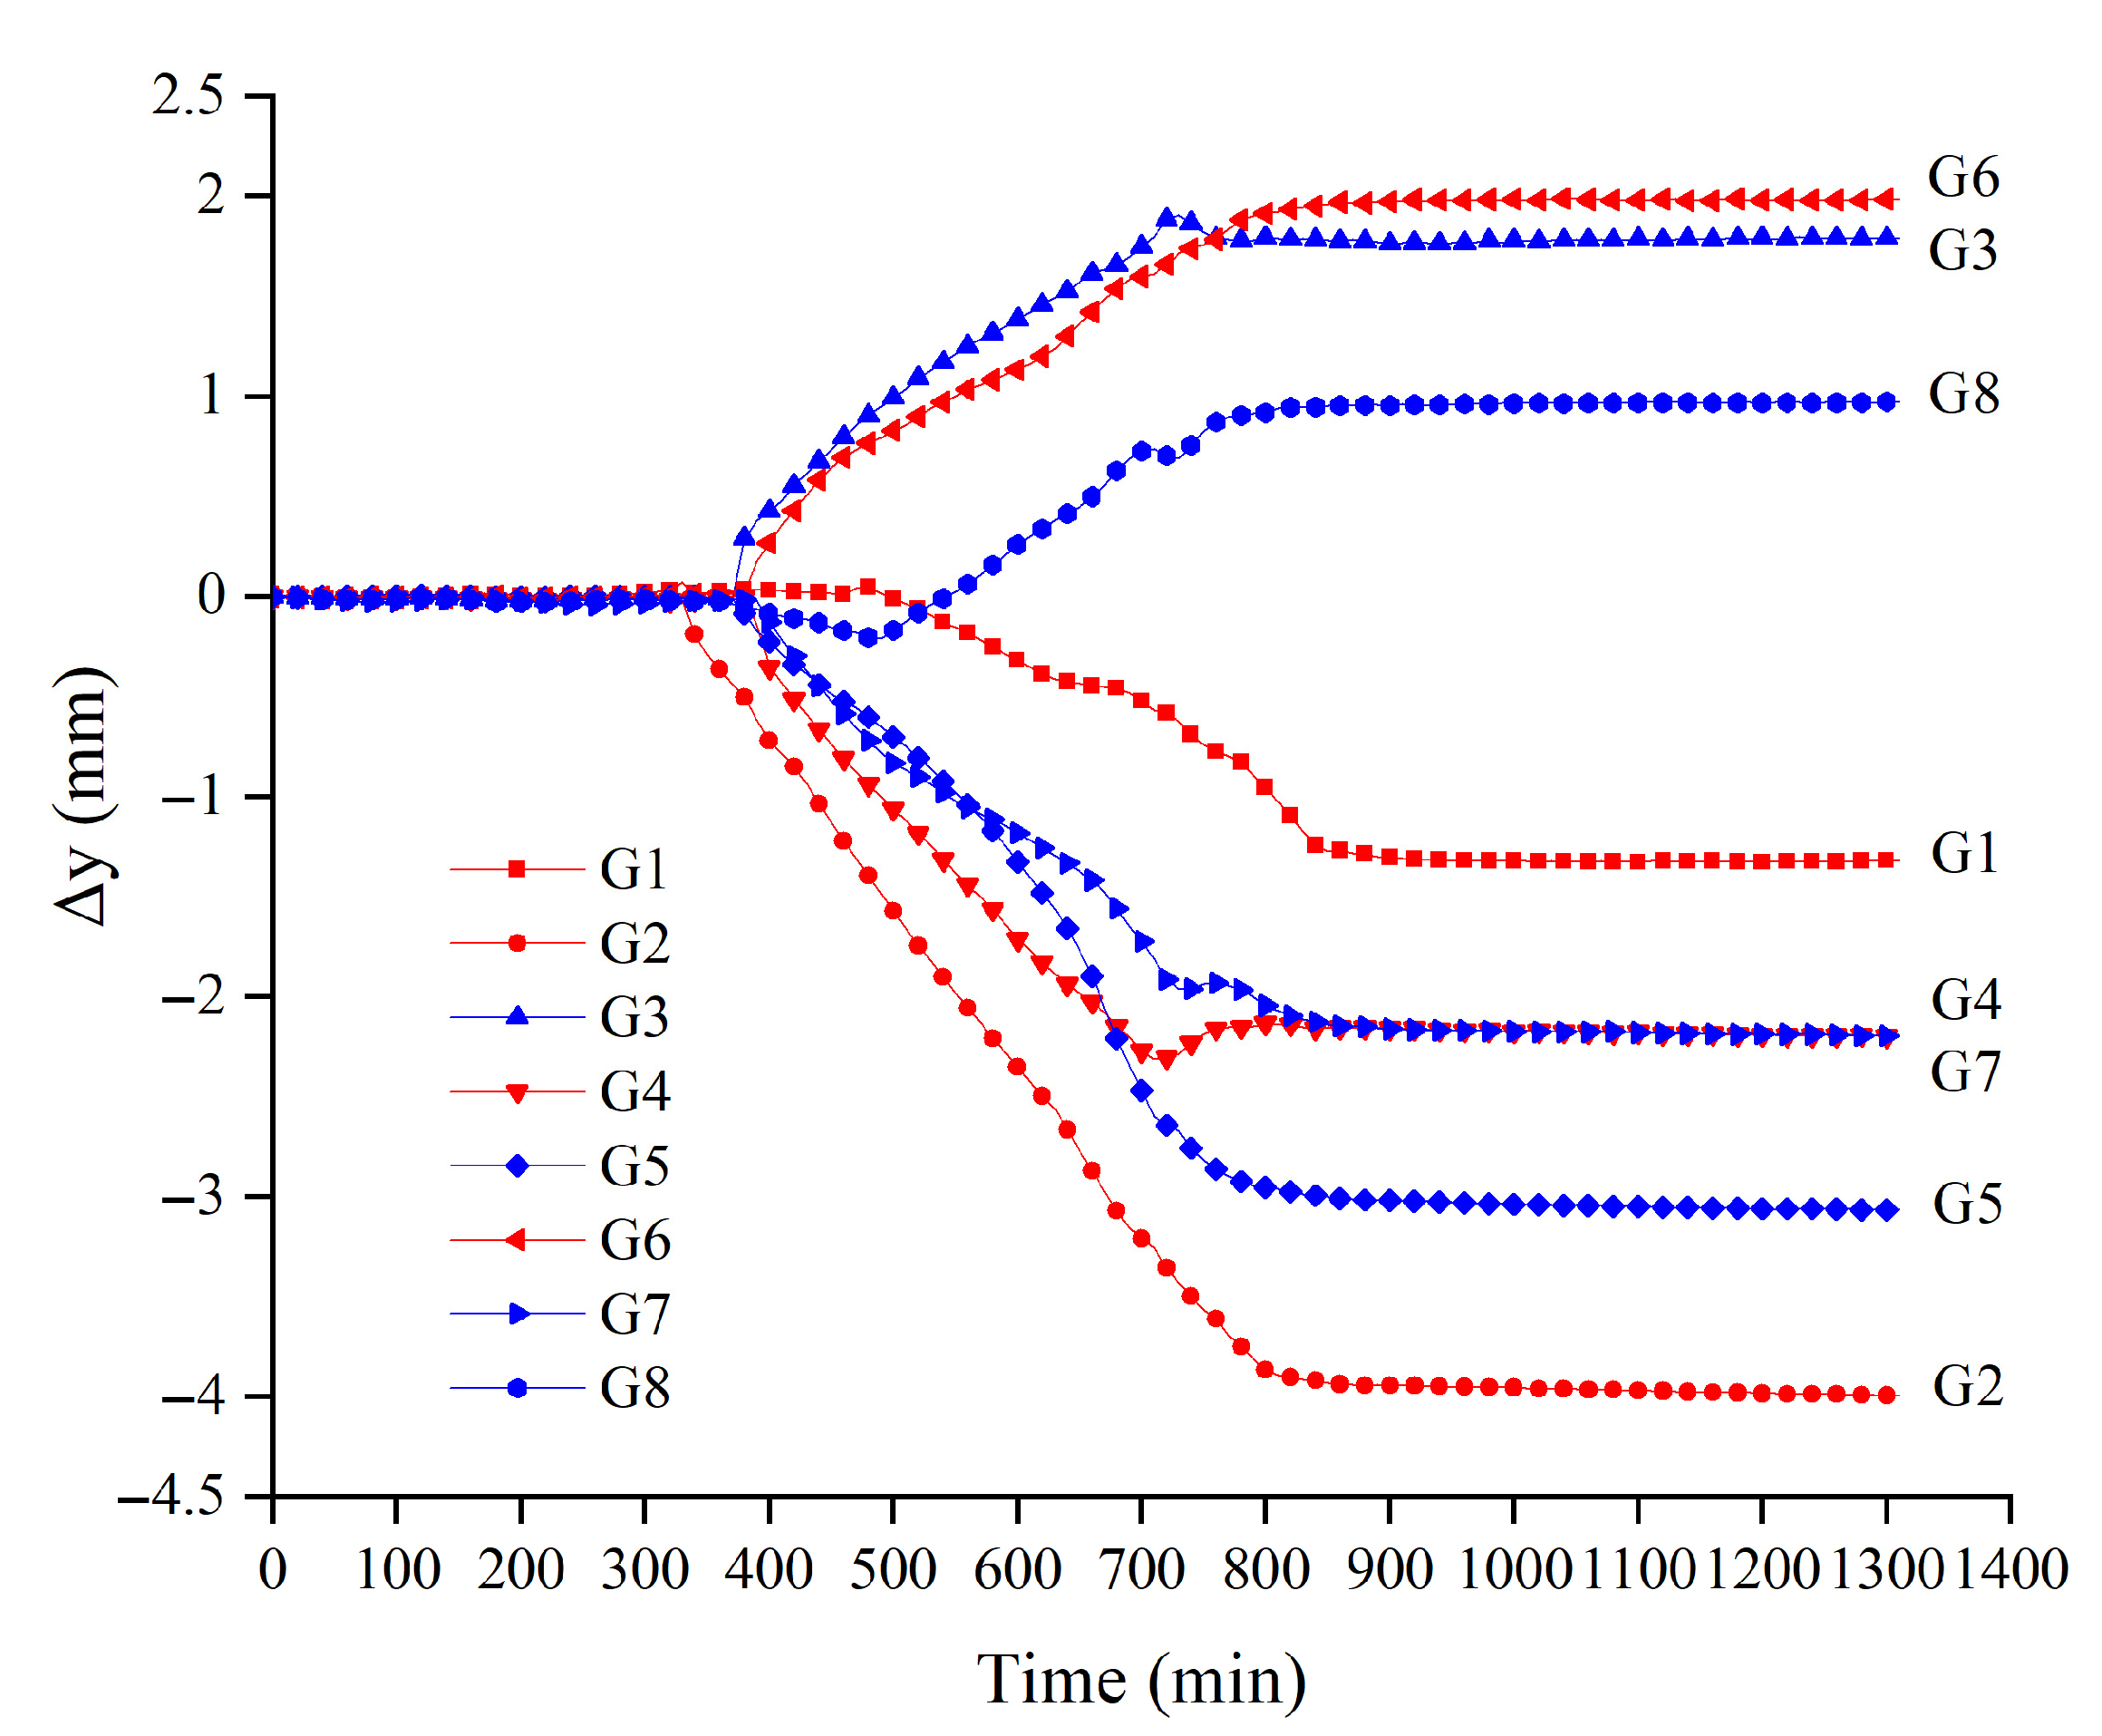
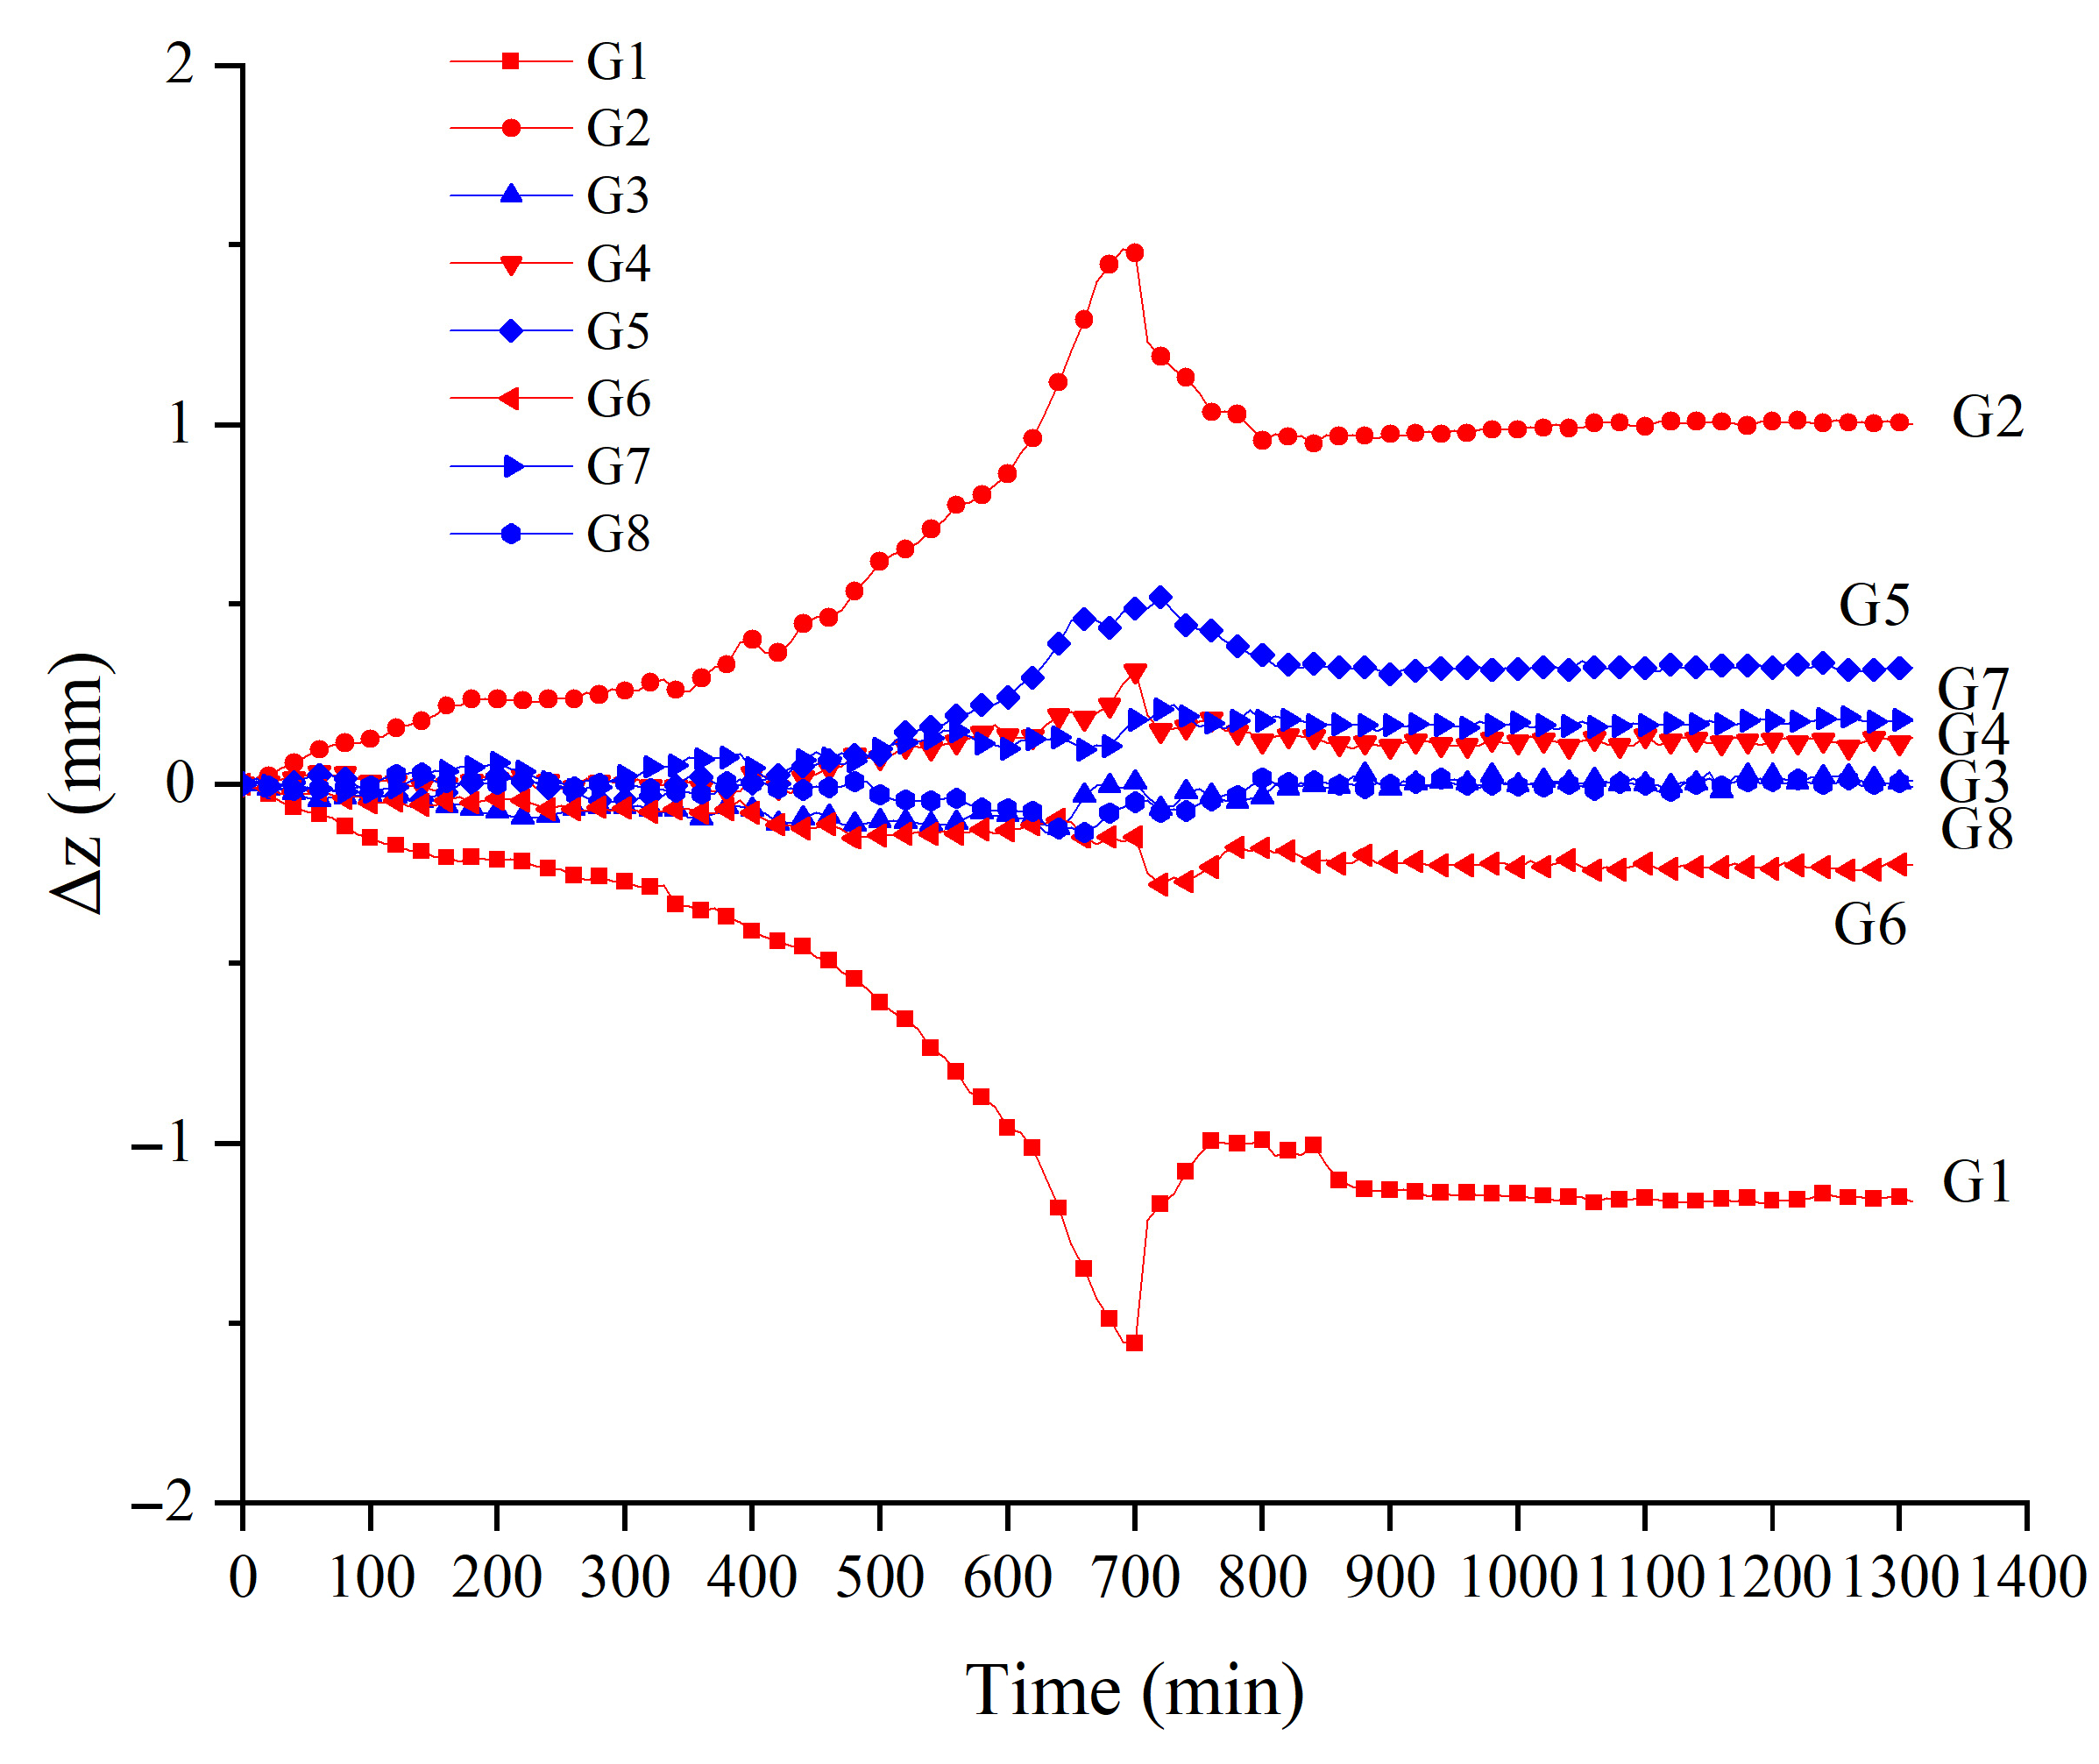
In Figure 7, eight positions where cracks initiated at different times are presented, and sets of relative displacement feature points (Gi) are selected on both sides of each position, including the left feature point (Li) and the right feature point (Ri). The relative displacements in each direction for each set of feature points are calculated (i.e., the displacement of Ri minus the displacement of Li in the same direction). The horizontal transverse relative displacement, horizontal longitudinal relative displacement, and vertical relative displacement are represented by Δx, Δy, and Δz, respectively. The X-, Y-, and Z- axes represent the horizontal transverse direction, horizontal longitudinal direction, and vertical direction. Two areas of soil samples were selected for analysis (feature points G1–G8, differentiated by red and blue, where cracks near G1–G8 initiated at 320 min, 330 min, 360 min, 370 min, 370 min, 380 min, 390 min, and 510 min). The relationship between the relative displacement of each point and time is shown in Figure 8, Figure 9 and Figure 10.
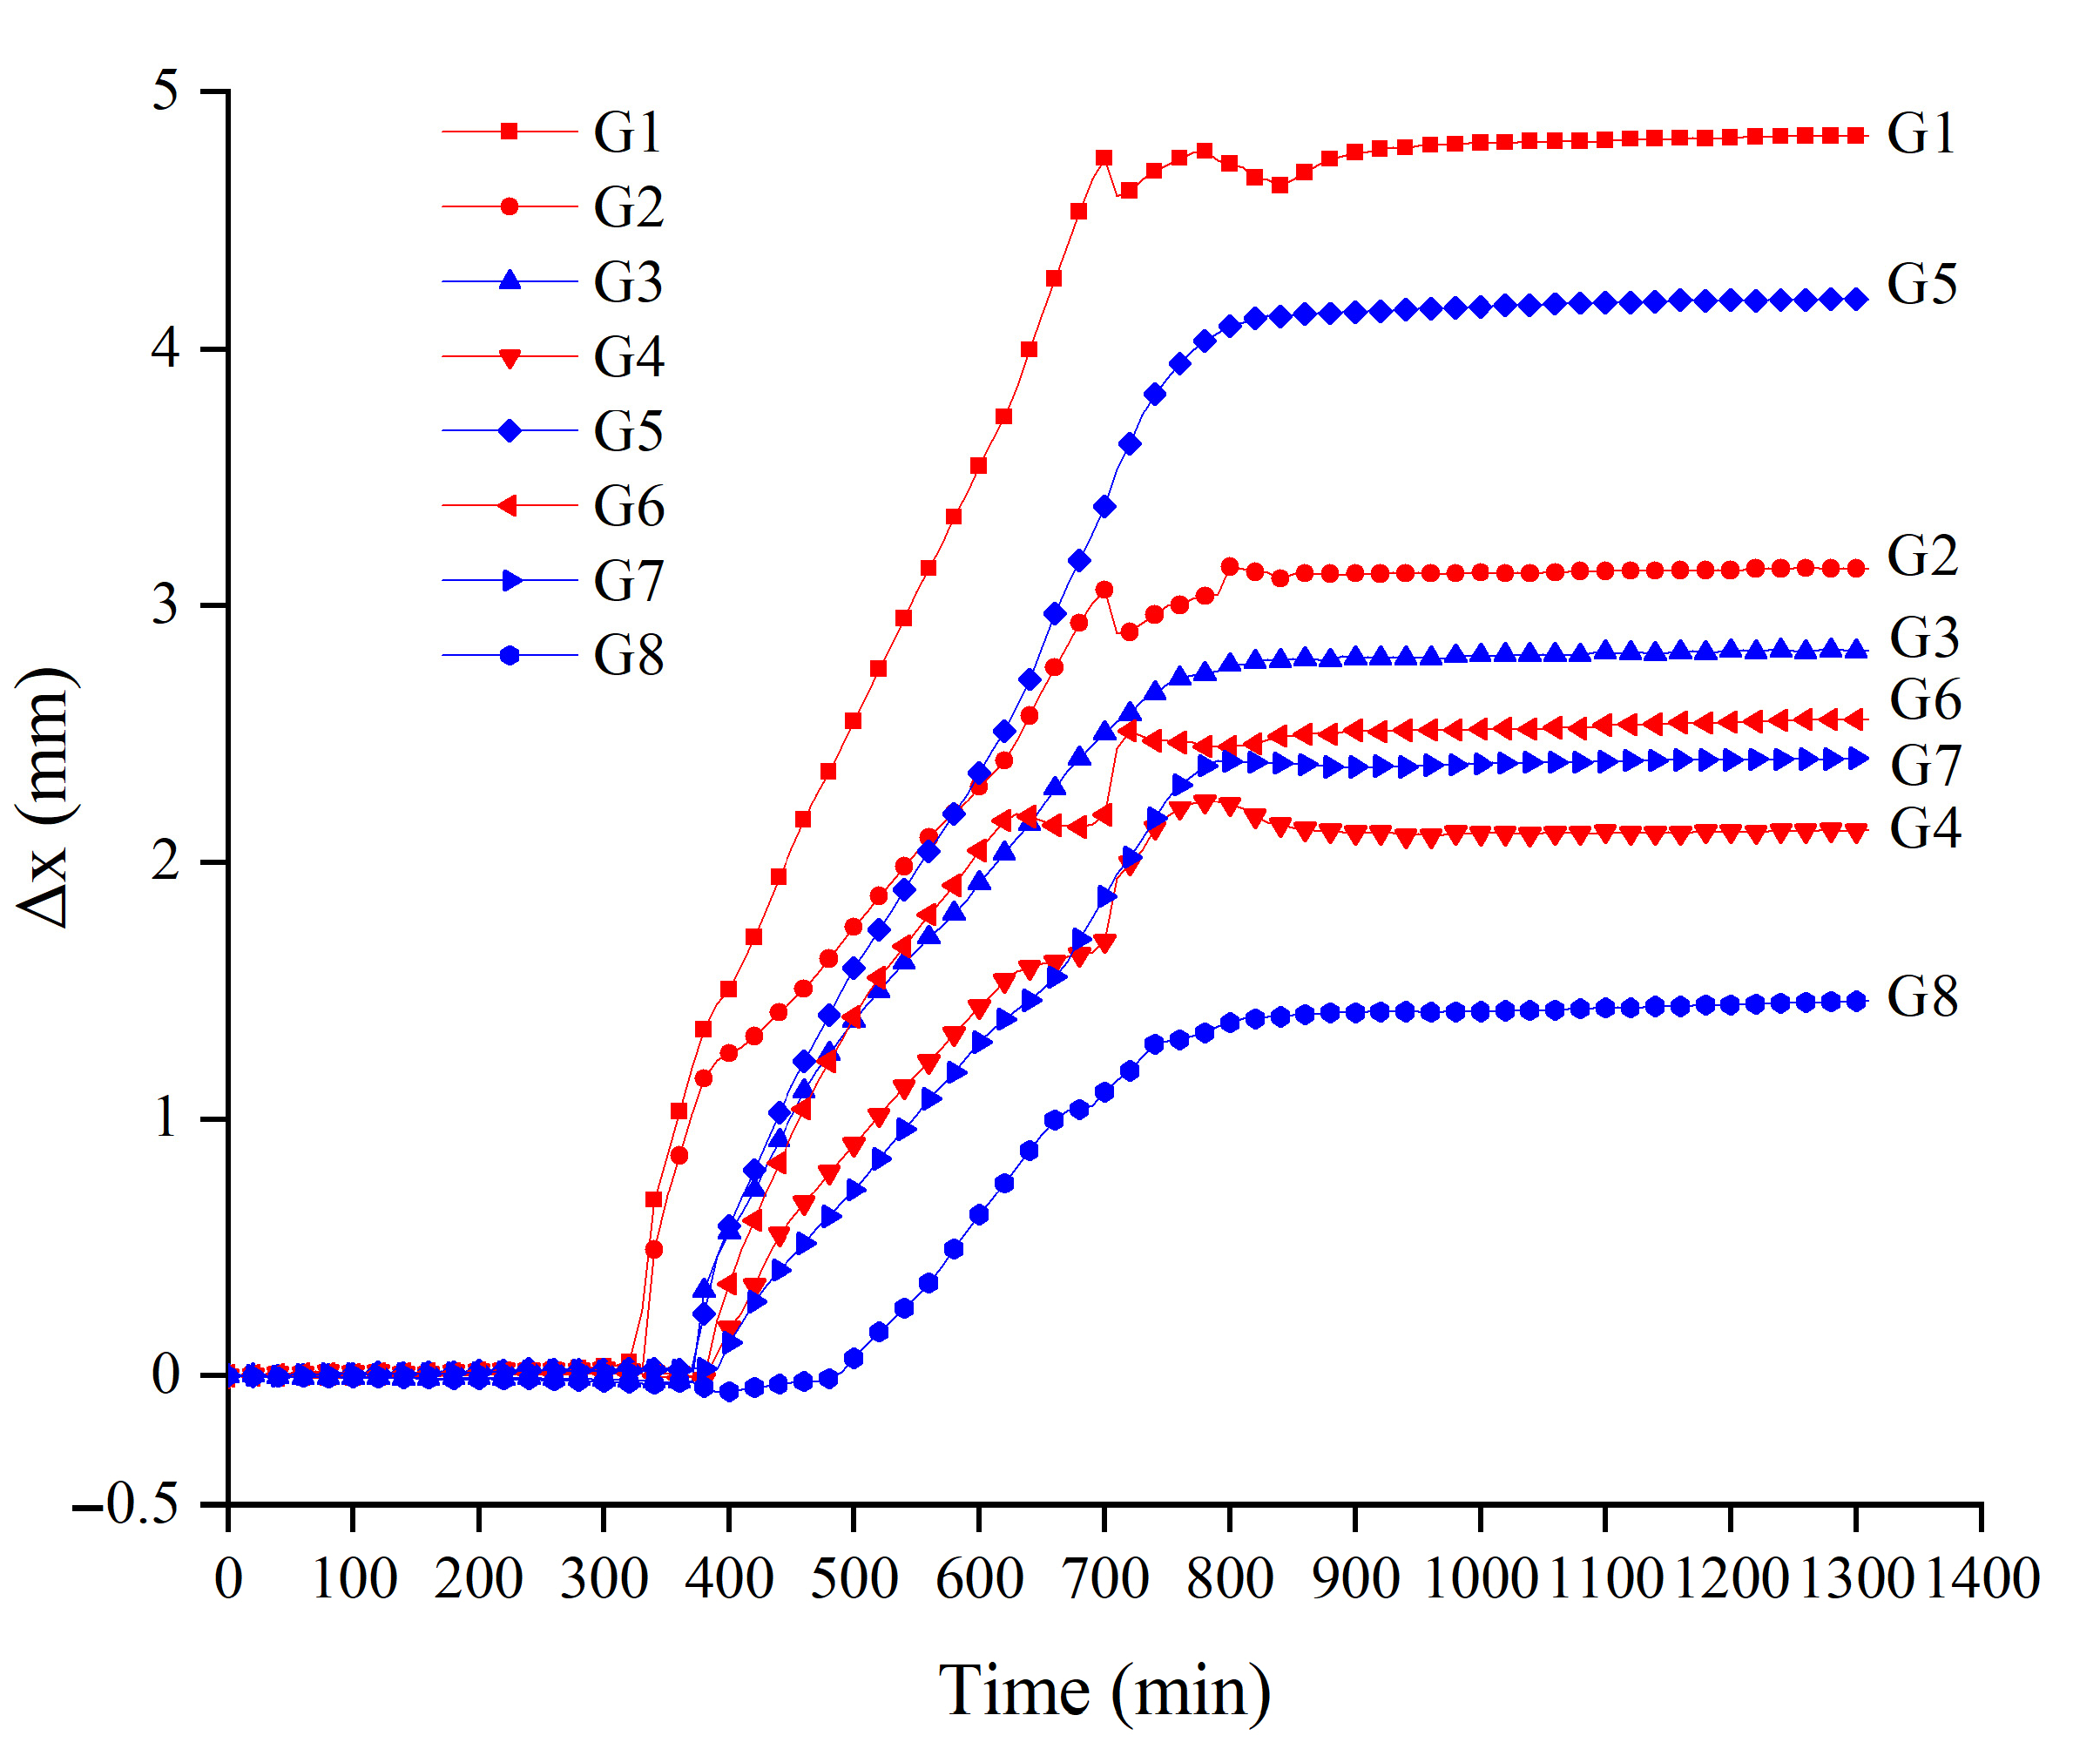
The relative displacement curves can be roughly divided into three stages. In the first stage (before crack initiation), Δx and Δy were not significant, and Δz of G1 and G2 increased with time, but Δz of other feature points was very small. In the second stage (the crack propagation stage after crack initiation), Δx and Δy rapidly increased when the cracks were about to initiate. The increase rate of relative displacement can be calculated by taking the derivative of the relative displacement. The increase rates of Δx, Δy, and Δz were 1.0–1.2 × 10⁻² mm/min, 0.4–0.8 × 10⁻² mm/min, and 0.1–0.3 × 10⁻² mm/min, respectively. This indicates that the change trend of Δz was relatively small, and Δx and Δy were the primary cause of soil surface cracking. This is attributed to the sample thickness being much smaller than its diameter, and soil vertical shrinkage exhibits less magnitude compared to horizontal shrinkage. In the late second stage, crack propagation basically completed, Δx and Δy had no significant changes, but Δz decreased. Combined with Figure 3, it can be inferred that the crack length was generally stable in this stage, indicating that the crack network was formed roughly. When the shrinkage stress exceeded the cohesive force between the soil clod bottom and container surface, the soil clod separated from the container bottom, causing the soil on both sides of the crack to arch upwards [46]. In the third stage (the crack stable stage), Δx, Δy, and Δz were basically stable. The earlier the crack initiates, the longer the crack development duration and the larger the crack width.
There are differences in the relative displacement between different feature points. The cracks at G4 and G5 initiate simultaneously, but the changes in the all-direction displacement curve at G5 is significantly larger than that at G4. because the crack near G4 is a secondary crack resulting from the bifurcation of the primary crack, whereas the crack at G5 is the primary crack. Δx for each set of feature points is positive, while Δy and Δz can be positive or negative. Small soil clods exhibit centripetal shrinkage, resulting in the opposite displacement directions of feature points on the left and right sides of a crack. Different shrinkage degrees lead to different positive and negative relative displacements because there is spatial anisotropy in the soil shrinkage deformation on both sides of the crack [47].
The relative displacement is related to the direction of crack propagation. The propagation direction and width of cracks near G3 and G6, as well as G4 and G7, are roughly similar, and the development trend of the relative displacement curves is also similar. The crack propagation direction impacts the change in the relative displacement of feature points. Such as when the crack at G1 developed along the Y direction, Δx began to increase at 330min, whereas Δy started to increase at 480min. Therefore, the earlier the crack initiates near the feature point, the more likely the relative displacement between the two feature points may not always be larger when the crack is stable. For example, Δx and Δz of G1 are the largest, while Δy is very small, due to the relative displacement parallel to the crack direction on the sample being smaller than that perpendicular to the crack direction.
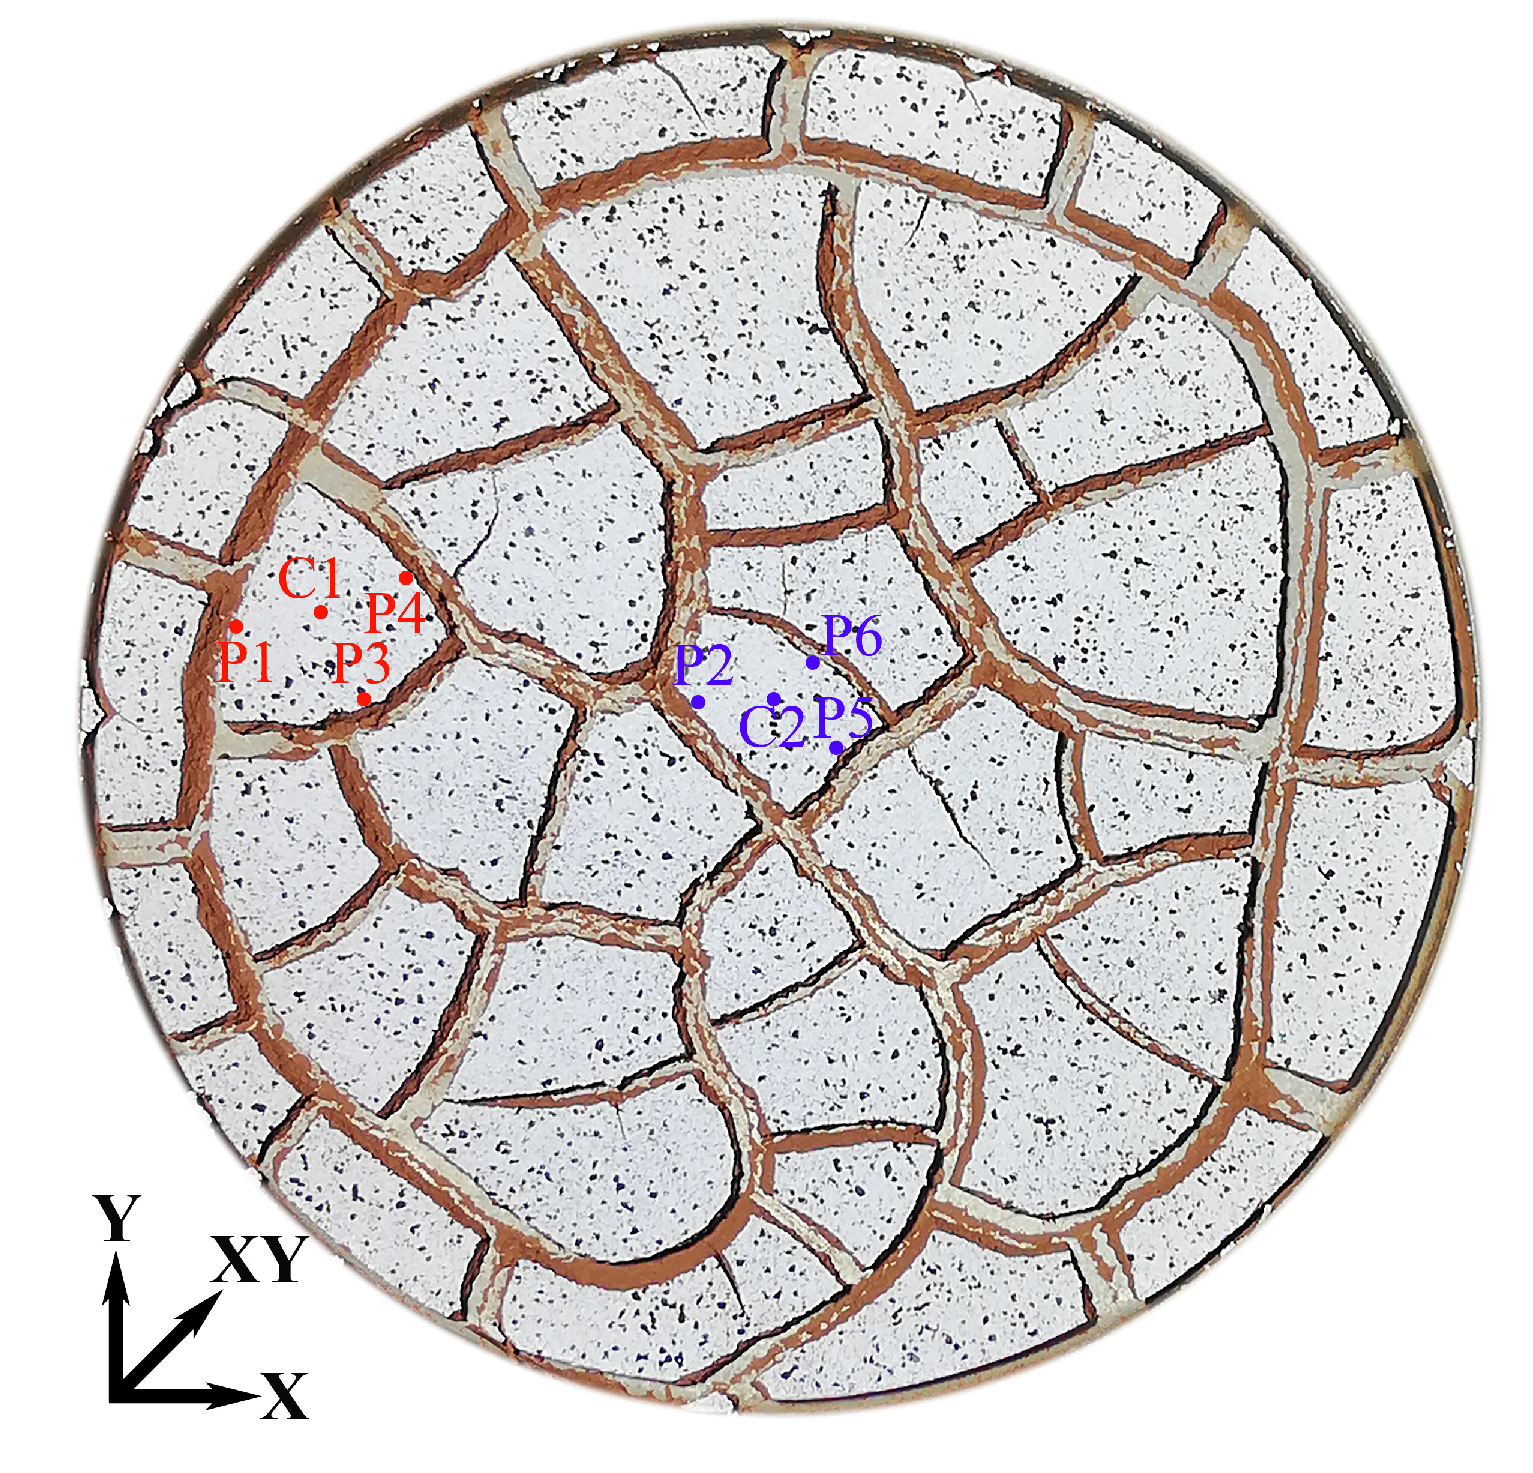
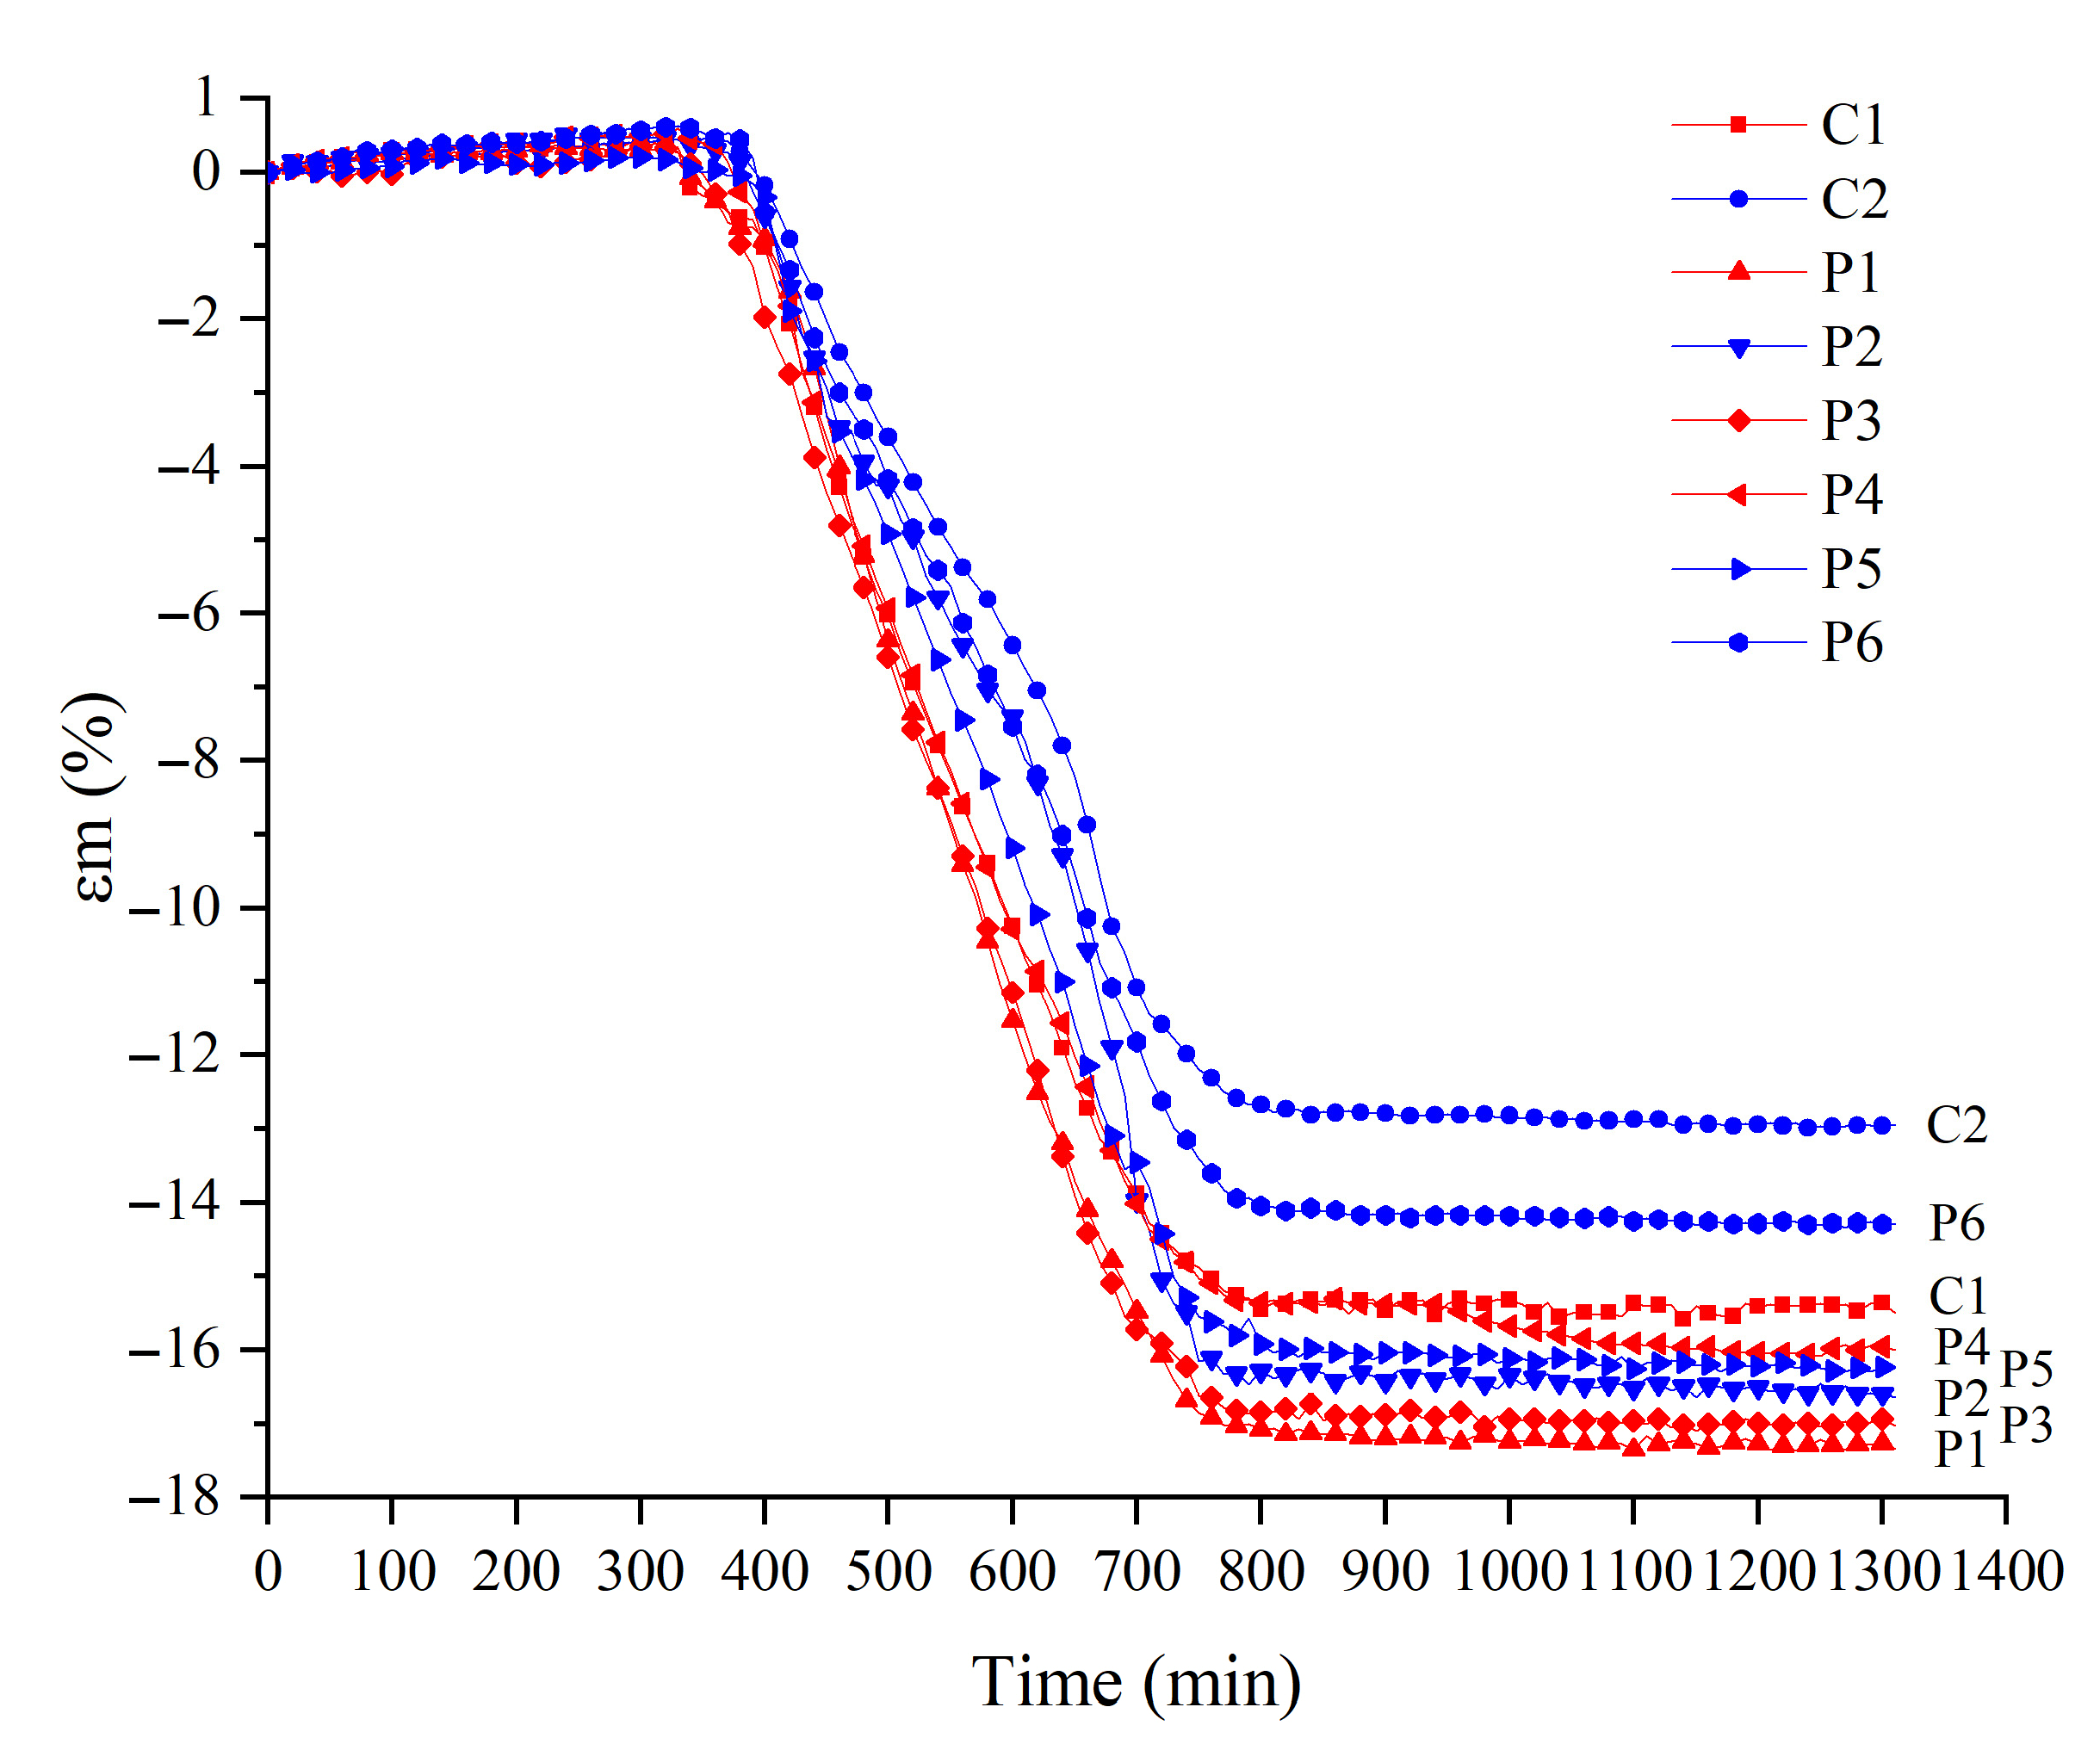
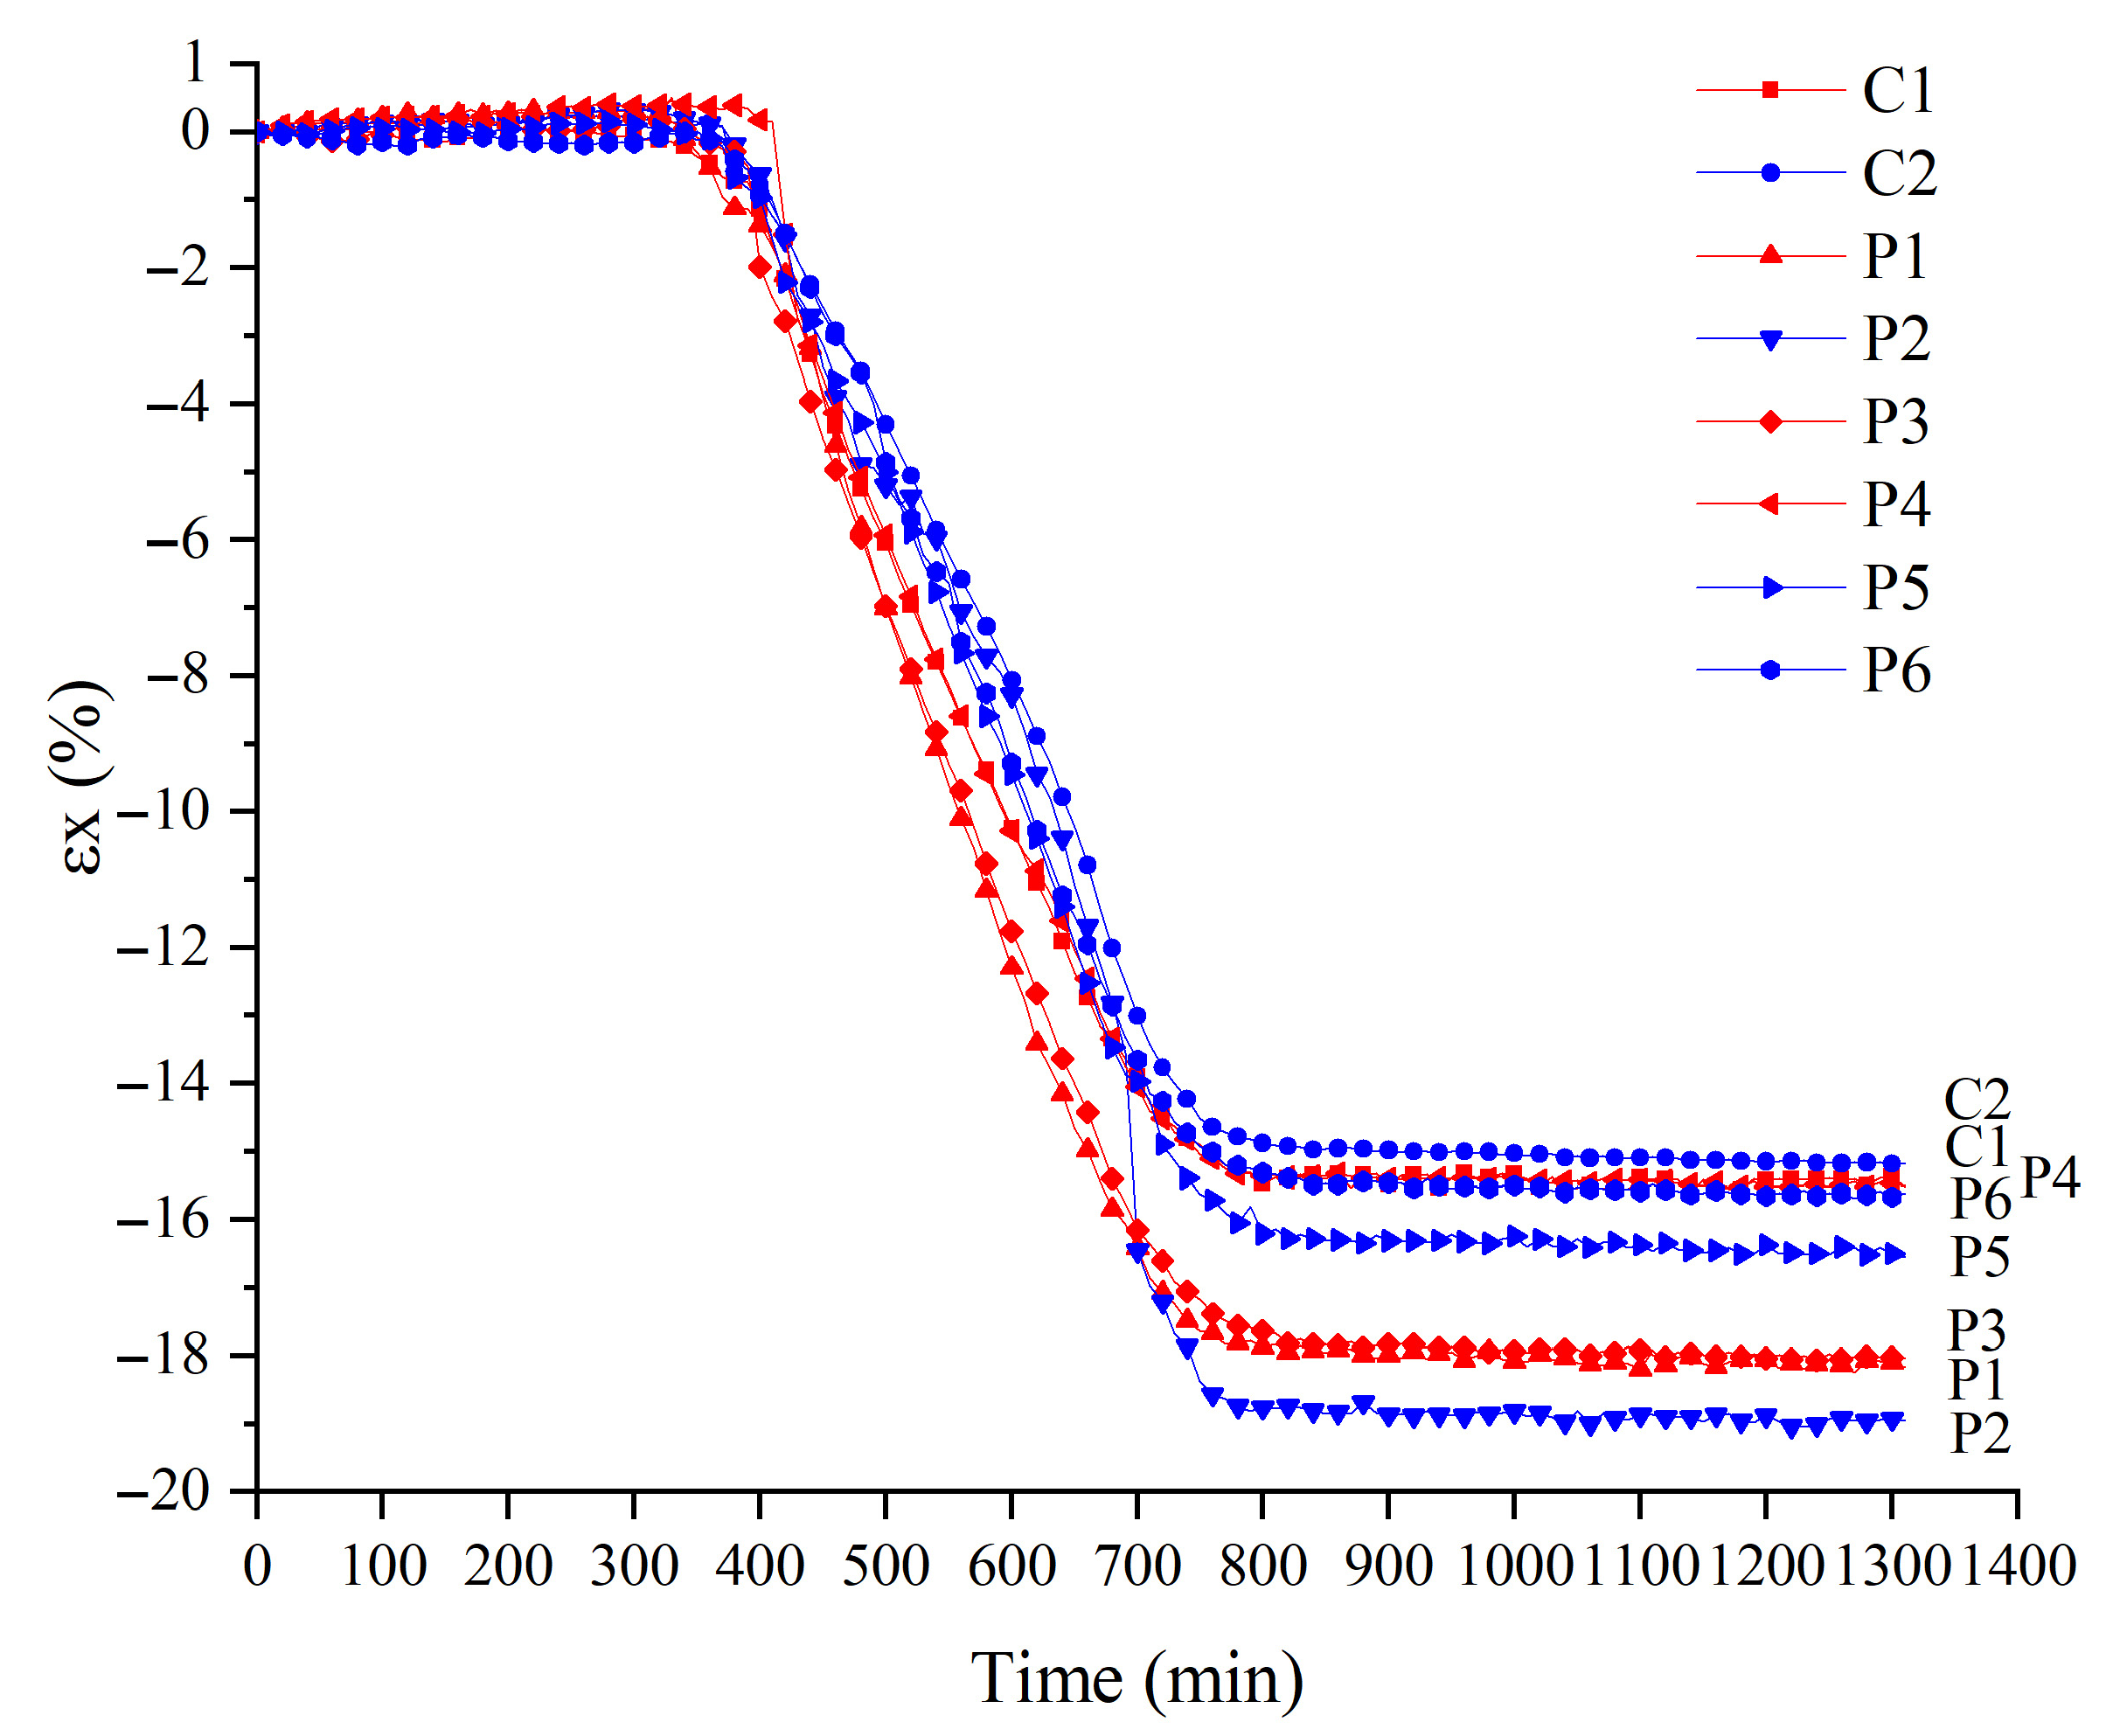
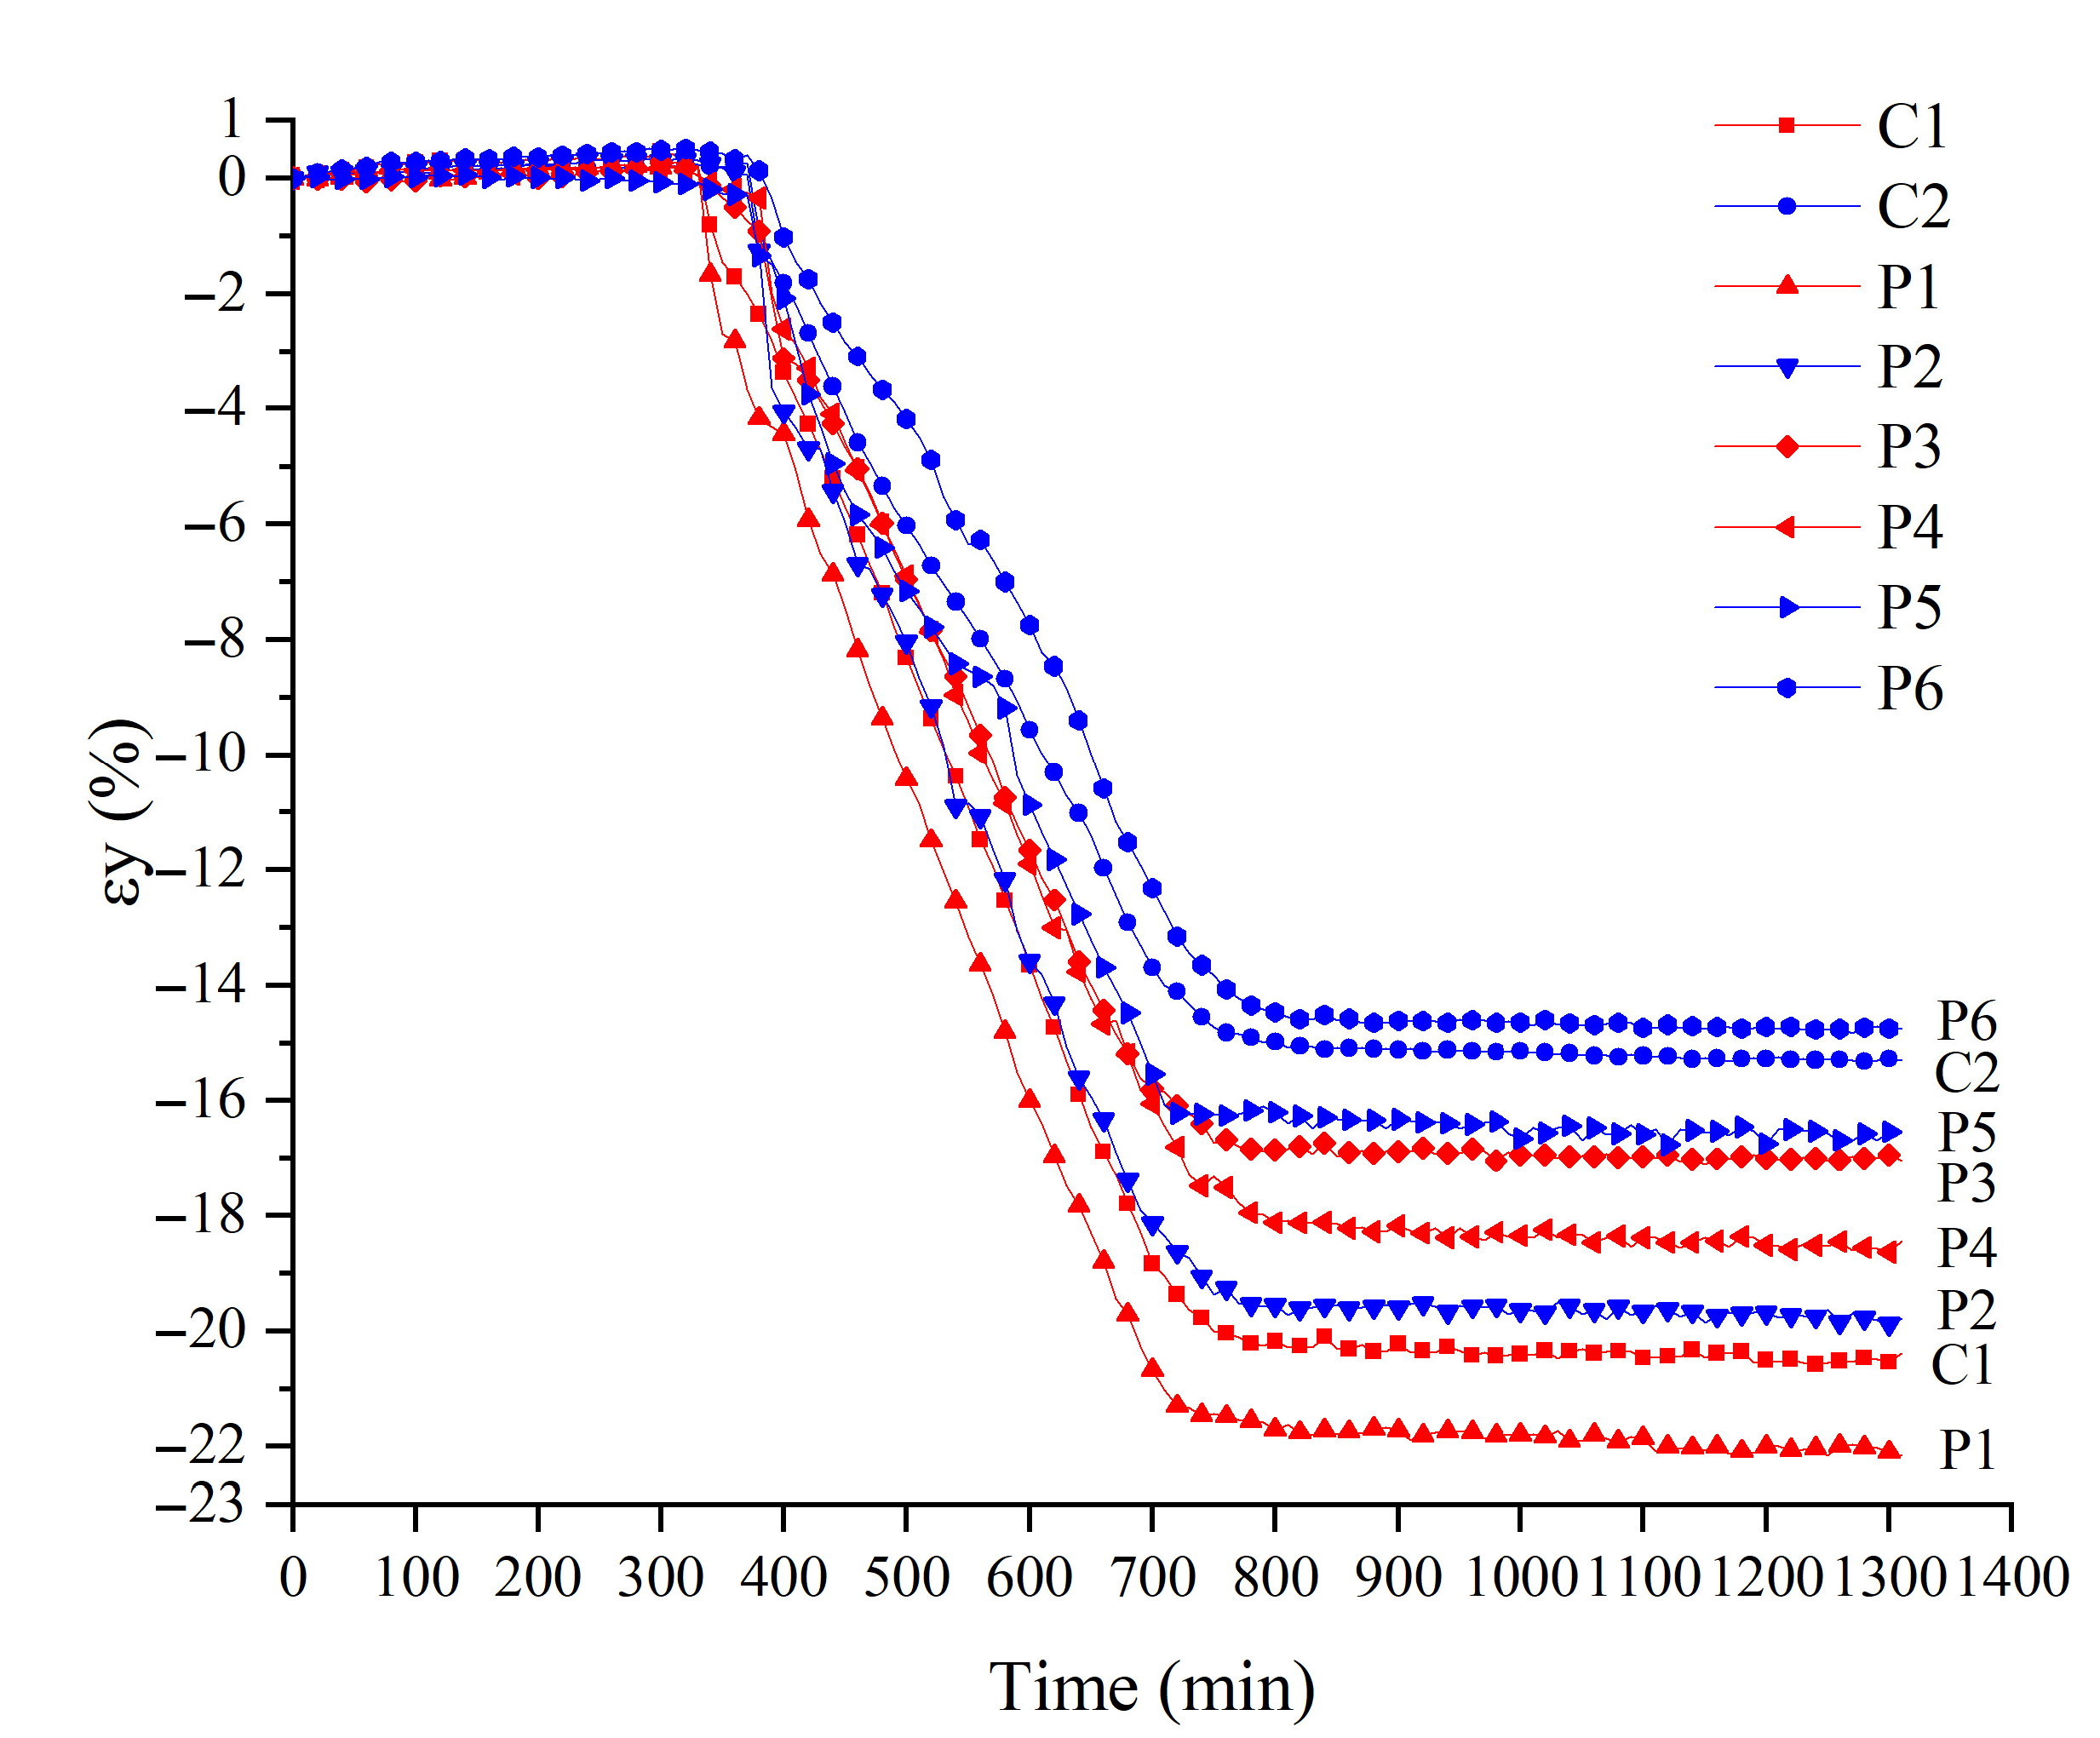
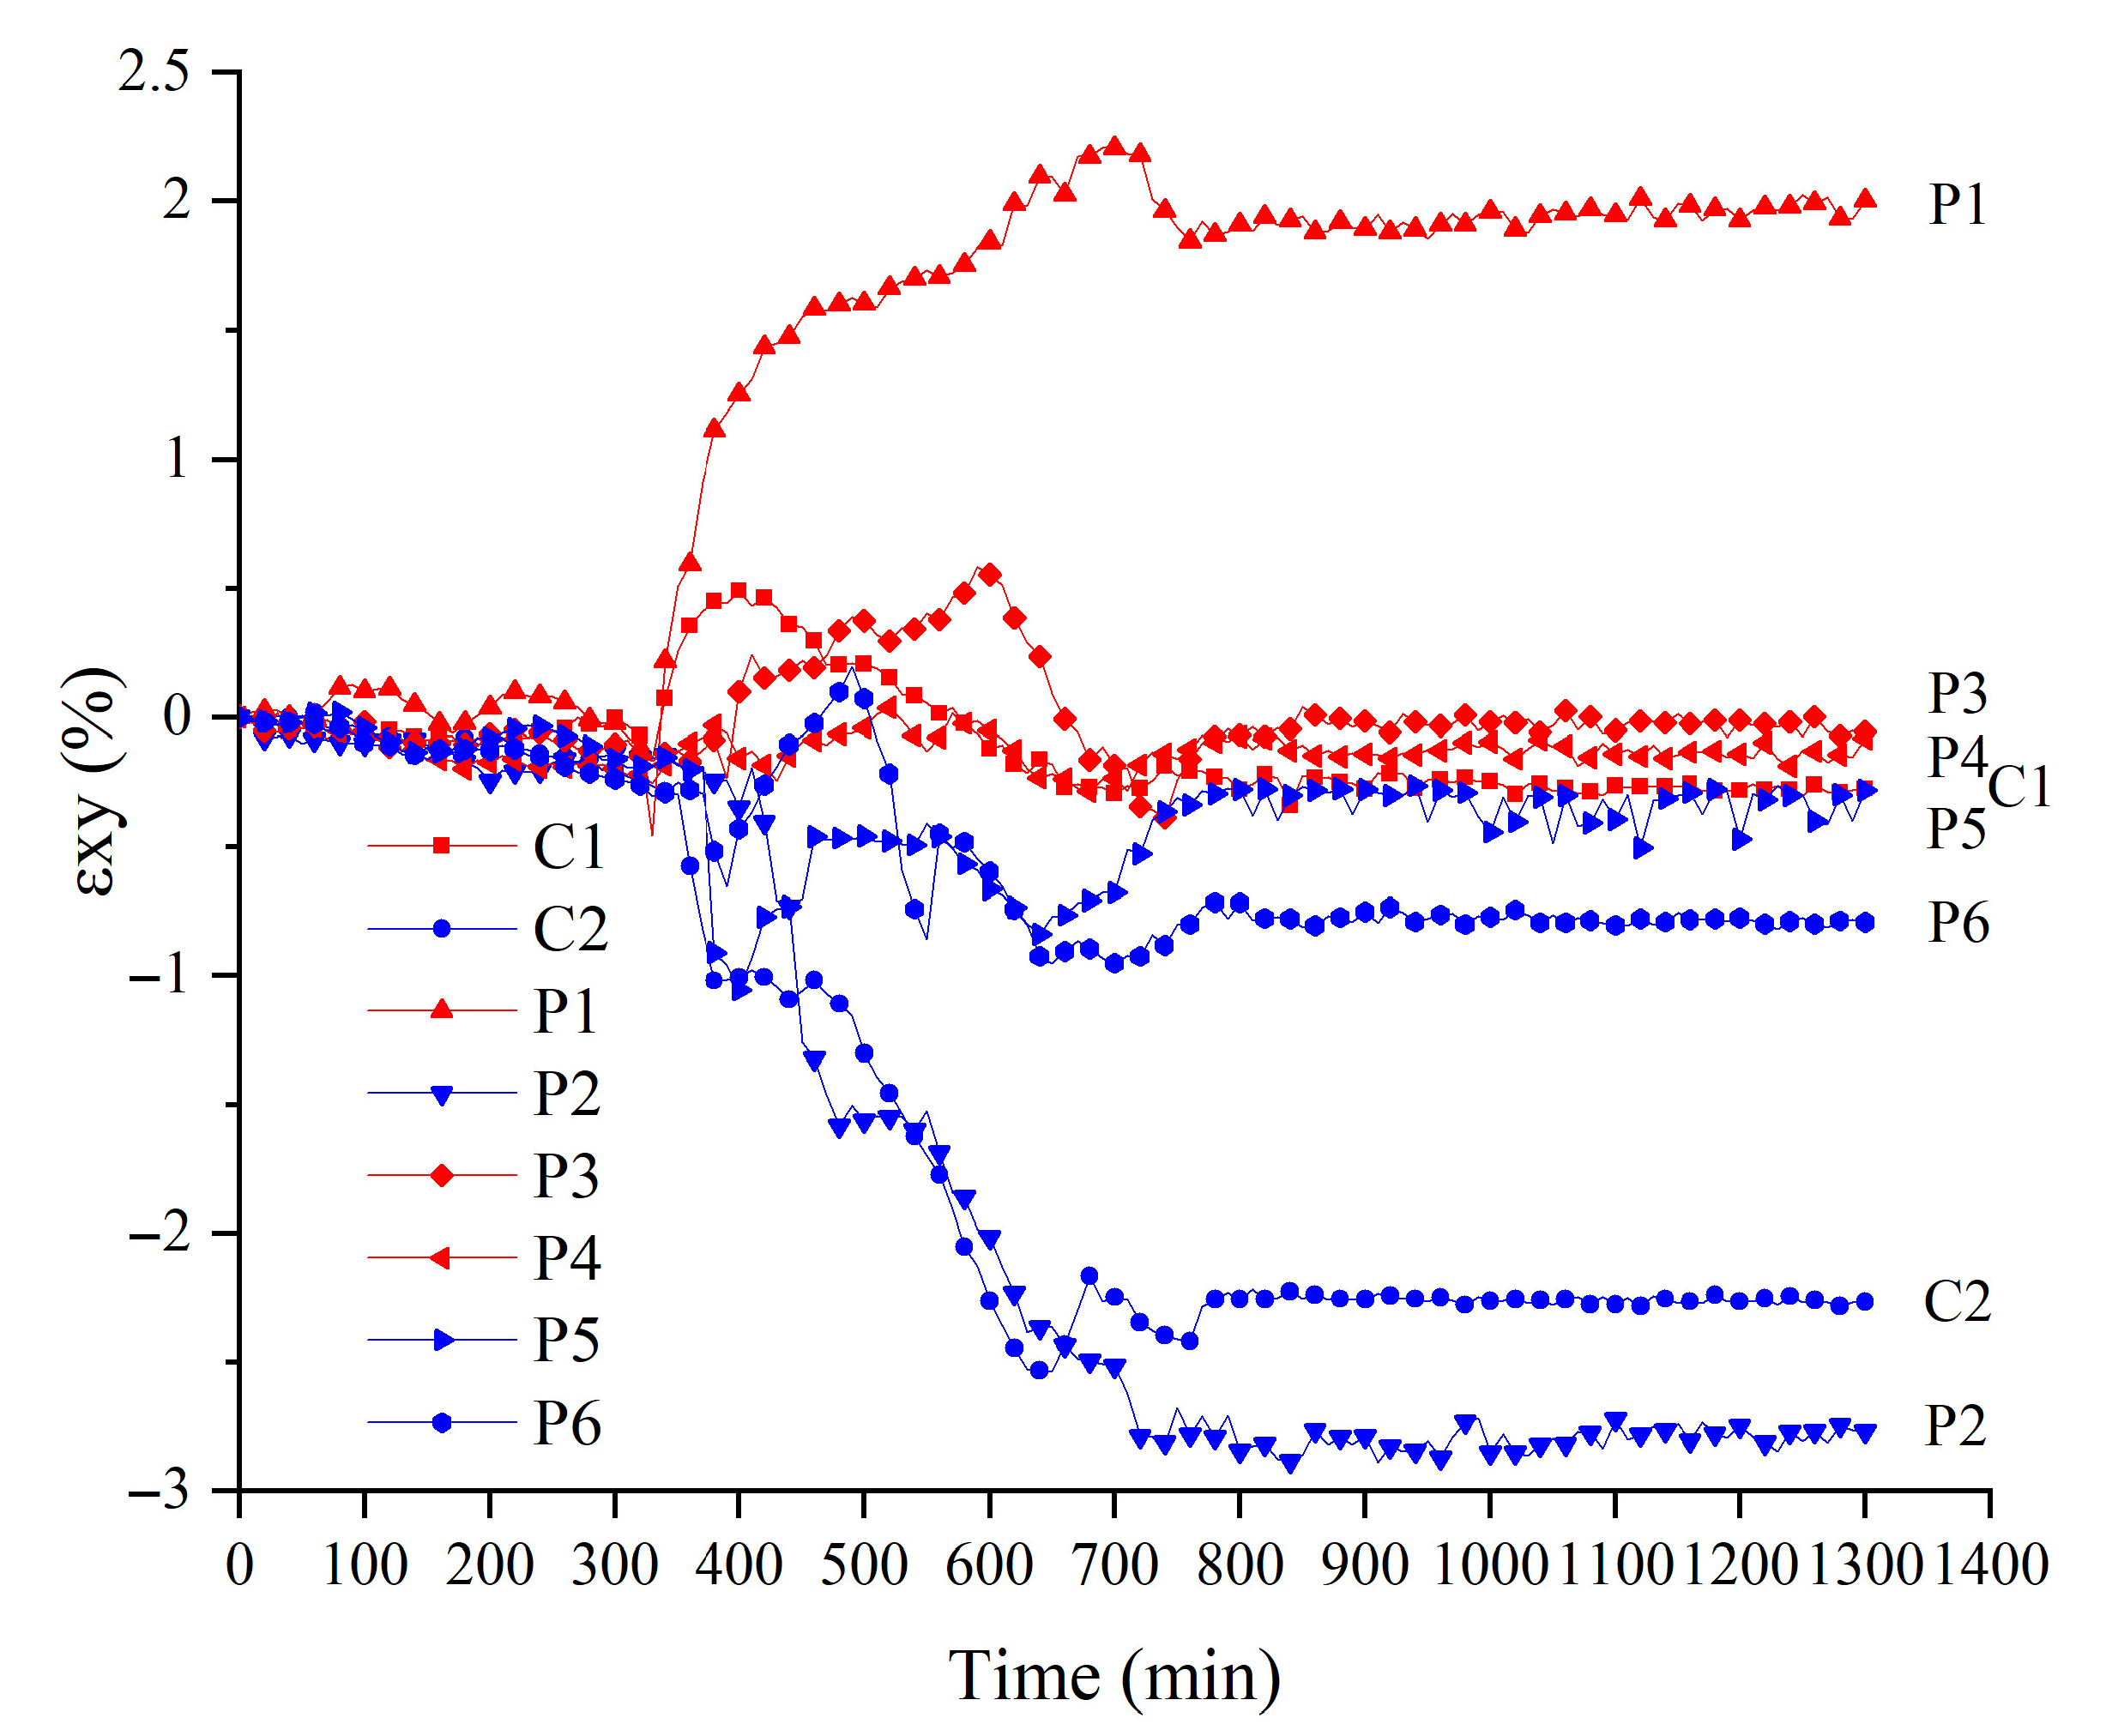
Figure 11 shows several feature points selected from soil clods formed at different times, with red and blue colours used to distinguish feature points on two soil clods. C1 and C2 represent the centre points of the soil clods, while P1–P6 represent the edge points of the cracks. The crack initiation times near P1–P6 were 330 min, 360 min, 370 min, 380 min, 390 min, and 510 min, respectively. The strain curves over time are shown in Figure 12, Figure 13, Figure 14 and Figure 15.
The strain field evolution is related to the crack development, as strain changes cause the initiation and propagation of cracks. In the first stage (before crack initiation), feature point strains remain small, and the strain changes are not significant. In the second stage (crack initiation and propagation stage), εx, εy, and εm increase linearly with time, with increasing rates of 3.2–3.8 × 10⁻²%/min, 3.2–5.3 × 10⁻²%/min, and 3.6–2.8 × 10⁻²%/min, respectively, whereas εxy changes are much smaller than those of εx and εy. The strain increase rate at the crack edge points in the same soil clod is generally greater than that at the centre points of the soil clod, indicating that the shrinkage of the centre of the soil clod is smaller than that of the edges. In the third stage (the crack stable stage), cracks near the feature points no longer develop significantly, and the strain curves tend to stabilise. The maximum principal strain is ranked from smallest to largest: C2 (12.9%) < P6 (14.3%) < C1 (15.5%) < P4 (16.0%) < P5 (16.2%) < P2 (16.6%) < P3 (17.0%) < P1 (17.3%). After stabilisation, εx, εy, and εxy also show that the earlier the crack initiates, the larger the strain of the crack edges usually is. In the same soil clod, the strain of the soil clod centre is usually smaller than that of the crack edges.
With the exception of εxy, εx and εy are positive before crack initiation and become negative after crack initiation. The primary reason is that soil moisture evaporation leads to a tensile stress field inside the soil, and cracks initiate when the tensile stress exceeds the soil limiting value. The soil around the crack changes from being under tension to being under compression, and εx and εy gradually become negative. εxy is negative at blue feature points and positive at red feature points, indicating that feature points are subjected to opposite directions of shear stress.
4. Conclusions
This study conducted a desiccation cracking test on a 200 mm diameter and 15 mm thick red clay sample under simulated natural hygrothermal conditions, and dynamic information on surface displacements and strains was obtained using DIC technology without disturbing the soil. The relationships between moisture content, surface displacement, strain, and cracks were explored to investigate the dynamic mechanism of desiccation crack initiation and propagation in red clay. The following conclusions were drawn:
- Soil desiccation crack evolution was related to the Atterberg limit of red clay. Cracks initiated when the moisture content approached the liquid limit of 67.7%, developed slowly when the moisture content reached the plastic limit of 28.3%, and tended to stabilise when the moisture content was less than the shrinkage limit of 18.8%.
- Changes in strain and displacement interacted with crack initiation and propagation. The initiation and evolution of subsequent cracks could be predicted by strain and displacement images, as cracks tended to initiate in areas with concentrated tensile strain or obvious horizontal relative displacement. The shape and propagation trend of cracks were under the influence of the distribution of the surface displacement and strain fields. Crack initiation caused the redistribution of the displacement and strain fields around them; the displacement and strain gradually increased with crack propagation, and the displacement and strain values on both sides of the cracks increased faster than in non-crack areas.
- The ratio of sample to diameter thickness is 40:3, with the diameter being significantly larger than the thickness. Hence, the horizontal relative displacement (Δx and Δy) on both sides of the cracks was significantly greater than the vertical relative displacement (Δz), and uneven shrinkage-induced horizontal relative displacement was the primary cause of soil cracking. Additionally, the numerical values of the relative displacement were also related to the crack propagation direction.
- Horizontal transverse strain and horizontal longitudinal strain (εx and εy) were greater than the shear strain (εxy), and cracks may initiate when the maximum principal strain (εm) exceeds 2.3%. The earlier the cracks initiated, the longer the development duration and the larger the strain at the crack edges.
- DIC technology can obtain dynamic information on the surface displacement and strain of the sample without disturbing the soil. It can analyse the critical strain and displacement when cracks are about to initiate and study the deformation behaviour during soil desiccation cracking. This is helpful in analysing the dynamic mechanism of soil desiccation crack initiation and propagation.
Under the influence of hot and arid weather, cracks initiate when soil loses moisture to the critical moisture content. The study results indicate that the majority of cracks initiate and propagate rapidly during the constant rate stage. Therefore, it is necessary to implement effective measures to maintain a uniform distribution of soil moisture and mitigate crack initiation. Through the utilisation of 3D DIC technology, it becomes feasible to preliminarily predict the initial location and subsequent propagation direction of desiccation cracks. This provides advantages for optimising the arrangement of irrigation systems during crop cultivation and growth, as proper irrigation contributes to maintaining soil moisture and limiting downward crack propagation. Moreover, the stability of soil slopes is heavily influenced by the development of soil cracks. By implementing reinforcement measures that restrict excessive strain and displacement, based on critical thresholds for soil crack initiation, the occurrence of hazards resulting from cracks can be minimised.
Author Contributions
Conceptualization, A.C.; Methodology, S.Z. and B.Y.; Software, C.L. and C.D.; Formal analysis, C.D.; Investigation, S.Z.; Data curation, C.L. and C.D.; Writing—original draft, C.L.; Writing—review & editing, S.Z.; Visualization, C.D.; Supervision, A.C. and B.Y.; Project administration, B.Y.; Funding acquisition, A.C. All authors have read and agreed to the published version of the manuscript.
Funding
This work was supported by the Guangxi Science and Technology Program (2022GXNSFAA035485), and by the Foundation for Science and Technology Base and Talents of Guangxi Provence of China (GUIKEAD 20238063).
Institutional Review Board Statement
Not applicable.
Informed Consent Statement
Not applicable.
Data Availability Statement
Data can be requested from the corresponding author.
Conflicts of Interest
The authors declare no conflict of interest.
References
- Yang, B.B.; Zhang, Z.P.; Ma, W.L. Effect of tea waste on cracking of foundation soil. Adv. Mater. Sci. Eng. 2021, 2021, 7525811. [Google Scholar] [CrossRef]
- Izzo, M.Z.; Miletic, M. Sustainable improvement of the crack resistance of cohesive soils. Sustainability 2019, 11, 5806. [Google Scholar] [CrossRef] [Green Version]
- Zhang, J.M.; Luo, Y.; Zhou, Z. Effects of preferential flow induced by desiccation cracks on slope stability. Eng. Geol. 2021, 288, 106164. [Google Scholar] [CrossRef]
- Liu, J.X.; Yang, C.H.; Gan, J.J. Stability analysis of road embankment slope subjected to rainfall considering runoff-unsaturated seepage and unsaturated fluid-solid coupling. Int. J. Civ. Eng. 2017, 15, 865–976. [Google Scholar] [CrossRef] [Green Version]
- Tay, Y.Y.; Stewart, D.I.; Cousens, T.W. Shrinkage and desiccation cracking in bentonite-sand landfill liners. Eng. Geol. 2001, 60, 263–274. [Google Scholar] [CrossRef]
- Peron, H.; Laloui, L.; Hueckel, T. Desiccation cracking of soil. Eur. J. Environ. Civ. Eng. 2009, 13, 869–888. [Google Scholar] [CrossRef]
- Xu, G.Y.; Han, X.; Zhang, Y.W. Dam crack image detection model on feature enhancement and attention mechanism. Water 2023, 15, 64. [Google Scholar] [CrossRef]
- Ding, J.X.; Meng, Y.W. Review of applied study for red clay in highway subgrades. In Proceedings of the 4th International Conference on Structures and Building Materials (ICSBM), Guangzhou, China, 15–16 March 2014. [Google Scholar]
- Towner, G.D. The mechanics of cracking of drying clay. J. Agric. Eng. Res. 1987, 36, 115–124. [Google Scholar] [CrossRef]
- El Hajjar, A.; Ouahbi, T.; Hamrouni, I. Experimental characterization of desiccation cracking mechanisms in clayey soils. Eur. J. Environ. Civ. Eng. 2022, 1–22. [Google Scholar] [CrossRef]
- Hirobe, S.; Oguni, K. Modeling and numerical investigations for hierarchical pattern formation in desiccation cracking. Phys. D Nonlinear Phenom. 2017, 359, 29–38. [Google Scholar] [CrossRef]
- Poulsen, T.G.; Cai, W.L.; Garg, A. Water evaporation from cracked soil under moist conditions as related to crack properties and near-surface wind speed. Eur. J. Soil Sci. 2020, 71, 627–640. [Google Scholar] [CrossRef]
- Chen, K.S. Field test research on red clay slope under atmospheric action. Adv. Civ. Eng. 2021, 2021, 6668979. [Google Scholar] [CrossRef]
- Liu, Y.; Chen, K.S.; Lyu, M.F. Study on failure of red clay slopes with different gradients under dry and wet cycles. Bull. Eng. Geol. Environ. 2020, 79, 4609–4624. [Google Scholar] [CrossRef]
- Nahlawsi, H.; Kodikara, J.K. Laboratory experiments on desiccation cracking of thin soil layers. Geotech. Geol. Eng. 2006, 24, 1641–1664. [Google Scholar] [CrossRef]
- Tang, C.S.; Cui, Y.J.; Tang, A.M. Experiment evidence on the temperature dependence of desiccation cracking behavior of clayey soils. Eng. Geol. 2010, 114, 261–266. [Google Scholar] [CrossRef] [Green Version]
- Rodriguez, R.; Sanchez, M.; Ledesma, A. Exp. and numerical analysis of desiccation of a mining waste. Can. Geotech. J. 2017, 44, 644–658. [Google Scholar] [CrossRef]
- Peron, H.; Laloui, L.; Hueckel, T. Experimental study of desiccation of soil. In UNSAT 2006; ASCE Geotechnical Special Publication; ASCE: Reston, VA, USA, 2006. [Google Scholar] [CrossRef]
- Xie, Y.H.; Zhang, B.H.; Liu, B.C. Shrinkage cracking and strength deterioration of red clay under cyclic drying and wetting. Alex. Eng. J. 2022, 61, 2574–2588. [Google Scholar] [CrossRef]
- Zeng, H.; Tang, C.S.; Zhu, C. Investigating soil desiccation cracking using an infrared thermal imaging technique. Water Resour. Res. 2021, 58, e2021WR030916. [Google Scholar] [CrossRef]
- Costa, S.; Kodikara, J.; Shannon, B. Salient factors controlling desiccation cracking of clay in laboratory experiments. Geotechnique 2013, 63, 18–29. [Google Scholar] [CrossRef]
- Akin, I.D.; Likos, W.J. Brazilian tensile strength testing of compacted clay. Geotech. Test. J. 2017, 40, 608–617. [Google Scholar] [CrossRef]
- Sawada, M.; Sumi, Y.; Mimura, M. Measuring desiccation-induced tensile stress during cracking process. Soils Found. 2021, 61, 915–928. [Google Scholar] [CrossRef]
- Peron, H.; Herchel, T.; Laloui, L. Fundamentals of desiccation cracking of fine-grained soils: Experimental characterization and mechanisms identification. Can. Geotech. J. 2009, 46, 1177–1201. [Google Scholar] [CrossRef]
- Hou, H.J.; Zhu, Z.W.; Wang, B. A practical model study on the mechanism of clay landslide under static loads: From the perspective of major crack-stress-displacement. Appl. Sci. 2022, 12, 3224. [Google Scholar] [CrossRef]
- Tang, C.S.; Shi, B.; Liu, C. Influencing factors of geometrical structure of surface shrinkage cracks in clayey soils. Eng. Geol. 2008, 101, 204–217. [Google Scholar] [CrossRef]
- Lei, D.; Hou, F.; Gong, X. Investigation of deformation at the grain scale in polycrystalline materials by coupling digital image correlation and digital microscopy. Exp. Tech. 2012, 36, 24–31. [Google Scholar] [CrossRef]
- Francic Smrkic, M.; Koscak, J.; Damjanovic, D. Application of 2D digital image correlation for displacement and crack width measurement on RC elements. Gradevinar 2018, 70, 771–781. [Google Scholar] [CrossRef]
- Han, Z.Y.; Xie, S.J.; Li, D.Y. Dynamic fracture analysis of sandstone specimens containing different inclusions. Theor. Appl. Fract. Mech. 2022, 122, 103623. [Google Scholar] [CrossRef]
- Wang, Y.; Cuitino, A.M. Full-field measurements of heterogeneous deformation patterns on polymeric foams using digital image correlation. Int. J. Solids Struct. 2002, 39, 13–14. [Google Scholar] [CrossRef]
- Zhang, D.S.; Arola, D.D. Applications of digital image correlation to biological tissues. J. Biomed. Opt. 2004, 9, 691–699. [Google Scholar] [CrossRef] [Green Version]
- JTG3430-2020; Test Methods of Soils for Highway Engineering. Ministry of Transport of the People’s Republic of China: Beijing, China, 2020.
- Ellis, C.L.; Hazell, P. Visual methods to assess strain fields in armour materials subjected to dynamic deformation. Appl. Sci. 2020, 18, 2644. [Google Scholar] [CrossRef] [Green Version]
- Wang, C.; Zhang, Z.Y.; Qi, W. Morphological approach to quantifying soil cracks: Application to dynamic crack patterns during wetting-drying cycles. Soil Sci. Soc. Am. J. 2018, 82, 757–771. [Google Scholar] [CrossRef]
- Miller, C.J.; Mi, H.; Yesiller, N. Experimental analysis of desiccation crack propagation in clay liners. J. Am. Water Resour. Assoc. 1998, 34, 677–686. [Google Scholar] [CrossRef] [Green Version]
- Trabelsi, H.; Chebbi, M.; Guiras, H. Stabilization of clayey soil using fibre reinforcement. In Unsaturated Soils: UNSAT 2018, Proceedings of the 7th International Conference on Unsaturated Soils, Hong Kong, China, 3–5 August 2018; The Hong Kong University of Science and Technology (HKUST): Hong Kong, China, 2018; pp. 545–550. [Google Scholar]
- An, N.; Tang, C.S.; Xu, S.K. Effects of soil characteristics on moisture evaporation. Eng. Geol. 2018, 239, 126–135. [Google Scholar] [CrossRef]
- Wang, W.W.; Li, W.; Yi, Y. Study on the cracking law of Nanyang expansive soil. Chin. J. Undergr. Space Eng. 2015, 11, 1437–1443. [Google Scholar]
- Zeng, H.; Tang, C.S.; Liu, C.L. Effects of boundary friction and layer thickness on desiccation cracking behaviors of soils. Chin. J. Geotech. Eng. 2019, 41, 544–553. [Google Scholar]
- Lin, L.; Tang, C.S.; Cheng, Q. Desiccation cracking bebavior of soils based on digital image correlation technique. Chin. J. Geotech. Eng. 2019, 41, 1311–1318. [Google Scholar] [CrossRef]
- Wang, L.L.; Tang, C.S.; Shi, B. Nucleation and propagation mechanisms of soil desiccation cracks. Eng. Geol. 2018, 238, 27–35. [Google Scholar] [CrossRef]
- Levatti, H.U.; Prat, P.C.; Ledesma, A. Numerical and experimental study of initiation and propagation of desiccation cracks in clayey soils. Comput. Geotech. 2019, 105, 155–167. [Google Scholar] [CrossRef]
- Lakshmikantha, M.R.; Prat, P.C.; Ledesma, A. Boundary effects in the desiccation of soil layers with controlled environmental conditions. Geotech. Test. J. 2018, 41, 675–697. [Google Scholar] [CrossRef] [Green Version]
- Yin, P.H.; Vanapalli, S.K.; Yu, S. Morphological characteristics of desiccation-induced cracks in cohesive soils: A critical review. Bull. Eng. Geol. Environ. 2022, 81, 503. [Google Scholar] [CrossRef]
- Lecocq, N.; Vandewalle, N. Dynamics of crack opening in a one-dimensional desiccation experiment. Phys. A Stat. Mech. Its Appl. 2003, 321, 431–441. [Google Scholar] [CrossRef]
- Du, C.C.; Zhu, Y.B.; Miao, S.S. The evolution of cracks in the dewatering shrinkage process of hipparion red soil. Rock Soil Mech. 2019, 40, 3019–3027. [Google Scholar] [CrossRef]
- Wang, C.; Zhang, Z.Y.; Liu, Y. Geometric and fractal analysis of dynamic cracking patterns subjected to wetting-drying cycles. Soil Tillage Res. 2017, 170, 1–13. [Google Scholar] [CrossRef]
Figure 1.
Layout of the desiccation test device.

Figure 2.
The relationship between moisture content, average crack width, and time.

Figure 3.
The relationship between total crack length and time.

Figure 4.
The relationship between crack ratio and time.

Figure 5.
Crack photos and displacement images of the sample at different times. In the colour bar, different colours may represent different displacement ranges in different figures. I, II, III, and IV represent the division of different displacement fields. 1 and 2 represent crack 1 and 2, respectively. A and B represent crack ends.

Figure 6.
Crack photos and strain images of the sample at different times. In the colour bar, different colours may represent different strain ranges in different figures. 1, 2, and 3 represent the order of the cracks.
Figure 6.
Crack photos and strain images of the sample at different times. In the colour bar, different colours may represent different strain ranges in different figures. 1, 2, and 3 represent the order of the cracks.

Figure 7.
Distribution of relative displacement feature points on the soil surface. L1–L8 represent the left feature point of cracks at different positions. R1–R8 represent the right feature point of cracks at different positions.
Figure 7.
Distribution of relative displacement feature points on the soil surface. L1–L8 represent the left feature point of cracks at different positions. R1–R8 represent the right feature point of cracks at different positions.

Figure 8.
Variations of Δx versus time.

Figure 9.
Variations of Δy versus time.

Figure 10.
Variations of Δz versus time.

Figure 11.
Distribution of strain feature points on the soil surface.

Figure 12.
Variations of εm versus time.

Figure 13.
Variations of εx versus time.

Figure 14.
Variations of εy versus time.

Figure 15.
Variations of εxy versus time.


Table 1.
Physical properties of red clay for testing.
| Specific Gravity /(g/cm3) | Liquid Limit /(%) | Plastic Limit /(%) | Shrinkage Limit /(%) | Plasticity Index /(%) | Optimum Moisture Content /(%) | Maximum Dry Density (g/cm3) | Clay Content /(%) |
|---|---|---|---|---|---|---|---|
| 2.72 | 67.7 | 28.3 | 18.8 | 39.4 | 18.5 | 1.86 | 62.8 |
Disclaimer/Publisher’s Note: The statements, opinions and data contained in all publications are solely those of the individual author(s) and contributor(s) and not of MDPI and/or the editor(s). MDPI and/or the editor(s) disclaim responsibility for any injury to people or property resulting from any ideas, methods, instructions or products referred to in the content. |
© 2023 by the authors. Licensee MDPI, Basel, Switzerland. This article is an open access article distributed under the terms and conditions of the Creative Commons Attribution (CC BY) license (https://creativecommons.org/licenses/by/4.0/).
Share and Cite
MDPI and ACS Style
Chen, A.; Li, C.; Zhao, S.; Yang, B.; Ding, C. Study on the Dynamic Mechanism of the Desiccation Crack Initiation and Propagation in Red Clay. Sustainability 2023, 15, 11156. https://doi.org/10.3390/su151411156
AMA Style
Chen A, Li C, Zhao S, Yang B, Ding C. Study on the Dynamic Mechanism of the Desiccation Crack Initiation and Propagation in Red Clay. Sustainability. 2023; 15(14):11156. https://doi.org/10.3390/su151411156
Chicago/Turabian StyleChen, Aijun, Chaohua Li, Shanshan Zhao, Bai Yang, and Chuanyang Ding. 2023. "Study on the Dynamic Mechanism of the Desiccation Crack Initiation and Propagation in Red Clay" Sustainability 15, no. 14: 11156. https://doi.org/10.3390/su151411156
Note that from the first issue of 2016, this journal uses article numbers instead of page numbers. See further details here.