
Transboundary Transitional Waters: Arenas for Cross-Border Cooperation or Confrontation?

1
Department of Sport, Recreation and Tourism, Klaipeda University, LT-92295 Klaipeda, Lithuania
2
Marine Research Institute, Klaipeda University, LT-92295 Klaipeda, Lithuania
*
Author to whom correspondence should be addressed.
Sustainability 2023, 15(13), 9922; https://doi.org/10.3390/su15139922
Submission received: 21 May 2023
/
Revised: 15 June 2023
/
Accepted: 19 June 2023
/
Published: 21 June 2023
(This article belongs to the Special Issue Towards a Sustainable Blue Economy: Perspectives on Opportunities and Challenges)
Abstract
:The Russian Federation’s invasion of Ukraine in 2022 evoked academic interest in various aspects of international security and stability. The main objective of this study was to elicit the essential features and indicators for gauging the current state of cross-border cooperation and the risks of confrontation in and around transboundary transitional waters, i.e., those transitional waters where two or more countries share an estuary, delta, or lagoon while having a contiguous border in the territorial waters. The Cooperation and Confrontation Index comprises five facets and 25 indicators spread equally among these five facets. The following are the facets based on the integrated values with which the Cooperation and Confrontation Index for each transboundary transitional water body is calculated: 1. Socioeconomic Cohesion; 2. Environmental Coherence; 3. Cross-border Connectivity; 4. Cross-border Co-operation; and 5. Confrontation Risk. A comprehensive worldwide inventory of transboundary transitional waters was created. The investigation results show that eight transboundary transitional water areas are under high confrontation risk, while six areas are under no confrontation risk. The conclusion is that this risk of confrontation is closely correlated with the level of corruption in a more bellicose country sharing the transboundary transitional water body.
1. Introduction
The term “transitional waters” (TW) was introduced in 2000 by the Water Framework Directive (WFD) of the European Communities (WFD, 2000/60/EC) to delineate the space between freshwaters, coastal waters, and marine waters. TW are defined in the Official Journal of the European Communities 43 (L327) as “bodies of surface water in the vicinity of river mouths which are partly saline in character as a result of their proximity to coastal waters but which are substantially influenced by freshwater flows” [1]. The WFD obliges the EU Member States to prepare and regularly update six-year river basin management plans, including coastal and TW up to 1 nautical mile (NM).
River estuaries and coastal lagoons are the most typical TW. However, the term also refers to a vast range of littoral aquatic habitats with varying physical and ecological characteristics, including lakes, rias, fjards and fjords, hypersaline ecosystems and brackish wetlands, and freshwater offshore discharge plumes, to mention just the most common types. TW ecosystems are the ecotones between freshwater basins and the open sea, and the resulting gradients make them some of the world’s most productive ecosystems [2].
Despite their limited scale, due to their specific locations and stressors, TW contain ecological communities with a rich biodiversity and complicated self-regulation mechanisms [3]. However, also due to these reasons, TW suffer from more impacts, resulting in a worse ecological status than lakes and coastal waters. The worst areas in Europe concerning these ecological pressures and the environmental status of TW and coastal waters are located along the Greater North Sea and Baltic Sea coastlines [4].
Human settlements on TW shores have been documented since prehistoric times, providing loci rich in living aquatic resources for developing early human societies and later civilizations [5,6,7,8,9,10]. TW’s enduring economic role prompted this paper’s authors to suggest and elaborate on the Emerald Growth concept as a novel approach to addressing TW’s ecological integrity and ecosystem services. The concept relies on native knowledge of TW environments as a sustainable development “tool chest” and offers innovative measures for revitalizing these areas [10].
Many TW worldwide are estuaries of large rivers or straits and conveniently serve as international boundaries. There are 108 transboundary TW (TTW) worldwide. We consider these TW to be transboundary when two or more countries share an estuary, delta, lagoon, strait, or another TW while having a contiguous border in the adjacent territorial maritime waters. The terms “transitional” and “transboundary” may look confusing, as there has been much attention paid to managing transboundary river basins and conflicts around sharing water resources. Although TTW may be an integral part of these transboundary river basins, the coastal locations of TTW pose very different management issues and challenges compared to inland river basin management.
The Russian Federation’s invasion of Ukraine in 2022 evoked academic interest in various aspects of international security and stability [11,12,13,14]. Due to their rich natural resources, TTW, disproportionally to their size, may contribute to achieving these goals through cross-border cooperation or heightening the confrontation between the countries sharing them., e.g., the Han River estuary, the TTW shared by North and South Korea, is part of the world’s most heavily militarized political border.
The ever-increasing attention paid by researchers from diverse research fields to TW is primarily related to the inclusion of TW into the regulations imposed by the WFD on the EU Member States with regard to a good ecological status, its criteria, and its indicators [15]. The majority of papers on these issues have been published by authors from Mediterranean countries, i.e., Italy [16,17,18], Greece [19,20,21], and Spain [22,23,24] in particular. The investigated and assessed good ecological status indicators range from invertebrates [25,26,27] to fish [28,29,30] and aquatic macrophytes [31,32,33]. Some recent papers on TW biodiversity have considered the role of aquatic meiofauna diversity in achieving TW with good ecological statuses [34,35].
Pitacco et al. [36] summarized the variation patterns of macrobenthic invertebrates in 18 Italian TW. Considering the threats posed to the native biodiversity of TW by alien species, the primary concerns for researchers and TW managers are the invasions and proliferation of alien invertebrates [37,38,39], fish [40,41], and aquatic macrophytes [42,43,44]. These concerns are closely related to research on the economy and sustainable development in TW areas [45,46,47,48,49]. A few case studies of TW in Portugal have dealt with aspects of Emerald Growth, including TW aquaculture, tourism, and management planning [50,51,52].
Due to their disproportionate role compared to their size, TTW, as a specific research area, need more consideration. Many high-level publications on the various management aspects of TTW have focused on the Baltic Sea area [53]. This is no surprise, since 8 of 31 TTW in Europe are around the Baltic Sea and 4 are along its southern rim [54,55]. There is a particular focus on cross-border cooperation for the environmental protection of TTW [56,57]. Several investigations have discussed the hydropolitical relationships involved in cross-border cooperation practices for transboundary river basin and adjacent TTW management, considering various aspects of cross-border politics and the power center stage in water issues [58,59,60].
Hence, the main objective of our study was to elicit the essential features and indicators for gauging the current state of cooperation and the confrontation risks in and around the TTW between the neighboring countries sharing them. Besides our ambition to deliver an inventory of all the TTW and their current situations worldwide, the main research question we focused on was to obtain an insight into the mechanisms governing the cross-border politics and policies on water issues in these TTW, mainly focusing on power struggles and confrontation risks.
2. Materials and Methods
2.1. Study Area
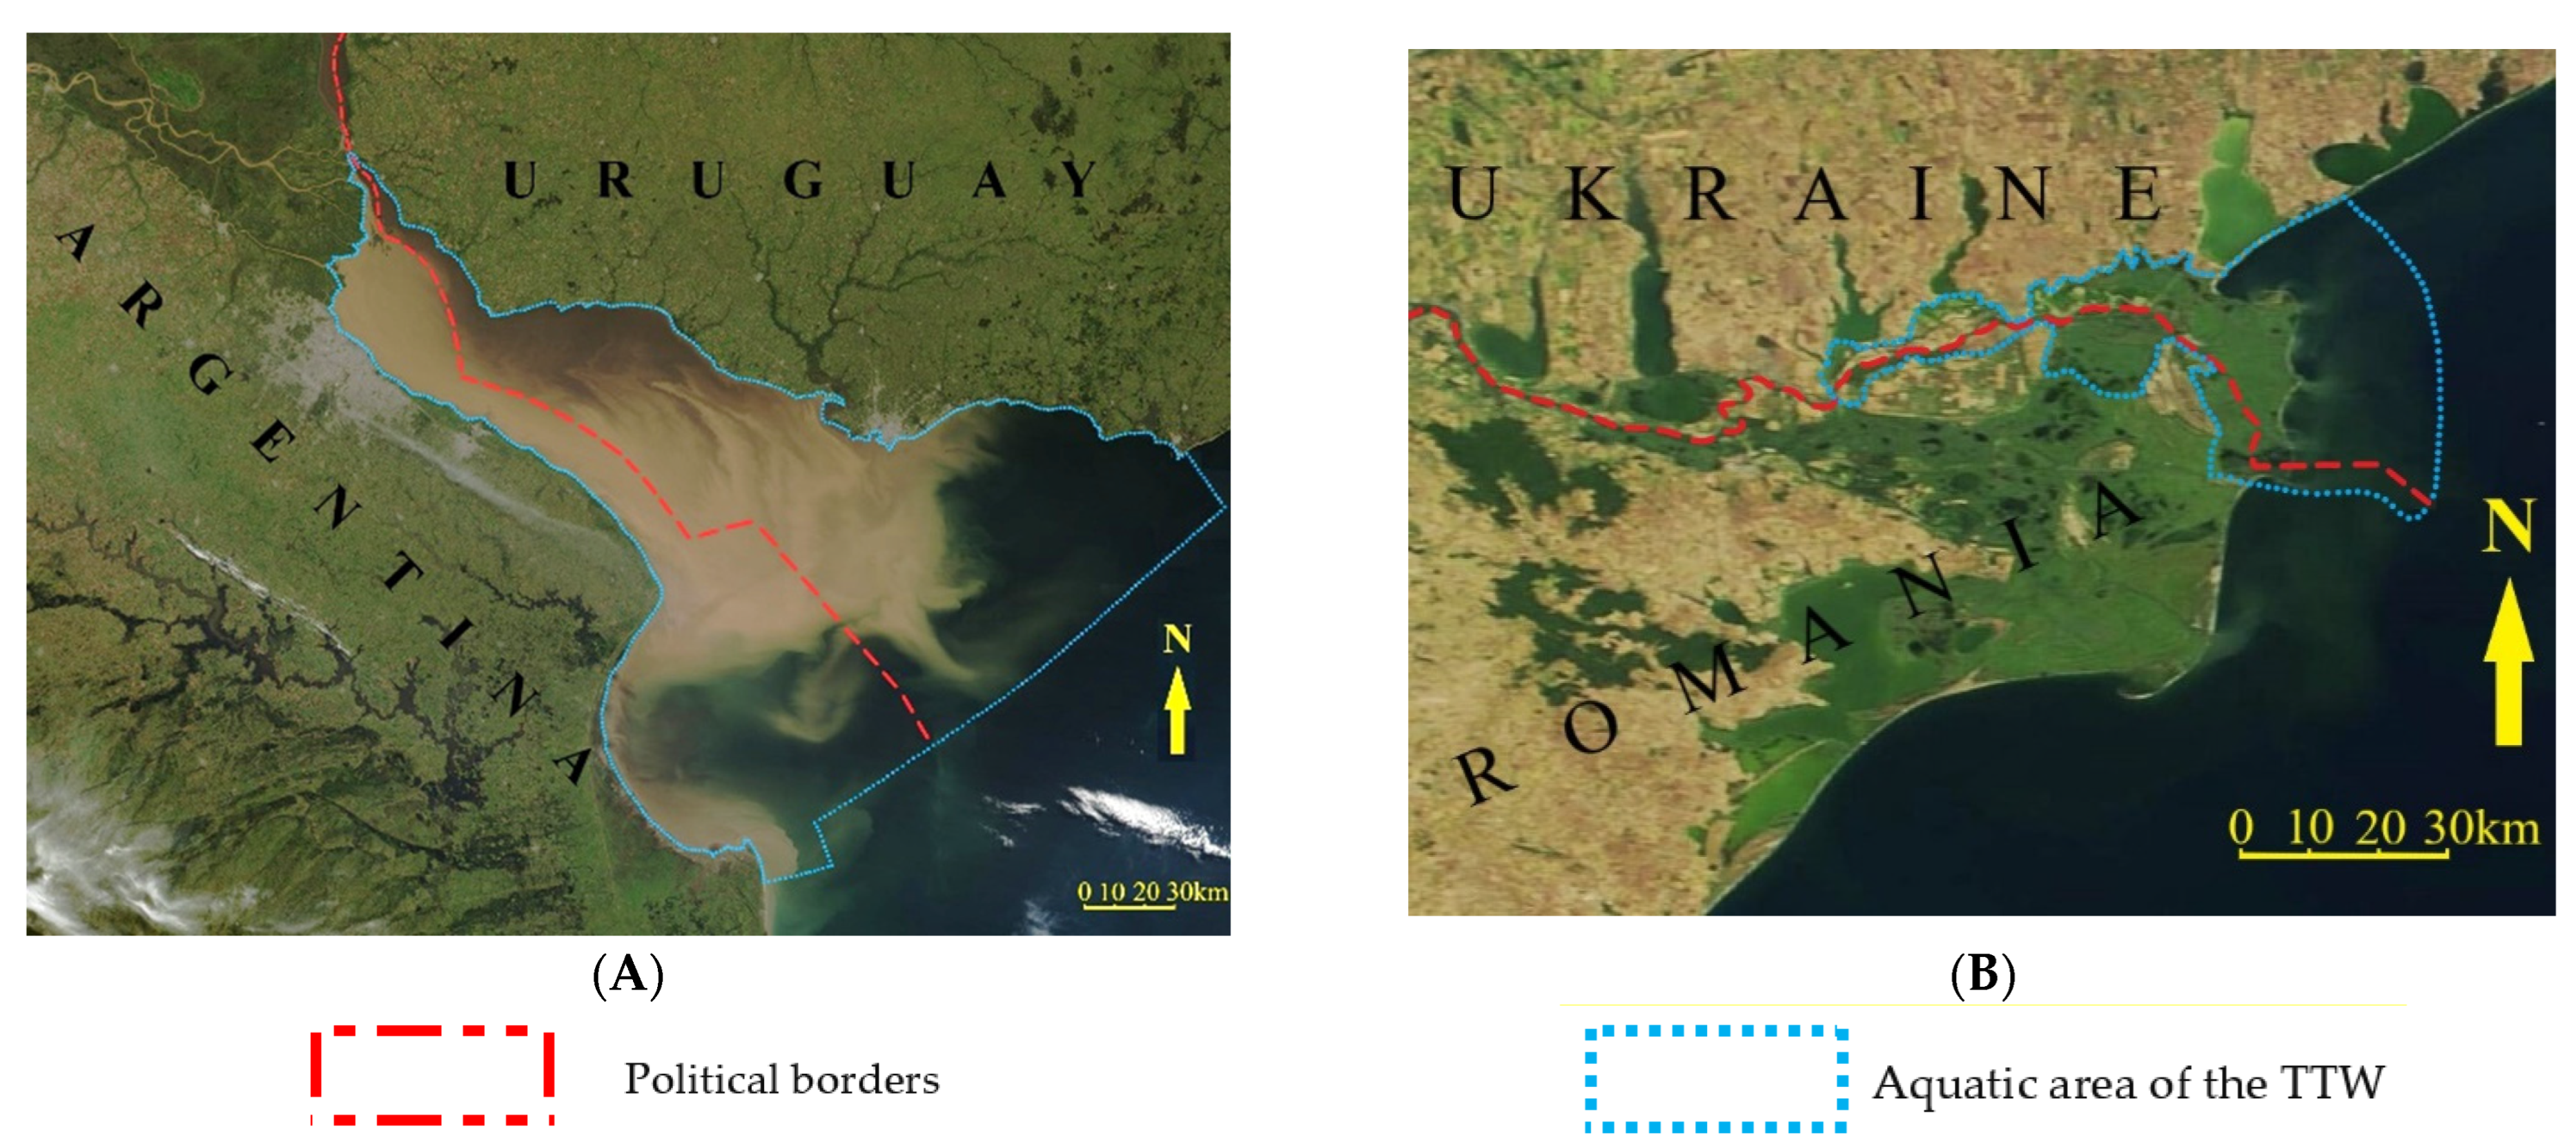
Defining the limits of TTW as areas of cross-border collaboration or, eventually, confrontation, is challenging. In a strict sense, a TTW body covers an aquatic area, tidal marshes, floodplains, and a possible freshwater discharge plume into the sea up to the 12 NM limit of territorial waters with a contiguous border (Figure 1). However, in a broad sense, particularly considering socioeconomic aspects, a TTW area should also cover the land directly adjacent to this TTW. In this case, boundaries are drawn arbitrarily. Typically, they follow the boundaries of riparian and the littoral local, municipal, or regional administrative units on both sides of the border.
2.2. Methods
Achieving the objectives and research results of the study comprised five steps:
- Obtaining a thorough inventory of the TTW worldwide using Google EarthTM as a tool;
- Designing an integrated TTW Cooperation and Confrontation Index (the Index) to gauge the level of cross-border cooperation versus the confrontation in and around TTW;
- Validating the statistical independence of the selected indicators comprising the Index and checking if collinearity was excluded from the data set;
- Quarrying raw and derivative socioeconomic data on TTW areas and the countries sharing them to elicit the values of the indicators comprising the CCI as a pilot test of the approach;
- In the next stage of our study, we conducted two comprehensive case studies: of the Curonian Lagoon, shared by Lithuania and the Russian Federation, and the Zwin tidal inlet, shared by Belgium and the Netherlands, in order to elicit the current CCI values for both of these TTW and compare their situations regarding their levels of cross-border cooperation and its perspectives.
This paper resulted from our dedicated work on this subject over several decades. We systematically surveyed the world’s coastal areas in detail on large-scale charts and maps, using Google EarthTM and published materials compiling the worldwide database of the TTW. Google EarthTM is widely applied as a free Graphic Satellite Interface for the inventory and a semi-instrumental spatial analysis of the land and coastal features [61]. We thoroughly examined the world’s coastline by scrutinizing the sites where sovereign states’ borders or their overseas dependencies meet the sea and checked additional materials in dubious cases. In several cases, we conducted fieldwork in Europe and the Americas.
The Index gauges the socioeconomic and environmental policies and factors that facilitate or hinder the cross-border cooperation in TTW areas and measures the confrontation risks between the countries sharing these areas. It demonstrates the need for and ways of securing peace and stability in TTW areas, which may contribute to or delay achieving the United Nations Sustainable Development Goals by 2030 in the countries sharing these TTW. The Index comprises five facets and 25 indicators are spread equally among these facets.
The methodology for eliciting the indicator values for computing the Index followed the quantitative part of the methodology used by the World Development Forum to compute the global Travel & Tourism Development Index [62,63]. The following are the five facets based on the values with which the total values of the CCI for each TTW are computed:
- Socioeconomic Cohesion;
- Environmental Coherence;
- Cross-border Connectivity;
- Cross-border Cooperation;
- Confrontation Risk.
After carefully selecting and comprehensively analyzing the collected material, we chose these five facets, relying on our more than twenty years of experience in conducting complex international environmental cooperation studies on TTW in Europe, especially in the South Baltic area and the Americas. We organized a focus group at Klaipeda University early in 2022 to verify this choice. In addition to the authors of this article, five other experts on environmental studies on TTW also took part. These five aspects did not cause disagreement among the experts and were approved unanimously. However, the selection of the 25 indicators raised more discussions, as we needed to maintain them within a reasonable number, have them be based on available and reliable data, and have them be representative.
We estimated the confrontation risk values for all the TTW areas worldwide as the fifth facet of the Index. We subtracted the last facet value from the other four facet values’ averages. Each facet comprised five indicators whose values were quarried directly from open sources, derived from spatial data, processed using GIS, and normalized from 1 to 7 (Table 1).
To be selected for the Index, the indicators had to meet the following criteria [63]:
- Regional or national coverage: Appropriate indicator data must be available for all the TTW covered by the CCI;
- Relevance: The indicator must represent a suitable metric for the addressed facet;
- Comparability: The data must be comparable between similar-level administrative units and throughout the time series;
- Update regularity: The indicator is recurrently updated for the foreseeable future;
- Source objectivity: The indicator must be quarried from a single objective source. The first-to-quarry sources include reputable international bodies such as the World Bank or International Monetary Fund.
In this study, we applied vector GIS to calculate the lengths and areas of six parameters: These were: 1.02, the relative difference in the nighttime light intensity between both parts of the area; 1.03, the difference in the road network density between both parts of the area; 2.01, the difference in the relative acreage of the natural habitats between both parts of the area; 2.02, the difference in the deforestation and wetland reclamation rate between both parts of the area; 2.03, the difference in the relative acreage of the protected areas between both parts of the area and 3.05, the cross-border infrastructure (power grid, cables, pipelines, and water canals).
These indicators’ values were elicited from the GIS-based calculations [64]. For achieving this aim, various spatial information sources were used—from using the baseline vector landcover map of the GIS software ArcGIS® 10.8 by ESRITM to open-source GIS-based vector data sets (HELCOM GIS, EU Digital Observatory of Protected Areas Explorer, Marine Regions, OpenStreetMap, Ramsar Sites Information Service, Google Night Lights) and digitizing the available topographical maps and nautical charts. For our investigation, we created additional ArcGIS layers and overlayed them. Afterwards, we accomplished the necessary calculations for the indicators.
For the six indicators, where the range of the elicited values was extensive, deleting data from each distribution end was applied to the sample minimum and maximum. This procedure is named winsorization and is necessary for reducing the effect of outliers and obtaining robust averages. This means that we used winsorized data sets for further normalization. We applied a typical winsorization strategy to set all the outliers to a specified percentile of the data, i.e., we winsorized the data at 1.5 standard deviations (σ), meaning that about 6.5% of the numbers from the minimum and maximum tails were deleted from the process of eliciting the indicator values. For example, if there were no border crossings in the Han River estuary and 2 Mio border crossings in the Bidasoa Estuary (Spain/France) and Tornio Estuary (Sweden/Finland), these outliers were deleted from the calculation.
The scores for each indicator were normalized and rated using a mathematical normalization from 1 (highest difference) to 7 (equal values). The World Development Forum applied this approach to elicit the global Travel & Tourism Development Index [62,63]. In addition to converting the data sets to a 1-to-7 scale for the indicators of the fifth facet, we adjusted the data so that 1 and 7 corresponded to best and worst, respectively. Finally, the CCI for each TTW was calculated as an average of the four cross-border cooperation facet value averages, from which the average of the confrontation facet was subtracted.
2.3. Statistical Analysis
To validate this choice of indicators and the necessity of including every single indicator in the calculation of each of the facets or “composite indicators”, we applied a principal component analysis (PCA) using multivariate covariance and correlation interpretation, focusing on the total inertia analysis of the first and further dimensions. This showed if strong relationships existed between the variables and suggested the number of dimensions that should be studied. We analyzed the data set containing 108 individuals (TTWs) and 25 variables (cooperation and confrontation risk indicators).
The results of the PCA and necessity of including every single indicator in the calculation of each of the facets or “composite indicators” was additionally performed by the expert focus group according to six criteria, such as statistical independence or multicollinearity, relevance, robustness, transparency, parsimony, and data reliability, following the methodological principles outlined and recommended by the Organization for Economic Cooperation and Development [65]. The focus group comprised the same team of experts, with many years of research experience in international environmental cooperation studies on TTW, and the authors of this paper.
Finally, we performed an additional PCA for analyzing the selected indicator data set to illustrate the suitability of the socioeconomic cohesion indicators for the confrontation risk. We plotted the selected data in two dimensions to elicit the clusters of the closely related data points. The data set contained 108 individuals and four variables for the PCA demonstration based on the correlation analysis between the confrontation risk index and socioeconomic cohesion indicators. The variables included: 1.01, the relative difference in GDP per capita (PPP); 1.05, the corruption perception of a more corrupt neighbor; 5, and the confrontation risk and continent as a qualitative variable. We included the latest variable for illustrative purposes.
3. Results
3.1. Global Database of TTW Bodies and Their Characteristics
TW cover 13% of the global coastline. In Europe, this percentage is significantly lower (8%) due to the predominantly indented coastline of the continent. However, the distribution of TTW illustrates a different picture. After a thorough inventory of the world’s coasts, we amassed a global database of 108 TTW bodies: 31 are in Europe, 27 are in Asia, 21 are in Africa, 18 are in North America and the Caribbean, and 11 are in South America (Table A1). Two TTW are shared by three countries: El Salvador, Honduras, and Nicaragua share the Gulf of Fonseca, whereas Bahrain, Qatar, and Saudi Arabia share the Gulf of Bahrain. Four countries, Egypt, Israel, Jordan, and Saudi Arabia, share the Gulf of Aqaba.
Considering the geographical diversity of these TTW bodies, as well as the delineation of the borders separating the neighboring countries sharing the TTW, the following patterns can be distinguished: transboundary estuaries with a border stretching along the thalweg is by far the most popular pattern, being demonstrated by 34 of such TTW bodies around the world. The borders along the thalwegs dividing tectonic inlets form the second most popular pattern, with 19 such TTW showing this worldwide. Other frequent patterns include an asymmetric division of estuaries and tectonic inlets. The Zwin, the Curonian Lagoon, and the Hondo estuary with the Corozal Lagoon do not fall into any of these elicited categories.
3.2. Independence of the Indicators
The results of the PCA analysis aimed to validate the choice of the indicators and the necessity of including all the indicators in the calculation for each of the facets, as the correlation plot of all the variables indicated that the collinearity was minimized in the data set. Table 2 shows that two facets—3 (cross-border connectivity) and 4 (cross-border cooperation)—showed a certain degree of inner correlation, with Pearson’s R2 reaching 0.66. However, such a statistical level of correlation is insufficient for reducing the number of indicators and merging some indicators into larger “composite” ones, or using easier available or more reliable indicators as proxies for less reliable indicators.
The expert group rectified the results of the PCA, agreeing that, although our chosen “five-by-five” approach may have looked very formal, the process of selection was transparent and careful, and, as noted by the OECD [65] (p. 138): “subjectivity and fitness need not be antithetical. They are both at play when constructing and adopting a composite indicator, where inter-subjectivity may be at the core of the exercise”. Indicator 1.5. The corruption perception of a more corrupt neighbor was exceptional, correlating with various indicators. Although the correlation was insufficient for using indicator 1.5 as a proxy, it validated the role of spin dictatorships in shaping the collaboration and confrontation in TTW.
3.3. TTW Areas in the World under High Confrontation Risk
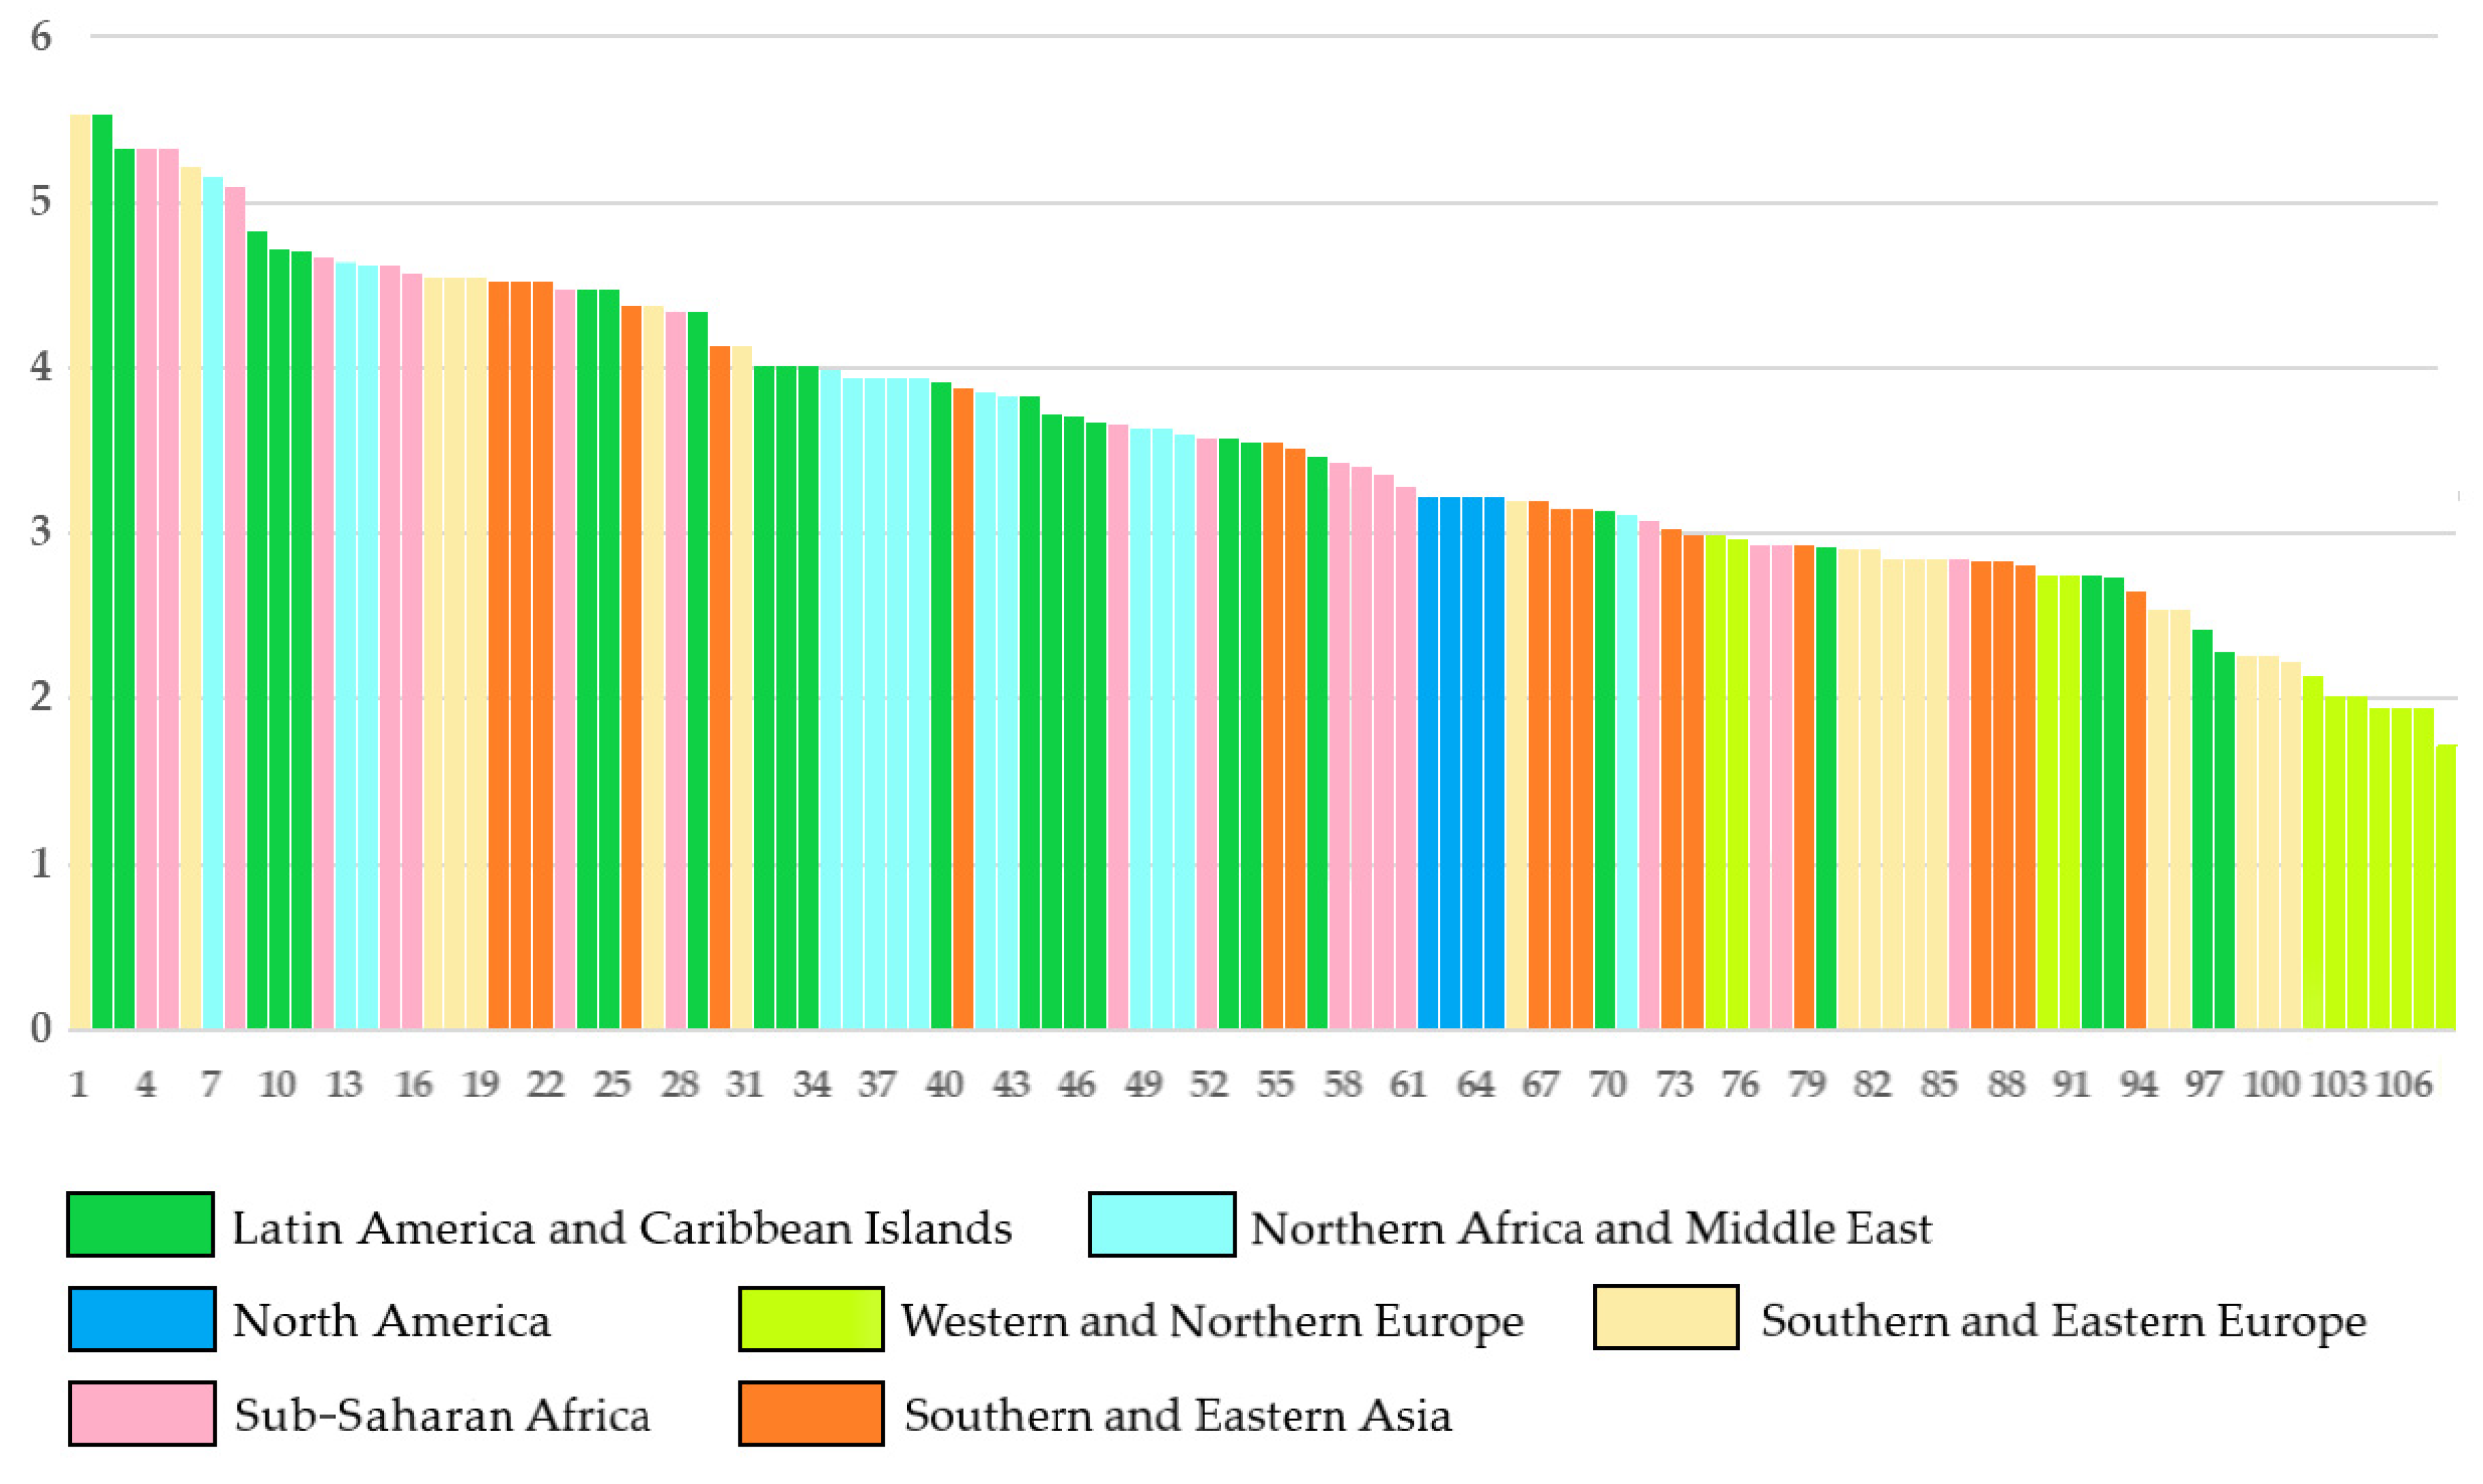
When studying the distribution of the world’s TTW according to confrontation risk (Figure 2), the results of the investigation showed that 8 TTW areas are under a high confrontation risk (average score 5.1–6.0), 23 TTW areas are under a significant confrontation risk (average score 4.1–5.0), 41 areas are under a medium confrontation risk (average score 3.1–4.0), and 29 TTW areas are under a low confrontation risk (average score 2.1–3.0). Six transboundary transitional water areas have little or no confrontation risk (average score 1.0–2.0). These six TTW areas are in Northern and Western Europe. No single TTW area has a very high confrontation risk (average score 6.1–7.0).
Currently, the highest confrontation risk among the TTW areas worldwide is in the Psou River mouth shared by the Russian Federation and, de jure, Georgia, although de facto, a breakaway region of Abkhazia controls the southern part of the Psou River mouth (Table 3). Russia has recognized and protects the independence of Abkhazia. Hence, Georgia’s efforts to take back Abkhazia resulted in a military conflict between Georgia and Russia in 2008. Russia won the conflict as a more bellicose and populous country. However, if Russia loses the invasion of Ukraine, Georgia may be tempted to take back Abkhazia, leading to military clashes between Russia and Georgia, also in the Psou River mouth.
The borders between the Russian Federation and most of its neighbors with whom it shares TTW, except Estonia, are demarcated, and there are no formal territorial disputes. However, the Russian Federation, an authoritarian [66], corrupt, and bellicose country that is more populous than all its littoral neighbors, poses a high confrontation risk on the eight TTW shared with its neighbors. Any of these TTW may become an area of a military conflict, especially the Narva River estuary on the Russian border with Estonia (Table 3).
Another TTW with a high confrontation risk is in South America, in the Barima River delta shared by Venezuela and Guyana. Venezuela, a bellicose, autocratic, and more populous neighbor, is notorious for its high homicide rate and endemic civil unrest. To make the situation worse, it claims all the territories of Guyana west of the Essequibo River, i.e., half of its neighbors’ territory, preventing any settlement of a maritime boundary, including the Barima River delta. Therefore, the average of the five confrontation indicator values showed that this TTW area is under a high confrontation risk.
However, on the world’s scale, the distribution of TTW according to the confrontation risk index shows normality (Figure 2). The median value of the distribution was 3.5, i.e., lying almost in the middle between 1.7, i.e., the lowest value, and 5.5, the highest value. The TTW with confrontation risk scores of 3.5 are in various regions of the world: the Kyan/Kra Buri Estuary, shared by Myanmar and Thailand, in southeast Asia; the Katchek Estuary (Guinea and Guinea Bissau) in western Africa; the Los Portillos Lagoon (Nicaragua and Costa Rica) in Central America; and Rio de la Plata (Uruguay and Argentina) in South America.
Three of the twenty-one African TTW have a high confrontation risk: the Ntem (Campo) Estuary, shared by Equatorial Guinea and Cameroon (confrontation risk score—5.3); the Akpa Yafe Estuary (Cameroon and Nigeria, score—5.3); and the Congo Estuary (Angola and DR Congo, score—5.1). Another five TTW are under a significant confrontation risk: the Orange River Estuary (South Africa and Namibia, score—4.6); the Muni River Estuary (Gabon and Equatorial Guinea, score—4.6); Lawyacado Bay (Djibouti and Somalia, score—4.5); Mekoundji Lagoon (Congo and Gabon, score 4.4); and the Kunene River Estuary (Namibia and Angola, score—4.1).
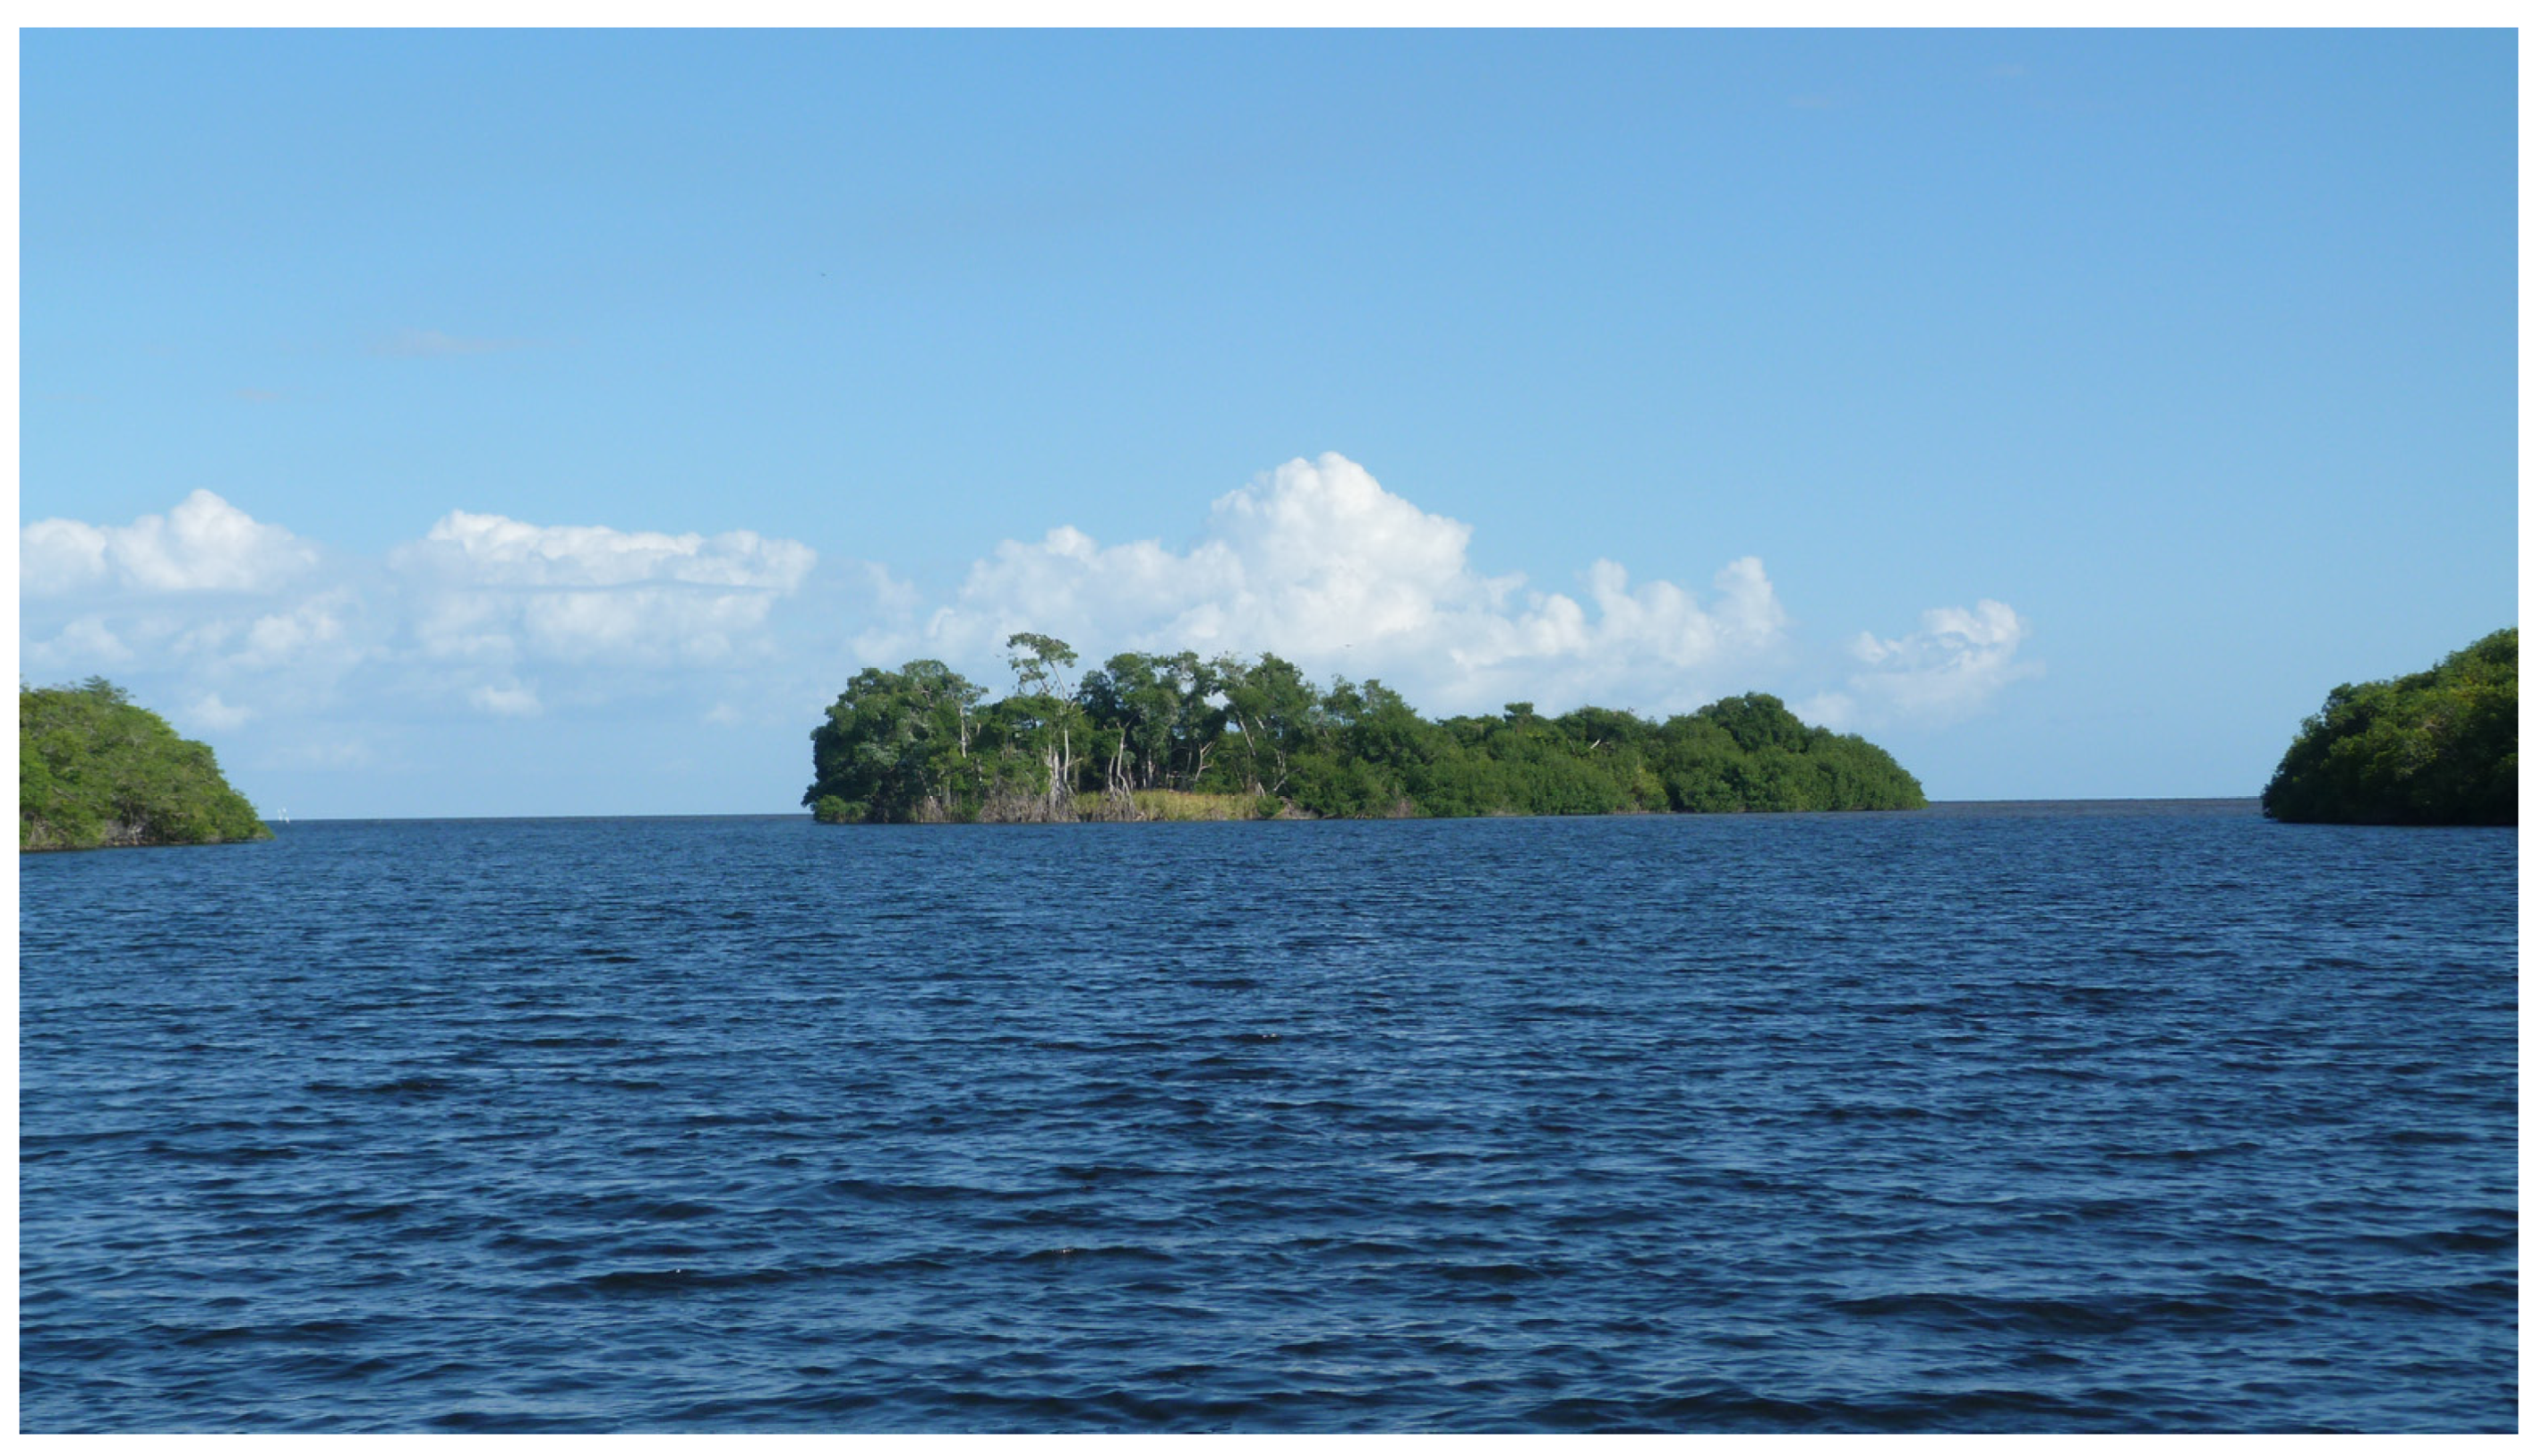
Three of the ten Central American TTW are under a significant confrontation risk: Amatique Bay (Belize and Guatemala, score—4.8); Chetumal Bay (Mexico and Belize, score—4.7); and the Suchiate River Estuary (Guatemala and Mexico, score—4.7). Notably, both TTW shared by Belize with its neighbors are under a high confrontation risk. Until 1981, Belize (British Honduras) was the only British colony in Central America. Guatemala has territorial claims to half of Belize, while Mexico and Belize have border demarcation issues in a TTW area with complicated physical features (Figure 3). The Suchiate River Estuary, shared by Mexico and Guatemala, is a porous border used by drug smugglers and illegal migrants heading to the US, causing potential conflict risks.
Three TTW areas in eastern Asia were presumed to showcase a very high confrontation risk. The People’s Republic of China and Taiwan (China) share the Xiamen Bay and Matsu Bay, and North Korea and the Republic of Korea share the Han River estuary. The PRC and ROC claim sovereignty over each other’s territory, as do North and South Korea. Xiamen Bay, Matsu Bay, and the Han River Estuary are heavily militarized few-NM-wide TW bodies separating these confronting polities. However, despite militant rhetoric and occasional warmongering by more bellicose neighbors, none of these polities intend to escalate tensions. The average of the confrontation indicator values showed that these TTW areas are under a significant but not high confrontation risk.
3.4. Correlation between the Confrontation Risk Index and the Socioeconomic Cohesion Indicators
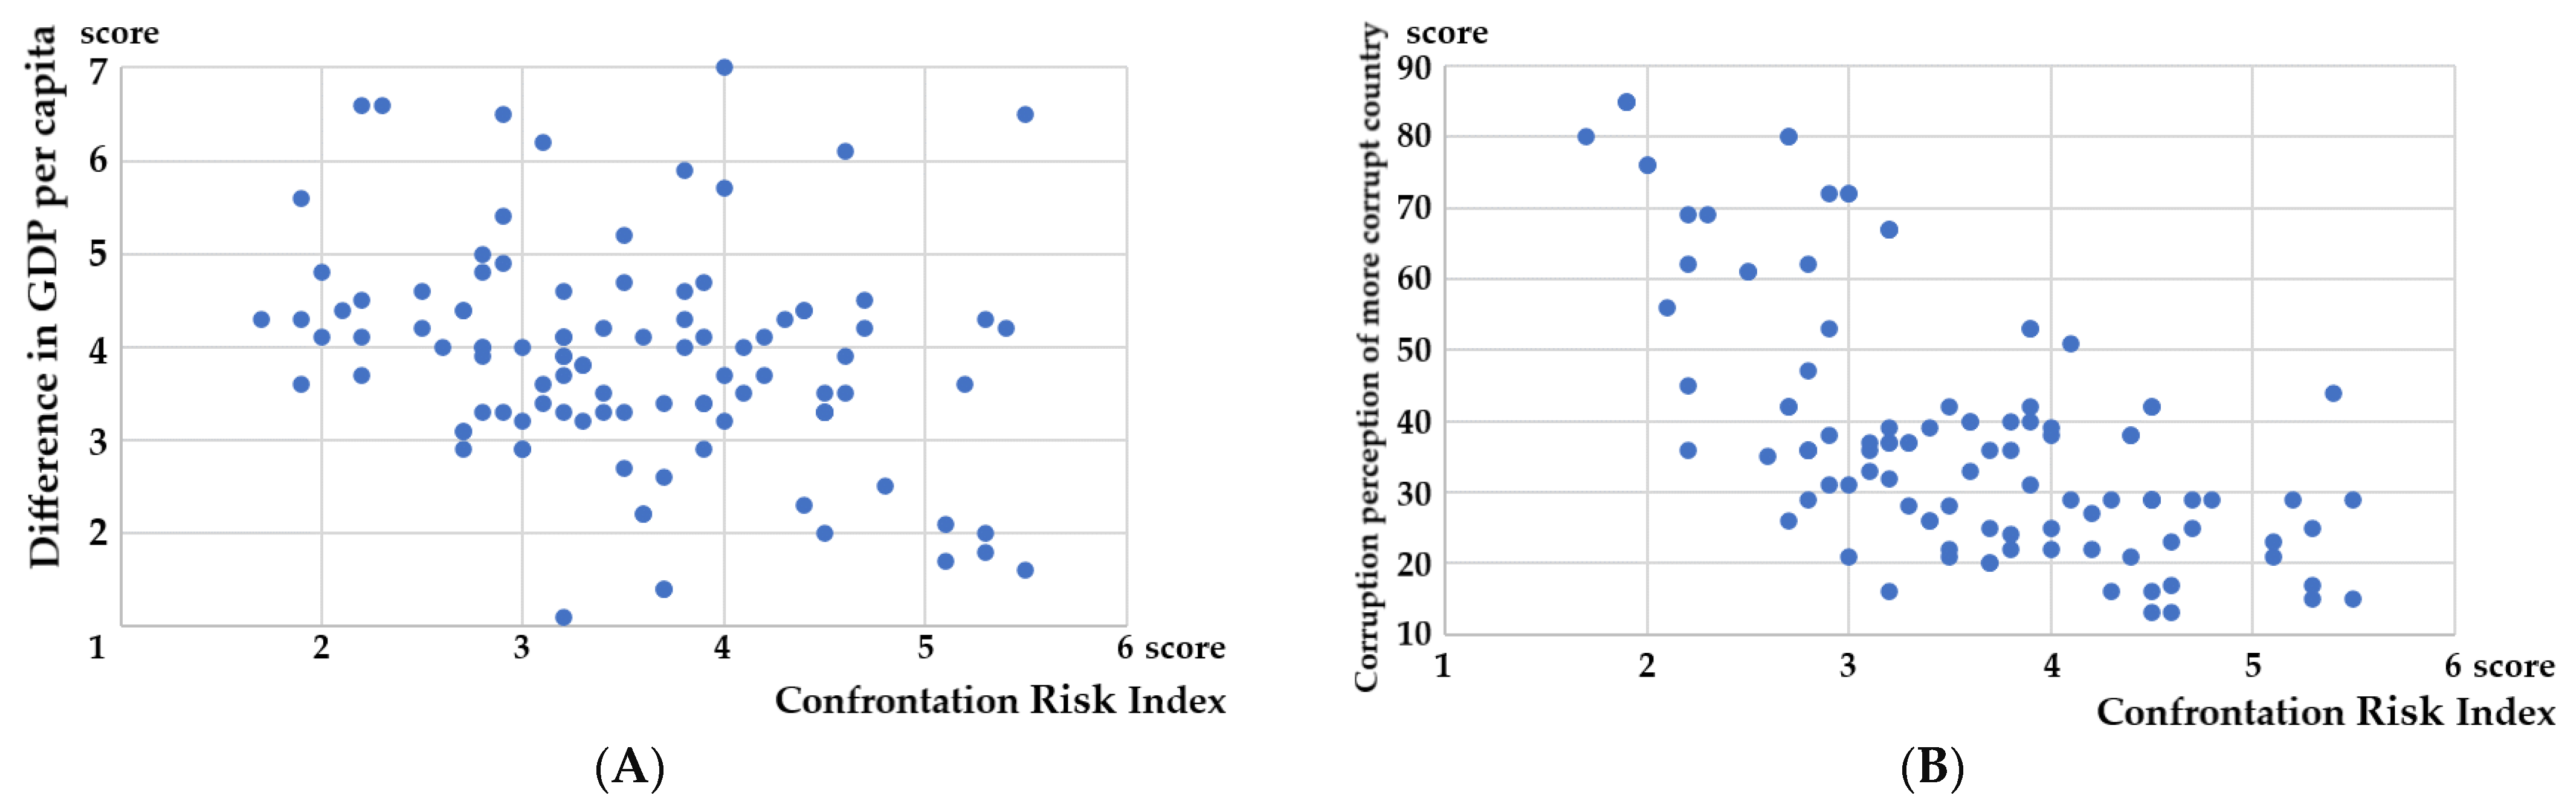
There was no correlation between the confrontation risk index and GDP (PPP) per capita difference between the countries sharing TTW (Figure 4A, Pearson’s R was—0.2965). This may indicate that differences in living standards on both border sides do not play any role in increasing tensions between these countries. However, they facilitate illegal migration, the smuggling of drugs and migrants, and raise cross-border tensions [67]. On the other hand, applying the purchasing power parity concept distorts this socio-economic comparison of neighboring countries, albeit being applied by the European Commission. Additionally, our research used regional rather than national GDP (PPP) per capita data, where available.
Instead, the correlation between the confrontation risk and corruption perception of a more corrupt neighbor was quite strong (Figure 4B, R = −0.6642), i.e., the more corrupt one of the countries sharing a TTW with another was, the greater the confrontation risk was. The correlation between the confrontation risk and corruption perception was negative, because the corruption perception index calculated by Transparency International ranks countries from the least corrupt (highest values) to most corrupt (lowest values). This correlation leads to the spin dictatorship concept [66].
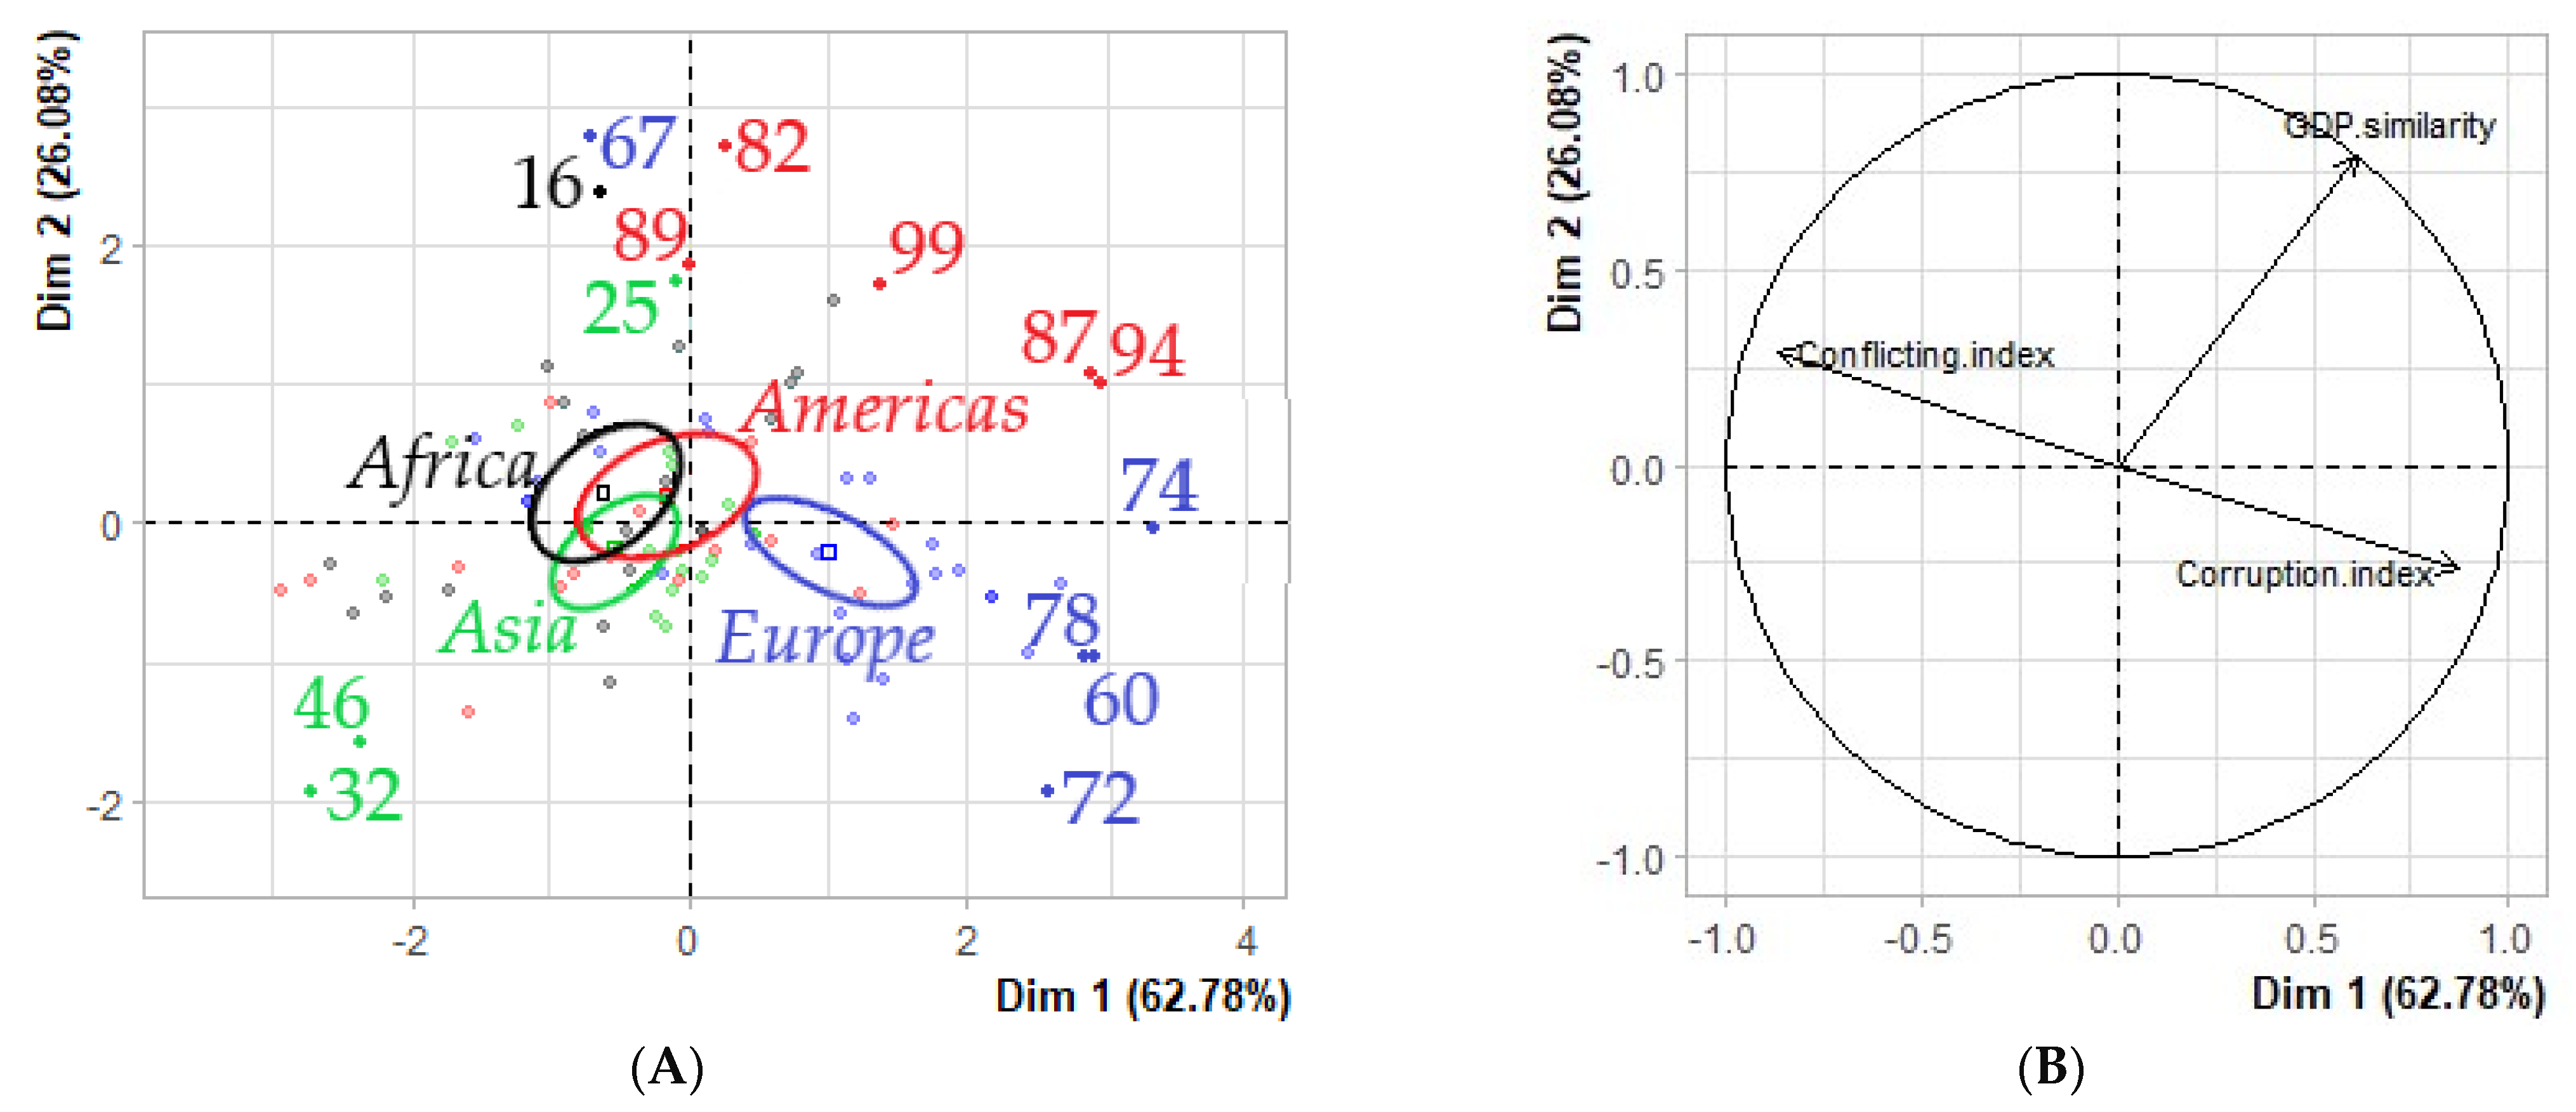
The Principal Component Analysis (PCA) was accomplished for all 108 worldwide TTW, with four variables being analyzed:
- i.
- The confrontation risk index (labelled as Conflicting.index);
- ii.
- The relative difference in GDP per capita (PPP) between both parts of the area (labelled as GDP.similarity);
- iii.
- The corruption perception of a more corrupt neighbor (labelled as Corruption.index);
- iv.
- The continent where the TTW is located (labelled as Continent.index).
The fourth variable (Continent.index) was interpreted as qualitative and considered to be illustrative. The two dimensions of the PCA explained 88.86% of the total variability in all the TTW cases regarding the multiple variations in the factors. This value was greater than the reference value of 75.57%. The variability explained by the plane was thus significant (the reference value was the 0.95-quantile of the inertia percentages’ distribution, obtained by simulating 1000 data tables of equivalent sizes based on a normal distribution). This was coherent with the results presented in Table 2.
The first factor (Dimension 1) was major: it explained 62.78% of the data variability. The Dimension 1 axis presented an inertia amount greater than that obtained by the 0.95-quantile of random distributions (62.78% against 42.91%). This observation suggests that only this axis carried factual information. The second factor (Dimension 2) was minor: it explained just 26.08% of the data variability. The variables factor map of the PCA (Figure 5B) indicated that the Dimension 1 axis featured the corruption perception of a more corrupt neighbor and the Dimension 2 axis featured the relative difference in GDP per capita (PPP) between both parts of the area.
3.5. Case Studies of the Curonian Lagoon and the Zwin
The results of our comprehensive study on the Curonian Lagoon, which is shared by Lithuania and the Russian Federation, showed that, just a couple of years ago, the level of cross-border cooperation in and around the lagoon was robust, with no confrontation risk. However, the Russian Federation’s invasion of Ukraine in 2022 and Lithuania’s stance on Ukraine’s side have led to a nearly complete deterioration of this cross-border cooperation around the Curonian Lagoon. Table 4 shows the current situation in the Curonian Lagoon area.
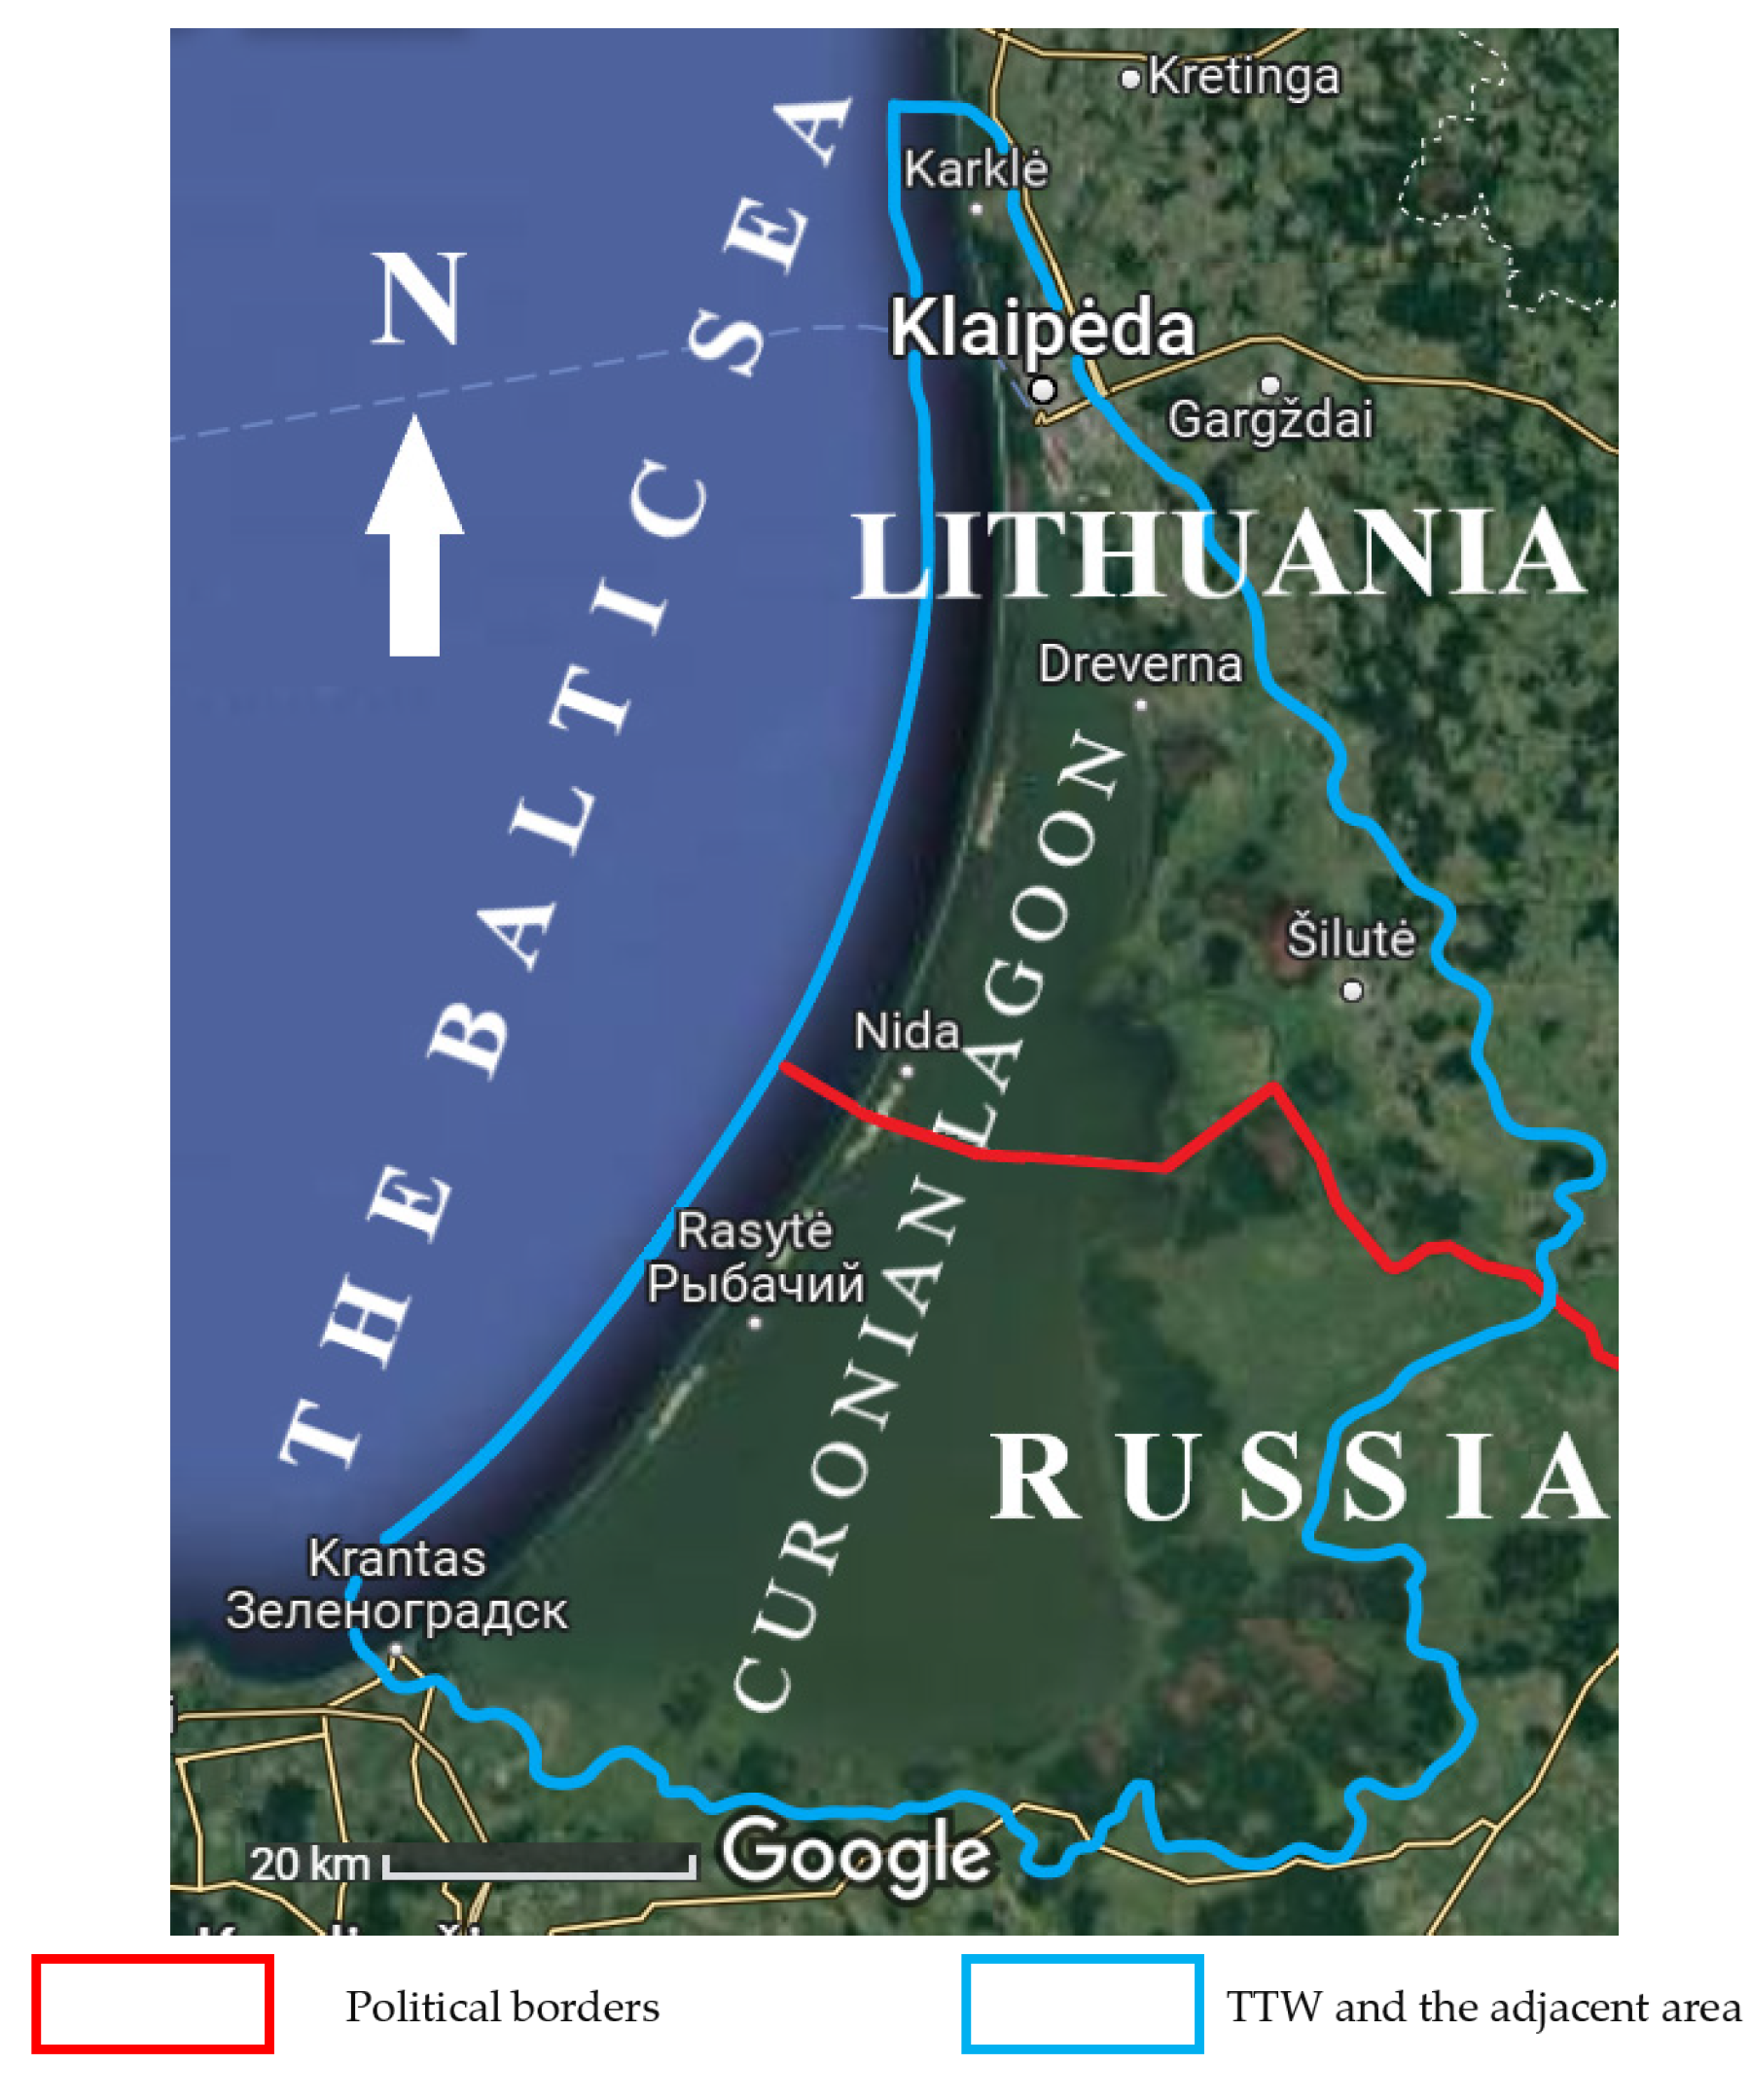
The non-tidal Curonian Lagoon is Europe’s largest coastal lagoon, situated on the southeast rim of the Baltic Sea. It is a semi-locked, shallow, and almost freshwater TW due to discharge from the Nemunas River. Politically, the southern two-thirds of the Curonian Lagoon and the adjacent area belong to Kaliningrad Oblast, an exclave territory of the Russian Federation. The northern part of the lagoon, the Strait of Klaipeda, and the Baltic Sea nearshore belong to Lithuania (Figure 6). This is a relatively recent division (since the collapse of the Soviet Union in 1991). The entire area was part of Prussia and Germany for centuries and part of the Soviet Union after World War II.
The close cohesion, e.g., of the road network, between the Russian and Lithuanian parts of the Curonian Lagoon area results from the long history of the area being within a single country. The much more intensive nighttime light in the Lithuanian part of the area is determined by Klaipeda City hosting the largest eastern Baltic seaport. Although Lithuania is richer in GDP per capita (PPP) than Kaliningrad Oblast of the Russian Federation, the difference in the official poverty rate between Lithuania and the Russian Federation is negligible. The most striking difference was in the Corruption Perceptions Index between Lithuania (the country rank determined by Transparency International was 34 for 2021) and the Russian Federation (136).
The close environmental coherence in the TTW area results from the prudence of both countries towards using natural resources with low rates of deforestation, wetland reclamation, and the poaching of resources. However, the natural habitats are better protected in the Lithuanian part of the area [57]. Additionally, the treatment of the wastewater discharged into the Curonian Lagoon is more advanced in the Lithuanian part, due to extensive EU subsidies.
Assessed as weak, the cross-border connectivity between the Lithuanian and Russian parts of the Curonian Lagoon area has declined due to the recent confrontation between NATO and the Russian Federation. Since March 2022, it has become problematic for Russian Federation citizens to obtain visas to enter Lithuania. Any regular cross-border passenger traffic between both parts of the area was cancelled and monthly border crossings are rapidly declining. However, the cross-border infrastructure (power grid, pipelines, cables, and water canals), which was created during the Soviet Union period (1945 to 1990), when the entire Curonian Lagoon area belonged to a single country, is still functioning.
The cross-border cooperation between Lithuania and the Russian Federation in the Curonian Lagoon area has declined dramatically. Lithuania suspended EU-funded cross-border NGO, academic, and business collaboration projects. Formal cross-border cooperation agreements are still valid, but their viability is weak, except for the regulation of the fishing quotas in the Curonian Lagoon. The border delimitation treaty between Russia and Lithuania was ratified in 2003, with no territorial disputes. Nevertheless, the Russian Federation poses a high confrontation risk. We estimated the total ICC value for the Curonian Lagoon to be 0.7 (cohesion and cooperation counterbalanced by confrontation).
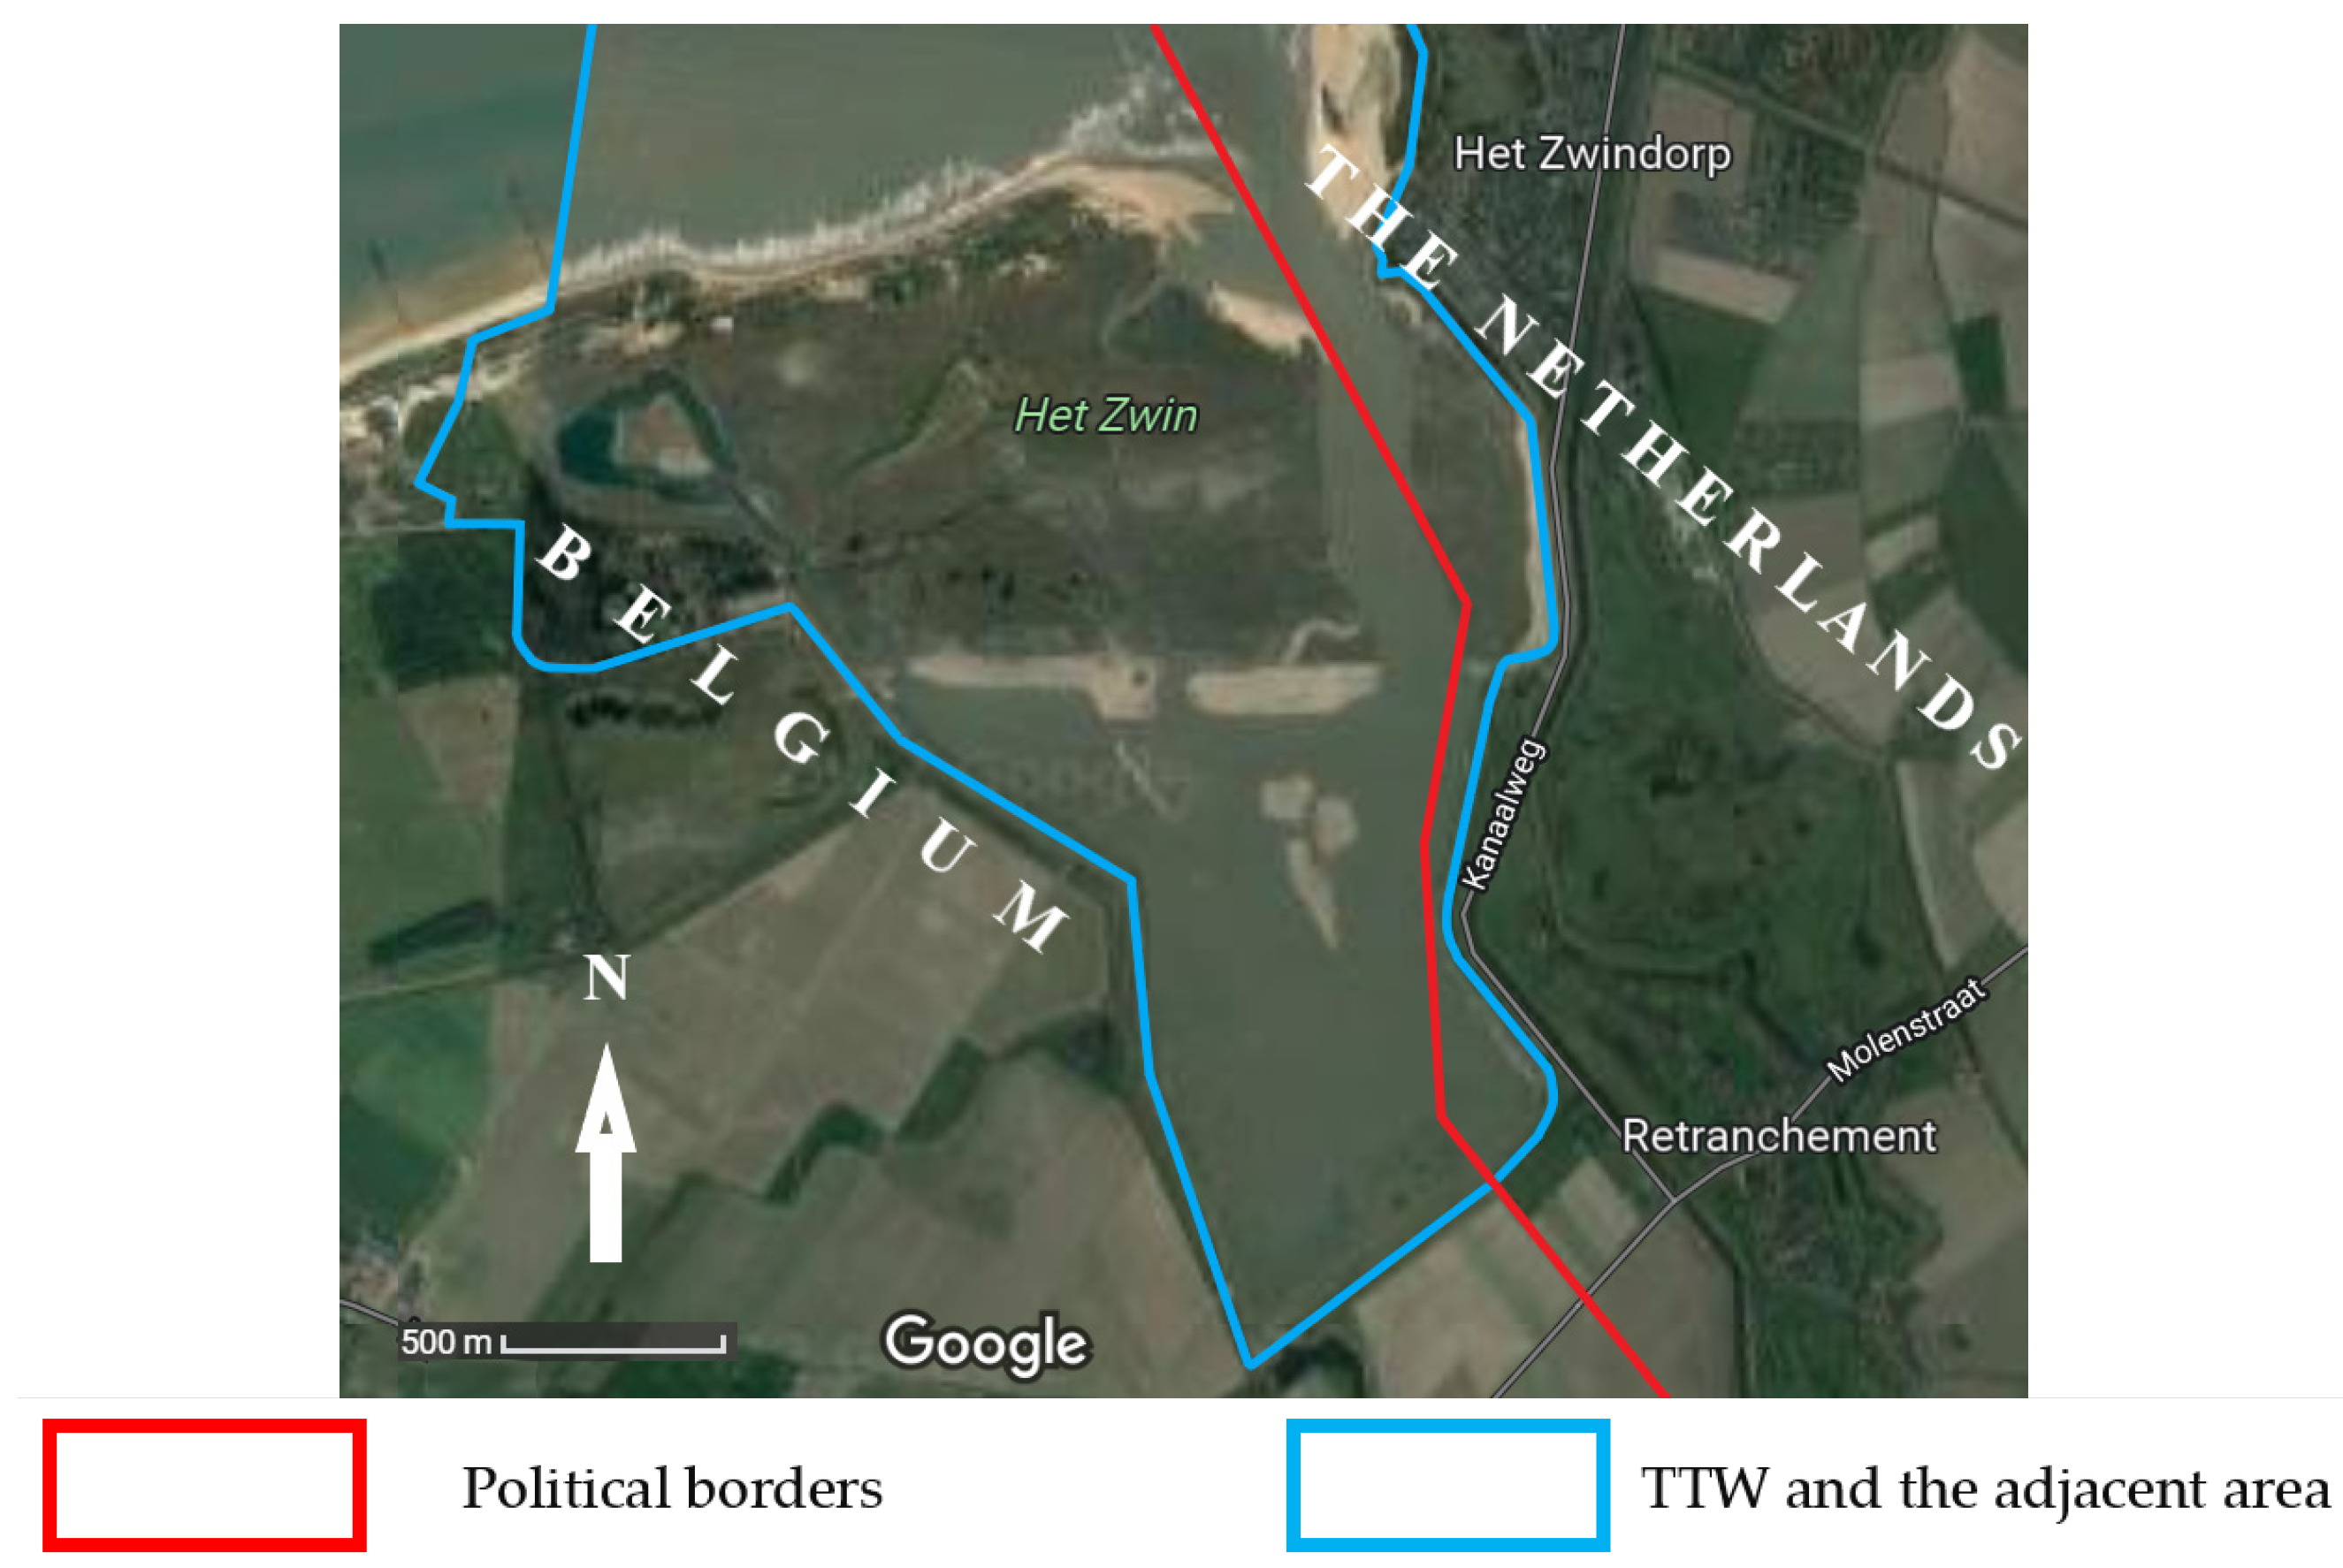
In contrast, the Zwin tidal inlet shared by Belgium and the Netherlands is a tiny TTW (area—1.58 km2, 1.25 km2 being on the Belgian side and 0.32 km2 on the Dutch side, Figure 7), which enjoys a long tradition of close cross-border cooperation between the neighboring countries sharing it (Table 4). The cross-border management of the Zwin started in 1873 with the construction of the Willem–Leopold-polder, named after William III of the Netherlands and Leopold II of Belgium, stretching across the border. The transboundary nature reserve was established in 1952, and in March 1986, it was designated as a Ramsar wetland of international importance.
The International Zwin Commission (IZC) has been operating since the creation of the Willem–Leopold-polder in 1872. Its main task is to preserve the Zwin as a tidal inlet and Ramsar wetland. Recently, the expansion of the natural inlet and facilitation of the tidal regime was agreed upon by both countries sharing the Zwin. The renaturalization of the Willem–Leopold-polder, combined with the widening and deepening of the Zwin inlet, was chosen as the scenario that best matched the managed semi-natural coastal landscape type set as a target for the ecosystem vision of the coast.
After completing these renaturalization works in 2019, the intertidal area was doubled and a new dyke was constructed surrounding the expanded natural tidal inlet and adjacent mudflats, dunes, canal system, and water pumping stations. The institutes from Belgium and the Netherlands carry out a multidisciplinary cross-border monitoring program to record the evolution in the morphology of the Zwin, its tidal regime, and changes in target species and habitats within the nature reserve [68].
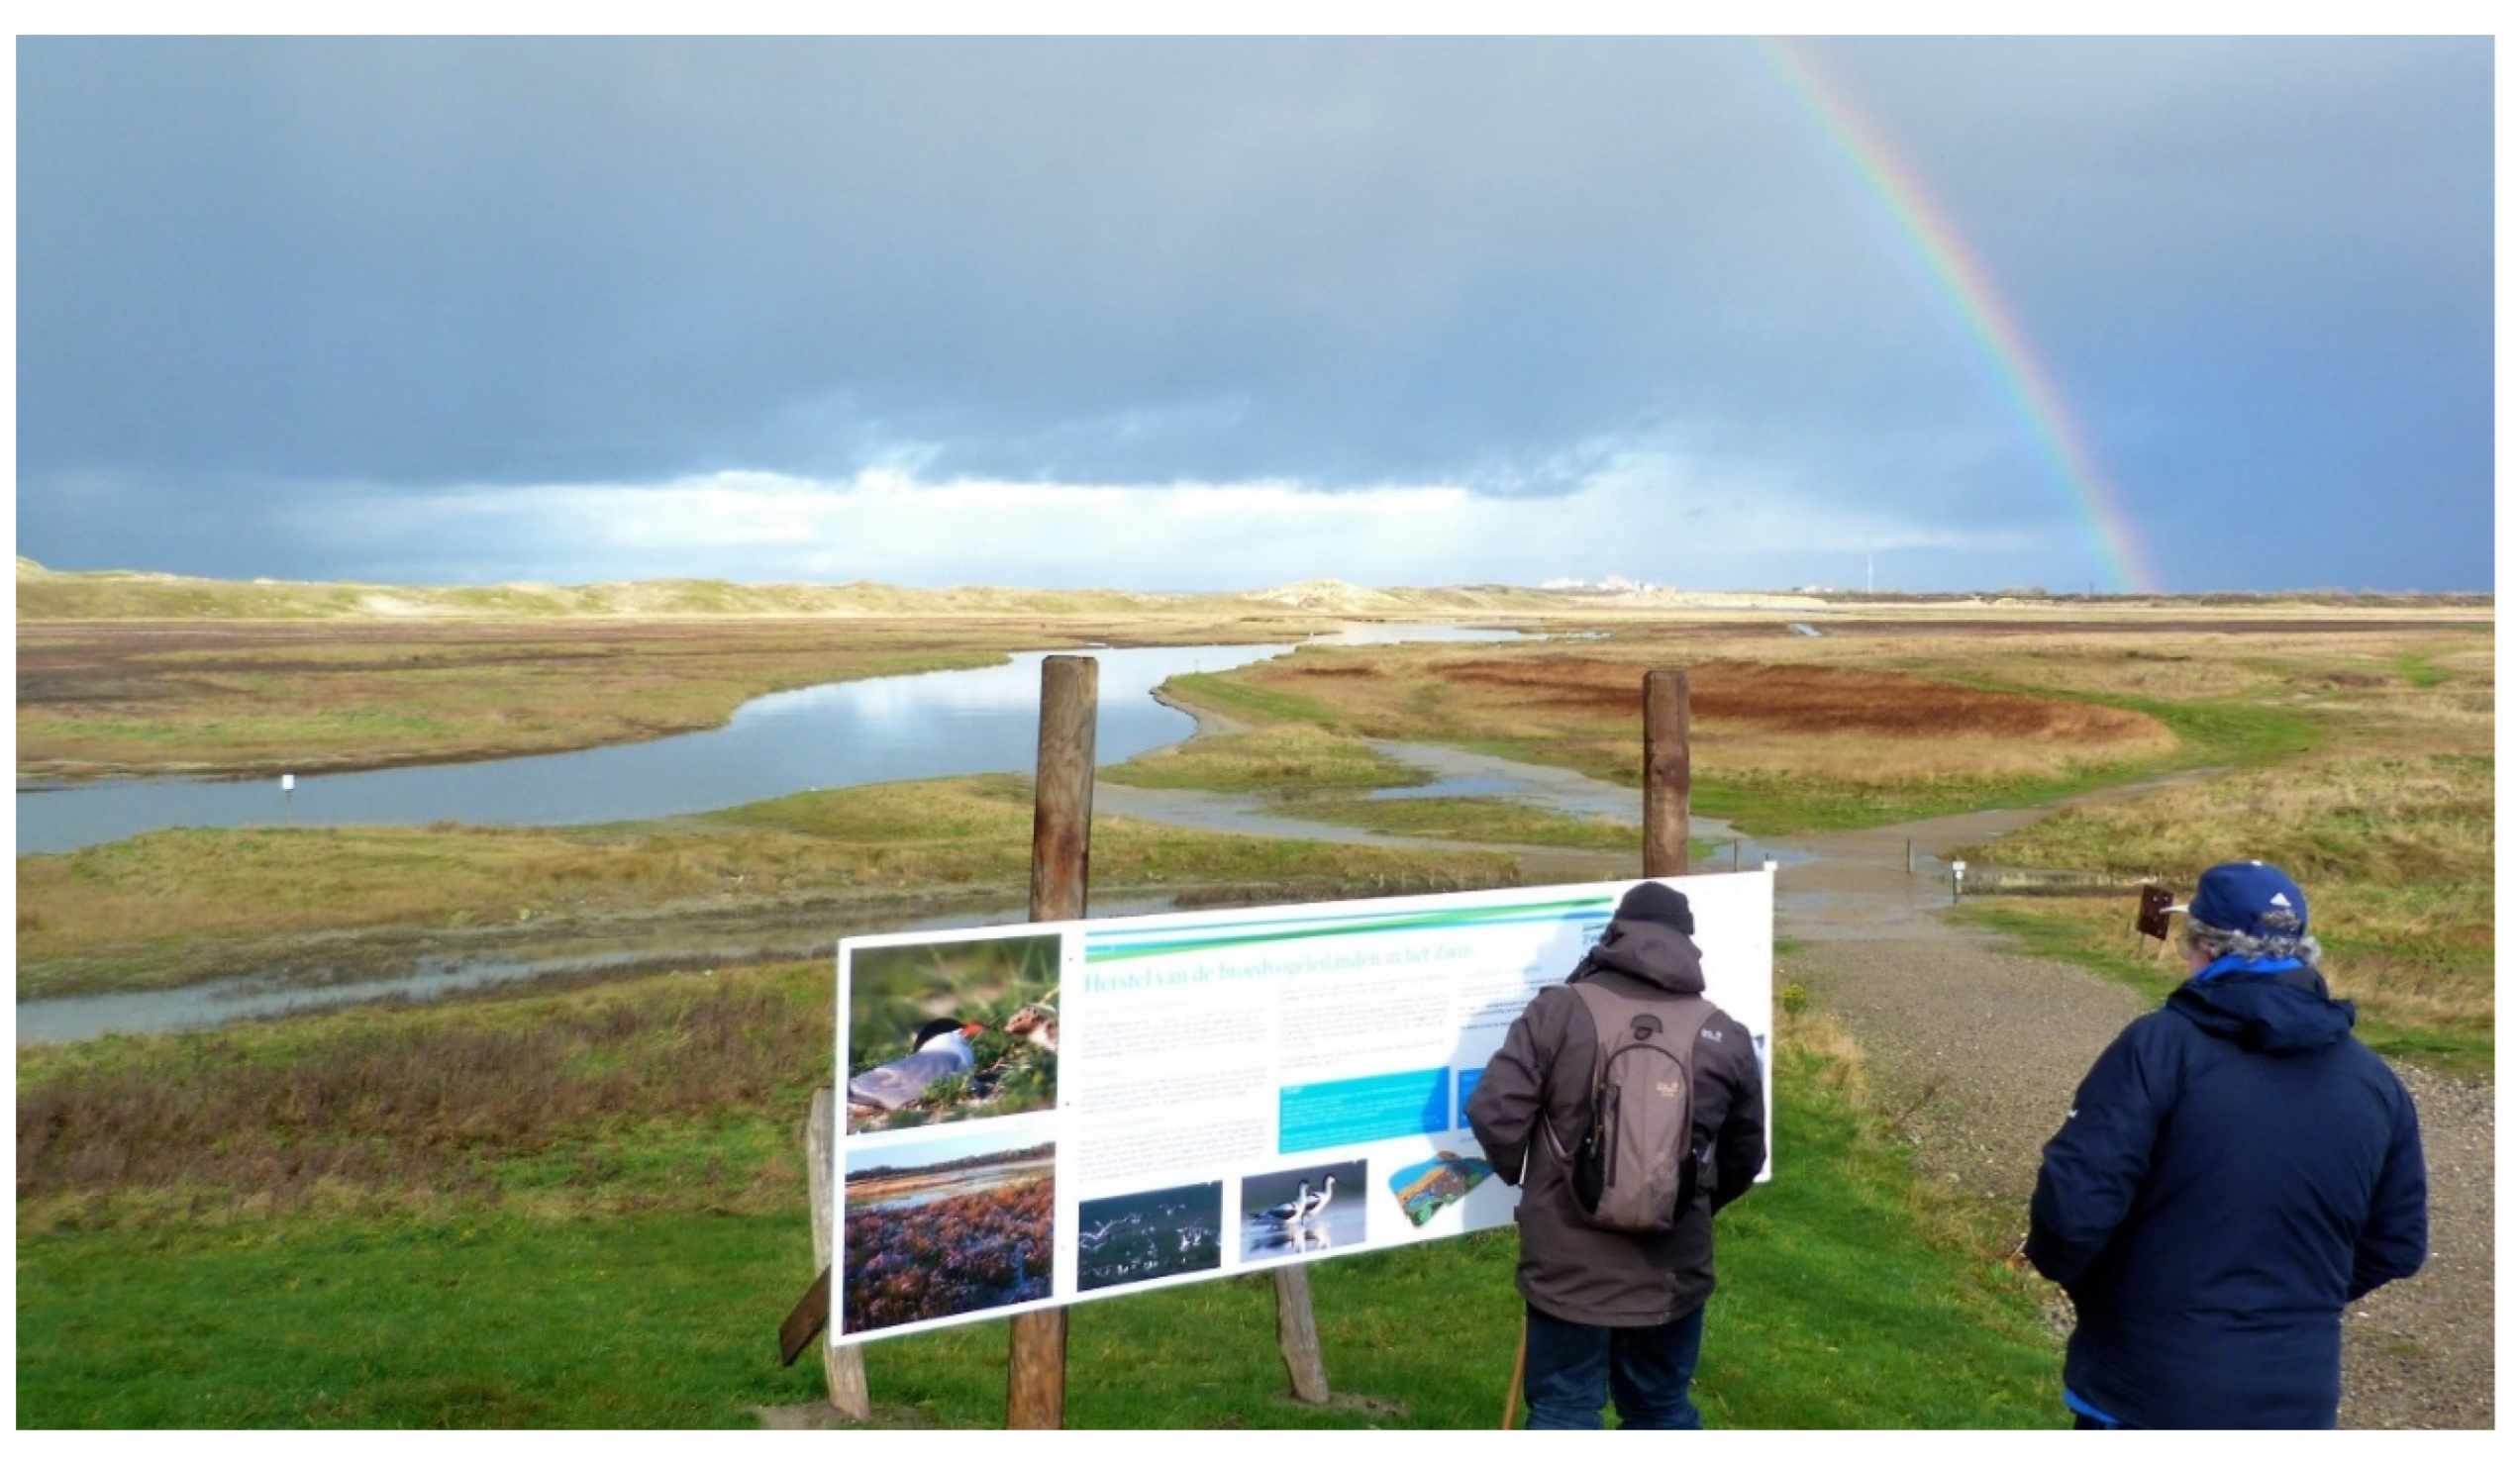
Good road and cycling path networks facilitate the visa-free movement of people across the border in the Zwin area, ensured by the EU Schengen regime. This free movement, however, was hampered in 2020 and 2021 by the anti-COVID quarantine regulations in both Belgium and the Netherlands. Considering this and other minor obstacles, and because the Economist Intelligence Unit regards Belgium as a country with a flawed democracy, we have estimated the total ICC value for the Zwin to be 4.8 (prevailing close cooperation and coherence). Despite it narrowly missing the ICC’s top value (+7.0), the Zwin can be a good benchmark of cross-border cooperation in TTW conservation and management (Figure 8).
4. Discussion
As can be seen from our investigation results, the main methodological advantage of the proposed Index is in the transparent and comprehensive systematization of such diverse and vaguely defined physical, geographical, ecological, and political territories, with all 108 of them being shared by several countries and covering the continuum between terrestrial and marine spheres. Such a comprehensive approach facilitates a broader application of the Emerald Growth concept in the contexts of different UN Sustainable Development regions and marine ecoregions. Of course, like with every hybrid survey, the results’ applicability and validity depend on the investigators’ alertness.
Naturally, this investigation is still in its pilot phase, and by far, only some of the 108 TTW have received the attention they deserve. There exist many possibilities for potential improvements. More attention should be paid to fine-tuning and the potential application of weights to the selected indicators. Additionally, there is room for expanding the existing indicator list to address the challenge of meeting the UN SDGs in these TTW areas, facilitating cross-border collaboration between the countries sharing the TTW and, eventually, involving additional countries in the basins of the rivers forming these TTW.
As mentioned in the introduction, due to their disproportionate socioeconomic and ecological roles in comparison to their sizes, TTW, as a specific research area, offer some advantages in the ways of measuring the confrontational risks between countries in coastal and maritime areas and areas upstream, especially regarding their competition over water resources and the protection of their quality. Our investigation offers additional perspectives for studying the hydropolitical relationships involved in transboundary cooperation practices for river basin and adjacent TTW management, regarding various aspects of cross-border politics and the political power in water issues [69].
For this discussion, the concept of “spin dictatorship”, coined by Guriev and Treisman [66], aptly fits when explaining the transboundary cooperation risks in the TTW identified in our investigation. Authoritarian spin dictators of the 21st century, in contrast to totalitarian “fear dictators” of the 20th century, hold on to power not by spreading fear through mass repression, but by using sophisticated leverage: “manipulating the media, engineering popularity, faking democracy, limiting public violence, and opening up to the world” [66] (p. 13). Hence, the term “spin dictators” is an analogy of “spin doctors”.
Spin dictators tend to show an eagerness and readiness for international cooperation. Guriev and Treisman argued that, in normal circumstances, they “welcome flows of people, capital, and data and find ways to profit from them” [66] (p. 17). However, if economic problems arise and the population’s support dwindles, they declare that this poor economic performance is the fault of external conditions and enemies. Spin dictators may consider a small victorious war with a presumably weaker neighbor as the means to restoring popular support through rallying around their flag. TTW may provide an appealing arena for such an undertaking, especially in resource-rich and disputed areas.
Particularly, when one neighboring country is dominant, even if there is an established formal cooperation structure, e.g., a bilateral commission or a committee for sharing resources, it may turn into an arena of domination rather than cooperation, like in several cases of sharing water resources at the river catchment area level. Several case studies from the Middle East, where water resources are particularly scarce and shared by several countries, show how this cooperation may turn into domination and “bullying” by the much stronger partner, becoming a potential cause of conflict [69,70,71]. In the case of TTW areas, fish resources and reserves of hydrocarbons are the most apparent causes for domination and tensions in the world.
On the other hand, TTW areas, which typically comprise a maze of water bodies, wetlands, river branches, and oxbow lakes, are ideal places for local grassroots cross-border collaboration, usually in the form of smuggling. As our ethnographic studies and interviews from the early 1990s with the oldest local inhabitants of the Nemunas River Delta and Curonian Lagoon shores revealed, they eagerly engaged in the smuggling of goods across the newly established border between the newly independent Republic of Lithuania and Germany in the pre-WW II period, between 1923 and 1939, for rounding their income [72]. Sporadic evidence hints that this is still the case in many TTW areas with porous borders worldwide.
5. Conclusions
The main conclusion of our investigation is that risks of confrontation are closely correlated with the level of corruption in a more bellicose country. As our results show, whether or not a TTW serves as an arena for cross-border cooperation or confrontation depends on a plethora of critical factors, first of all, on the goodwill of both (or all) the countries sharing it. Admittedly, it is hard to unequivocally judge if cross-border tensions inevitably lead to confrontation. However, the rapid deterioration of the cross-border cooperation in the Curonian Lagoon area shows that good neighborhood prospects with a corrupt, authoritarian, and bellicose neighbor should not be taken for granted.
Therefore, it is difficult to draw any firm conclusion about under what conditions these confrontation risks can be avoided. Our long-term experience of the cross-border cooperation with the Russian Federation in the Curonian and Vistula lagoons has taught us that only firmly rooted democratic institutions on both sides of a border at the local, regional, and national levels, which cherish bottom-up democratic decision making and respect the rule of law, can reduce these confrontation risks in the long run. Open visa-free exchange across borders, joint transboundary ventures, or ad hoc collaboration platforms such as joint commissions or forums cannot sufficiently moderate or mediate these confrontation risks.
The study’s main objective was to elicit the essential features and indicators for gauging the cross-border cooperation and risks of confrontation in and around TTW, particularly regarding the international aspiration to reach the UN SDGs by 2030. The investigation enabled us to develop and test a comprehensive CCI, which covered the essential facets of this complex issue. However, further research is necessary for validating and fine-tuning the indicators comprising the Index on a more extensive and diverse sample of TTW.
Author Contributions
Conceptualization, R.P. and A.R.-B.; methodology, R.P.; software, A.R.-B.; validation, R.P. and A.R.-B.; formal analysis, R.P.; investigation, R.P. and A.R.-B.; resources, R.P.; data curation, R.P.; writing—original draft preparation, R.P.; writing—review and editing, A.R.-B.; visualization, R.P.; supervision, A.R.-B.; project administration, R.P. All authors have read and agreed to the published version of the manuscript.
Funding
This research received no external funding.
Institutional Review Board Statement
The study did not require ethical approval.
Informed Consent Statement
Not applicable.
Data Availability Statement
Not applicable.
Acknowledgments
We appreciate the insightful comments and suggestions from the anonymous reviewers that helped improve the quality and presentation of the manuscript substantially.
Conflicts of Interest
The authors declare no conflict of interest.
Appendix A

Table A1.
TTW areas of the world listed for each continent in the alphabetical order.
| No. | TTW | Countries Sharing TTW | UNSD Region | WWF Marine Ecoregion |
|---|---|---|---|---|
| Africa | ||||
| 1. | Akpa Yafe Estuary | Cameroon, Nigeria | Middle Africa/West Africa | Gulf of Guinea Central |
| 2. | Allahein Estuary | The Gambia, Senegal | West Africa | Sahelian Upwelling |
| 3. | Benzú Bay | Morocco, Spain | North Africa | Alboran Sea |
| 4. | Bujejete Estuary | Guinea Bissau, Senegal | West Africa | Sahelian Upwelling |
| 5. | Cavally Estuary | Ivory Coast, Liberia | West Africa | Gulf of Guinea West |
| 6. | Congo Estuary | Angola, Congo DR | Middle Africa | Angolan |
| 7. | Jinnak/Sina-Niji Delta and Estuary | The Gambia, Senegal | West Africa | Sahelian Upwelling |
| 8. | Juen Lagoon | Ghana, Ivory Coast | West Africa | Gulf of Guinea Upwelling |
| 9. | Katchek Estuary | Guinea, Guinea Bissau | West Africa | Gulf of Guinea West |
| 10. | Kis Oued (Wadi) | Morocco, Algeria | North Africa | Alboran Sea |
| 11. | Kunene Estuary | Namibia, Angola | South Africa/Middle Africa | Namib |
| 12. | Loema Lagoon | Congo, Angola | Middle Africa | Gulf of Guinea South |
| 13. | Loyada Bight | Djibouti, Somalia | East Africa | Gulf of Aden |
| 14. | Mano Estuary | Liberia, Sierra Leone | West Africa | Gulf of Guinea West |
| 15. | Melilla Harbour | Morocco, Spain | North Africa | Alboran Sea |
| 16. | Muni Estuary | Gabon, Equatorial Guinea | Middle Africa | Gulf of Guinea Central |
| 17. | Ntem (Campo) Estuary | Equatorial Guinea, Cameroon | Middle Africa | Gulf of Guinea Central |
| 18. | Orange Estuary | South Africa, Namibia | South Africa | Namaqua |
| 19. | Ruvuma Estuary | Tanzania, Mozambique | East Africa | East African coral coast |
| 20. | Senegal Estuary | Senegal, Mauritania | West Africa | Sahelian Upwelling |
| 21. | Vanga Bay | Kenya, Tanzania | East Africa | East African coral coast |
| Asia | ||||
| 22. | Abd Allah & Būbiyān Khawr | Kuwait, Iraq | West Asia | Persian (Arabian) Gulf |
| 23. | al Adaid Khawr | Saudi Arabia, Qatar | West Asia | Persian (Arabian) Gulf |
| 24. | Aqaba/Eilat Gulf | Egypt, Israel, Jordan, Saudi Arabia | West Asia | Northern and Central Red Sea |
| 25. | Astara Estuary | Azerbaijan, Iran | West Asia/South Asia | Caspian Sea |
| 26. | Bahrain Gulf | Saudi Arabia, Qatar, Bahrain | West Asia | Persian (Arabian) Gulf |
| 27. | Beilun/Ka Long Delta | Vietnam, China | Southeast Asia/East Asia | Gulf of Tonkin |
| 28. | Brunei Bay | Brunei, Malaysia | Southeast Asia | Palawan/North Borneo |
| 29. | Duweihin Khawr | Saudi Arabia, UAE | West Asia | Persian (Arabian) Gulf |
| 30. | Golok/Bang Nara Estuary | Malaysia, Thailand | Southeast Asia | Sunda Shelf/Java Sea |
| 31. | Gwadar/Jiwani Bay | Iran, Pakistan | South Asia | Gulf of Oman |
| 32. | Han Estuary | North Korea, South Korea | East Asia | Yellow Sea |
| 33. | Hari(a)bhanga Estuary | India, Bangladesh | South Asia | Northern Bay of Bengal |
| 34. | Johor Strait | Malaysia, Singapore | Southeast Asia | Malacca Strait |
| 35. | Kep Bay | Cambodia, Vietnam | Southeast Asia | Gulf of Thailand |
| 36. | Kutch Rann | Pakistan, India | South Asia | Western India |
| 37. | Kyan/Kra Buri Estuary | Myanmar, Thailand | Southeast Asia | Andaman Sea Coral Coast |
| 38. | Masin Bight | Indonesia, East Timor | Southeast Asia | Lesser Sunda |
| 39. | Matsu Bay | China, Taiwan | East Asia | East China Sea |
| 40. | Mota Bight | Indonesia, East Timor | Southeast Asia | Lesser Sunda |
| 41. | Naaf Estuary | Bangladesh, Myanmar | Southeast Asia | Northern Bay of Bengal |
| 42. | Nahr el Kabir Estuary | Syria, Lebanon | West Asia | Levantine Sea |
| 43. | Northeast Strait of Malacca | Malaysia, Thailand | Southeast Asia | Andaman Sea Coral Coast |
| 44. | Sebuku Bay | Indonesia, Malaysia | Southeast Asia | Palawan/North Borneo |
| 45. | Shatt-al-Arab/Arvan Rud Estuary | Iraq, Iran | West Asia/South Asia | Persian (Arabian) Gulf |
| 46. | Tumen Estuary | North Korea, Russia | East Asia | Sea of Japan |
| 47. | Xiamen (Amoy) Bay | China, Taiwan | East Asia | Southern China |
| 48. | Yalu Estuary | China, North Korea | East Asia | Yellow Sea |
| Europe | ||||
| 49. | Bidasoa Estuary | Spain, France | South Europe/West Europe | South European Atlantic Shelf |
| 50. | Bojana/Buna Delta | Albania, Montenegro | South Europe | Adriatic Sea |
| 51. | Carlingford Lough | Ireland, UK | North Europe | Celtic Seas |
| 52. | Curonian Lagoon | Russia, Lithuania | East Europe/North Europe | Baltic Sea |
| 53. | Danube Delta | Ukraine, Romania | East Europe | Black Sea |
| 54. | Evros/ Meriç Delta | Turkey, Greece | West Asia/South Europe | Aegean Sea |
| 55. | Foyle Lough | Ireland, UK | North Europe | Celtic Seas |
| 56. | Ftelia Bight | Albania, Greece | South Europe | Ionian Sea |
| 57. | Gibraltar/Algeciras | Spain, UK | South Europe | Alboran Sea |
| 58. | Guadiana Estuary | Spain, Portugal | South Europe | South European Atlantic Shelf |
| 59. | Idde Fjord & Svinesund | Sweden, Norway | North Europe | North Sea |
| 60. | Jakobselv/Voryema | Russia, Norway | East Europe/North Europe | Northern Norway and Finnmark |
| 61. | Kigach Estuary | Kazakhstan, Russia | East Europe/Central Asia | Caspian Sea |
| 62. | Kotor (Outer) Bay | Montenegro, Croatia | South Europe | Adriatic Sea |
| 63. | Mali Ston Bay & Strait | Bosnia and Herzegovina, Croatia | South Europe | Adriatic Sea |
| 64. | Minho/ Miño Estuary | Spain, Portugal | South Europe | South European Atlantic Shelf |
| 65. | Narva Estuary | Russia, Estonia | East Europe/North Europe | Baltic Sea |
| 66. | Oder/Odra Lagoon | Germany, Poland | West Europe/East Europe | Baltic Sea |
| 67. | Piran Bay | Croatia, Slovenia | South Europe | Adriatic Sea |
| 68. | Psou River mouth | Georgia, Russia | East Europe/West Asia | Black Sea |
| 69. | Rezovo/Mutludere | Bulgaria, Turkey | East Europe/West Asia | Black Sea |
| 70. | San Bartolomeo Bay | Slovenia, Italy | South Europe | Adriatic Sea |
| 71. | Scheldt Estuary | Belgium, The Netherlands | West Europe | North Sea |
| 72. | Southern Belt Sea | Germany, Denmark | West Europe/North Europe | Baltic Sea |
| 73. | The Sound | Sweden, Denmark | North Europe | Baltic Sea |
| 74. | The Zwin | Belgium, The Netherlands | West Europe | North Sea |
| 75. | Tornio/Torne Delta | Finland, Sweden | North Europe | Baltic Sea |
| 76. | Virolahti Bight | Russia, Finland | East Europe/North Europe | Baltic Sea |
| 77. | Vistula Lagoon | Poland, Russia | East Europe | Baltic Sea |
| 78. | Wadden Sea | The Netherlands, Germany | West Europe | North Sea |
| 79. | Wadden Sea | Germany, Denmark | West Europe/North Europe | North Sea |
| North and Central America and the Caribbean | ||||
| 80. | Amatique Bay | Belize, Guatemala | Centr. America | Western Caribbean |
| 81. | Chetumal Bay | Mexico, Belize | Centr. America | Western Caribbean |
| 82. | Coco Estuary | Honduras, Nicaragua | Centr. America | Southwest. Caribbean |
| 83. | Dajabón Estuary | Haiti, Dominican Republic | Caribbean | Greater Antilles |
| 84. | Fonseca Gulf | El Salvador, Nicaragua, Honduras | Centr. America | Chiapas-Nicaragua |
| 85. | Fortune Bay | Canada, France | North America | Gulf of St. Lawrence |
| 86. | Los Portillos Lagoon | Nicaragua, Costa Rica | Centr. America | Southwest. Caribbean |
| 87. | Motagua Estuary | Guatemala, Honduras | Centr. America | Western Caribbean |
| 88. | Oyster Bay, St. Martin Island | The Netherlands, France | Caribbean | Eastern Caribbean |
| 89. | Paz Estuary | El Salvador, Guatemala | Centr. America | Chiapas-Nicaragua |
| 90. | Pedernales Estuary | Haiti, Dominican Republic | Caribbean | Greater Antilles |
| 91. | Portland Canal | US, Canada | North America | North American Pacific Fjordland |
| 92. | Quoddy Bay, St. Croix | US, Canada | North America | Gulf of Maine/Bay of Fundy |
| 93. | Rio Grande Estuary, Laguna Madre | US, Mexico | North America/Centr. America | Northern Gulf of Mexico |
| 94. | Salish Sea | US, Canada | North America | Puget Trough/Georgia Basin |
| 95. | Simpson Bay, St Martin Island | The Netherlands, France | Caribbean | Eastern Caribbean |
| 96. | Sixaola Estuary | Costa Rica, Panama | Centr. America | Southwestern Caribbean |
| 97. | Suchiate Estuary | Guatemala, Mexico | Centr. America | Chiapas-Nicaragua |
| South America | ||||
| 98. | Barima Delta | Venezuela, Guyana | South America | Guianan |
| 99. | Beagle Channel | Argentina, Chile | South America | Channels and Fjords of Southern Chile |
| 100. | Canal de Capones | Peru, Ecuador | South America | Guayaquil |
| 101. | Chuy Stream | Brazil, Uruguay | South America | Uruguay-Buenos Aires Shelf |
| 102. | Courantyne Estuary | Guyana, Surinam | South America | Guianan |
| 103. | La Plata Estuary | Uruguay, Argentina | South America | Rio de la Plata |
| 104. | Maroni Estuary | Surinam, French Guiana | South America | Guianan |
| 105. | Mataje Estuary | Ecuador, Colombia | South America | Panama Bight |
| 106. | Mirim/Merin Lagoon | Brazil, Uruguay | South America | Uruguay-Buenos Aires Shelf |
| 107. | Oyapock Bay | French Guiana, Brazil | South America | Amazonia |
| 108. | Paria Gulf | Trinidad and Tobago, Venezuela | Caribbean/South America | Southern Caribbean |
References
- European Commission. Directive 2000/60/EC of the European Parliament and of the Council of 23 October 2000 Establishing a Framework for Community Action in the Field of Water Policy. Off. J. Eur. Communities 2000, 43, 327. [Google Scholar]
- Elliott, M.; Day, J.W.; Ramachandran, R.; Wolanski, E. A synthesis: What is the future for coasts, estuaries, deltas and other transitional habitats in 2050 and beyond. In Coasts and Estuaries: The Future; Wolanski, E., Day, J.W., Elliott, M., Ramachandran, R., Eds.; Elsevier: Amsterdam, The Netherlands; Oxford, UK; Cambridge, MA, USA, 2019; pp. 1–28. [Google Scholar]
- Pérez-Ruzafa, A.; Pérez-Ruzafa, I.M.; Newton, A.; Marcos, C. Coastal lagoons: Environmental Variability, Ecosystem Complexity and Goods and Services Uniformity. In Coasts and Estuaries: The Future; Wolanski, E., Day, J.W., Elliott, M., Ramachandran, R., Eds.; Elsevier: Amsterdam, The Netherlands; Oxford, UK; Cambridge, MA, USA, 2019; pp. 253–276. [Google Scholar]
- Ferreira, T.; Globevnik, L.; Schinegger, R. Water Stressors in Europe: New Threats in the Old World. In Multiple Stressors in River Ecosystems: Status, Impacts and Prospects for the Future; Sabater, S., Elosegi, A., Ludwig, R., Eds.; Elsevier: Amsterdam, The Netherlands; Oxford, UK; Cambridge, MA, USA, 2019; pp. 139–155. [Google Scholar]
- Breber, P.; Povilanskas, R.; Armaitienė, A. Recent evolution of fishery and land reclamation in Curonian and Lesina lagoons. Hydrobiologia 2008, 611, 105–114. [Google Scholar] [CrossRef]
- Tagliapietra, D.; Volpi Ghirardini, A. Notes on coastal lagoon typology in the light of the EUWater Framework Directive: Italy as a case study. Aquat. Conserv. 2006, 16, 457–467. [Google Scholar] [CrossRef]
- Tilley, C. An Ethnography of the Neolithic: Early Prehistoric Societies in Southern Scandinavia; Cambridge University Press: Cambridge, UK, 2003; p. 388. [Google Scholar]
- Viaroli, P.; Mistri, M.; Troussellier, M.; Guerzoni, S.; Cardoso, A.C. Structure, functions and ecosystem alterations in Southern European coastal lagoons. Preface. Hydrobiologia 2005, 550, 7–9. [Google Scholar]
- Wilson, L.; Dickinson, P.; Jeandron, J. Reconstructing Human-Landscape Interactions; Cambridge Scholars Publishing: Cambridge, UK, 2009; p. 291. [Google Scholar]
- Tagliapietra, D.; Povilanskas, R.; Razinkovas-Baziukas, A.; Taminskas, J. Emerald Growth: A New Framework Concept for Managing Ecological Quality and Ecosystem Services of Transitional Waters. Water 2020, 12, 894. [Google Scholar] [CrossRef] [Green Version]
- Bildirici, M.E.; Lousada, S.; Yılmaz Genç, S. Terrorism, Freshwater, and Environmental Pollution: Evidence of Afghanistan, Burkina Faso, Iraq, Arab Republic of Egypt, Cameroon, Mali, Mozambique, Niger, Nigeria, Somalia, Syrian Arab Republic, and Pakistan. Water 2022, 14, 2684. [Google Scholar] [CrossRef]
- Hussein, H. Russia is weaponizing water in its invasion of Ukraine. Nature 2022, 603, 793. [Google Scholar] [CrossRef]
- Wittner, L.S. The war in Ukraine underscores the need to strengthen the international security system. Peace Change 2022, 47, 265–268. [Google Scholar] [CrossRef]
- Rogstad, A. When Stigmatization Fails: Russia and Aggression in Ukraine. J. Glob. Secur. Stud. 2022, 7, ogac025. [Google Scholar] [CrossRef]
- Boon, P.J.; Clarke, S.A.; Copp, G.H. Alien species and the EU Water Framework Directive: A comparative assessment of European approaches. Biol. Invasions 2020, 22, 1497–1512. [Google Scholar] [CrossRef] [Green Version]
- Malcangio, D.; Manella, N.; Ungaro, N. Environmental quality characteristics of the Apulian transitional waters. Case study: Lagoons of Lesina and Varano (Italy). Aquat. Ecosyst. Health Manag. 2020, 23, 427–435. [Google Scholar] [CrossRef]
- Mangoni, O.; Bolinesi, F.; Saggiomo, V.; Saggiomo, M. Photosynthetic rate and size structure of the phytoplankton community in transitional waters of the Northern Adriatic Sea. Ecol. Quest. 2020, 31, 11–20. [Google Scholar] [CrossRef]
- Monticelli, L.S.; Decembrini, F.; Bergamasco, A.; Caruso, G. Water quality assessment of transitional and coastal marine Sicilian waters (Italy): Ecological and epidemiological significance of multiple antimicrobial resistant Enterococcus spp. Estuar. Coast. Shelf Sci. 2019, 217, 173–184. [Google Scholar] [CrossRef]
- Botsou, F.; Karageorgis, A.P.; Paraskevopoulou, V.; Dassenakis, M.; Scoullos, M. Critical processes of trace metals mobility in transitional waters: Implications from the remote, Antinioti Lagoon, Corfu Island, Greece. J. Mar. Sci. Eng. 2019, 7, 307. [Google Scholar] [CrossRef] [Green Version]
- Tzempelikou, E.; Zeri, C.; Iliakis, S.; Paraskevopoulou, V. Cd, Co, Cu, Ni, Pb, Zn in coastal and transitional waters of Greece and assessment of background concentrations: Results from 6 years implementation of the Water Framework Directive. Sci. Total Environ. 2021, 774, 145177. [Google Scholar] [CrossRef]
- Zoulias, T.; Papadopoulos, A.; Conides, A. An ecological evaluation using fisheries landings time-series data: A case study of two coastal lagoons in the Ionian sea (E. Mediterranean, Greece). Estuar. Coast. Shelf Sci. 2019, 216, 229–239. [Google Scholar] [CrossRef]
- Belando, M.D.; Martínez, P.M.; Aboal, M. Interactive effects of warming and eutrophication on population dynamics and stalk production of epiphytic diatoms in transitional waters. Estuar. Coast. Shelf Sci. 2019, 229, 106413. [Google Scholar] [CrossRef]
- García del Toro, E.M.; Mateo, L.F.; García-Salgado, S.; Más-López, M.I.; Quijano, M.Á. Use of Artificial Neural Networks as a Predictive Tool of Dissolved Oxygen Present in Surface Water Discharged in the Coastal Lagoon of the Mar Menor (Murcia, Spain). Int. J. Environ. Res. Public Health 2022, 19, 4531. [Google Scholar] [CrossRef] [PubMed]
- Montes-Pérez, J.J.; Moreno-Ostos, E.; Marañón, E.; Blanco, J.M.; Rodríguez, V.; Rodríguez, J. Intermediate-size cell dominance in the phytoplankton community of an eutrophic, estuarine ecosystem (Guadalhorce River, Southern Spain). Hydrobiologia 2020, 847, 2241–2254. [Google Scholar] [CrossRef]
- Grinienė, E.; Lesutienė, J.; Gorokhova, E.; Zemlys, P.; Gasiūnaitė, Z.R. Lack of ciliate community integrity in transitional waters: A case study from the Baltic Sea. Estuar. Coast. Shelf Sci. 2019, 226, 106259. [Google Scholar] [CrossRef]
- O’Brien, P.A.; Polovodova Asteman, I.; Bouchet, V.M. Benthic foraminiferal indices and environmental quality assessment of transitional waters: A review of current challenges and future research perspectives. Water 2021, 13, 1898. [Google Scholar] [CrossRef]
- Salas Herrero, F.; Teixeira, H.; Poikane, S. A novel approach for deriving nutrient criteria to support good ecological status: Application to coastal and transitional waters and indications for use. Front. Mar. Sci. 2019, 6, 255. [Google Scholar] [CrossRef] [Green Version]
- Cavraro, F.; Bettoso, N.; Zucchetta, M.; D’Aietti, A.; Faresi, L.; Franzoi, P. Body condition in fish as a tool to detect the effects of anthropogenic pressures in transitional waters. Aquat. Ecol. 2019, 53, 21–35. [Google Scholar] [CrossRef]
- Facca, C. Ecological Status Assessment of Transitional Waters. Water 2020, 12, 3159. [Google Scholar] [CrossRef]
- Souza, G.B.G.; Vianna, M. Fish-based indices for assessing ecological quality and biotic integrity in transitional waters: A systematic review. Ecol. Indic. 2020, 109, 105665. [Google Scholar] [CrossRef]
- Bernardi Aubry, F.; Acri, F.; Scarpa, G.M.; Braga, F. Phytoplankton–Macrophyte Interaction in the Lagoon of Venice (Northern Adriatic Sea, Italy). Water 2020, 12, 2810. [Google Scholar] [CrossRef]
- Bonometto, A.; Ponis, E.; Cacciatore, F.; Riccardi, E.; Pigozzi, S.; Parati, P.; Novello, M.; Ungaro, N.; Acquavita, A.; Manconi, P.; et al. A New Multi-Index Method for the Eutrophication Assessment in Transitional Waters: Large-Scale Implementation in Italian Lagoons. Environments 2022, 9, 41. [Google Scholar] [CrossRef]
- Semprucci, F.; Facca, C.; Ferrigno, F.; Balsamo, M.; Sfriso, A.; Sandulli, R. Biotic and abiotic factors affecting seasonal and spatial distribution of meiofauna and macrophytobenthos in transitional coastal waters. Estuar. Coast. Shelf Sci. 2019, 219, 328–340. [Google Scholar] [CrossRef]
- Schroeder, A.; Stanković, D.; Pallavicini, A.; Gionechetti, F.; Pansera, M.; Camatti, E. DNA metabarcoding and morphological analysis—Assessment of zooplankton biodiversity in transitional waters. Mar. Environ. Res. 2020, 160, 104946. [Google Scholar] [CrossRef] [PubMed]
- Semprucci, F.; Gravina, M.F.; Magni, P. Meiofaunal dynamics and heterogeneity along salinity and trophic gradients in a Mediterranean transitional system. Water 2019, 11, 1488. [Google Scholar] [CrossRef] [Green Version]
- Pitacco, V.; Mistri, M.; Aleffi, I.F.; Lardicci, C.; Prato, S.; Tagliapietra, D.; Munari, C. Spatial patterns of macrobenthic alpha and beta diversity at different scales in Italian transitional waters (central Mediterranean). Estuar. Coast. Shelf Sci. 2019, 222, 126–138. [Google Scholar] [CrossRef]
- Mancinelli, G.; Bardelli, R.; Zenetos, A. A global occurrence database of the Atlantic blue crab Callinectes sapidus. Sci. Data 2021, 8, 1–10. [Google Scholar] [CrossRef] [PubMed]
- Manfrin, C.; Souty-Grosset, C.; Anastácio, P.; Reynolds, J.; Giulianini, P.G. The apparently relentless spread of the major decapod alien species in the Mediterranean basin and European inland waters. In Histories of Bioinvasions in the Mediterranean; Queiroz, A.I., Pooley, S., Eds.; Springer: Cham, Switzerland, 2018; pp. 51–86. [Google Scholar]
- Pansera, M.; Camatti, E.; Schroeder, A.; Zagami, G.; Bergamasco, A. The non-indigenous Oithona davisae in a Mediterranean transitional environment: Coexistence patterns with competing species. Sci. Rep. 2021, 11, 1–14. [Google Scholar] [CrossRef]
- Dodd, J.A.; Copp, G.H.; Tidbury, H.J.; Leuven, R.S.; Feunteun, E.; Olsson, K.H.; Gollasch, S.; Jelmert, A.; O’Shaughnessy, K.A.; Reeves, D.; et al. Invasiveness risks of naked goby, Gobiosoma bosc, to North Sea transitional waters. Mar. Pollut. Bull. 2022, 181, 113763. [Google Scholar] [CrossRef]
- Facca, C.; Cavraro, F.; Franzoi, P.; Malavasi, S. Lagoon resident fish species of conservation interest according to the habitat directive (92/43/CEE): A review on their potential use as ecological indicator species. Water 2020, 12, 2059. [Google Scholar] [CrossRef]
- Koletić, N.; Alegro, A.; Rimac, A.; Vuković, N.; Šegota, V.; Vilović, T. Environmental preferences of Polysiphonia subtilissima (Ceramiales, Rhodophyta) in transitional, oligohaline and fresh waters of the East Adriatic coast. Nova Hedwig. 2020, 111, 39–58. [Google Scholar] [CrossRef]
- Orlando-Bonaca, M.; Lipej, L.; Bonanno, G. Non-indigenous macrophytes in Adriatic ports and transitional waters: Trends, taxonomy, introduction vectors, pathways and management. Mar. Pollut. Bull. 2019, 145, 656–672. [Google Scholar] [CrossRef]
- Orlando-Bonaca, M.; Lipej, L.; Bonanno, G. Non-indigenous macrophytes in Central Mediterranean ports, marinas and transitional waters: Origin, vectors and pathways of dispersal. Mar. Pollut. Bull. 2021, 162, 111916. [Google Scholar] [CrossRef]
- Marcos, C.; Gamito, S.; Umgiesser, G.; Pérez-Ruzafa, A. Vindicating the biological and socioeconomic importance of coastal lagoons and transitional waters. Estuar. Coast. Shelf Sci. 2019, 216, 1–3. [Google Scholar] [CrossRef]
- Vieira, M.; Maciel, G.; Henriques, E.; Reis, L. A new proposal for an offshore wind foundation for transitional waters. Mar. Struct. 2019, 68, 102657. [Google Scholar] [CrossRef]
- Grizzetti, B.; Liquete, C.; Pistocchi, A.; Vigiak, O.; Zulian, G.; Bouraoui, F.; De Roo, A.; Cardoso, A.C. Relationship between ecological condition and ecosystem services in European rivers, lakes and coastal waters. Sci. Total Environ. 2019, 671, 452–465. [Google Scholar] [CrossRef]
- Lonsdale, J.A.; Leach, C.; Parsons, D.; Barkwith, A.; Manson, S.; Elliott, M. Managing estuaries under a changing climate: A case study of the Humber Estuary, UK. Environ. Sci. Policy 2022, 134, 75–84. [Google Scholar] [CrossRef]
- Manes, F.; Vizzini, S.; Buonocore, E.; Renzi, M.; Franzese, P.P. Pressures and impacts on structure, functioning and services in marine, terrestrial, and transitional ecosystems. Ecol. Quest. 2020, 31, 7–9. [Google Scholar]
- Clara, I.; Dyack, B.; Rolfe, J.; Newton, A.; Borg, D.; Povilanskas, R.; Brito, A.C. The Value of Coastal Lagoons: Case Study of Recreation at the Ria de Aveiro, Portugal in comparison to the Coorong, Australia. J. Nat. Conserv. 2018, 43, 190–200. [Google Scholar] [CrossRef]
- Lillebø, A.I.; Teixeira, H.; Morgado, M.; Martínez-López, J.; Marhubi, A.; Delacámara, G.; Strosser, P.; Nogueira, A.J. Ecosystem-based management planning across aquatic realms at the Ria de Aveiro Natura 2000 territory. Sci. Total Environ. 2019, 650, 1898–1912. [Google Scholar] [CrossRef]
- Rocha, C.P.; Cabral, H.N.; Marques, J.C.; Gonçalves, A.M. A Global Overview of Aquaculture Food Production with a Focus on the Activity’s Development in Transitional Systems—The Case Study of a South European Country (Portugal). J. Mar. Sci. Eng. 2022, 10, 417. [Google Scholar] [CrossRef]
- Baltranaitė, E.; Povilanskas, R.; Dučinskas, K.; Ernšteins, R.; Tõnisson, H. Systems Approach to Eastern Baltic Coastal Zone Management. Water 2020, 12, 3102. [Google Scholar] [CrossRef]
- Krechik, V.; Krek, A.; Bubnova, E.; Kapustina, M. Mixing zones within the complex transitional waters of the Baltic Sea Vistula Lagoon. Reg. Stud. Mar. Sci. 2020, 34, 101023. [Google Scholar] [CrossRef]
- Schernewski, G.; Baltranaitė, E.; Kataržytė, M.; Balčiūnas, A.; Čerkasova, N.; Mėžinė, J. Establishing new bathing sites at the Curonian Lagoon coast: An ecological-social-economic assessment. J. Coast. Conserv. 2019, 23, 899–911. [Google Scholar] [CrossRef] [Green Version]
- Friedland, R.; Schernewski, G.; Gräwe, U.; Greipsland, I.; Palazzo, D.; Pastuszak, M. Managing eutrophication in the Szczecin (Oder) lagoon-development, present state and future perspectives. Front. Mar. Sci. 2019, 5, 521. [Google Scholar] [CrossRef]
- Povilanskas, R.; Razinkovas-Baziukas, A.; Jurkus, E. Integrated environmental management of transboundary transitional waters: Curonian Lagoon case study. Ocean Coast. Manag. 2014, 101, 14–23. [Google Scholar] [CrossRef]
- Skoulikaris, C.; Zafirakou, A. River Basin Management Plans as a tool for sustainable transboundary river basins’ management. Environ. Sci. Pollut. Res. 2019, 26, 14835–14848. [Google Scholar] [CrossRef] [PubMed]
- Hussein, H.; Grandi, M. Contexts matter: A hydropolitical analysis of Blue Nile and Yarmouk River basins. Soc. Water Stud. Arab. Reg. 2015, 159, 159–176. [Google Scholar]
- Hussein, H.; Menga, F.; Greco, F. Monitoring transboundary water cooperation in SDG 6.5.2: How a critical hydropolitics approach can spot inequitable outcomes. Sustainability 2018, 10, 3640. [Google Scholar] [CrossRef] [Green Version]
- Liang, J.; Gong, J.; Li, W. Applications and impacts of Google Earth: A decadal review (2006–2016). ISPRS J. Photogramm. Remote Sens. 2018, 146, 91–107. [Google Scholar] [CrossRef]
- Uppink Calderwood, L.; Soshkin, M. Travel & Tourism Development Index 2021: Rebuilding for Sustainable and Resilient Future. Available online: https://www.weforum.org/reports/travel-and-tourism-development-index-2021 (accessed on 1 March 2022).
- World Development Forum Travel & Tourism Development Index 2021: Explore the Data. Available online: https://www.weforum.org/reports/travel-and-tourism-development-index-2021/explore-the-data (accessed on 1 March 2022).
- Jurkus, E.; Taminskas, J.; Povilanskas, R.; Kontautienė, V.; Baltranaitė, E.; Dailidė, R.; Urbis, A. Delivering tourism sustainability and competitiveness in seaside and marine resorts with GIS. J. Mar. Sci. Eng. 2021, 9, 312. [Google Scholar] [CrossRef]
- Joint Research Centre—European Commission. Handbook on Constructing Composite Indicators: Methodology and User Guide; OECD Publishing: Paris, France, 2008; 160p. [Google Scholar]
- Guriev, S.; Treisman, D. Spin Dictators: The Changing Face of Tyranny in the 21st Century; Princeton University Press: Princeton, NJ, USA; Oxford, UK, 2022; xi+360p. [Google Scholar]
- Carter, D.B.; Poast, P. Why do states build walls? Political economy, security, and border stability. J. Confl. Resolut. 2017, 61, 239–270. [Google Scholar] [CrossRef] [Green Version]
- Montreuil, A.-L.; Dan, S.; Verwaest, T. Monitoring the Morphodynamics of the Zwin Inlet: Interim Report: 1 Year after the Extension Works, version 2.0; FHR Reports, 16_089_1; Flanders Hydraulics Research: Antwerp, Belgium, 2021; pp. 19, 48. [Google Scholar]
- Zeitoun, M. Violations, Opportunities and Power along the Jordan River: Security Studies Theory Applied to Water Conflict. In Water Resources in the Middle East. Israel-Palestinian Water Issues—From Conflict to Cooperation; Shuval, H., Dweik, H., Eds.; Springer: Berlin/Heidelberg, Germany, 2007; pp. 213–223. [Google Scholar]
- Selby, J. Governance and Resistance in Palestine: Simulations, Confrontations, Sumoud. In Global Governance, Conflict and Resistance; Cochrane, F., Duffy, R., Selby, J., Eds.; Palgrave Macmillan: Basingtoke, UK; New York, NY, USA, 2003; pp. 118–134. [Google Scholar]
- Selby, J.; Daoust, G.; Hoffmann, C. Divided Environments: An International Political Ecology of Climate Change, Water and Security; Cambridge University Press: Cambridge, UK, 2022; 338p. [Google Scholar]
- Povilanskas, R.; Purvinas, M.; Urbis, A. Minija ir Karklė: Pamario Paveldo Kaimai ir jų Aplinka; EUCC Publishers: Klaipeda, Lithuania, 2002; 182p. [Google Scholar]
Figure 1.
Delimitation of the aquatic part of TTW: (A) La Plata Estuary (Atlantic Ocean, Argentina and Uruguay); and (B) Danube Delta (Black Sea, Romania and Ukraine). Satellite Terra Image Credit: MODIS Land Rapid Response Team, NASA GSFC.
Figure 1.
Delimitation of the aquatic part of TTW: (A) La Plata Estuary (Atlantic Ocean, Argentina and Uruguay); and (B) Danube Delta (Black Sea, Romania and Ukraine). Satellite Terra Image Credit: MODIS Land Rapid Response Team, NASA GSFC.

Figure 2.
Distribution of the world’s TTW according to the confrontation risk.

Figure 3.
Bifurcation of the Hondo River estuary at Chetumal Bay shared by Belize and Mexico causing border demarcation issues and a porous border (Image: Ramūnas Povilanskas).
Figure 3.
Bifurcation of the Hondo River estuary at Chetumal Bay shared by Belize and Mexico causing border demarcation issues and a porous border (Image: Ramūnas Povilanskas).

Figure 4.
Correlation between the confrontation risk index and the socioeconomic cohesion indicators: (A) Correlation with indicator 1.01. Relative difference in GDP per capita (PPP) between both parts of the area (the value of Pearson’s correlation coefficient R is: −0.2965); (B) Correlation with indicator 1.05. Corruption perception of a more corrupt country (R = −0.6642).

Figure 5.
Principal Component Analysis of the correlation between the confrontation risk index and the socioeconomic cohesion indicators. The numbered TTW are those with the higher contribution to the plane construction, their numbers referring to the TTW in Table A1: (A) individuals factor map of PCA with different colors signifying TTW in different continents; and (B) variables factor map of PCA for the selected four indicators.

Figure 6.
The Curonian Lagoon area (Baltic Sea, Lithuania, Russian Federation). Satellite Image Credit: © Terra Metrics, 2022, Maps GoogleTM.
Figure 6.
The Curonian Lagoon area (Baltic Sea, Lithuania, Russian Federation). Satellite Image Credit: © Terra Metrics, 2022, Maps GoogleTM.

Figure 7.
The Zwin (North Sea, Belgium, The Netherlands). Satellite Image Credit: © Terra Metrics, 2022, Maps GoogleTM.
Figure 7.
The Zwin (North Sea, Belgium, The Netherlands). Satellite Image Credit: © Terra Metrics, 2022, Maps GoogleTM.

Figure 8.
The Zwin (Belgium–the Netherlands) is a TTW area which is the benchmark of sound cross-border cooperation in TTW conservation and management (Image: Ramūnas Povilanskas).
Figure 8.
The Zwin (Belgium–the Netherlands) is a TTW area which is the benchmark of sound cross-border cooperation in TTW conservation and management (Image: Ramūnas Povilanskas).

Table 1.
Description of the 25 indicators of the five facets of the Index.
| Indicator Number | Indicator Title | Indicator Units | Range Used for Normalization | Guiding Principle | Description |
|---|---|---|---|---|---|
| |||||
| 1.01 | Relative difference in GDP per capita (PPP) between both parts of the area | % | 1/7 (equal) | Winsorization | Data on GDP per capita on the regional or national level depending on data availability |
| 1.02 | Relative difference in night time light intensity between both parts of the area | Scores | 1/7 (equal) | Range of relative values | Data on average night time light intensity in the riparian and littoral areas |
| 1.03 | Difference in road network density between both parts of the area | km/surface area | 1/7 (equal) | Winsorization | The road network includes highways, national, and secondary or regional roads |
| 1.04 | Difference in poverty rate between both parts of the area | % | 1/7 (equal) | Winsorization | Multidimensional poverty headcount ratio (% of population) |
| 1.05 | Corruption perception of a more corrupt neighbor | Scores | 13/88 | Natural min max | Data on the national-level corruption perceptions |
| |||||
| 2.01 | Difference in relative acreage of natural habitats between both parts of the area | % | 0/100 | Range of possible values | Data on forest and wetland acreage in the riparian and littoral areas |
| 2.02 | Difference in deforestation and wetland reclamation rates between both parts of the area | Scores | 0/10 | Range of possible values | Data on forest and wetland area changes in the last 25 years in the riparian and littoral areas |
| 2.03 | Difference in relative acreage of protected areas between both parts of the area | % | 0/100 | Range of possible values | Data on protected areas acreage in the riparian and littoral areas |
| 2.04 | Difference in the treatment rate of wastewater discharged between both parts of the area | % | 0/100 | Range of possible values | Data on the treatment rate of wastewater discharged in the riparian and littoral municipal or regional administrative entities |
| 2.05 | Difference in poaching rate of TW resources between both parts of the area | Scores | 1/7 (equal) | Range of relative values | Average score across the components of the available data from reports |
| |||||
| 3.01 | Strictness of the cross-border visa regime | Scores | 1/7 (visa-free) | Range of relative values | Data on the strictness of the visa regime between both countries |
| 3.02 | Quantity of border checkpoints and their regime | Scores | 1/7 (highest) | Range of relative values | Data on the quantity of border checkpoints and their regime |
| 3.03 | Intensity of regular cross-border passenger traffic | Scores | 1/7 (highest) | Range of relative values | Data on the intensity of regular cross-border passenger traffic |
| 3.04 | Number of annual border crossings | Persons | 0/200 | Winsorization | Data on annual border crossings adjusted to the diversity of TTW |
| 3.05 | Cross-border infrastructure (power grid, cables, pipelines, and water canals) | Scores | 1/7 (highest) | Range of relative values | Number of points within the area where technical infrastructure crosses the border |
| |||||
| 4.01 | Availability and viability of bilateral mechanisms | Scores | 1/7 (best) | Range of relative values | This indicator refers to any bilateral mechanisms for controlling the quantities of harvested resources |
| 4.02 | Availability and viability of cross-border cooperation agreements | Scores | 1/7 (best) | Range of relative values | This indicator gauges the number and viability of cross-border cooperation agreements |
| 4.03 | Availability and viability of a bilateral body functioning on routine basis | Scores | 1/7 (best) | Range of relative values | This indicator refers to the availability and viability of any bilateral body functioning |
| 4.04 | Availability and viability of NGO collaboration networks | Scores | 1/7 (best) | Range of relative values | This indicator gauges the number and viability of NGO collaboration networks |
| 4.05 | Availability and viability of mutually agreed platforms to resolve disputes | Scores | 1/7 (best) | Range of relative values | This indicator refers to the availability and viability of any platform to resolve disputes |
| |||||
| 5.01 | Presence and severity of territorial disputes between the countries sharing TTW | Scores | 1/5.9 (worst) | Range of relative values | Summing of relative score values reflecting territorial disputes and armed conflicts |
| 5.02 | Index of Despotism of a more despotic neighbor | Scores | 1.9/6.2 (worst) | Range of relative values | Calculated from the Index of Democracy |
| 5.03 | Index of Bellicosity of a more bellicose neighbor | Scores | 2.9/6.7 (worst) | Range of relative values | Calculated from the Global Peace Index |
| 5.04 | Value of human life in a more bellicose neighbor | Scores | 1/7 (worst) | Winsorization | Intentional homicide rate per 100,000 inhabitants of the country |
| 5.05 | Population ratio between a more bellicose and less bellicose neighbor | Scores | 1/7 (worst) | Winsorization | Shows the potential threat in terms of manpower from a more bellicose neighbor |
Table 2.
Pearson’s R2 of all investigated variables resulting from PCA analysis (the values in the cells indicate the correlation degree).
Table 2.
Pearson’s R2 of all investigated variables resulting from PCA analysis (the values in the cells indicate the correlation degree).
| Indicator Number | 1.01 | 1.02 | 1.03 | 1.04 | 1.05 | 2.01 | 2.02 | 2.03 | 2.04 | 2.05 | 3.01 | 3.02 | 3.03 | 3.04 | 3.05 | 4.01 | 4.02 | 4.03 | 4.04 | 4.05 | 5.01 | 5.02 | 5.03 | 5.04 | 5.05 |
|---|---|---|---|---|---|---|---|---|---|---|---|---|---|---|---|---|---|---|---|---|---|---|---|---|---|
| 1.01 | 1.00 | 0.01 | 0.02 | 0.12 | 0.10 | 0.00 | 0.00 | 0.00 | 0.14 | 0.13 | 0.29 | 0.09 | 0.06 | 0.06 | 0.08 | 0.11 | 0.06 | 0.02 | 0.01 | 0.03 | 0.03 | 0.13 | 0.08 | 0.00 | 0.00 |
| 1.02 | 0.01 | 1.00 | 0.22 | 0.00 | 0.00 | 0.00 | 0.01 | 0.00 | 0.04 | 0.00 | 0.02 | 0.00 | 0.02 | 0.00 | 0.00 | 0.00 | 0.00 | 0.00 | 0.01 | 0.00 | 0.00 | 0.01 | 0.00 | 0.00 | 0.02 |
| 1.03 | 0.02 | 0.22 | 1.00 | 0.02 | 0.00 | 0.04 | 0.07 | 0.01 | 0.09 | 0.03 | 0.08 | 0.01 | 0.03 | 0.02 | 0.01 | 0.03 | 0.06 | 0.05 | 0.03 | 0.04 | 0.01 | 0.06 | 0.04 | 0.00 | 0.06 |
| 1.04 | 0.12 | 0.00 | 0.02 | 1.00 | 0.24 | 0.02 | 0.00 | 0.01 | 0.01 | 0.09 | 0.06 | 0.07 | 0.06 | 0.12 | 0.13 | 0.11 | 0.07 | 0.07 | 0.04 | 0.06 | 0.00 | 0.15 | 0.05 | 0.13 | 0.00 |
| 1.05 | 0.10 | 0.00 | 0.00 | 0.24 | 1.00 | 0.00 | 0.00 | 0.01 | 0.10 | 0.14 | 0.31 | 0.47 | 0.40 | 0.48 | 0.46 | 0.51 | 0.53 | 0.62 | 0.45 | 0.56 | 0.02 | 0.64 | 0.42 | 0.22 | 0.00 |
| 2.01 | 0.00 | 0.00 | 0.04 | 0.02 | 0.00 | 1.00 | 0.00 | 0.00 | 0.04 | 0.00 | 0.01 | 0.02 | 0.00 | 0.00 | 0.02 | 0.00 | 0.01 | 0.00 | 0.01 | 0.02 | 0.03 | 0.00 | 0.00 | 0.05 | 0.00 |
| 2.02 | 0.00 | 0.01 | 0.07 | 0.00 | 0.00 | 0.00 | 1.00 | 0.00 | 0.00 | 0.01 | 0.02 | 0.00 | 0.00 | 0.00 | 0.00 | 0.01 | 0.02 | 0.01 | 0.00 | 0.01 | 0.02 | 0.01 | 0.02 | 0.03 | 0.00 |
| 2.03 | 0.00 | 0.00 | 0.01 | 0.01 | 0.01 | 0.00 | 0.00 | 1.00 | 0.02 | 0.05 | 0.01 | 0.01 | 0.00 | 0.02 | 0.01 | 0.00 | 0.01 | 0.00 | 0.00 | 0.00 | 0.01 | 0.00 | 0.03 | 0.01 | 0.02 |
| 2.04 | 0.14 | 0.04 | 0.09 | 0.01 | 0.10 | 0.04 | 0.00 | 0.02 | 1.00 | 0.35 | 0.27 | 0.07 | 0.06 | 0.03 | 0.05 | 0.03 | 0.05 | 0.08 | 0.02 | 0.05 | 0.04 | 0.06 | 0.10 | 0.00 | 0.01 |
| 2.05 | 0.13 | 0.00 | 0.03 | 0.09 | 0.14 | 0.00 | 0.01 | 0.05 | 0.35 | 1.00 | 0.17 | 0.03 | 0.03 | 0.11 | 0.07 | 0.06 | 0.07 | 0.07 | 0.06 | 0.08 | 0.03 | 0.09 | 0.10 | 0.00 | 0.00 |
| 3.01 | 0.29 | 0.02 | 0.08 | 0.06 | 0.31 | 0.01 | 0.02 | 0.01 | 0.27 | 0.17 | 1.00 | 0.25 | 0.19 | 0.13 | 0.21 | 0.27 | 0.26 | 0.24 | 0.15 | 0.20 | 0.08 | 0.41 | 0.38 | 0.00 | 0.00 |
| 3.02 | 0.09 | 0.00 | 0.01 | 0.07 | 0.47 | 0.02 | 0.00 | 0.01 | 0.07 | 0.03 | 0.25 | 1.00 | 0.57 | 0.65 | 0.66 | 0.31 | 0.21 | 0.26 | 0.15 | 0.23 | 0.00 | 0.33 | 0.27 | 0.15 | 0.00 |
| 3.03 | 0.06 | 0.02 | 0.03 | 0.06 | 0.40 | 0.00 | 0.00 | 0.00 | 0.06 | 0.03 | 0.19 | 0.57 | 1.00 | 0.52 | 0.55 | 0.33 | 0.30 | 0.36 | 0.18 | 0.21 | 0.00 | 0.31 | 0.16 | 0.08 | 0.00 |
| 3.04 | 0.06 | 0.00 | 0.02 | 0.12 | 0.48 | 0.00 | 0.00 | 0.02 | 0.03 | 0.11 | 0.13 | 0.65 | 0.52 | 1.00 | 0.55 | 0.25 | 0.30 | 0.29 | 0.20 | 0.30 | 0.01 | 0.29 | 0.18 | 0.13 | 0.00 |
| 3.05 | 0.08 | 0.00 | 0.01 | 0.13 | 0.46 | 0.02 | 0.00 | 0.01 | 0.05 | 0.07 | 0.21 | 0.66 | 0.55 | 0.55 | 1.00 | 0.36 | 0.21 | 0.29 | 0.19 | 0.23 | 0.00 | 0.30 | 0.15 | 0.15 | 0.00 |
| 4.01 | 0.11 | 0.00 | 0.03 | 0.11 | 0.51 | 0.00 | 0.01 | 0.00 | 0.03 | 0.06 | 0.27 | 0.31 | 0.33 | 0.25 | 0.36 | 1.00 | 0.58 | 0.61 | 0.38 | 0.38 | 0.07 | 0.46 | 0.19 | 0.07 | 0.00 |
| 4.02 | 0.06 | 0.00 | 0.06 | 0.07 | 0.53 | 0.01 | 0.02 | 0.01 | 0.05 | 0.07 | 0.26 | 0.21 | 0.30 | 0.30 | 0.21 | 0.58 | 1.00 | 0.64 | 0.48 | 0.54 | 0.07 | 0.43 | 0.20 | 0.04 | 0.00 |
| 4.03 | 0.02 | 0.00 | 0.05 | 0.07 | 0.62 | 0.00 | 0.01 | 0.00 | 0.08 | 0.07 | 0.24 | 0.26 | 0.36 | 0.29 | 0.29 | 0.61 | 0.64 | 1.00 | 0.64 | 0.66 | 0.05 | 0.44 | 0.21 | 0.08 | 0.00 |
| 4.04 | 0.01 | 0.01 | 0.03 | 0.04 | 0.45 | 0.01 | 0.00 | 0.00 | 0.02 | 0.06 | 0.15 | 0.15 | 0.18 | 0.20 | 0.19 | 0.38 | 0.48 | 0.64 | 1.00 | 0.64 | 0.01 | 0.40 | 0.16 | 0.01 | 0.02 |
| 4.05 | 0.03 | 0.00 | 0.04 | 0.06 | 0.56 | 0.02 | 0.01 | 0.00 | 0.05 | 0.08 | 0.20 | 0.23 | 0.21 | 0.30 | 0.23 | 0.38 | 0.54 | 0.66 | 0.64 | 1.00 | 0.02 | 0.34 | 0.25 | 0.11 | 0.01 |
| 5.01 | 0.03 | 0.00 | 0.01 | 0.00 | 0.02 | 0.03 | 0.02 | 0.01 | 0.04 | 0.03 | 0.08 | 0.00 | 0.00 | 0.01 | 0.00 | 0.07 | 0.07 | 0.05 | 0.01 | 0.02 | 1.00 | 0.02 | 0.01 | 0.04 | 0.01 |
| 5.02 | 0.13 | 0.01 | 0.06 | 0.15 | 0.64 | 0.00 | 0.01 | 0.00 | 0.06 | 0.09 | 0.41 | 0.33 | 0.31 | 0.29 | 0.30 | 0.46 | 0.43 | 0.44 | 0.40 | 0.34 | 0.02 | 1.00 | 0.39 | 0.05 | 0.00 |
| 5.03 | 0.08 | 0.00 | 0.04 | 0.05 | 0.42 | 0.00 | 0.02 | 0.03 | 0.10 | 0.10 | 0.38 | 0.27 | 0.16 | 0.18 | 0.15 | 0.19 | 0.20 | 0.21 | 0.16 | 0.25 | 0.01 | 0.39 | 1.00 | 0.08 | 0.04 |
| 5.04 | 0.00 | 0.00 | 0.00 | 0.13 | 0.22 | 0.05 | 0.03 | 0.01 | 0.00 | 0.00 | 0.00 | 0.15 | 0.08 | 0.13 | 0.15 | 0.07 | 0.04 | 0.08 | 0.01 | 0.11 | 0.04 | 0.05 | 0.08 | 1.00 | 0.01 |
| 5.05 | 0.00 | 0.02 | 0.06 | 0.00 | 0.00 | 0.00 | 0.00 | 0.02 | 0.01 | 0.00 | 0.00 | 0.00 | 0.00 | 0.00 | 0.00 | 0.00 | 0.00 | 0.00 | 0.02 | 0.01 | 0.01 | 0.00 | 0.04 | 0.01 | 1.00 |
Table 3.
TTW areas of the world under high confrontation risk.
| No. | Average Score | TTW | Countries Sharing TTW | Description |
|---|---|---|---|---|
| 1. | 5.5 | Psou River mouth | Georgia, Russia | Russia, a more bellicose and populous neighbor, recognizes and militarily protects the independence of a breakaway region of Abkhazia, internationally recognized as part of Georgia, resulting in a military conflict |
| 2. | 5.5 | Barima Delta | Venezuela, Guyana | Venezuela, a more corrupt, bellicose, and populous neighbor, notorious for its high homicide rate and endemic civic unrest, claims all of Guyana’s territory west of the Essequibo River |
| 3. | 5.3 | Paria Gulf | Trinidad and Tobago, Venezuela | Venezuela, a more corrupt, bellicose, and populous neighbor, notorious for its high homicide rate, shares a TTW rich in hydrocarbons |
| 4. | 5.3 | Akpa Yafe Estuary | Cameroon, Nigeria | Nigeria, a more corrupt, bellicose, and populous neighbor, notorious for its high homicide rate, shares the estuary in a region rich in hydrocarbons |
| 5. | 5.3 | Ntem (Campo) Estuary | Equatorial Guinea, Cameroon | Sovereignty dispute between two corrupt countries with authoritarian regimes over an island at the river mouth in a region rich in hydrocarbons |
| 6. | 5.2 | Narva Estuary | Russia, Estonia | Russia, a more corrupt, bellicose, and populous neighbor sharing the estuary, did not ratify the border treaty and demands better treatment for the Russian-speaking population in Estonia |
| 7. | 5.1 | Abd Allah & Būbiyān Khawr | Kuwait, Iraq | In 1990, Iraq invaded Kuwait, causing the Gulf War. Although the border was settled in 2004, political instability in Iraq makes the situation in the area rich in hydrocarbons precarious |
| 8. | 5.1 | Congo Estuary | Angola, DR Congo | Military involvement of the Angolan government in the civil war in the DRC in 1997 and 1998 made the situation in the area rich in hydrocarbons volatile |
Table 4.
Cross-border cooperation and confrontation index for the Curonian Lagoon and the Zwin.
| ||||||
| TTW | 1.01 | 1.02 | 1.03 | 1.04 | 1.05 | Avg. 1 |
| Curonian Lagoon | 3.5 | 2.2 | 7.0 | 6.5 | 2.7 | 4.4 |
| The Zwin | 4.8 | 7.0 | 7.0 | 6.9 | 5.6 | 6.3 |
| ||||||
| TTW | 2.01 | 2.02 | 2.03 | 2.04 | 2.05 | Avg. 2 |
| Curonian Lagoon | 3.6 | 6.5 | 3.2 | 3.0 | 5.4 | 4.3 |
| The Zwin | 7.0 | 7.0 | 7.0 | 7.0 | 7.0 | 7.0 |
| ||||||
| TTW | 3.01 | 3.02 | 3.03 | 3.04 | 3.05 | Avg. 3 |
| Curonian Lagoon | 2.0 | 1.5 | 1.0 | 1.4 | 4.5 | 2.1 |
| The Zwin | 7.0 | 7.0 | 7.0 | 7.0 | 7.0 | 7.0 |
| ||||||
| TTW | 4.01 | 4.02 | 4.03 | 4.04 | 4.05 | Avg. 4 |
| Curonian Lagoon | 5.4 | 3.4 | 2.4 | 1.2 | 1.3 | 2.7 |
| The Zwin | 7.0 | 7.0 | 7.0 | 7.0 | 7.0 | 7.0 |
| ||||||
| TTW | 5.01 | 5.02 | 5.03 | 5.04 | 5.05 | Avg. 5 |
| Curonian Lagoon | 1.0 | 5.7 | 6.6 | 2.4 | 6.7 | 4.5 |
| The Zwin | 1.0 | 2.7 | 3.1 | 1.3 | 1.7 | 2.0 |
Scores for facets 1 to 4: 1.1–2.0—virtually no cohesion, coherence, vonnectivity, or cooperation; 2.1–3.0—weak cohesion, coherence, connectivity, or cooperation; 3.1–4.0—mediocre cohesion, coherence, connectivity, or cooperation; 4.1–5.0—quite close cohesion, coherence, connectivity, or cooperation; 5.1–6.0—close cohesion, coherence, connectivity, or cooperation; and 6.1–7.0—very close cohesion, coherence, connectivity, or cooperation. Scores for facet 5: 1.0–2.0—no confrontation risk; 2.1–3.0—low confrontation risk; 3.1–4.0—medium confrontation risk; 4.1–5.0—significant confrontation risk; 5.1–6.0—high confrontation risk; 6.1–7.0—very high confrontation risk.
Disclaimer/Publisher’s Note: The statements, opinions and data contained in all publications are solely those of the individual author(s) and contributor(s) and not of MDPI and/or the editor(s). MDPI and/or the editor(s) disclaim responsibility for any injury to people or property resulting from any ideas, methods, instructions or products referred to in the content. |
© 2023 by the authors. Licensee MDPI, Basel, Switzerland. This article is an open access article distributed under the terms and conditions of the Creative Commons Attribution (CC BY) license (https://creativecommons.org/licenses/by/4.0/).
Share and Cite
MDPI and ACS Style
Povilanskas, R.; Razinkovas-Baziukas, A. Transboundary Transitional Waters: Arenas for Cross-Border Cooperation or Confrontation? Sustainability 2023, 15, 9922. https://doi.org/10.3390/su15139922
AMA Style
Povilanskas R, Razinkovas-Baziukas A. Transboundary Transitional Waters: Arenas for Cross-Border Cooperation or Confrontation? Sustainability. 2023; 15(13):9922. https://doi.org/10.3390/su15139922
Chicago/Turabian StylePovilanskas, Ramūnas, and Artūras Razinkovas-Baziukas. 2023. "Transboundary Transitional Waters: Arenas for Cross-Border Cooperation or Confrontation?" Sustainability 15, no. 13: 9922. https://doi.org/10.3390/su15139922
Note that from the first issue of 2016, this journal uses article numbers instead of page numbers. See further details here.