Article

Tripartite Evolutionary Game of Power Generation Enterprises’ Green Transformation under the Responsibility Assessment of Renewable Energy Consumption in China

School of Economics and Management, Wuhan University, Wuhan 430072, China
*
Author to whom correspondence should be addressed.
Sustainability 2023, 15(13), 10512; https://doi.org/10.3390/su151310512
Submission received: 19 May 2023 / Revised: 18 June 2023 / Accepted: 27 June 2023 / Published: 4 July 2023

Abstract

:
Under the requirements of a low carbon economy, promoting the transition of energy consumption of power generation enterprises from fossil energy to renewable energy is essential in practicing carbon emission reduction. Taking China as an example, this study investigates the impact of the interactive behavior of central and local governments in fulfilling their green obligations on the green transformation of power generation enterprises by constructing a tripartite evolutionary game model. The main findings of this paper are as follows: (i) Under the trend of reducing subsidies for renewable electricity, if local governments fail to fulfill their regulatory obligations for renewable energy consumption on time, it will discourage power generation enterprises from using renewable electricity; in the short term, it will cause power generation enterprises to turn their backs on green power strategy and choose thermal power strategy. (ii) If the central government releases a strong signal of a considerable amount of renewable energy power subsidy, the local government’s enthusiasm for fulfilling the renewable energy consumption supervision obligations will be hurt. (iii) The practical implementation of the responsibility assessment system of renewable energy consumption requires mobilizing all relevant stakeholders in the renewable energy market. It is essential to motivate local governments to fulfill their renewable energy consumption regulation obligation. This study provides a policy analysis for the green transformation of Chinese power generation enterprises and a reference for the green transformation of enterprises in other developing countries.

1. Introduction

Global warming caused by massive greenhouse gas emissions has become the most critical environmental issue in the world. Activities related to energy production and consumption are the most important sources of CO2 emissions. In the face of global climate change, environmental degradation, and finite energy resources, it is imperative to transition towards renewable energy sources to replace traditional fossil fuels [1].
According to the International Energy Agency’s (IEA) CO2 Emissions in 2022 report, the most significant increase in emissions in 2022 came from the electricity and heat generation sector, where emissions increased by 1.8% or 261 million tonnes. The power sector is vital to reducing carbon emissions.
In response to these pressing issues, the Chinese government has implemented active fiscal policies to support the development of renewable energy and to encourage the transformation and optimization of the energy structure of power generation enterprises. These policies include subsidies, increased tariffs, tax incentives, and low-interest loans. China has established a comprehensive suite of financial subsidies to support the development of photovoltaic, wind, and biomass power generation projects.
According to the Ministry of Finance’s October 2020 notice, the total renewable energy tariff surcharge subsidies to be transferred from the central government to localities in 2021 is 5.954 billion yuan, representing a 4.91% increase from 2020. Among these subsidies, photovoltaic power generation projects received a substantial 3.384 billion yuan, a 56.83% increase from 2020.
In recent years, China’s financial subsidy policy has been a critical driving force for developing renewable energy, playing a crucial role in the early stages of the industry’s growth [2]. As the white paper “China’s Energy Development in a New Era” in 2020, China’s energy security system has been steadily improved, and its energy security capacity has significantly increased. The country has made rapid advancements in renewable energy development and utilization and now ranks first globally in cumulative installed capacity of wind, hydropower, and photovoltaic power generation. In just the first half of 2021, China’s renewable energy generation capacity reached 971 million kilowatts, with hydropower accounting for the most considerable portion of installed capacity at 38.93%.
However, as China’s renewable energy industry continues to proliferate, the country faces increasing government subsidy shortages and difficulties with renewable energy consumption. Renewable energy should reestablish its commodity characteristics [3], break reliance on financial subsidies, and allow the market to play a decisive role in resource allocation. The government has implemented a mechanism for accommodating renewable energy power and established a green power certificate trading system. This set of mechanisms links renewable energy’s production and consumption segments, fostering more vital interaction between electricity producers and consumers. It will encourage all members of society to actively participate in developing high-quality renewable energy and promote a fair distribution of the environmental benefits of renewable energy power among all market players. This paper examines the role of renewable energy policies on the green transformation of the energy mix of power generation companies in this institutional context.
Since the 21st century, Chinese and foreign scholars have researched the development mode of renewable energy and the transformation of energy structure. Some scholars introduced the idea of an energy revolution from the trend of world energy production and consumption [4]. They argue that the development and utilization of new energy sources has broken the original triad of oil, natural gas, and coal, thus entering a golden period. Mortimer and Grant conducted feasibility research on developing renewable energy sources in rural China. They analyzed and summarized the energy efficiency measures and methods to develop renewable energy sources [5]. Tsao constructed a scenario-based robust fuzzy optimization method to consider a financial subsidy policy for maintaining the continuity of renewable energy supply under the impact of significant hazard events such as COVID-19 [6]. Using econometric analysis, Yu et al. summarized the CO2 reduction experience of 29 OECD countries and argued that the energy mix transition pair is an essential driver for achieving CO2 reductions [7]. Numerous studies have shown that promoting renewable energy development has been a significant trend and is an important initiative to solve global climate problems and achieve national energy security [8].
Renewable energy has increasingly become a focal point for energy development in China and worldwide, with the government taking various measures to promote its development. Numerous studies have been conducted recently to assess policies’ effectiveness in enhancing renewable electricity development. The green power certificate trading system, linked to the renewable energy quota system, can help reduce CO2 emissions but may hinder economic growth. On the other hand, the financial subsidy system, which is associated with the feed-in tariff system, can effectively reduce CO2 emissions while offsetting the adverse effects of green electricity certificate trading on economic development [9]. Although renewable energy subsidy systems have many advantages, some scholars argue that they are not a long-term solution for promoting sustainable development in renewable electricity, particularly with the recent increase in renewable energy capacity [10,11,12]. Therefore, some scholars believe reducing financial subsidies for renewable energy and establishing a new and effective policy is necessary.
Renewable energy policy involves a wide range of electricity players, and game theory is a primary method for studying the interactions between economic players. Many scholars have used game theory to research renewable energy policies on electricity market players.
Wu and Xi constructed a game model in the electricity supply chain by starting from the game relationship between power generators and electricity consumers [13]. They studied the effects of three government policies: a quota system, a fixed premium subsidy system, and a dual system in parallel in the renewable energy electricity market. Xu et al. constructed the Stackelberg and cooperative game models in the context of the mechanism for accommodating power generated from renewable energy to analyze the competitive and cooperative strategies of thermal and green power enterprises. They found that power generation enterprises can achieve higher returns when they adopt cooperative strategies [14]. The above literature assumed that power generation firms are perfectly rational and focus on static equilibrium in the electricity market, which is inconsistent with the finite rational state of power generation firms in the real economy.
To overcome the shortcomings of traditional game theory in describing dynamic equilibrium, some scholars have also studied the evolutionary path of strategies under the assumption that actors have bounded rationality. Chai and Li studied the evolutionary path of strategies under the assumption that the actors are with bounded rationality [15]. They included government departments in the game model to reflect more intuitively the influence of government behavior on the energy mix transformation of power generation enterprises. Shao and Hu studied the influence of government financial subsidy policy on the energy mix transformation of power generation enterprises. Shao and Hu investigated the role of subsidy size and willingness to subsidize in guiding firms’ energy mix choices in the context of the game relationship between government financial subsidy policies and the behavior of power generation firms [16]. Their study showed that having more government subsidies is not better, and too many financial subsidies can breed inertia in the technological innovation of enterprises. The above studies focused on the dual role of government subsidies in promoting the development of clean energy and the cleaner use of traditional energy sources. They require more research on the evolution of government energy policies in light of the trend of government subsidies retreat.
Dong et al. constructed a game model among grid, government, and green electricity enterprises [17]. They found that the green electricity certificate trading system is conducive to the evolution of China’s renewable energy policy. The system helps a mechanism that accommodates power generated from renewable energy to replace the feed-in tariff system as the primary energy policy in China. Sun et al. investigated the effect of thermal power companies’ market power on government policies by modeling the evolutionary game between thermal power companies and the government [18]. However, their research focused on the effect of government regulation’s reward and punishment mechanism. It limits the effect of the green electricity certificate trading on the grid and green electricity enterprises.
Tao et al. focused on improving the motivation of green power certificate trading [19]. They found that a well-developed carbon emissions trading system can increase the incentive to purchase green electricity certificates. They constructed a green electricity certificate pricing model based on oligopolistic markets and found that the price of carbon influences the price of green electricity certificate trading. However, Tao et al. focused on the linkage between the carbon emissions trading market and green electricity certificate trading [19]. They weakened the role of government regulation on green electricity certificate trading.
Unlike previous studies, this study is based on the concept that environmental governance outcomes and green responsibilities are shared. Synthesizing the above studies, this paper explores the role of renewable energy policies on the transition of the energy mix of power generators. This paper highlights the green responsibilities of local governments and electricity consumers, which everyone has long neglected.
This study extends the literature in the following ways:
(i)
Examination of the role of two levels of government behavior in the evolution of energy policy from a renewable energy subsidy policy to the responsibility assessment of renewable energy consumption. Under the dual role of the financial pressure of renewable electricity subsidies and the pressure to achieve the carbon target, it is urgent to establish a policy system that can sustainably promote the green transformation of power generation enterprises. Therefore, establishing a game model based on the current context of renewable energy policy evolution in China is of great practical significance.
(ii)
The central and local governments are added to the model as different green responsibility subjects. It highlights the role of local governments in the green transformation of power generation enterprises. Although research on renewable energy policies is booming, there needs to be more research exploring the interaction between two levels of government on the energy structure transformation of power generation enterprises under the decentralization perspective.
(iii)
This paper examines China’s renewable energy policy and how it promotes fair sharing of green responsibility. It analyzes the responsibility assessment of renewable energy consumption to ensure equitable distribution of responsibilities between the central government, local government, and power generation companies. Additionally, it explores how green electricity certificate trading promotes the fair sharing of responsibilities between electricity consumers and producers. Green responsibility sharing reflects a collective effort towards environmental protection and aligns with Chinese values of creating a beautiful China.
In conclusion, this study aims to address the following questions:
(i)
Can establishing a system of responsibility assessment of renewable energy consumption resolve the negative impact of reducing renewable energy financial subsidies on the energy structure transformation of power generation enterprises?
(ii)
With establishing a green power certificate trading market, how does sharing green responsibility between power users and producers promote power generation enterprises’ energy structure transformation?
(iii)
How does the interactive behavior of the central and local governments at both levels play a role in the evolution of energy policy?
Addressing these issues promotes the effective implementation of renewable energy policies and accelerates the green transformation of the energy mix of power generation enterprises. Given this, this paper considers the interaction between central and local governments, constructs a tripartite evolutionary game model between central government–local government–generation enterprises, and studies the influence of the behavior of the two levels of government on the use of renewable energy to replace fossil energy and determine the appropriate renewable energy policy settings. This study provides a policy analysis for the green transformation of power generation enterprises in China and a reference for the green transformation of enterprises in other developing countries.

2. Materials and Methods

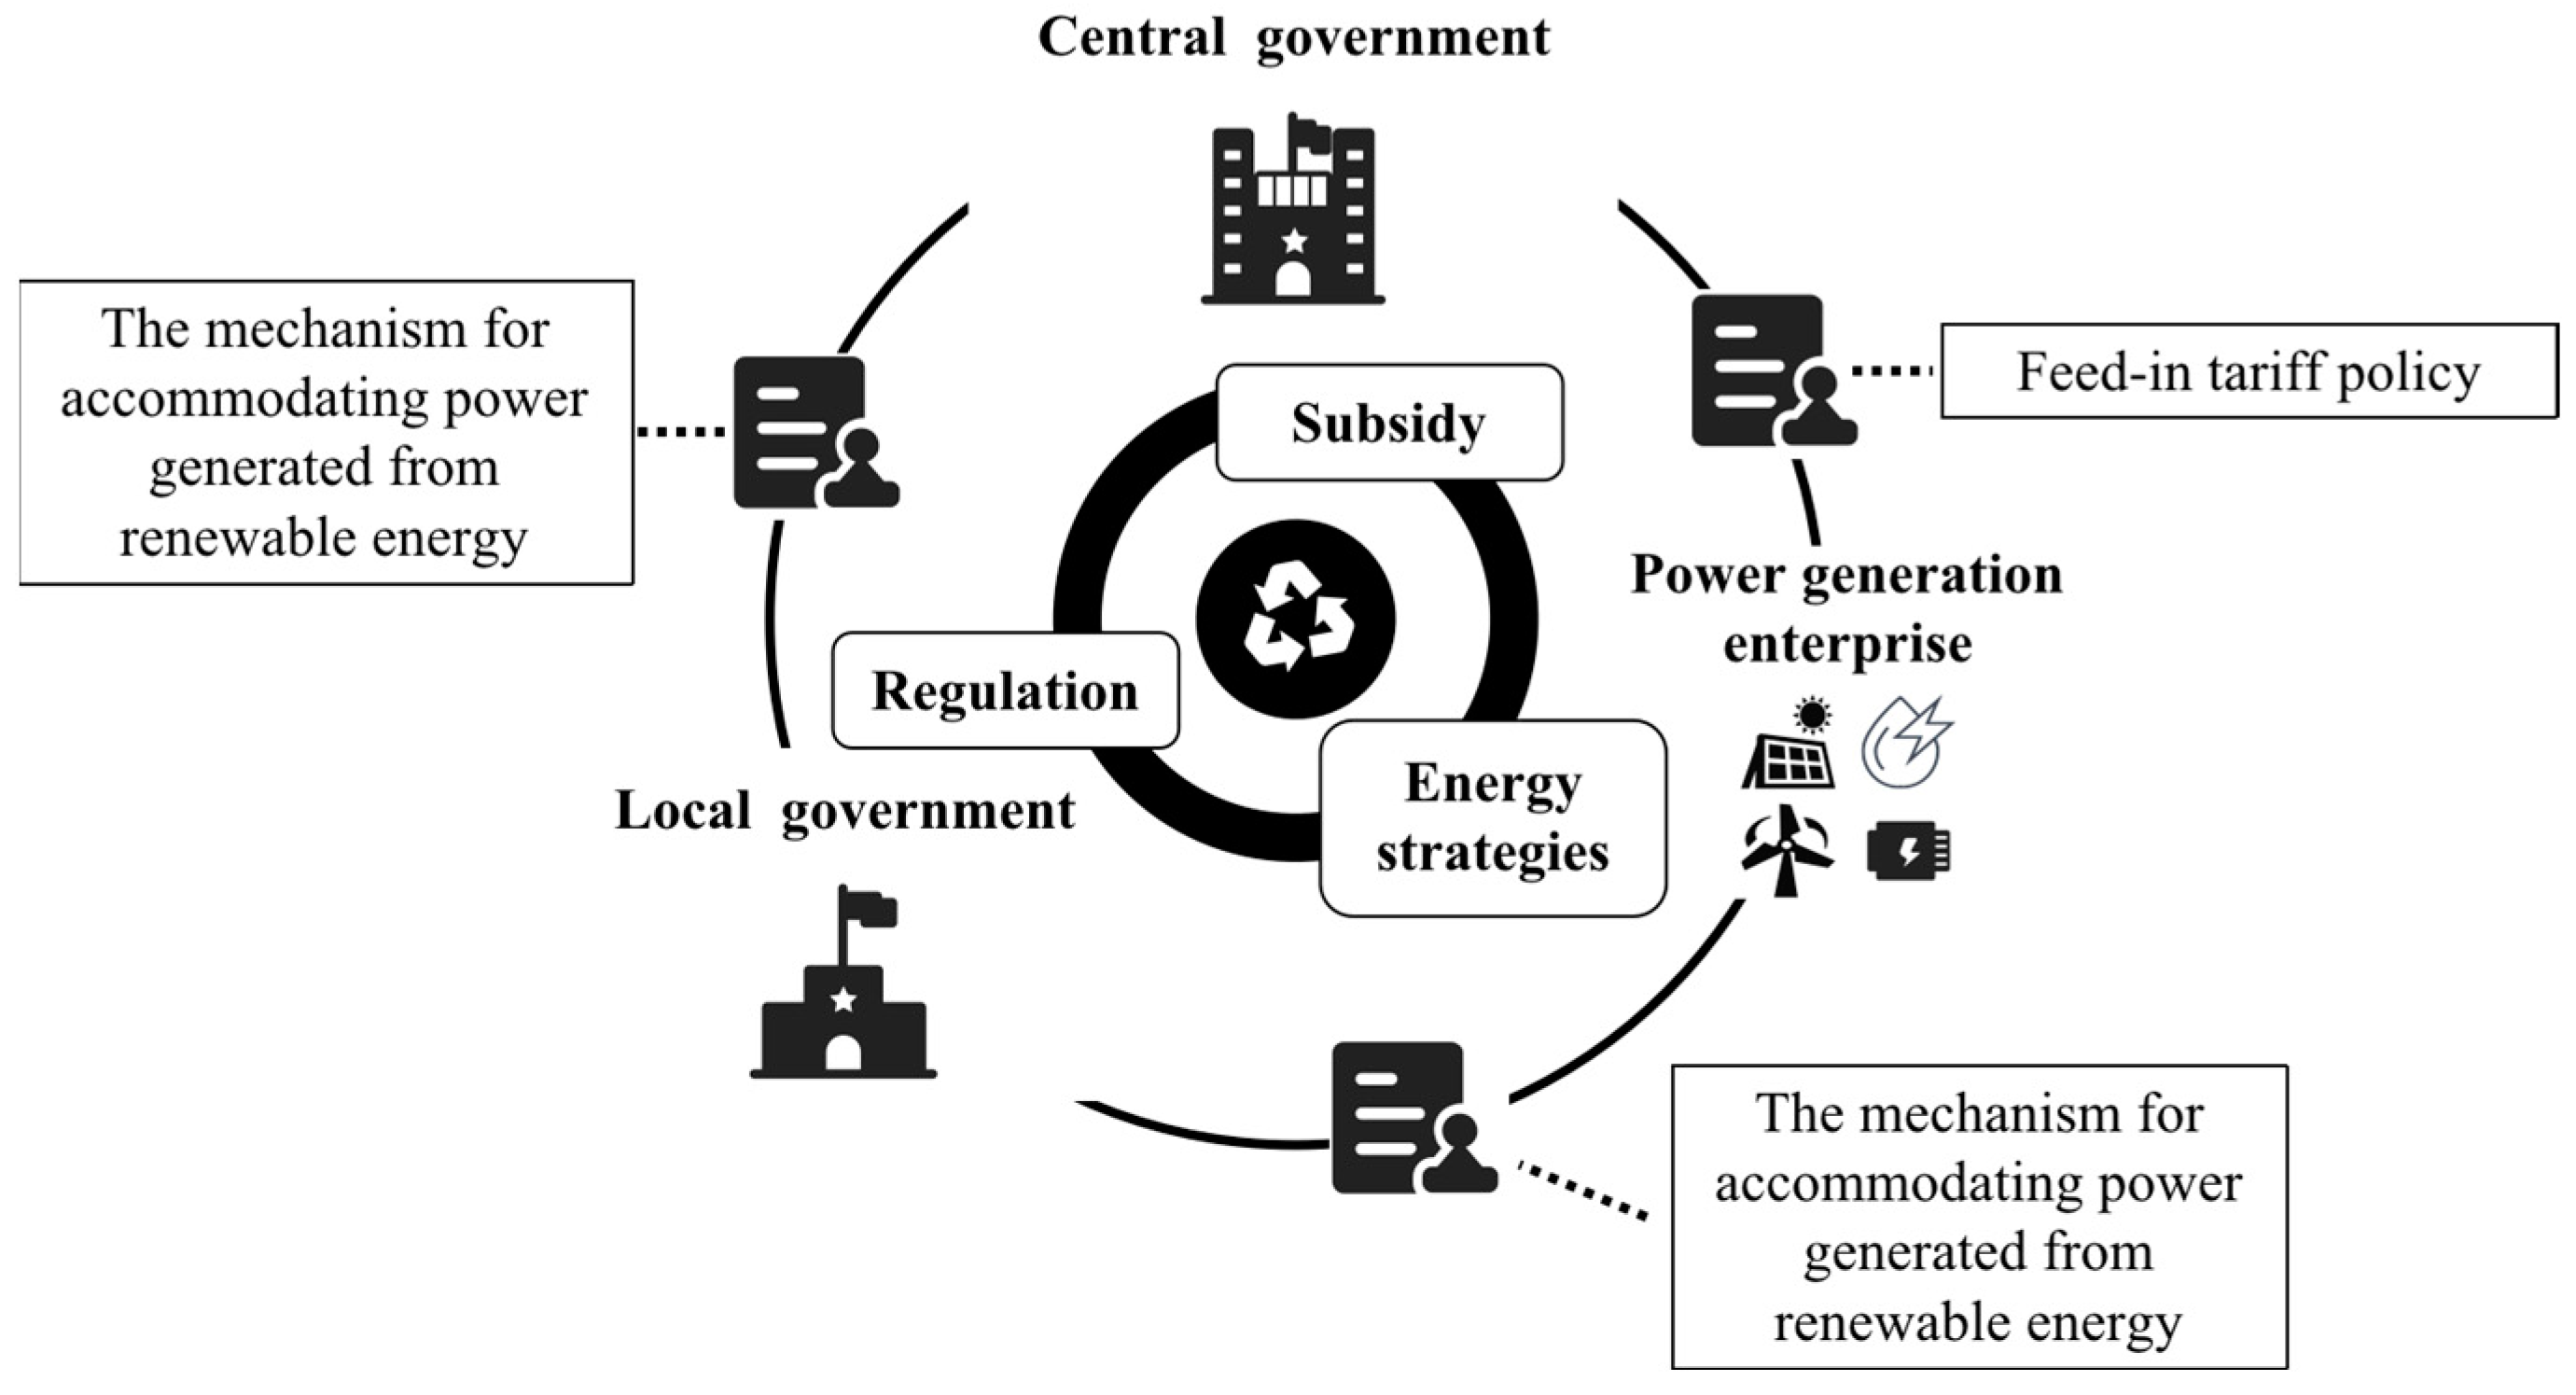
2.1. Renewable Energy Policy in China

In recent years, driven by the renewable energy policy, the development of the renewable energy industry in China has ushered in a golden period of significant development and utilization. With the progress of renewable energy power generation technology and the continuous expansion of investment scale, the cost of renewable energy power generation has decreased, and the competitiveness of renewable energy power generation has gradually increased. However, due to China’s resource endowment and the current energy structure and technology development level, renewable energy development still needs government policy support to reach the level and development degree planned by the government. In a sense, the government policy support for renewable energy is a “soft investment” to promote the transformation of the energy structure of power generation enterprises.

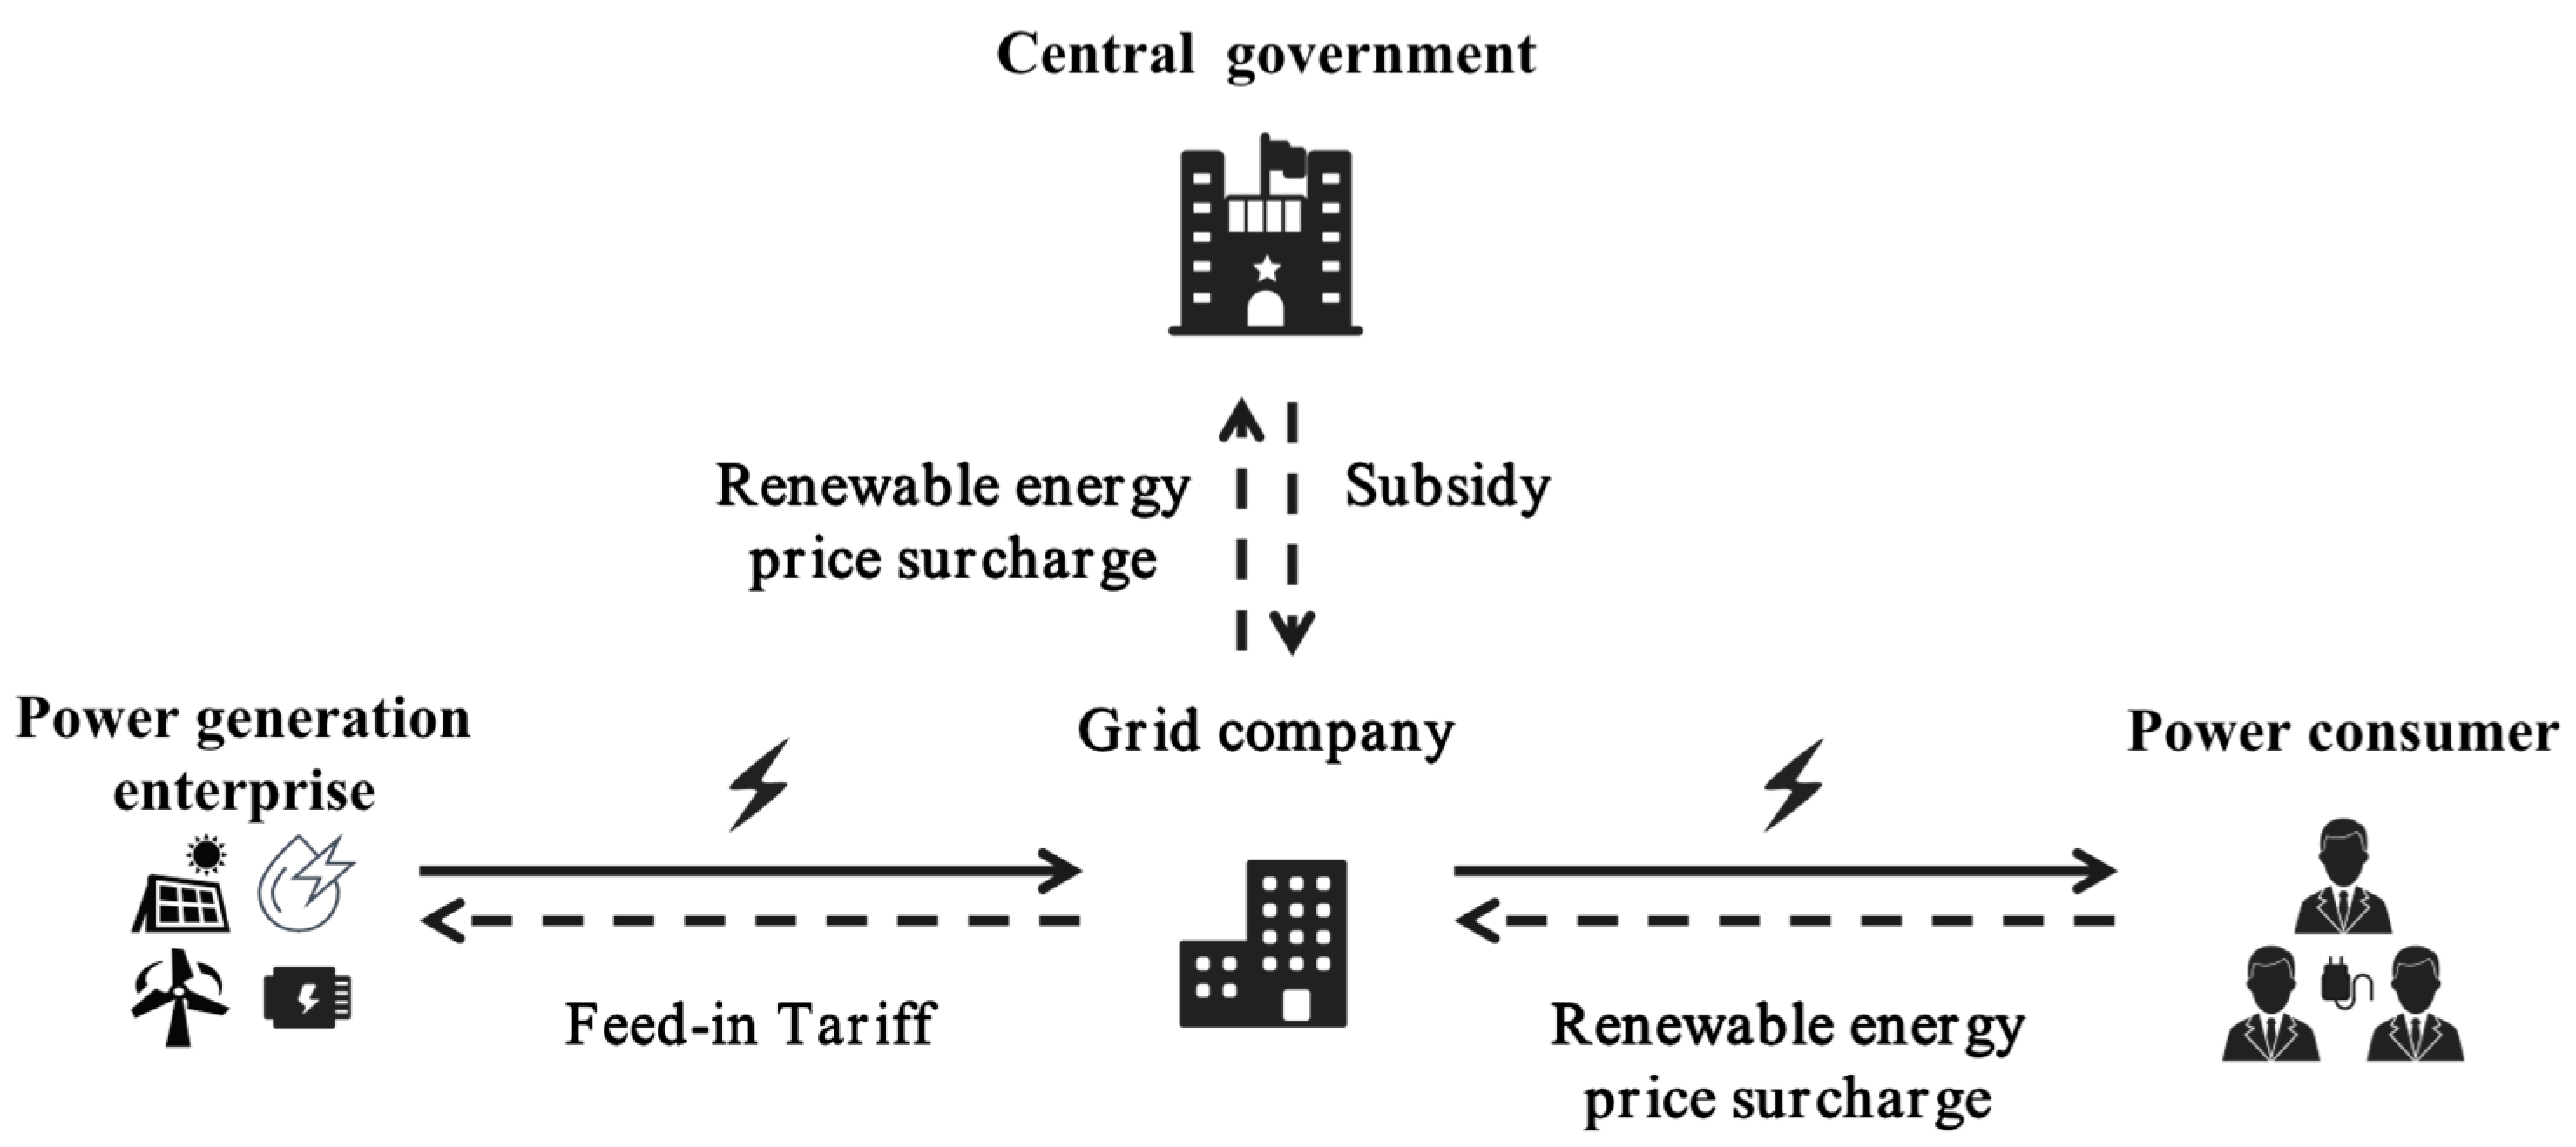
2.1.1. Feed-In Tariff

Feed-in tariff policy is that the price department of the State Council makes explicit provisions to the feed-in tariff of all kinds of renewable energy power generation according to the cost. Furthermore, grid companies must acquire renewable energy power by the stipulated feed-in tariff. As shown in Figure 1, the government is imposing a nationwide renewable energy tariff surcharge based on electricity sales, which will subsidize the costs incurred by grid companies for acquiring renewable energy power above the average feed-in tariff for conventional energy.
China’s renewable energy tariff surcharge is currently managed in two ways: income and expenditure. The grid enterprises pay the renewable energy tariff surcharge to the particular financial account every month. The Ministry of Finance distributes the funds and allocates the subsidy funds to the grid enterprises regularly.
China has made several adjustments to its renewable energy tariff surcharge since the “Interim Measures for the Collection and Use of Renewable Energy Development Fund” was issued in 2010. The tariff surcharge has increased from 0.8 cents/kWh to 1.9 cents/kWh, and the renewable energy feed-in tariff subsidy policy has significantly boosted China’s renewable energy power business. However, due to the rapid growth of renewable energy capacity in recent years, the financial subsidies for renewable energy have expanded quickly, and there may need to be more than raising the tariff surcharge to cover the increasing financial gap.

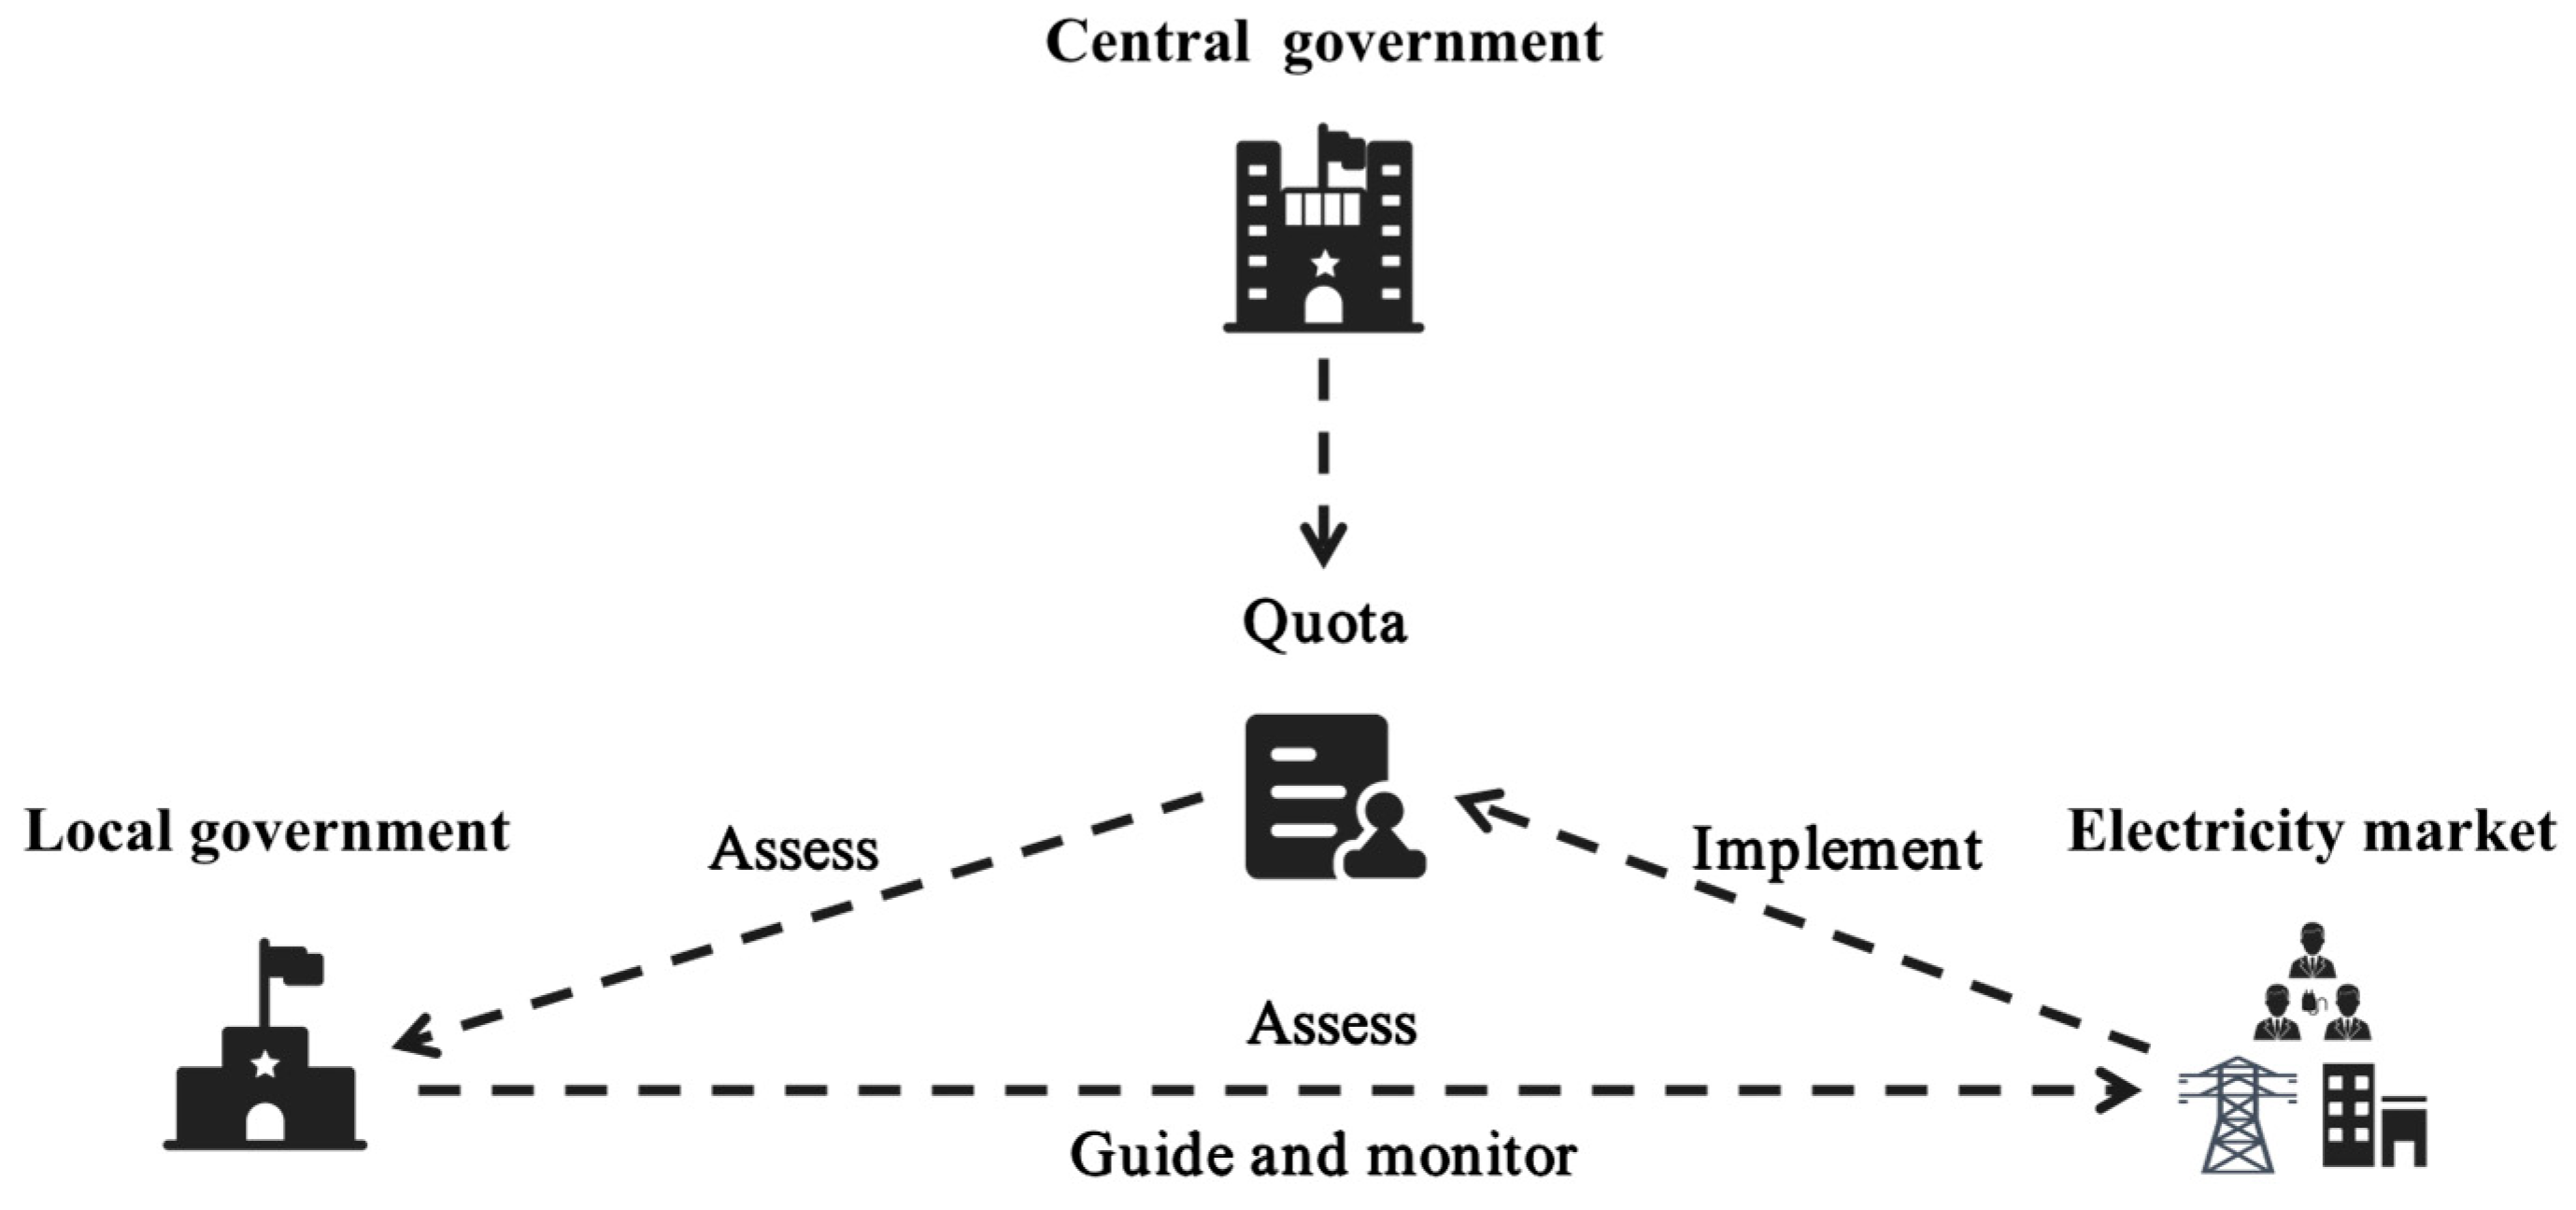
2.1.2. Renewable Energy Quota Policy

The Renewable Energy Quota Policy is a compulsory regulation made by the state to the market share of renewable energy generation at all levels of provincial administrations. In order to ensure the achievement of the carbon peaking and carbon neutrality goals and to guarantee that the share of non-fossil energy in primary energy will reach 25% by 2025, China has put in place a mechanism for accommodating power generated from renewable energy.
This mechanism considers various factors, including the development and utilization of renewable energy in each region, the national energy development plan, and the electricity consumption of society as a whole. It also mandates the consumption weight for each provincial administrative region and specifies the responsibility weight of total renewable and non-hydropower consumption. There are two grades of indicators, minimum and incentive values, which are established to ensure compliance with the policy.
Under the mechanism, the state assesses the provincial administrative regions, and each provincial government assesses the market entities that bear the consumption responsibility in each region. So, completing the consumption responsibility requires the cooperation of each provincial government department, power grid enterprises, and other related market entities. Market players can complete the assessment by consuming renewable energy power or using alternative methods such as purchasing Tradable Green Certificates (TGCs) to complete the consumption.
Figure 2 shows that the green power certificate trading mechanism supports the renewable energy quota mechanism. These certificates are electronic vouchers issued by the state for non-water renewable energy. Buying them supports green development and can be used as a voucher to consume green power. Certain power generation enterprises in China can apply for and trade these certificates on the voluntary subscription platform for TGCs. Government departments, enterprises, institutions, and consumers can purchase TGCs on this platform. TGC prices are regulated to be reasonable and not exceed the national subsidy standard for renewable energy power. TGCs are not only a supplementary way to complete the assessment of renewable energy consumption but can also relieve the pressure of central government financial subsidies. After power generation enterprises sell TGCs, the corresponding renewable power will no longer receive subsidies from the national renewable energy tariff surcharge fund.
Green power certificate trading systems have been used in many countries. Since 2017, China’s trial of a renewable power certificate trading system has been successful in reducing the financial gap and promoting the energy consumption revolution. The system allows for voluntary subscriptions and has shown promising results.
In summary, the research framework of this paper is shown in Figure 3. The central government and power generation enterprises establish a game relationship through the renewable energy feed-in tariff subsidy system. The central government decides the financial subsidy policy for power generation enterprises. The subsidy policy directly affects the profit and the energy structure strategy of power generation enterprises. Moreover, the central government is concerned about environmental effects. The energy structure strategy of power generation enterprises will affect the environmental quality, which will influence the energy policy of the central government.
Under the mechanism for accommodating power generated from renewable energy, the central government assesses the local renewable power consumption, as shown in Figure 3. It is the regulator of environmental pollution and the assessor of renewable power consumption. Moreover, the local government has the obligation and right to supervise and manage the local responsible body of renewable power consumption.
This mechanism aims to reduce the relative advantage of thermal power over green power, resulting in the responsible body prioritizing green power consumption under the same tariff. Thermal power generation companies have two options: accept that their competitive advantage is decreasing or negotiate with the responsible authority for consumption and share the cost of TGCs. Green power generation companies face a reduction in financial subsidies, which means they must either adjust to the decrease or find alternative ways to obtain compensation, such as selling TGCs.
The tripartite evolutionary game model constructed in this paper discards the traditional classical game theory’s assumption. In the traditional classical game, the players are perfectly rational and have complete information. In the game of evolution, the players are only able to make rational decisions based on limited information, making it difficult for them to predict each other’s actions in real-life situations. This reflects the reality that economic actors also have limited rationality [20]. The central government, local government, and power generation enterprises make decisions based on their individual interests and revenue functions. They are driven by factors such as environmental impact, performance, and profit.
In summary, this paper uses the evolutionary game approach to simultaneously consider the strategies of the central government, local governments, and power generation companies. We can obtain policy recommendations by exploring the dynamic equilibrium conditions under the ideal steady state. These policy recommendations can drive the energy mix transition of power generators under the trend of fiscal subsidy withdrawal.

2.2. Tripartite Evolutionary Game

2.2.1. Research Hypotheses

H1. 
The central government, local government, and power generation enterprises are all bounded rational and cannot have complete information to predict their opponents’ behavioral decisions in advance.
H2. 
Each subject in the evolutionary game has two possible strategies. The central government can choose to subsidize green power enterprises or not; the local government can choose to strengthen the regulation of renewable energy consumption or not; the power generation enterprises can choose the green power strategy or the thermal power strategy.
H3. 
In the electricity market, power generation enterprises have similar characteristics. They all face the same power demand and supply capacity and have equal technology levels and resource endowments. The enterprises can freely choose to adopt conventional energy generation or renewable energy generation. All renewable energy power generators can apply for green power certificates and sell them on the green power certificate trading platform.
H4. 
To assess power consumption, the responsible party must buy TGCs simultaneously with thermal power purchase. Thermal power generation enterprises will bear part of the cost of TGCs under the price transmission mechanism of the TGCs trading market. Therefore, the price of TGCs will be shared between thermal power enterprises and the responsible subjects of power consumption.
H5. 
There are two options to complete the central government’s assessment tasks: the actual consumption of renewable electricity in the electricity market; the responsible subjects purchasing TGCs while consuming thermal electricity. The local government will receive a performance bonus if it completes the assessment. Otherwise, local governments will be punished for their performance.
H6. 
Assume that the supply and demand in the electricity market are balanced, and the electricity produced by power generators can always be sold in the electricity market in time.
H7. 
If the central government provides financial subsidies, the decision of green power generation companies to sell green certificates depends on external factors such as the price of TGCs and the amount of financial support offered.
H8. 
Assume that sufficient green power certificates are available for trading in the market, which can help the bearers of responsibility for consumption power generated by renewable energy to complete the assessment. If the local government fails to regulate, the market for trading TGCs becomes unfavorable, making it challenging for power generators who prioritize green power to generate revenue by selling TGCs.

2.2.2. Parameter Setting and Problem Description

The process of substituting renewable energy for traditional fossil energy is a macro reflection of each power generation enterprise’s choice of energy structure strategy in each phase of the game. In the process of connecting a large proportion of renewable energy to the grid, power generation enterprises have two possible strategies: one is to use conventional energy generation, such as coal generation, represented by thermal power strategy (TPS); the other is to use renewable energy generation for its cleanliness and greenness, which is represented by green power strategy (GPS).
Power generation companies are bounded rationality and make decisions based on maximizing their interests when choosing their strategies. With their regional nature, local governments make decisions based on local interests when choosing strategies. The central government coordinates economic, social, and environmental issues from the overall and global interests.
When the subsidies are more significant than the benefits obtained from the transactions of TGCs, power generators will choose to give up the transactions of TGCs and accept the central government subsidies. Otherwise, the generating companies will sell their TGCs and give up the central government subsidies. Given this, we discuss the revenue expenditure function of the evolutionary game in two cases, S > P T G C × q and S < P T G C × q .
S denotes the financial subsidy funds issued to the green power enterprises when the central government adopts the subsidy issuance strategy. P T G C denotes the market trading price of TGCs that can be applied by the enterprises. q denotes the average generation demand of power generation enterprises. We call the case of S > P T G C × q the case of low price of TGCs, and the case of S < P T G C × q the case of high price of TGCs.
The revenue expenditure functions of each subject in the evolutionary game are shown in Table 1 and Table 2. Table 1 represents the benefit expenditure function in the case of the low price of TGCs, and Table 2 represents the benefit expenditure function in the case of the high price of TGCs.
V C , V L , V P denote the revenue expenditure functions of the central government, local government, and power generation enterprises, respectively.
C 1 denotes the costs and expenses other than the financial subsidy funds paid by the central government when the central government adopts the strategy of granting subsidies. These include the expenses related to designing the financial subsidy policy and allocating funds for electricity price subsidies.
W denotes the reward the central government gives when the local government completes its responsibility of renewable energy consumption weight.
F denotes the penalty imposed by the central government on the local government when the local government fails to complete its responsibility of renewable energy consumption weight.
E 1 denotes the environmental effect on the central government when the power generator adopts the green power strategy.
E 2 denotes the environmental effect on the local government when the power generator adopts the green power strategy.
G represents the incentive the central government gives the local government when the central government stops providing subsidies. The local governments receive incentives to enforce their responsibility in consuming green power.
C 2 denotes the cost to be paid by the local government to strengthen the regulation of renewable energy consumption and to regulate and control the trading market of TGCs.
P denotes the selling price per unit of electricity.
C R denotes the cost per unit of renewable energy generation borne by power generation enterprises when they choose the green power strategy.
C T denotes the cost per unit of thermal power borne by power generation enterprises when they choose the thermal power strategy.
r denotes the share of the cost of purchasing TGCs borne by power generation enterprises to fulfill the responsibility of renewable energy consumption. Therefore, 1 r can reflect the green consumption intention of electricity consumers.
x denotes the probability that the central enterprise adopts the subsidy strategy, 0 x 1 . y denotes the probability that the local government adopts the regulation strategy, 0 y 1 . z denotes the probability that the power generation enterprise chooses the green power strategy, 0 z 1 .

2.2.3. Model Establishment
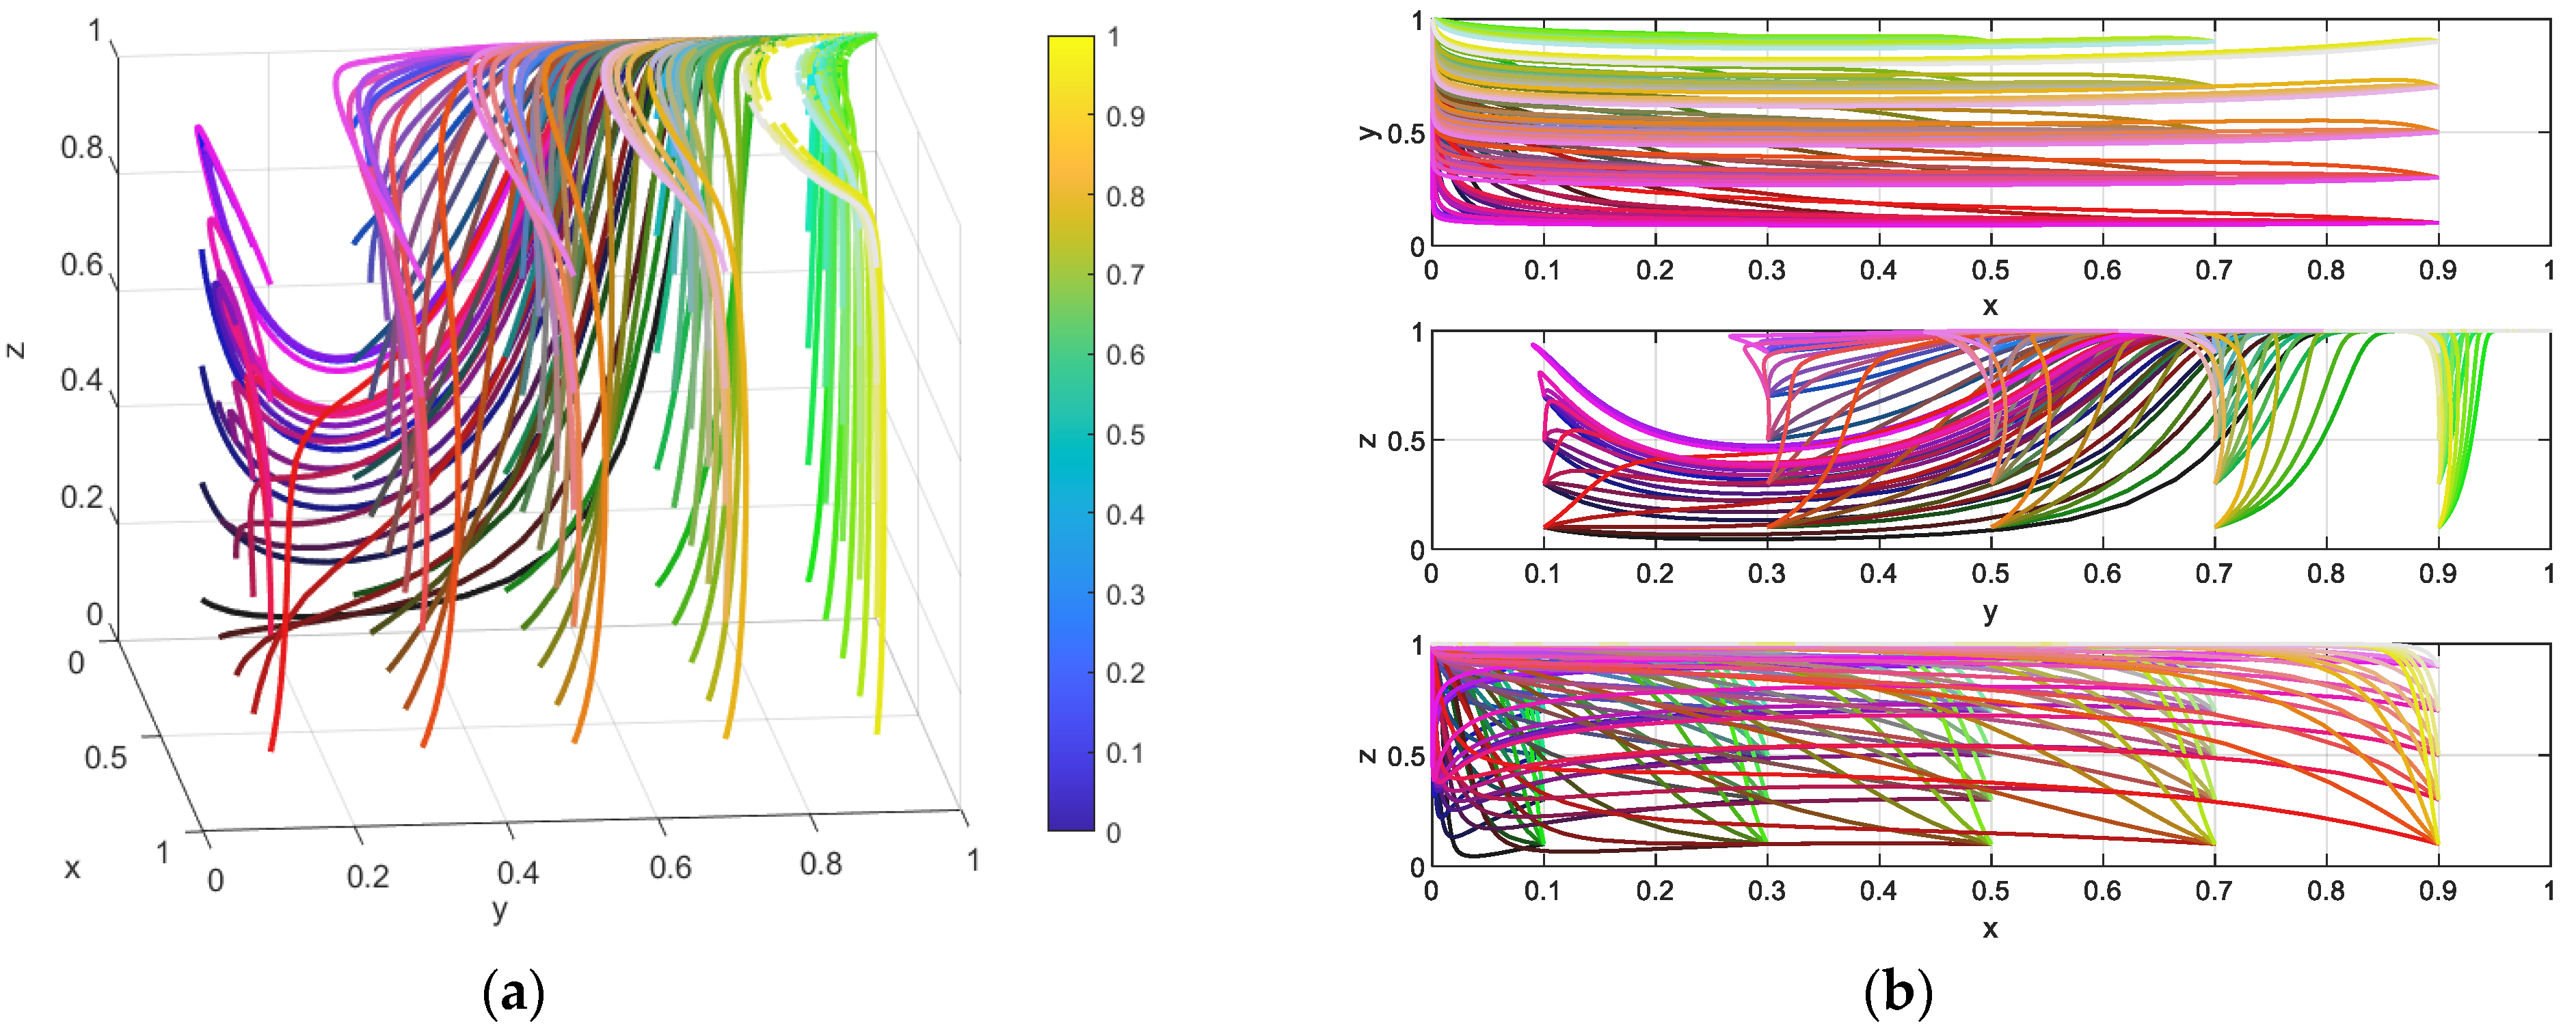
Based on the revenue payment function of each subject in the above evolutionary game, the expected revenue functions of the central government, local government, and power generation enterprises are constructed.
The expected returns of the central government that adopts the strategy of granting financial subsidies and the strategy of not granting financial subsidies are denoted by f x 1 and f x 2 , respectively, and the average expected return is denoted by u x .
The expected returns of the local government adopting the regulation and non-regulation strategies are denoted by f y 1 and f y 2 , respectively, and the average expected return is denoted by u y .
The expected returns of power generators adopting green and thermal power strategies are denoted by f z 1 and f z 2 , respectively, and the average expected return is denoted by u z .
u x = x f x 1 + 1 x f x 2
u y = y f y 1 + 1 y f y 2
u z = z f z 1 + 1 z f z 2
Thus, the system of replication dynamic equations for the central government, local governments, and power producers is obtained as:
g x = x t = x ( f x 1 u x )
g y = y t = y ( f y 1 u y )
g z = y t = z ( f z 1 u z )
The system of dynamic equations is obtained from Table 1 as follows:
g x = x x 1 × C 1 G y + S z
g y = y y 1 C 2 + G x 1 + K z 1
g z = z z 1 R 1 + S x + R 0 y 1 x + R 0 r y
where K = W + F , R 0 = P T G C × q , R 1 = C T C R × q .
According to Table 2, a dynamic equation system is obtained as follows:
g x = x x 1 × C 1 G y + S z 1 y
g y = y y 1 C 2 + G x 1 + K z 1
g z = z z 1 R 1 + S x 1 y + R 0 y 1 + r
The Jacobian matrix of this game can be obtained by the set of dynamic equations among the central government, local government, and power producers.
J = g x x g x y g x z g y x g y y g y z g z x g z y g z z
Using the properties of the eigenvalues of this Jacobian matrix, we can perform a local stability analysis of the evolutionary game.
When the eigenvalues of the Jacobian matrix are all less than 0, the obtained local equilibrium point is stable, and the Evolutionary Stable State (ESS) is reached at this time. In the steady state of the evolutionary game, any game participant cannot increase the gain by individual action. The minority group that takes any sudden change will disappear under natural selection. When the game reaches dynamic equilibrium, small perturbations in the dynamic process will naturally return to the steady state after they occur, i.e., when in the evolutionary steady state, the game system will not deviate from the steady state unless there are strong shocks from outside.
In this paper, referring to Daniel Friedman, ESS is not necessary for the equilibrium point to reach dynamical stability. When the eigenvalues of the Jacobian matrix are all greater than 0, the obtained local equilibrium point is unstable [21]. When the Jacobian matrix has eigenvalues of both positive and negative signs, then the evolutionary steady state of the obtained local equilibrium point is uncertain. The local equilibrium point is unstable when the Jacobian matrix has eigenvalues of value 0.

3. Results

Power generators are influenced by the size of subsidies for renewable electricity as well as the price of green power certificates when making energy mix adjustments. These subsidies are typically regulated by policy, and power generators respond strategically to these subsidy conditions. This paper examines two scenarios of high and low green electricity certificate prices in relation to the subsidy scale of renewable electricity and analyzes the strategic evolution of power producers.

3.1. Scenario Analysis of Low Price of TGCs

When S > P T G C × q , the eigenvalues of the game model at each local equilibrium point are shown in Table 3.
The local equilibrium point (0, 0, 0) indicates that the central government does not issue financial subsidies for renewable electricity, the local government does not take regulatory measures, and the power-generating enterprises continue to adopt a highly polluting power generation method by coal power generation.
Driven by the goals of building a beautiful China, it is unrealistic for the central and local governments to ignore the ecological damage and environmental pollution caused by coal power generation.
The local equilibrium point (0, 0, 1) indicates that neither the central government nor the local government takes positive measures, but the power generation enterprises will spontaneously choose to use renewable energy to generate electricity.
When the stability conditions R 1 < 0 ,   G C 2 < 0 are satisfied simultaneously, the strategy on the local equilibrium point (0, 0, 1) stays steady. At this time, because q > 0 , the cost of green power and thermal power need to satisfy C T > C R , which means that the cost of green power is lower than the cost of thermal power, and green power has more competitive advantages in generation cost.
According to the National Energy Administration 2022 data, the cost of renewable energy generation in China has been relatively reduced in recent years, and the gap with the cost of coal power has gradually narrowed. The difference between the cost of wind power and coal power generation has dropped to 1.1 cents/kWh. The difference between the cost of photovoltaic and coal power generation has fallen to 4.3 cents/kWh. However, some of the critical technologies rely heavily on foreign countries. Some of the high-value-added, high-tech equipment and materials rely on imports. In order to decrease the cost of renewable energy production and enhance its competitiveness, China must make advancements in the critical technology sectors of renewable energy generation.
The local equilibrium points (0, 1, 0) and (0, 1, 1) reflect the energy strategy of power generation enterprises when the central government does not issue financial subsidies and local governments adopt the regulatory strategy.
By comparing the stability conditions of the local equilibrium points (0, 1, 0) and (0, 1, 1), we find that under the strategy of no subsidies, only when C 2 < G + K is satisfied, the local government will adopt the regulatory strategy.
K indicates the performance difference that the local government suffers when the responsibility of renewable energy electricity consumption is completed and when it is not. When the sum of the performance incentive for local governments to complete the renewable electricity consumption responsibility and the incentive to adopt the regulatory strategy is greater than the cost of the regulatory strategy, local governments have the motivation to maintain the regulatory strategy.
Whether the local government’s regulatory strategy can promote the energy transition of power generators depends on whether 1 + r R 0 + R 1 is greater than 0, i.e., whether the price advantage of green power under the green power certificate trading system can compensate for the difference in cost with thermal power generation. When 1 + r R 0 + R 1 > 0 , it reflects that the difference between thermal power and green power generation costs is in a relatively reasonable space on the one hand. Moreover, it reflects that the green power certificate trading price can reasonably reflect the environmental premium of green power. The transition of power generation enterprises to green and low-carbon is blocked when 1 + r R 0 + R 1 < 0 .
The local equilibrium points (1, 0, 0), (1, 0, 1), (1, 1, 0), and (1, 1, 1) reflect the combination of strategies of local governments and power generation companies in the context of the central government’s adoption of financial subsidies.
Among them, the local equilibrium points (1, 0, 0), (1, 0, 1), and (1, 1, 1) have positive eigenvalues, and the local equilibrium points are in an unstable or uncertain state.
To position the local equilibrium point (1, 1, 0) in a stable state, the stability condition R 1 + S + r R 0 < 0 needs to be satisfied. It means that the sum of the financial subsidies received by green power and the partial green power certificate transaction price borne by thermal power cannot make up for the cost difference between green power and thermal power. In China, the cost difference is decreasing, and the government should be cautious of how small financial subsidies may hinder the transition to green energy in power generation companies.
r is also conducive to enhancing the advantages of the green power strategy. However, in recent years, due to the long-term high coal prices, thermal power generation profit margins have shrunk, and the operating effectiveness of thermal power enterprises has shown a downward trend. Restricted by technical conditions, resource endowment, and other multi-conditions, China will remain in a long-term energy structure where thermal and green power co-exist. Therefore, r should exist in a reasonable range and should not excessively affect the operating effect of thermal power enterprises.
China’s increase in renewable power generation is primarily due to high electricity consumption rather than advancements in power production technology [22]. As a result, support for renewable energy policies is still crucial, given China’s current power production level.
After reducing energy subsidies, local governments must be motivated to regulate and increase power users’ willingness to pay for clean electricity to maintain green transformation in power generation enterprises. An effective central government regulatory incentive policy for local governments and an efficient trading market for green electricity certificates are indispensable.

3.2. Scenario Analysis of High Price of TGCs

When S < P T G C × q , the eigenvalues of the game model at each local equilibrium point are shown in Table 4.
Comparing Table 3 and Table 4, we find that the eigenvalues differ only at the local equilibrium points (0, 1, 1), (1, 1, 0) and (1, 1, 1). The differences are concentrated when the local government adopts a regulatory strategy. When the local government does not adopt a regulatory strategy, according to hypothesis H8, the market for green power certificates is cold. Currently, grid companies, power sales companies, and power consumers do not have a strong motivation to buy green certificates. The stability of the strategy remains unaffected by the proportion between the financial subsidy and the revenue earned by green power companies from selling green certificates.
The stability of the local equilibrium point (0, 1, 0) is not impacted by the lack of subsidies for thermal power. Additionally, thermal power must bear some of the cost of green certificates as part of the local government regulation strategy.
According to the stability conditions of (0, 1, 1) and (1, 1, 1), when the local government adopts the regulatory strategy, and the generators adopt the green power strategy, the evolution of the central government subsidy strategy is determined by the relationship between the magnitude of G and C 1 .
According to the stability conditions of (1, 1, 0) and (1, 1, 1), the evolution of the energy strategy of power generators is determined by the sign of 1 + r R 0 + R 1 , i.e., it is influenced by whether green certificate trading can compensate for the difference between thermal and green power generation costs.
In contrast to the low green certificate price scenario, the high green certificate price scenario highlights the importance of a well-functioning green electricity certificate trading market. In this scenario, the impact of the central government’s subsidy scale on the green transformation of power generation enterprises becomes less significant. In the case of high green certificate prices, the role of R 0 and r is further emphasized, with the former representing the level of electricity production from renewable energy sources and the latter emphasizing the willingness of power users to pay for green electricity, that is, the green responsibility of power consumers.

4. Discussion

Section 3 analyzes the price scenario of green power certificates relative to financial subsidies. In this part, this study will assign values to the model based on China’s current energy policy background. This part explores how the reduction of financial subsidies affects the energy transformation of power generation enterprises under the current background and how to mitigate the adverse impact of the reduction of financial subsidies on the transformation of power generation enterprises.

4.1. Scenario Setting

Based on the stability analysis above, the evolutionary stability state of the game is impacted by both the initial probability of strategy choice among the three gamers and the initial values of the exogenous parameter variables. To confirm the accuracy of this analysis, numerical simulations were conducted using Matlab (R2023a) in this paper.
According to the expenditure of renewable energy tariff surcharge income arranged in the final account of the central government funds in 2021, the number of subsidies for wind power and photovoltaic power generation was 30.552 billion yuan and 47.893 billion yuan, respectively. In 2021, the national wind power generation capacity was 652.6 billion kWh, an increase of 40.5% from a year earlier, and the national photovoltaic power generation was 325.9 billion kilowatt-hours, an increase of 25.1% from a year earlier. Therefore, the subsidy for renewable energy generation is about 80 RMB/MWh. The parameter S is set to 80.
According to data from the green power certificate subscription platform, the average price of PV power certificates in 2021 was 76.1 RMB, and the average price of wind power certificates was 145.9 RMB. The total sales volume of green power certificates in 2021 was 577,400, including 50,200 PV power certificates and 75,300 wind power certificates. China sets the same issuance standard for all kinds of renewable power. One certificate is issued for 1 MWh power.
Assume P T G C = w w i n d P T G C w i n d + w l i g h t P T G C l i g h t , where P T G C w i n d and P T G C l i g h t denote the price of PV power certificate and wind power certificate, respectively; w w i n d and w l i g h t denote the sales proportion of PV power certificate and wind power certificate, respectively. Therefore, the trading price of a green power certificate is about 85 Yuan/MWh by calculation. The parameter value is assigned as R 0 = 85 .
The trading amount of the green power certificate is about 49.2 million yuan. The green power certificate trading volume is much smaller than the financial subsidy. The green power certificate trading lacks vitality. Therefore, the parameter value is assigned as r = 1 .
The report “Cost of Renewable Energy Power Generation in 2021”, released by IRENA, the International Renewable Energy Agency, shows that the installation cost of about two-thirds of the new renewable energy power is less than the cheapest coal-fired power in the G20 countries. The levelized cost of PV power generation is about 0.34 yuan/kWh, and the levelized cost of onshore wind power is about 0.23 yuan/kWh. According to the data and parameter settings of the cost above, R 1 is set to −50 in this paper.
It is assumed that the central government’s reward and punishment mechanism for local governments is effective. Referring to the relevant studies on government regulation [23,24,25,26], the parameter values are assigned as C 1 = 18 ,   C 2 = 10 ,   G = 15 ,   K = 20 under the condition that G C 1 < 0 , C 2 G < 0 , and C 2 K < 0 .
Under the high green certificate trading price, S < R 0 = P T G C × q , this paper conducts a simulation based on the above parameter setting. The sign of the eigenvalues and the stability of the local equilibrium points are shown in Table 5. The evolutionary results are shown in Figure 4.
As shown in Figure 4, with the initial parameter settings, when the conditions G < C 1 , C 2 < G , and 1 + r R 0 + R 1 > 0 are satisfied, the local equilibrium point (0, 1, 1) is stable.
At this point, the central government does not issue financial subsidies, the local government adopts an active regulatory strategy, and the power generation companies choose a renewable energy generation strategy. The conditions G < C 1 and C 2 < G show that the central government adopts effective incentives for local government.
The condition 1 + r R 0 + R 1 > 0 reflects that the green power enterprises can now compensate for the part of green power cost through green power certificate trading. On the one hand, power generation enterprises are motivated by the benefits of green power certificate trading and spontaneously transform into green production. On the other hand, local governments are motivated by the central government’s policy to adopt strict control strategies. It results in thermal power companies having to bear part of the cost of purchasing green power certificates, which makes the original cost advantage from thermal power generation squeezed.
Figure 4 shows that no matter the initial probability of the central government adopting a financial subsidy strategy, the probability will decrease monotonically and evolve to zero.
In contrast, the evolutionary strategies of local governments and power generators will eventually evolve toward (1, 1), although there will be a twist in the evolutionary process.
In the y z perspective, if the initial strategies of the three gamers are (low subsidy, low control, and high green power), then the probability of power generation enterprises adopting the thermal power strategy in the short term will rise. Since the green power certificate trading market may lack vitality at this time, the power market has insufficient incentive to purchase green power certificates. Coupled with the limited subsidies received by the green power strategy, the incentive of power generators to adopt the green power strategy is impaired.
In the x y perspective, when the initial probability of the central government adopting the financial subsidy strategy is high, the local government’s probability of adopting the regulatory strategy will tend to decrease in the short term. It means that the financial subsidy strategy may breed the inertia of the local government to take green responsibility and reduce the motivation of the local government to adopt the regulatory strategy.
We use x 0 , y 0 , and z 0 to denote the initial values of x , y , z , respectively. In order to improve the problems such as energy shortage and environmental pollution, renewable energy has been developing rapidly in recent years. According to The China Renewable Energy Development Report 2021, by the end of 2021, the installed capacity of renewable energy power generation reached 106,394 million kW, accounting for 44.8% of the total electricity capacity. The national renewable energy power generation reached 24,864 billion kWh, accounting for 29.7% of the total power generation. Therefore, we set the initial probability of power generation enterprises to adopt green power strategy: z 0 = 0.3 .
Under the background of renewable energy financial subsidies retreat, we set the initial probability of the central government adopting subsidy strategy: x 0 = 0.5 .
Under the assessment mechanism of renewable energy consumption responsibility, we set the initial probability of local government adopting an intervention strategy: y 0 = 0.5 .

4.2. The Influence of the Initial Probability of the Central Government’s Choice of Strategy

The central government’s initial probability of adopting a subsidy policy serves as a signal to the electricity market to encourage the use of renewable energy. The strength of this signal determines the likelihood of renewable electricity receiving subsidies, thus providing power generation companies with a stronger incentive to shift toward renewable energy sources. However, research suggests that local governments may engage in free-riding behaviors by not fully participating in the central government’s assessment process. This paper proposes that similar free-riding opportunities should be available to local governments under the consumption assessment system. Furthermore, the strong subsidy signal from the central government allows local governments to neglect their green responsibilities.
Figure 4 tentatively verifies the above conjecture. The evolutionary results presented in Figure 4 show that the evolutionary game reaches a stable state when x = 0 , y = 1 , and z = 1 . The perspective from x y presented in Figure 4 shows that if x 0 is high when the initial probability of the local government adopting a regulatory strategy is high, y will decrease in the short run and evolve to 1 in the long run.
Figure 5 further verifies the conclusion of Figure 4, when x 0 = 0.9 , z 0 = 0.3 , take y 0 = 0.1 ,   0.2 ,   0.3 ,   0.4 ,   0.5 ,   0.6 ,   0.7 ,   0.8 ,   0.9 , respectively. When y 0 is higher, y decreases more obviously in the early stage of the evolutionary game. When y 0 is close to 0, z fluctuates widely. Figure 5 reveals that when the central government adopts a high probability of financial subsidy strategy, the local government is not very active in adopting the control strategy in the short term. However, as the evolution of the game advances, y will decrease significantly, and the local government will be forced to adopt an active control strategy under the assessment mechanism of renewable energy consumption responsibility.
Figure 6 reveals the effect of the initial probability of the central government’s fiscal subsidy strategy on the evolutionary game. Under the initial parameter settings, the system stability point does not shift as the initial probability of the central government’s fiscal subsidy strategy x 0 increases. However, as x 0 increases, the local government’s evolution rate to 1 is slower in the short term. As x 0 increases, in the short term, the rate of the green transition of power generation enterprises is faster. However, in the long run, the higher the x 0 , the slower the evolution rate of power generation enterprises to green power strategy. As seen in Figure 6, greater probability of the central government taking financial subsidies is not better.
As shown in Figure 6, when x 0 decreases, local governments can hardly rely on the central government’s behavior in the long term to solve the problem of renewable energy consumption and the environmental problems caused by conventional energy generation. Thus, the local government has to adopt more active control policies. Under this situation, the central government can alleviate the pressure of financial subsidies through the green power certificate trading market and reduce the use of financial subsidies invested in the energy structure transformation. To the extent that power generation enterprises that adopt green power strategy have been at an advantage, the evolutionary game will develop to (0, 1, 1) and reach stability.
Even though the central and local governments are both national policy implementers and agree on the general interests, they have mutual games in promoting renewable energy development due to the different specific subjects and geographical constraints. It is verified with hypotheses H1 and H2 that each actor is finite rational. They all adopt strategies to maximize their interests, among which the central and local governments are independent game subjects. The strategies of the two levels of government will be influenced by the interaction between the two levels of government.
Renewable energy power generation has apparent eco-environmental friendliness, and the positive externality of renewable energy power generation is highlighted. The local government would be a free rider in climate policy and the completion of responsibility for renewable energy consumption. It is verified with H5 that the rewards and punishes toward local governments primarily rely on the behavior of power companies. Therefore, the central government should moderately reduce the probability of adopting fiscal subsidy policies and reduce its intervention in the renewable energy generation market to stimulate local governments to play a higher utility.

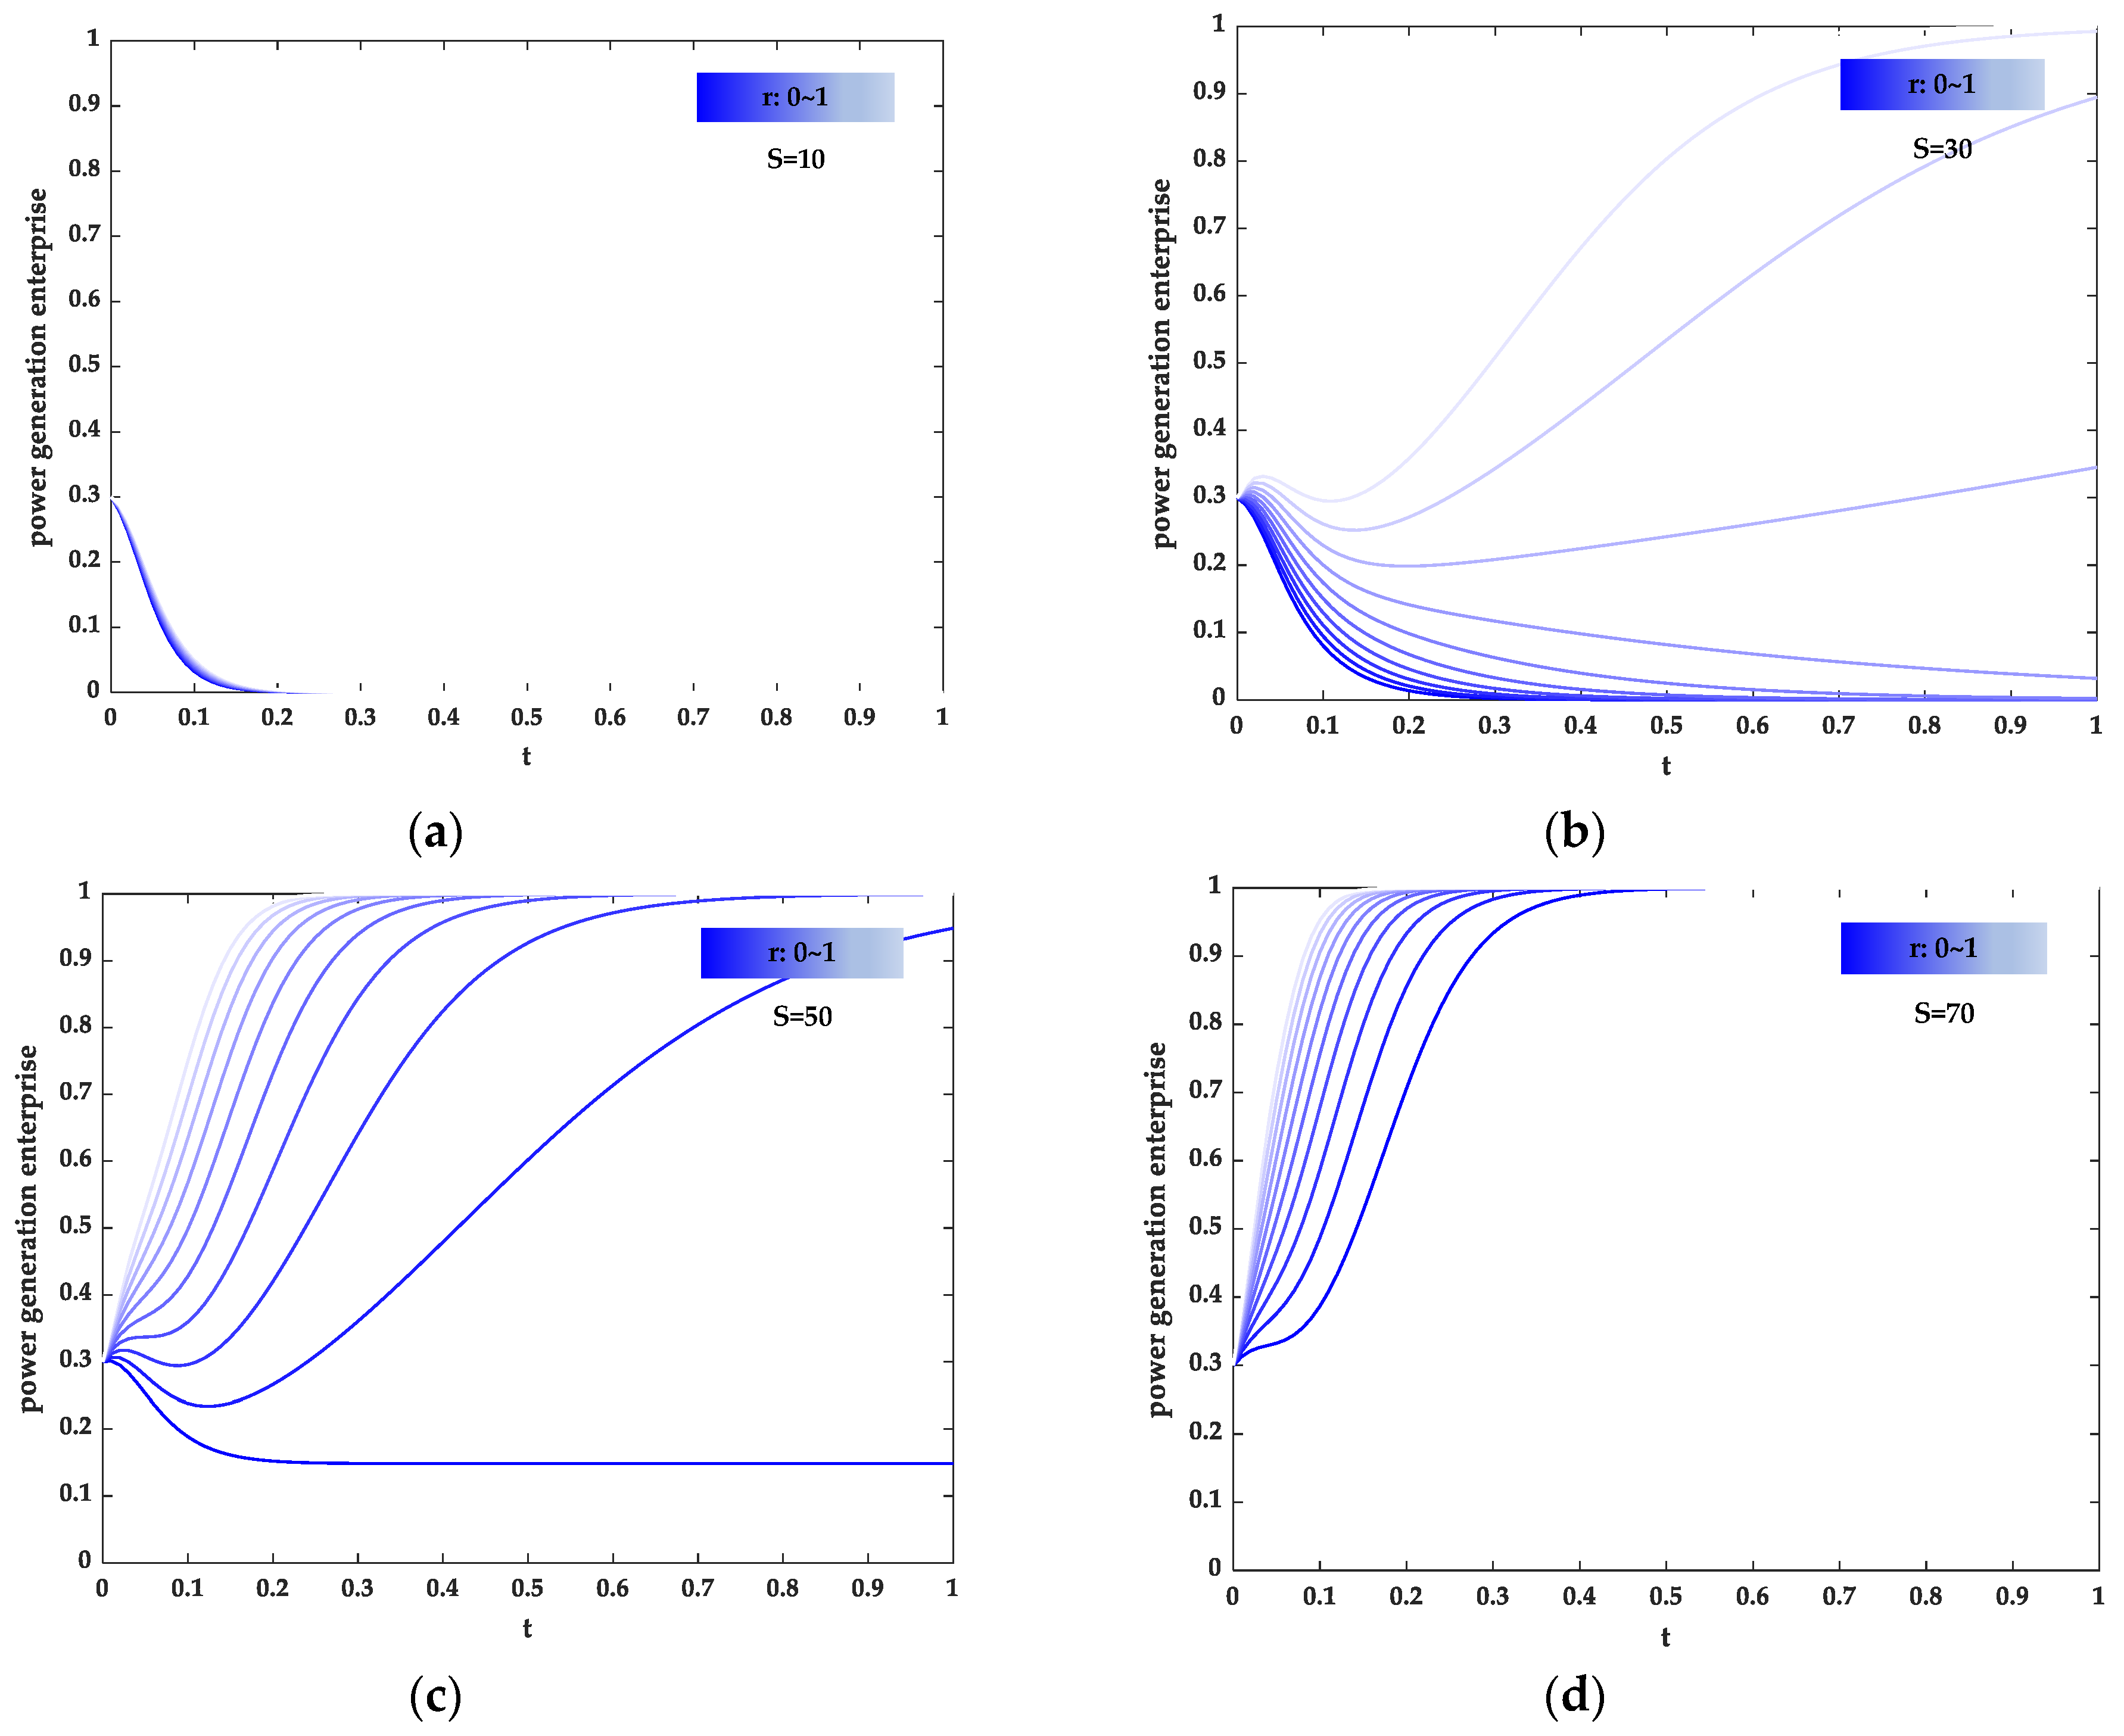
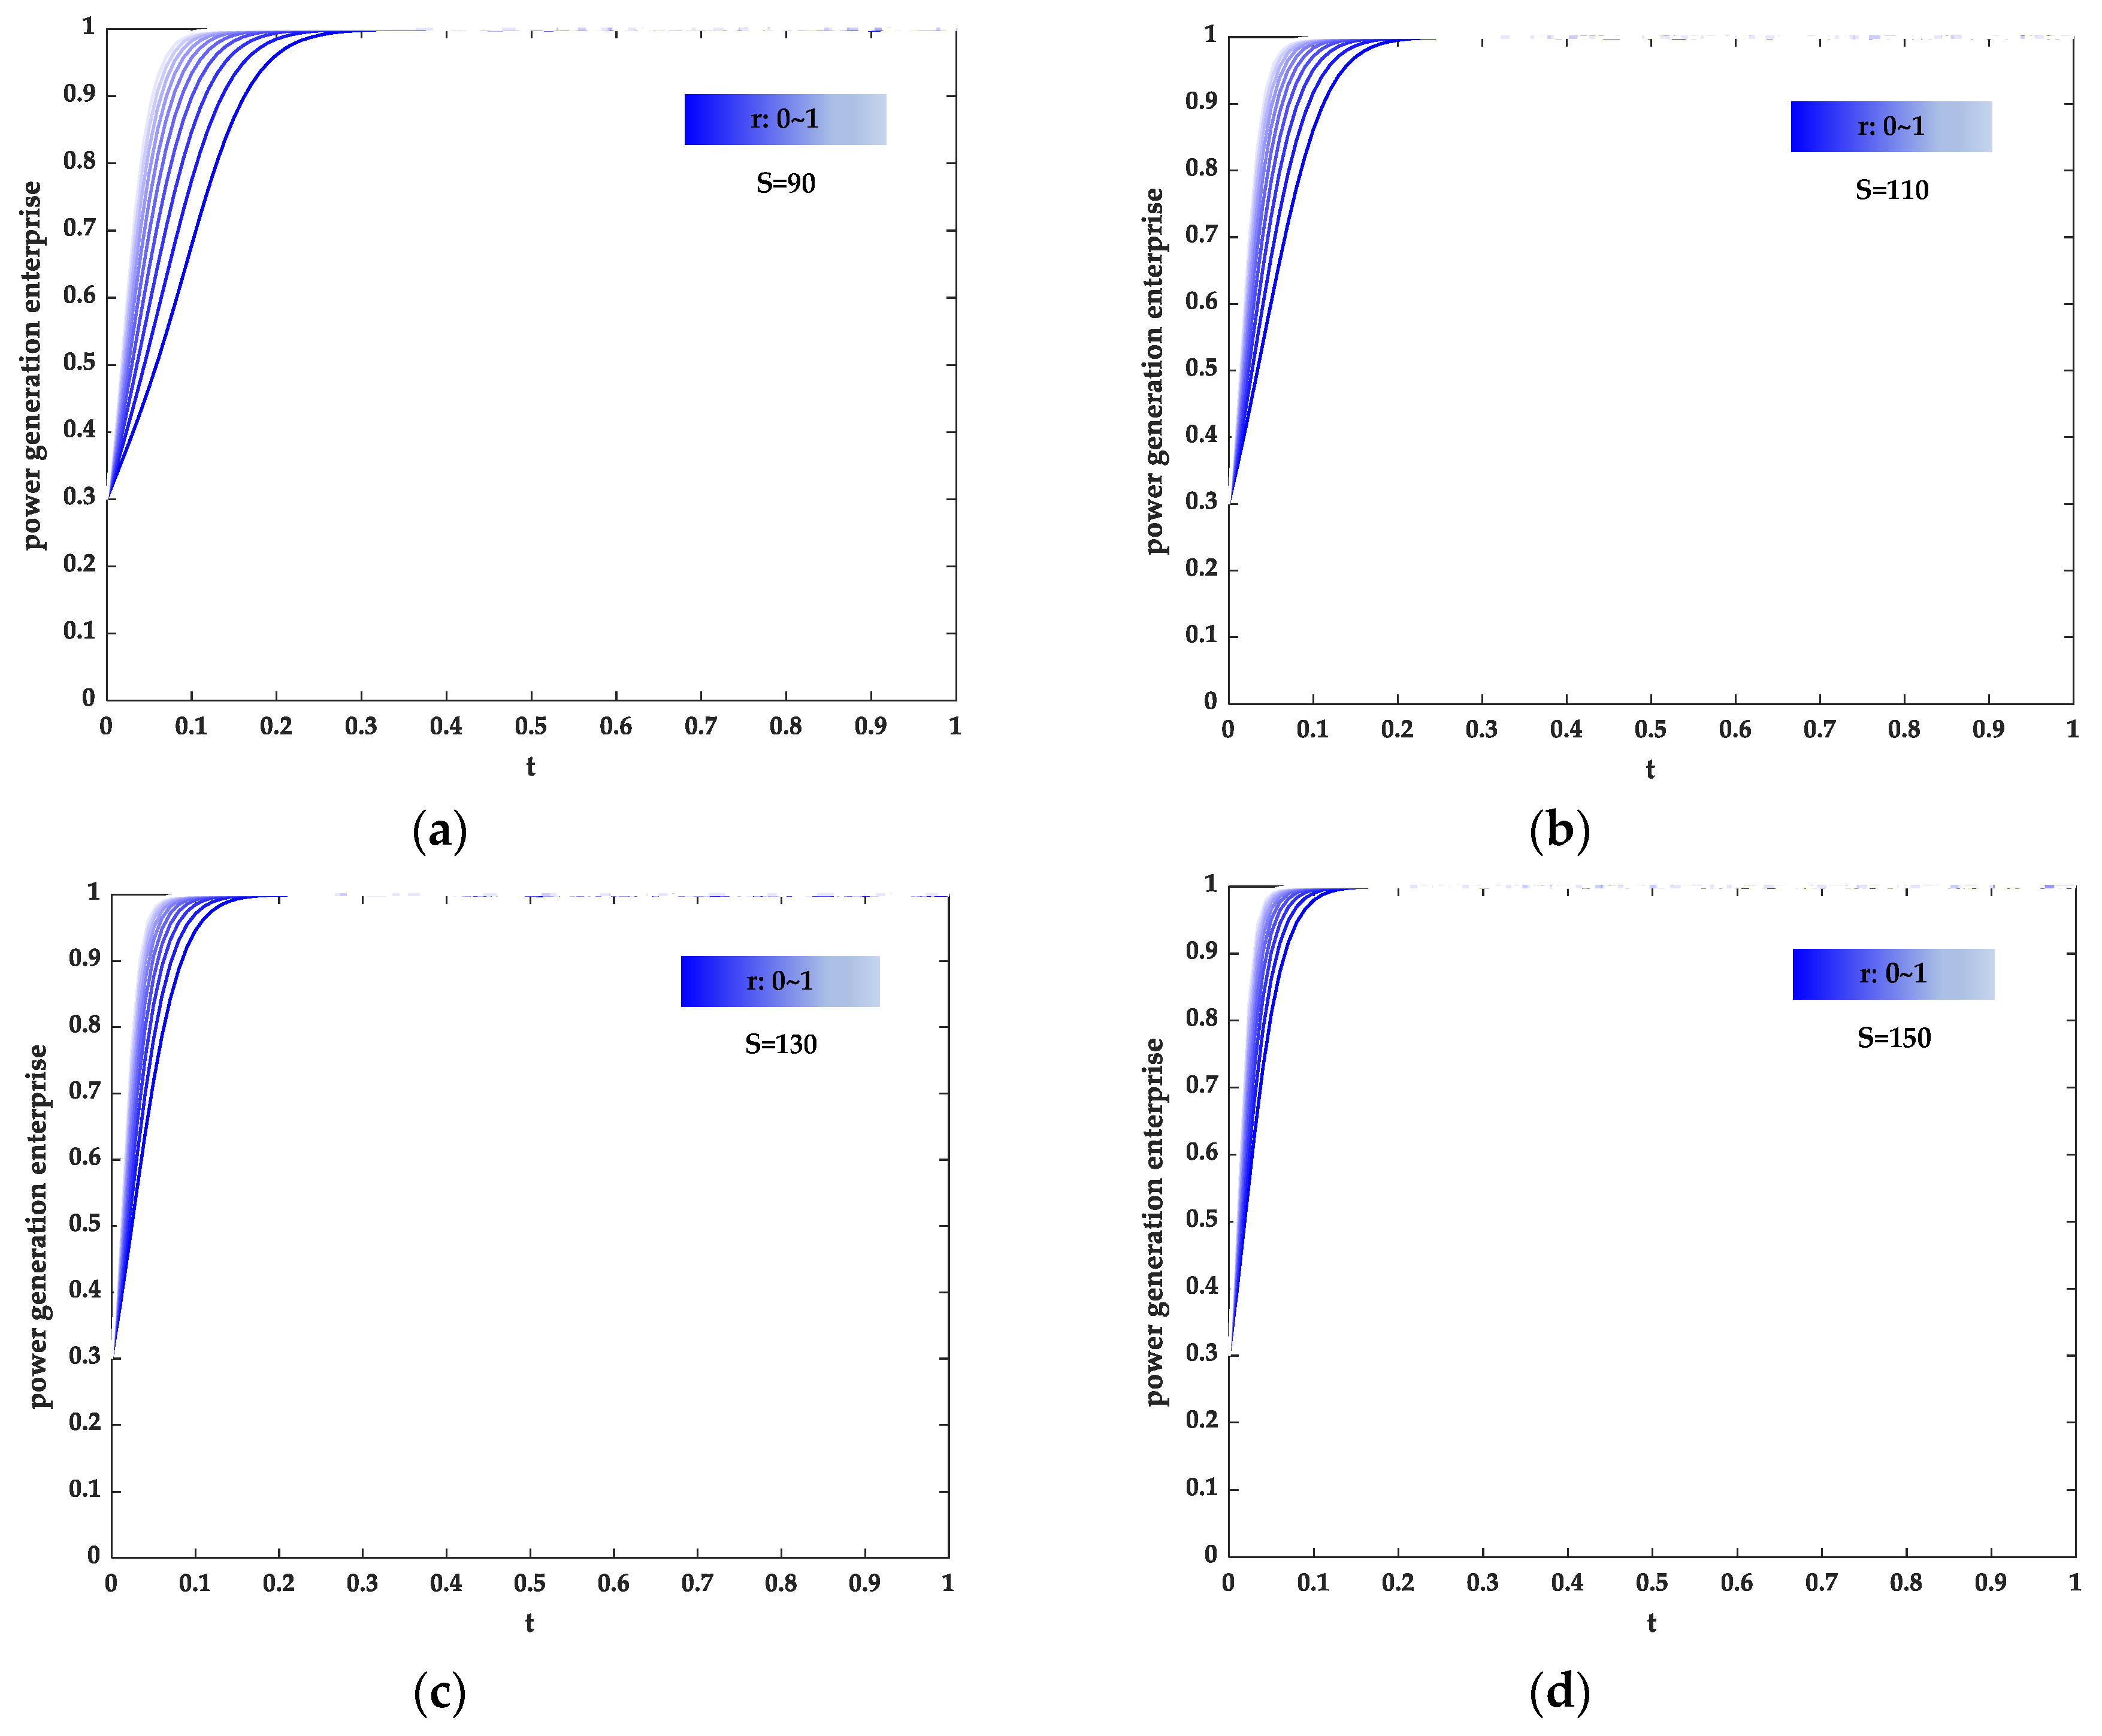
4.3. The Influence of the Central Government’s Financial Subsidy Scale

The reduction of subsidies for renewable energy is an important topic. In this section, we will examine how the size of subsidies for renewable energy affects the transition of power producers to a more sustainable energy mix.
Under the condition that the initial strategy probabilities of the three gamers in the evolution game are x 0 = 0.5 , y 0 = 0.5 , and z 0 = 0.3 , the influence of the central government subsidy scale on the strategies of the central government, local governments, and power generation enterprises is investigated. According to the signs of the eigenvalues of the game model at each local equilibrium point shown in Table 3 and Table 4, the range of values of S can be considered in the following three situations: S > R 0 , S < R 0 and S + R 1 > 0 , S + R 1 < 0 . Under the condition that other parameters are constant, while S is 30, 70, and 110, respectively, the results of the evolutionary game are shown in Figure 7.
Figure 7 indicates that the likelihood of receiving financial subsidies from the central government decreases as the evolutionary game progresses. Consequently, the rate at which the central government’s strategy evolves also decreases as the financial subsidy scale tightens. The figure also highlights how the fiscal subsidy scale impacts the outcome of the evolution. Specifically, when all other parameters remain constant, Figure 7a demonstrates that the system stability points do not shift as the fiscal subsidy scale decreases.
Specifically, when S = 3 0, S + R 1 < 0 , it is difficult for financial subsidies to make up the cost difference between thermal and renewable power generation. However, because the central government adopts an effective incentive strategy for local governments, the incentive for local governments to take the initiative to adopt a regulatory strategy is high. So, the power market can conduct green certificate trading to help the implementation of renewable energy consumption responsibility.
When S = 70 , S < R 0 , and S + R 1 > 0 , although the financial subsidies can make up the cost difference, the green power enterprises will prefer to obtain green revenue by selling green certificates because they have more profit space through green certificate trading.
When S = 110 , S > R 0 , the power generation enterprises have more profit space through financial subsidies, and at this time, the rate that power generation enterprises evolve to the green power strategy is the fastest. Meanwhile, the central government is under significant financial pressure and evolving to the no financial subsidy strategy at the fastest rate.
At the start of the process, providing significant financial subsidies can help accelerate the shift towards environmentally friendly power generation companies. This will aid in the successful growth of the energy market.
Despite the decreasing fiscal subsidy scale, the development of the renewable energy industry will continue forward without a reversal. The green transformation process of power generation companies may experience a slowdown but will still achieve stability in their green power strategy.
As shown in Figure 7, although the evolutionary rate of green transformation of power generation enterprises decreases with the declining scale of fiscal subsidies, it is not apparent relative to the changes in the evolutionary rate of the central government and local governments. All in all, under the background of fiscal subsidies retreat and assessment system of responsibility for renewable energy consumption, green power certificate trading can effectively alleviate the problem of excessive dependence of the renewable energy industry on subsidies and promote the healthy and sustainable development of the renewable energy industry.
Figure 7 illustrates that the rate of green transformation in power generation companies decreases as fiscal subsidies decrease. However, this decrease is insignificant compared to the changes in the evolutionary rate of central and local governments. Overall, in the context of reduced fiscal subsidies and the assessment system for renewable energy consumption responsibility, trading green power certificates can effectively address the over-reliance of the renewable energy industry on subsidies and promote its healthy and sustainable development.

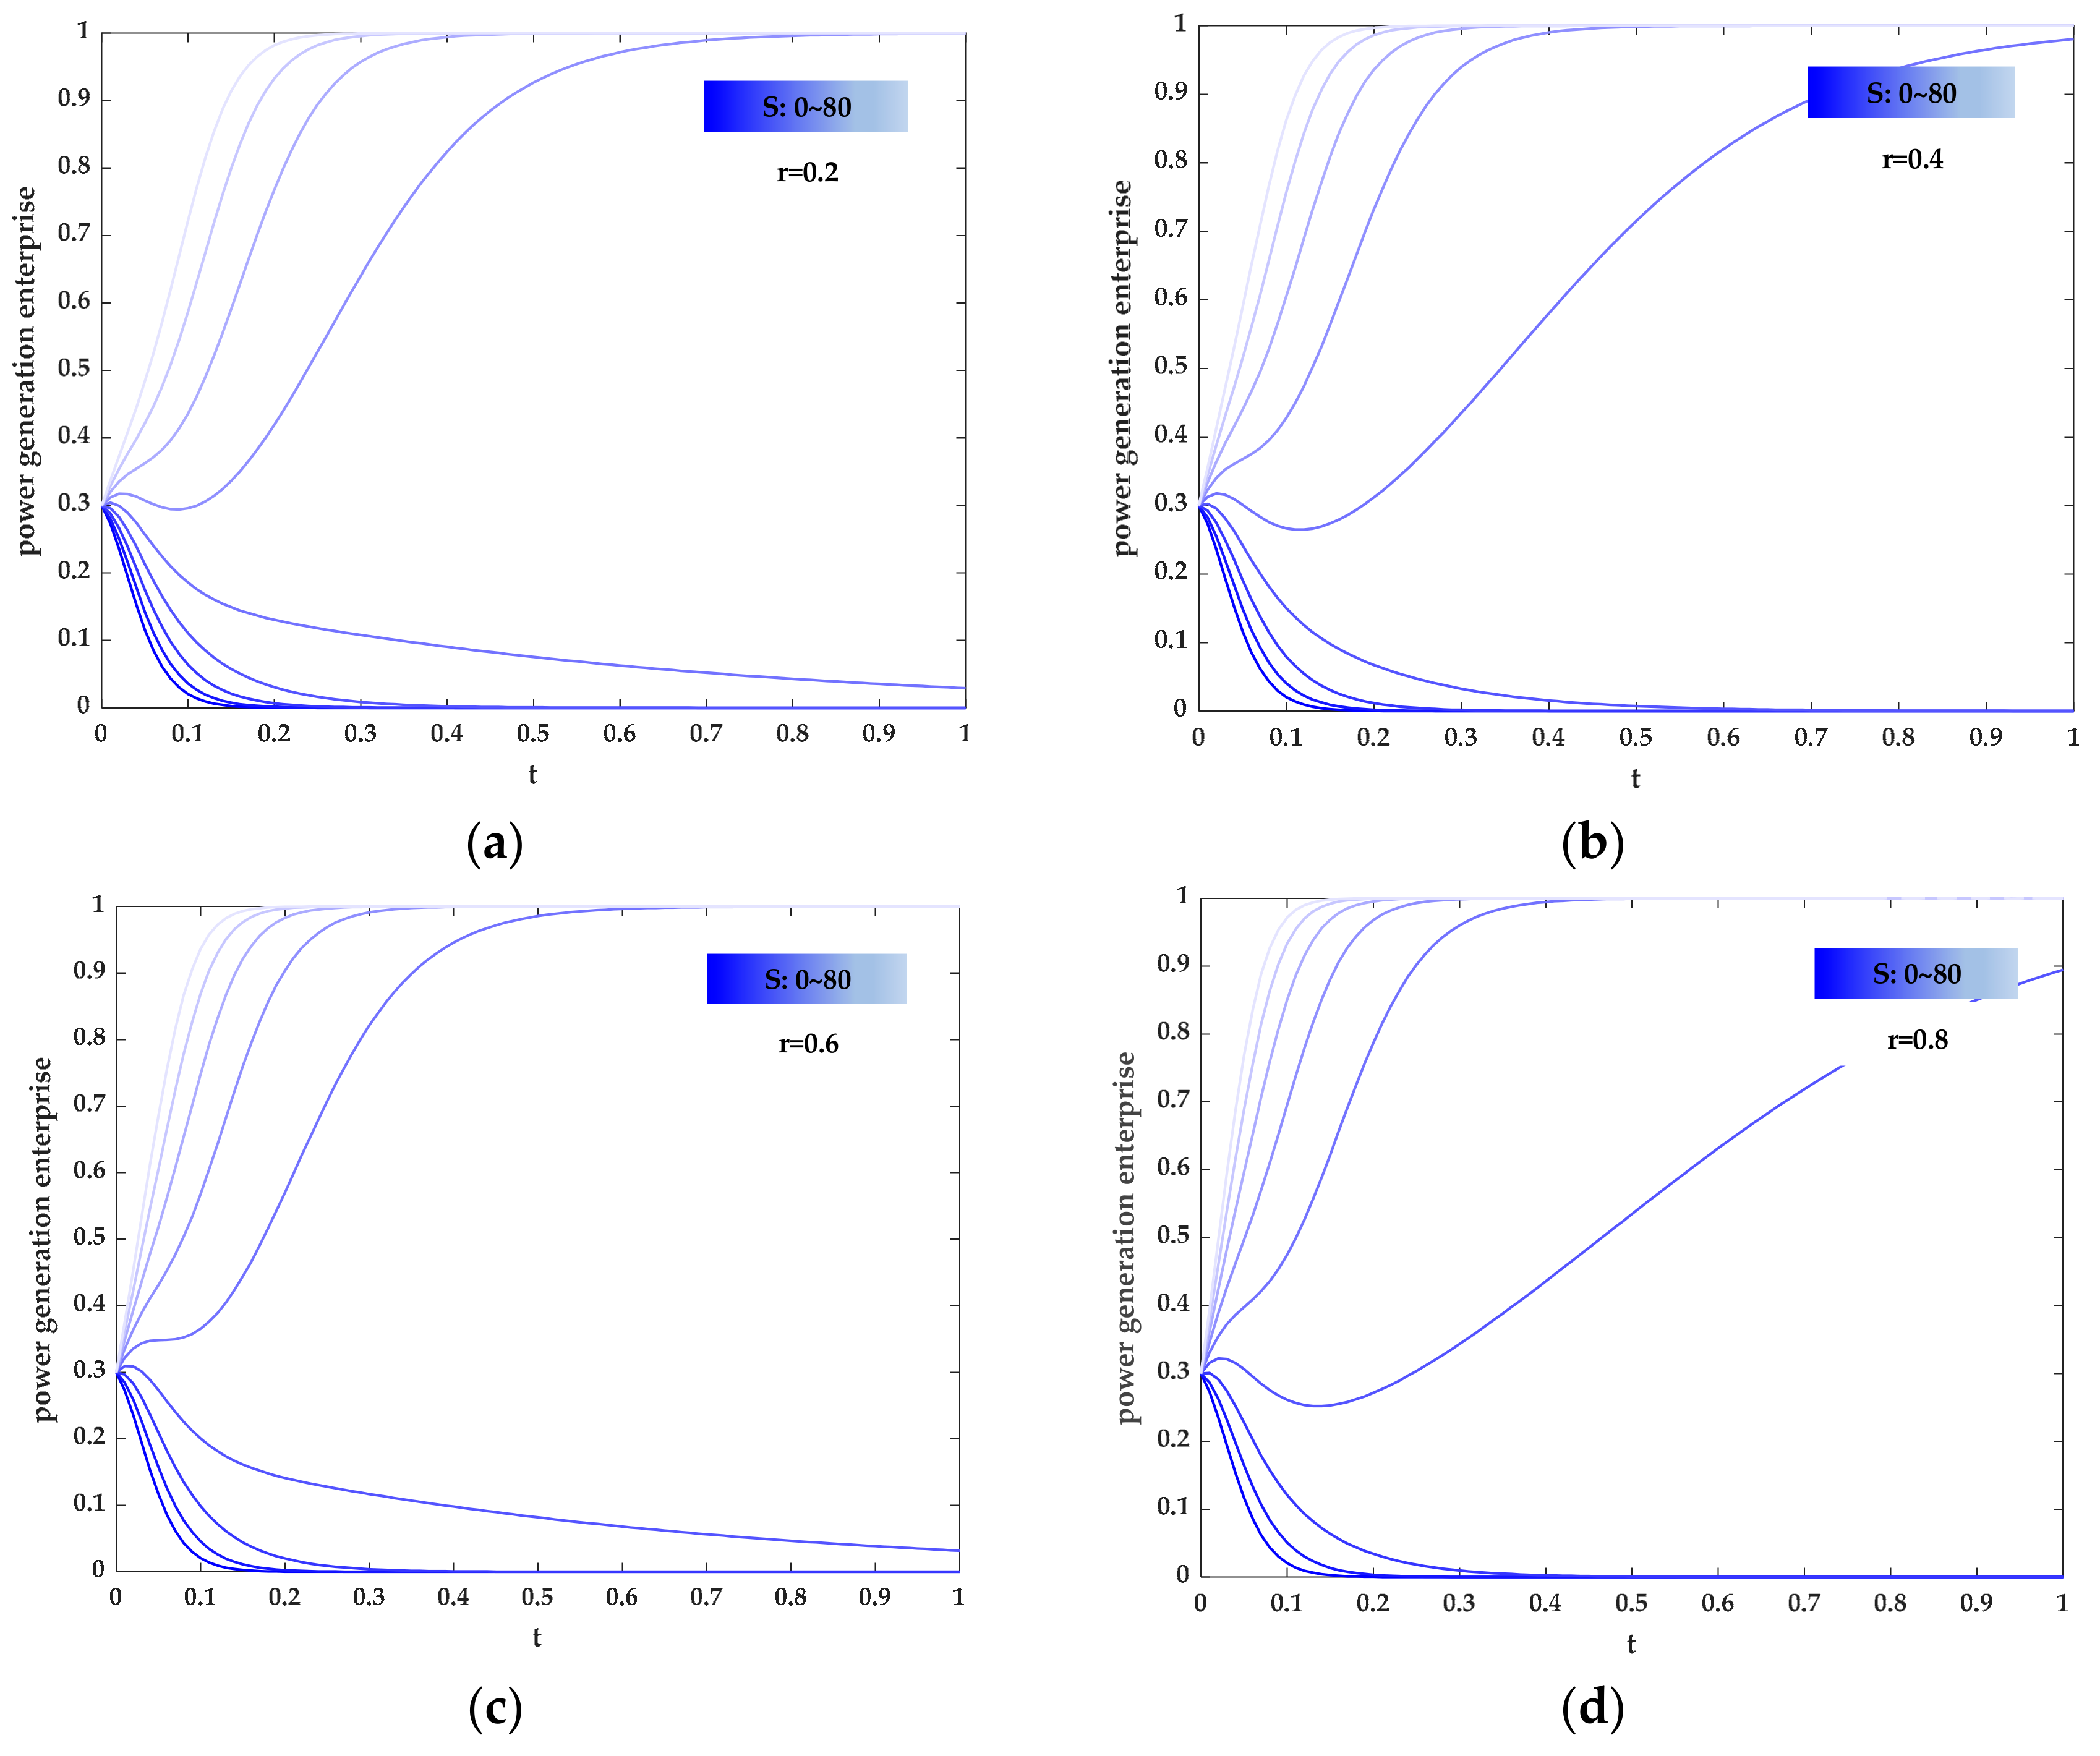
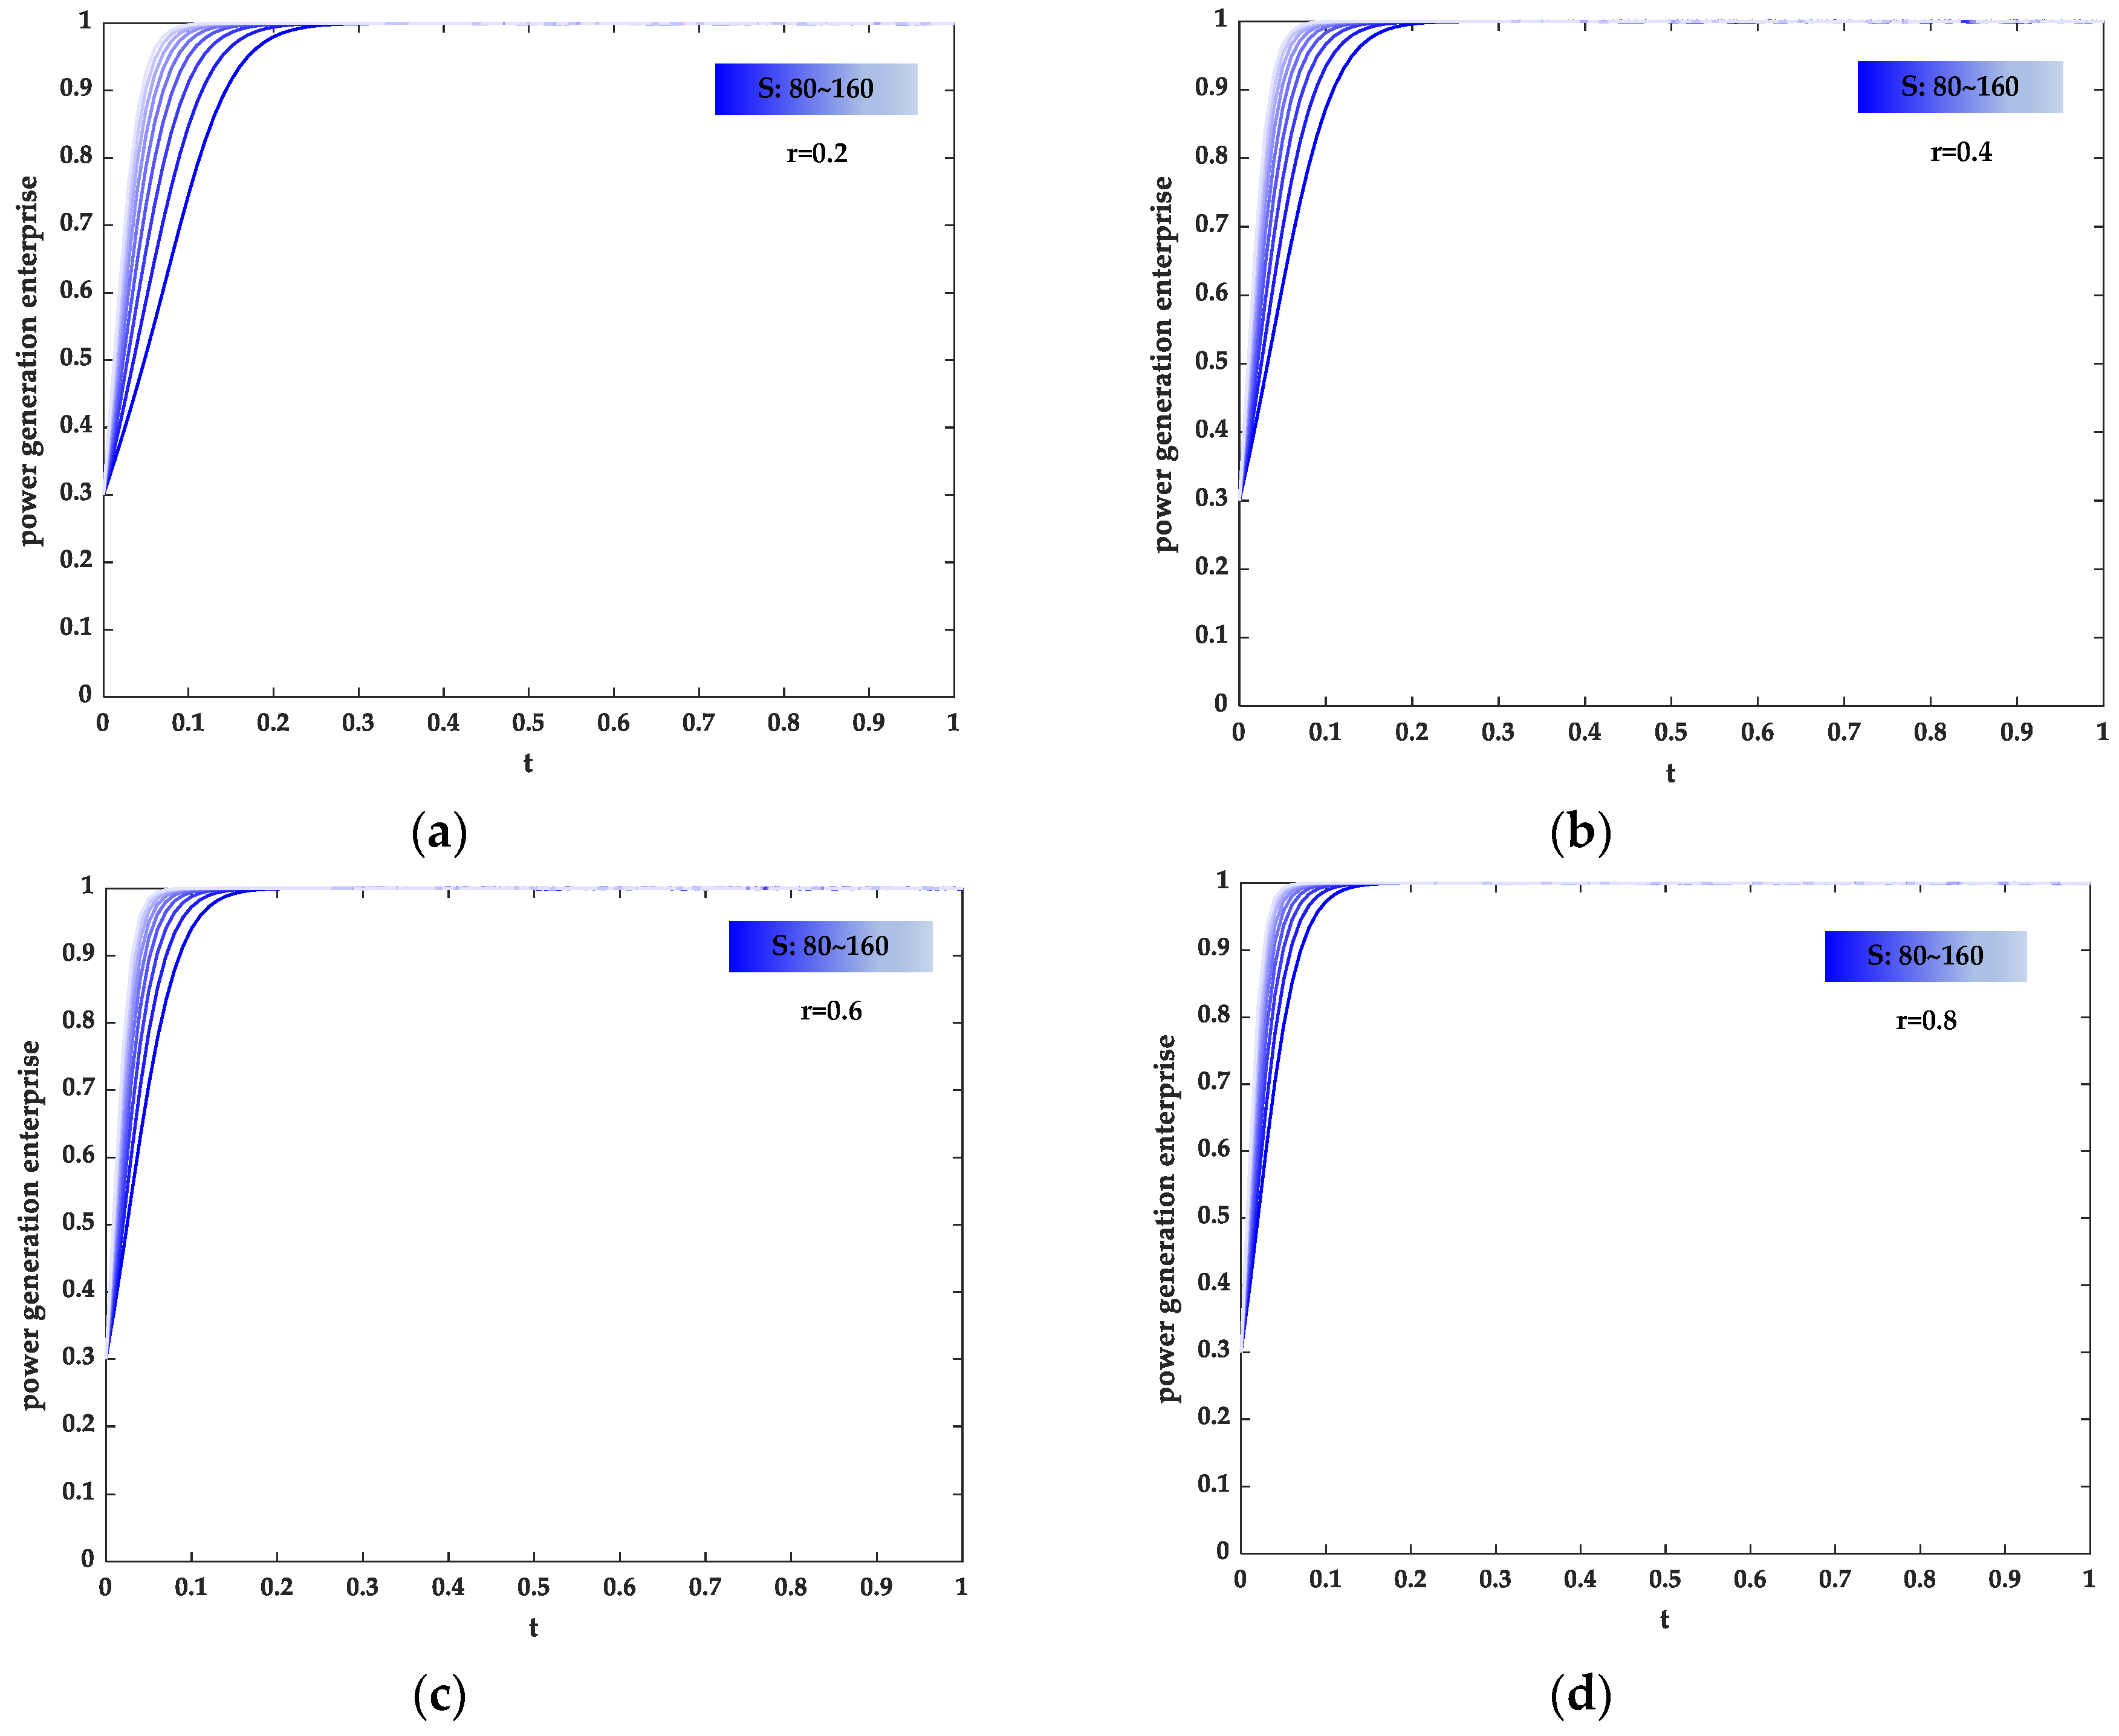
4.4. The Impact of Green Power Certificate Trading on the Strategy of the Evolutionary Game

Encouraging local governments to take responsibility for green initiatives and promoting the adoption of renewable energy can be incentivized through effective assessment mechanisms. Additionally, improving the trading market for green power certificates can accelerate companies’ transition towards sustainable power generation practices.
By analyzing the functional equation of the eigenvalues at the local equilibrium point, we have determined that the stability of said point is influenced by factors such as the trading price of green power certificates and the distribution of green certificate prices between thermal power enterprises and consumers. Specifically, we have assumed that the price of green certificates is shared between these two groups.
Based on the average price of green power certificates traded on the green power certificate trading platform in 2021, the profit per kWh through green certificate trading is about $0.08, which is higher than the level of electricity price subsidy from the central government for renewable energy subsidies.
According to PwC’s Global Consumer Insights Research 2022 China report, about 45% of respondents are willing to pay more than the average selling price for products made from recyclable, sustainable, or environmentally friendly materials.
While there has been a rise in awareness among Chinese consumers about environmentally friendly consumption, they still need to be inclined to pay extra for renewable energy. Green certificates are still predominantly subscribed to by companies. Based on the subscription records listed on the green certificate subscription platform in November 2022, the highest individual subscriber had 1343 green certificates subscribed. Meanwhile, the top corporate subscriber acquired 432,500 green certificates.
To sum it up, China is currently experiencing a challenge of costly green certificates and limited consumer participation. The country has a strong reliance on institutional and policy support for green certificate subscriptions.
Figure 8 reveals six scenarios with r = 0 ,   0.5 ,   1 for the high and low green certificate price scenarios. According to H3, the generating companies in the electricity market, either thermal or green, have the same generation capacity, and the market is assumed to be cleared. Each generating company has equal generation capacity, and when the green certificate price is high, it means there is a high demand for green certificates according to R 0 = P T G C × q . Therefore, R 0 = 85 in the initial parameter setting is the high green certificate price scenario.
According to Figure 8, the system will be stable at (0, 1, 1) in the high green certificate price scenario, regardless of the value of the apportionment ratio r . That is, the evolutionary game will be stable on the combined strategy of no subsidy strategy by the central government, the local government’s regulatory strategy, and the generating companies’ green power strategy.
When R 0 = 40 , R 0 < S , it is in the low green certificate price scenario. When the apportionment ratio is 1 and 0.5, the system is stable at (0, 1, 1), the same as the system stability point of the high green certificate price case.
However, when the apportionment ratio is further reduced to 1 + r R 0 + R 1 < 0 , the system will stabilize at (0, 1, 0). Such as the scenario with R 0 = 40 , r = 0 in Figure 8, the evolutionary game will stabilize on the combined strategy of no subsidy strategy by the central government, regulatory strategy by the local government, and thermal power strategy by the generators.
This suggests that if the value of P T G C or r is too low and green energy companies are unable to offset their cost disadvantage through green certificate trading, power producers may shift towards using thermal energy.
Because the sharing ratio r is challenging to observe, setting a minimum price for green certificate trading makes sense, even though a high price will discourage electricity market participants from purchasing green certificates. Implementing a minimum price for trading green certificates can prevent system instability in thermal power strategies and facilitate the transition towards green power generation.
To further explore the impact of green power certificate price and allocation ratio on the transformation of power generation enterprises, we conducted a more detailed study according to the situation in the following research.
As shown in Figure 9 and Figure 10, no matter the scenario of a high green power certificate price or low green power certificate price, in the case of a specific price of green power certificate, increasing the allocation ratio r is more conducive to the transformation of power generation enterprises.
As shown in Figure 11 and Figure 12, no matter in the scenario of a high green power certificate price or low green power certificate price, in the case of a specific allocation ratio r , increasing the price of a green power certificate is more conducive to the transformation of power generation enterprises.
As shown in Figure 13, the energy structure evolution of power generation enterprises partially overlaps in the scenario of high green power certificate price and low green power certificate price. The high green power certificate price scenario is not utterly superior to the low green power certificate price scenario.
At the same time, increasing the price and allocation ratio of green power certificates will bring a heavy burden to thermal power enterprises. While appropriately reducing the price of green power certificates, emphasizing the implementation of green responsibility of thermal power enterprises can also promote the green transformation of the energy structure of power generation enterprises.

5. Conclusions and Policy Implications

5.1. Conclusions

Aiming at the problem of how to promote green transformation, this paper constructs an evolutionary game model to explore the strategic choices of power generation enterprises under government regulation and subsidies. The main findings are as follows:
(i)
The central and local governments have different roles in promoting sustainable energy. The central government should provide incentives for renewable energy consumption while considering the impact on local governments.
(ii)
Financial subsidies can boost renewable energy growth, but they are not a long-term solution. Sustainable progress can be challenging to achieve.
(iii)
The model is simulated under the scenario of decreasing the scale of renewable electricity subsidies. Renewable electricity consumption systems can counteract decreased subsidies for green transformation, but they require efficient incentives and penalties from the central government.
(iv)
In the analysis of different scenarios of green power certificate trading approaches, we find that reducing green power certificate prices will not hinder the ongoing shift towards a more sustainable energy structure for power generation companies. In fact, if power generation companies are able to share the cost of green power certificates, it could lead to a greater promotion of green energy transformation within the industry.

5.2. Policy Implications

To promote the realization of sustainable energy development and achieve the carbon peaking and carbon neutrality goals under the background of responsibility assessment of renewable energy consumption, this paper suggests perspectives of the central government, the local government, and power generation enterprises, respectively:
(i)
The central government takes macro control and focuses on stimulating the potential of individual market players. To promote an energy supply and consumption revolution, the central government must assert its role as a manager and exercise better macro control of the energy market. It should also mobilize different market players to participate in this effort. In addition to pollution control, environmental issues should be addressed at the source, and all market players should adopt a green mindset and assume greater responsibility for the environment.
(ii)
Local governments are supposed to take up the responsibility to help establish an excellent green power certificate trading market. Local governments can leverage their regional strengths by implementing strategic planning and fostering open communication with power generation companies, power consumers, and other market participants. This can help to streamline operations and promote growth in the renewable energy industry.
(iii)
As a power generation enterprise, it is important to overcome challenges and conquer major technical obstacles in key areas. By implementing technical innovation, power generation enterprises can lower the cost of renewable energy generation and enhance the utilization rate of electric energy. It is crucial to achieve technical breakthroughs in producing equipment and materials that possess high added value and advanced technology to overcome the challenge of being outpaced by other countries.

Author Contributions

Conceptualization, Q.L. and J.S.; methodology, Q.L. and J.S.; software, J.S.; validation, Q.L. and J.S.; formal analysis, Q.L. and J.S.; investigation, Q.L. and J.S.; resources, Q.L. and J.S.; data curation, Q.L. and J.S.; writing—original draft preparation, Q.L. and J.S.; writing—review and editing, Q.L. and J.S.; visualization, Q.L. and J.S.; supervision, Q.L. and J.S.; project administration, Q.L. and J.S.; funding acquisition, Q.L. and J.S. All authors have read and agreed to the published version of the manuscript.

Funding

This research was funded by the National Social Science Fund of China, grant number 21AJY005.

Institutional Review Board Statement

Not applicable.

Informed Consent Statement

Not applicable.

Data Availability Statement

Not applicable.

Acknowledgments

The authors would like to thank the National Social Science Fund of China for funding the publication.

Conflicts of Interest

The authors declare no conflict of interest.

References

  1. Jiang, Z.M. Reflections on Energy Issues in China. J. Shanghai Jiaotong Univ. 2008, 3, 345–359. [Google Scholar] [CrossRef]
  2. Li, B.Q. Research of Financial Policy and taxations to Promote Renewable Energy Development—Focus on Analysing Renewable Power Energy. Res. Inst. Fisc. Sci. 2010, 112–164. [Google Scholar]
  3. Wang, S.Y.; Bai, Z.H.; Lü, L.; Luo, H. Evaluation of China’s biomass power generation subsidy policy based on policy tools. J. Environ. Eng. Technol. 2021, 6, 1241–1249. Available online: https://kns.cnki.net/kcms/detail/11.5972.X.20210707.1801.010.html (accessed on 11 November 2022).
  4. Zou, C.N.; Zhao, Q.; Zhang, G.S.; Xiong, B. Energy evolution: From a fossil energy era to a new energy era. Nat. Gas Ind. 2016, 1, 1–10. Available online: https://kns.cnki.net/kcms/detail/51.1179.te.20160125.1326.002.html (accessed on 11 November 2022).
  5. Mortimer, N.D.; Grant, J.F. Evaluating the prospects for sustainable energy development in a sample of Chinese villages. J. Environ. Manag. 2008, 87, 276–286. [Google Scholar] [CrossRef]
  6. Tsao, Y.C.; Thanh, V.V.; Chang, Y.Y.; Wei, H.H. COVID-19; Government subsidy models for sustainable energy supply with disruption risks. Renew. Sustain. Energy Rev. 2021, 150, 111425. [Google Scholar] [CrossRef]
  7. Yu, B.; Fang, D.; Kleit, A.N.; Xiao, K. Exploring the driving mechanism and the evolution of the low-carbon economy transition: Lessons from OECD developed countries. World Econ. 2022, 45, 2766–2795. [Google Scholar] [CrossRef]
  8. Zhang, H.L. Research on the New Energy Development in China. Ph.D. Thesis, Jilin University, Changchun, China, 2014. [Google Scholar]
  9. Pan, Y.; Dong, F. Green finance policy coupling effect of fossil energy use rights trading and renewable energy certificates trading on low carbon economy: Taking China as an example. Econ. Anal. Policy 2023, 77, 658–679. [Google Scholar] [CrossRef]
  10. Yang, W.X. The Effects of Price Premium Policies on Emission Reduction and Innovation in the Electricity Industry. Ph.D. Thesis, Zhejiang University, Hangzhou, China, 2022. [Google Scholar] [CrossRef]
  11. Huang, B.B.; Zhang, Y.Z.; Wang, C.X. New Energy Development and Issues in China during the 14th Five-Year Plan. Electr. Power 2020, 1, 1–9. [Google Scholar]
  12. Nie, H.G.; Liu, Q.S.; Mo, J.L. Incentive Policies and Development Path of China’s Renewable Energy Power under the Background of Declining Subsidy—A Study Using Comprehensive Levelized Cost of Electricity (CLCOE) Model. J. China Univ. Geosci. Soc. Sci. Ed. 2022, 6, 66–81. [Google Scholar] [CrossRef]
  13. Wu, Q.L.; Xi, M. Research on Effects of Renewable Energy Policy Based on Power Supply Chain Game. Electr. Power 2022, 5, 12–20, 38. [Google Scholar]
  14. Xu, J.; Gao, Y.; Liu, K.P.; Wang, M.; Ma, B.; Li, Y.; Wen, Y.; Liu, D. Study on the Influence of Cooptation Strategy of Thermal Power and Green Power on Market Equilibrium and Bargaining Power—Game Analysis of Market Behavior of Power Producers Based on the Weight of Renewable Energy Consumption Responsibility. Price Theory Pract. 2022, 12, 139–143. [Google Scholar] [CrossRef]
  15. Chai, R.R.; Li, G. Renewable Clean Energy and Clean Utilization of Traditional Energy; An Evolutionary Game Model of Energy Structure Transformation of Power Enterprises. Syst. Eng. Theory Pract. 2022, 1, 184–197. [Google Scholar]
  16. Shao, B.L.; Hu, L.L. A Game Analysis of the Evolution of Participation Behavior of Green Supply Chain——A Study Based on the System Dynamics Perspective. Sci. Res. Manag. 2021, 11, 171–181. [Google Scholar] [CrossRef]
  17. Dong, Z.J.; Yu, X.Y.; Chang, C.T.; Zhou, D.Q.; Sang, X.Z. How does feed-in tariff and renewable portfolio standard evolve synergistically? An integrated approach of tripartite evolutionary game and system dynamics. Renew. Energy 2022, 186, 864–877. [Google Scholar] [CrossRef]
  18. Sun, Z.; Wang, W.; Zhu, W.; Ma, L.; Dong, Y.; Lu, J. Evolutionary game analysis of coal enterprise resource integration under government regulation. Environ. Sci. Pollut. Res. Vol. 2022, 29, 7127–7152. [Google Scholar] [CrossRef]
  19. Tao, Y.C.; Qiu, J.; Lai, S.Y.; Zhao, J.H. Renewable energy certificates and electricity trading models; Bi-level game approach. Int. J. Electr. Power Energy Syst. 2021, 130, 106940. [Google Scholar] [CrossRef]
  20. Wang, X.J.; Quan, J.; Liu, W.B. Study on evolutionary games and cooperation mechanism within the framework of bounded rationality. Syst. Eng. Theory Pract. 2011, S1, 82–93. Available online: https://kns.cnki.net/kcms/detail/detail.aspx?FileName=XTLL2011S1014&DbName=CJFQ2011 (accessed on 14 November 2022).
  21. Friedman, D. Evolutionary economics goes mainstream: A review of the theory of learning in games. J. Evol. Econ. 1998, 8, 423–432. [Google Scholar] [CrossRef]
  22. Yu, B.; Fang, D.; Xiao, K.; Pan, Y. Drivers of renewable energy penetration and its role in power sector’s deep decarbonization towards carbon peak. Renew. Sustain. Energy Rev. 2023, 178, 113247. [Google Scholar] [CrossRef]
  23. Li, L.; Nie, Y.; Zhi, J.; Zhang, G.X. Game Analysis on the Consumption of Renewable Energy under the Government Supervision. J. China Univ. Pet. Ed. Soc. Sci. 2021, 1, 1–10. [Google Scholar] [CrossRef]
  24. Qu, G.H.; Yang, L.; Qu, W.H.; Li, Q.M. Game Model to Analyze Strategy Options between Government Regulation and Public Supervision under in the Third Party International Environmental Audit. Chin. J. Manag. Sci. 2021, 4, 225–236. [Google Scholar] [CrossRef]
  25. Zhou, Y.L.; Yuan, H.Y. Economic Evaluation of Coal Power Generation and Photovoltaic Power Generation Technologies in China. J. Technol. Econ. Manag. 2014, 12, 97–102. Available online: https://kns.cnki.net/kcms/detail/detail.aspx?FileName=JXJG202012017&DbName=CJFQ2020 (accessed on 14 November 2022).
  26. Zhao, M.; Zhao, G.H. Environmental Regulation; Local Government and Green Responsibility Behavior of Resource-Based Enterprises—Game Analysis Based on Foucault’s Power Thought and Government Enterprise Interaction. J. Stat. 2014, 4, 12–27. [Google Scholar] [CrossRef]
Figure 1. Feed-in tariff policy.
Sustainability 15 10512 g001
Figure 2. The mechanism for accommodating power generated from renewable energy.
Sustainability 15 10512 g002
Figure 3. Research framework.
Sustainability 15 10512 g003
Figure 4. Schematic diagram of the evolution under the initial parameter setting. (a) Description of a 3D evolutionary game diagram; (b) Description of 2D evolutionary game diagrams.
Sustainability 15 10512 g004
Figure 5. Results of the evolutionary game with different y 0 for x 0 = 0.9 . (a) Description of a 3D evolutionary game diagram; (b) Description in the y z perspective.
Sustainability 15 10512 g005
Figure 6. Results of the evolutionary game with different y 0 and x 0 . (a) Description of evolutionary paths of y ; (b) Description of evolutionary paths of z .
Sustainability 15 10512 g006
Figure 7. Tripartite strategy under different financial subsidy scales. (a) Description of a 3D evolutionary game diagram; (b) Description of evolutionary paths of x ; (c) Description of evolutionary paths of y ; (d) Description of evolutionary paths of z .
Sustainability 15 10512 g007
Figure 8. Effect of green power certificate price and apportionment ratio on evolutionary results. (a) Description of a 3D evolutionary game diagram; (b) Description of evolutionary paths of x ; (c) Description of evolutionary paths of y ; (d) Description of evolutionary paths of z .
Sustainability 15 10512 g008
Figure 9. Effect of apportionment ratio on evolutionary results under the scenario of low price of TGCs. (a) Description of evolutionary paths of z when S = 10 ; (b) Description of evolutionary paths of z when S = 30 ; (c) Description of evolutionary paths of z when S = 50 ; (d) Description of evolutionary paths of z when S = 70 .
Sustainability 15 10512 g009
Figure 10. Effect of apportionment ratio on evolutionary results under the scenario of high price of TGCs. (a) Description of evolutionary paths of z when S = 90 ; (b) Description of evolutionary paths of z when S = 110 ; (c) Description of evolutionary paths of z when S = 130 ; (d) Description of evolutionary paths of z when S = 150 .
Sustainability 15 10512 g010
Figure 11. Effect of green power certificate price on evolutionary results under the scenario of low price of TGCs. (a) Description of evolutionary paths of z when r = 0.2 ; (b) Description of evolutionary paths of z when r = 0.4 ; (c) Description of evolutionary paths of z when r = 0.6 ; (d) Description of evolutionary paths of z when r = 0.8 .
Sustainability 15 10512 g011
Figure 12. Effect of green power certificate price on evolutionary results under the scenario of high price of TGCs. (a) Description of evolutionary paths of z when r = 0.2 ; (b) Description of evolutionary paths of z when r = 0.4 ; (c) Description of evolutionary paths of z when r = 0.6 ; (d) Description of evolutionary paths of z when r = 0.8 .
Sustainability 15 10512 g012
Figure 13. Description of evolutionary paths of z under different R 0 and r .
Sustainability 15 10512 g013
Table 1. The case of low price of TGCs.
V C , V L , V P Power Generation Enterprise
GPSTPS
SubsidyRegulation S C 1 W + E 1 ,
C 2 + W + E 2 ,
P C R × q + S
W + C 1 ,
C 2 + W ,
P C T P T G C × r × q
No regulation S C 1 W + E 1 ,
W + E 2 ,
P C R × q + S
F C 1 ,
F ,
P C T × q
No subsidyRegulation W + E 1 G ,
C 2 + W + E 2 + G ,
P C R + P T G C × q
W G ,
C 2 + W + G ,
P C T P T G C × r × q
No regulation W + E 1 ,
W + E 2 ,
P C R × q
F ,
F ,
P C T × q
Table 2. The case of high price of TGCs.
V C , V L , V P Power Generation Enterprise
GPSTPS
SubsidyRegulation C 1 W + E 1 ,
C 2 + W + E 2 ,
P C R + P T G C × q
W + C 1 ,
C 2 + W ,
P C T P T G C × r × q
No regulation S C 1 W + E 1 ,
W + E 2 ,
P C R × q + S
F C 1 ,
F ,
P C T × q
No subsidyRegulation W + E 1 G ,
C 2 + W + E 2 + G ,
P C R + P T G C × q
W G ,
C 2 + W + G ,
P C T P T G C × r × q
No regulation W + E 1 ,
W + E 2 ,
P C R × q
F ,
F ,
P C T × q
Table 3. The eigenvalues when S > P T G C × q .
Equilibrium PointThe Eigenvalue 1The Eigenvalue 2The Eigenvalue 3
0 ,   0 ,   0 C 1 G C 2 + K R 1
0 ,   0 ,   1 C 1 S G C 2 R 1
0 ,   1 ,   0 G C 1 C 2 G K 1 + r R 0 + R 1
0 ,   1 ,   1 G C 1 S C 2 G 1 + r R 0 R 1
1 ,   0 ,   0 C 1 K C 2 R 1 + S
1 ,   0 ,   1 C 1 + S C 2 R 1 S
1 ,   1 ,   0 C 1 G C 2 K R 1 + S + r R 0
1 ,   1 ,   1 C 1 G + S C 2 R 1 S r R 0
Table 4. The eigenvalues when S < P T G C × q .
Equilibrium PointThe Eigenvalue 1The Eigenvalue 2The Eigenvalue 3
0 ,   0 ,   0 C 1 G C 2 + K R 1
0 ,   0 ,   1 C 1 S G C 2 R 1
0 ,   1 ,   0 G C 1 C 2 G K 1 + r R 0 + R 1
0 ,   1 ,   1 G C 1 C 2 G 1 + r R 0 R 1
1 ,   0 ,   0 C 1 K C 2 R 1 + S
1 ,   0 ,   1 C 1 + S C 2 R 1 S
1 ,   1 ,   0 C 1 G C 2 K 1 + r R 0 + R 1
1 ,   1 ,   1 C 1 G C 2 1 + r R 0 R 1
Table 5. The sign of the eigenvalues and the stability.
Equilibrium PointSignStability
(0, 0, 0) , + , Uncertain
(0, 0, 1) , + , + Uncertain
(0, 1, 0) , , + Uncertain
(0, 1, 1) , , Stable
(1, 0, 0) + , + , + Unstable
(1, 0, 1) + , , Uncertain
(1, 1, 0) + , , + Uncertain
(1, 1, 1) + , + , Uncertain
Disclaimer/Publisher’s Note: The statements, opinions and data contained in all publications are solely those of the individual author(s) and contributor(s) and not of MDPI and/or the editor(s). MDPI and/or the editor(s) disclaim responsibility for any injury to people or property resulting from any ideas, methods, instructions or products referred to in the content.

