
Identifying the Full Carbon Sink of Forest Vegetation: A Case Study in the Three Northeast Provinces of China

1
Ecology and Nature Conservation Institute, Chinese Academy of Forestry, Beijing 100091, China
2
Key Laboratory of Forest Ecology and Environment of National Forestry and Grassland Administration, Beijing 100091, China
3
Dagangshan National Key Field Observation and Research Station for Forest Ecosystem, Xinyu 338033, China
*
Authors to whom correspondence should be addressed.
Sustainability 2023, 15(13), 10396; https://doi.org/10.3390/su151310396
Submission received: 25 April 2023
/
Revised: 25 June 2023
/
Accepted: 29 June 2023
/
Published: 30 June 2023
Abstract
:Accurate analysis of the carbon sink capacity of forest vegetation is particularly important for achieving China’s carbon neutral strategy. In this study, we put forward the concept of the full carbon sink, which includes the sink capacity of forest components carbon sink tree arbors and bushes, sparse forest land, unclosed forest land, other shrubs, nursery, barren mountain shrubs, urban and rural green areas surrounding trees and scattered forests, and forest soil. The plot measurement method was used based on the forest resource inventory data and the plot data of the China Forest Ecosystem Research Network to accurately estimate the full carbon sequestration of forest vegetation in the Three Northeastern Provinces. The results showed that the full carbon sink is 69.45 TgC yr−1, which is equivalent to neutralizing 22% of carbon emissions from energy consumption. Among the three provinces, the vegetation of Heilongjiang Province was the largest carbon sink, accounting for 63% of the total. Regarding the contribution of each component to the full carbon sink, tree arbors accounted for 78%, followed by other forest vegetation at 13%, then soil at 9%. Crop output was the main factor influencing the spatial pattern of the full carbon sink. The full carbon sink of forest vegetation can objectively reflect the important role of forestry in achieving the carbon neutrality strategy.
1. Introduction
With the rapid development of society, excessive emissions of greenhouse gases resulted in severe environmental problems. CO2 makes up the largest portion of these greenhouse gases [1,2]. The Chinese government announced in 2020 that it would achieve carbon neutrality by 2060 [3]. According to the Global Carbon Project, terrestrial ecosystems absorbed 31% of CO2 emissions from fossil fuel combustion during the years 2010–2019 [4]. As important components of terrestrial ecosystems, forests accumulate over 45% of the carbon (C) in the terrestrial biosphere, and thus play a significant role in the global carbon balance [5]. Accurate evaluation of the carbon sink capacity of forest ecosystems is particularly important for achieving the “carbon peaking and carbon neutrality goals”.
There are many methods to estimate the capacity of a forest as a carbon sink, such as plot measurement method, biomass expansion factor (BEF) method, eddy covariance (EC) method and remote sensing (RS) interpretation method. Each of these methods yields different results [6]. Fang et al. estimated the forest biomass carbon storage in China with the BEF method in 2001, the result showed that the carbon accumulation rate was 0.021 PgC per year [7]. Many countries have adopted the BEF method combined with the stock change for reporting carbon stock changes under the United Nations Framework Convention on Climate Change (UNFCCC) and Intergovernmental Panel on Climate Change (IPCC) [8]. However, the BEF method can only be used to roughly estimate a forest carbon sink due to the fact that wood density varies greatly in different regions and for different tree species. Long-term carbon flux observations can provide evidence for understanding the relationship between carbon and climate change [9]. Some researchers [10], using observations from flux data combined with inventory data, estimated the net carbon absorption of semiarid forests to be a large carbon sink. Yu et al., studied the carbon fluxes in terrestrial ecosystems of China with the EC method and found that they had a relatively large C sequestration rate that ranged from 168.8 to 592.4 gC m−2 year−1 [11]. EC is considered an ideal method that can directly measure the carbon dioxide flux between the forest ecosystem and the atmosphere; however, the results are hard to interpret due to the limited observation points and the physical characteristics of carbon dioxide sinking at night. Piao et al. estimated the annual carbon sequestration rate was 0.019 PgC per year using satellite data and the RS method [12]. Yu et al. [13] used integrated meteorological data, remote sensing data, and soil data to simulate changes in soil respiration and the relationship between respiration and the carbon sink process in a terrestrial ecosystem. Kumar et al. [14] estimated the soil organic carbon with the RS method, the results showed that NDVI was a good predictor for soil organic carbon estimation. However, there is still some incompleteness in the theory and technology of the RS method. Based on forest inventory data, Dixon et al. [15] confirmed that terrestrial ecosystems in the Northern Hemisphere are an important carbon sink. Fang et al. [16] and Tang et al. [17] systematically investigated more than 17,000 quadrat data from forests, grasslands, shrubs, farmland, and other ecosystems. They assessed China’s terrestrial ecosystem carbon storage and its changes. They found that the average annual carbon sink on land in China between 2001 and 2010 was 0.201 PgC year−1. Pan et al. [18] used global forest survey data and long-term observation data to reassess the global carbon budget of forests and found that the global total carbon sink of forests was as high as 4.0 PgC year−1. The plot measurement method, however, is the most direct method for measuring a forest carbon sink. Although the measurement process is time-consuming and labor-intensive, carbon stocks in different compartments are estimated at a specific time, and successive measurements at different times provide the opportunity to record changes in C stocks over time, which can lead to direct and accurate calculations of the forest carbon sink [6,19].
A recent study showed that the previous study underestimated the land carbon sink over Southwest China and over Northeast China because of afforestation [20]. The Northeast region of China is an important industrial base with the highest forest cover [21], and this area is also sensitive to climate change [22]. Accurate analysis of the carbon sink capacity of forest vegetation in Northeast China can best reflect the role and position of forestry in the overall layout of the ecological civilization construction, and serves society as well as providing scientific and technological support for the implementation of forestry in achieving the carbon neutral strategy. However, current research on carbon sequestration has mostly focused on the arbor forests or soils, while the research about the carbon sequestration capacity of shrubs, scattered trees, and surrounding trees is still insufficient. How to consider all forest components in estimating carbon sequestration is vital to carbon neutrality.
Therefore, based on using the forest resource inventory data and biomass data obtained via the plot measurement method in the Three Northeast Provinces of China, this study proposes the concept of full carbon sink, which includes all the vegetation components of a forest ecosystem. We set out to analyze the spatial pattern of a full carbon sink, and analyze the impact factor of this pattern. The main objectives of this study were: (1) to propose the concept of full carbon sink and calculate the full carbon sink in the Three Northeast Provinces; (2) to analyze the component differences among the full carbon sink in the Three Northeastern Provinces, and (3) to discuss how climate factors (annual average temperature and annual average precipitation) and socio-economic factors (population density, farmers’ net incomes, primary industry proportion, and crop output) influence the spatial pattern of the full carbon sinks.
2. Materials and Methods
2.1. Study Area
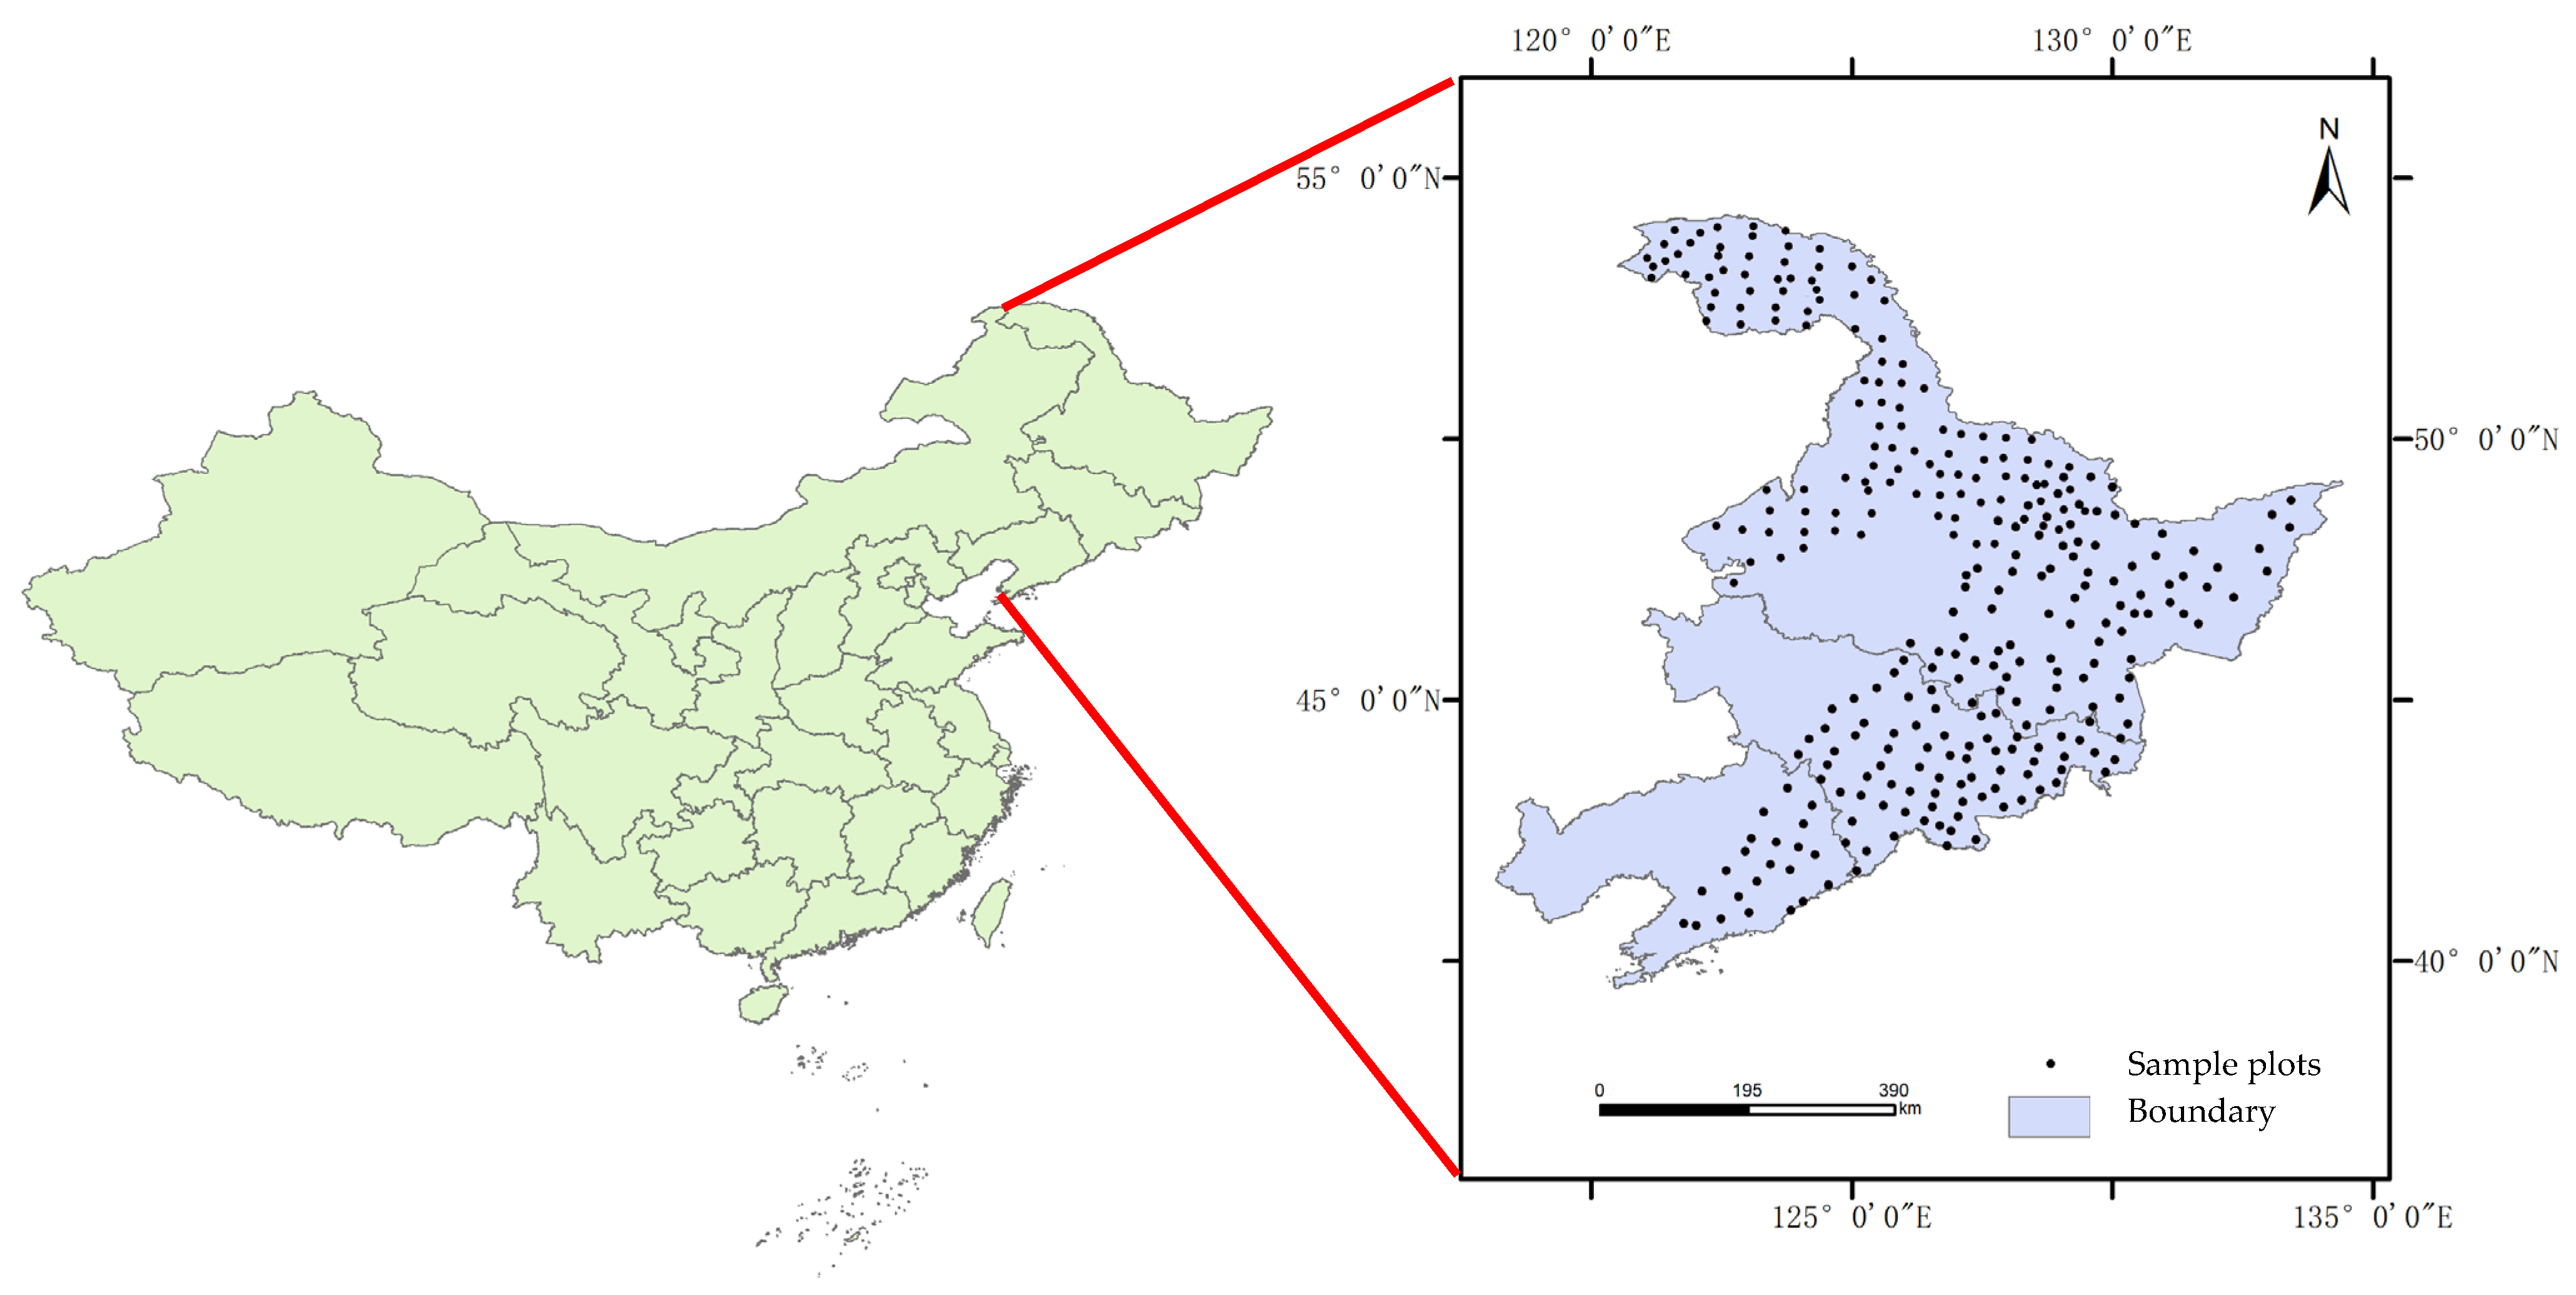
The Three Northeast Provinces, in the northeast of the People’s Republic of China, is the collective name of the three provinces of Liaoning, Jilin and Heilongjiang, located at 38°43′–53°33′ N, 118°02′–135°53′ E [23]. The area spans from south to north across the warm temperate zone, the middle temperate zone, and the cold temperate zone with a humid and semi-humid continental monsoon climate [24]. The main forest types are cold-temperate coniferous forests and mixed coniferous and broad-leaved forests [25]. According to the data from the Ninth National Forest Resource Inventory, the total forest area is 33.47 Mha, and this includes 31.85 Mha of arbor forests [21]. The area of various forestry land is shown in Table 1.
2.2. Methods
2.2.1. Data Sources
The data needed for this study mainly included forest resource data, vegetation carbon storage data and soil carbon storage data. The forest resource data came from the Ninth National Forest Resource Inventory data (2014–2018), which are based on the results of a sample survey. The data used in our study include the area and storage volume of various forestry lands, the area of each age group (young, middle-aged, near-mature, mature, and over-mature forests), dominant tree species (groups). The pre-processing of forest resources inventory data refers to the “Technical regulations for continuous forest inventory” [26]. Tree species (groups) with similar physiological and ecological characteristics were consolidated in each region’s forest resources inventory to obtain the area and accumulation data of the dominant tree species (groups) by age group. The criteria for the classification of age groups referred to the “Division of Age Classes and Age Groups of Major Tree Species” [27].
The vegetation carbon storage data and soil carbon storage data were derived from the long-term monitoring data of forest research stations of Chinese Forest Ecosystem Research Network and several auxiliary monitoring stations in the Three Northeastern Provinces (Figure 1) and refer to “Methodology for field long term observation of forest ecosystem” during the forest inventory period [28].
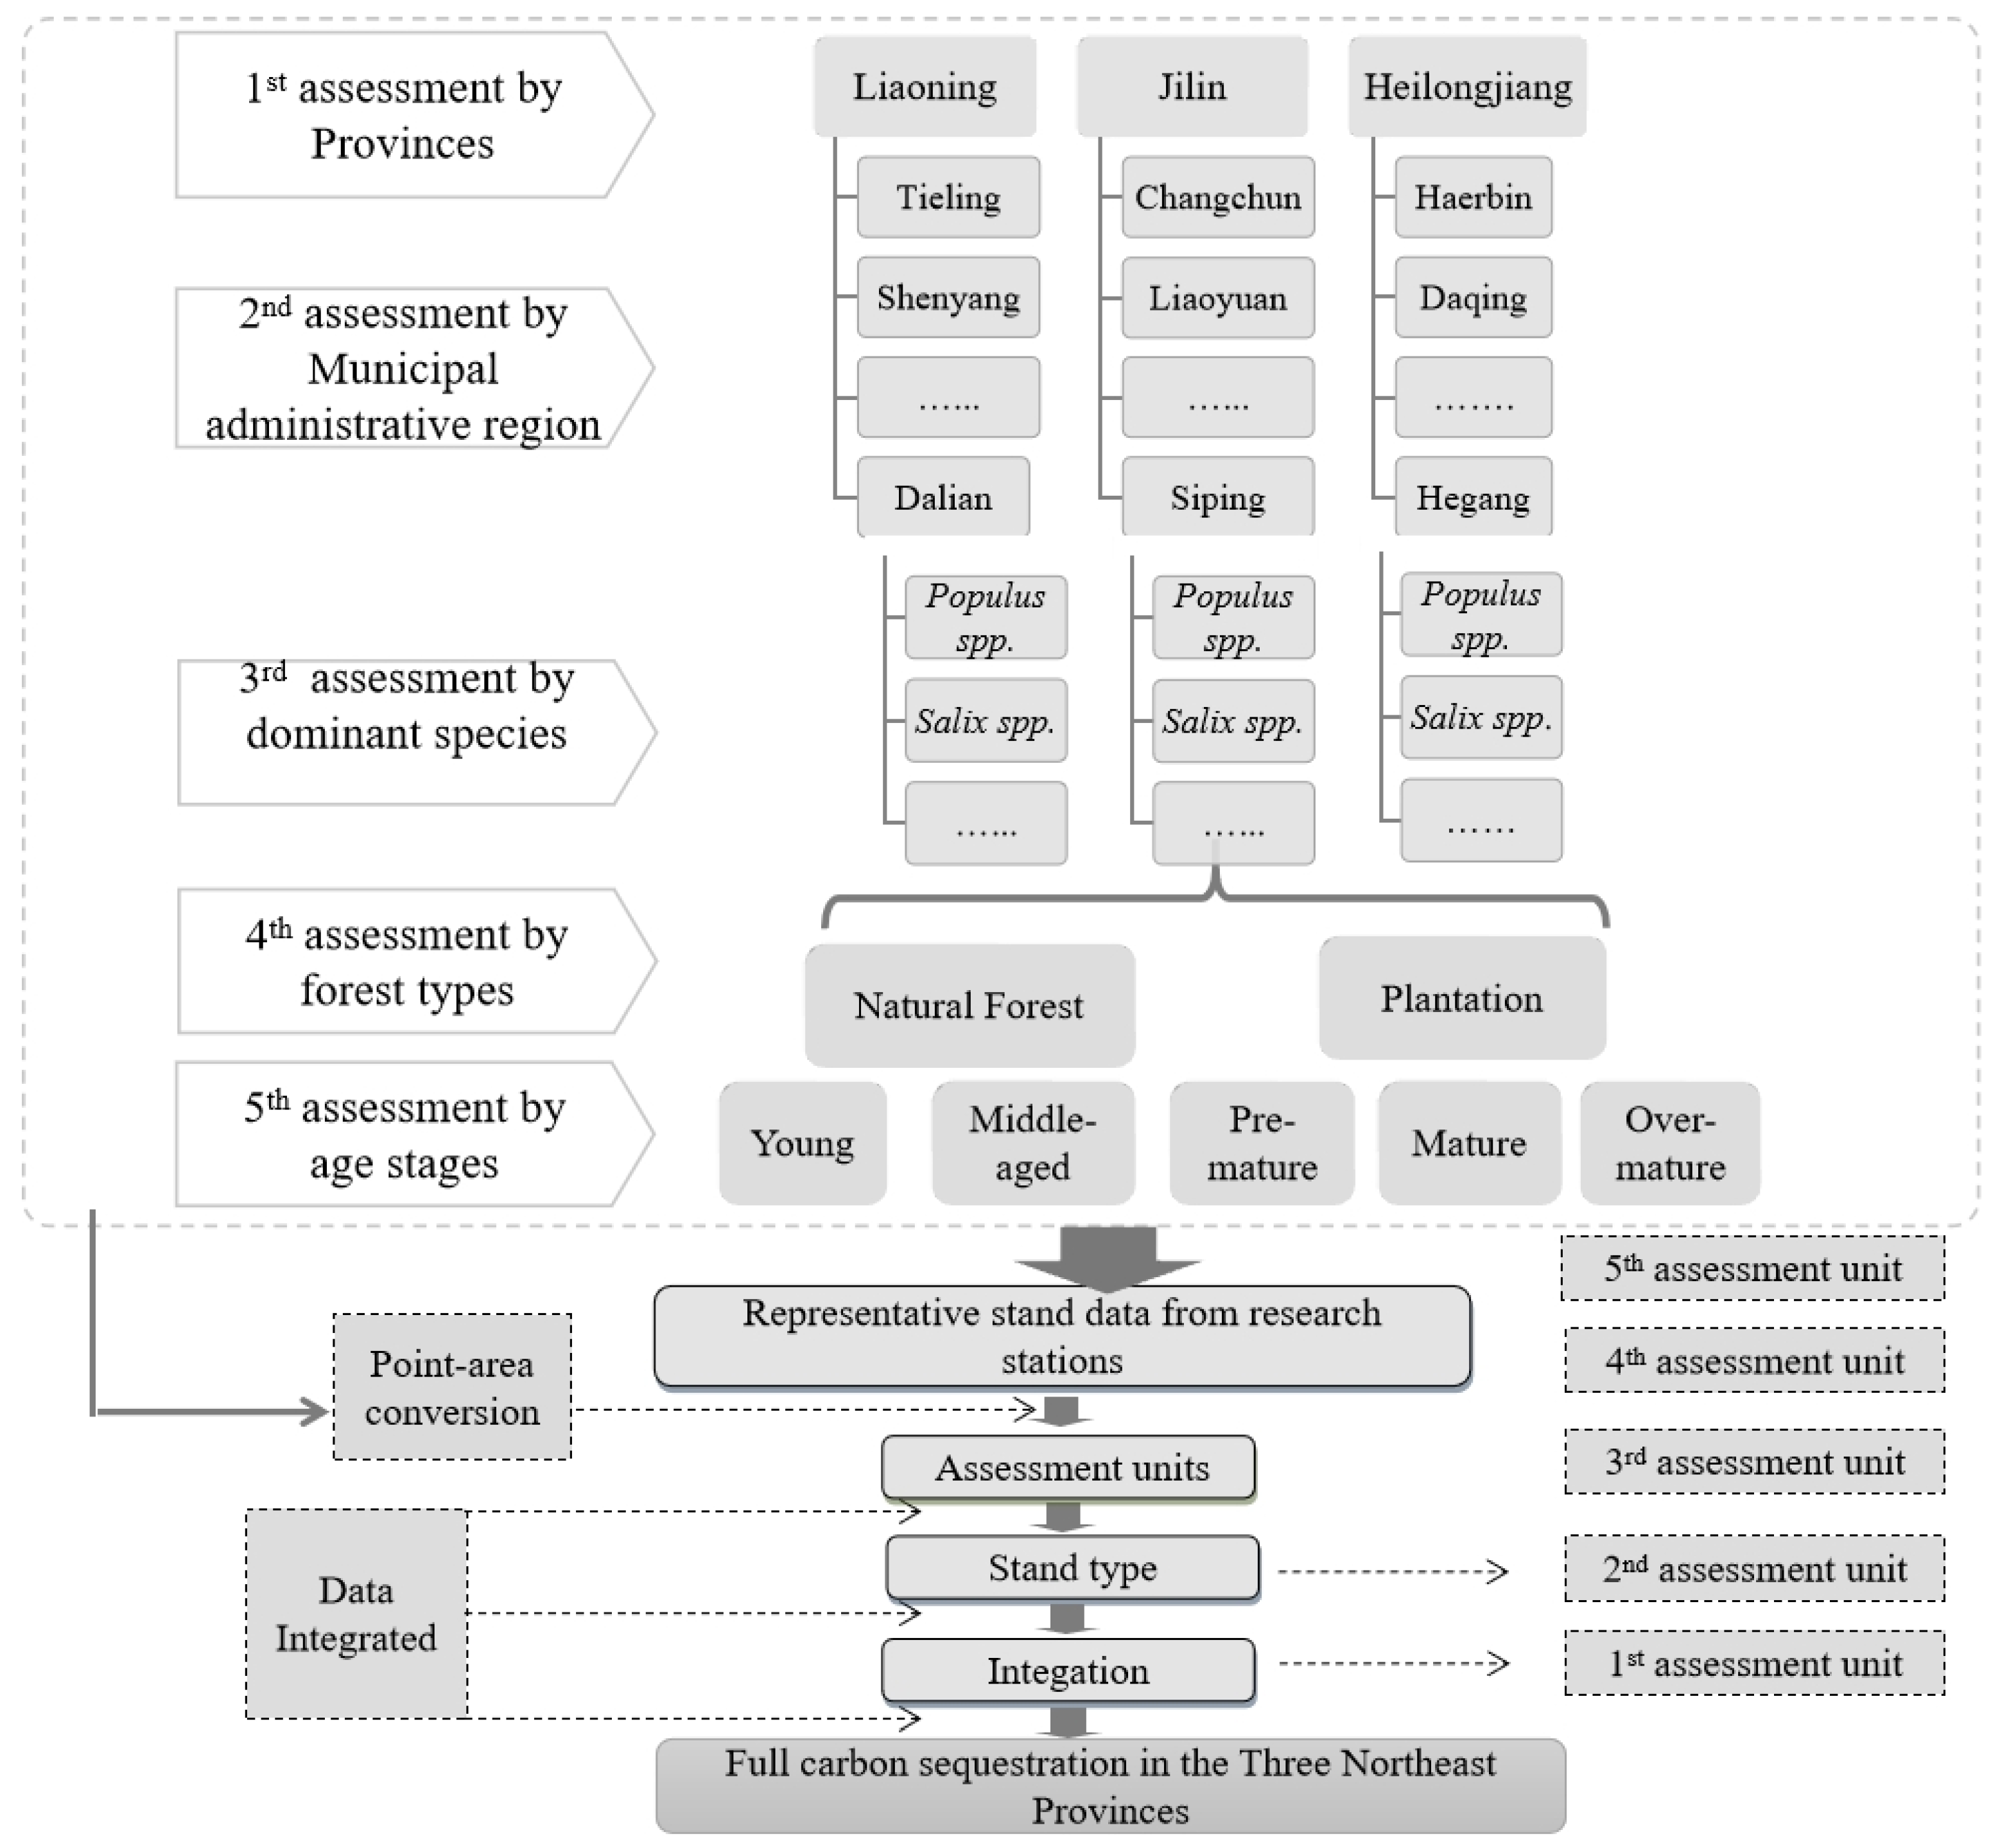
The assessment of the carbon sink on a regional scale was a large and complex project. Therefore, it was suitable to divide into multiple homogeneous ecological assessment units for evaluation. We conducted scale transformation of plant and soil carbon sequestration utilizing the distributed evaluation system at five different levels (Figure 2). The first assessment level was made by the provincial administrative regions, the second level by municipal administrative regions, the third level by dominant species, the fourth level by age groups (Figure 2), and the fifth level by forest origin (natural or plantation). Ultimately, 7650 relatively homogeneous (20 × 20 m) assessment units that were determined. Results for the entire study area were obtained by converting and combining the results of all relatively homogeneous assessment units.
2.2.2. Vegetation Carbon Sink
Firstly, we used the harvesting method to obtain forest biomass data (including the biomass of tree trunks, branches, leaves, and roots of the tree layer, as well as the biomass of shrubs, herb layers and interlayer plants, and necromass and litterfall mass) referring to “Methodology for field long-term observation of forest ecosystem” [28] and the methods proposed by other researchers [16,17].
The height and DBH of each tree were measured in a sample plot, and standard trees were selected according to the data obtained from the survey. The standard trees were felled and brought back to the laboratory for drying and weighing to obtain the biomass of trunks, roots, branches, leaves, flowers, and fruits. Five 2 × 2 m shrub squares and five 1 × 1 m herb squares were set up in each plot. The biomass of shrubs and herbs as well as the biomass of interlayer plants (vines, etc.) was measured by the full harvest method.
The standard tree biomass equation is:
where Ws is the biomass of a standard tree (kg); WR is the biomass of the roots (kg); WT is the biomass of the trunk (kg); WB is the biomass of the branches (kg); and WL is the biomass of leaf, flower, and fruits (kg).
The equation of arbor forest biomass per unit area is:
where W is the biomass of arbor forest biomass per unit area (kg·m−2); G is the total cross-sectional area at DBH (m2); and gi is the cross-sectional area at DBH of a standard tree (m2). The litterfall was collected by the direct collection method, and the necromass (including standing dead wood, fallen wood, stumps, and dead large branches) was collected by the line intersect sampling method. All collected samples were brought back to the laboratory for drying and weighing.
Then, the net primary productivity (NPP) of vegetation was measured according to the dynamic data of vegetation biomass.
The equation is:
where NPP is net primary productivity (kg·m−2·a−1); L is the production of litterfall (kg·m−2·a−1); N is the production of necromass (kg·m−2·a−1); and ΔW is the change in the biomass per unit area.
Carbon sequestration was estimated with the photosynthesis method [28]. The equation is:
where Gveg is the amount of vegetation carbon sequestration(kg·a−1); and Si is the area of the ith sampling points (m2).
This method was also applied to sparse forest land, unclosed forest land, nurseries, and nonforested land. The carbon sink of scattered trees and surrounding trees was calculated based on the NPP for each species. Otherwise, the emission of C from burning, deforestation and decay of vegetation was not estimated in this study because of insufficient data.
2.2.3. Soil Carbon Sink
We set up soil sampling points according to the spatial distribution of soil types and vegetation types. Soil samples were collected to measure soil texture, bulk density, and organic carbon at depth intervals of 0–10, 10–20, 20–30, 30–50, and 50–100 cm using a soil auger. Within each depth interval, at least five samples from the forest and shrubland plots were collected along two diagonal lines. Then, we collected soil samples through the profile method and brought them back to the laboratory to measure soil organic carbon (SOC) content. For this part of our work, we referred to “Methodology for field long-term observation of forest ecosystem” [28] and “Forest soil analysis methods (LY/T 1210-1275)” [29]. The dichromate oxidation method was used to measure organic C content. Soil bulk density was sampled and analyzed by the sampling spoon (100 cm3). Firstly, we calculated the SOC density in different soil horizons, and the SOC density varied with vegetation type. Secondly, we converted the SOC density into soil C density, which represented the weight of organic C in the 1 m3 soil-cubic at the soil profile depth of 1.0 m. Finally, the soil C density was multiplied by the area of each vegetation type to estimate the amount of soil carbon sequestration over the region. The equations are:
where SOCDk is the SOC density (kg·m−2) at the kth profile; k is the profile depth of soil; Ck is the SOC content (gC·kg−1) at the kth profile; Dk is the average soil bulk density (g·cm−3) at the kth profile; Ek is the thickness (cm) of the soil at the kth profile; Gk is the volume percentage (%) of the fraction >2 mm at the kth profile; TSOC is the soil carbon storage (kg·a−1); i is the number of sampling points; and Gsoil is the amounts of soil carbon sequestration (kg·a−1)
So, the full carbon sink is the sum of the vegetation carbon sink and soil carbon sink. The equation is:
where Gfull is the amount of full carbon sequestration (kg·a−1).
2.3. Driving Factors Analysis
Factors affecting the spatial patterns of carbon sequestration in the Three Northeast Provinces included climate factors including annual average temperature (°C) and annual average precipitation (mm), and socio-economic factors including population density (people/km2), farmers’ net incomes (Yuan), primary industrial proportion (%), and crop output (×104 ton). All data came from the Statistical Yearbook (2020) [30,31,32]. We used SPSS24.0 software to analyze the relationship between these factors and the carbon sequestration rate. The person correlation coefficient was used to study the impact of various factors on the spatial pattern of the full carbon sinks.
3. Results
3.1. Full Carbon Sink of Forest Vegetation in the Three Northeastern Provinces
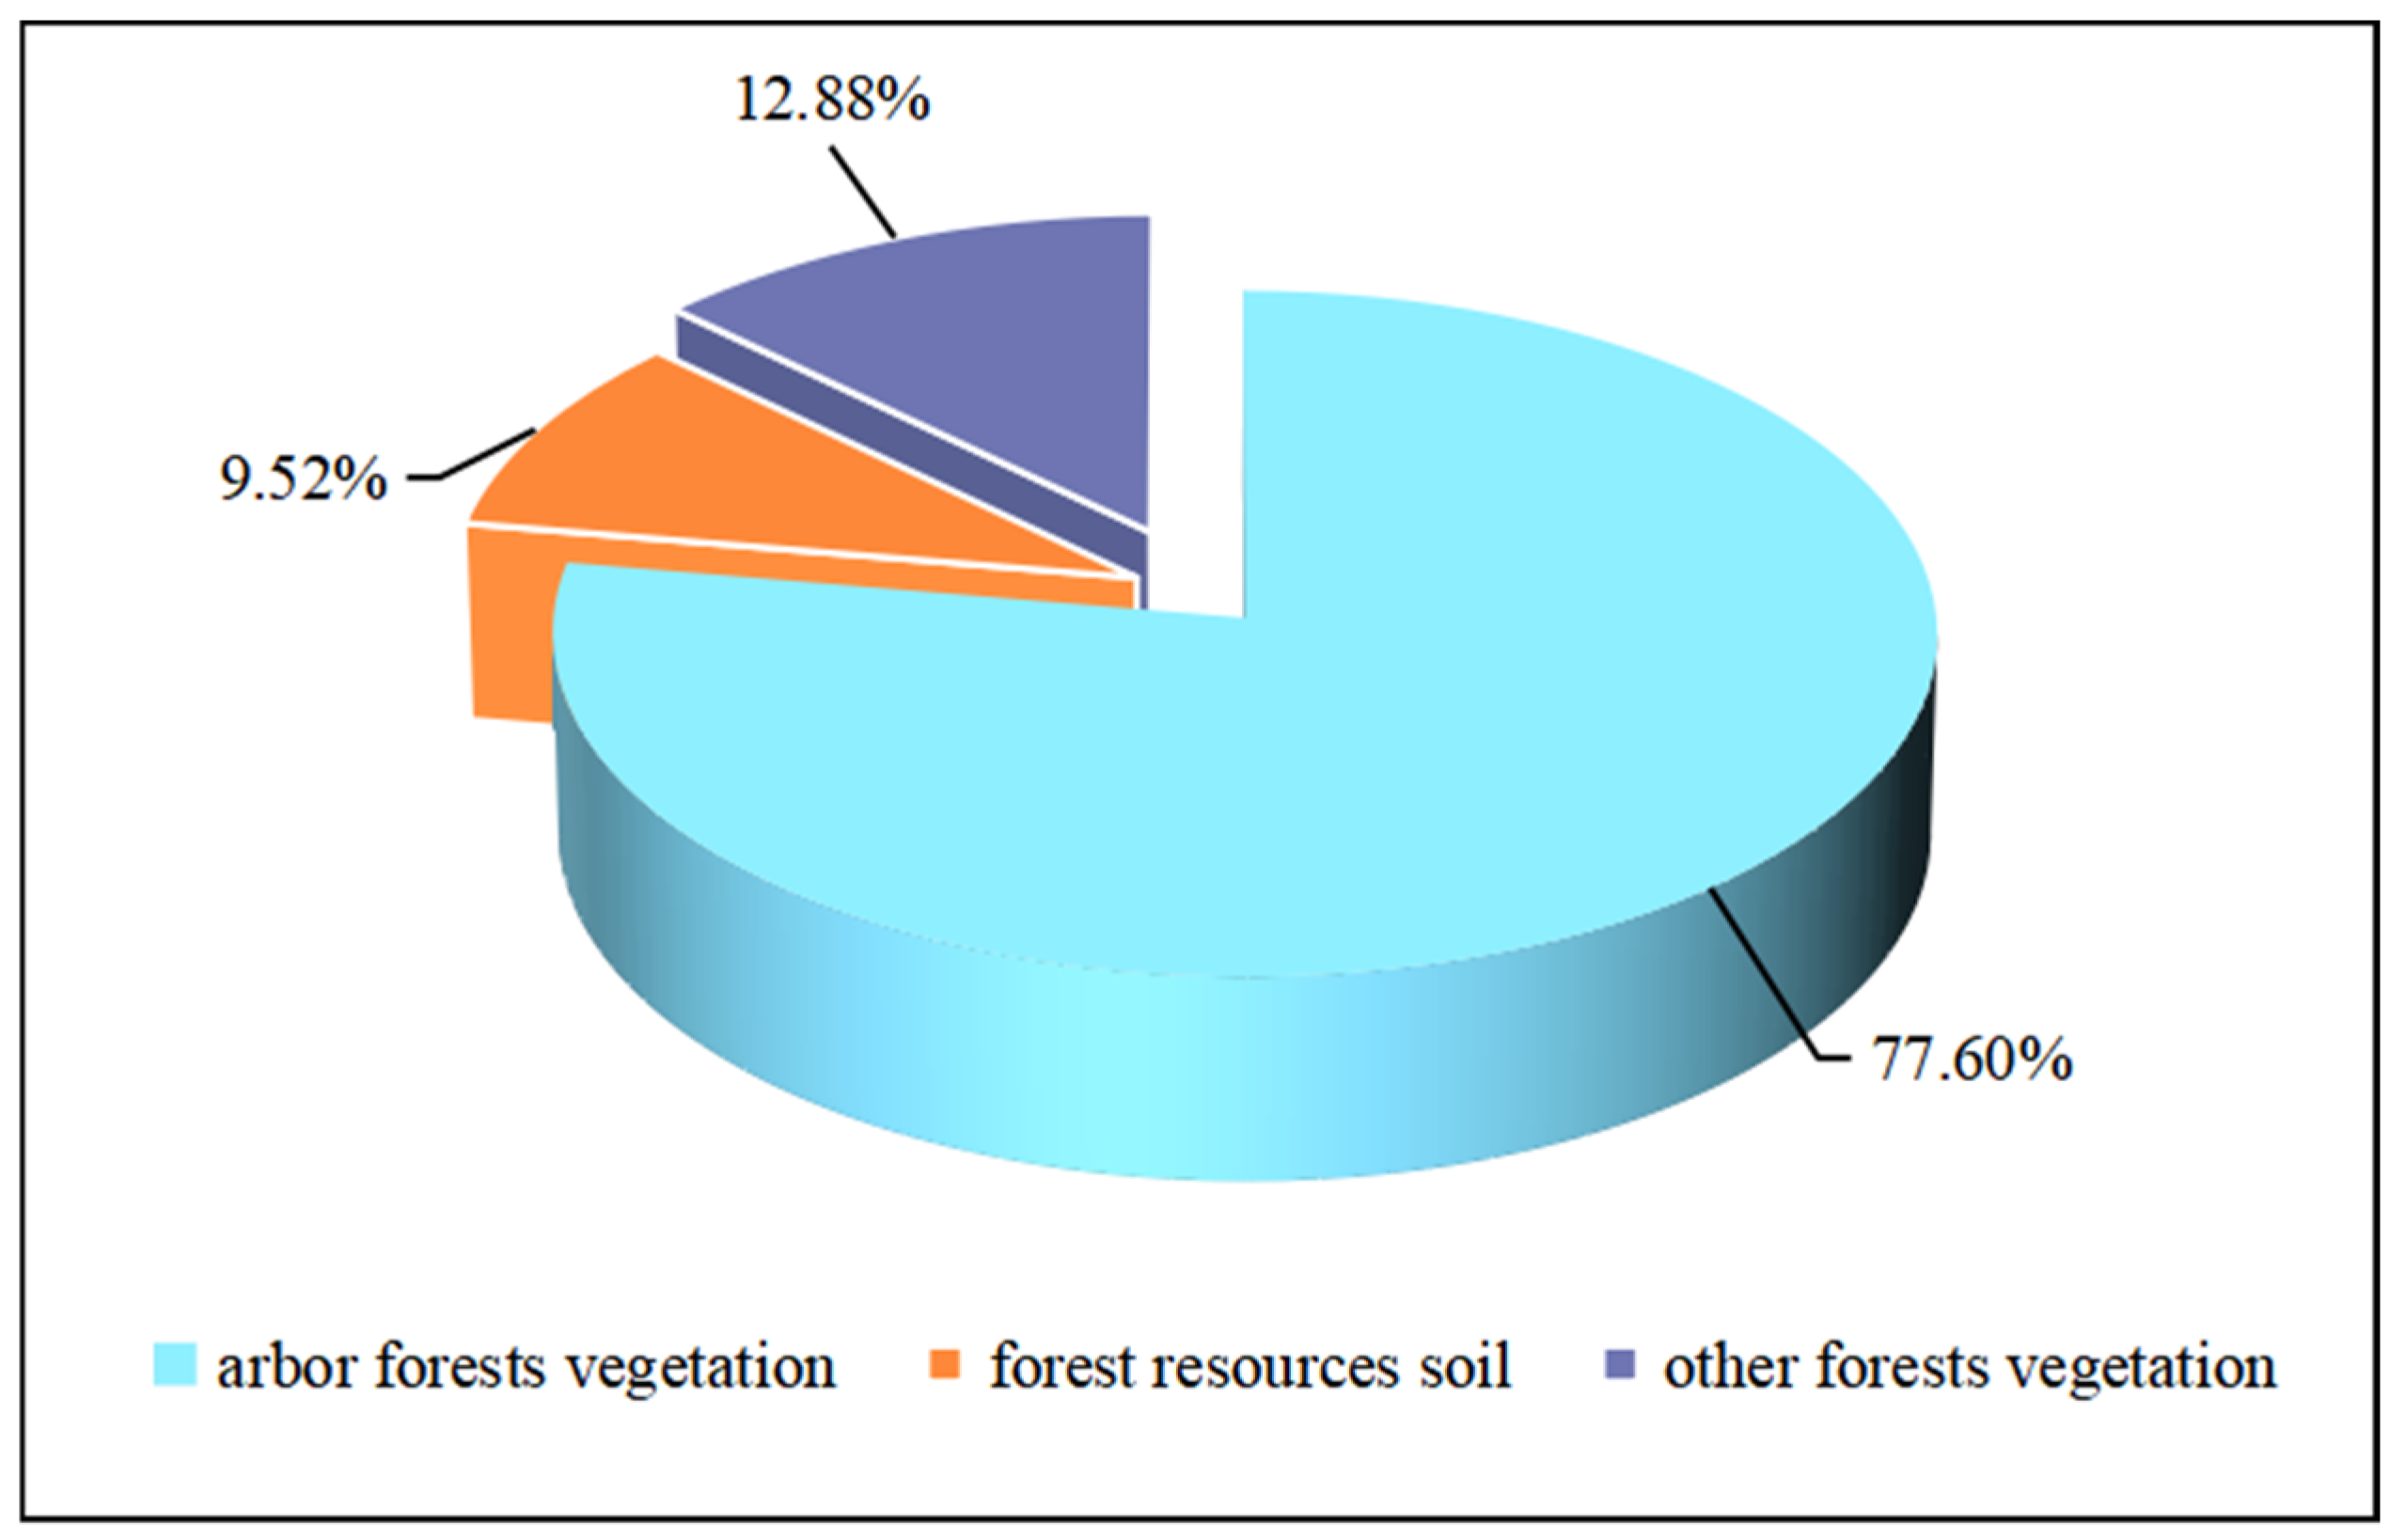
The full carbon sink of forest vegetation in the Three Northeastern Provinces is 69.45 TgC year−1. In 2019, this sink neutralized 22% of carbon emissions from energy consumption based on the statistical yearbook data [30,31,32] and carbon emission coefficient [33]. We divided the full carbon sink into three parts in this study: arbor forests vegetation, forest resource soil (arbor trees and special bushes), and other forest vegetation (sparse forest land, unclosed forest land, other shrubs, nursery, barren mountain shrubs, urban and rural green areas surrounding trees and scattered forests). The carbon sink of the different components are shown in Figure 2. The arbor forest vegetation contributed the largest carbon sequestration, accounting for 78% of the total. The Three Northeastern Provinces have a total area of 31.85 Mha of arbor forests, accounting for 77.78% of the total forest land area. Arbor forests in a forest ecosystem are mainly responsible for serving as a carbon sink. In other words, arbor forests are the key factor for determining regional carbon sequestration ability. Other forest vegetation absorbs CO2 through photosynthesis and fix it as biomass in plants during growth. The annual carbon sequestration of forest soil only accounts for 9% of the total, but it is a huge carbon pool, and fluctuations of the soil component will have a huge impact on climate change. For example, part of the organic carbon fixed in the soil will be decomposed and transformed by soil microorganisms and returned to the atmosphere in the form of CO2; the remaining will be converted into stable organic carbon after years of accumulation and stored in the soil [34].
3.2. Spatial Differences of the Full Carbon Sink in the Three Northeastern Provinces
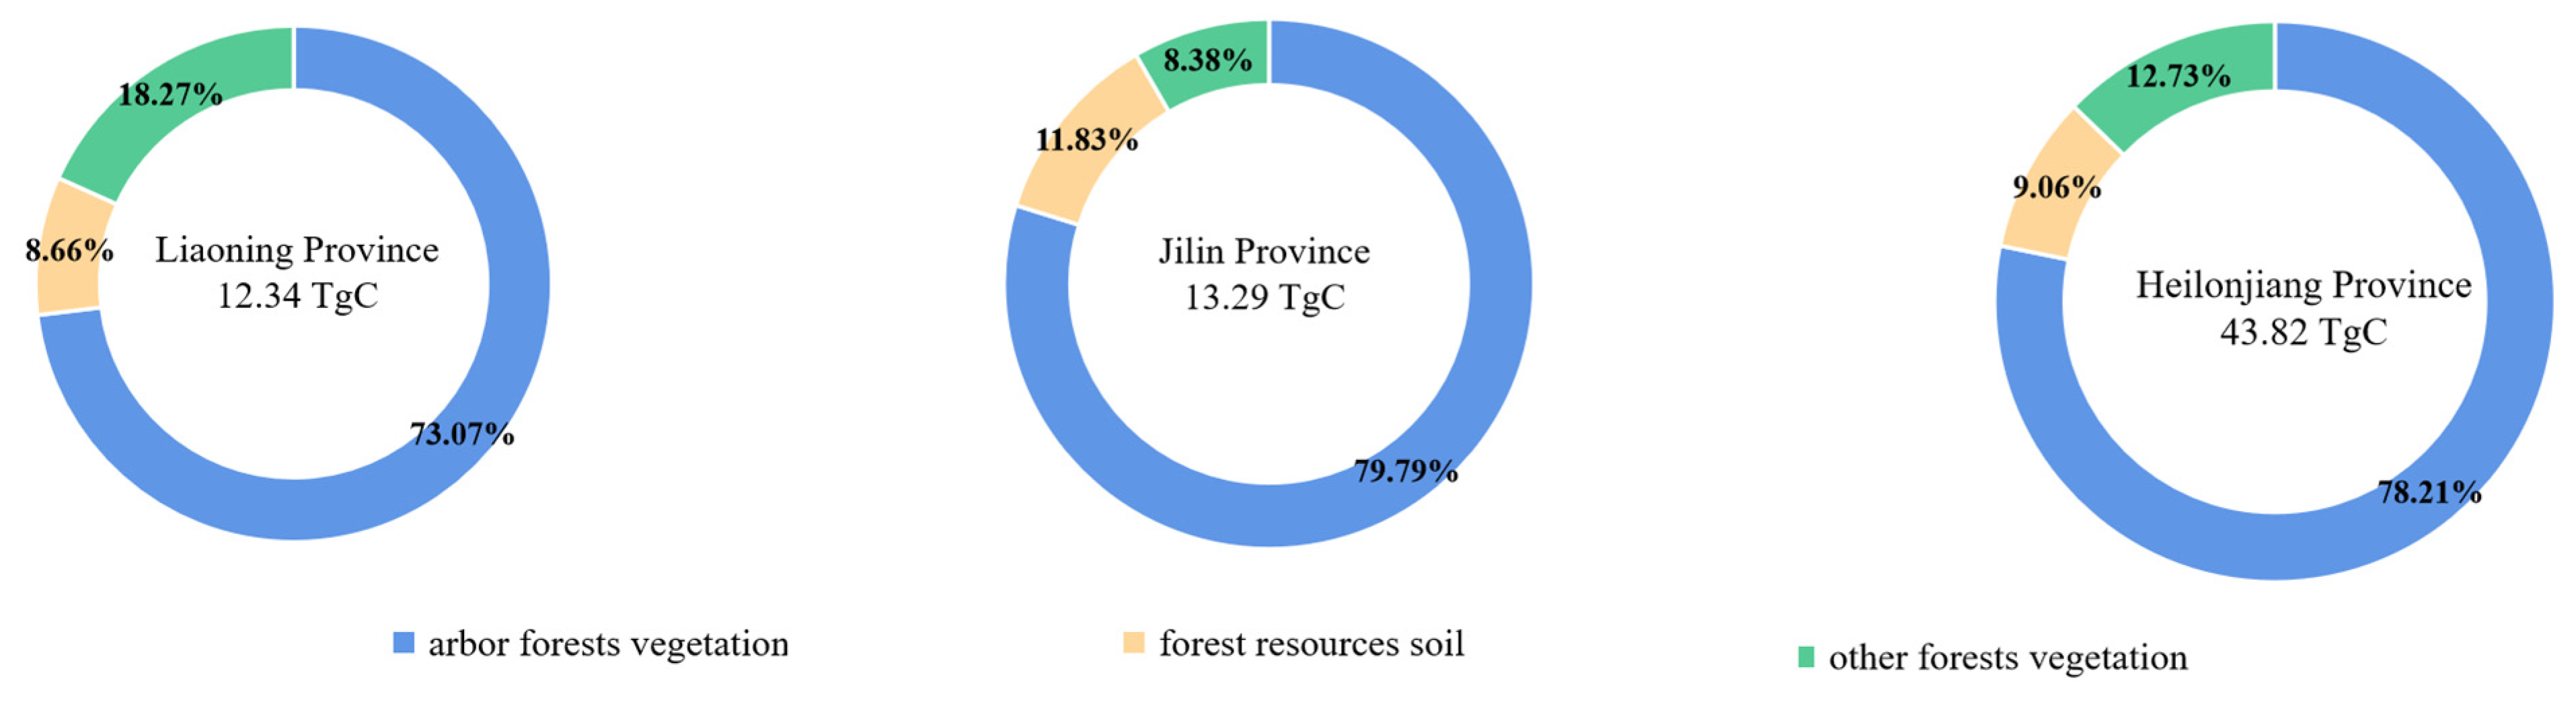
The carbon sink capacity of forests is quite different due to the differences in the composition of forest resources and environmental conditions. Arbor trees were the main carbon sink in each province. It can be seen from Figure 3 that Heilongjiang Province has the largest proportion of the full carbon sink, accounting for 63% of the total, which is mainly attributed to it having the largest forest area; followed by Jilin Province, which accounted for 19% of the total. The lowest was Liaoning Province, which accounted for 18% of the total. The full carbon sink of forest vegetation neutralized 42% (Heilongjiang Province), 25% (Jilin Province), and 8% (Liaoning Province) of energy consumption carbon emissions (Figure 4).
3.3. Driving Factors Influencing Carbon Sequestration in the Three Northeastern Provinces
Spatial heterogeneity of carbon sequestration was influenced by climate and socio-economic factors (Table 2). In general, the carbon sequestration rate increased with increasing annual average temperature (correlation coefficient = 0.354, p = 0.083) and per precipitation (correlation coefficient = 0.323, p = 0.115) but the effects of climate were relatively weak. Our results also indicated that intensive human activities have reduced the carbon sequestration ability. With the exception of population density, the socio-economic factors showed a negative correlation with the rate of carbon sequestration. Crop output had a significant negative impact on carbon sequestration as well (correlation coefficient = −0.463, p = 0.02). Other factors only weakly influenced the spatial patterns (p > 0.05).
4. Discussion
4.1. Characteristics of Carbon Sequestration in the Three Northeastern Provinces
We found that the arbor trees were the largest most of the carbon sink; however, the ability of other forest land should not be ignored. Sparse forest land refers to the forest land in close proximity to trees, the canopy closure is sparse (0.1 to 0.19), which can effectively increase forest resources, expand the forest area, and improve the ecological environment. The competition of these trees is relatively weak, and their rapid growth rate reflects their strong carbon sequestration ability. Unclosed forest land refers to the land after artificial afforestation, the plantation is evenly distributed, and the land is one of the important potential resources to improve the forest coverage. It is in the initial stage of afforestation, which is also the peak period of tree growth, and has a strong carbon sink capacity. The nurseries are the base of breeding and cultivating seedlings. Because of the large planting density, carbon density is inevitable. Studies have shown that the carbon density of nursery was significantly higher than that of the unclosed forest land and the surrounding trees [35]. There is almost no growth limit factor (competition, water, fertilizer) in urban and rural greening trees, and the growth rate is closer to the peak of productivity. It also means that its carbon sequestration ability is strong.
4.2. Main Driving Factors Influencing Carbon Sequestration Ability in the Three Northeastern Provinces
Our results indicate that the patterns of carbon sequestration’s abilities weakly coincide with temperature and precipitation distribution patterns. We also found that ecosystem carbon sequestration is more constrained by water availability in dry areas than in humid areas because of the impact on plant production and microbial respiration [36]. We suggest that carbon stocks are relative to human activities, which can provide guidance for land-based carbon management strategies. Lu et al. have shown that the key ecological restoration projects have made a huge contribution to carbon dioxide emission reduction. The implementation of these projects has meant 56% of the carbon sink in the project area, and it increased the carbon storage of 97.7 TgC [37]. Since the 1980s, the Three Northeastern Provinces have carried out a number of national and provincial forestry ecological projects. The forest area and forest quality have been improved, and the carbon sequestration capacity of the forest ecosystem has also been strengthened. According to the “2016 National Report on the Monitoring of Ecological Benefits of the Grain for Green Program” [38], the carbon sequestration in the project area in the Three Northeastern Provinces was 5.34 TgC year−1, contributing 8% to the full carbon sink of the study area, which is similar to the results in other studies [39,40]. The Grain for Green Program changed land use methods, improved soil structure, and had sustainable carbon sequestration benefits. According to the “2015 National Report on the Monitoring of Ecological Benefits of Natural Forest Resource Protection Project in Northeast and Inner Mongolia Key State-owned Forest Area” [41], the forest carbon sequestration during the implementation of the project was 8.36 TgC year−1 in Heilongjiang Province, and 1.26 TgC year−1 in Jilin Province, which are contributed to 20% and 9% of the area’s full carbon sink, respectively. A series of forest projects were implemented in the study area by artificial afforestation, closing hills for afforestation, forest management, and so on. This series has improved the structure of the ecosystem and thus enhanced the carbon sequestration capacity of the ecosystem [42].
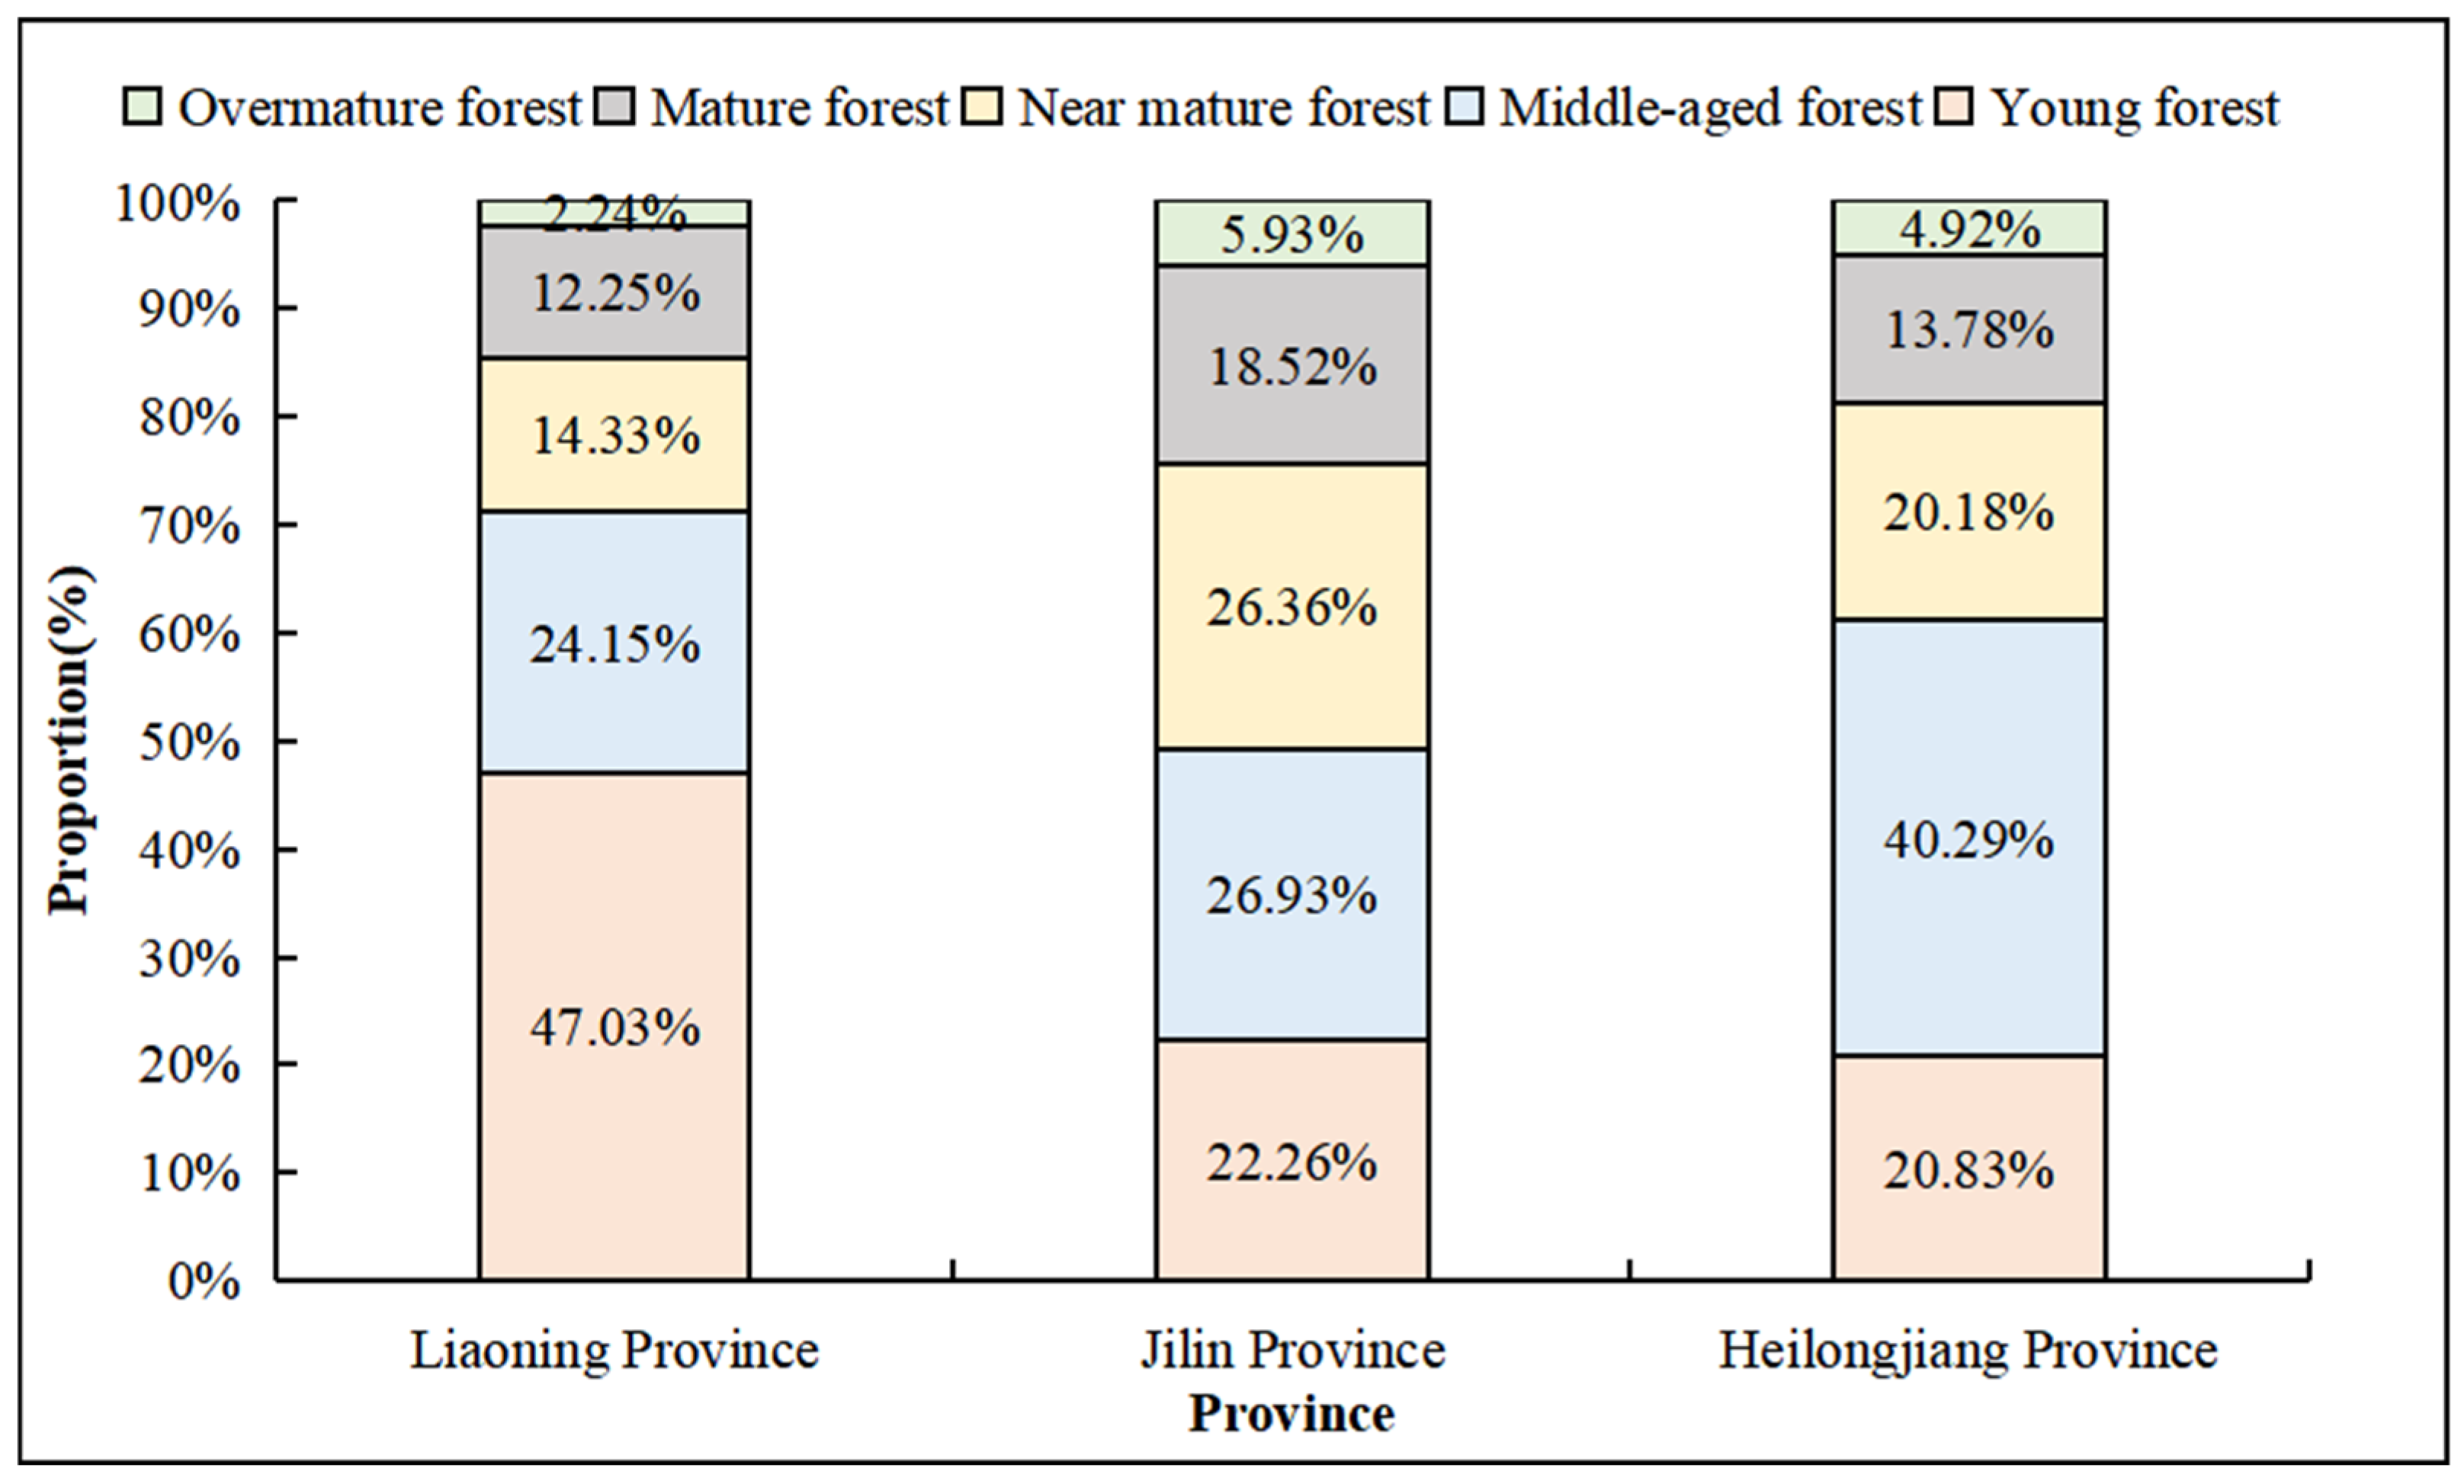
The implementation of forestry projects has been to change forest structure, which can be seen in the Ninth National Forest Resources Inventory data (Figure 5). Most studies have shown that as the forest age increases, the forest productivity reaches its maximum and then begins to decline [2,43], and forest productivity in the subsequent mature stage decreases significantly [44]. In terms of carbon sequestration per unit area, the fastest growth and highest carbon sequestration capacity of the arbor trees vegetation in Liaoning Province is mainly due to the high proportion of young and middle-aged forests reaching 71.18% of their capacity. According to the “China Forest Resources Inventory Report (2014–2018)” [21], the annual net growth rate of forest stock in Liaoning Province is 5.64%, which is higher than Heilongjiang Province (3.01%) and Jilin Province (2.90%). The proportion of young and middle-aged forests in Heilongjiang Province is 61.11%, while the proportions of all age groups in Jilin Province are similar. The annual growth in Jilin Province is lower than that of the other two provinces, and the amount of carbon sequestration capacity is also lower. In addition, carbon sequestration capacity may be impacted by tree species composition [45], litterfall production [46], and species richness [47].
4.3. Precision Analysis
The rate of carbon sequestration per unit area of vegetation in the Three Northeastern Provinces (1.37–2.12 tC∙hm−2∙year−1) is relatively consistent with the result of temperate forests of Yu et al., using observation data combined with the integration analysis of 52 flux tower observation data (1.9 tC∙hm−2∙year−1) [11], and higher than the results of Piao et al. (0.13 tC∙hm−2∙year−1) based on remote sensing data and forest resource inventory data [12], lower than the results of Cai et al. (2.16–3.47 tC∙hm−2∙year−1) [48] and Ge et al. (3.5 tC∙hm−2∙year−1) [49] using simulation method based on the field measurement combined with the model. The data obtained from satellites include vegetation carbon storage data, and the calculated annual carbon sequestration capacity does not conform to the law of tree growth, which leads to an underestimation of the carbon sequestration. Simple numerical simulation of the carbon cycle process using the model method may ignore the carbon loss process which may lead to overestimation of the carbon sequestration. The rate of soil carbon sequestration in this study was between 0.18–0.20 tC∙hm−2∙year−1, which is a little lower than the results of Zhu et al., for the northern forest areas of China (0.24 tC∙hm−2∙year−1) [50], and similar to the result of Fang et al. (0.2 tC∙hm−2∙year−1) [16]. At the regional scale, Xu et al. [51] found that temperate forest carbon sinks were 0.94 tC∙hm−2∙year−1 based on monitoring data and flux data, which are similar to the results of Harris et al. [52] (0.64 tC∙hm−2∙year−1). On a global scale, Wang et al. [53] calculated a global forest carbon sink with average of 1.16 tC∙hm−2∙year−1 based on the collected flux tower data from 75 sites. In summary, the results in this study were a little higher than the characteristics of temperate forests in the Northern Hemisphere because of the large scale estimation, but are similar to those in other studies conducted in China.
In the process of calculating the full carbon sink, we realized that the orchards can also be regarded as a carbon sink besides the fruit production function. The carbon in the fruit is removed from the orchard ecosystem through harvesting [54]. This particular study only discusses the carbon captured by fruit formation process. Other studies have shown that the carbon sequestration capacity of China’s apple orchards is equivalent to 5.6% of the national forest carbon sink. Increasing the output of orchards through reasonable management measures will not only bring economic benefits but also help neutralize carbon dioxide [55]. Otherwise, the emission of C from burning, deforestation, and decay of vegetation was not estimated in our study because of the insufficient data. However, we feel we have shown that the net absorption of C based on calculating absorption and discharge accurately reflects the ability of carbon neutralization of forest vegetation.
Assuming that existing forest lands will be converted into arbor forests, we use the existing forest carbon sequestration capacity to estimate the potential carbon sequestration in the Three Northeastern Provinces. Hypothetically, in the future, the forest area of Liaoning, Jilin, and Heilongjiang provinces will reach 7.36, 9.05, and 24.54 Mha, and the annual carbon sequestration will reach 80 TgC year−1, an increase of 13% compared to the results of this study. In fact, due to the limitation of water and heat conditions, not all forest lands can be converted into arbor forests. However, with the development of forest protection work and the continuous improvement of forest management methods, the carbon sequestration capacity of forests will be further strengthened.
4.4. Uncertainty
Forest ecosystems have complex spatial and temporal heterogeneity and extensive internal linkages, which must be addressed in the study of forest ecosystem carbon sequestration and which make it difficult to estimate the full carbon sink of forests. Different analytical methods produce different results. Compared with the IPCC method, the method used in this study and the IPCC method are both based on the principle of calculating the biomass stock of two periods to calculate carbon sequestration. The difference is that in this study, the NPP of the dominant tree species is obtained through the biomass calculation of two periods, and then the carbon sequestration is calculated based on the photosynthesis equation, which is flow calculation. The allometry model and BEF method was used in the IPCC carbon account, carbon storage is calculated based on the carbon content in dry matter, which is stock calculation. When applying the IPCC method at the national and regional scales, carbon emissions were also considered at the tier 2 level. In this study, due to the lack of data, carbon losses caused by factors such as land use conversion were not calculated. When using IPCC method, due to differences in parameters among different dominant tree species and age groups, accounting and correction should be made based on actual situations. The method used in this study investigates the biomass of different age groups and dominant tree species in the sample plot through long-term positioning monitoring. This method is equivalent to supplementing the IPCC method on a smaller regional scale, making the assessment of regional carbon sink function more accurate. The calculation method for carbon sequestration in shrublands and soil is basically consistent with the IPCC method, using the difference between the two periods for calculation.
In addition, different countries have different definitions of forests, with Chinese forests including arbor trees, bamboo, and shrubs specifically designated by the state. These categories can obtain detailed data for carbon sequestration assessment in forest resource inventory. However, vegetation such as nursery, barren mountain shrubs, urban and rural green areas surrounding trees and scattered forests that do not meet the definition of forests also store a large amount of carbon, but are not measured in traditional forest carbon sequestration assessment. The innovation of this study is to also consider these categories of forest land, thus evaluating the full carbon sink. However, this method ignores the carbon sink process, the results for the estimation of dynamic changes may be inaccurate. Therefore, it is necessary to use a combination of multiple methods to expand the spatiotemporal range and accuracy of ecosystem surveys and to use long-term observations to enhance the spatiotemporal representativeness of sample plots. It is also necessary to strengthen the observations of specific forests (shrubs, unclosed forest, surrounding trees) and carbon cycle components in the future. There are still many deficiencies in the understanding of ecosystem processes and their responses to climate change and human activities. We only selected the data from statistic books to study the impact factor of full carbon sink. Due to the complexity of the carbon cycle process, the driving factors for a carbon sink are not yet clear. Therefore, it is necessary to use model simulations and other means to deeply analyze the factors that affect the spatiotemporal distribution and dynamic changes in carbon sink, providing support for ecosystem management to enhance the carbon sink.
5. Conclusions
Based on the Ninth Forest Resource Inventory Data, we identified the full carbon sink of forest vegetation in the Three Northeastern Provinces to be 69.45 TgC, which is equivalent to neutralizing 22% of carbon emissions produced by energy consumption. Heilongjiang Province has the highest forest carbon sink capacity, accounting for 63% of the total. In terms of the full carbon sink for this region, the carbon sequestration of the arbor forest vegetation, other forest vegetation and the forest soil accounted for 77%, 13%, and 10%, respectively. Crop output is the main factor impacting the spatial pattern of the full carbon sink. Our findings identify the important role that forestry and forest vegetation have in achieving a carbon neutrality strategy.
Author Contributions
B.W. conceived and designed the paper. X.N. analyzed the data. T.X. wrote the paper. All authors have read and agreed to the published version of the manuscript.
Funding
This study was funded by the National Key Research and Development Plan (No. 2021YFF0703905).
Institutional Review Board Statement
Not applicable.
Data Availability Statement
No new data were created or analyzed in this study. Data sharing is not applicable to this article.
Conflicts of Interest
The authors declare no conflict of interest.
References
- Piao, S.L.; He, Y.; Wang, X.H. Estimation of China’s terrestrial ecosystem carbon sink: Methods, progress and prospects. Sci. China Earth Sci. 2022, 65, 641–651. [Google Scholar] [CrossRef]
- Cai, W.X.; He, N.P.; Li, M.X.; Xu, L.; Wang, L.Z.; Zhu, J.H.; Zeng, N.; Yan, P.; Si, G.X.; Zhang, X.Q.; et al. Carbon sequestration of Chinese forests from 2010–2060: Spatiotemporal dynamics and its regulatory strategies. Sci. Bull. 2021, 67, 836–843. [Google Scholar] [CrossRef]
- Xi, J.P. Speech at the general debate of the seventy-fifth United Nations General Assembly. The People’s Daily, 23 September 2020. (In Chinese) [Google Scholar]
- Friedlingstein, P.; O’Sullivan, M.; Jones, M.W.; Andrew, R.M.; Hauck, J.; Olsen, A.; Peters, G.P.; Peters, W.; Pongratz, J.; Sitch, S.; et al. Global Carbon Budget 2020. Earth Syst. Sci. Data. 2020, 12, 3269–3340. [Google Scholar] [CrossRef]
- Yang, Y.H.; Shi, Y.; Sun, W.J.; Chang, J.F.; Zhu, J.X.; Chen, L.Y.; Wang, X.; Guo, Y.P.; Zhang, H.T. Terrestrial carbon sinks in China and around the world and their contribution to carbon neutrality. Sci. China Life Sci. 2022, 65, 861–895. [Google Scholar] [CrossRef] [PubMed]
- Wang, B.; Niu, X.; Tao, Y.Z. Methodology of Forest Ecology; China Forestry Publishing Press: Beijing, China, 2018. (In Chinese) [Google Scholar]
- Fang, J.Y.; Chen, A.P.; Peng, C.H.; Zhao, S.Q.; Ci, L.J. Changes in forest biomass carbon storage in China between 1949 and 1998. Science 2001, 292, 2320–2322. [Google Scholar] [CrossRef] [PubMed]
- Schepaschenko, D.; Moltchanova, E.; Shvidenko, A.; Blyshchyk, V.; Dmitriev, E.; Martynenko, O.; See, L.; Kraxne, F. Improved Estimates of Biomass Expansion Factors for Russian Forests. Forests 2018, 9, 312. [Google Scholar] [CrossRef] [Green Version]
- Ankur, R.D.; Bailey, A.M.; Susanne, W.; Jonathan, T.; Brain, J.B.; Nikaan, K.A.; Andi, M.; Sreenath, P.; Ammarae, T.; Jess, T.; et al. Drivers of Decadal Carbon Fluxes Across Temperate Ecosystems. J. Geophys. Res. Biogeosci. 2022, 127, e2022JG007014. [Google Scholar]
- Qubaja, R.; Grünzweig, J.M.; Rotenberg, E.; Yakir, D. Evidence for large carbon sink and long residence time in semiarid forests based on 15 year flux and inventory records. Glob. Change Biol. 2019, 26, 1626–1637. [Google Scholar] [CrossRef]
- Yu, G.R.; Zhu, X.J.; Fu, Y.L.; He, H.L.; Wang, Q.F.; Wen, X.F.; Li, X.R.; Zhang, L.M.; Zhang, L.; Su, W.; et al. Spatial patterns and climate drivers of carbon fluxes in terrestrial ecosystems of China. Glob. Change Biol. 2013, 19, 798–810. [Google Scholar] [CrossRef]
- Piao, S.L.; Fang, J.Y.; Zhu, B.; Tan, K. Forest biomass carbon stocks in China over the past 2 decades: Estimation based on integrated inventory and satellite data. J. Geophys. Res. 2005, 110, G01006. [Google Scholar] [CrossRef] [Green Version]
- Yu, P.X.; Zhou, T.; Luo, H.; Liu, X.; Shi, P.J.; Zhang, Y.J.; Zhang, J.Z.; Zhou, P.F.; Xu, Y.X. Global pattern of ecosystem respiration tendencies and its implications on terrestrial carbon sink potential. Earth’s Future 2022, 10, e2022EF002703. [Google Scholar] [CrossRef]
- Kumar, M.; Kumar, A.; Thakur, T.K.; Sahoo, U.K.; Kumar, R.; Konsam, B.; Pandey, R. Soil organic carbon estimation along an altitudinal gradient of chir pine forests in the Garhwal Himalaya, India: A field inventory to remote sensing approach. Land Degrad. Dev. 2022, 33, 3387–3400. [Google Scholar] [CrossRef]
- Dixon, R.K.; Solomon, A.M.; Brown, S.; Houghton, R.A.; Trexier, M.C.; Wisniewski, J. Carbon pools and flux of global forest ecosystems. Science 1994, 263, 185–190. [Google Scholar] [CrossRef]
- Fang, J.; Yu, G.R.; Liu, L.L.; Hu, S.J.; Chaptin, F.S., III. Climate change, human impacts, and carbon sequestration in China. Proc. Natl. Acad. Sci. USA 2018, 115, 4015–4020. [Google Scholar] [CrossRef] [PubMed] [Green Version]
- Tang, X.L.; Zhao, X.; Bai, Y.F.; Tang, Z.Y.; Wang, W.T.; Zhao, Y.C.; Wan, H.W.; Xie, Z.Q.; Shi, X.Z.; Wu, Y.B.F.; et al. Carbon pools in China’s terrestrial ecosystems: New estimates based on an intensive field survey. Proc. Natl. Acad. Sci. USA 2018, 115, 4021–4026. [Google Scholar] [CrossRef] [Green Version]
- Pan, Y.D.; Birdsey, R.A.; Fang, J.Y.; Houghton, R.; Kauppi, P.E.; Kurz, W.A.; Phillips, O.L.; Shvidenko, A.; Lewis, S.L.; Canadell, J.G.; et al. A large and persistent carbon sink in the world’s forests. Science 2011, 333, 988–993. [Google Scholar] [CrossRef] [PubMed] [Green Version]
- Wang, B.; Wang, D.; Niu, X. Past, present and future forest resources in China and the implications for carbon sequestration dynamics. J. Food Agric. Environ. 2013, 11, 801–806. [Google Scholar]
- Wang, J.; Feng, L.; Palmer, P.I.; Liu, Y.; Fang, S.X.; Bosch, H.; O’Dell, C.W.; Tang, X.P.; Yang, D.X.; Liu, L.X.; et al. Large Chinese land carbon sink estimated from atmospheric carbon dioxide data. Nature 2020, 586, 720–723. [Google Scholar] [CrossRef]
- National Forestry and Grassland Administration. China Forest Resources Report 2014–2018; China Forestry Publishing Press: Beijing, China, 2019. (In Chinese)
- Luo, W.X.; Kim, S.H.; Zhao, X.H.; Ryu, D.; Jung, I.; Cho, H.; Harris, N.; Ghosh, S.; Zhang, C.Y.; Liang, J.J. New forest biomass carbon stock estimates in Northeast Asia based on multisource data. Glob. Change Biol. 2020, 26, 7045–7066. [Google Scholar] [CrossRef]
- Guo, H.P.; Xie, S.D.; Pan, C.L. The Impact of Planting Industry Structural Changes on Carbon Emissions in the Three Northeast Provinces of China. Int. J. Environ. Res. Public Health 2021, 18, 705. [Google Scholar] [CrossRef]
- Zheng, D. Study on the Ecogeographic Regional System of China; The Commercial Press: Shanghai, China, 2008. [Google Scholar]
- Zhang, X.S. Vegetation Map of the People’s Republic of China (1:1,000,000,000); Geology Press: Beijing, China, 2007. [Google Scholar]
- GB/T 38590-2020; State Forestry Administration. Technical Regulations for Continuous Forest Inventory. Standards Press of China: Beijing, China, 2020. (In Chinese)
- LY/T 2908-2017; State Forestry Administration. Regulations for Age-Class and Age-Group Division of Main Tree-Species. Standards Press of China: Beijing, China, 2017. (In Chinese)
- GB/T 33027-2016; State Forestry Administration. Methodology for Long-Term Observation of Forest Ecosystem. Standards Press of China: Beijing, China, 2016. (In Chinese)
- LY/T 1210-1275; State Forestry Administration. Forest Soil Analysis Methods. Standards Press of China: Beijing, China, 1999. (In Chinese)
- Liaoning Provincial Bureau of Statistics. Liaoning Statistical Yearbook 2020; China Statistic Press: Beijing, China, 2020. (In Chinese)
- Jilin Provincial Bureau of Statistics. Jilin Statistical Yearbook 2020; China Statistic Press: Beijing, China, 2020. (In Chinese)
- Heilongjiang Provincial Bureau of Statistics. Heilongjiang Statistical Yearbook 2020; China Statistic Press: Beijing, China, 2020. (In Chinese)
- Wang, Z.; Zhu, Y.B. Study on the Status of Carbon Emission in Provincial Scale of China and Countermeasures for Reducing its Emission. Bull. Chin. Acad. Sci. 2008, 23, 109–115. (In Chinese) [Google Scholar]
- Mayer, M.; Prescott, C.E.; Abaker, W.E.; Augusto, L.; Cécillon, L.; Ferreira, G.W.; James, J.; Jandl, R.; Katzensteiner, K.; Laclau, J.P.; et al. Tamm review: Influence of forest management activities on soil organic carbon stocks: A knowledge synthesis. For. Ecol. Manag. 2020, 466, 118127. [Google Scholar] [CrossRef]
- Guo, J.; Wang, B.; Wang, G.B.; Wu, Y.Q.; Cao, F.L. Afforestation and agroforestry enhance soil nutrient status and carbon sequestration capacity in eastern China. Land Degrad. Dev. 2020, 31, 392–403. [Google Scholar] [CrossRef]
- Wu, Z.; Fan, C.; Zhang, C.Y.; Zhao, X.H.; Gadow, K. Effects of biotic and abiotic drivers on the growth rates of individual trees in temperate natural forests. For. Ecol. Manag. 2022, 503, 119769. [Google Scholar] [CrossRef]
- Lu, F.; Hu, H.; Sun, W.; Zhu, J.; Liu, G.; Zhou, W.; Zhang, Q.; Shi, P.; Liu, X.; Wu, X.; et al. Effects of national ecological restoration projects on carbon sequestration in China from 2001 to 2010. Proc. Natl. Acad. Sci. USA 2018, 115, 4039–4044. [Google Scholar] [CrossRef] [Green Version]
- State Forestry Administration. 2016 National Report on Ecological Benefit Monitoring of Conversion of Cropland to Forest Project; China Forestry Publishing House: Beijing, China, 2018. (In Chinese)
- Wang, Y.F.; Liu, L.; Shangguan, Z.P. Carbon storage and carbon sequestration potential under the Grain for Green Program in Henan Province, China. Ecol. Eng. 2017, 100, 147–156. [Google Scholar] [CrossRef]
- Wang, J.J.; Liu, Z.P.; Gao, J.L.; Emanuele, L.; Ren, Y.Q.; Shao, M.A.; Wei, X.R. The Grain for Green project eliminated the effect of soil erosion on organic carbon on China’s Loess Plateau between 1980 and 2008. Agric. Ecosyst. Environ. 2021, 322, 107636. [Google Scholar] [CrossRef]
- State Forestry Administration. National Report on Ecological Benefit Monitoring of Key State-Owned Forest Regions in Northeast and Inner Mongolia of Natural Forest Resources Protection Project in 2015; China Forestry Publishing House: Beijing, China, 2016. (In Chinese)
- Sha, Z.Y.; Bai, Y.F.; Li, R.R.; Lan, H.; Zhang, X.L.; Li, J.; Liu, X.F.; Chang, S.J.; Xie, Y.C. The global carbon sink potential of terrestrial vegetation can be increased substantially by optimal land management. Commun. Earth Environ. 2022, 3, 8. [Google Scholar] [CrossRef]
- Zhu, K.; Song, Y.L.; Qin, C. Forest age improves understanding of the global carbon sink. Proc. Natl. Acad. Sci. USA 2019, 116, 3962–3964. [Google Scholar] [CrossRef] [Green Version]
- Li, M.J. Carbon stock and sink economic values of forest ecosystem in the forest industry region of Heilongjiang Province, China. J. For. Res. 2022, 33, 875–882. [Google Scholar] [CrossRef]
- Chen, S.P.; Wang, W.T.; Xu, W.T.; Wang, Y.; Wan, H.W.; Chen, D.; Tang, Z.Y.; Tang, X.L.; Zhou, G.Y.; Xie, Z.Q.; et al. Plant diversity enhances productivity and soil carbon storage. Proc. Natl. Acad. Sci. USA 2018, 115, 4027–4032. [Google Scholar] [CrossRef] [PubMed] [Green Version]
- Shen, G.R.; Chen, D.M.; Wu, Y.; Liu, L.; Liu, C.J. Spatial patterns and estimates of global forest litterfall. Ecosphere 2019, 10, e02587. [Google Scholar] [CrossRef] [Green Version]
- Yue, Q.M.; Hao, M.H.; Geng, Y.; Wang, X.R.; Gadow, K.; Zhang, C.Y.; Zhao, X.H.; Gao, L.S. Evaluating alternative hypotheses behind biodiversity and multifunctionality relationships in the forests of Northeastern China. For. Ecosyst. 2022, 9, 100027. [Google Scholar] [CrossRef]
- Cai, W.X.; He, N.P.; Xu, L.; Li, M.X.; Wen, D.; Liu, S.R.; Sun, O.J. Spatial-temporal variation of the carbon sequestration rate of afforestation in China: Implications for carbon trade and planning. Sci. Total Environ. 2023, 884, 163792. [Google Scholar] [CrossRef]
- Ge, R.; He, H.; Ren, X.; Zhang, L.; Yu, G.R.; Smallman, T.L.; Zhou, T.; Yu, S.Y.; Luo, Y.Q.; Xie, Z.Q.; et al. Underestimated ecosystem carbon turnover time and sequestration under the steady state assumption: A perspective from long-term data assimilation. Glob. Change Biol. 2019, 25, 938–953. [Google Scholar] [CrossRef] [PubMed] [Green Version]
- Zhu, J.X.; Wang, C.K.; Zhou, Z.; Zhou, G.Y.; Hu, X.Y.; Jiang, L.; Li, Y.D.; Liu, G.H.; Ji, C.J.; Zhao, S.Q.; et al. Increasing soil carbon stocks in eight permanent forest plots in China. Biogeosciences 2020, 17, 715–726. [Google Scholar] [CrossRef] [Green Version]
- Xu, L.; Saatchi, S.S.; Yang, Y.; Yu, Y.F.; Pongratz, J.; Bloom, A.A.; Bowman, K.; Worden, J.; Liu, J.J.; Yin, Y.; et al. Changes in global terrestrial live biomass over the 21st century. Sci. Adv. 2021, 7, eabe9829. [Google Scholar] [CrossRef]
- Harris, N.L.; Gibbs, D.A.; Baccini, A.; Birdsey, R.A.; Bruin, S.; Farina, M.; Fatoyinbo, L.; Hansen, M.C.; Herold, M.; Houghton, R.A.; et al. Global maps of twenty-first century forest carbon fluxes. Nat. Clim. Change 2021, 11, 234–240. [Google Scholar] [CrossRef]
- Wang, X.; Wang, C.; Bond-Lamberty, B. Quantifying and reducing the differences in forest CO2-fluxes estimated by eddy covariance, biometric and chamber methods: A global synthesis. Agric. For. Meteorol. 2017, 247, 93–103. [Google Scholar] [CrossRef]
- Wu, T.; Wang; Yu, C.J.; Chiarawipa, R.; Zhang, X.Z.; Han, Z.H.; Wu, L.H. Carbon Sequestration by Fruit Trees—Chinese Apple Orchards as an Example. PLoS ONE 2012, 7, e38883. [Google Scholar] [CrossRef]
- Yulistyarini, T.; Hadiah, J.T. Carbon stock potential of Indonesian local fruit trees, some collections of Purwodadi Botanic Garden. IOP Conf. Ser. Earth Environ. Sci. 2022, 976, 012057. [Google Scholar] [CrossRef]
Figure 1.
Geographical location and distribution of sample plots in the Three Northeast Provinces.

Figure 2.
Distributed evaluation system for the full carbon sequestration.

Figure 3.
Proportion of different components of the full carbon sink.

Figure 4.
Different components of forest full carbon sink in various provinces.

Figure 5.
Proportion of different age groups of arbor forests in the Three Northeast Provinces.


Table 1.
Statistics of forest land in the Three Northeast Provinces.
| Provinces | Total | Arbor Trees | Shrub | Sparse Forest Land | Unclosed Forest Land | Nursery | Non Forested Land | Forest Suitable Land | Scattered Trees | Surrounding Trees (Number) | |
|---|---|---|---|---|---|---|---|---|---|---|---|
| Special Bushes | Other Shrubs | ||||||||||
| Heilongjiang | 24.54 | 19.84 | 0.06 | 0.20 | 0.08 | 0.15 | 0.02 | 0.05 | 4.14 | 1.41 | 6710 |
| Proportion | 100.00% | 80.87% | 0.25% | 0.83% | 0.31% | 0.60% | 0.06% | 0.21% | 16.87% | ||
| Jilin | 9.05 | 7.75 | 0.10 | 0.08 | 0.02 | 0.13 | 0.0022 | 0.02 | 0.95 | 0.39 | 2991 |
| Proportion | 100.00% | 85.62% | 1.13% | 0.83% | 0.23% | 1.49% | 0.02% | 0.24% | 10.44% | ||
| Liaoning | 7.37 | 4.26 | 1.46 | 0.35 | 0.04 | 0.17 | 0.03 | 0.13 | 0.93 | 0.03 | 22,588 |
| Proportion | 100.00% | 57.83% | 19.88% | 4.81% | 0.51% | 2.27% | 0.34% | 1.72% | 12.65% | ||
Unit: Mha.
Table 2.
Correlationship between carbon sequestration and driving factors.
| a | b | c | d | e | f | g | |
|---|---|---|---|---|---|---|---|
| a | 1 | 0.354 | 0.323 | 0.339 | −0.036 | −0.463 * | −0.325 |
| b | 0.354 | 1 | −0.183 | 0.749 | 0.602 | −0.349 | −0.687 ** |
| c | 0.323 | −0.183 | 1 | 0.009 | −0.348 | −0.066 | 0.163 |
| d | 0.339 | 0.749 ** | 0.009 | 1 | 0.301 | −0.28 | −0.547 * |
| e | −0.036 | 0.602 ** | −0.348 | 0.301 | 1 | −0.315 | −0.385 |
| f | −0.463 * | −0.349 | −0.066 | −0.28 | −0.315 | 1 | 0.434 * |
| g | −0.325 | −0.687 ** | 0.163 | −0.547 ** | −0.385 | 0.434 * | 1 |
Note: a: carbon sequestration rate, b: annual average temperature, c: annual average precipitation, d: population density, e: farmer’s net income, f: crop output, and g: primary industry proportion. ** Corrected significance at p < 0.01. * Corrected significance at p < 0.05.
Disclaimer/Publisher’s Note: The statements, opinions and data contained in all publications are solely those of the individual author(s) and contributor(s) and not of MDPI and/or the editor(s). MDPI and/or the editor(s) disclaim responsibility for any injury to people or property resulting from any ideas, methods, instructions or products referred to in the content. |
© 2023 by the authors. Licensee MDPI, Basel, Switzerland. This article is an open access article distributed under the terms and conditions of the Creative Commons Attribution (CC BY) license (https://creativecommons.org/licenses/by/4.0/).
Share and Cite
MDPI and ACS Style
Wang, B.; Niu, X.; Xu, T. Identifying the Full Carbon Sink of Forest Vegetation: A Case Study in the Three Northeast Provinces of China. Sustainability 2023, 15, 10396. https://doi.org/10.3390/su151310396
AMA Style
Wang B, Niu X, Xu T. Identifying the Full Carbon Sink of Forest Vegetation: A Case Study in the Three Northeast Provinces of China. Sustainability. 2023; 15(13):10396. https://doi.org/10.3390/su151310396
Chicago/Turabian StyleWang, Bing, Xiang Niu, and Tingyu Xu. 2023. "Identifying the Full Carbon Sink of Forest Vegetation: A Case Study in the Three Northeast Provinces of China" Sustainability 15, no. 13: 10396. https://doi.org/10.3390/su151310396
Note that from the first issue of 2016, this journal uses article numbers instead of page numbers. See further details here.