
Analyzing the Factors for Implementing Make-to-Order Manufacturing System

1
Department of Mechanical Engineering, Delhi Technological University, Delhi 110042, India
2
Department of Mechanical Engineering, G B Pant DSEU, Okhla 1 Campus, New Delhi 110020, India
*
Author to whom correspondence should be addressed.
Sustainability 2023, 15(13), 10312; https://doi.org/10.3390/su151310312
Submission received: 27 April 2023
/
Revised: 20 June 2023
/
Accepted: 22 June 2023
/
Published: 29 June 2023
(This article belongs to the Topic Efficient Manufacturing: Materials, Processes, and Systems)
Abstract
:Make-to-order (MTO) is becoming vital for meeting ever-changing customer requirements. Growing demand for customized items has been linked to a rise in the proportion of MTO businesses. Many sectors and product categories have implemented the MTO concept and achieved a competitive edge in sustainable manufacturing. However, in the case of the automobile sector, little work has been carried out, both in research and practice. In this study, our objective is to identify and prioritize the critical success factors (CSF) which can affect the implementation of make-to-order and rank the different strategies to implement MTO manufacturing systems for passenger cars. This paper proposes an integrated approach where an Analytic Hierarchy Process (AHP) is used for prioritizing factors and the Technique for Order of Preference by Similarity to Ideal Solution (TOPSIS) is used for ranking the strategies for implementation. The study shows that a customer-centric strategy would be the best solution to implement MTO in the automobile sector.
1. Introduction
In today’s manufacturing climate, the priority of every company is to strive hard to remove all kinds of bottleneck so that it can withstand the cutthroat competition in the market and can meet customer requirements for cost, quality, and delivery [1]. In order to maintain and grow their market shares, sales, and revenue rates, organizations are believed to benefit from high levels of customer satisfaction [2]. Market dynamics reflect all the processes along the supply chain and need to be observed and controlled closely. Manufacturing, as well as the service industry, requires adapting to fast-changing customer requirements. Industries today are becoming complex and need to introduce technologies to cope with changing trends. In order to compete on a worldwide scale, industries must improve their economic and business performance related to quality, cost, and adaptability.
With an aim to meet customers’ expectations (related to quality, cost, and delivery time) and cope with the worldwide competition, make-to-order (MTO) systems are gaining attention in manufacturing industries. Manufacturing firms must compete in an environment where flexibility, affordability, and response time are all crucial in meeting customers’ demand [3]. These circumstances drew the attention of practitioners and researchers, who saw the advantages of MTO in terms of minimizing finished product inventories, high customization, and reacting to highly dynamic customer behavior [4]. With such systems, not only is high product variety met, but it also enables the provision of on-time delivery. Growing demand for customized items has also been linked to a rise in the proportion of MTO businesses [5]. Companies are seeking a way to manage products and associated processes, such as inventory, with these types of production paradigms available, where product customization is becoming so much more of a requirement for customers [6].
Automobile Sector in India
As a result of two decades of strong growth, India transformed from being a net importer of cars to a significant producer and exporter of vehicles and components. One of India’s most significant economic development drivers and one with significant involvement in international value chains is the automobile industry [7]. Together with many new initiatives for business revival, technology has emerged as a great enabler. Building new efficiencies for sustainable recovery while identifying new growth engines has been a key task at hand. A seamless integration across all operations has assured efficiencies over the long term. Expansion across physical as well as virtual platforms is critical for business success. As MTO will only increase in the future, OEMs are forced to re-evaluate sourcing and inventory management strategies to hedge risks against multiple supply chain disruptions that might happen in the future. The automobile sector has grown manifold since the opening of the Indian economy in 1991. Along with the increase in total production, the variety of cars has increased many times more than the increase in production. New model introduction is the norm rather than the exception. From 1991 to 2022, India produced an average of 120,997.03 vehicles, with a record high of 292,861 vehicles produced in March 2012 and a record low production of 7277 vehicles in April 1992.
In many nations, the passenger vehicle industry has emerged as one of the most powerful engines for technological innovation, economic expansion, and job creation. In recent years, the growth of this industry has characterized the competitiveness of the world’s top industrialized economies. At present the passenger car segment of the automobile sector is working on an MTS system which has large inventories at the showrooms at the same time; thus, customers have no option other than to purchase the standard products available in the stock. Emerging trends in customer-configured vehicles necessitate a change from the existing manufacturing approach of “make to stock”, which is based on market forecasts [8]. To meet the demands of a customer-configured business scenario in the passenger vehicle industry, it is crucial to review the entire business process of sales and operations planning. Future automobiles will be controlled by software and have several customization possibilities [9]. The motivation and contribution of the study come from the fact that customers have become variety-seeking in every kind of product including passenger cars. To attract buyers, the manufacturers offer a wide range of models, colors, features, and value-added services [10]. This causes a huge rise in the amount of inventory required to fulfill customers’ demands. In many nations, the passenger vehicle industry has emerged as one of the most powerful engines for technological innovation, economic expansion, and job creation. In recent years, the growth of this industry has characterized the competitiveness of the world’s top industrialized economies [11]. A combination of all these refers to the use of the make-to-order strategy.
The objective of this paper is to choose the right approach of implementing MTO in passenger car manufacturing and prioritize them with the help of AHP and TOPSIS. Not much work has been reported till now to implement make-to-order in the manufacturing of passenger cars. Only a few research papers show that it has been applied at various types of manufacturing companies, for example, a steel mill [12], appliance manufacturer [13], Iranian wood industry manufacturing company [14], small equipment manufacturing company [15], fruit juice companies [16], manufacturing companies for aluminum profiles for construction industry [17], and restaurant [18]. However, a very small quantity of work has been done in the automobile sector for implementation of MTO.
The remainder of the paper is structured as follows: Section 2 represents the literature review; Section 3 comprises of the methodology adopted for the study; Section 4 describes the selection of the strategy for implementing the MTO system for passenger cars manufacturer; Section 5 comprises of the result and discussion; the practical implication of the study is included in Section 6; and finally, Section 7 presents the conclusion, limitation, and future direction of this study.
2. Literature Review
As one of the classifications, manufacturing systems are classified as make-to-order and make-to-stock [13,19,20,21,22]. Make-to-stock systems respond to customer demand swiftly through the available stocks. However, this system is ineffective in markets which have enormous product variety according to needs of customer, and inventory holding costs are significant. MTO systems, on the other hand, can create highly tailored items, but buyers must wait for them to be filled [3]. MTO is a manufacturing system in which the receipt of a customer order triggers all processes within the company, from sales to procurement to product delivery [15]. Many organizations are shifting their manufacturing approach from MTS to MTO as customer expectations for large variety is increasing along with greater modification of the items [19,20,21,22,23,24]. Short delivery times and the potential to create guaranteed delivery dates with significantly less inventory are the major competitive advantages in MTO situations [25]. MTO describes scenarios in which a product is produced through a variety of services or engineering designs and cannot be manufactured without a customer order. MTO companies are usually pressured to maintain reduced delivery lead time, a wider range of parts of components, improved OTD (on-time delivery), achieve a high degree of technical expertise, and update product designs on a regular basis in order to fulfill customers’ needs [26].
2.1. Benefits and Challenges of MTO
Hemmati and Rabbani [27] discussed that in MTO environments, the main purpose is to keep track of arriving orders’ delivery dates for accomplishing timely and consistent delivery. Firms should use appropriate production planning to attain this goal. Indeed, an intensive literature review reveals that the MTO system’s production planning encounters various issues. Few research papers consider the order entry stage in MTO systems, an issue that was first presented by [28]; the authors emphasize hierarchical production planning as a critical component of MTO manufacturing system modeling. Hendry and Kingsman [29] considered input–output control systems as a method to reject or accept new order arrivals. Kingsman and Hendry [30] exhibited that input–output control improves performance measures such as capacity utilization, waiting time, and lead time. MTO systems are characterized by extended lead times, despite the fact that they provide high levels of product customization and retain constant client participation [31]. MTO companies can offer a wider range of items and customer orders while reducing inventory concerns, while customer lead times are usually higher [32]. Although MTO reduces inventory, it also introduces issues such as production scheduling issues in the event of demand congestion or the inability to specify correct due dates, among others [20].
Make-to-order (MTO) manufacturing organizations must be able to assess incoming orders with respect to productivity and choose the appropriate orders to remain competitive. For an MTO production system manager, the most pressing issues are order acceptance and machine control. Furthermore, MTO production must be a job shop, with process-specific workstations [33]. Ebadian et al. [25] presented an entirely new comprehensive decision structure for the order entry stage that takes into account all supply chain stakeholders, including the MTO organization, customers, subcontractors, and suppliers, in an attempt to strengthen the framework for production planning for MTO scenarios. To exist in an uncertain and complex environment, MTO production systems should react quickly in terms of beneficial market position.
Total lead time, cycle time and OTD (on-time delivery) are the major performance measures for products manufactured by the MTO approach [34]. The lower the cycle time standard deviation, the more negotiating leverage each MTO product has in deciding its delivery date and price. In a competitive climate, total lead time is another important component for high income, rapid growth, and increased margins for businesses. Total lead time is the amount of time it takes for an MTO product to arrive in the job pool and leave the production floor. Eivazy et al. [34] mentioned that this performance metric depicts workload flow and a balanced workload on the production floor, which is a key aspect in maintaining shop floor production management. Pool time, in addition to workload balancing, is also indicated by this performance measure. Reduced pool time and total lead time demonstrates the production management and scheduling model’s ability to release and dispatch MTO items quickly. On-time delivery is the crucial criterion for assessing the satisfaction of customer. This indicates other significant performance indicators such as tardiness on its own [34]. The major competitive factor in MTO systems is the lowering of lead times, which improves customer service (due date) [35]. Few challenges faced by the passenger car manufacturing industry are discussed hereafter. Due to the need to satisfy new client order criteria, MTO extends production lead times. Using MTO, one of the challenges of modern operations management is to reconcile lead time and inventory risk conflicts [36]. MTO would initially be unable to match demand, which would result in lost sales [22].
Some recent work related to MTO has been discussed hereafter. An Indian MTO handloom saree sector performed a study to determine the supply chain risks which were generated during the pandemic and how to minimize its impact on the MTO handloom industry [37]. Another study reviewed and examined the strategies employed to fix and validate sequencing issues in make-to-order production on a single machine setting [38]. To determine how PTH (production time hedging) impacts the retailer’s QDLT (quoted delivery lead time) choice and the supply chain’s effectiveness, an analytical model was developed [39]. For MTO manufacturing systems, a step-by-step model was created for combined optimization of production- and condition-based maintenance scheduling [40]. Another study presented a multi-objective discrete firefly algorithm as a solution for a scheduling problem encountered by flexible job shops in make-to-order production [41]. One of the most important success factors for MTO producers is their capacity to establish and uphold short due dates in response to customer inquiries [42]. Numerous studies on the automotive sector have been carried out but very few have discussed the importance of attainment of sustainable manufacturing through MTO. Ha and Woo [43] mentioned that operations or processes involved in car manufacture need massive investments into equipment, facilities, employees, and others. To implement digital transformation, increase digital technology innovation capacity, and enhance product research and development performance, automotive businesses should manage resources and the environment responsibly [44]. Dou et al. [45] mentioned that the number of nations beginning to prioritize the sustainable growth of manufacturing is growing.
2.2. AHP and TOPSIS
The Analytic Hierarchy Process (AHP) is a multi-criteria decision-making tool used where the decision is influenced by subjective and objective criteria. According to [46], “Since its inception, AHP has long been a tool in the hands of decision-makers and researchers, and it is one of the most widely used multiple-criterion decision-making tools on the market”. The ability of AHP to integrate with a number of techniques, such as quality function deployment, TOPSIS, linear programming, and fuzzy logic, is one of its distinguishing features. As a result, the user may get far more out of all of the integrated methods and achieve the desired outcome faster. An extensive literature review demonstrates that in the past, several researchers have used AHP both in manufacturing and service sectors. TOPSIS is a ranking algorithm established by Hwang and Yoon in 1981, and it is still in use today for conception and implementation. As a multi-criteria decision-making tool, TOPSIS is a straightforward but effective strategy for prioritization. An in-depth literature review has been performed to comprehend the importance of TOPSIS and its application in different fields. Table 1 and Table 2 highlight different areas of application for AHP and TOPSIS respectively.
3. Methodology
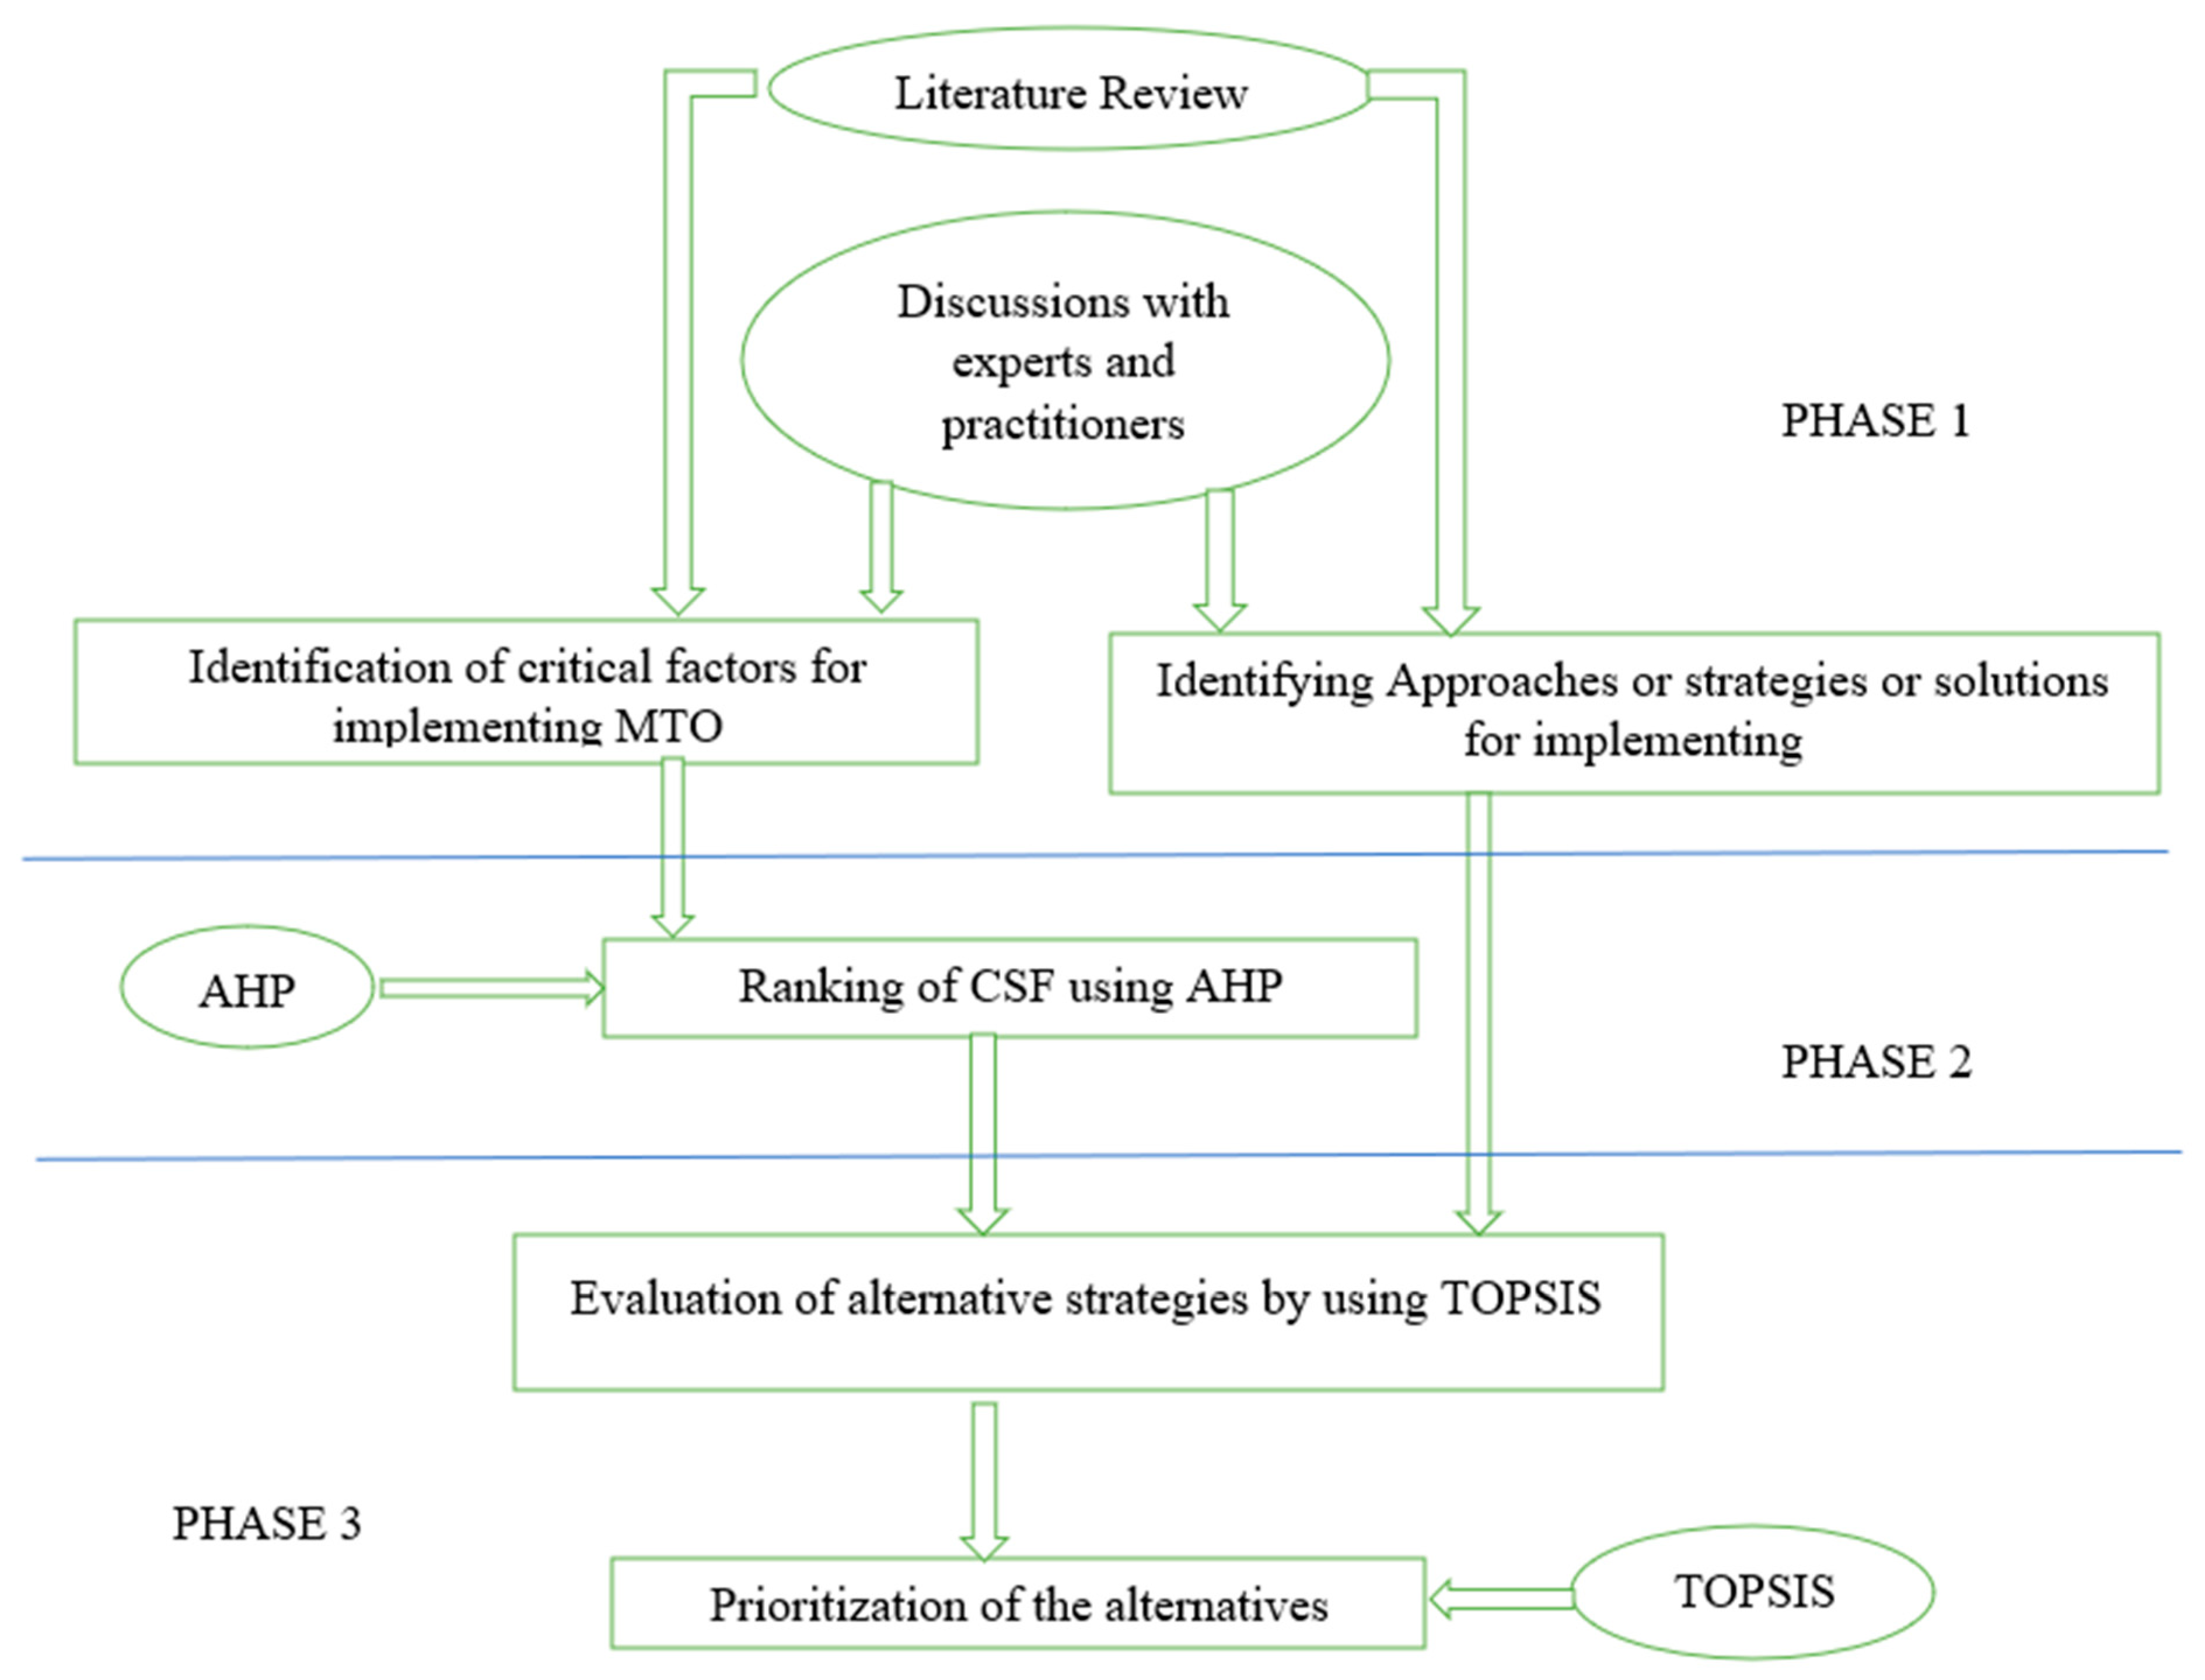
For allocating weights to critical success factors and ranking solutions in this study, a three-phase process was used. The first phase studied the critical success factors (CSF) which affect the MTO implementation system for passenger cars. The weight of these factors was determined during the second phase using AHP, and in the third phase, TOPSIS was applied to rank the strategies for implementing MTO (Figure 1).
3.1. Phase 1: Identification of Critical Success Factors (CSF) and Alternative Strategies
In this phase, critical success factors and alternative strategies have been identified through the use of literature review and discussion with experts, researchers, and academicians. The experts chosen are decision-makers in prestigious passenger car manufacturing companies in India. These professionals were selected based on their prior or present manufacturing organization’s titles or roles held. They were managers and consultants in the automobile industries with more than 10 years’ experience who came from geographically varied areas around India. The following arguments support this particular division of decision-makers as experts: (a) for expert practitioners, who are also the study’s biggest stakeholders and have the necessary industry expertise and knowledge of the actual ramifications of particular actions or policies, there were the most respondents; and (b), academicians and researchers are knowledgeable with the theoretical foundations of the various sustainability elements as well as specifics of some issues that are frequently disregarded by practitioners in the industry.
3.2. Phase 2: Application of AHP for Relative Importance of Critical Success Factors
AHP is a simple technique for decision-making designed by Saaty (1980) to tackle complicated, multi-attribute, and unstructured problems. When both tangible and intangible components of a decision need to be examined, AHP is a strong and adaptive decision-making technique that may help people define priorities and choose the optimal option [68]. The AHP technique is based on three guiding principles: the model’s structure; evaluating options and criteria; and synthesizing priorities. Comparisons of multiple pairwise in AHP are done according to a nine-level standardized comparison scale [69] (Table 3).
There are three main steps in the AHP, which are (a) developing the decision hierarchy, (b) the prioritization procedure, and (c) calculation of results. To establish the method’s outcome, the consistency ratio (CR) for every one of the matrices is computed, as well as the total inconsistency for the hierarchy. The consistency index is a measure of inconsistency, and the equation consistency index (CI) gives the deviations from consistency.
By dividing the CI by a value from the random consistency index database, the consistency ratio (CR) is computed (RI).
3.3. Phase 3: Selection of Best Strategy Using TOPSIS
The goal of the standard TOPSIS method is to choose the alternatives that are the shortest distance from the positive ideal solution and the furthest away from the negative ideal solution. The positive ideal solution boosts advantages and lowers costs, while the negative ideal solution increases costs while lowering benefits. TOPSIS includes the following steps.
Step 1: For the ranking, create a decision matrix. The structure of the matrix is as follows:
Step 2: Calculate R (= [rji]), the normalized decision matrix, and rji, the normalized value is calculated as
Step 3: To get the weighted normalized decision matrix, multiply the normalized decision matrix by the related weights. Vji is the weighted normalized value derived as follows:
where represents the weight of the ith attribute or criterion.
Step 4: Establish the positive-ideal and negative-ideal scenarios.
where corresponds to benefit criteria, and corresponds to cost criteria.
Step 5: Calculate the separation measurements using the n-dimensional Euclidean distance. The distance between alternative option and the positive-ideal solution is expressed as
Each alternative is distanced from the negative-ideal solution in the same way.
Step 6: Calculate and rank the performance order based on how near the alternative is to the ideal solution. The relative closeness of the alternative Aj can be expressed as
where the index value of lies between 0 and 1. The higher the index value, the better the alternative’s performance.
4. Strategy Selection for Implementing an MTO System for Passenger Car Manufacturers
4.1. Critical Success Factors
For identifying critical success factors and mapping them with implementation strategies, several experts from the automobile sector were contacted. After discussion and keeping in view the importance of study, ten experts agreed to participate in the study. Out of these ten, 4 are from manufacturing area, 2 from marketing and strategy, 2 from IT, 1 from product design and development, and 1 expert representing the vendor. On the basis of discussion with the practitioners and literature review, 18 critical success factors have been identified which are important for implementing MTO in automobile sectors (Table 4). Furthermore, 3 approaches are ranked for the implementation of an MTO system for automobile companies manufacturing passenger cars.
4.2. Implementation Strategies
For the implementation of an MTO system or changing the existing MTS to MTO system, the organization needs to select the appropriate implementation strategy. The following strategies that are significant for implementing MTO in the automotive industries have been identified through with practitioners and research review.
- IT system-centric: Jain et al. [89] considered IT-enabled technology as one of the critical enablers for customization. Jitpaiboon et al. [90] supported the need for enterprises to integrate their usage of IT for strategy, infrastructure, and operational activity. According to Vinodh et al. [91] and Zhang et al. [92], manufacturing sectors need to use CAD, CAM, and CAE solutions to reduce customer response times. Any firm attempting to deploy make-to-order should put the most emphasis on the Internet’s ability to connect customers and suppliers, online product setup, and IT-enabled techniques.
- Design-, innovation- and production-centric: Rossini et al. [93] illustrated implementation of Kaizen through a real case study for high-mix low-volume production. Companies need to offer increasingly customized items on the market in order to stay competitive. The sort of production method that must be chosen is impacted by this customization [94]. Production planning in MTO systems is more difficult than in MTS systems because of the large range of products, the small number of standard items, and the impossibility of accurate forecasts [13]. MTO reduces the expense of carrying inventory, but it also introduces issues such as production scheduling issues when demand is high or issues with precise due date setting, etc. [20].
- Customer-centric: The customer’s choice is the foundation of make-to-order production. MTO companies employ many production policies to increase customer satisfaction and has its own benefits and drawbacks [18]. In an MTO system, production does not start unless there is a demand. The system manufactures in accordance with customer requirements and does not maintain an inventory of finished goods [17]. There is constant pressure from customers on suppliers to increase quality, reduce costs, and decrease delivery delays [20]. In MTO, before a customer places a request, the product’s parameters are unknown, and even after the order has been accepted, they may change during processing [95]. Therefore, an effective MTO strategy is one that efficiently utilizes all the organization’s professional resources to produce products as per the customer’s needs.
The role of these 3 strategies in different phases of supply chain of passenger car manufacturing has been discussed (Table 5) to understand their importance and need. Automobile experts were interviewed, and their valuable inputs were used for this part of the study.
4.3. Relative Importance of CSF Using AHP
This section discusses the weights of factors of MTO implementation for passenger cars by using AHP (data collection).
The criteria’s weights to be utilized in the ranking process are determined by an AHP approach after the decision hierarchy of the problem has been formed and data were collected. There were three phases to the data collection. In the first phase, the advantages of introducing MTO in the automotive industry were explained to the specialists. In the second phase, an online platform for self-assessment data collection was developed and made available to the experts via email. The automobile experts were interviewed as part of the third step of data gathering and were tasked with constructing individual pairwise comparison matrixes using the nine-point intensity important scale mentioned in Table 3.
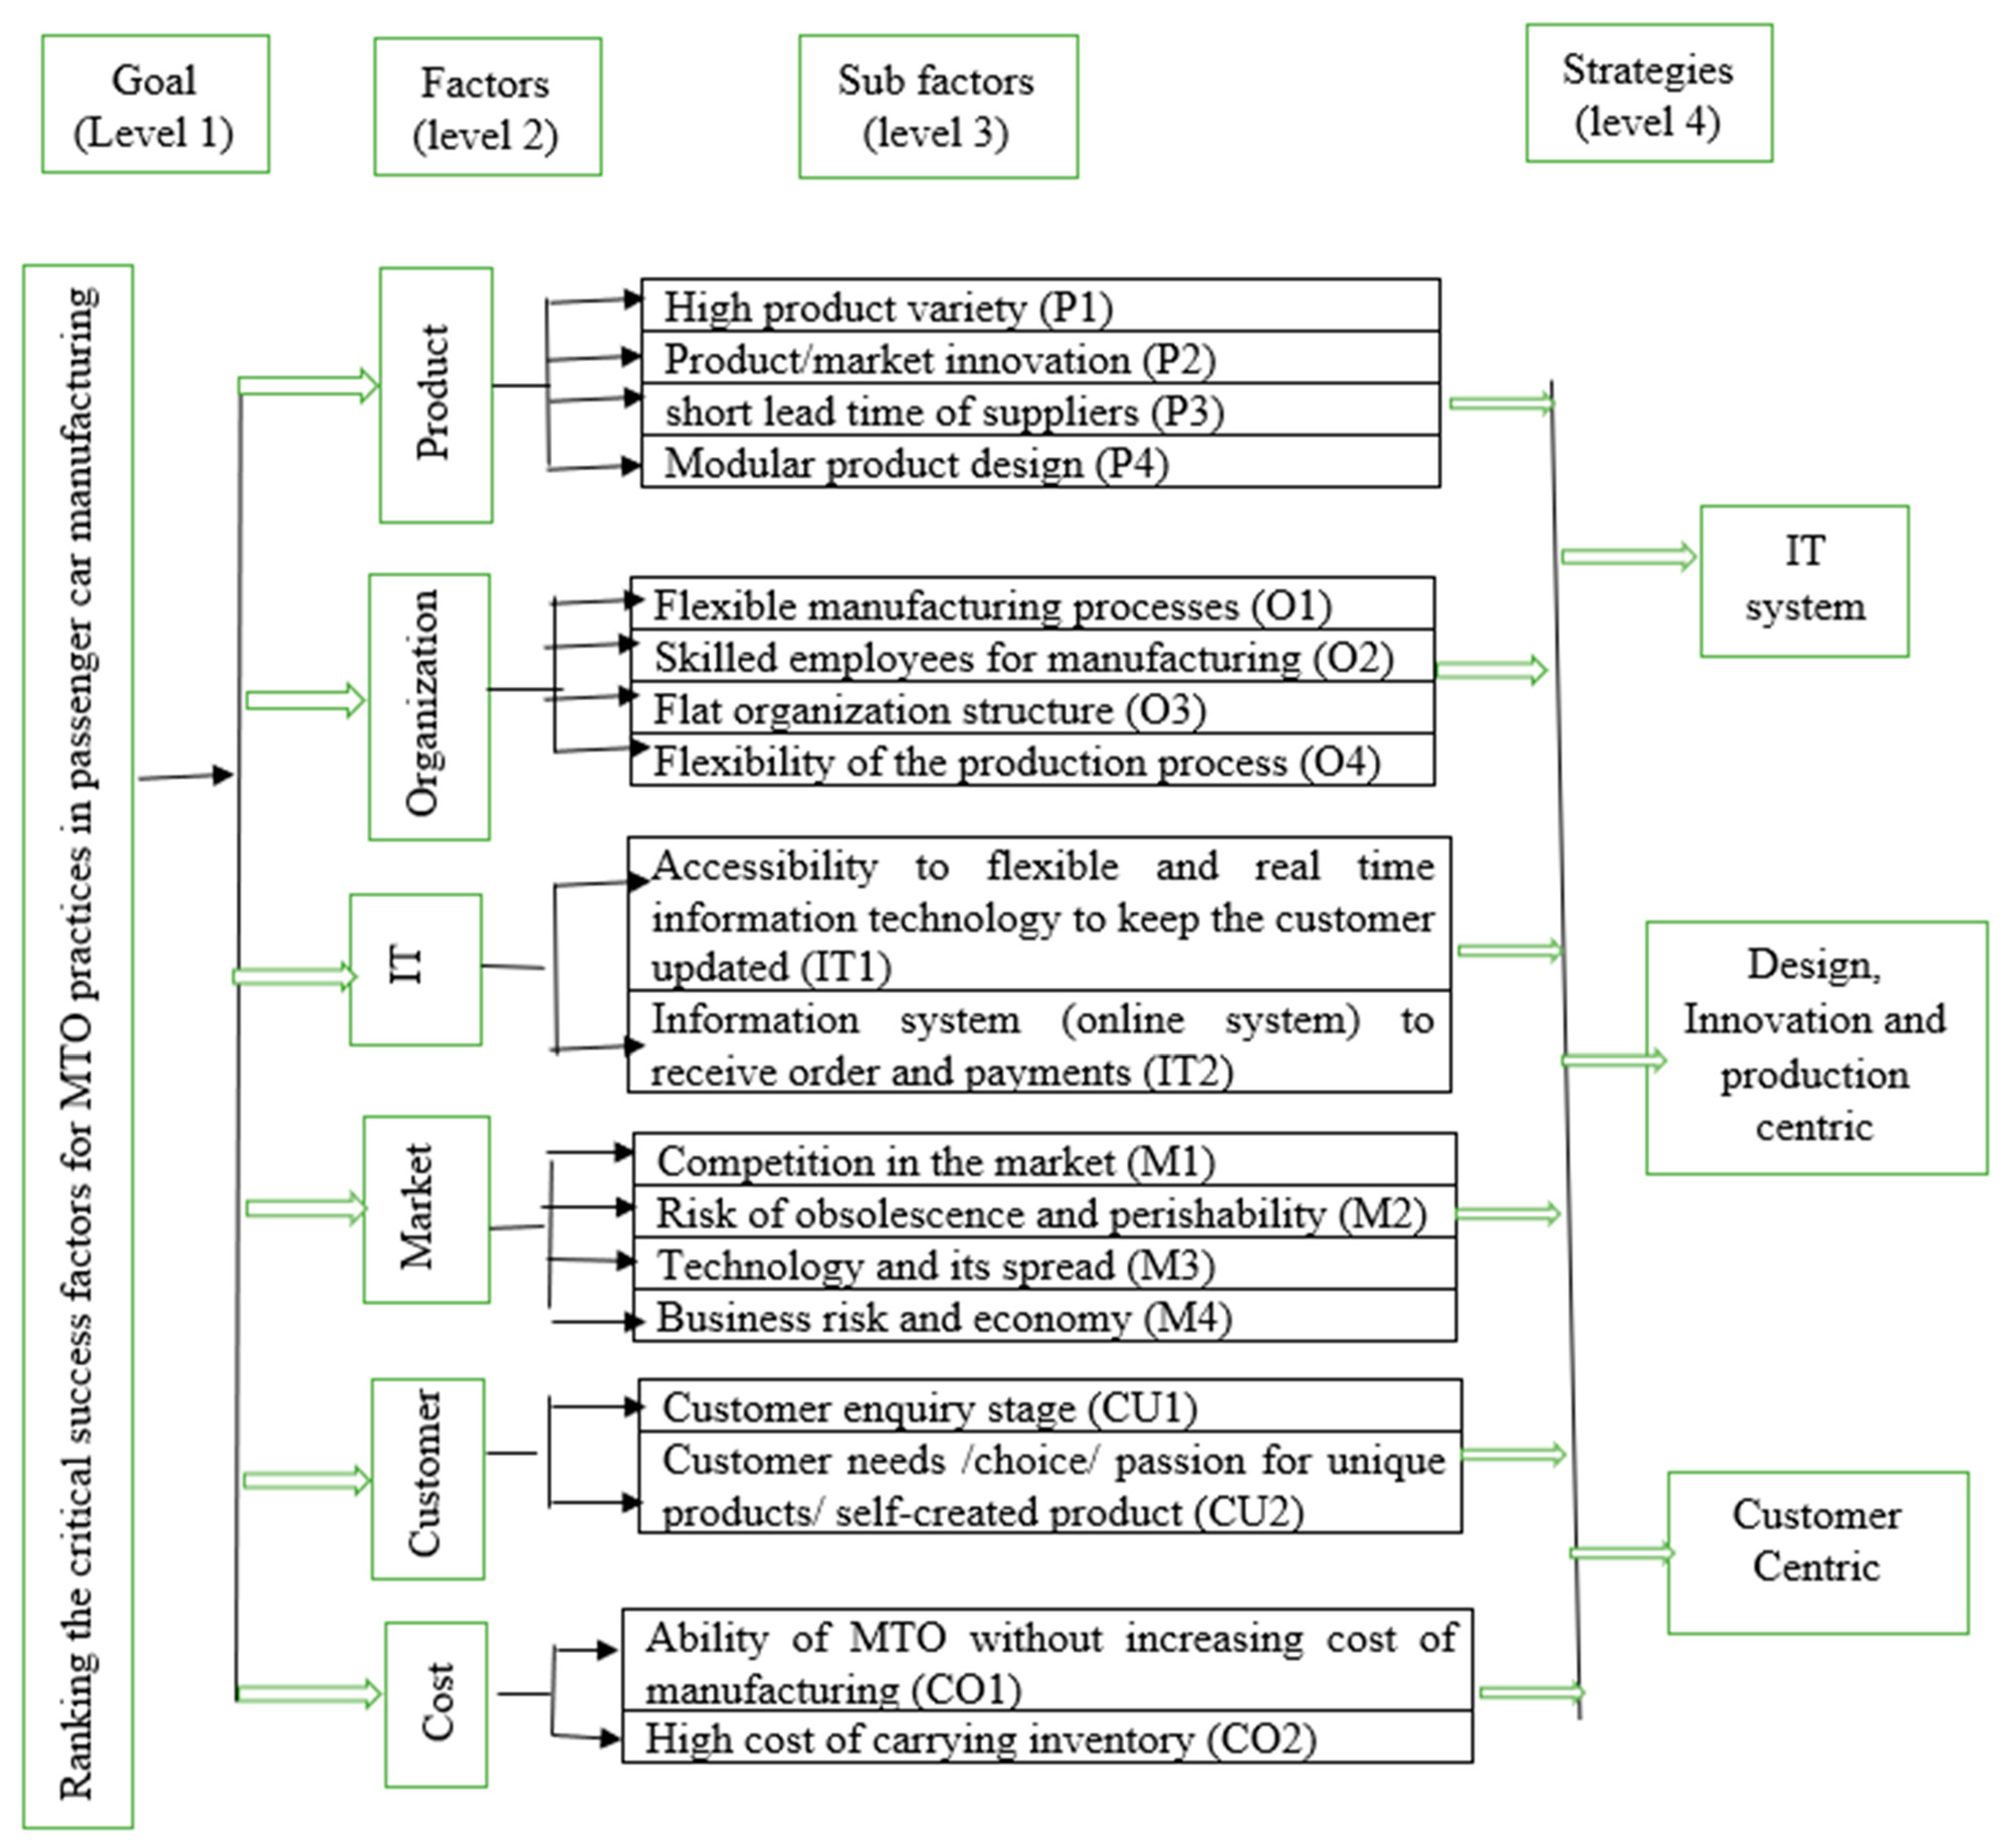
A total of 18 critical success factors are broadly grouped into 6 categories as shown in level 2 and level 3 of Figure 2. Initially, all the six factors at level 2 (Figure 2) are compared among themselves. The next step is to extract the weights of each member in the pairwise comparison matrix after it has been constructed. Table 6 shows the comparison results and the weight of 6 factors. The next step includes comparison and relative weights among 18 sub-factors toward the six factors and are shown in Table 7, Table 8, Table 9, Table 10, Table 11 and Table 12. Along with local weights, global weights are also calculated for the product’s local weight and its category’s priority. Finally, the weights of 18 critical success factors are compiled in Table 13.
The consistency of pairwise comparison of factors is measured by ⅄max (Lambda), CI, and CR. In this case, for pairwise matrix of six categories of critical success factors, ⅄max = 6.57, CI = 0.11, and CR = 0.09. The consistency ratio (CR) is the third ratio, and it is used to directly measure the consistency of pairwise comparisons. The comparisons are permitted if the CR is less than 0.10. Since all CR inconsistency ratios are less than 0.1 in this case, all judgments are consistent.
4.4. Ranking of Strategies Using TOPSIS
With the help of experts and literature review three strategies have been selected to be ranked for implementation of MTO in passenger car manufacturing. The first strategy is IT system-centric, the second strategy is design-, innovation- and production-centric, while the third strategy is customer-centric. TOPSIS methodology is adopted for ranking the alternative strategies that have been finalized. It starts by preparing a normalization matrix of critical success factors vs. strategies, and normalized values are determined during this first step. The collected data are then organized into a decision matrix form. The weights allocated to each critical success factor are used to find the weighted normalized decision matrix (Table 14). The ideal and negative ideal solutions from the decision matrix are discovered once the weighted formation is performed. Thereafter, on the basis of these solutions, alternatives are ranked (Table 15).
5. Result and Discussion
Saaty’s (1980) Analytic Hierarchy Process was used to rank the critical success factors for three different approaches. A hierarchy of six factors, eighteen sub-factors, and three strategies was used to calculate the priority rankings for each strategy for implementation of MTO for passenger cars. On a pairwise basis, the factors and sub-factors were compared.
The integrated AHP and TOPSIS methods made it more organized and effective for the decision-maker to select the best strategy for MTO implementation by ranking and prioritizing processes. The maximum weight value was used to consider the most valuable critical success factors, which were represented such that Market > Customer > Organization > Product > IT > Cost. This shows that ‘market’ is the most significant critical success factor for MTO implementation in passenger car manufacturing. The sub-factors in this study include market sub-factors, which are M4 > M2 > M3 > M1, and which show that ‘business risk and economy’ (M4) for MTO implementation is the highest weightage sub-factor and ‘competition in the market’ (M1) is the lowest weightage sub-factor of all sub-critical success factors. Ranking value of ‘customer’ factors are CU2 > CU1, respectively, in which the ‘customer needs’ sub-factor has more weight than the ‘customer enquiry’ stage. Organization factors’ ranking values are O4 > O1 > O2 > O3, respectively, in which ‘flexibility of production process’ is the highest weightage sub-factor and ‘flat organization structure’ is the lowest weightage sub-factor. Product factors’ ranking values are P2 > P4 > P1 > P3, respectively, in which ‘product/market innovations’ is the highest weightage sub-factor. IT factors’ ranking values are IT1 > IT2, in which ‘accessibility to flexible and real-time information technology to keep the customer updated’ and ‘information system (online system) to receive order and payments’ are the lowest weightage sub-factors of all IT factors. Cost factors’ ranking values are CO1 > CO2 (Table 12), respectively, in which ‘ability of the MTO without increasing cost of manufacturing’ is the highest weightage sub-factor, while ‘high cost of carrying inventory’ is the lowest weightage sub-factor.
To implement MTO in the manufacture of passenger cars, a ranking of factors has been suggested to decision-makers to make the best strategy. With the help of TOPSIS, the Ci value were used to consider prioritizing of strategies. The Ci values are S3 > S2 > S1, respectively. The highest Ci value is the customer-centric (S3) strategy, and the lowest value is the IT system-centric (S1) strategy. This study has an advantage in that it considered numerous critical success factors related to the automobile sector, while other authors have only studied a few of these, and indeed even fewer have studied MTOs in the automobile industry. Some of these studies have been discussed here: Yu et al. [96] worked only on manufacturing lead time in make-to-order production; Sun et al. [97] considered only two factors, i.e., customer delivery time and demand variance, whereas this study focused on numerous other factors; and Chua et al. [98] analyzed the MTO supply chain, taking into consideration only two factors, i.e., lead time market elasticity and price.
6. Practical/Managerial Implications
The practical objective of this research is to offer top-level manufacturing executives in the automotive industry strategic guidance on how to promote make-to-order manufacturing in order to achieve sustainability. Based on the study’s findings, three contributions have been made to the automobile industry. Firstly, the findings can be useful for organizations to get to know beforehand what is required to change the manufacturing strategy from MTS to MTO. Secondly, organizations would be able to map their existing manufacturing system and identify the critical success factors and define strategies for implementing MTO. Thirdly, the present work will also assist companies to adopt counter-measures for MTO implementation so that it becomes easier to minimize the difficulties while implementing MTO. This study has made an effort to assist managers to control inventory and thereby attain sustainability in passenger car manufacturing by adopting an MTO strategy.
7. Conclusions, Limitation and Future Direction
As the variety of products manufactured by a company increases, make-to-order manufacturing systems start becoming more effective in meeting customer demands at a low cost. Many sectors and companies have started implementing this manufacturing strategy and achieved a good competitive edge. However, in the automobile sector, it is at a nascent stage and not much work is being reported in trade magazines as well as in research publications. Thus, a need was felt to identify the critical success factors in the implementation of an MTO system. In addition, it felt necessary to select the right strategy for the successful implementation of the MTO once it was decided to transition away from make-to-stock.
In this study, eighteen critical success factors were identified based on a literature review, and three strategies were defined. The CSF were rated for their importance using AHP and TOPSIS was used to rank the alternate strategies. It was observed that customer needs, business risk and economy, flexibility of the production process, risk of obsolescence and perishability, accessibility to flexible and real-time information technology to keep the customer updated, and technology and its spread account for 64% of critical success factors for the implementation of MTO in passenger cars of the automobile sector. Further, the results of TOPSIS show that a customer-centric approach is the best system for MTO in passenger car manufacturing. The key features of customer-centric strategy are customer needs or choices, business risk and economy, flexibility of the production process, flexible manufacturing processes, risk of obsolescence and perishability, accessibility to flexible and real-time information technology to keep the customer updated, customer enquiry stage, ability of MTO without increasing cost of manufacturing, and product/market innovation.
The study has some limitations, much like any other study. The study has been carried out using AHP and TOPSIS. In future studies, methods such as fuzzy logic or cluster analysis can be applied, or a regression model can be developed to obtain more prolific or improved results. The critical success factors and the implementation strategies identified in this study can be analyzed from another industry or country’s perspective too. The AHP and TOPSIS technique necessitates the opinion of specialists, which may be biased and alter the study’s findings, leading to its disintegration during the adoption phase. Finally, it is challenging to generalize the results for other sectors since the results are industry-specific and cannot be compared with results from other industries because each industry’s supply chain network is different and responds to customer’s choices differently.
Author Contributions
Conceptualization, S.U., S.K.G. and R.S.; methodology, S.U. and S.K.G.; vallidation, S.U.; formal analysis, S.U., S.K.G. and R.S.; investigation, S.U.; resources, S.U., S.K.G. and R.S.; data curation, S.U.; writing—original draft preparation, S.U.; writing—review and editing, S.K.G. and R.S.; visualization, S.U., S.K.G. and R.S.; supervision, S.K.G. and R.S.; All authors have read and agreed to the published version of the manuscript.
Funding
This research received no specific grant from any funding agency in the public, commercial or not-for-profit sectors.
Institutional Review Board Statement
Not applicable.
Informed Consent Statement
Not applicable.
Data Availability Statement
Not applicable.
Acknowledgments
We sincerely thank the editors and anonymous reviewers for their constructive and insightful comments, which led to major improvements. We wish to thank the automobile experts, professionals, and academicians for their technical support and valuable inputs.
Conflicts of Interest
The authors declare no conflict of interest.
References
- Kannaujiya, V.K.; Sundaram, S.; Sinha, R.P. Advances in Production Technology. In Phycobiliproteins: Recent Developments and Future Applications; Springer: Singapore, 2017. [Google Scholar] [CrossRef]
- Konstantas, D.; Ioannidis, S.; Kouikoglou, V.S.; Grigoroudis, E. Linking product quality and customer behavior for performance analysis and optimization of make-to-order manufacturing systems. Int. J. Adv. Manuf. Technol. 2017, 95, 587–596. [Google Scholar] [CrossRef]
- Almehdawe, E.; Jewkes, E. Performance analysis and optimization of hybrid manufacturing systems under a batch ordering policy. Int. J. Prod. Econ. 2013, 144, 200–208. [Google Scholar] [CrossRef]
- Mohammadi, S.; Al-E-Hashem, S.M.; Rekik, Y. An integrated production scheduling and delivery route planning with multi-purpose machines: A case study from a furniture manufacturing company. Int. J. Prod. Econ. 2019, 219, 347–359. [Google Scholar] [CrossRef]
- Gharehgozli, A.H.; Rabbani, M.; Zaerpour, N.; Razmi, J. A comprehensive decision-making structure for acceptance/rejection of incoming orders in make-to-order environments. Int. J. Adv. Manuf. Technol. 2007, 39, 1016–1032. [Google Scholar] [CrossRef]
- Zennaro, I.; Finco, S.; Battini, D.; Persona, A. Big size highly customised product manufacturing systems: A literature review and future research agenda. Int. J. Prod. Res. 2019, 57, 5362–5385. [Google Scholar] [CrossRef] [Green Version]
- Tripathi, S.; Talukder, B. Supply Chain Performance and Profitability in Indian Automobile Industry: Evidence of Segmental Difference. Glob. Bus. Rev. 2020, 24, 371–392. [Google Scholar] [CrossRef]
- Murugan, R.P. Managing the change in sales and operations planning in a customer configured business scenario in commercial vehicles industry. J. Emerg. Technol. Innov. Res. 2019, 6, 500–505. [Google Scholar]
- König, S.; Reihn, M.; Abujamra, F.G.; Novy, A.; Vogel-Heuser, B. Flexible scheduling of diagnostic tests in automotive manufacturing. Flex. Serv. Manuf. J. 2022, 35, 320–342. [Google Scholar] [CrossRef]
- Arokiaraj, D.; Banumathi, M. Factors Influencing the Purchase Decision of Passenger Cars in Puduchery. Int. J. Exclus. Manag. Res. 2014, 2249–2585. Available online: https://ssrn.com/abstract=2986661 (accessed on 1 April 2014).
- Bhatia, J. Porter’s Five Forces Industry Analysis of Indian Passenger Car Industry. Pac. Bus. Rev. Int. 2016, 8, 113–123. Available online: http://oaji.net/articles/2016/3050-1456208479.pdf (accessed on 1 August 2016).
- Kerkkänen, A. Determining semi-finished products to be stocked when changing the MTS-MTO policy: Case of a steel mill. Int. J. Prod. Econ. 2007, 108, 111–118. [Google Scholar] [CrossRef]
- Hemmati, S.; Ebadian, M.; Nahvi, A. A new decision making structure for managing arriving orders in MTO environments. Expert Syst. Appl. 2012, 39, 2669–2676. [Google Scholar] [CrossRef]
- Rafiei, H.; Rabbani, M. Capacity coordination in hybrid make-to-stock/make-to-order production environments. Int. J. Prod. Res. 2012, 50, 773–789. [Google Scholar] [CrossRef]
- Li, H.; Womer, K. Optimizing the supply chain configuration for make-to-order manufacturing. Eur. J. Oper. Res. 2012, 221, 118–128. [Google Scholar] [CrossRef]
- Rabbani, M.; Bagherzadeh, N.; Rafiei, H. Calculating raw material and work-in-process inventories in MTO/MTS production. J. Res. Sci. Eng. Technol. 2014, 2, 109–116. [Google Scholar]
- Fernandes, N.O.; Silva, C.; Carmo-Silva, S. Order release in the hybrid MTO–FTO production. Int. J. Prod. Econ. 2015, 170, 513–520. [Google Scholar] [CrossRef]
- Rabbani, M.; Dolatkhah, M. Simultaneous production planning of make-to-order (MTO) and make-to-stock (MTS) products using simulation optimization. Case study: Soren Restaurant. Int. J. Adv. Logist. 2017, 6, 30–44. [Google Scholar] [CrossRef]
- Hemmati, S.; Rabbani, M.; Ebadian, M. Positioning of Order Penetrating Point in Hybrid MTS/MTO Environments. In Proceedings of the 2009 Third UKSim European Symposium on Computer Modeling and Simulation, Athens, Greece, 25–27 November 2009; pp. 263–268. [Google Scholar] [CrossRef]
- Günalay, Y. Efficient management of production-inventory system in a multi-item manufacturing facility: MTS vs. MTO. Int. J. Adv. Manuf. Technol. 2010, 54, 1179–1186. [Google Scholar] [CrossRef]
- Rafiei, H.; Rabbani, M. Order partitioning in hybrid MTS/MTO contexts using fuzzy ANP. World Acad. Sci. Eng. Technol. 2009, 58, 467–471. [Google Scholar] [CrossRef]
- Peeters, K.; Van Ooijen, H. Hybrid make-to-stock and make-to-order systems: A taxonomic review. Int. J. Prod. Res. 2020, 58, 4659–4688. [Google Scholar] [CrossRef]
- Fakhrzad, M.B.; Mohagheghian, E. A nash game in multi-period planning of make-to-order production system across the supply chain. Int. J. Ind. Eng. Prod. Res. 2019, 30, 231–246. [Google Scholar]
- Kalantari, M.; Rabbani, M.; Ebadian, M. A decision support system for order acceptance/rejection in hybrid MTS/MTO production systems. Appl. Math. Model. 2011, 35, 1363–1377. [Google Scholar] [CrossRef]
- Ebadian, M.; Rabbani, M.; Jolai, F.; Torabi, S.; Tavakkoli-Moghaddam, R. A new decision-making structure for the order entry stage in make-to-order environments. Int. J. Prod. Econ. 2008, 111, 351–367. [Google Scholar] [CrossRef]
- Raturi, A.S.; Meredith, J.R.; McCutcheon, D.M.; Camm, J.D. Coping with the build-to-forecast environment. J. Oper. Manag. 1990, 9, 230–249. [Google Scholar] [CrossRef]
- Hemmati, S.; Rabbani, M. Make-to-order/make-to-stock partitioning decision using the analytic network process. Int. J. Adv. Manuf. Technol. 2009, 48, 801–813. [Google Scholar] [CrossRef]
- Hendry, L.; Kingsman, B. Production planning systems and their applicability to make-to-order companies. Eur. J. Oper. Res. 1989, 40, 1–15. [Google Scholar] [CrossRef]
- Hendry, L.C.; Kingsman, B.G. Customer Enquiry Management: Part of a Hierarchical System to Control Lead Times in Make-to-Order Companies. J. Oper. Res. Soc. 1993, 44, 61–70. [Google Scholar] [CrossRef]
- Kingsman, B.; Hendry, L. The relative contributions of input and output controls on the performance of a workload control system in Make-To-Order companies. Prod. Plan. Control 2002, 13, 579–590. [Google Scholar] [CrossRef]
- Ioannou, G.; Dimitriou, S. Lead time estimation in MRP/ERP for make-to-order manufacturing systems. Int. J. Prod. Econ. 2012, 139, 551–563. [Google Scholar] [CrossRef]
- Teimoury, E.; Modarres, M.; Khondabi, I.G.; Fathi, M. A queuing approach for making decisions about order penetration point in multiechelon supply chains. Int. J. Adv. Manuf. Technol. 2012, 63, 359–371. [Google Scholar] [CrossRef]
- Ghelase, D.; Daschievici, L.; Marinescu, V.; Epureanu, A. Method for control of the make-to-order manufacturing system on the base of earning power assessment. Int. J. Adv. Manuf. Technol. 2012, 65, 1439–1458. [Google Scholar] [CrossRef]
- Eivazy, H.; Rabbani, M.; Ebadian, M. A developed production control and scheduling model in the semiconductor manufacturing systems with hybrid make-to-stock/make-to-order products. Int. J. Adv. Manuf. Technol. 2009, 45, 968–986. [Google Scholar] [CrossRef]
- Renna, P. Production control policies for a multistage serial system under MTO-MTS production environment. Int. J. Adv. Manuf. Technol. 2015, 83, 449–459. [Google Scholar] [CrossRef]
- Tomino, T.; Park, Y.; Hong, P.; Roh, J.J. Market flexible customizing system (MFCS) of Japanese vehicle manufacturers: An analysis of Toyota, Nissan and Mitsubishi. Int. J. Prod. Econ. 2009, 118, 375–386. [Google Scholar] [CrossRef]
- Dohale, V.; Ambilkar, P.; Gunasekaran, A.; Verma, P. Supply chain risk mitigation strategies during COVID-19: Exploratory cases of “make-to-order” handloom saree apparel industries. Int. J. Phys. Distrib. Logist. Manag. 2021, 52, 109–129. [Google Scholar] [CrossRef]
- Martinelli, R.; Mariano, F.C.M.Q.; Martins, C.B. Single machine scheduling in make to order environments: A systematic review. Comput. Ind. Eng. 2022, 169, 108190. [Google Scholar] [CrossRef]
- Zhai, Y.; Cheng, T. Lead-time quotation and hedging coordination in make-to-order supply chain. Eur. J. Oper. Res. 2021, 300, 449–460. [Google Scholar] [CrossRef]
- Qiu, S.; Ming, X.; Sallak, M.; Lu, J. Joint optimization of production and condition-based maintenance scheduling for make-to-order manufacturing systems. Comput. Ind. Eng. 2021, 162, 107753. [Google Scholar] [CrossRef]
- Álvarez-Gil, N.; Rosillo, R.; de la Fuente, D.; Pino, R. A discrete firefly algorithm for solving the flexible job-shop scheduling problem in a make-to-order manufacturing system. Central Eur. J. Oper. Res. 2020, 29, 1353–1374. [Google Scholar] [CrossRef]
- Mezzogori, D.; Romagnoli, G.; Zammori, F. Job—Shops Managed by Workload Control; Springer: New York, NY, USA, 2020. [Google Scholar]
- Ha, Y.-K.; Woo, S.-H. Transportation Infrastructure or Economic Power? Development of the Automobile Industry in the United States. Sustainability 2022, 14, 1649. [Google Scholar] [CrossRef]
- Men, F.; Dong, F.; Liu, Y.; Yang, H. Research on the Impact of Digital Transformation on the Product R&D Performance of Automobile Enterprises from the Perspective of the Innovation Ecosystem. Sustainability 2023, 15, 6265. [Google Scholar] [CrossRef]
- Dou, Z.; Wu, B.; Sun, Y.; Wang, T. The Competitiveness of Manufacturing and Its Driving Factors: A Case Study of G20 Participating Countries. Sustainability 2021, 13, 1143. [Google Scholar] [CrossRef]
- Fountzoula, C.; Technical, N. Analytic hierarchy process and its applications in the public sector: A review. Acad. Account. Financ. Stud. J. 2021, 25, 1–15. [Google Scholar]
- Wang, Z.; Ran, Y.; Yu, H.; Zhang, S.; Zhang, G. Precision analysis for five-axis CNC milling machine based on meta-action units and integrated weights with Shannon entropy and AHP. Int. J. Adv. Manuf. Technol. 2020, 107, 2767–2782. [Google Scholar] [CrossRef]
- Younas, M.; Jaffery, S.H.I.; Khan, M.; Khan, M.A.; Ahmad, R.; Mubashar, A.; Ali, L. Multi-objective optimization for sustainable turning Ti6Al4V alloy using grey relational analysis (GRA) based on analytic hierarchy process (AHP). Int. J. Adv. Manuf. Technol. 2019, 105, 1175–1188. [Google Scholar] [CrossRef]
- Oliveira, G.A.; Tan, K.H.; Guedes, B. Lean and green approach: An evaluation tool for new product development focused on small and medium enterprises. Int. J. Prod. Econ. 2018, 205, 62–73. [Google Scholar] [CrossRef]
- Durão, L.F.C.S.; Carvalho, M.M.; Takey, S.; Cauchick-Miguel, P.A.; Zancul, E. Internet of Things process selection: AHP selection method. Int. J. Adv. Manuf. Technol. 2018, 99, 2623–2634. [Google Scholar] [CrossRef]
- Fortunet, C.; Durieux, S.; Chanal, H.; Duc, E. DFM method for aircraft structural parts using the AHP method. Int. J. Adv. Manuf. Technol. 2017, 95, 397–408. [Google Scholar] [CrossRef]
- Rajesh, G.; Malliga, P. Supplier Selection based on AHP QFD Methodology. Procedia Eng. 2013, 64, 1283–1292. [Google Scholar] [CrossRef] [Green Version]
- Özkan, B.; BaŠligil, H.; Şahin, N. Supplier selection using Analytic Hierarchy Process: An application from Turkey. Proc. World Congr. Eng. 2011, 2, 1160–1165. [Google Scholar]
- Yücenur, G.N.; Vayvay, O.; Çetin Demirel, N. Supplier selection problem in global supply chains by AHP and ANP approaches under fuzzy environment. Int. J. Adv. Manuf. Technol. 2011, 56, 823–833. [Google Scholar] [CrossRef]
- Amiri, M.P. Project selection for oil-fields development by using the AHP and fuzzy TOPSIS methods. Expert Syst. Appl. 2010, 37, 6218–6224. [Google Scholar] [CrossRef]
- Şahin, T.; Ocak, S.; Top, M. Analytic hierarchy process for hospital site selection. Health Policy Technol. 2019, 8, 42–50. [Google Scholar] [CrossRef]
- Li, Y.; Cheng, Y.; Hu, Q.; Zhou, S.; Ma, L.; Lim, M.K. The influence of additive manufacturing on the configuration of make-to-order spare parts supply chain under heterogeneous demand. Int. J. Prod. Res. 2018, 57, 3622–3641. [Google Scholar] [CrossRef]
- Ocampo, L.A. Applying fuzzy AHP–TOPSIS technique in identifying the content strategy of sustainable manufacturing for food production. Environ. Dev. Sustain. 2018, 21, 2225–2251. [Google Scholar] [CrossRef]
- Vavrek, R.; Chovancová, J. Assessment of economic and environmental energy performance of EU countries using CV-TOPSIS technique. Ecol. Indic. 2019, 106, 105519. [Google Scholar] [CrossRef]
- Abdel-Basset, M.; Saleh, M.; Gamal, A.; Smarandache, F. An approach of TOPSIS technique for developing supplier selection with group decision making under type-2 neutrosophic number. Appl. Soft Comput. 2019, 77, 438–452. [Google Scholar] [CrossRef]
- Arabzad, S.M.; Ghorbani, M.; Razmi, J.; Shirouyehzad, H. Employing fuzzy TOPSIS and SWOT for supplier selection and order allocation problem. Int. J. Adv. Manuf. Technol. 2014, 76, 803–818. [Google Scholar] [CrossRef]
- Alao, M.; Ayodele, T.; Ogunjuyigbe, A.; Popoola, O. Multi-criteria decision based waste to energy technology selection using entropy-weighted TOPSIS technique: The case study of Lagos, Nigeria. Energy 2020, 201, 117675. [Google Scholar] [CrossRef]
- Hosseini, S.M.; Bahadori, M.; Raadabadi, M.; Ravangard, R. Ranking Hospitals Based on the Disasters Preparedness Using the TOPSIS Technique in Western Iran. Hosp. Top. 2018, 97, 23–31. [Google Scholar] [CrossRef]
- Umer, R.; Touqeer, M.; Omar, A.H.; Ahmadian, A.; Salahshour, S.; Ferrara, M. Selection of solar tracking system using extended TOPSIS technique with interval type-2 pythagorean fuzzy numbers. Optim. Eng. 2021, 22, 2205–2231. [Google Scholar] [CrossRef]
- Swain, B.; Priyadarshini, M.; Mohapatra, S.; Gupta, R.K.; Behera, A. Parametric optimization of atmospheric plasma spray coating using fuzzy TOPSIS hybrid technique. J. Alloy. Compd. 2021, 867, 159074. [Google Scholar] [CrossRef]
- Sirisawat, P.; Kiatcharoenpol, T. Fuzzy AHP-TOPSIS approaches to prioritizing solutions for reverse logistics barriers. Comput. Ind. Eng. 2018, 117, 303–318. [Google Scholar] [CrossRef]
- Sharma, P.; Singhal, S. Implementation of fuzzy TOPSIS methodology in selection of procedural approach for facility layout planning. Int. J. Adv. Manuf. Technol. 2016, 88, 1485–1493. [Google Scholar] [CrossRef]
- Rao, R.V.; Davim, J.P. A decision-making framework model for material selection using a combined multiple attribute decision-making method. Int. J. Adv. Manuf. Technol. 2006, 35, 751–760. [Google Scholar] [CrossRef]
- Najafi, A.; Karimpour, M.H.; Ghaderi, M. Application of fuzzy AHP method to IOCG prospectivity mapping: A case study in Taherabad prospecting area, eastern Iran. Int. J. Appl. Earth Obs. Geoinf. 2014, 33, 142–154. [Google Scholar] [CrossRef]
- Yildirim, V.; Yomralioglu, T.; Nisanci, R.; Çolak, H.E.; Bediroğlu, Ş.; Saralioglu, E. A spatial multicriteria decision-making method for natural gas transmission pipeline routing. Struct. Infrastruct. Eng. 2016, 13, 567–580. [Google Scholar] [CrossRef]
- Haskose, A.; Kingsman, B.; Worthington, D. Performance analysis of make-to-order manufacturing systems under different workload control regimes. Int. J. Prod. Econ. 2004, 90, 169–186. [Google Scholar] [CrossRef]
- Vidyarthi, N.; Elhedhli, S.; Jewkes, E. Response time reduction in make-to-order and assemble-to-order supply chain design. IIE Trans. 2009, 41, 448–466. [Google Scholar] [CrossRef]
- Pramod, M.; Garg, S. Analysis of flexibility requirements under uncertain environments. J. Model. Manag. 2006, 1, 196–214. [Google Scholar] [CrossRef]
- Sahin, F.; Robinson, E.P., Jr. Information sharing and coordination in make-to-order supply chains. J. Oper. Manag. 2005, 23, 579–598. [Google Scholar] [CrossRef]
- Garmdare, H.S.; Lotfi, M.M.; Honarvar, M. Integrated model for pricing, delivery time setting, and scheduling in make-to-order environments. J. Ind. Eng. Int. 2017, 14, 55–64. [Google Scholar] [CrossRef] [Green Version]
- He, N.; Zhang, D.; Li, Q. Agent-based hierarchical production planning and scheduling in make-to-order manufacturing system. Int. J. Prod. Econ. 2014, 149, 117–130. [Google Scholar] [CrossRef] [Green Version]
- Pan, T.; Zhang, Z.-H.; Cao, H. Collaborative production planning with production time windows and order splitting in make-to-order manufacturing. Comput. Ind. Eng. 2014, 67, 1–9. [Google Scholar] [CrossRef]
- Salamati-Hormozi, H.; Zhang, Z.-H.; Zarei, O.; Ramezanian, R. Trade-off between the costs and the fairness for a collaborative production planning problem in make-to-order manufacturing. Comput. Ind. Eng. 2018, 126, 421–434. [Google Scholar] [CrossRef]
- Zaerpour, N.; Rabbani, M.; Gharehgozli, A.H.; Tavakkoli-Moghaddam, R. A comprehensive decision making structure for partitioning of make-to-order, make-to-stock and hybrid products. Soft Comput. 2008, 13, 1035–1054. [Google Scholar] [CrossRef]
- Zaabar, I.; Arango-miranda, R.; Beauregard, Y.; Paquet, M. A Sustainable Multicriteria Decision Framework for Obso-lescence Resolution Strategy Selection. Sustainability 2021, 13, 8601. [Google Scholar] [CrossRef]
- Wang, Z.; Qi, Y.; Cui, H.; Zhang, J. A hybrid algorithm for order acceptance and scheduling problem in make-to-stock/make-to-order industries. Comput. Ind. Eng. 2018, 127, 841–852. [Google Scholar] [CrossRef]
- Khakdaman, M.; Wong, K.Y.; Zohoori, B.; Tiwari, M.K.; Merkert, R. Tactical production planning in a hybrid Make-to-Stock–Make-to-Order environment under supply, process and demand uncertainties: A robust optimisation model. Int. J. Prod. Res. 2014, 53, 1358–1386. [Google Scholar] [CrossRef]
- Kidwell, R.E. Seven decades of leadership and performance: An interview with Bernard M. Bass. J. Appl. Manag. Entrep. 2005, 10, 87–96. [Google Scholar]
- Easton, F.F.; Moodie, D.R. Pricing and lead time decisions for make-to-order firms with contingent orders. Eur. J. Oper. Res. 1999, 116, 305–318. [Google Scholar] [CrossRef]
- Chhimwal, M.; Agrawal, S.; Kumar, G. Measuring Circular Supply Chain Risk: A Bayesian Network Methodology. Sustainability 2021, 13, 8448. [Google Scholar] [CrossRef]
- Gunasekaran, A.; Ngai, E. Build-to-order supply chain management: A literature review and framework for development. J. Oper. Manag. 2004, 23, 423–451. [Google Scholar] [CrossRef]
- Kingsman, B.; Hendry, L.; Mercer, A.; de Souza, A.A. Responding to customer enquiries in make-to-order companies Problems and solutions. Int. J. Prod. Econ. 1996, 46–47, 219–231. [Google Scholar] [CrossRef] [Green Version]
- Stevenson, M.; Hendry, L.C.; Kingsman, B.G. A review of production planning and control: The applicability of key concepts to the make-to-order industry. Int. J. Prod. Res. 2005, 43, 869–898. [Google Scholar] [CrossRef]
- Jain, P.; Garg, S.; Kansal, G. A TISM approach for the analysis of enablers in implementing mass customization in Indian manufacturing units. Prod. Plan. Control 2021, 34, 173–188. [Google Scholar] [CrossRef]
- Jitpaiboon, T.; Dobrzykowski, D.D.; Ragu-Nathan, T.; Vonderembse, M.A. Unpacking IT use and integration for mass customisation: A service-dominant logic view. Int. J. Prod. Res. 2013, 51, 2527–2547. [Google Scholar] [CrossRef]
- Vinodh, S.; Sundararaj, G.; Devadasan, S.; Kuttalingam, D.; Rajanayagam, D. Amalgamation of mass customisation and agile manufacturing concepts: The theory and implementation study in an electronics switches manufacturing company. Int. J. Prod. Res. 2009, 48, 2141–2164. [Google Scholar] [CrossRef]
- Zhang, M.; Qi, Y.; Zhao, X.; Duray, R. Mass customisation systems: Complementarities and performance consequences. Int. J. Logist. Res. Appl. 2015, 18, 459–475. [Google Scholar] [CrossRef]
- Rossini, M.; Audino, F.; Costa, F.; Cifone, F.D.; Kundu, K.; Portioli-Staudacher, A. Extending lean frontiers: A kaizen case study in an Italian MTO manufacturing company. Int. J. Adv. Manuf. Technol. 2019, 104, 1869–1888. [Google Scholar] [CrossRef]
- Guillaume, R.; Grabot, B.; Thierry, C. Management of the risk of backorders in a MTO–ATO/MTS context under imperfect requirements. Appl. Math. Model. 2013, 37, 8060–8078. [Google Scholar] [CrossRef]
- Corti, D.; Pozzetti, A.; Zorzini, M. A capacity-driven approach to establish reliable due dates in a MTO environment. Int. J. Prod. Econ. 2006, 104, 536–554. [Google Scholar] [CrossRef]
- Yue, Z.; Jia, Y. A group decision making model with hybrid intuitionistic fuzzy information. Comput. Ind. Eng. 2015, 87, 202–212. [Google Scholar] [CrossRef]
- Sun, X.; Ji, P.; Sun, L.; Wang, Y. Positioning multiple decoupling points in a supply network. Int. J. Prod. Econ. 2008, 113, 943–956. [Google Scholar] [CrossRef]
- Chua, F.L.S.; Vasnani, N.N.; Pacio, L.B.M.; Ocampo, L.A. A Stackelberg game in multi-period planning of make-to-order production system across the supply chain. J. Manuf. Syst. 2018, 46, 231–246. [Google Scholar] [CrossRef]
Figure 1.
Model of selecting strategy for implementing MTO in passenger car manufacturing.

Figure 2.
Proposed model for selecting the best strategy for MTO.


Table 1.
Different applications of AHP.
| References | Areas of Application | Findings |
|---|---|---|
| Wang et al. [47] | Precision analysis of five-axis CNC milling machine (9 main criteria, 53 sub criteria) | Life prediction and precision evaluation of five-axis CNC milling machine. |
| M. Younas et al. [48] | Sustainable machining of Ti6Al4 alloy (4 criteria) | Achieved advantages of high-speed machining Ti6Al4V. |
| Oliveira et al. [49] | New product development focused on SMEs (6 criteria) | To define relative importance of SMEs’ characteristics. |
| Durão et al. [50] | Selection of Internet of Things process (5 criteria) | Selected suitable process for improvement with IOT technology. |
| Fortunet et al. [51] | Optimization of dimensions of an I-beam profile for obtaining optimal performances (3 main criteria) | Optimized geometry of an aircraft’s I-beam, considering use and manufacturing process. |
| Rajesh and Malliga [52], Özkan et al. [53] and Yücenur et al. [54] | Supplier selection (3 main criteria), supplier selection (4 main criteria, 16 sub criteria) and selection of global supplier (4 main criteria, 28 sub criteria, respectively) | Selection of supplier for a medium-scale industry manufacturing die-cast components of precision-machined aluminum alloy for computer and printer purchasing, as well as selection of supplier in the global supply chain. |
| Amiri [55] | Selecting project for oil field development (6 criteria) | AHP analyzed the structure of the problem for selection of project, and the weights of the criteria are determined. |
| Şahin et al. [56] | Site selection for establishing a new hospital (6 criteria and 19 sub-criteria) | AHP was used to investigate a decision model for selection of site for establishing a new hospital (Turkey). |
| Li et al. [57] | Assessment of risk in the life cycle of distributed wind farm (4 main criteria, 21 sub criteria) | Risk factors have been identified for distributed wind power and ranked using AHP. |
Table 2.
Different areas of application of TOPSIS.
| References | Areas of Application | Indicators/Alternatives |
|---|---|---|
| Ocampo [58] | Large food production firms (7 alternatives) | In food production systems, the content strategy to make it sustainable is determined using TOPSIS. |
| Vavrek and Chovancová [59] | Environmental energy performance of the EU countries (7 indicators) | Quantitative analysis of EU countries’ energy, environmental, and economic performance. |
| Abdel-Basset et al. [60] and Arabzad et al. [61] | Selection of suppliers (5 alternatives), supplier selection, and order allocation problem (5 alternatives, respectively) | TOPSIS was used to select suppliers with group decision-making under type-2 neutrosophic number. It was also used for calculating weights of criteria for supplier selection and order allocation. |
| Alao et al. [62] | Selection of technology for waste-to-energy plant (4 alternatives) | Used the waste stream from Lagos, Nigeria, to choose the best technology from the available waste-to-energy possibilities. |
| Hosseini et al. [63] | Ranking Western Iranian hospitals based on disaster preparedness (8 alternatives) | TOPSIS method was used to rate hospitals according to how well prepared they are for disasters. |
| Umer et al. [64] | Selection of solar tracking system (3 alternatives) | For making multiple subjective decisions, TOPSIS was employed by decision-makers with distinct decision-making perspectives. |
| Swain et al. [65] | Establishing the plasma spray process’ optimal parametric settings (3 alternatives) | TOPSIS revealed the gas flow rate and current’s optimized parametric setting. |
| Sirisawat and Kiatcharoenpol [66] | Green supply chain management (14 alternatives) | TOPSIS was used to prioritize solutions for reverse logistics barriers. |
| Sharma and Singhal [67] | Facility layout planning (5 alternatives) | TOPSIS was applied to select a procedural approach for facility layout planning. |
Table 3.
Nine-point intensity important scale for AHP.
| Definition | Intensity of Importance |
|---|---|
| Equally important | 1 |
| Moderately more important | 3 |
| Strongly more important | 5 |
| Very strongly more important | 7 |
| Extremely more important | 9 |
| Intermediate more important | 2,4,6,8 |
Table 4.
Critical success factors for implementing MTO.
| Critical Success Factors | Definition | Authors |
|---|---|---|
| Customer needs choice/passion for unique products/self-created product | Customers’ needs are on topmost priority as it influences the overall production system of MTO. | Rabbani and Dolatkhah [18], Zennaro et al. [6] |
| High product variety | Range and brand of products affects the performance measures in MTO. | Haskose et al. [71], Vidyarthi et al. [72] |
| Modular product design | Design of the product wherein it can be assembled with the standard set of constituents. | Zennaro et al. [6] |
| Flexible manufacturing processes | Flexibility in manufacturing processes will be the deciding factor for analyzing the time required for transformation of system from one type of job to other. | Pramod and Garg [73] |
| Accessibility to flexible and real-time information technology to keep the customer updated (why this is required) | For effective and enhanced MTO performance, information technology has to be real-time. Any kind of update or change in information will affect the whole system, thereby making it time-, energy- and cost-saving. | Sahin and Robinson [74] Zennaro et al. [6] |
| Information system (online system) to receive order and payments | Centralized online system for managing orders and payments effectively. | Zennaro et al. [6] |
| Competition in the market | Competition in the market impacts variables such as retail price, selling price, etc., and is affected by various factors such as advancement in technology. | Garmdare et al. [75], Fakhrzad and Mohagheghian [23] |
| Ability of MTO without increasing cost of manufacturing | Various parameters and resources have to be considered and analyzed to minimize total cost. | He et al. [76], Pan et al. [77] Salamati-Hormozi [78], |
| Risk of obsolescence and perishability | Inclination towards MTO systems is more, in case the possibility of product obsolescence or perishability is high. | Zaerpour et al. [79], Rafiei and Rabbani [21], S. Hemmati and Rabbani [27], Zaabar et al. [80] |
| High cost of carrying inventory | Lower storage or carrying cost is the key feature of MTO. | Wang et al. [81] |
| Skilled employees for manufacturing | MTO requires extensive use of a skilled workforce due to the use of general-purpose equipment or machines. | Li and Womer [15], Khakdaman et al. [82] |
| Flat organization structure | Organization has less hierarchical management and fewer employees. | Kidwell [83] |
| Short lead time of suppliers | Shorter and accurate lead times are desirable for successful MTO firms. Likewise, it depends on sequencing and scheduling decisions. | Easton and Moodie [84] |
| Technology and its spread | Advancement in technology increases competition for MTO. | Garmdare et al. [75], Chhimwal et al. [85] |
| Product/market innovation | This is the factor that helps MTO companies to be competitive and successful. | Gunasekaran and Ngai [86], Chhimwal et al. [85] |
| Business risk and economy | This market factor is critical in taking MTO decisions. | Gunasekaran and Ngai [86] |
| Flexibility of the production process | Higher flexibility is one of the prominent features of MTO. | Wang et al. [81] |
| Customer enquiry stage | Customer enquiry process has a direct and profitable impact on MTO. It further affects other decisions such as acceptance or rejection of an order and capacity planning. | Kingsman et al. [87], Stevenson et al. [88] |
Table 5.
Attributes of different implementation strategies in the supply chain of passenger car manufacturing.
Table 5.
Attributes of different implementation strategies in the supply chain of passenger car manufacturing.
| Stage | Description | Role of IT | Role of Design, Innovation, and Production | Role of Customer |
|---|---|---|---|---|
| Procurement | Procuring raw materials, parts, and subsystems. | Through information sharing, supply chain management permits supply chain participants to work closely in order to facilitate interactions of supplier–customer and lower transaction costs. | Design of the passenger car is the critical factor for purchasing raw materials, machines, tools, and other resources. | There is a constant pressure from the customer on suppliers to increase quality, reduce costs, and decrease delivery delays. |
| Manufacturing | Transforming raw materials into intermediate and finished products. | Activities related to IT, such as information processing, information coordination, and information integration are very useful for product development. | Design of the passenger car decides the manufacturing strategy. | Manufacturing strategy depends upon the customer’s demand. |
| Distribution/retailer | Distributing the finished products to retailers. | The use of technology in the distribution system is seen as a key competitive feature since it gives clients access to a limitless number of locations, times, and even product types, as well as updates related to due dates. | It is vital to coordinate the two functions in industrial issues where production and distribution expenses are of a similar magnitude in order to keep overall costs to a minimum. | Customer location and demand affects the distribution system of passenger cars. |
| Demand management | Methodology for forecasting, planning for, and managing the demand for goods and services. | Provides information about various options on the website Allows placement of order by customer. | Consumer segmentation and pricing discrimination are two demand management techniques that help increase the supply chain’s overall distribution efficiency while ensuring the necessary responsiveness to address real customer needs. | Customer provides requirements which further help in calculating the demand of the specific variant of passenger car. |
Table 6.
Pairwise comparison matrix of factors for implementing MTO.
| MTO | Product | Organization | IT | Market | Customer | Cost | Weights | Ranks |
|---|---|---|---|---|---|---|---|---|
| Product | 1 | 1/3 | 2 | 1/3 | 1/4 | 4 | 0.11 | 4 |
| Organization | 3 | 1 | 2 | 1/5 | 1/2 | 5 | 0.15 | 3 |
| IT | ½ | 1/2 | 1 | 1/3 | 1/6 | 2 | 0.07 | 5 |
| Market | 3 | 5 | 3 | 1 | 4 | 4 | 0.38 | 1 |
| Customer | 4 | 2 | 6 | 1/4 | 1 | 5 | 0.25 | 2 |
| Cost | ¼ | 1/5 | ½ | 1/4 | 1/5 | 1 | 0.04 | 6 |
Consistency ratio = 0.0928.
Table 7.
Pairwise comparison matrix of product-related sub-factors.
| Product (0.11) | P1 | P2 | P3 | P4 | Local Weights | Global Weights | Ranks |
|---|---|---|---|---|---|---|---|
| P1 | 1 | 1/2 | 3 | 1/3 | 0.18 | 0.02 | 3 |
| P2 | 2 | 1 | 5 | 2 | 0.43 | 0.05 | 1 |
| P3 | 1/3 | 1/5 | 1 | 1/3 | 0.08 | 0.01 | 4 |
| P4 | 3 | 1/2 | 3 | 1 | 0.31 | 0.03 | 2 |
Consistency ratio = 0.0591.
Table 8.
Pairwise comparison matrix of organization-related sub-factors.
| Organization (0.15) | O1 | O2 | O3 | O4 | Local Weights | Global Weights | Ranks |
|---|---|---|---|---|---|---|---|
| O1 | 1 | 3 | 5 | 1/2 | 0.31 | 0.05 | 2 |
| O2 | 1/3 | 1 | 5 | 1/3 | 0.18 | 0.03 | 3 |
| O3 | 1/5 | 1/5 | 1 | 1/5 | 0.06 | 0.01 | 4 |
| O4 | 2 | 3 | 5 | 1 | 0.45 | 0.07 | 1 |
Consistency ratio = 0.0817.
Table 9.
Pairwise comparison matrix of IT-related sub-factors.
| IT (0.07). | IT1 | IT2 | Local Weights | Global Weights | Ranks |
|---|---|---|---|---|---|
| IT1 | 1 | 5 | 0.83 | 0.06 | 1 |
| IT2 | 1/5 | 1 | 0.17 | 0.01 | 2 |
Consistency ratio = 0.0.
Table 10.
Pairwise comparison matrix of market-related sub-factors.
| Market (0.38) | M1 | M2 | M3 | M4 | Local Weights | Global Weights | Ranks |
|---|---|---|---|---|---|---|---|
| M1 | 1 | 1/3 | 1/3 | 1/5 | 0.07 | 0.03 | 4 |
| M2 | 3 | 1 | 2 | 1/5 | 0.18 | 0.07 | 2 |
| M3 | 3 | 1/2 | 1 | 1/6 | 0.13 | 0.05 | 3 |
| M4 | 5 | 5 | 6 | 1 | 0.61 | 0.23 | 1 |
Consistency ratio = 0.0872.
Table 11.
Pairwise comparison matrix of customer-related sub-factors.
| Customer (0.25) | CU 1 | CU 2 | Local Priority | Global Priority | Ranks |
|---|---|---|---|---|---|
| CU1 | 1 | 1/6 | 0.14 | 0.04 | 2 |
| CU2 | 6 | 1 | 0.86 | 0.21 | 1 |
Consistency ratio = 0.0.
Table 12.
Pairwise comparison matrix of cost-related sub-factors.
| Cost (0.04) | CO 1 | CO 2 | Local Priority | Global Priority | Ranks |
|---|---|---|---|---|---|
| CO 1 | 1 | 4 | 0.80 | 0.04 | 1 |
| CO 2 | 1/4 | 1 | 0.20 | 0.01 | 2 |
Consistency ratio = 0.0.
Table 13.
Ranks of factors as per AHP.
| Codes | Criteria Success Factors | Weights |
|---|---|---|
| M4 | Business risk and economy | 0.23 |
| CU2 | Customer needs/choice/passion for unique products/self-created products | 0.21 |
| O4 | Flexibility of the production process | 0.07 |
| M2 | Risk of obsolescence and perishability | 0.07 |
| IT1 | Accessibility to flexible and real-time information technology to keep the customer updated | 0.06 |
| M3 | Technology and its spread | 0.05 |
| O1 | Flexible manufacturing processes | 0.05 |
| P2 | Product/market innovation | 0.05 |
| CU1 | Customer enquiry stage | 0.04 |
| CO1 | Ability of MTO without increasing cost of manufacturing | 0.04 |
| O2 | Skilled employees for manufacturing | 0.03 |
| P4 | Modular product design | 0.03 |
| M1 | Competition in the market | 0.03 |
| P1 | High product variety | 0.02 |
| P3 | Short lead time of suppliers | 0.01 |
| IT2 | Information system (online system) to receive order and payments | 0.01 |
| CO2 | High cost of carrying inventory | 0.01 |
| O3 | Flat organization structure | 0.01 |
Table 14.
TOPSIS matrices.
| CSF | Scoring of Strategies for Different CSF | ||||||||
|---|---|---|---|---|---|---|---|---|---|
| IT System-Centric Strategy | Design-, Innovation- and Production-Centric Strategy | Customer-Centric Strategy | |||||||
| Score | Normalized Score | Weighted Normalized Score | Score | Normalized Score | Weighted Normalized Score | Score | Normalized Score | Weighted Normalized Score | |
| P 1 | 5 | 0.651 | 0.013 | 3 | 0.391 | 0.008 | 5 | 0.651 | 0.013 |
| P 2 | 7 | 0.704 | 0.035 | 5 | 0.503 | 0.025 | 5 | 0.503 | 0.025 |
| P 3 | 5 | 0.451 | 0.005 | 7 | 0.631 | 0.006 | 7 | 0.631 | 0.006 |
| P 4 | 7 | 0.523 | 0.016 | 9 | 0.673 | 0.020 | 7 | 0.523 | 0.016 |
| O 1 | 7 | 0.482 | 0.024 | 9 | 0.620 | 0.031 | 9 | 0.620 | 0.031 |
| O 2 | 5 | 0.402 | 0.012 | 9 | 0.723 | 0.022 | 7 | 0.562 | 0.017 |
| O 3 | 5 | 0.437 | 0.004 | 9 | 0.786 | 0.008 | 5 | 0.437 | 0.004 |
| O 4 | 5 | 0.366 | 0.026 | 9 | 0.658 | 0.046 | 9 | 0.658 | 0.046 |
| IT 1 | 7 | 0.631 | 0.038 | 7 | 0.631 | 0.038 | 5 | 0.451 | 0.027 |
| IT 2 | 5 | 0.549 | 0.005 | 7 | 0.768 | 0.008 | 3 | 0.329 | 0.003 |
| M 1 | 7 | 0.768 | 0.023 | 5 | 0.549 | 0.016 | 5 | 0.329 | 0.010 |
| M 2 | 7 | 0.704 | 0.049 | 5 | 0.503 | 0.035 | 5 | 0.503 | 0.035 |
| M 3 | 7 | 0.562 | 0.028 | 5 | 0.402 | 0.020 | 9 | 0.723 | 0.036 |
| M 4 | 7 | 0.704 | 0.162 | 5 | 0.503 | 0.116 | 5 | 0.503 | 0.116 |
| CU 1 | 9 | 0.577 | 0.023 | 9 | 0.577 | 0.023 | 9 | 0.577 | 0.023 |
| CU 2 | 9 | 0.620 | 0.130 | 7 | 0.482 | 0.101 | 9 | 0.620 | 0.130 |
| CO 1 | 7 | 0.631 | 0.025 | 5 | 0.451 | 0.018 | 7 | 0.631 | 0.025 |
| CO 2 | 7 | 0.562 | 0.006 | 5 | 0.402 | 0.004 | 9 | 0.723 | 0.007 |
Table 15.
Ranking of strategies for implementing MTO.
| Alternatives or Strategies for MTO | Si+ | Si- | Si+ + Si- | Ci | Rank |
|---|---|---|---|---|---|
| IT system-centric (S1) | 0.06 | 0.04 | 0.09 | 0.40 | 3 |
| Design-, innovation- and production-centric (S2) | 0.04 | 0.06 | 0.09 | 0.61 | 2 |
| Customer-centric (S3) | 0.02 | 0.06 | 0.09 | 0.73 | 1 |
Disclaimer/Publisher’s Note: The statements, opinions and data contained in all publications are solely those of the individual author(s) and contributor(s) and not of MDPI and/or the editor(s). MDPI and/or the editor(s) disclaim responsibility for any injury to people or property resulting from any ideas, methods, instructions or products referred to in the content. |
© 2023 by the authors. Licensee MDPI, Basel, Switzerland. This article is an open access article distributed under the terms and conditions of the Creative Commons Attribution (CC BY) license (https://creativecommons.org/licenses/by/4.0/).
Share and Cite
MDPI and ACS Style
Upadhyay, S.; Garg, S.K.; Sharma, R. Analyzing the Factors for Implementing Make-to-Order Manufacturing System. Sustainability 2023, 15, 10312. https://doi.org/10.3390/su151310312
AMA Style
Upadhyay S, Garg SK, Sharma R. Analyzing the Factors for Implementing Make-to-Order Manufacturing System. Sustainability. 2023; 15(13):10312. https://doi.org/10.3390/su151310312
Chicago/Turabian StyleUpadhyay, Surbhi, Suresh Kumar Garg, and Rishu Sharma. 2023. "Analyzing the Factors for Implementing Make-to-Order Manufacturing System" Sustainability 15, no. 13: 10312. https://doi.org/10.3390/su151310312
Note that from the first issue of 2016, this journal uses article numbers instead of page numbers. See further details here.