Article

Spatial Accessibility Analysis of Emergency Shelters with a Consideration of Sea Level Rise in Northwest Florida

1
Department of Civil and Environmental Engineering, Florida Agricultural and Mechanical University–Florida State University College of Engineering, Tallahassee, FL 32310, USA
2
Department of Civil and Environmental Engineering, Louisiana State University, Baton Rouge, LA 70808, USA
*
Author to whom correspondence should be addressed.
Sustainability 2023, 15(13), 10263; https://doi.org/10.3390/su151310263
Submission received: 12 May 2023 / Revised: 23 June 2023 / Accepted: 27 June 2023 / Published: 28 June 2023

Abstract

:
Hurricane-induced storm surge and flooding often lead to the closures of evacuation routes, which can be disruptive for the victims trying to leave the impacted region. This problem becomes even more challenging when we consider the impact of sea level rise that happens due to global warming and other climate-related factors. As such, hurricane-induced storm surge elevations would increase nonlinearly when sea level rise lifts, flooding access to highways and bridge entrances, thereby reducing accessibility for affected census block groups to evacuate to hurricane shelters during hurricane landfall. This happened with the Category 5 Hurricane Michael which swept the east coast of Northwest Florida with long-lasting damage and impact on local communities and infrastructure. In this paper, we propose an integrated methodology that utilizes both sea level rise (SLR) scenario-informed storm surge simulations and floating catchment area models built in Geographical Information Systems (GIS). First, we set up sea level rise scenarios of 0, 0.5, 1, and 1.5 m with a focus on Hurricane Michael’s impact that led to the development of storm surge models. Second, these storm surge simulation outputs are fed into ArcGIS and floating catchment area-based scenarios are created to study the accessibility of shelters. Findings indicate that rural areas lost accessibility faster than urban areas due to a variety of factors including shelter distributions, and roadway closures as spatial accessibility to shelters for offshore populations was rapidly diminishing. We also observed that as inundation level increases, urban census block groups that are closer to the shelters get extremely high accessibility scores through FCA calculations compared to the other block groups. Results of this study could guide and help revise existing strategies for designing emergency response plans and update resilience action policies.

1. Introduction

1.1. Background

“Access” has different definitions or usages in different domains such as transportation, health, and emergency management. Some use “access” to denote entry into or utilization of the healthcare system, whereas others use it to describe factors that affect entry or use [1]. Several obstacles are present, which lead to many challenges from potential to realized access, can be categorized into five dimensions: availability, accessibility, affordability, acceptability, and accommodation [1]. The first two dimensions are spatial in nature with availability referring to the number of local service supply options available, and accessibility referring to the travel impedance (e.g., distance or time) between demand and supply [2]. They have been combined as “spatial accessibility (SA)” and SA is commonly used in geography and social sciences literature.
SA to service facilities is a complex issue that is impacted by a wide range of factors. Two critical factors that influence spatial accessibility are the capacity of supply points (e.g., available sheltering spaces), and the size of the demand (e.g., population) [3]. Hence, the SA varies from one region to the other, especially between urban and rural areas. Rural areas may be a few miles to hundreds of miles farther from service facilities usually located around the core of the denser urban areas, and the lack of such services in larger rural areas may be interpreted as a severe shortage of providers [4]. In Northwest Florida, the distribution of shelters for hurricane evacuation tends to cluster within counties that contain large and densely populated cities. Conversely, certain counties that feature predominantly rural areas and comparatively lower population densities may possess relatively sparsely located shelters, ranging from none to at most two [5]. Therefore, it is helpful if a proper SA analysis and visualization method of emergency facility can be applied to the coastal area and present the SA situation of urban and rural areas. Not only benefits evacuation planning, but this type of research also gives good assessment on service facility improvement in case of future uncertainty.

1.2. Literature Review of Emergency Accessibility

Emergency planning should also consider long term factors related to climate change so that it can be more efficient. Climate is the significant element that forms and increases the frequency and strength of hurricanes or other related coastal hazards [6]. Strong links between Atlantic Sea surface temperature and tropical cyclone activity have been mentioned several times in earlier studies [7]—tracing as far back as the late 1800s. Therefore, the major climate change, in terms of global warming, plays a key role in worsening hurricanes. It lifts the sea surface temperature (speed up winds) as well as water elevation (worsen the inundation). Strong scientific evidence exists that global warming has been speeding up under the dominant influence of greenhouse gases, and studies warned of sea level rise (SLR) and disruptions in the water cycle such as droughts and floods [8]. Long-term factors like SLR, warm sea temperature which are related to global warming, can be severe in highly populated coastal regions due to an increase in storm surge nonlinearly, which should be considered when evaluating potential future hurricane flood conditions [9].

1.3. Research Gaps and Motivation

Regrettably, although a substantial amount of research works focused on the SA to facilities such as health care services [10,11,12], libraries [13], supermarkets [14], and special needs shelters [15,16] using floating catchment area methods and gravity models, there is still a paucity of research in the field of SA in terms of studying the impact of sea level rise (SLR) on the transportation accessibility of shelters in the event of hurricanes. Consequently, this study relies on the lessons learned from a historically unusually intensified hurricane, namely Hurricane Michael, and its forecasted data to generate scenarios in analyzing SA to hurricane shelters with SLR considerations. The next step is to integrate them with a floating catchment area-based Geographical Information Systems (GIS) methodology. In particular, our objective is to provide practical insight into assessing the effectiveness of emergency evacuations to shelters, in the context of transportation accessibility, by considering the impact of SLR and answering the following research questions:
  • How and to what extent does the SLR impact the accessibility of hurricane shelters based on a floating catchment area-based Geographical Information Systems (GIS) methodology?
  • Is there any statistically significant difference between results of the floating catchment area-based models while calculating the accessibility of these shelters?

1.4. Challenges

The study encountered several notable challenges in assessing SA for Northwest Florida. Firstly, the region is defined by expansive rural areas and widely dispersed population. Furthermore, a scarcity of essential medical resources, including hospitals, clinics, and healthcare professionals, poses significant obstacles. Additionally, the limited public transportation options coupled with long travel distances can hinder timely evacuations during critical situations. The study’s spatial accessibility evaluation employed a single-line design, considering crowd-to-hurricane shelters with travel time cost as a parameter constraint. However, it overlooked the intricate aspects of transportation modes and the concurrent operation of multiple emergency sites, warranting further investigation and refinement. In response to the impact of natural disasters like hurricanes, another common practice is resilience analysis. Resilience exploration encompasses forecasting, planning, and reducing disaster risks. Subsequent research could focus on determining the optimal placement and protection of power and transportation infrastructure during hurricanes [17]. Additionally, efforts can be made to enhance flexibility and adaptability to effectively address unforeseen and significant disruptions caused by such events.
In this paper, Northwest Florida was selected as the focus area, which was hit by Hurricane Michael. To clarify, Hurricane Michael was a Category 5 strength and struck the area in October 2018 [18]. This was the strongest hurricane on record to hit the region. Peak storm surge inundation heights were 9–14 feet, causing destruction to roads, bridges, households, and the ecology along the coastal area from Mexico Beach to Panama City [19]. Typically, the inundation of hurricane storm surge can flood low-lying roadways that potentially cut off access to other roadways and bridges, and isolate evacuees. Thus, it would adversely impact the accessibility to shelters during hurricane events [16]. Storm surge can furthermore limit the available evacuation routes and increase traffic congestion unexpectedly due to the uncertainty of hurricane track shifting which lead to delays and endanger affected populations [20]. Therefore, storm surge is a critical factor to consider when planning hurricane evacuations to ensure safety of the evacuees and analyze accessibility levels of evacuation routes [21].

1.5. Contributions

There is still a research gap in the literature with regard to assessing the spatial accessibility of hurricane shelters with a consideration of sea level rise and storm surge modeling. As such, this study has the following contributions to the literature. The paper measures the spatial accessibility of hurricane shelters in the Hurricane Michael-impacted coastal areas in Northwest Florida. For this purpose, the 3SFCA and E2SFCA methods were utilized in order to identify the areas with high and low levels of accessibility to shelters given different levels of SLR. This has been done for the first time, to the authors’ knowledge. Findings of this study can provide valuable insights for the field of emergency management that can lead to providing better access to shelters while considering SLR and storm surge.

1.6. Paper Organization

The remainder of the paper is organized as follows. First, an extensive literature review is presented with a focus on the evolution of the floating catchment method’s use for accessibility index estimation. This is followed by the section on data collection and preparation for population, transportation network and evacuation routes, hurricane forecasting information, and spatial distribution and capacities of hurricane shelters. Afterwards, storm surge models are set up and simulated with incorporating additional sea level rise scenarios for Hurricane Michael. Based on these simulations, floating catchment area-based scenarios are created to study the accessibility of shelters. Finally, results obtained from these accessibility analyses were discussed with future work directions and limitations of the work.

2. Literature Review of Floating Catchment Area Methods

Floating catchment area [22], originated from a gravity-based method, has been used to assess the service region of medical physicians based on a predefined travel time threshold, while also considering their availability relative to demand (i.e., the surrounded population) [12]. It could simplify the tuning of the distance impedance factor β in gravity models [10]. With more comprehensive constraints and assessments input into SA analysis, better floating catchment area methods were developed in the literature including two-step floating catchment area (2SFCA), enhanced two-step floating catchment area (E2SFCA), three-step floating catchment area (3SFCA), and other advanced ratio calculation methods [23].

2.1. Enhanced Two-Step Floating Catchment Area (E2SFCA)

2SFCA includes the first step of catching all population centroids ( i ) within a determined travel time threshold ( t 0 , is capable of a related travel distance d 0 ) from service supplies ( j ) in order to calculate the physician-to-population ratio ( R j ) dividing supplier capacity ( S j ) by the population of all fall-in centroids ( i ( t < t 0 ) P i ). The second step is to sum up R j of those suppliers within t 0 from population centroids, and that forms the accessibility index ( A i ) at each resident location. It can be implemented in ESRI ArcGIS Pro 2.9; however, its limitation lies in the assumption of equal access for all population locations inside the catchment without distance impendence [12] and giving unrealistic zero SA for locations outside of the catchment. To overcome this, [3] proposed the distance decay in the E2SFCA method, applying weights in the first and second steps of 2SFCA to distinguish travel time zones. To distinguish the accessibility within a catchment, multiple sub-time zones are obtained, and weights are assigned according to the Gaussian function.
E2SFCA came out as early as 2009 [3] and it is a very powerful and popular tool in healthcare accessibility analysis. Many research papers have applied E2SFCA to measure accessibility in developing countries [24]. In the literature, 2SFCA had many adaptations such as Hierarchical 2SFCA (H2SFCA) [25], integrated a Variable Distance Decay Function with FCA [10], and Multi-Modal 2SFCA [26,27]. However, many of these bring complexities such as longer computational time. Compared with other adapted 2SFCA models, E2SFCA is simpler and more applicable to the analyses of transportation networks and demographics. That is why it was selected to study the region selected. In addition, the E2SFCA method is very suitable for evaluating emergency accessibility during hurricane evacuations.

2.2. Three-Step Floating Catchment Area (3SFCA)

On the other hand, 3SFCA is designed to minimize the overestimation for demand in spatial access models like 2SFCA [28]. Adding the distance decay weights to E2SFCA, it also assigns a travel time-based selection weight ( G i j ) to each population-supplier (e.g., medical site) pair. 3SFCA assumes that local demand for and choice of use of nearby service supplies are influenced by the travel cost of the population to each service point. This is logical in a realistic situation since the demand for more distant supply points is mitigated when more adjacent supply points are available. Compared to E2SFCA, which is widely used to evaluate SA in public health literature, 3SFCA provides more reasonable and promising solutions in accessibility studies [29]. As such, this paper will utilize the 3SFCA method in the proposed approach.
While the 3SFCA method itself is already an extension of the 2SFCA method, several researchers also developed further extensions and adaptations of it to further enhance the spatial analysis of healthcare access. One significant extension to the 3SFCA method include Modified Huff 3SFCA (MH3SFCA) [23], which simulates distance attenuation effects and more realistically verifies the continuity of attenuation. Compared with the diversity of 2SFCA, 3SFCA still has high development potential because of its short computational time [30]. Although this study provides a comparison of the accessibility results of two methods on the accessibility of hurricane shelters, a follow-up research direction can be the further development of 3SFCA. This development can be performed in order to make the model more suitable for coastal rural areas like Northwest Florida.

2.3. Comparison

Although 3SFCA was developed more recently than E2SFCA, both have been applied in a variety of accessibility research works with informative results. Based on the findings in the next section, 3SFCA is found to be more adaptable when the evacuation case requires demand separation. E2SFCA is relatively clarified for ‘global’ accessibility index observation, which provides a general assessment of accessibility that does not take demand variation and supply competition into consideration. While 3SFCA works perfectly when both demand and supply are influenced by travel cost, it also provides a more detailed and accurate assessment of accessibility.

3. Methodology

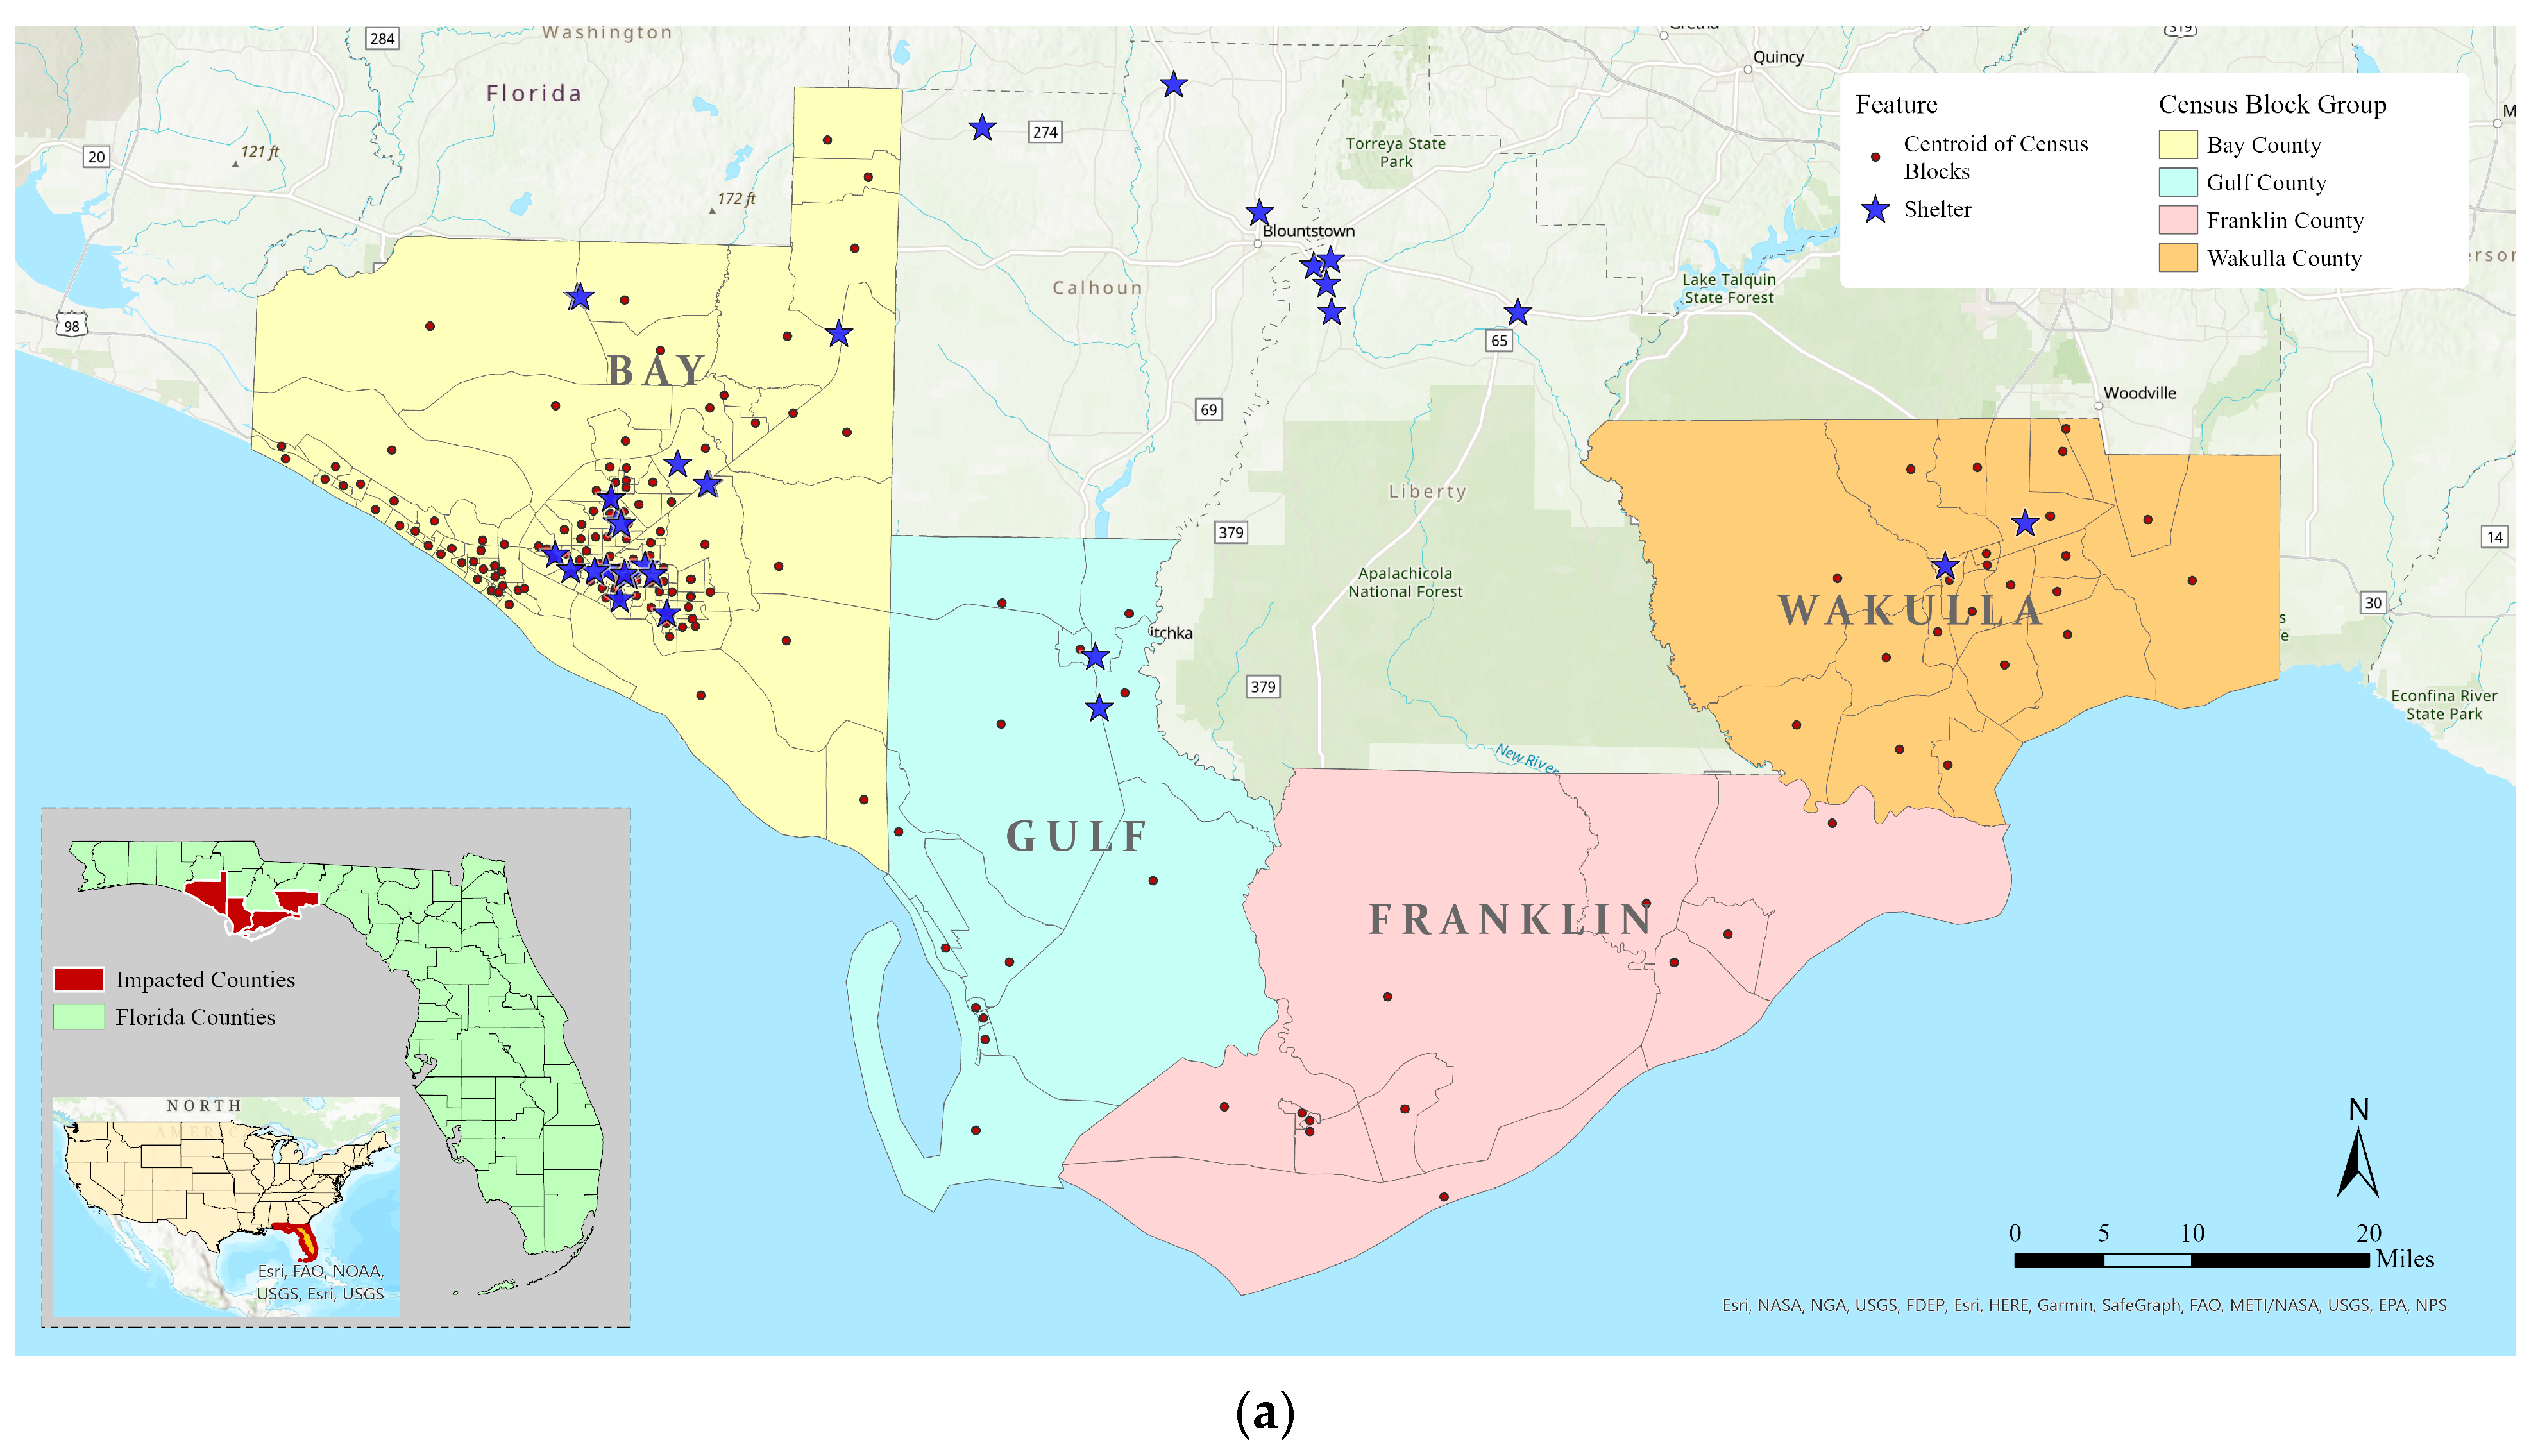
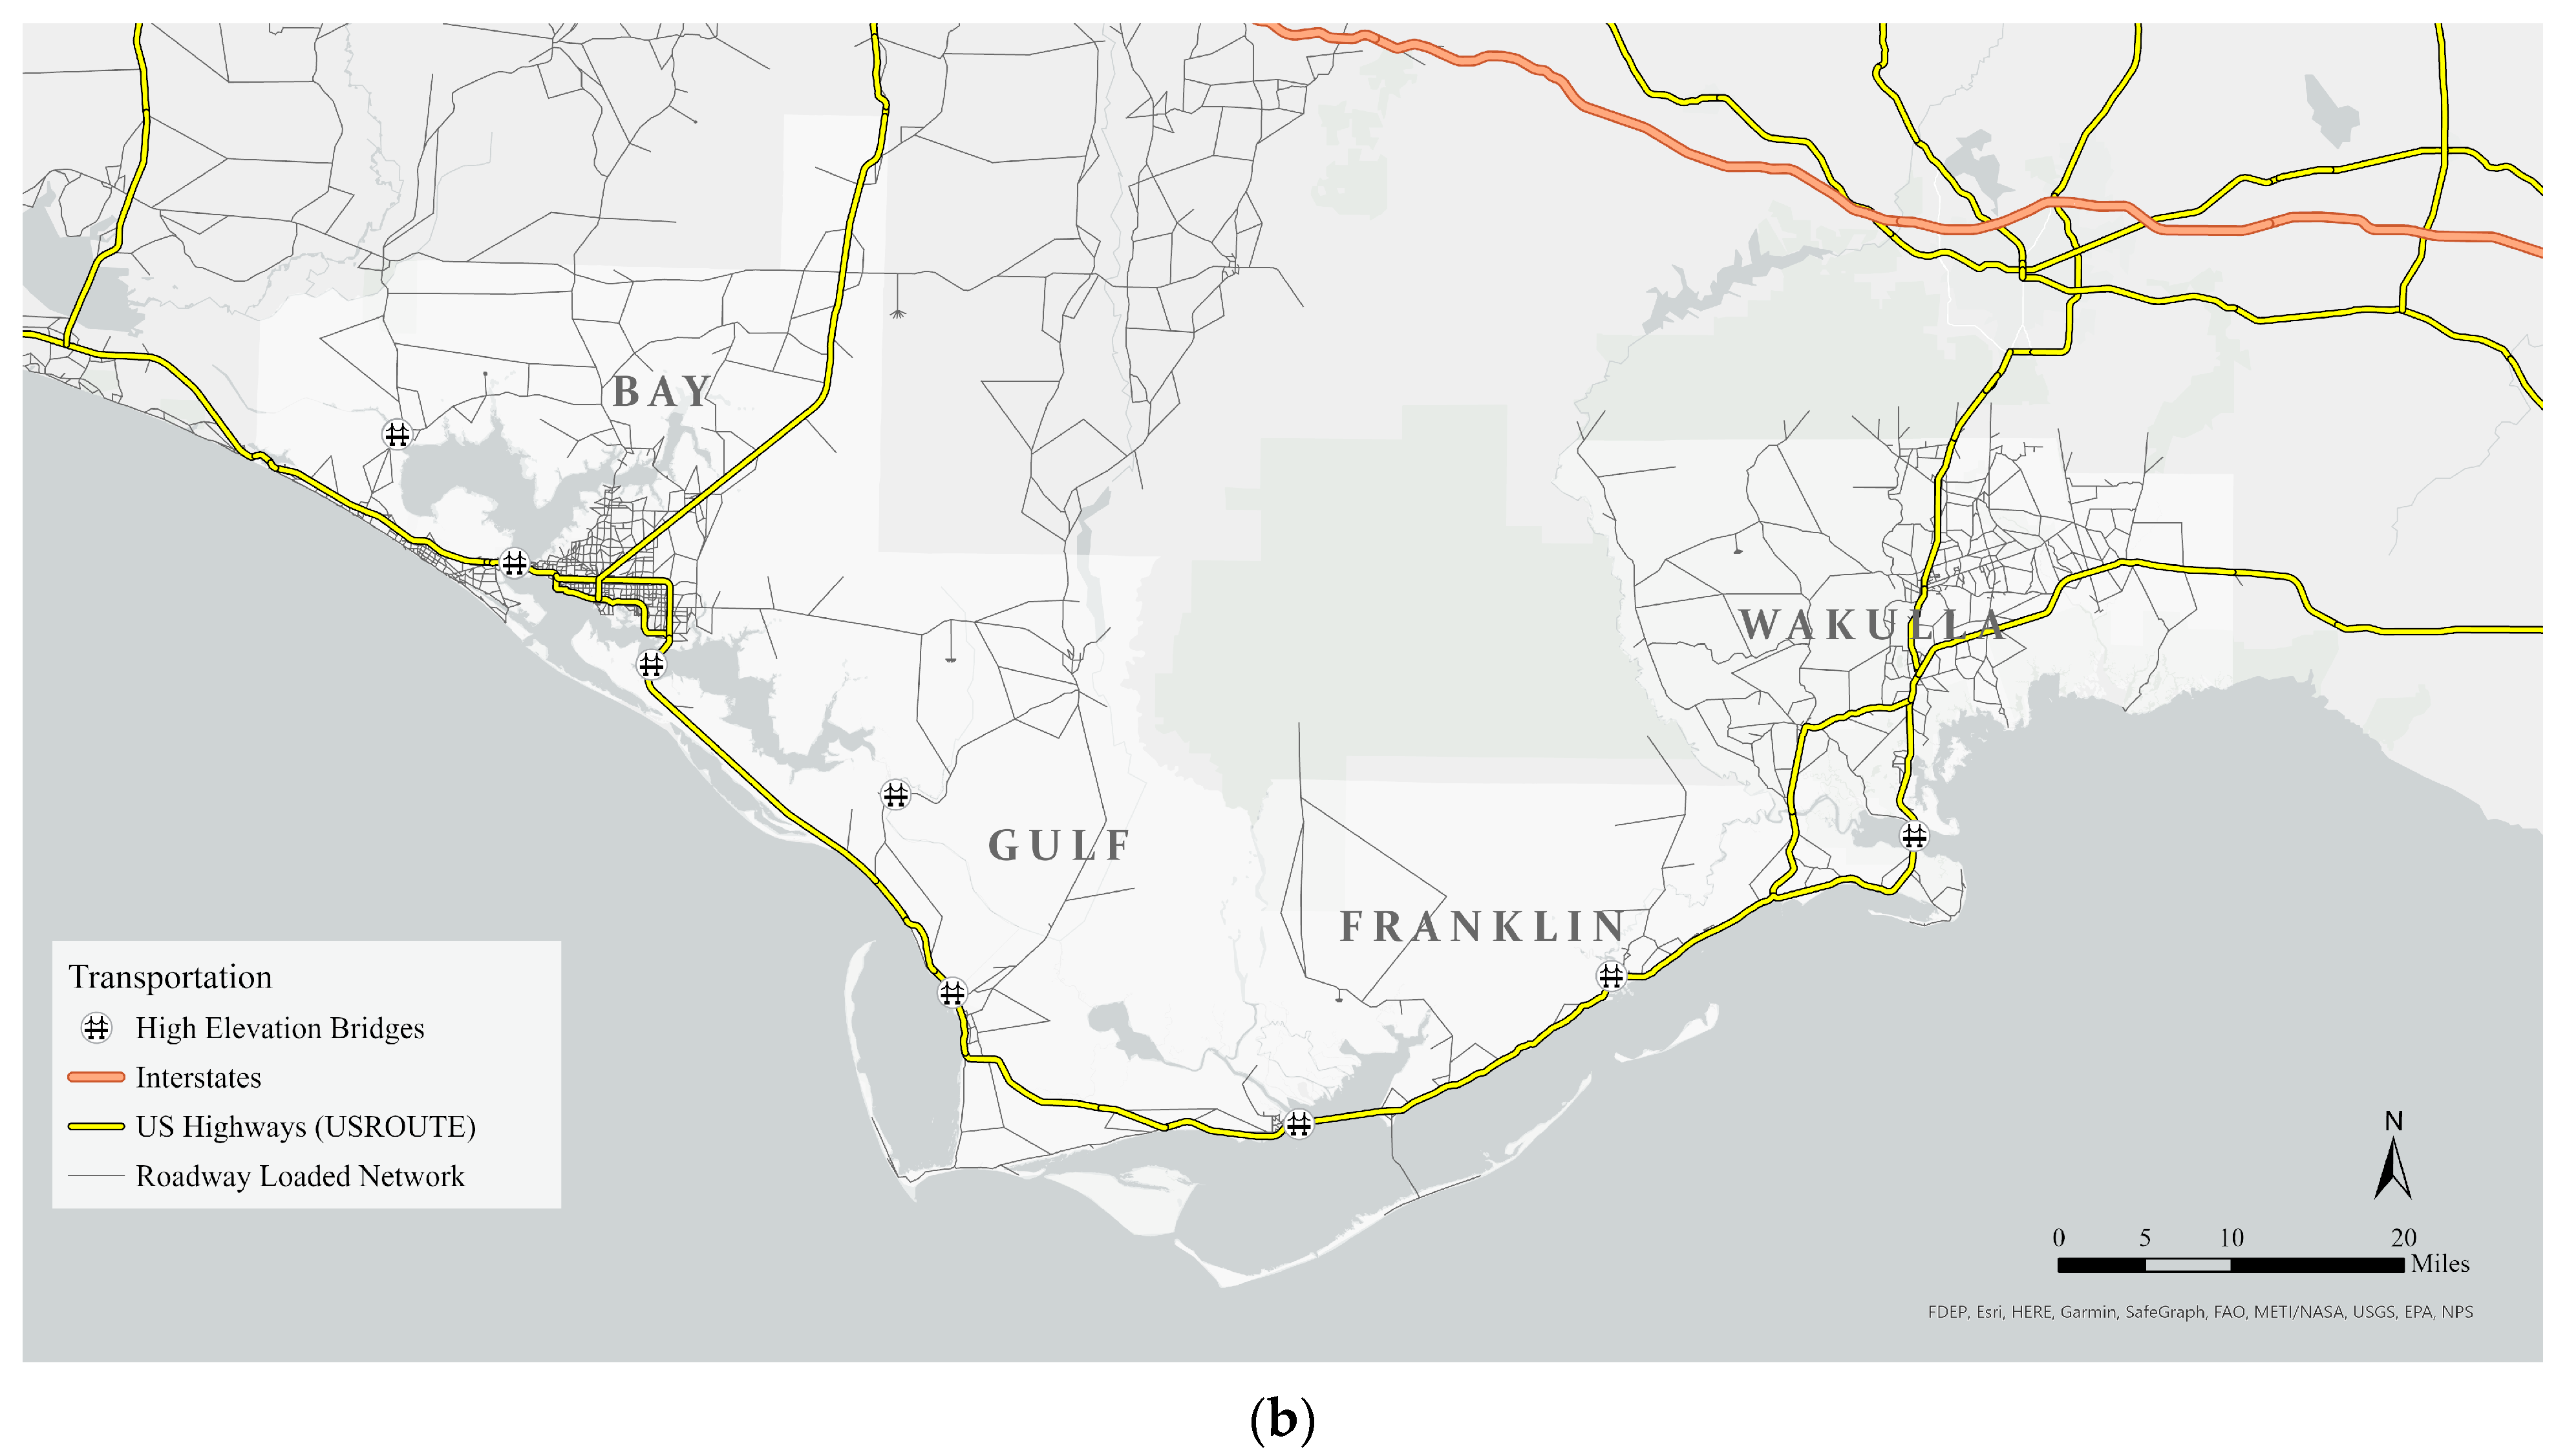
3.1. Study Area and Data Preparation

This paper studied the impact of Hurricane Michael, focusing on four coastal counties (shown in Figure 1a) in northwest Florida that are susceptible to hurricane storm surge impact. Among these counties, only Panama City—Panama City Beach in Bay County, and Crawfordville in Wakulla County were designated as 2020 Qualifying Urban Areas [31,32,33].
To simulate the hurricane surge and waves, the Advanced Circulation (ADCIRC) model and Simulating Waves Nearshore (SWAN) model were employed using the recorded forecasting data obtained from the NOAA Hurricane center. ADCIRC solves differential equations of momentum and continuity for a physical domain [34], while SWAN is a spectral wave action model used widely for coastal wave predictions [35]. To examine the impact of sea level rise (SLR) on the storm surge levels and significant wave heights, [36] investigated SLR scenarios using the ADCIRC+SWAN model, which highlighted the nonlinear amplification effect of SLR on storm surge heights. This is a valuable investigation on the impact of SLR on hurricane inundation levels and assessment of the potential for significant surge in water levels, and the paper also implied the bad implications for hurricane evacuation accessibility.
While most of the studies on SA rely on census tracts for population data, in our investigation, the utilization of census block groups is necessary due to the presence of large rural areas within the selected four counties. Note that a census block group represents the smallest geographical unit for which the Census Bureau provides sample data, with at least one block group located in each tract. The use of a smaller sample unit like block groups enabled a more detailed and explicit visualization of the changes in accessibility. Therefore, we used 2020 U.S Census Block Groups [37] for our research as the unit of analysis, and the proposed accessibility index displays will be presented throughout each block group area.
For travel cost calculation, we used the congested travel time on loaded roadway networks (shown in Figure 1b) for northwest Florida which was downloaded from FSUTMS Online website owned by the FDOT Forecasting and Trends Office [38]. This travel time consisted of the cost of travel in the Origin-Destination (OD) Matrix within ArcGIS from each census block group centroid (set as the Origin) to the statewide hurricane shelters [5] (evacuation destination of this SA research). Each origin in the study area was geocoded to its respective census block group and snapped to the roadway network. However, the destinations, which were provided by FEMA and had fixed addresses, were not allowed to be snapped to the network. As a result, some shelters were excluded from the analysis as they were located outside of the network’s coverage area and were not accessible to the population of impacted counties.
To obtain accurate information on whether roadways are accessible or inundated, with a focus on study area bridges, the Navigation Vertical Clearance from the National Bridge Inventory report [39] was used as a basic reference to see whether bridges are above the estimated inundation water levels or not. For OD Matrix cost calculation, roadway network was derived from this step. In addition, the OD Matrix was calculated for all scenarios with a tolerance of 500 m, not the default 5 km. This was to avoid some inundated centroids being snapped to the inner network and getting a lower evacuation time, which would be deemed unreasonable as sea level rise increased and caused more challenges for evacuation.

3.2. Research Assumptions

By focusing on the coastline of four northwest Florida counties, our research aimed to simulate the post-impact changes in evacuation accessibility of coastal urban and rural areas caused by the combination of Hurricane Michael’s impact and SLR. To set up scenarios of SA and apply floating catchment area methods for the studied region successfully, the research contained several assumptions discussed as follows:
(1) It was assumed that coastal boundary of impacted areas would not shrink sharply when SLR increased up to 1.5 m which is the maximum water level considered by our models. SLR could inundate shorelines and make previous residential places unavailable before hazards, which could change the evacuation demand (i.e., population to be evacuated) and locations of origins in the OD Matrix. Since this research had a specific focus on additional inundation brought by SLR, and 1.5m SLR only affected the coastal beach areas mostly, there was no significant difference of residential locations being inundated by SLR.
(2) It was assumed that the only effect of SLR would be to increase the hurricane’s direct impact. Other climatic conditions, such as the stability of atmospheric pressure, may also play a role in the formation of hurricanes, but they are not the focus of this study. To visualize the challenges that SLR posed for hurricane evacuations, the model only assumed the water elevation changes during hurricane development using different scenarios. Ease of evacuation and accessibility changes are subject to this single impact of SLR.
(3) Residents in the studied four counties were assumed to own vehicles or have access to vehicles so that they would choose to evacuate to hurricane shelters. Travel costs and catchment thresholds were determined using travel time by a motor vehicle. Other travel modes such as transit, cycling and walking were out of scope in this study.
(4) It was assumed that the roadway closures were due to flooding to make model’s focus directly on the impact of SLR. Strong wind could knock down trees, traffic poles and other similar structures above the ground, causing roadway disruptions and other related shortages; however, in this research, only inundation was considered as the major factor in SLR scenarios causing lower accessibility levels. It is worth mentioning that if wind damage were added, the affected area would be larger, and the accessibility will be more unpredictable and unquantifiable. This is a very relevant area of future work.

3.3. Floating Catchment Area

According to the literature review of FCA methods, E2SFCA would apply a distance decay function to a physician-to-population ratio ( R j ) calculation and the SA index ( A i ) generation. Note that the predefined catchment size should be based on travel cost, either the travel time or distance [10], thus we used OD Matrix travel time cost t to determine catchment size. A base scenario was utilized as a benchmark to set up the catchment size and sub-zone thresholds in the absence of any natural disaster impact, which ensured that accessibility calculations to be reasonable. To accurately capture accessibility in rural areas, the catchment size was expanded to 45–200 min whereas it is 30 min in the urban metropolitan area [40]. To determine the maximum threshold for the catchment size, the minimum time required for each population centroid to reach the nearest shelter in our base scenario was extracted, with an observed maximum value of 90.76 min. As a result, a maximum threshold of 91 min was chosen, then four sub-zones for this study are divided into the following intervals: 0–30 min, 30–60 min, 60–91 min, and >91 min. To calculate some subsequent divisions of the model properly (i.e., to avoid a zero denominator), the travel cost was assigned a distance weight of 0.00001 for travels exceeding the maximum catchment size. Accordingly, steps of E2SFCA are listed as follows:
Step 1: calculate the supply to demand ratio:
R j = S j r = 1 , 2 , 3 , 4 i t i j t r P i · W r
S j is the capacity of shelter j which first was a buffer center with the travel time threshold radius. t i j is the travel cost (time) from population centroid i to the shelter j. r means the rth sub-zone [28] under the order 0–30 min, 30–60 min, 60–91 min and >91 min. t r is the threshold of rth sub-zone. W r is the gaussian weight function for distance decay, which will be:
W r =   W t i j , t r = e 1 2 × t i j t r 2 e 1 2 1 e 1 2                         i f t i j t r   a n d   r 1 , 2 , 3 0.00001                                                                                           i f t i j > 91     a n d   r = 4
Step 2: calculate accessibility index:
A i = r = 1 , 2 , 3 , 4 j t i j t r R j W r
3SFCA minimized the overestimation of demand by generating a selection weight for population i to all its accessible shelters. Both the numerator and the denominator of Equation (4) were composed of Gaussian decay weight as mentioned in E2SFCA. For the purpose of making the independent variable of each SA scenario just the SLR inundation elevation, the catchment size threshold was set consistent with E2SFCA. In the following formulas, j is the shelter investigated and k represents each shelter that can have a distance weight from population i.
Step 1: calculate selection weight:
G i , j = W i j k t i k < t r     r = 1 , 2 , 3 , 4 W i k
Step 2: calculate the supply to demand ratio:
R j = S j r = 1 , 2 , 3 , 4 i t i j t r P i · W r · G
Step 3: calculate accessibility index:
A i = r = 1 , 2 , 3 , 4 j t i j t r R j W r G

4. Results

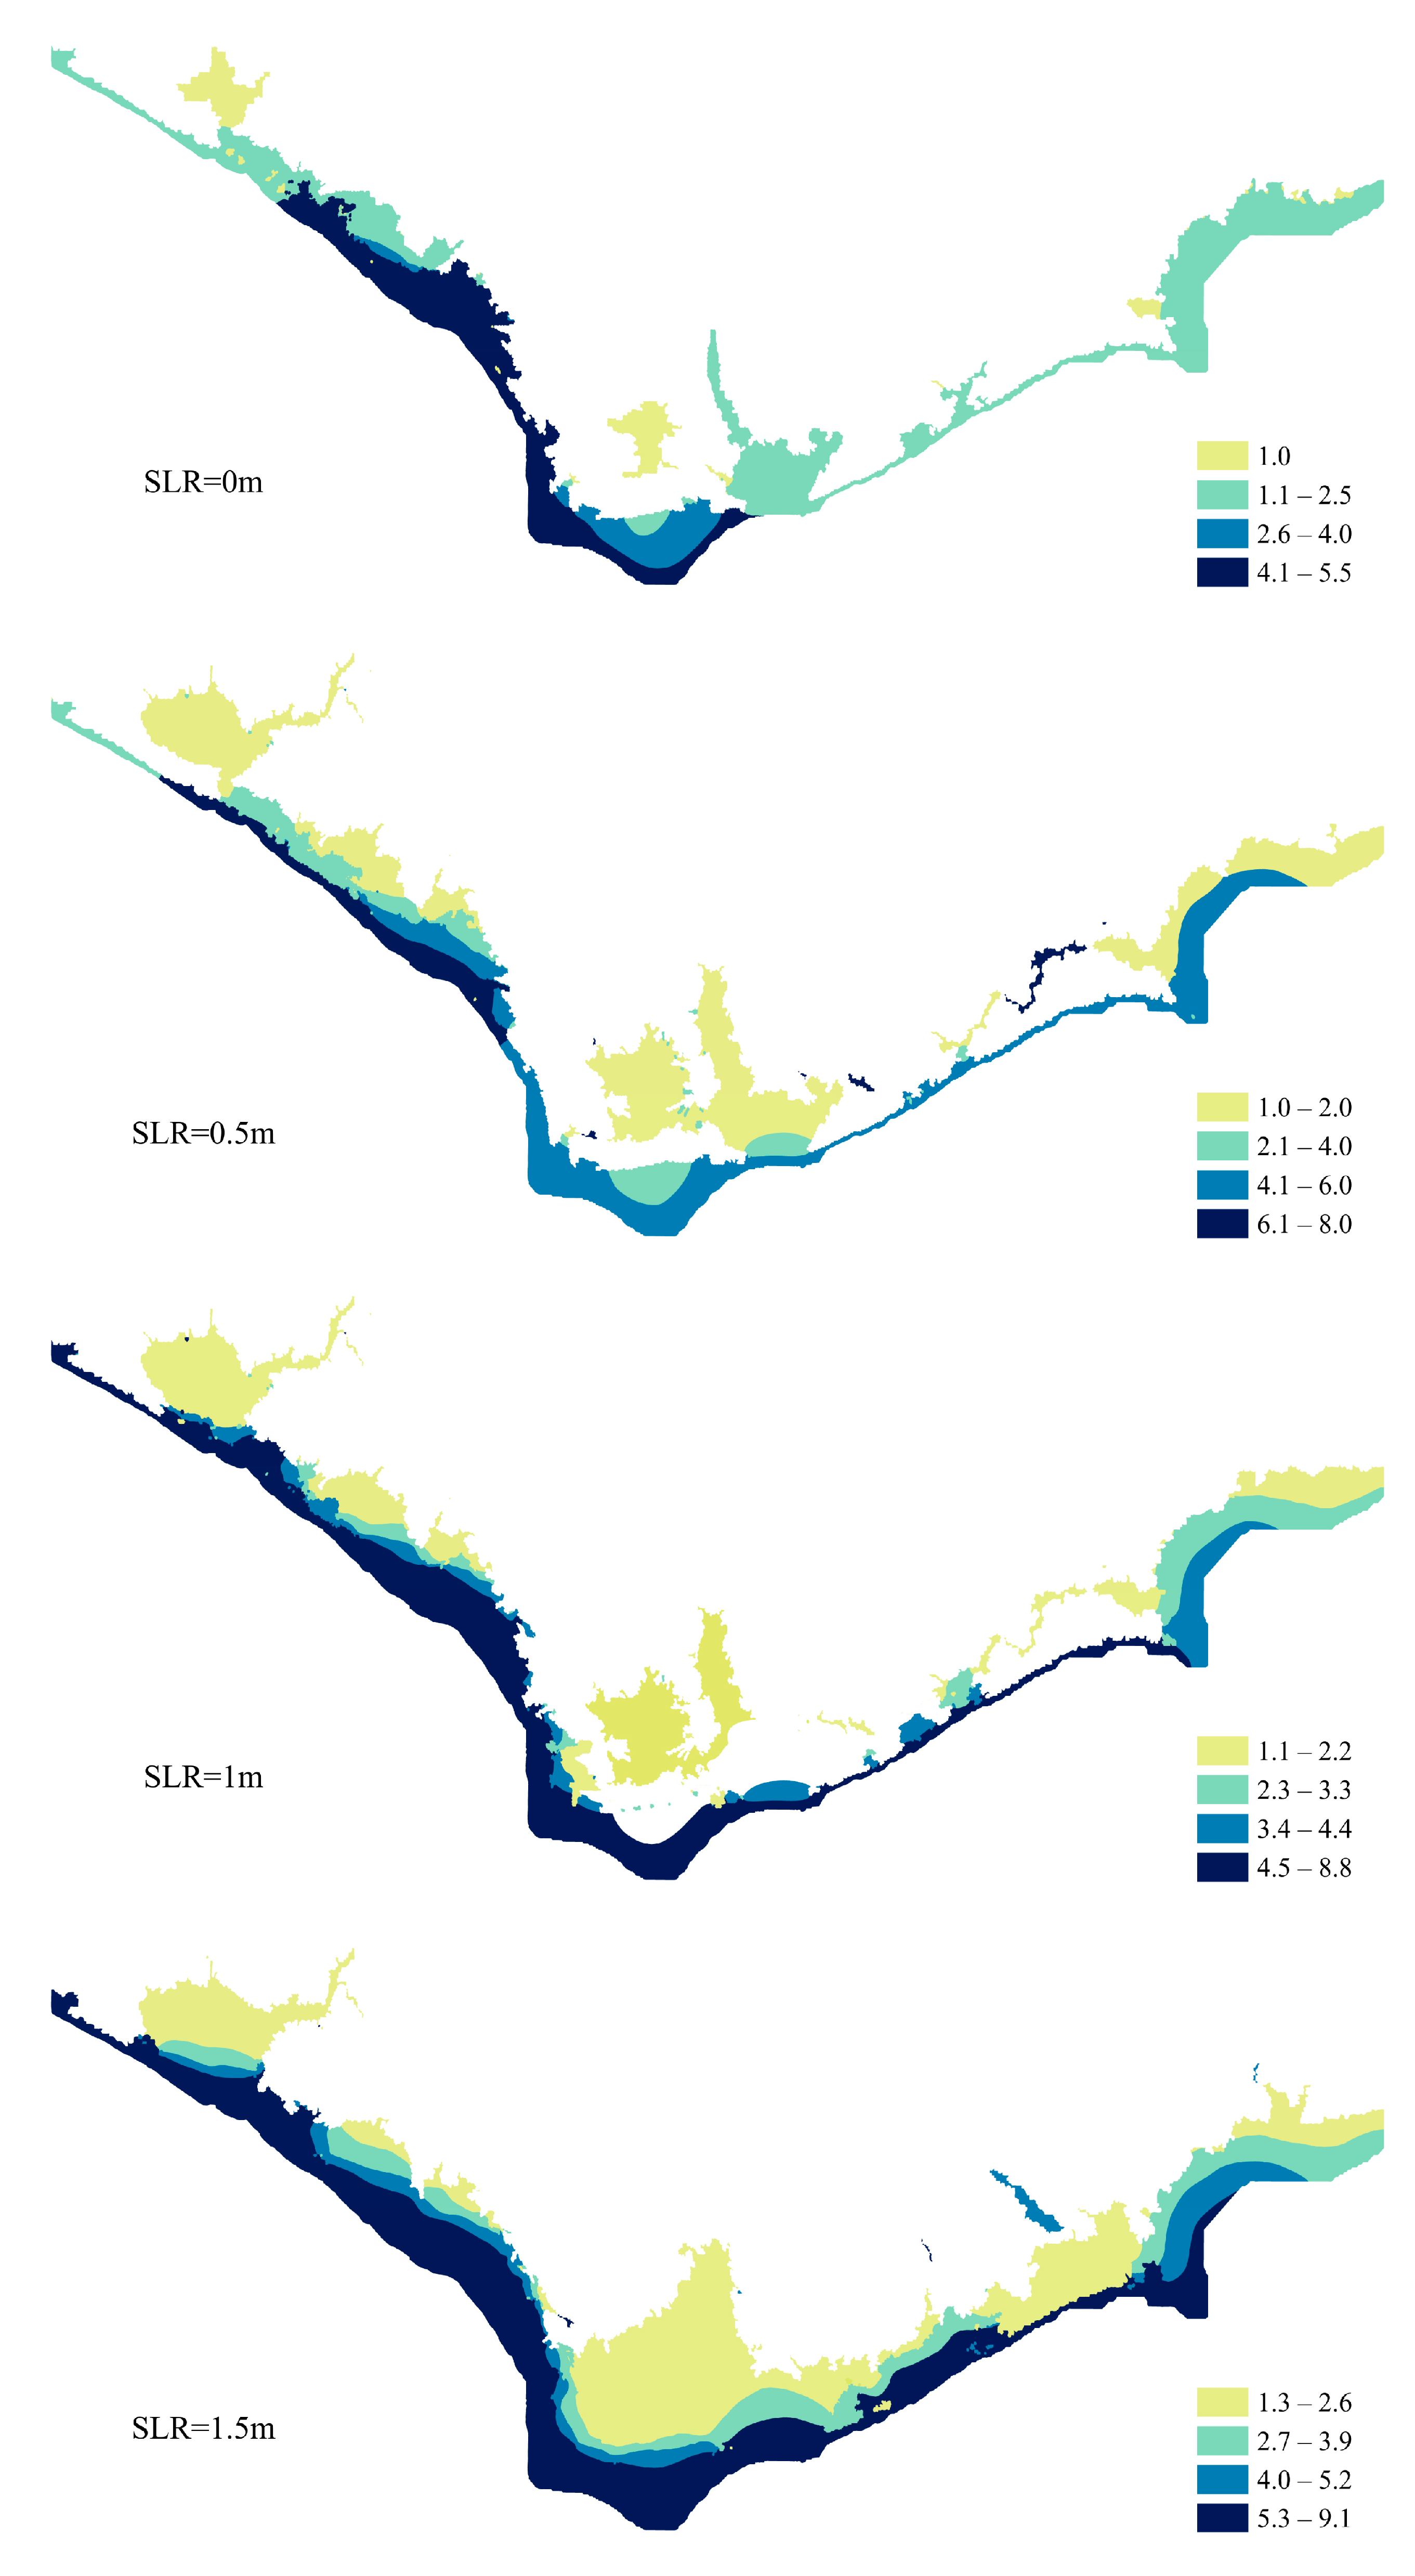
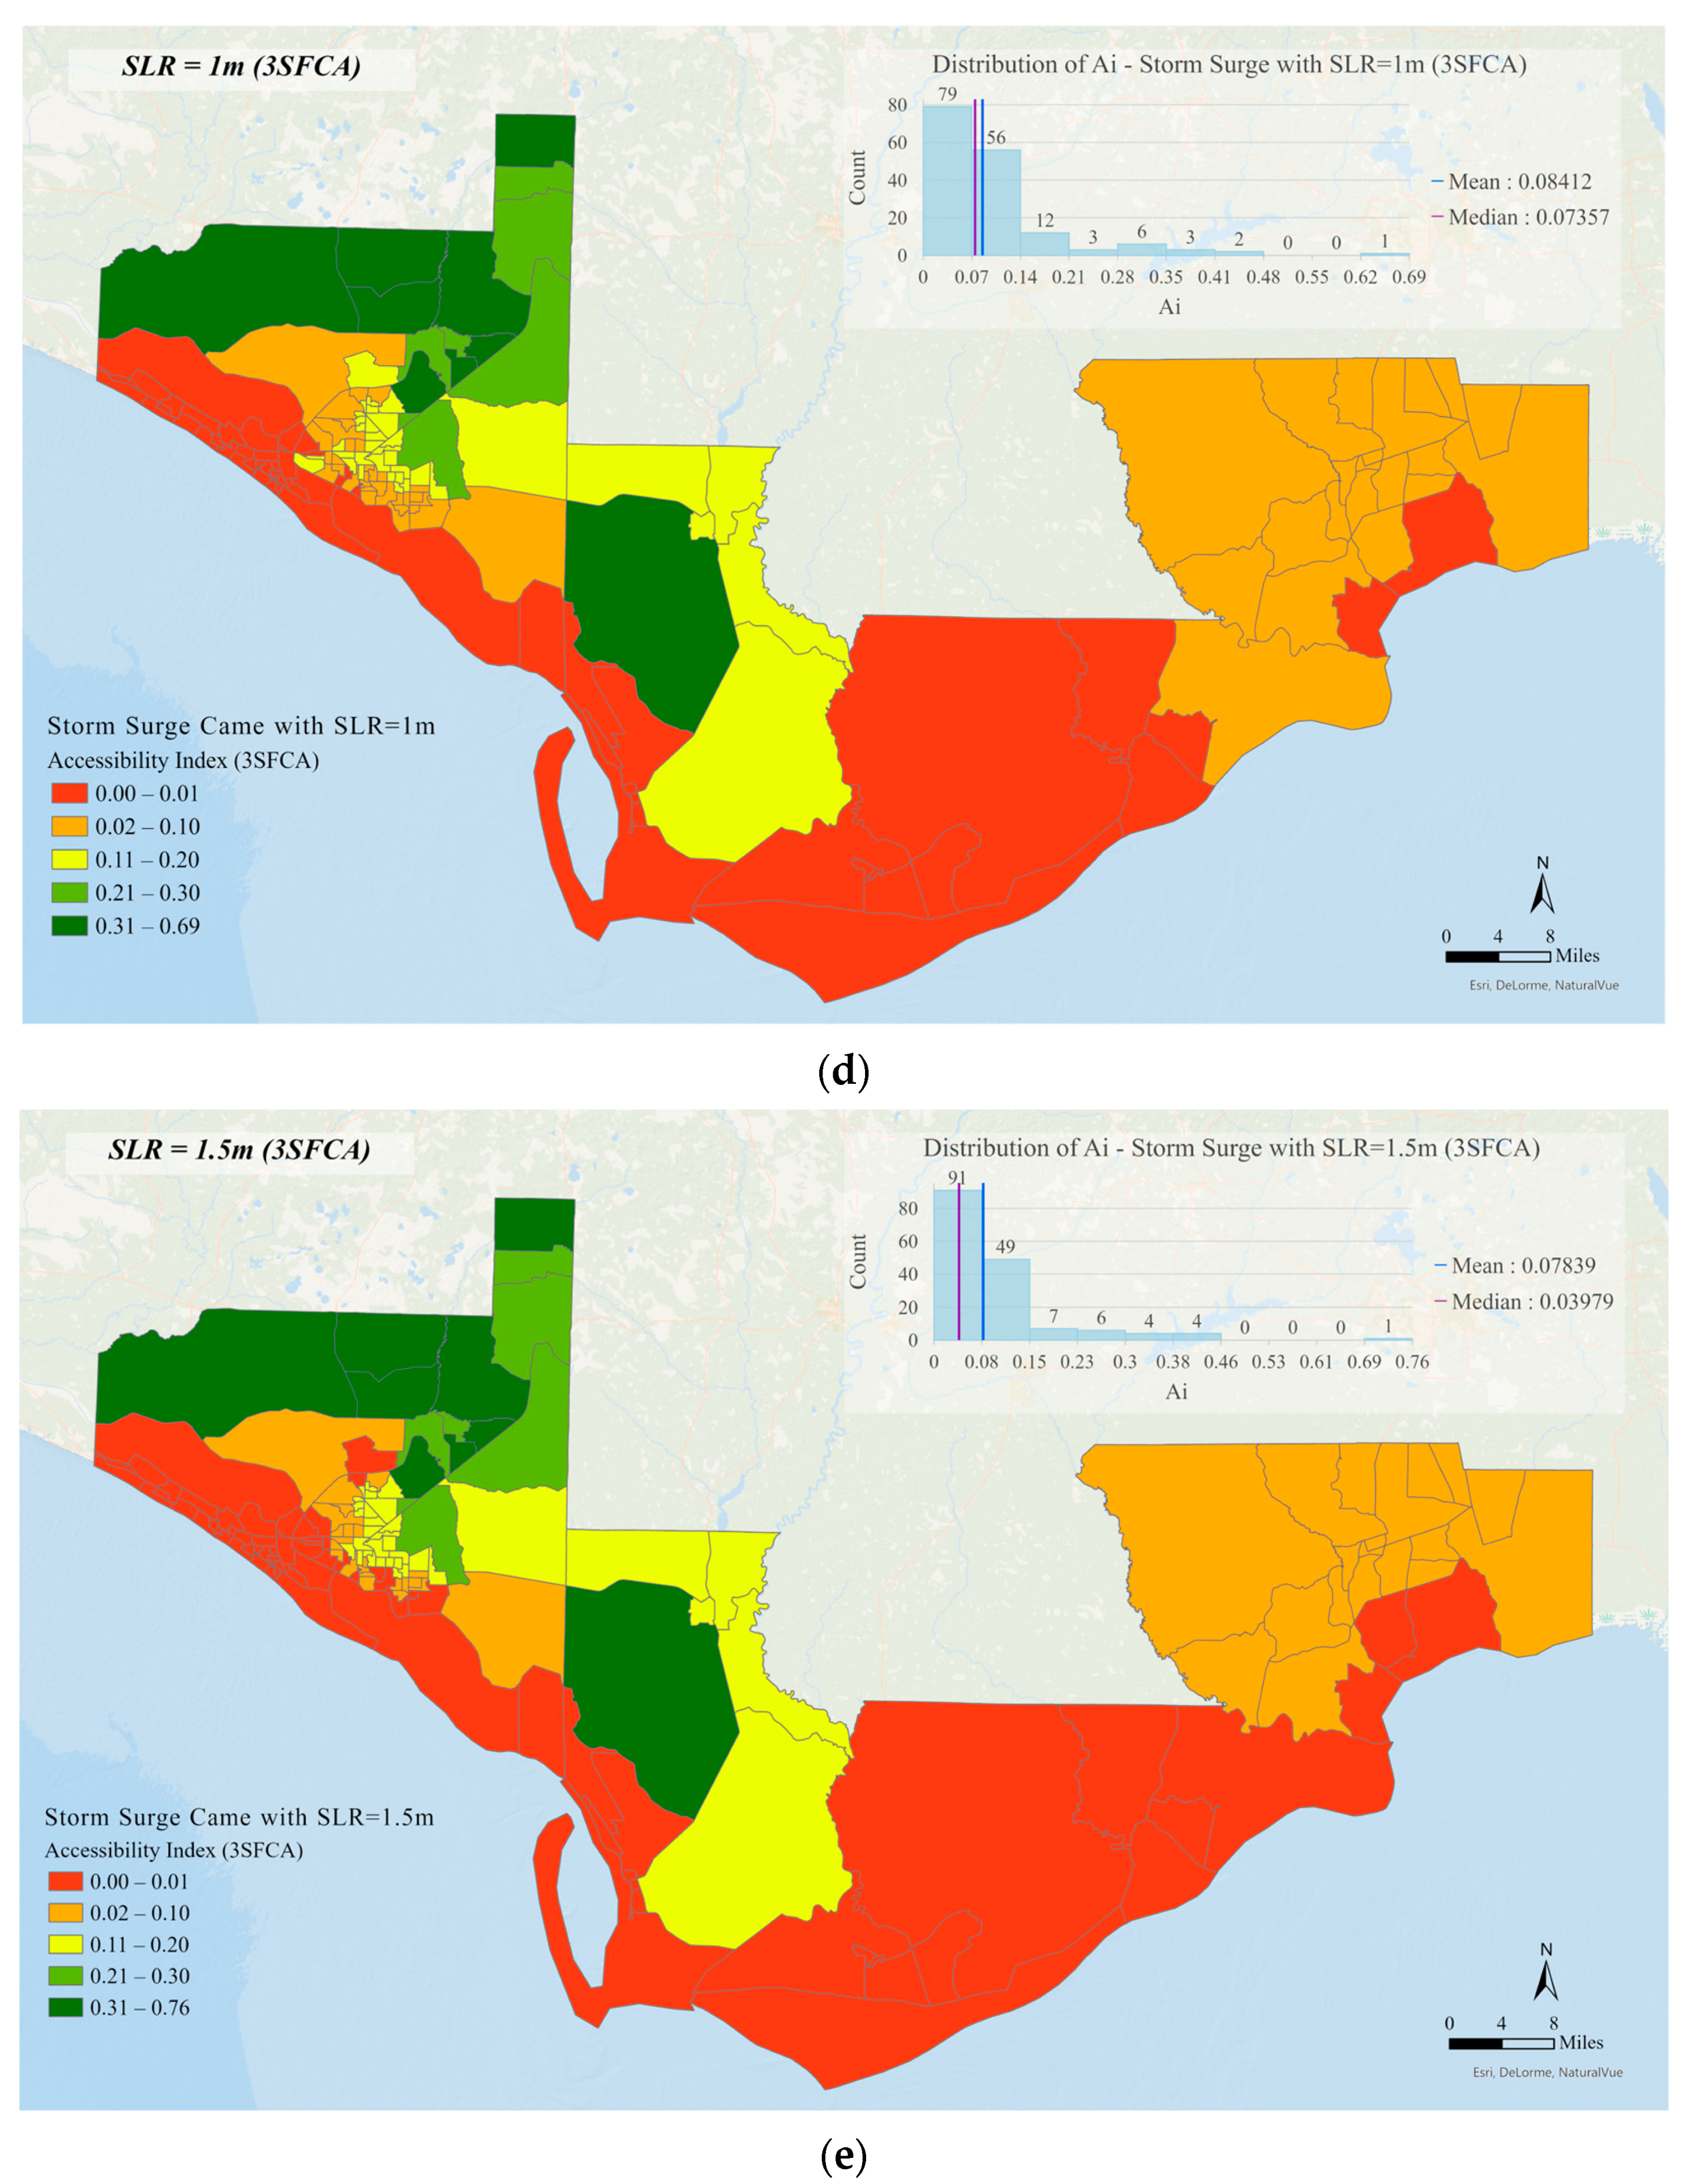
4.1. The Impact of SLR on Hurricane Michael Inundation

The impact of SLR on coastal regions can be devastating, with rising inundation threatening to destroy low-lying areas and coastal communities. In this study, a previously calibrated storm surge model [36] has been used to analyze the effects of SLR on four coastal counties: Bay, Gulf, Franklin, and Wakulla. As the SLR increased by 0.5m increments, the inundation area expanded, with increasingly darker blue colors in Figure 2 indicating the areas affected by the rising sea levels. Despite previous possible efforts to elevate major bridges as symbolled in Figure 1b along US highways to withstand rising sea levels, the effects of SLR on the roadway network was found to be significant. As SLR became more severe, those roadways that were available previously also got flooded, and the number of affected census block groups and unavailable roadway segments increased, as shown in Table 1.
It is noteworthy that elevation of hurricane storm surge increased nonlinearly, and the distribution of inundation spreading was irregular due to the geographic characteristics of impacted regions. For instance, Panama City urban area was surrounded by Saint Andrew Bay on the South and Grand Lagoon along the city west shoreline. When storm surge hit, the bay played as a barrier for waves to run through, making the Southern beach areas of Bay County inundated with extremely high-water elevation (always dark blue color in all sections of Figure 1). On the other hand, the urban area inundation increased but slower than beach areas. A similar change happened at the southwest of Apalachicola National Forest in Franklin County, buffering the inundation extend when SLR changed. This caused block groups who located nearer to the seashore lost their accessibility to shelters faster than inner block groups, as shown in the next section.
The inundation models provide important information for further accessibility analysis, such as identifying evacuation route availability, and estimating impacted population and locations. Table 1 emphasizes that more severe SLR scenarios bring a steep increase in the risk. Hurricane evacuation plans under SLR considerations can have a disproportionately bad impact on the affected population, whether they are underserved or not, and whether they live in a rural or urban area. This presents a significant challenge for emergency management and evacuation efforts, particularly in coastal areas that are the most vulnerable zones to SLR. Our results clearly demonstrate the potential risks associated with SLR, primarily in low-lying coastal areas. As such, to prevent the potential impacts of SLR to hurricane storm surge inundation, people should consider the risk of flooding to critical infrastructure, as well as the potential for displacement and isolation of affected populations.

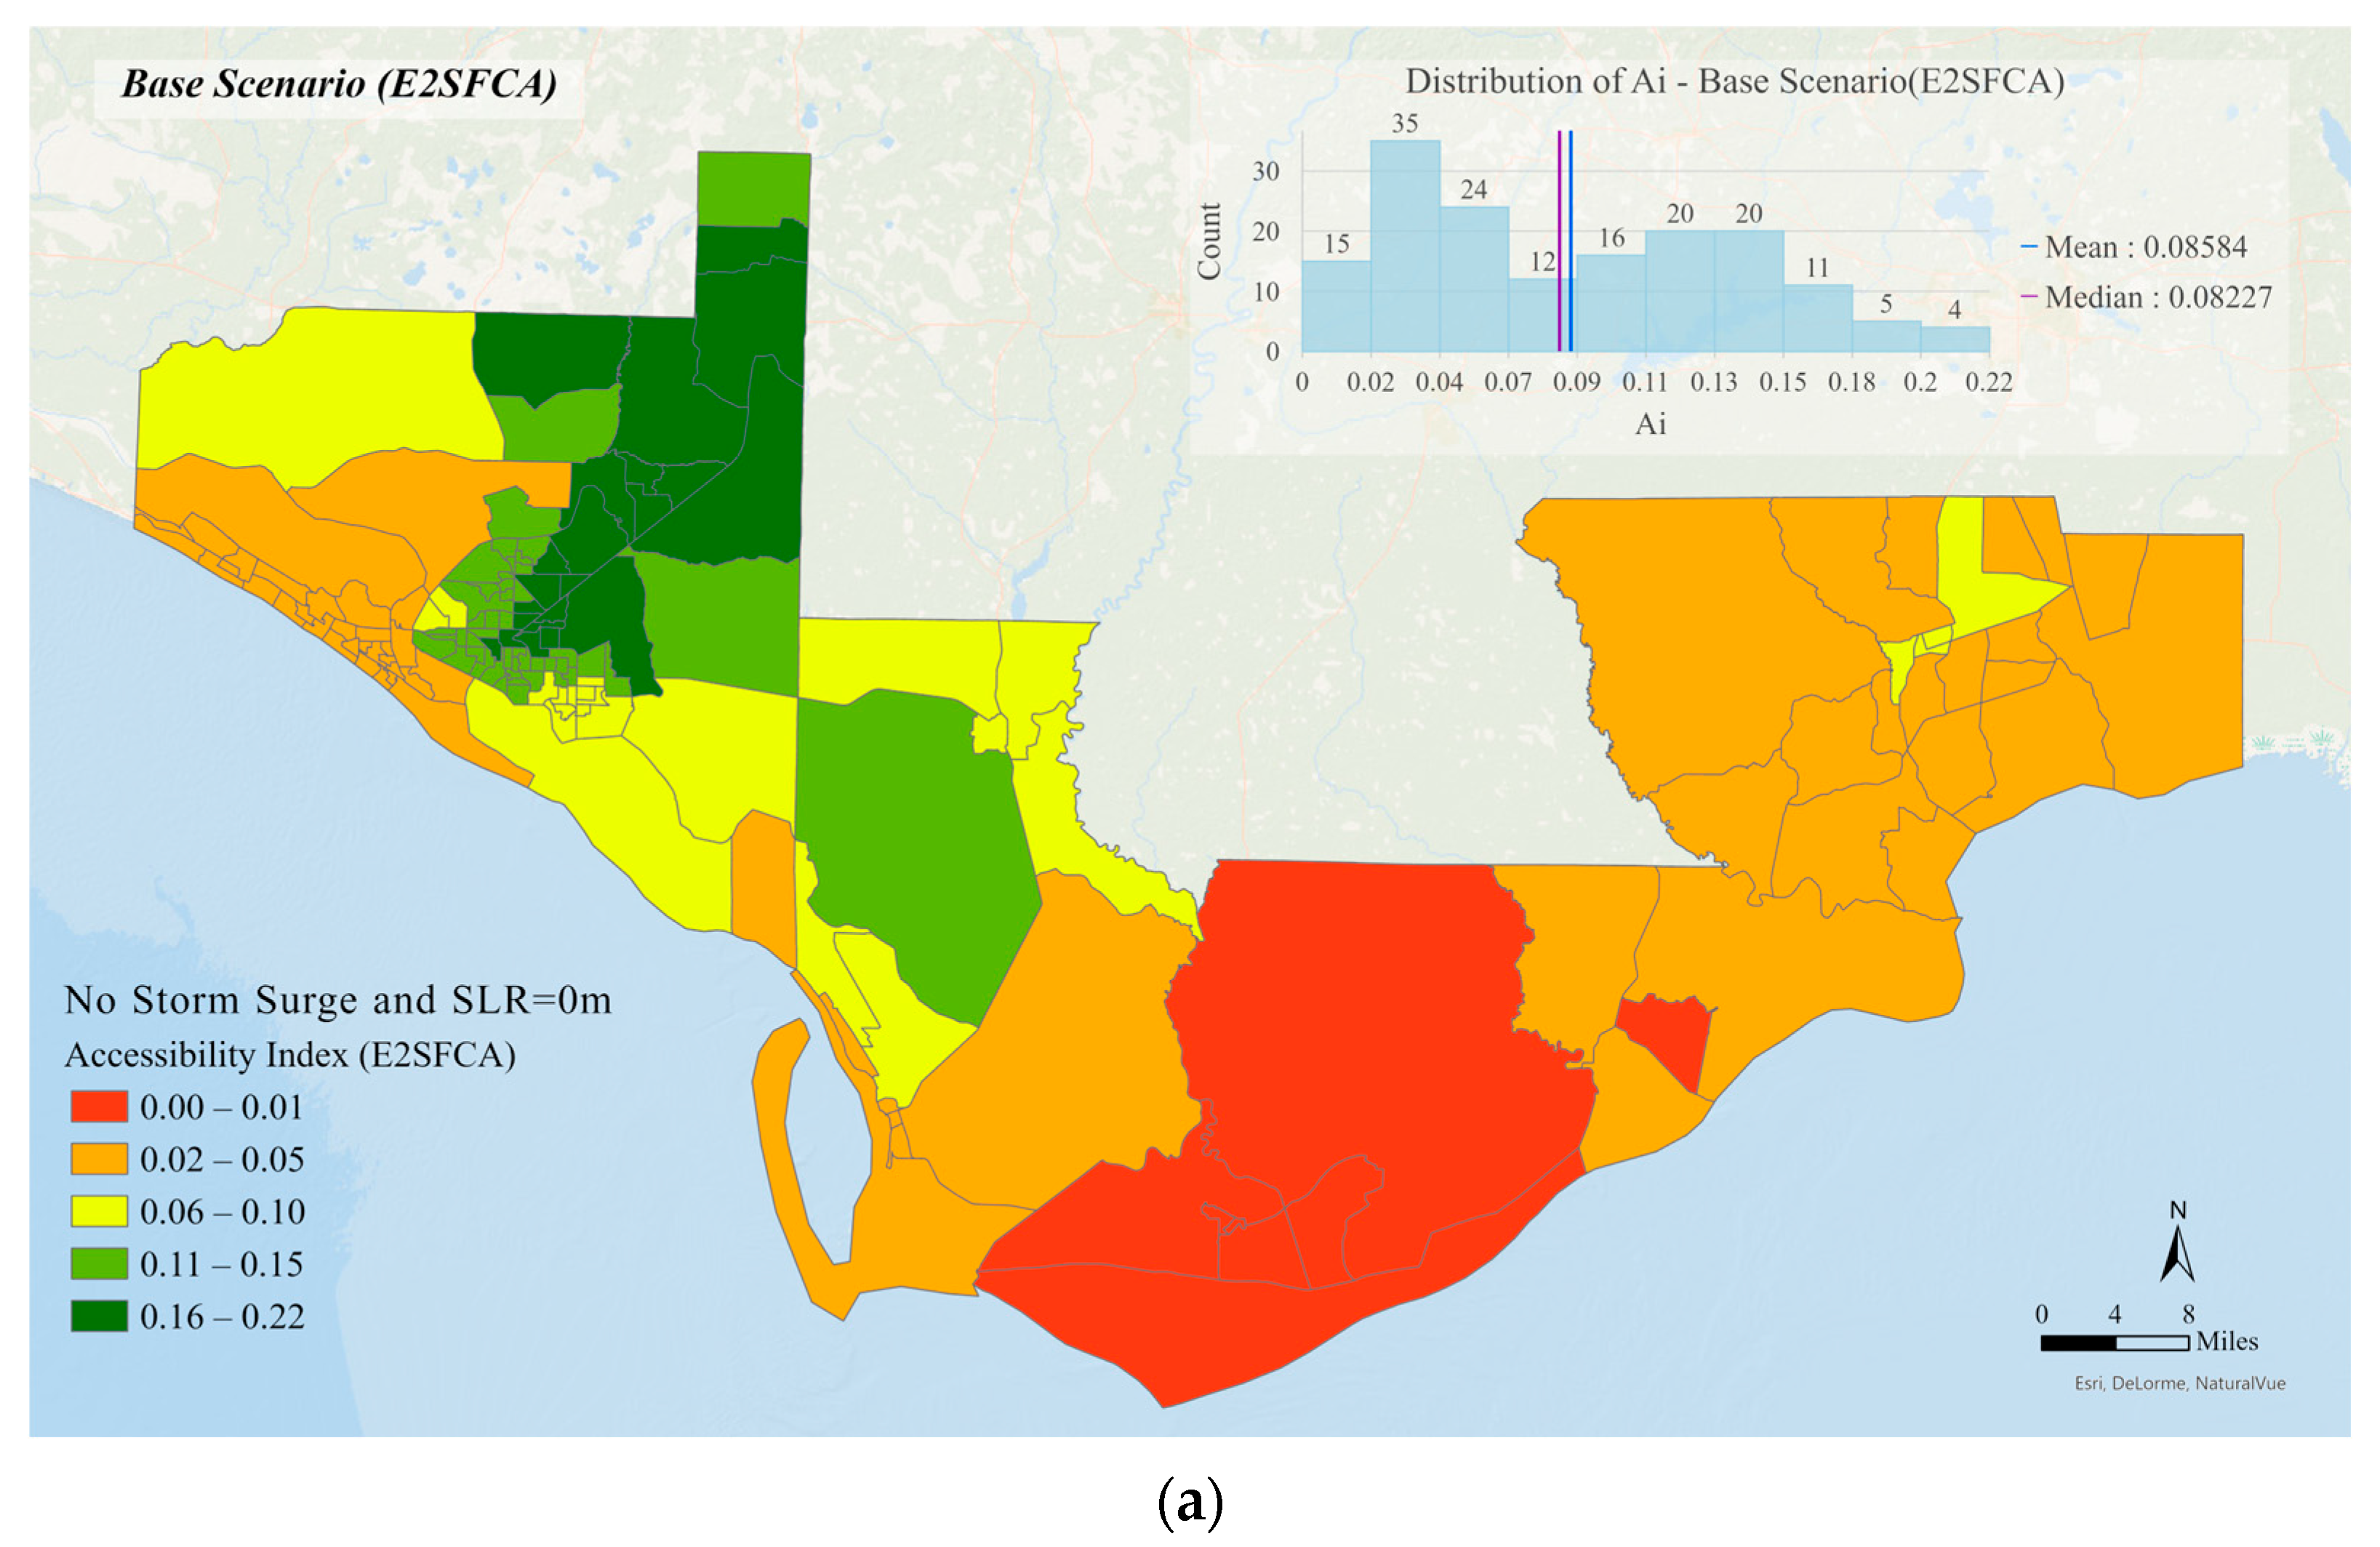
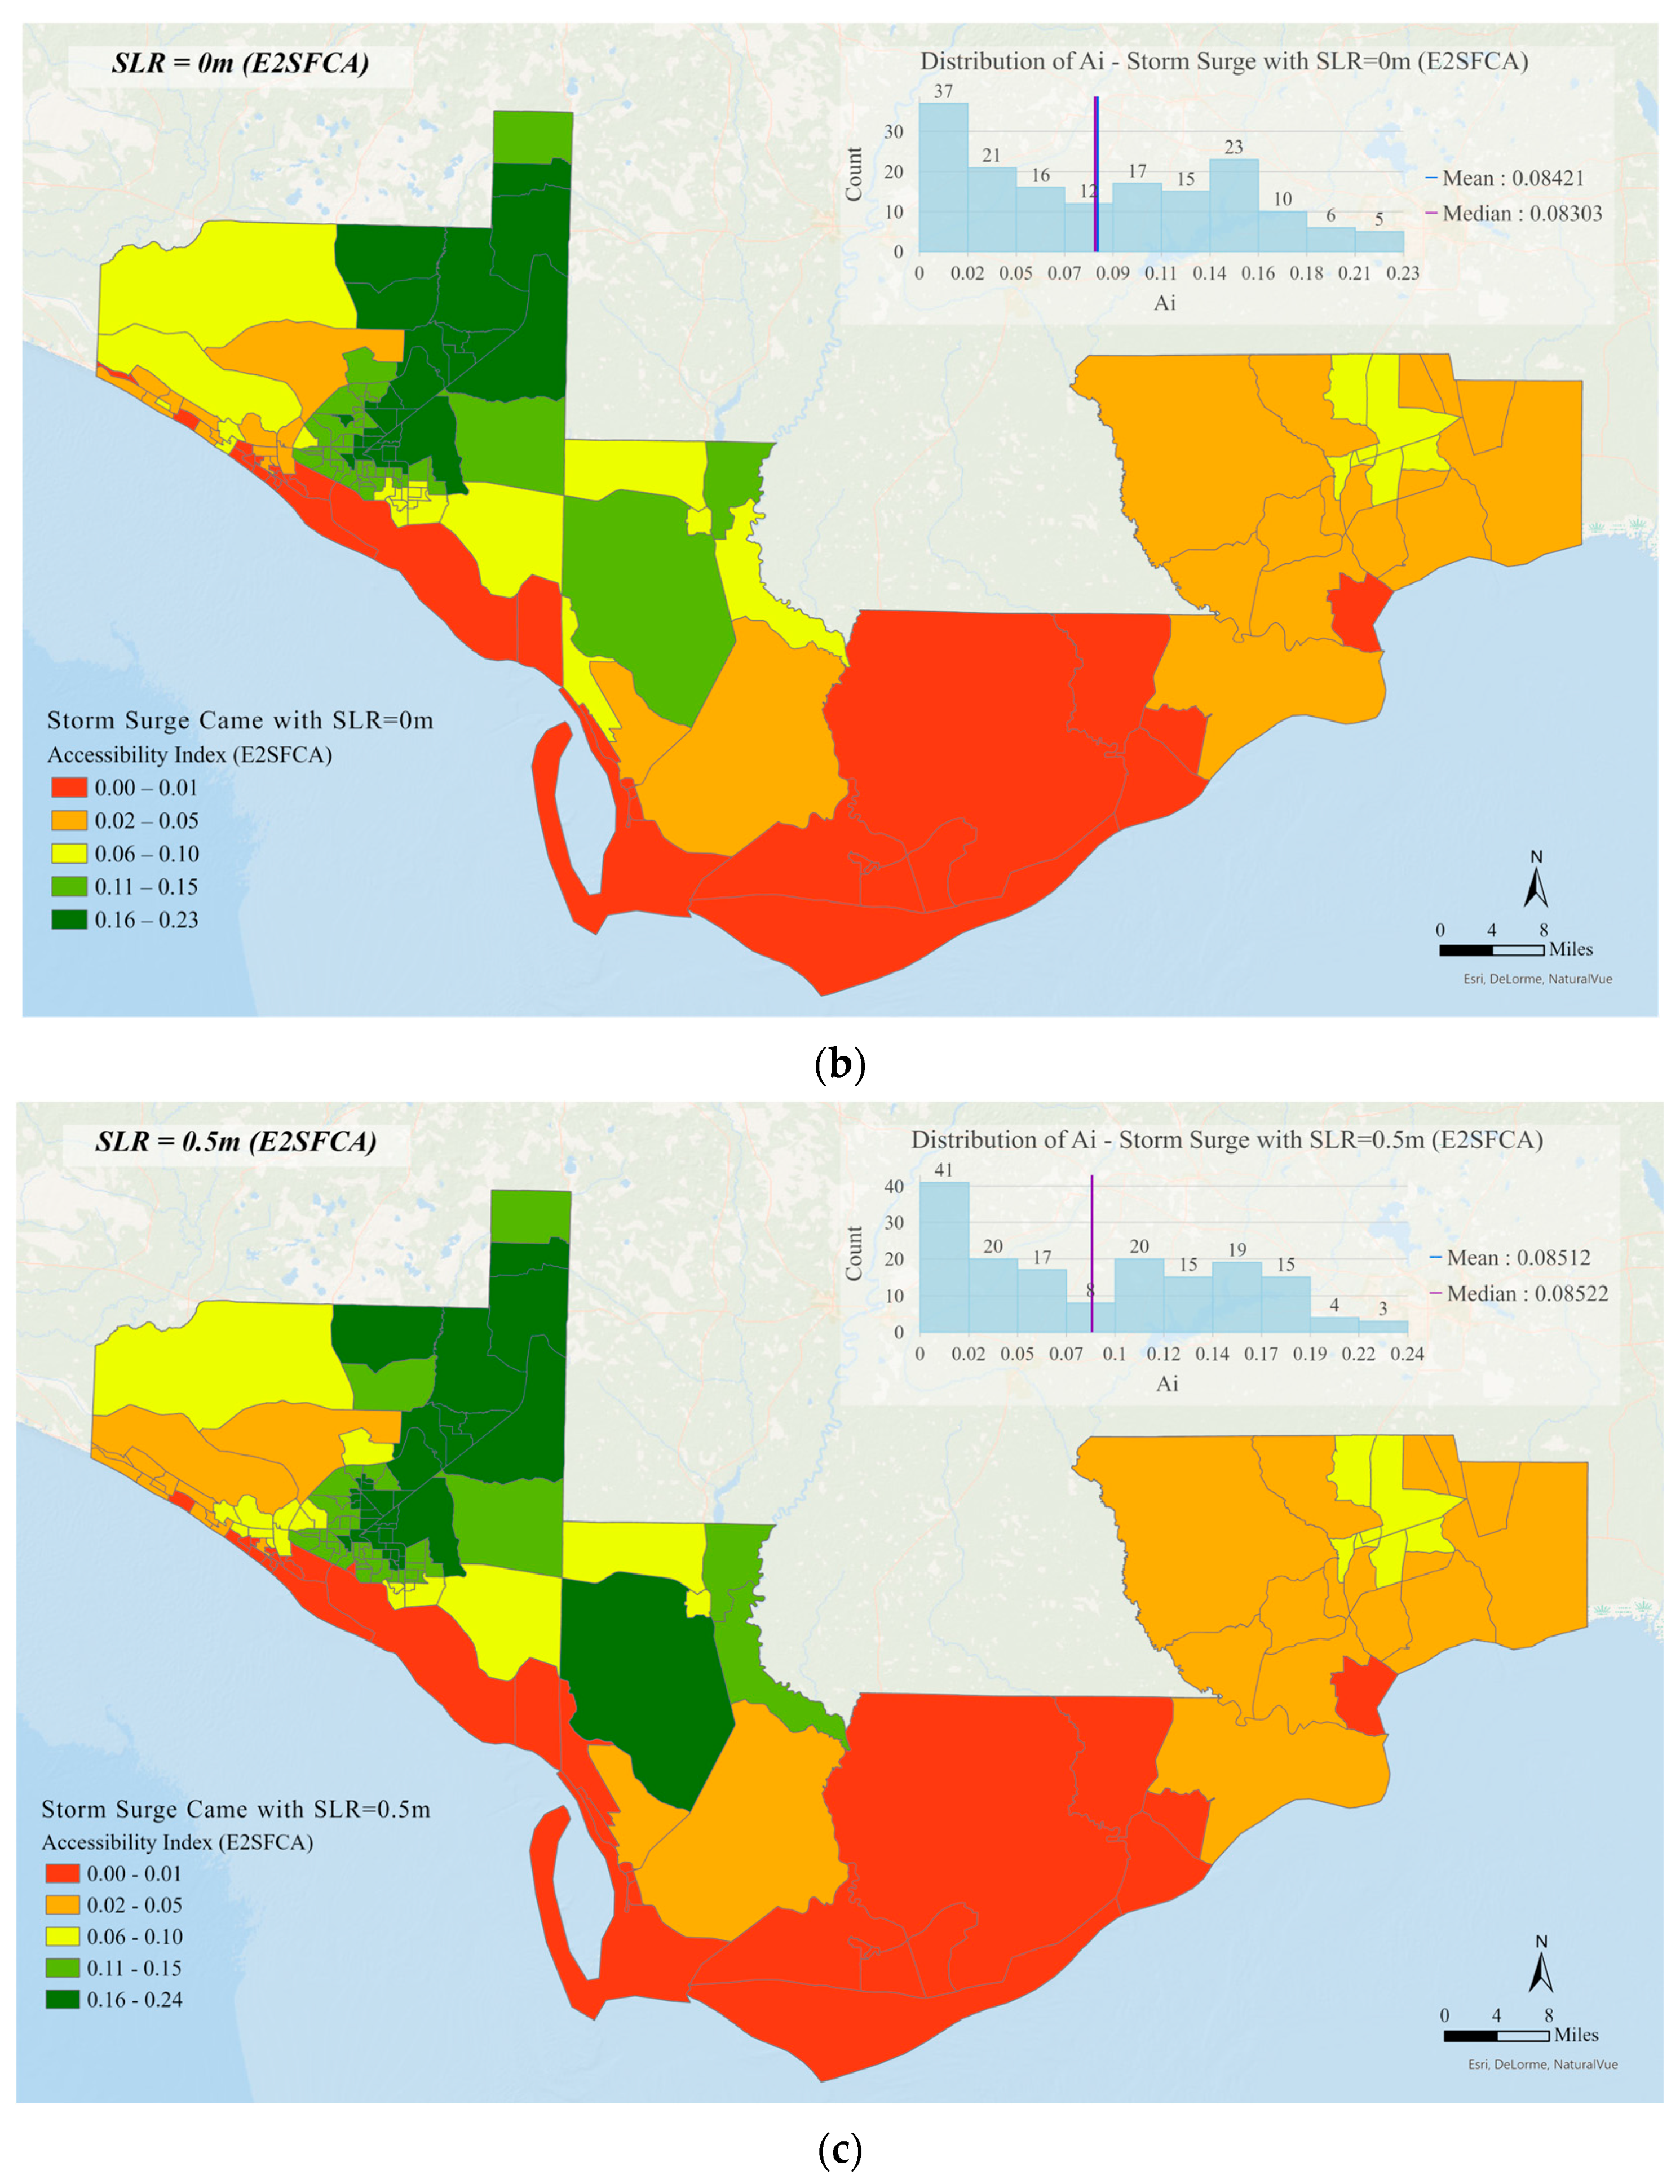
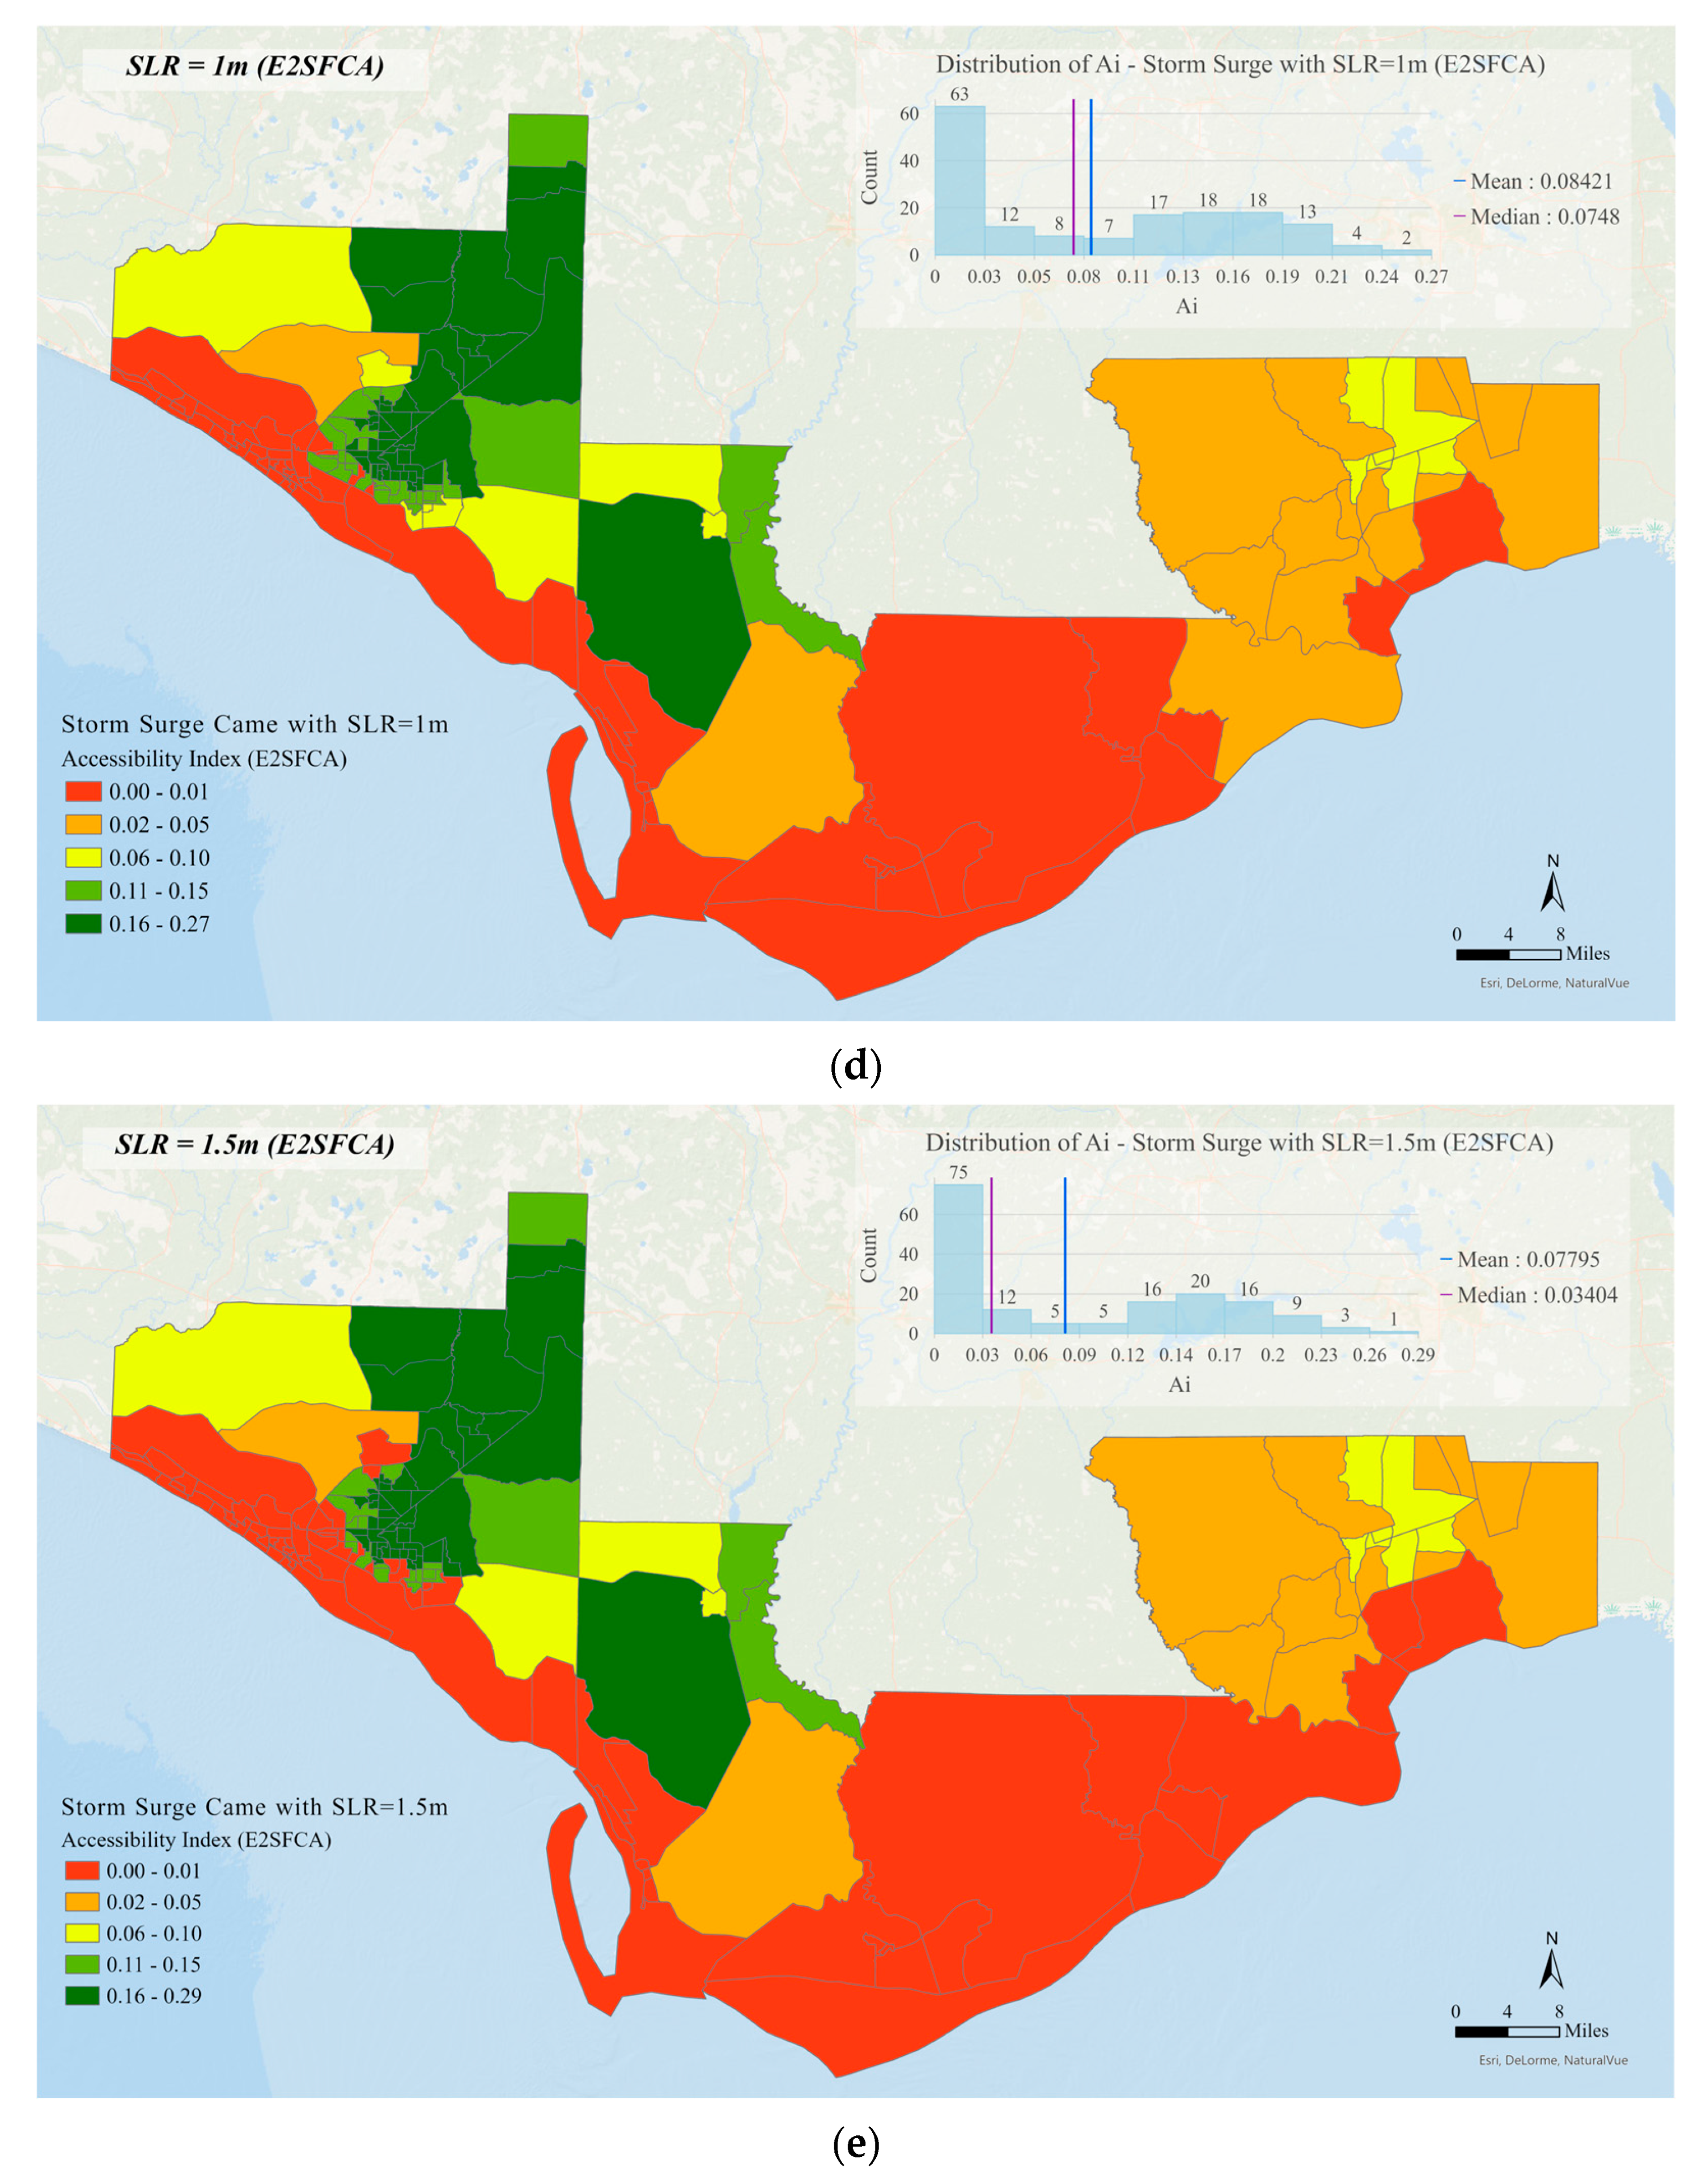
4.2. Accessibility Index Assessment via E2SFCA

The results of applying E2SFCA to the study area are shown in Figure 3. Although the west to central areas in Franklin County had an A i as low as valued in the lowest category since the areas had more forests and fewer roadways, other census block groups on or near the coastline jumped from an intermediate level of A i to the lowest category quickly when sea level rise brought more water to the inundation. Looking at the histogram from Figure 3a–e, census block groups that are already assigned a median or low level A i would have the trend of clustering to a lower A i level. However, census block groups originally had a high A i and seemed not to be impacted much by SLR. Instead, some of the green symbol colored census block groups could even reach a higher A i when more coastal residents lost their access to shelters. This is possible for FCA calculations if we look again carefully at the formulas.
When shelter capacity stayed the same, R j relies on only the weighted population within catchment areas using E2SFCA. While catchment size remained to be the same—in case the only variable among scenarios was SLR increasing, the population in inner or urban areas who needed to be served would share shelters less with other further block groups who already lost access to shelters. Additionally, shelters in Figure 1a are located around higher density areas, which means that the urban block groups would not lose roadway accessibility and would keep high accessibility to less-shared shelters. But overall, the number of census block groups that have decreased A i to shelters was reduced. That explains why the maximum A i was not cut down while the mean of A i remained between 0.085 and 0.086.
Another notable finding presented in Figure 3 is that the count of census block groups with A i < 0.03 increased with an unstable speed while SLR was lifted up linearly between scenarios. This is a chain reaction of the nonlinear spreading of inundation mentioned in previous literature. For every 0.5 m increase in sea level, the inundation area and water height of the hurricane do not increase linearly but show a slope biased inflection point at some point. For example, a sudden increase in census block groups with a large number of low A i to the west from SLR = 0.5 m to SLR = 1 m may be due to a steep increase in storm surge during this SLR change interval, resulting in a sudden and pronounced disaster impact.

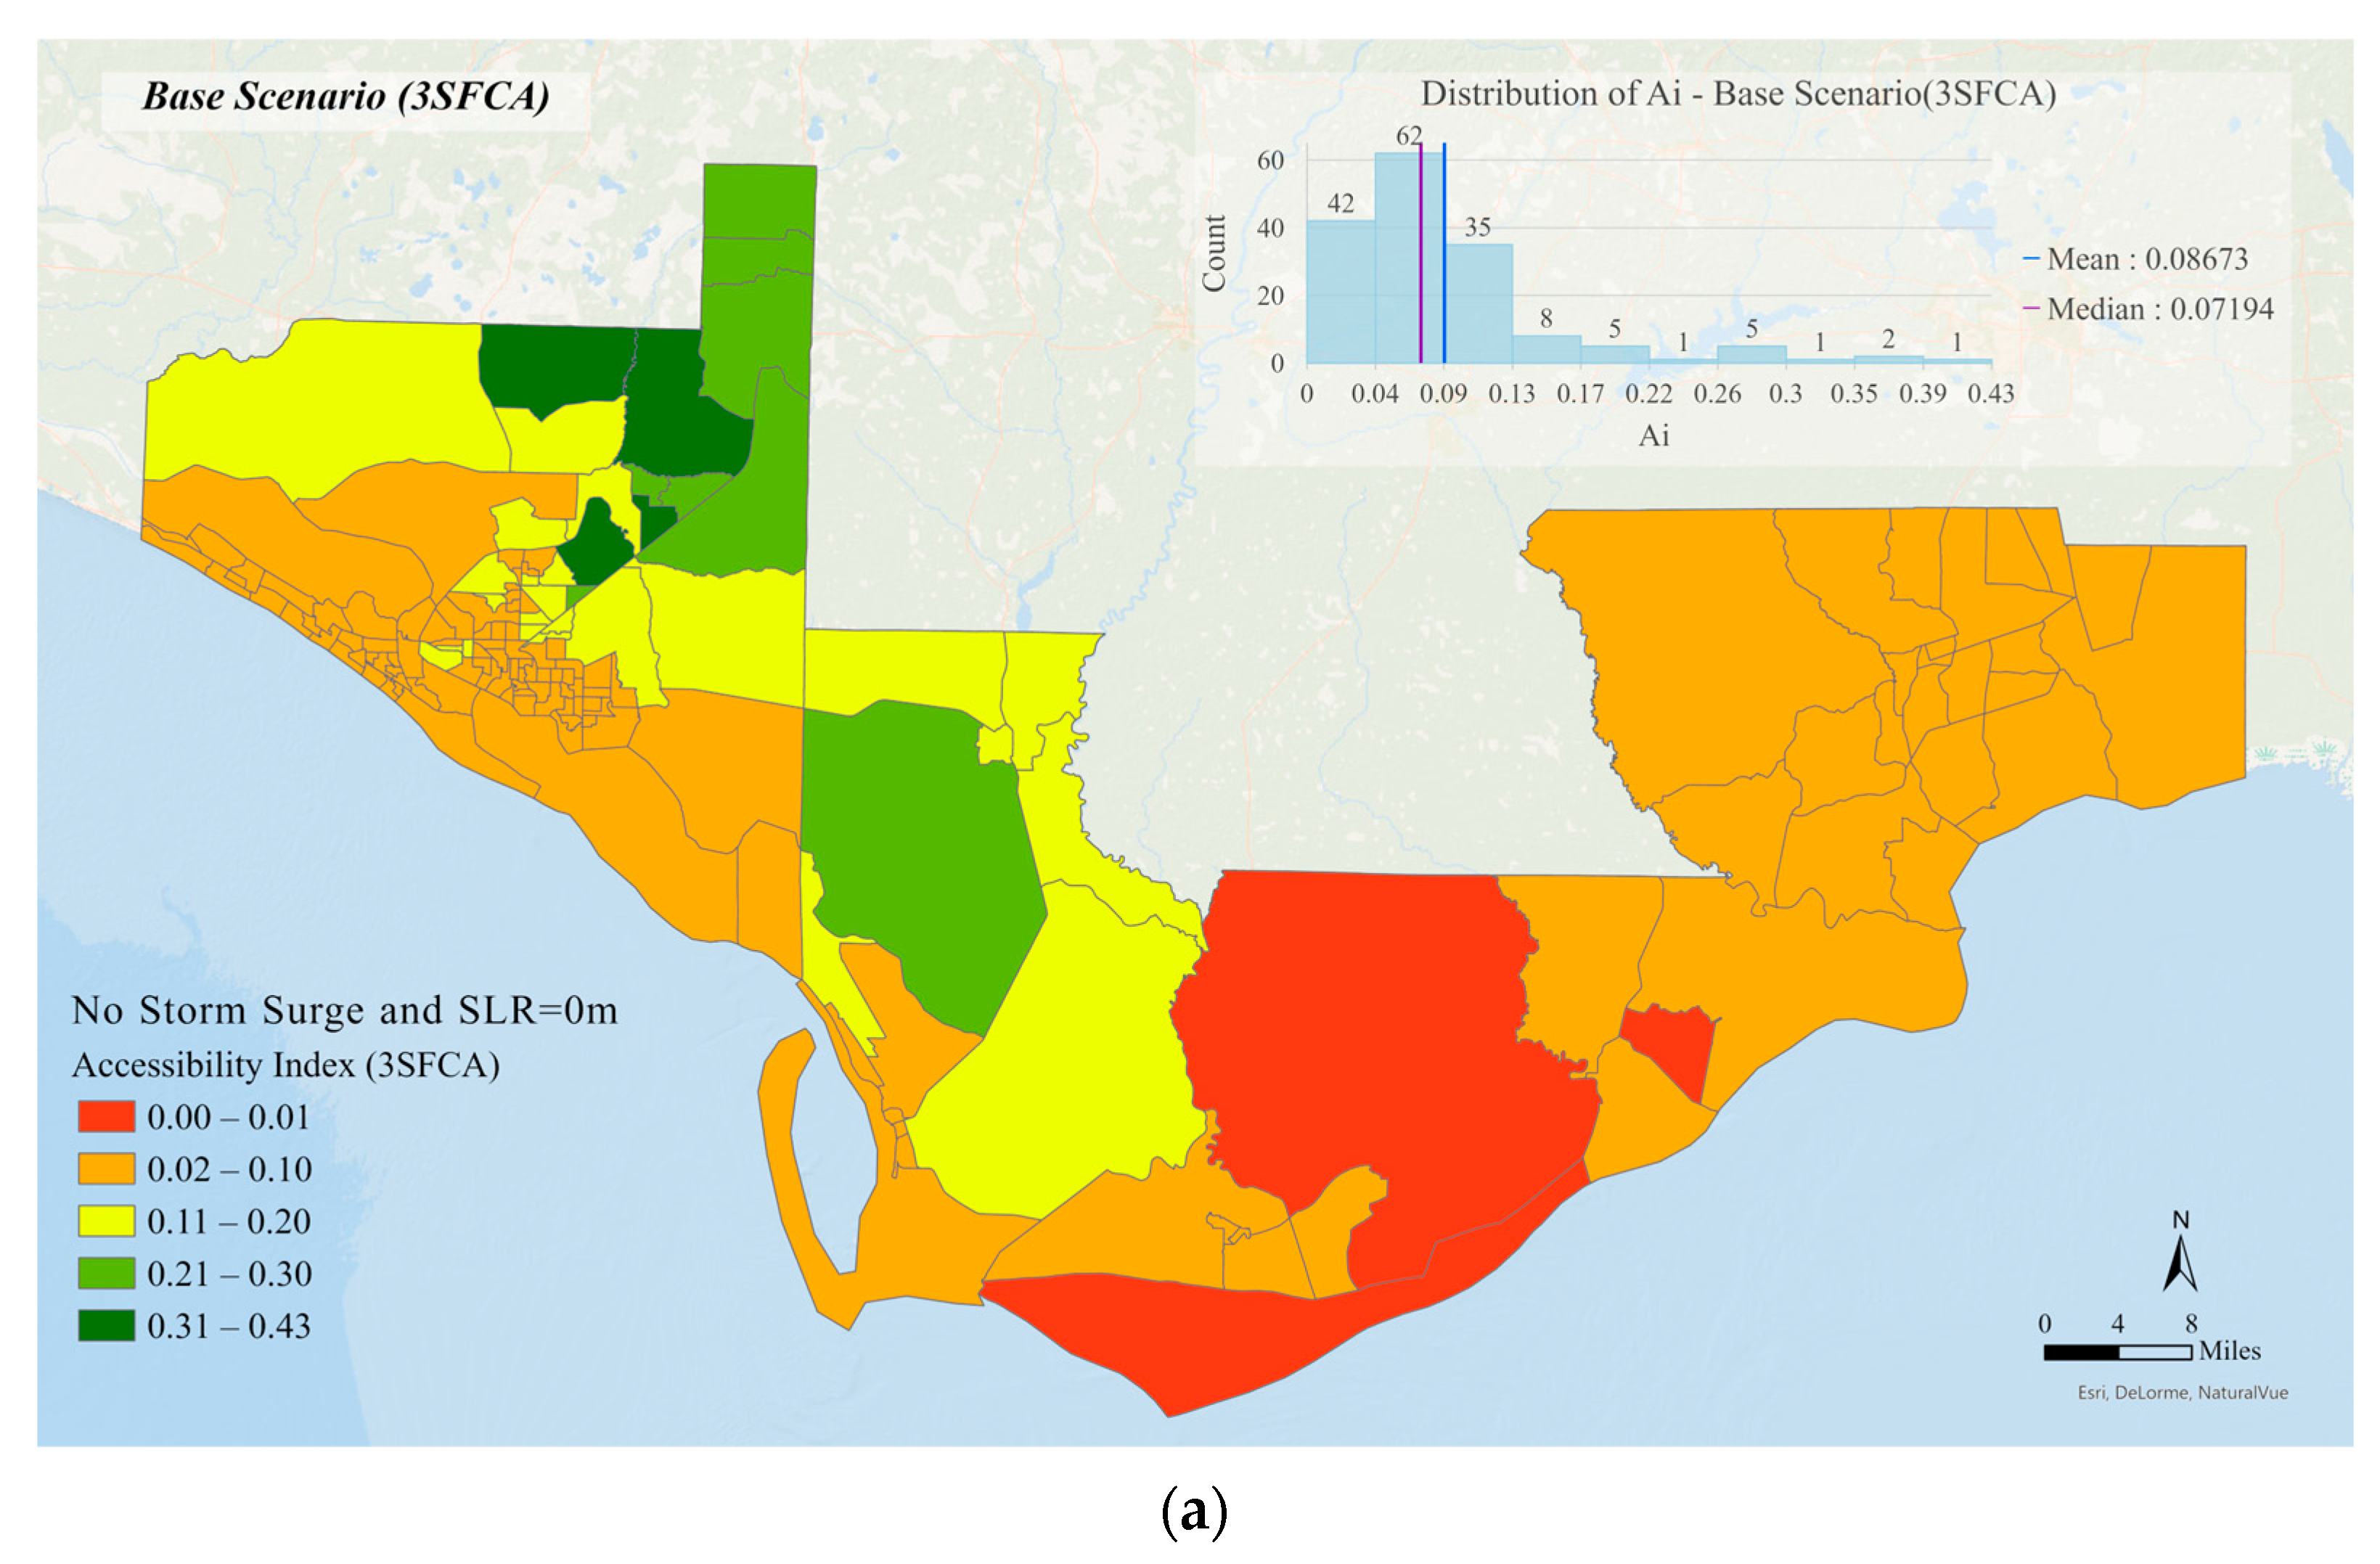
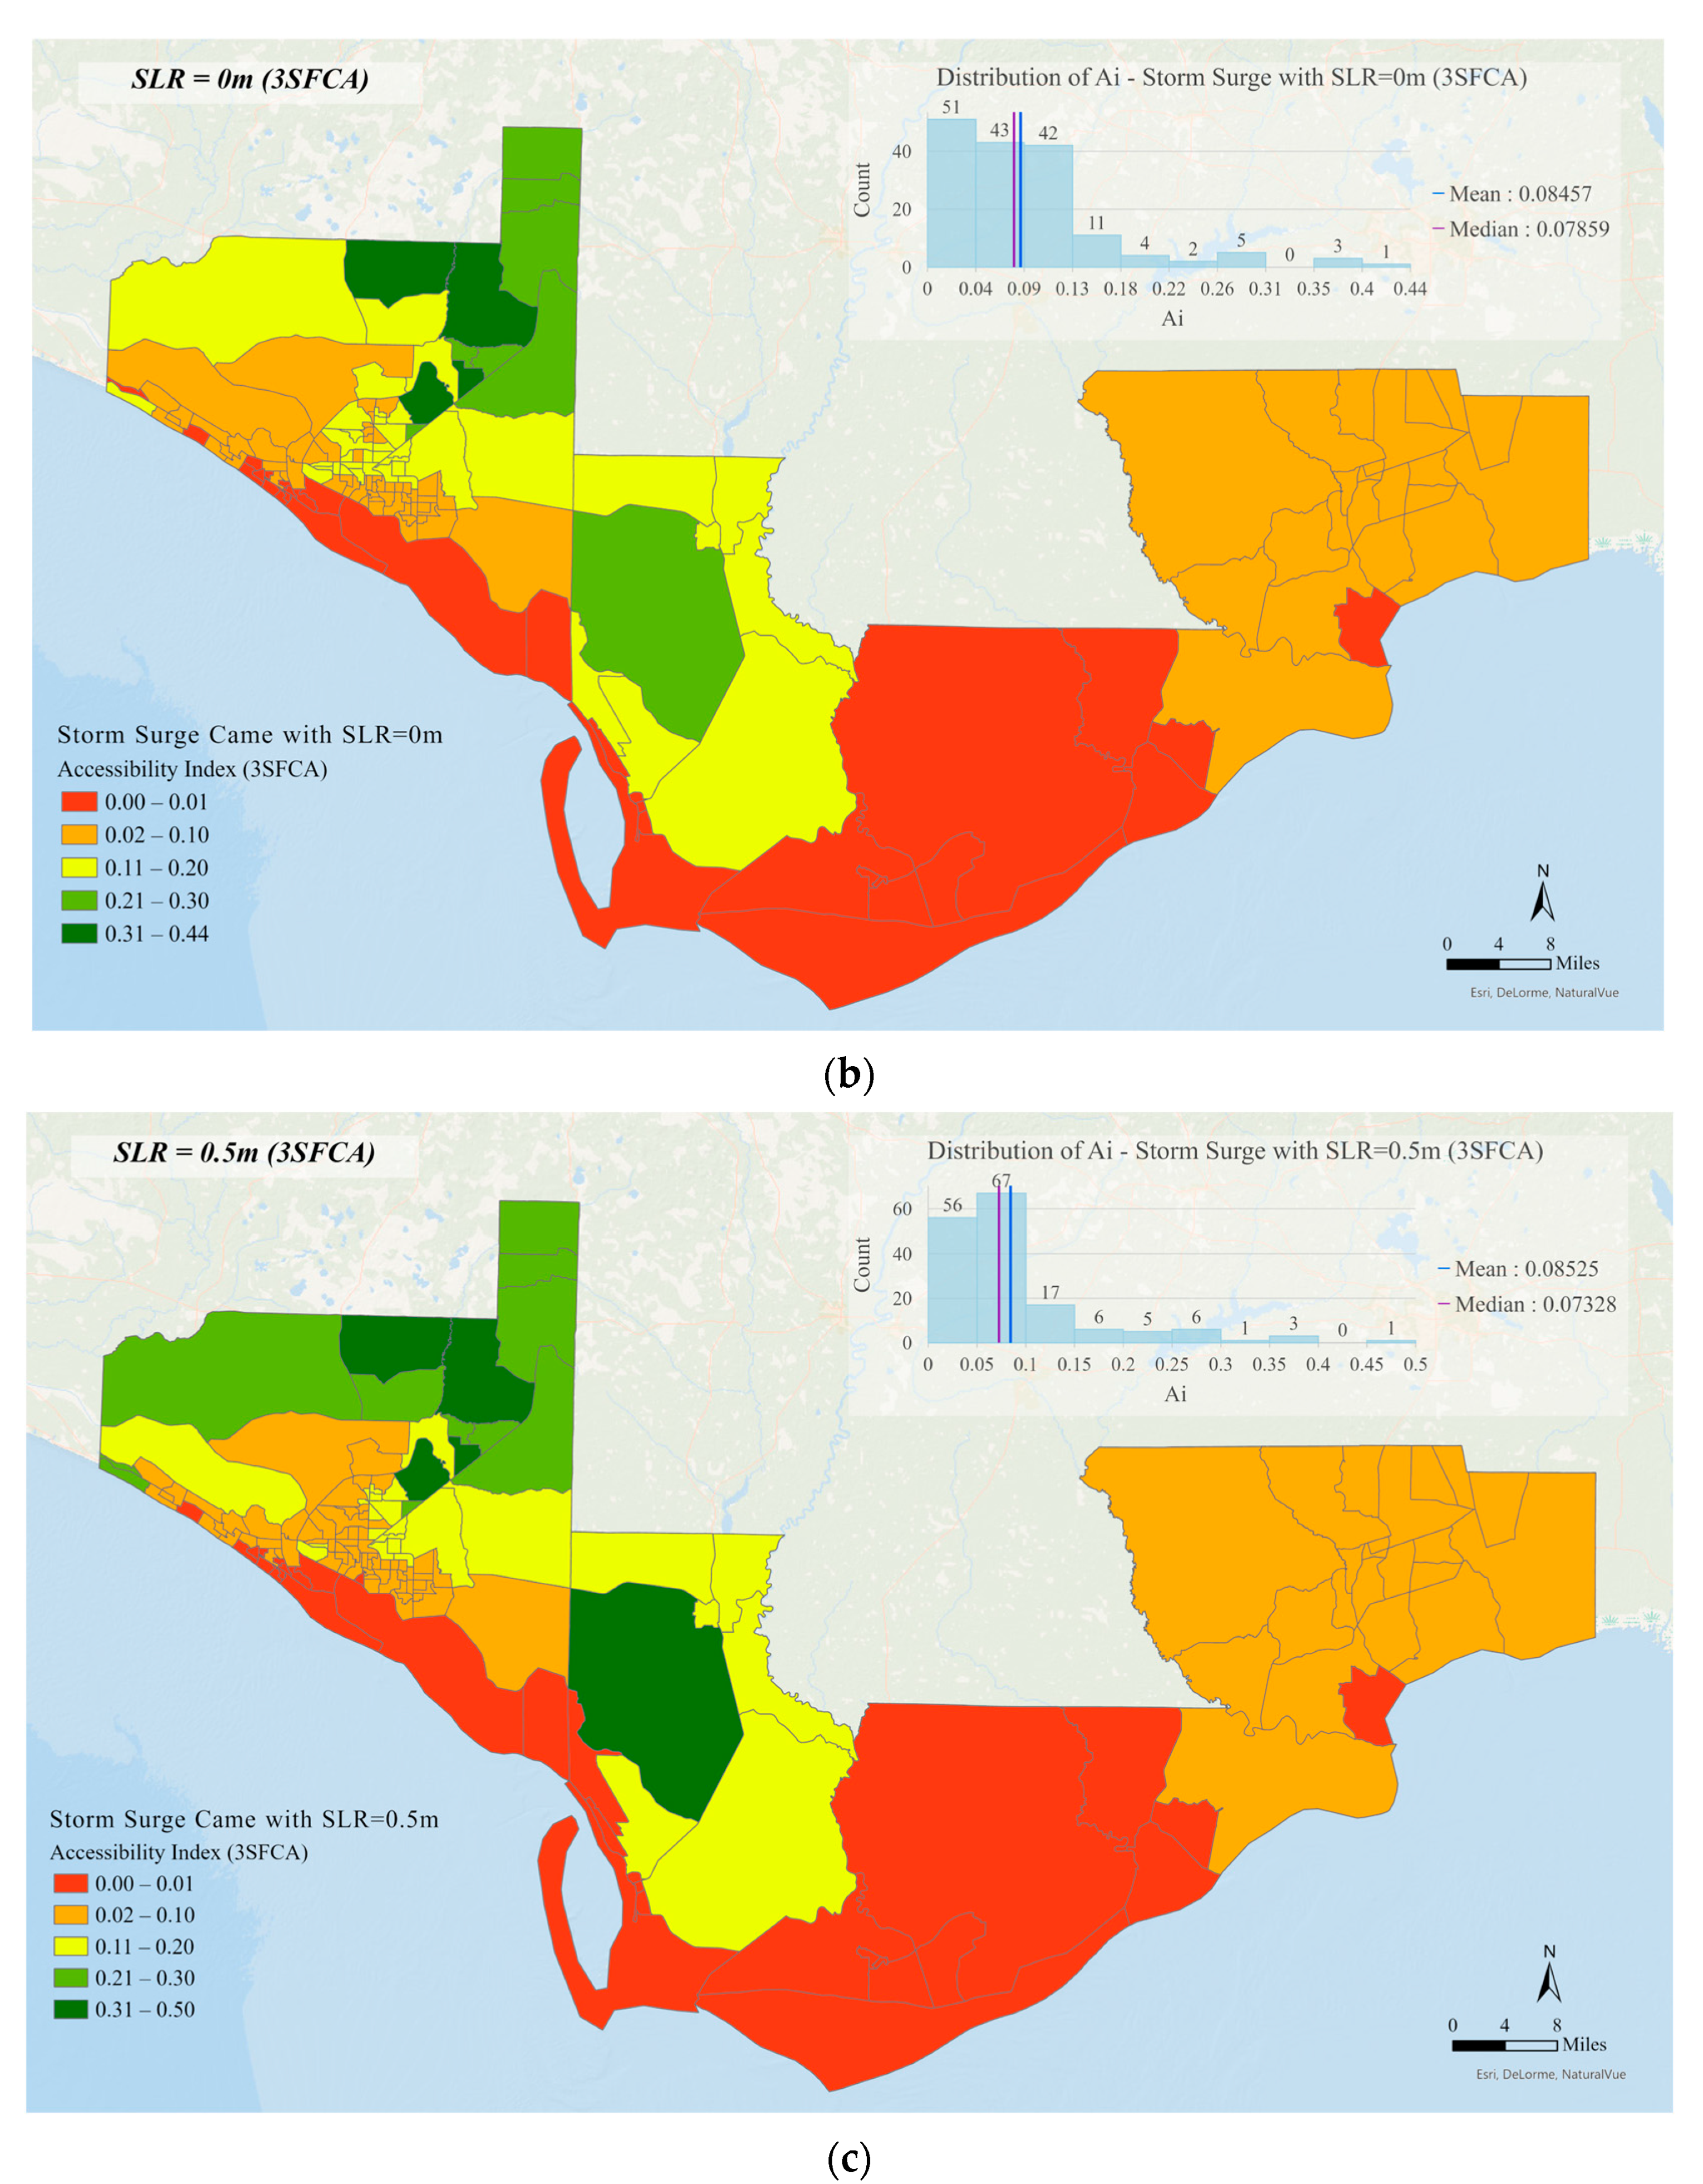
4.3. Accessibility Index Assessment via 3SFCA

A few studies mentioned that, if 3SFCA would get a larger or a smaller A i for each population location, 3SFCA may not change the mean for all A i comparing to E2SFCA with a visible obvious difference. However, this will give a smoother simple-trend distribution of the A i values that are shown in each distribution histogram charts of Figure 4. Referring to Equations (4)–(6), 3SFCA generated the selection weight G based on travel cost as well as the distance decay, and G < W . Therefore, when calculating the provider-to-population ratio R j , the denominator r = 1 , 2 , 3 , 4 i t i j t r P i · W r · G would be smaller than i t i j t r P i · W r in E2SFCA. Physically speaking, it produced a lower but more reasonable demand for shelters to be assigned to, and the overestimation problem happening for service locations was relieved. But it also led to a slightly larger R j . When summing up R j in the catchment size for each population location i, the result of A i would be higher than E2SFCA.
Comparing the base scenario with SLR = 1.5 m scenario, the number of census block groups with higher A i in E2SFCA had an increasing trend. For instance, in Figure 3a, there were 4 block groups who had A i higher than 0.2 whereas it increased to 14 block groups whose A i values were higher than 0.2 in Figure 3e. However, the number of high A i census block groups in 3SFCA seemed to be stable when SLR increased. Looking at histograms in Figure 4a,e, the number of census block groups whose A i distribution is shown at the end where largest value interval was staying as 1. Moreover, this last interval of A i had a more skewed distribution compared to most of others, just like an undesirable value that should be taken out of consideration. It shows a function of 3SFCA, that applying a selection weight function in A i assessment may help to sieve out outlier values for further research.
According to both Figure 3 and Figure 4, the mean and median values of A i were dispersed in E2SFCA scenarios as SLR increased. Nevertheless, in 3SFCA scenarios, the difference between two kinds of measures did not have any sudden change until Figure 4e where the highest A i became too high to be reasonable. 3SFCA could give a set of smoother distribution of A i when the evacuation became more problematic due to less and more difficult access. On the other hand, keeping its smoothing impact, 3SFCA demonstrated more visually that population in urban areas where more shelters would not lose much of their A i . However, people in rural areas like Gulf County and Franklin County would rapidly reach a low level of accessibility.
For both E2SFCA and 3SFCA, the A i resulted in a major group of less than 0.2. This situation was caused since there were not enough shelters to meet the demand for hurricane evacuation. This occurred in areas with high population density or in areas with limited facilities. In other words, if further studies would like to improve the accessibility to shelters during hurricane evacuation in the northwest Florida, they should optimize in a way that there will be larger capacity of existing shelters or equally distributed locations for both urban and rural areas, not clustering shelters only in populated cities. Additionally, other factors such as varying travel time, and socio-economic characteristics of the population could also impact A i calculated via FCA methods. Some possible suggestions for future evacuation preparations can be improving roadways by widening roads, elevating roadways, and improving better traffic flow management. Providing public transportation options during evacuation using vehicles such as buses can also help increase the accessibility for people with lower income levels, people living in rural areas and vulnerable populations who do not have their own cars.

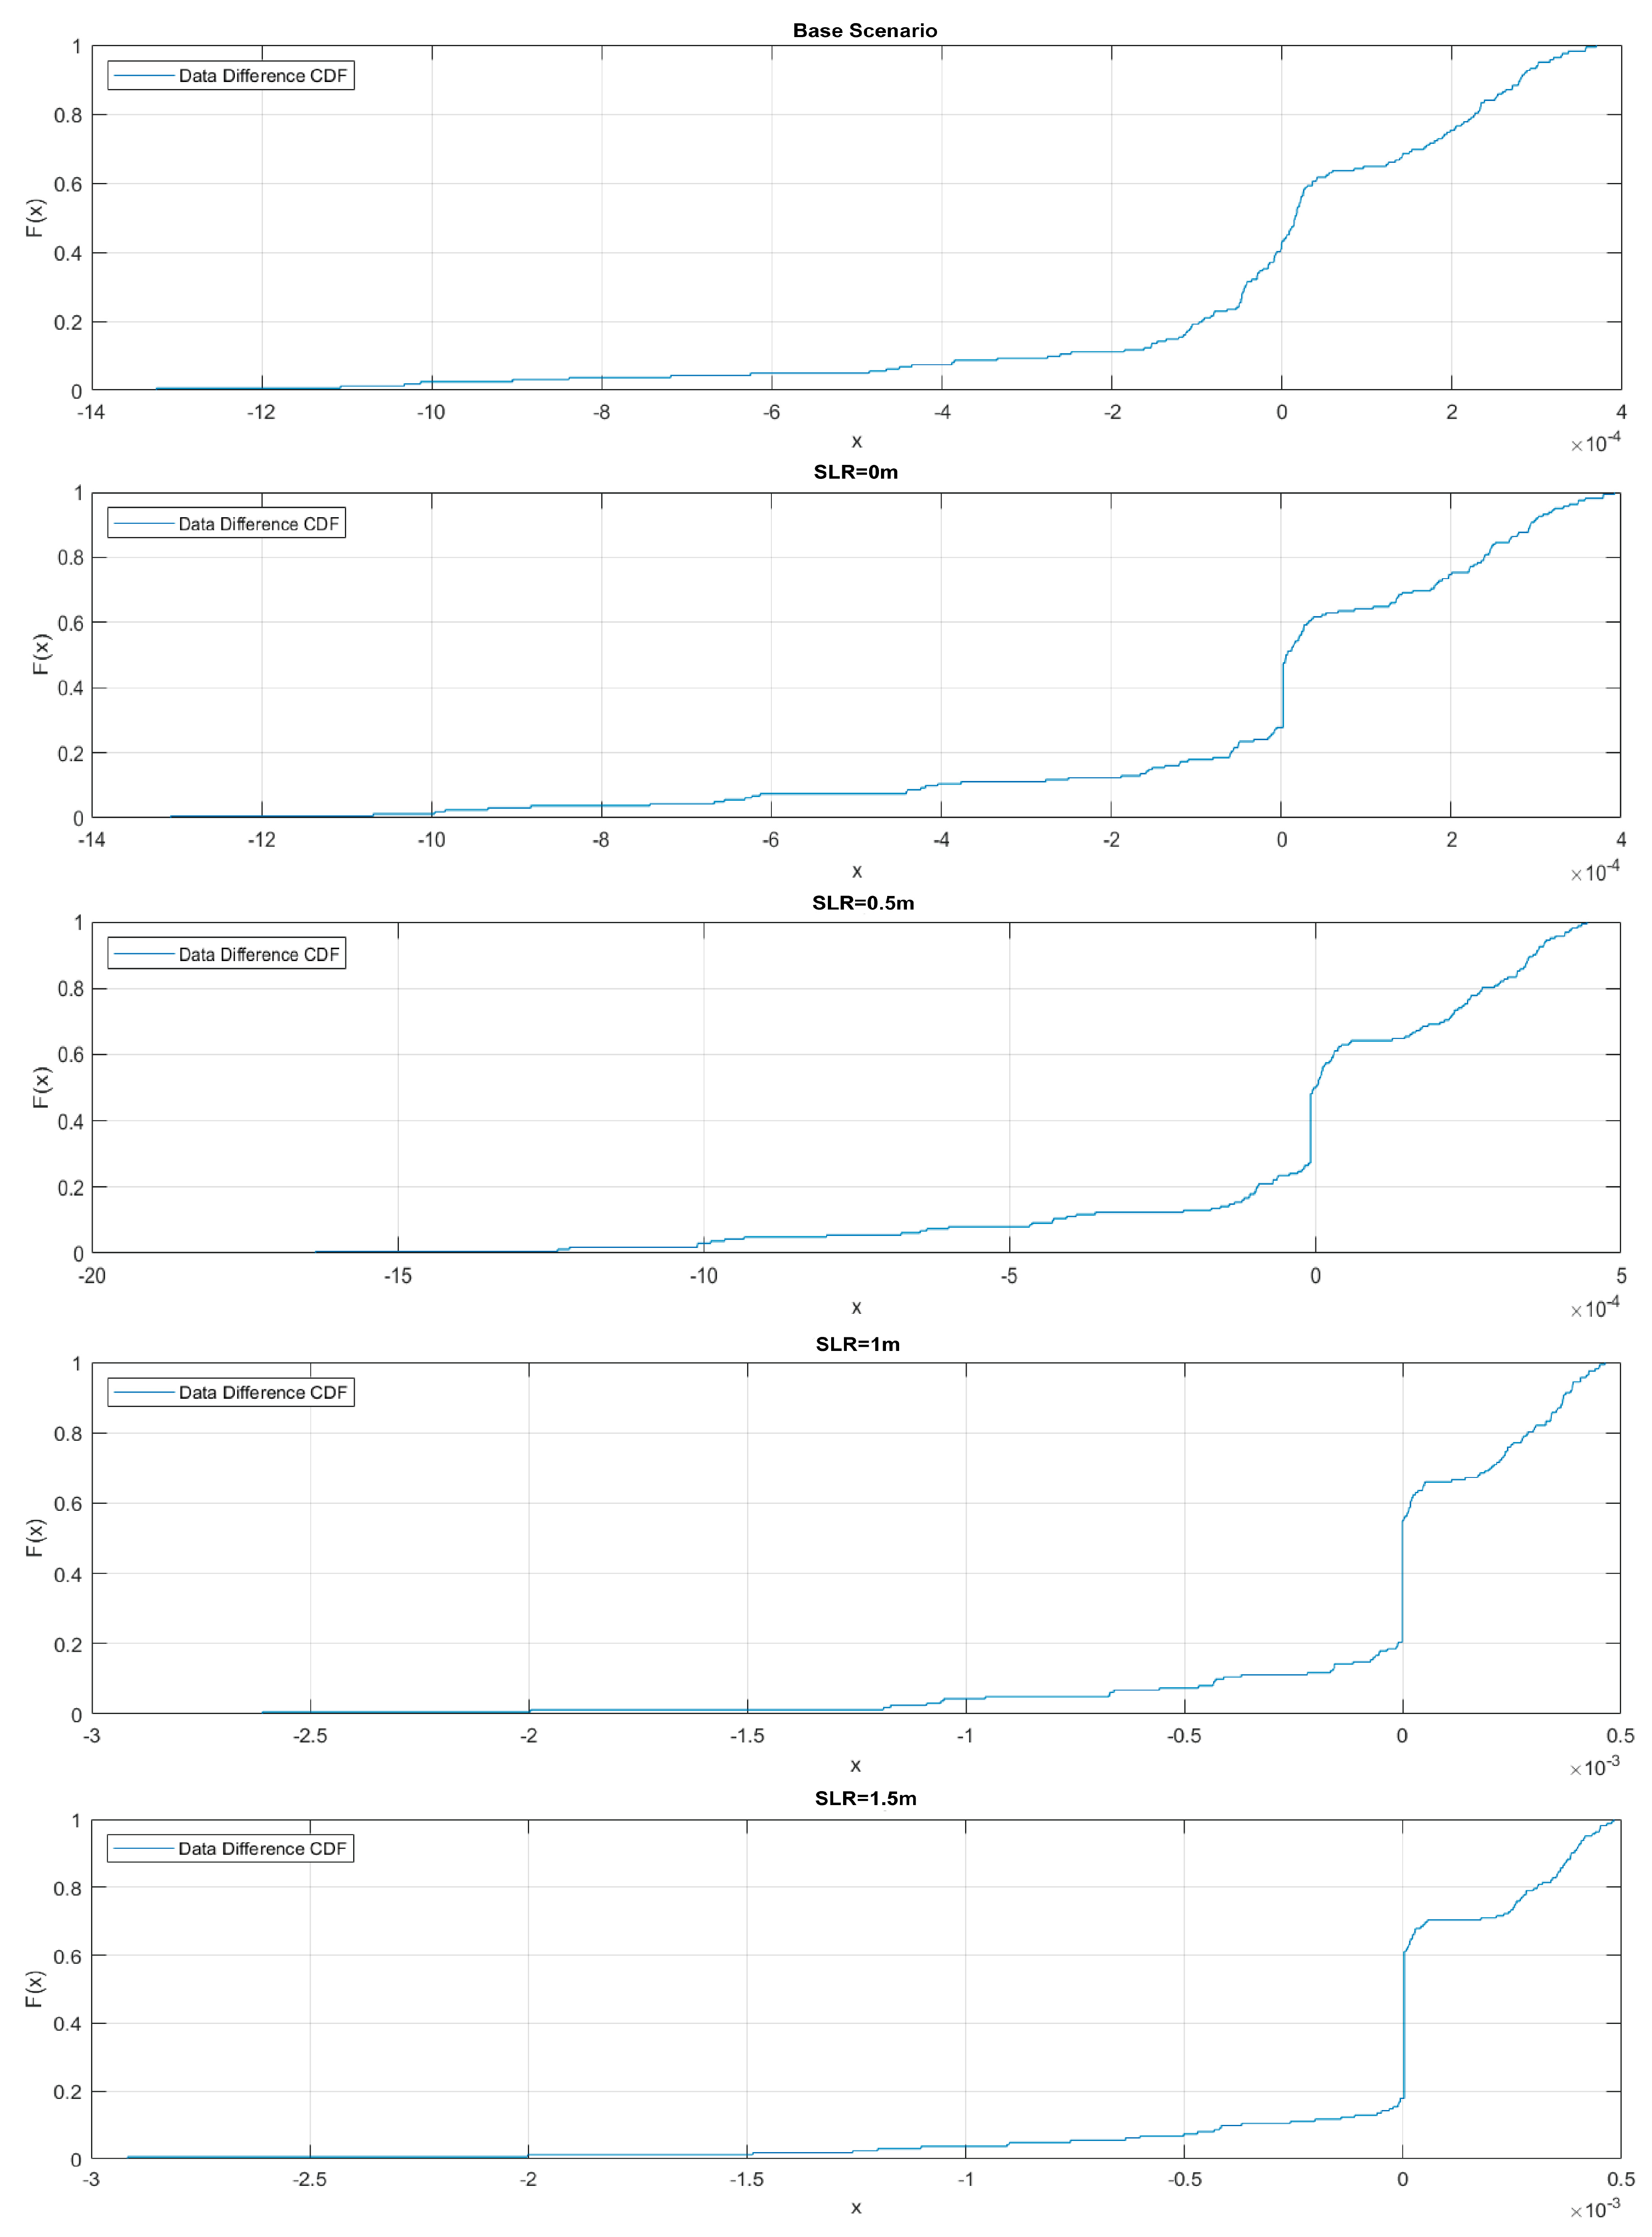
4.4. Comparison of Results

After obtaining the E2SFCA and 3SFCA calculations, as described in Section 4.2 and Section 4.3, we wanted to compare the results. Results of different SLR scenarios exhibited distinct distribution patterns in the accessibility index histogram. The accessibility scores calculated by these two methods do not necessarily have the characteristics of a normal distribution. In order to determine whether the comparison between each related E2SFCA and 3SFCA accessibility score has a special distribution and thus apply an appropriate statistical method, the Kolmogorov–Smirnov (K-S) test was firstly used to determine whether the difference of two sets of results follow normal distribution or not [41,42,43].
According to Figure 5, based on the difference between the two kinds of floating catchment area simulation, we cannot accept the null hypothesis that data was normally distributed. None of any set of accessibility index results provided a normal cumulative distribution. In addition, p-values during K-S test were smaller than 10 11 among scenarios, providing another reason to reject normality. Note that base scenarios were related to original evacuations during blue sky days without SLR, while the other scenarios are either based on the inundation caused by Hurricane Michael at its observed strength or more severe inundation with additions of SLR. As such, the calculation results of the two methods have dived at the front end of the cumulative distribution. To present the differences of two sets of non-normally distributed results, a nonparametric statistic test, the Wilcoxon signed rank test was applied to conduct the required statistical analysis [44,45,46]. This test does not need to assume a specific distribution of the data and is suitable for nonnormal as well as skewed data, while it can observe the magnitude of the difference between variables. At the same time, the test has been known to perform well even with small sample sizes [47], suitable for the resulting data size of this study. For this research, the null and alternative hypotheses in this test were:
H0: 
The median of the accessibility score differences between two methods is zero;
Ha: 
The median of the accessibility score differences between two methods is not zero.
As shown in Table 2, we obtained a quantitative assessment of the data differences with p-values listed, supporting the interpretation of our research findings and the derivation of conclusions. The observation was intriguing, as they indicated a substantial difference between the accessibility index simulations of E2SFCA and 3SFCA. For base scenarios, since there was no external influence due to an event like a hurricane, the existing accessibility of this area showed a certain similarity under the two sets of calculations. It is understandable because the evacuated area was fixed as well as the demand/locations (i.e., population/origins) are fixed, the shelters and transportation network were also not affected. However, once the effects of hurricanes and SLRs were present, the accessibility scores derived from the two methods showed significant differences.
The current research focused on examining accessibility scores within the context of the study area, without considering the potential ramifications of rising sea levels. It is important to note that increasing SLR has the potential to significantly alter coastal regions by causing shoreline inundation and land boundary flooding under the water. As such, these changes may have profound implications for the accessibility of various locations along the coast. Given the dynamic nature of coastal environments, it is expected that the number of census block groups with nonzero accessibility scores would experience a continuous and nonlinear decrease as sea levels rise. This is due to the encroachment of seawater onto previously accessible areas, leading to reduced connectivity and increased spatial barriers.
Overall, understanding the impact of SLR on accessibility patterns is of great importance for effective planning and resource allocation in coastal regions. To gain a comprehensive observation of the relationship between SLR and accessibility, future research needs to delve deeper into this phenomenon, such as conducting detailed analyses that incorporate spatial analysis methods—as mentioned before. Extending the 3SFCA will be a valuable research topic, and consideration of infrastructure vulnerabilities is another. The latter is basically an effective benefit that enables evacuation planners to develop proactive measures to assess the impact of climate change-related factors on hurricane response. The investigation of emergency response methodologies pertaining to hurricane evacuations, including power supply stabilization and security [48], merits scholarly examination. Given the prevailing conditions of pronounced climate change, it becomes imperative to deliberate conscientiously on not only the enhancement of evacuation accessibility and personal safety assurance, but also on the resilience of infrastructural technology in effectively addressing more severe adversities that lie ahead.

5. Conclusions and Future Work

This paper delved deeper into the spatial analysis of four counties in northwest Florida in terms of evacuation accessibility based on the impact of Hurricane Michael. The paper aimed to anticipate future climate change impacts by establishing scenarios that simulate the effects of four potential SLR levels. These scenarios were based on increasing SLR levels of 0 m, 0.5 m, 1 m, and 1.5 m. It was found that while the rise in SLR had a nonlinear effect on the hurricane storm surge, it led to uncertain and unstable changes in the accessibility index of hurricane shelters. Core research gap that this paper was attempting to fill is developing a more comprehensive and efficient hurricane evacuation planning based on SLR, which is applying SWAN+ADCIRC storm surge modeling to potential hurricane-based simulation and developing more accurate storm surge cases for further evacuation scenarios.
To enhance the accuracy and reliability of the findings, two methods, E2SFCA and 3SFCA, were employed. Both E2SFCA and 3SFCA methods employed distance decay weights to evaluate the spatial accessibility of shelters. However, 3SFCA incorporated an additional selection weight that considered the appropriate population served by each shelter. In the case of a hurricane evacuation, people tend to choose the shelter that requires the least driving time. Thus, shelters located closer to urban centers tend to be more attractive and receive a higher number of victims. The selection weight in 3SFCA considers this factor and assigns a higher probability to those shelters that can be reached in the shortest driving time. Shelters located far away from population centroids can avoid overestimation of demand, while reducing excess congestion so that people would not drive to them in real world situations.
E2SFCA and 3SFCA would yield similar accessibility indices when they are using the same parameters, such as the same distance decay function and the same catchment area and sub-zone sizes. In our case, the only difference between scenarios was the SLR height. Therefore, both methods presented results with a large count of small accessibility indices for less populated census block groups. The distribution of two sets of results, however, could be slightly different as 3SFCA seemed to cluster values within lower intervals, for example, 0.01 to 0.15.
Note that the studied area in Northwest Florida is naturally at a low level with one medium-size city and rural areas, indicating a diverse distribution of the population. Rural areas often have limited evacuation facilities and roadway access compared to urban areas, making it more difficult for residents in these remote areas to get to safety in a timely manner in the event of a hurricane. Additionally, the area’s susceptibility to these severe weather events, including hurricanes, exacerbates the need for hurricane shelters. Also, the frequency of hurricanes in the region is increasing as the ocean surface steadily rises due to global warming. This directly leads to the unpredictability of hurricane occurrences which would lead to uncertainty in the evacuation operations and accessibility of shelters. This makes it very difficult to make concrete discussions on the accuracy of the models. Ideally, the accuracy of the methods should be compared with “ground truth” data. Unfortunately, this data set is not available, so we provided a means of sensitivity analysis with multiple SLR levels and compared two methods in order to make sure of the applicability and appropriateness of the proposed methods. Much of the information reviewed was highly technical and procedural in nature, and continuously refining our approach is important for maintaining and augmenting its future utility.
Limitations of this research contain two aspects. Firstly, the SLR was individually Firstly, the SLR was individually added as the base water elevation for each storm surge simulation scenario; however, SLR would actually change the coastal boundary and submerge some of the coastal land in the long run. This could lead to a totally different evacuation demand as well as roadway infrastructure. Secondly, it is crucial to acknowledge that the accessibility index is just one of many measures of accessibility, and it may not always provide a comprehensive view of accessibility to emergency facilities. Although this paper focuses on driving time, the physical distance between two locations is frequently a crucial factor in accessibility measures. In addition, the mode of transportation used to travel between locations can significantly influence accessibility measures. For instance, accessibility for pedestrians should differ significantly compared to drivers. The quality and availability of transportation infrastructure, such as sidewalks for pedestrians and public transportation for low-mobility populations, is also critical to consider. Other socioeconomic factors such as income, education, and age can also influence accessibility, making it a multifaceted concept that requires a multidimensional approach. As a result, a holistic view of accessibility should be taken into account when designing and implementing policies and interventions aimed at enhancing real-world accessibility.
Based on the discussion, future works can potentially move towards (1) finding a dynamic SLR modeling method that account for the changing coastal land characteristics, (2) exploring alternative measures of accessibility such as distance, mode of transportation and roadway reliance, and (3) investigating the influence of socioeconomic factors on SA to emergency facilities. Also, future research can further expand the proposed work towards climate-related hurricane hazard modeling, resilience-based approaches, and related evacuation accessibility. Some other possible suggestions for future evacuation preparations can be improving roadways by widening roads, elevating roadways, and improving better traffic flow management. Providing public transportation options during evacuation using vehicles such as buses can also help increase the accessibility for people with lower income levels, people living in rural areas, and other vulnerable populations who do not have their own cars. Also, future work may consider an application of other advanced floating catchment area methods or spatial-related accessibility analysis methods.

Author Contributions

Conceptualization, J.Y.; Methodology, J.Y. and O.A.; Software, J.Y. and L.V.; Validation, O.A.; Investigation, M.M.; Data curation, M.M. and L.V.; Writing—original draft, J.Y.; Writing—review & editing, O.A., E.E.O. and W.H.; Supervision, E.E.O. and W.H. All authors have read and agreed to the published version of the manuscript.

Funding

This research was funded by National Science Foundation Award #1832068.

Institutional Review Board Statement

Not applicable.

Informed Consent Statement

Not applicable.

Data Availability Statement

Publicly available datasets were analyzed in this study. This data can be found here: https://www.fsutmsonline.net/index.php.

Conflicts of Interest

The authors declare no conflict of interest.

References

  1. Penchansky, R.; Thomas, J. The Concept of Access: Definition and Relationship to Consumer Satisfaction. Med. Care 1981, 19, 127–140. [Google Scholar] [CrossRef]
  2. Guagliardo, M.F. Spatial accessibility of primary care: Concepts, methods and challenges. Int. J. Health Geogr. 2004, 3, 3. [Google Scholar] [CrossRef] [PubMed] [Green Version]
  3. Luo, W.; Qi, Y. An enhanced two-step floating catchment area (E2SFCA) method for measuring spatial accessibility to primary care physicians. Health Place 2009, 15, 1100–1107. [Google Scholar] [CrossRef] [PubMed]
  4. Hart, L.G.; Larson, E.H.; Lishner, D.M. Rural Definitions for Health Policy and Research. Am. J. Public Health 2005, 95, 1149–1155. [Google Scholar] [CrossRef] [PubMed]
  5. 2022 Statewide Emergency Shelter Plan. Florida Division of Emergency Management. Available online: https://www.floridadisaster.org/dem/response/infrastructure/statewide-emergency-shelter-plan/2020-statewide-emergency-shelter-plan2/ (accessed on 25 March 2023).
  6. Hurricanes and Climate Change. Center for Climate and Energy Solutions. Available online: https://www.c2es.org/content/hurricanes-and-climate-change/ (accessed on 31 May 2023).
  7. Mann, M.E.; Emanuel, K.A. Atlantic hurricane trends linked to climate change. Eos 2006, 87, 233–241. [Google Scholar] [CrossRef] [Green Version]
  8. Houghton, J. The science of global warming. Interdiscip. Sci. Rev. 2001, 26, 247–257. [Google Scholar] [CrossRef]
  9. Mousavi, M.E.; Irish, J.L.; Frey, A.E.; Olivera, F.; Edge, B.L. Global warming and hurricanes: The potential impact of hurricane intensification and sea level rise on coastal flooding. Clim. Chang. 2010, 104, 575–597. [Google Scholar] [CrossRef]
  10. Bauer, J.; Groneberg, D.A. Measuring Spatial Accessibility of Health Care Providers—Introduction of a Variable Distance Decay Function within the Floating Catchment Area (FCA) Method. PLoS ONE 2016, 11, e0159148. [Google Scholar] [CrossRef] [Green Version]
  11. Ghorbanzadeh, M.; Kim, K.; Ozguven, E.E.; Horner, M.W. Spatial accessibility assessment of COVID-19 patients to healthcare facilities: A case study of Florida. Travel Behav. Soc. 2021, 24, 95–101. [Google Scholar] [CrossRef]
  12. Luo, W.; Wang, F. Measures of Spatial Accessibility to Health Care in a GIS Environment: Synthesis and a Case Study in the Chicago Region. Environ. Plan. B Plan. Des. 2003, 30, 865–884. [Google Scholar] [CrossRef] [Green Version]
  13. Ghorbanzadeh, M.; Ozguven, E.E.; Tenney, C.S.; Leonarczyk, Z.; Jones, F.R.; Mardis, M.A. Natural Disaster Accessibility of Small and Rural Libraries in Northwest Florida. Public Libr. Q. 2020, 40, 310–329. [Google Scholar] [CrossRef]
  14. Widener, M.J.; Farber, S.; Neutens, T.; Horner, M. Spatiotemporal accessibility to supermarkets using public transit: An interaction potential approach in Cincinnati, Ohio. J. Transp. Geogr. 2015, 42, 72–83. [Google Scholar] [CrossRef] [Green Version]
  15. Kocatepe, A.; Ozguven, E.E.; Horner, M.; Ozel, H. Pet- and special needs-friendly shelter planning in south Florida: A spatial capacitated p-median-based approach. Int. J. Disaster Risk Reduct. 2018, 31, 1207–1222. [Google Scholar] [CrossRef]
  16. Yang, J.; Vijayan, L.; Ghorbanzadeh, M.; Alisan, O.; Ozguven, E.E.; Huang, W.; Burns, S. Integrating storm surge modeling and accessibility analysis for planning of special-needs hurricane shelters in Panama City, Florida. Transp. Plan. Technol. 2023, 46, 241–261. [Google Scholar] [CrossRef]
  17. Pinzan, D.; Kocatepe, A.; Gilanifar, M.; Ulak, M.; Ozguven, E.; Arghandeh, R. Data-Driven and Hurricane-Focused Metrics for Combined Transportation and Power Networks Resilience. In Proceedings of the Transportation Research Board’s 97th Annual Meeting, Washington, DC, USA, 7–11 January 2018. [Google Scholar]
  18. Bevin, J.L., II; Berg, R.; Hagen, A. National Hurricane Center Tropical Cyclone Report: Hurricane Michael; National Hurricane Center: Miami, FL, USA, 2019; pp. 1–86. Available online: https://www.nhc.noaa.gov/data/tcr/AL142018_Michael.pdf (accessed on 28 April 2022).
  19. US Department of Commerce. “Hurricane Michael 2018”, National Weather Service. Available online: https://www.weather.gov/tae/HurricaneMichael2018 (accessed on 25 March 2023).
  20. Yang, J.; Vijayan, L.; Ghorbanzadeh, M.; Alisan, O.; Huang, W.; Ozguven, E.E.; Burns, S. Effects of the Uncertainty of Hurricane Tracks on Coastal Hazards and Evacuations. IJSCER 2022, 11, 99–107. [Google Scholar] [CrossRef]
  21. Ghorbanzadeh, M.; Vijayan, L.; Yang, J.; Ozguven, E.E.; Huang, W.; Ma, M. Integrating Evacuation and Storm Surge Modeling Considering Potential Hurricane Tracks: The Case of Hurricane Irma in Southeast Florida. ISPRS Int. J. Geo-Inf. 2021, 10, 661. [Google Scholar] [CrossRef]
  22. Luo, W. Using a GIS-based floating catchment method to assess areas with shortage of physicians. Health Place 2003, 10, 1–11. [Google Scholar] [CrossRef]
  23. Jörg, R.; Haldimann, L. MHV3SFCA: A new measure to capture the spatial accessibility of health care systems. Health Place 2023, 79, 102974. [Google Scholar] [CrossRef]
  24. Tali, J.A.; Nazir, M.; Shafiq, M.U. Enhanced Two-Step Floating Catchment Area (E2SFCA) Method for Measuring Spatial Accessibility to Primary Healthcare in HD Kote, Mysore (India). In Towards Sustainable Natural Resources; Springer: Berlin/Heidelberg, Germany, 2022; pp. 255–273. [Google Scholar] [CrossRef]
  25. Tao, Z.; Cheng, Y.; Liu, J. Hierarchical two-step floating catchment area (2SFCA) method: Measuring the spatial accessibility to hierarchical healthcare facilities in Shenzhen, China. Int. J. Equity Health 2020, 19, 164. [Google Scholar] [CrossRef]
  26. Langford, M.; Higgs, G.; Fry, R. Multi-modal two-step floating catchment area analysis of primary health care accessibility. Health Place 2016, 38, 70–81. [Google Scholar] [CrossRef]
  27. Tao, Z.; Yao, Z.; Kong, H.; Duan, F.; Li, G. Spatial accessibility to healthcare services in Shenzhen, China: Improving the multi-modal two-step floating catchment area method by estimating travel time via online map APIs. BMC Health Serv. Res. 2018, 18, 345. [Google Scholar] [CrossRef] [Green Version]
  28. Wan, N.; Zou, B.; Sternberg, T. A three-step floating catchment area method for analyzing spatial access to health services. Int. J. Geogr. Inf. Sci. 2012, 26, 1073–1089. [Google Scholar] [CrossRef]
  29. Shatnawi, N.; Al-Omari, A.; Al-Mashaqbeh, A. Comparative study of using E2SFCA and 3SFCA methods for selected healthcare resources in Jordan during COVID-19 pandemic. Int. J. Health. Manag. 2022, 15, 347–356. [Google Scholar] [CrossRef]
  30. Paez, A.; Higgins, C.D.; Vivona, S.F. Demand and level of service inflation in Floating Catchment Area (FCA) methods. PLoS ONE 2019, 14, e0218773. [Google Scholar] [CrossRef]
  31. Census Qualifying Urban Areas and Final Criteria Clarifications, Federal Register. 2022. Available online: https://www.federalregister.gov/documents/2022/12/29/2022-28286/2020-census-qualifying-urban-areas-and-final-criteria-clarifications (accessed on 25 March 2023).
  32. U.C. Bureau, “2020 Census Urban Areas Wall Map”, Census.gov. Available online: https://www.census.gov/geographies/reference-maps/2020/geo/2020-census-urban-areas.html (accessed on 25 March 2023).
  33. NOAA, “Hurricane MICHAEL Advisory Archive,” National Hurricane Center and Central Pacific Hurricane Center. Available online: https://www.nhc.noaa.gov/archive/2018/MICHAEL.shtml? (accessed on 26 March 2023).
  34. Blain, C.; Westerink, J.; Richard, J.L.; Scheffner, N. ADCIRC: An Advanced Three-Dimensional Circulation Model for Shelves, Coasts, and Estuaries. Report 4. Hurricane Storm Surge Modeling Using Large Domains; Engineer Research and Development Center (U.S.): Vicksburg, MS, USA, 1994; p. 68. [Google Scholar]
  35. SWAN|Coastal & Computational Hydraulics Team. Available online: https://ccht.ccee.ncsu.edu/category/models/swan/ (accessed on 26 March 2023).
  36. Vijayan, L.; Huang, W.; Ma, M.; Ozguven, E.; Ghorbanzadeh, M.; Yang, J.; Yang, Z. Improving the accuracy of hurricane wave modeling in Gulf of Mexico with dynamically-coupled SWAN and ADCIRC. Ocean Eng. 2023, 274, 114044. [Google Scholar] [CrossRef]
  37. US Census Bureau, “2020 Census,” Census.gov. Available online: https://www.census.gov/programs-surveys/decennial-census/about/rdo/summary-files/2020.html (accessed on 26 March 2023).
  38. FDOT. FSUTMSOnline: Model Download: Loaded Networks. Available online: https://www.fsutmsonline.net/index.php/model_pages/model_pages/loaded_networks (accessed on 26 March 2023).
  39. Download NBI ASCII Files—National Bridge Inventory—Bridge Inspection—Safety Inspection—Bridges & Structures—Fed-eral Highway Administration. Available online: https://www.fhwa.dot.gov/bridge/nbi/ascii.cfm (accessed on 26 March 2023).
  40. McGrail, M.R.; Humphreys, J.S. Spatial access disparities to primary health care in rural and remote Australia. Geospat. Health 2015, 10, 358. [Google Scholar] [CrossRef] [Green Version]
  41. Massey, F.J., Jr. The Kolmogorov-Smirnov Test for Goodness of Fit. J. Am. Stat. Assoc. 1951, 46, 68–78. [Google Scholar] [CrossRef]
  42. Whitnall, C.; Oswald, E.; Mather, L. An Exploration of the Kolmogorov-Smirnov Test as a Competitor to Mutual Information Analysis. In Smart Card Research and Advanced Applications; Lecture Notes in Computer Science; Prouff, E., Ed.; Springer: Berlin/Heidelberg, Germany, 2011; pp. 234–251. [Google Scholar] [CrossRef] [Green Version]
  43. Olea, R.A.; Pawlowsky-Glahn, V. Kolmogorov–Smirnov test for spatially correlated data. Stoch. Environ. Res. Risk Assess. 2008, 23, 749–757. [Google Scholar] [CrossRef]
  44. Scheff, S.W. Chapter 8—Nonparametric Statistics. In Fundamental Statistical Principles for the Neurobiologist; Academic Press: Cambridge, MA, USA, 2016; pp. 157–182. [Google Scholar] [CrossRef] [Green Version]
  45. Riffenburgh, R.H. Chapter 16—Tests on Ranked Data. In Statistics in Medicine, 2nd ed; Academic Press: Burlington, NJ, USA, 2006; pp. 281–303. [Google Scholar] [CrossRef]
  46. Vierra, A.; Razzaq, A.; Andreadis, A. Chapter 27—Continuous variable analyses: T-test, Mann–Whitney U, Wilcoxon sign rank, Translational Surgery. In Handbook for Designing and Conducting Clinical and Translational Research; Eltorai, A.E.M., Bakal, J.A., Newell, P.C., Osband, A.J., Eds.; Academic Press: Cambridge, MA, USA, 2023; pp. 165–170. [Google Scholar] [CrossRef]
  47. Dwivedi, A.K.; Mallawaarachchi, I.; Alvarado, L.A. Analysis of small sample size studies using nonparametric bootstrap test with pooled resampling method. Stat. Med. 2017, 36, 2187–2205. [Google Scholar] [CrossRef]
  48. Sava, G.N.; Duong, M.Q.; Leva, S.; Mussetta, M.; Costinas, S.; Golovanov, N. Coordination control of active crowbar for doubly fed induction generators. In Proceedings of the 2014 International Symposium on Fundamentals of Electrical Engineering (ISFEE), Bucharest, Romania, 28–29 November 2014; pp. 1–5. [Google Scholar] [CrossRef]
Figure 1. Study area: (a) Census block groups and shelter locations, and (b) Loaded network.
Sustainability 15 10263 g001aSustainability 15 10263 g001b
Figure 2. Inundation to Coastal Areas with SLR Consideration.
Sustainability 15 10263 g002
Figure 3. Accessibility Index of E2SFCA: (a) Base Scenario, (b) SLR = 0 m, (c) SLR = 0.5 m, (d) SLR = 1 m, and (e) SLR = 1.5 m.
Sustainability 15 10263 g003aSustainability 15 10263 g003bSustainability 15 10263 g003c
Figure 4. Accessibility Index of 3SFCA: (a) Base Scenario, (b) SLR = 0 m, (c) SLR = 0.5 m, (d) SLR = 1 m, and (e) SLR = 1.5 m.
Sustainability 15 10263 g004aSustainability 15 10263 g004bSustainability 15 10263 g004c
Figure 5. Cumulative distribution of each scenario.
Sustainability 15 10263 g005
Table 1. SLR Impact on Storm Surge Elevation, Inundated Block Group and Roadway Section Counts.
SLR (Meters)Maximum Water Elevation (Meters)Minimum Water Elevation (Meters)Inundated Census Block Group CountInundated Roadway Section Count
05.51751109
0.58.01881175
18.81.1951865
1.59.11.31032545
Table 2. Wilcoxon Signed Rank Test for E2SFCA and 3SFCA Accessibility Index Results.
SLR (Meters)Block Groups (Total)Block Groups (Nonzero AI)z-ValueSigned Rankp-Value
01621302.23952210.025(.)
0.51621302.35251170.019(.)
11621062.38435920.017(.)
1.5162912.11826830.034(.)
Base Scenario1621621.63075760.103(·)
Significance codes: 0.05 “.” 0.1 “·“ 1.
Disclaimer/Publisher’s Note: The statements, opinions and data contained in all publications are solely those of the individual author(s) and contributor(s) and not of MDPI and/or the editor(s). MDPI and/or the editor(s) disclaim responsibility for any injury to people or property resulting from any ideas, methods, instructions or products referred to in the content.

