
Sustainability of Cultural Heritage-Related Projects: Use of Socio-Economic Indicators in Latvia

1
Institute of the Civil Engineering and Real Estate Economics, Riga Technical University, 6 Kalnciema Street, LV-1048 Riga, Latvia
2
Faculty of Law, Maastricht University, Minderbroedersberg 4-6, 6211 LK Maastricht, The Netherlands
*
Author to whom correspondence should be addressed.
Sustainability 2023, 15(13), 10109; https://doi.org/10.3390/su151310109
Submission received: 15 May 2023
/
Revised: 15 June 2023
/
Accepted: 18 June 2023
/
Published: 26 June 2023
Abstract
:The main objective of the current study was to contribute to the creation of a practically usable set of heritage development project performance indicators and check their usage possibilities in the Latvian context. For this purpose, the authors have studied scientific literature, regulatory acts, international methodologies, as well as 22 EU co-financed projects related to the cultural heritage objects’ development. The developed list of indicators was tested through a sociological survey in all Latvian municipalities, other institutions and organizations. The study results showed that the use of indicators can increase public awareness and support for planned and implemented projects. The possibility of obtaining relevant measurement data (not applicability of the indicators alone) plays a very important role in the use of indicators. In addition, municipalities better accept indicators that are directly related to project results, do not require resource-intensive financial and economic analysis and are not related to long-term socio-economic impact. The study revealed that greater attention on the national scale (both by project implementers and supervisory institutions), should be paid to the acquisition and processing of the necessary data at the municipal level, paying special attention to the impact of implemented projects on well-being of population, environment, economy, finances, social inclusion, local production, education, science, real estate and infrastructure.
1. Introduction
Indicators are the variables that produce comprehensive information about the systems shaping sustainable development [1] (pp. 6–7). For more than 40 years, sustainability indicators have been used across a variety of sectors to measure the performance and progress of environmental, social, economic, urban and regional planning (see, e.g., [2,3,4,5,6]).
Cultural heritage is increasingly defined as an economic development tool [7,8,9] and resource for sustainable development [10,11]. For instance, culture is seen as a resource contributing to each of the goals of the 2030 Agenda for Sustainable Development [12] (In 2015, the United Nations’ General Assembly unanimously adopted the 2030 Agenda, comprising 17 Sustainable Development Goals (SDGs) and 169 targets grouped around three objectives: the economic, social and environmental. While the Agenda explicitly refers to protection of the world’s cultural and natural heritage only once (SDG 11.4), culture is seen as a resource contributing to each of the goals transversally. To see the many ways in which heritage can address the SDGs, please see ICOMOS Heritage and the Sustainable Development Goals: Policy Guidance for Heritage and Development Actors [13]). The United Nations New Urban Agenda ([14] the twenty-year roadmap to guide sustainable urban development adopted in 2016) confirms and strengthens the role of cultural heritage in transforming cities toward achieving sustainability. Both documents are not binding, but their unanimous approval [15,16] is a strong signal of the readiness of the Member States to contribute to achievement of the set goals.
With the reference to, inter alia, the 2030 Agenda, the EU has repeatedly affirmed cultural heritage in all its diversity and forms as a value in its own right and a strategic resource for the sustainable future of Europe (see, e.g., [17,18]). There have been many similar initiatives of regional and global level confirming the crucial role of protection and enjoyment of cultural heritage in effective global governance. Hence, cultural belonging, cultural rights, cultural voice, and cultural inclusion–for both individuals and groups–now constitute claims which can be incorporated into demands for the realization of economic, political and social rights [19]. The mentioned documents also stress the need of implementation of these “claims” by way of adequate financial, planning and evaluation mechanisms.
The 2030 Agenda states that the measurement of progress in implementation of the “claims” requires “quality, accessible, timely and reliable disaggregated data” (Par.48) which should be obtained through the developed list of indicators (Par.48, 75). These indicators can help in producing empirical evidence about cultural heritage objects’ multidimensional benefits [20,21,22,23] and express how these benefits may be consistent with sustainable development goals [24]. Thus, it is acknowledged that a comprehensive evaluation of the contribution of cultural heritage requires a holistic approach. However, to date no universal list of indicators has been developed to measure this contribution, and research studies focusing on such indicators are insufficient (See, e.g., CHCfE project [25], which has singled out four domains (economic, social, cultural and environmental) that together form a holistic approach in assessing the value of cultural heritage as a strategic resource for a sustainable Europe. According to the project, only 6% of all identified studies were conceived as holistic studies covering all four domains) [26,27,28], even though the need for them is undeniable and acute.
As pointed out by UNESCO, “making decisions without reliable indicators is like driving without road signs” [22]. However, while driving towards sustainability requires adequate indicators across all dimensions, there should be a strong understanding about the selection and correct use of the applicable measures.
For instance, the only indicator developed in support of the SDG 11.4 of the 2030 Agenda is “total per capita expenditure on the preservation, protection and conservation of all cultural and natural heritage, by source of funding (public, private), type of heritage (cultural, natural) and level of government (national, regional, and local/municipal)” [29]. F. Nocca in her research describes why this indicator alone is not effective in achieving its main goal (11.4 of the SDGs; [27]). On the other hand, in research that analysed the indicators of sustainable tourism, which is frequently invoked to assess sustainability of cultural heritage, Tanguay, Rajaonson and Thereen [30], identified 768 indicators—a number which obviously is unreasonable (if not impossible) to implement.
The aim of the current research was to evaluate the utility of socio-economic indicators in understanding and explaining the rationale of cultural heritage development projects (projects contributing to unlocking of socio-economic potential of immovable cultural heritage objects; cultural heritage potential means a potential to generate sustainable socio-economic development based on cultural resources which extracts, exposes, and appreciates cultural heritage components, emphasising their cultural (and social) value and economic significance ([31], p. 2) using a Latvian example. Until now, despite a sufficiently large number of cultural heritage object development projects in Latvia (altogether from 2017, there were 22 approved EU co-funded Latvian projects’ applications in the field of preservation, protection and development of important cultural and natural heritage and development of the related services (19 municipal and three state-led projects for the total amount of M120+ euro) [32]), a list of indicators that would reflect the achieved progress in social, economic, cultural, environmental, well-being and other areas has not been developed. Thus, it is difficult to explain the need and usefulness of projects to local residents in order to gain their support for project implementation, to attribute the return on investment from projects to their implementers, and to help the supervising institutions to evaluate both project applications and the results achieved by the implemented project.
The research question for the authors, therefore, was whether there is a need for changes in existing approaches to and use of socio-economic indicators for reasonable substantiation and measuring of the impact of cultural heritage development projects in Latvia. The current study was intended to fill the research gap and contribute to formulation of a comprehensive set of heritage development project performance indicators, to check the applicability and data acquisition possibilities for evaluation of these indicators in the Latvian context.
In the course of the analytical work, the authors have proposed a hypothesis that the effective implementation of the indicator system is hindered by (a) the lack of necessary measurement data, and (b) insufficient awareness/understanding of the broader socio-economic impact (and impact in other areas) of cultural heritage object development projects by the involved parties (project implementers, local residents and project supervisors). Thus, the focus is shifted towards the indicators that are mostly directly linked to project results and that do not characterize long-term development.
A tangible benefit of project planners, implementers and supervisors from the study of indicators is related to the possibility of immediate application of the corresponding indicators in practical work throughout all project stages–from initial planning to assessing the results. A set of indicators developed within the research constitutes an essential element for the further development of the methodology of immovable cultural heritage management and socio-economic development. Additionally, it may serve to improve the quality, competitiveness and sustainability of cultural heritage development projects.
The methodological part of the article is dedicated to the process of formulation of the comprehensive set of socio-economic indicators related to cultural heritage development projects. This part also reflects construction of the survey according to which the offered indicators have been evaluated by the project implementers (municipalities) and other professional heritage-related stakeholders throughout Latvia. The middle part describes the obtained results. The final part contains concluding remarks and recommendations.
2. Methodology, Target Audience and Construction of the Survey
In order to make a holistic, yet workable list of applicable indicators, the authors have extensively analysed the available scientific literature on:
Compiling results of the above analysis and internationally developed methodologies [29,48], the authors then identified the holistic list of indicators provisionally applicable to the Latvian situation. The identified list was then put against the indicators used in Latvia in the field of cultural heritage project development, i.e., when submitting a project application in order to qualify for co-financing by EU financial instruments, these indicators (if they apply to the project) must be carried out. These few monitoring indicators are defined in regulatory acts and guidelines. For instance, regulations related to implementation of heritage protection and development projects (Point 9, [49] (Regulation No. 635 provides for one additional indicator: “energy consumption figure (megawatt hours) (if applicable)”), Point 8, Regulation No. 130 [50], Point 9, Regulation No.322 [51], for the applicant to be eligible for co-financing under EU structural funds) provide for the following indicators to be reached:
- the expected increase in the number of visits to the supported cultural heritage objects and tourist facilities,
- the number of supported natural and cultural heritage objects,
- the number of newly created services in the supported objects of cultural heritage,
- result indicator–the number of nights spent in tourist accommodation in the territory of Latvia during the year.
The regulations-related guidelines provide for a couple of more precise indicators, e.g., improved or constructed infrastructure that promotes safeguarding and development of cultural objects, improved attainability of the cultural objects [52], benefits from increased tourism flow and from tax revenues for newly created jobs [53].
To check the practical applicability and viability of these measurements, the list of identified indicators was then put against approved EU co-funded projects’ Latvian applications [32]. The approved project applications predominantly appeal to only 5 indicators:
- number of renovated/supported (cultural and natural) objects,
- number of newly created objects,
- number of newly introduced services,
- increase in object visits,
- arrangement/installation/improvement of infrastructure.
The other indicators mentioned much less frequently are:
- number of new jobs,
- new opportunities for tourism development,
- local belonging/local patriotism,
- rehabilitated degraded areas,
- benefits for society,
- archaeological research.
As a result of thorough research of the mentioned sources, the authors assumed that respective measurements (a) only partially relate to sustainable development, (b) are largely oriented towards benefits for visitors rather than for the local community and other stakeholders (e.g., [54,55]), and (c) do not reflect a whole spectre of socio-economic benefits, as they do not touch several areas positively affected by the development of heritage objects, for example, the development of cultural activities, local production, increase in welfare, etc. Comprehensive analysis of all the above scientific literature, internationally developed methodologies, national legal acts and confirmed project applications led to the development of the list of indicators to assess the multidimensional benefits produced by conservation/regeneration of cultural heritage objects. These indicators were subdivided into ten impact categories (certain major categories were subdivided into sub-categories) that composed the comprehensive matrix for impact assessment–altogether 96 individual indicators. The authors performed pilot testing of this initially created, pre-final list and respective division of indicators into categories in one of the municipalities. As a result, the following division was created (Table 1).
2.1. Target Audience
The list of indicators was handed over for evaluation to all Latvian municipalities (N = 43, n = 20 (13 municipal governments and 7 State cities (By administrative division, Latvia is divided into territories of local governments of State cities, hereinafter ‘State cities’, and territories of municipal governments, hereinafter ‘municipal governments’ (Part 1, Sec. 4, [56]). There are 10 State cities altogether, covering around 1% of the territory of Latvia [57] and comprising the total population at the beginning of 2022 of M1,05+ [58]. This is 56% of the total Latvian population (total population of Latvia at the beginning of 2022 was M1,87+ [59]). State cities are considered to be development centres of national significance. As per the previous Law on Administrative Territories and Populated Areas (no more in force), Republican cities (in the current law replaced with State cities) were cities with developed commercial activities, transport and community facilities, social infrastructure and a significant complex of cultural institutions, having at least 25,000 permanent residents (the cities with more residents could receive status of a Republican city even without conforming to the above requirements) (Sec. 6, [60,61]. The remaining 44% of the Latvian population live in the sparsely populated rural areas and towns, covering around 99% of the territory, which are divided into 33 administrative units (municipal governments)); 46.5% from the municipalities replied, covering territories with about 67% of the total Latvian population). Responding municipal governments represent a total population of K369+ residents or 45% of all their residents (or almost 20% of the total population of Latvia). Responding State cities represent a total population of K880+ or 84% of all the residents of State cities (or about 47% of the total population of Latvia) (altogether regarding municipalities, hereinafter ‘respondents’).
For supplementing the results, the list of indicators was as well handed over for evaluation to Local Action Groups (3 replied) (Local Action Group (LAG) is an association for the implementation of the local development strategies and LEADER approach, giving local residents, businesses and municipalities the opportunity to determine the development of their territory [62,63]. The received answers represented Local Action Groups from three (out of four) Latvian regions), certain state authorities engaged in development of heritage and tourism (2 replied) (e.g., (1) the Tourism Department of the Latvian Investment and Development Agency (LIAA), whose goal is to develop Latvian tourism products and services and increase their competitiveness, as well as to make Latvia internationally recognized as an attractive tourist destination [64] and (2) the Rural Support Service that is the state’s direct administrative institution, which is, inter alia, responsible for the unified implementation of the state and European Union support policy in Latvia, agricultural and rural support policy [65], as well as LEADER program which is thought to promote the economic growth of the coastal area (including renovation of cultural heritage objects within the co-financed projects)) and associations (1 replied) (e.g., The professional association “Association of Latvian Castles and Manors” that aims to promote the preservation of Latvian cultural heritage, its research, restoration, maintenance, adaptation for use and development; promotes the development of tourism, culture and creative industries and related infrastructure and services in castles and estates; expands the accessibility of castles and manors to the public; develops public awareness of cultural heritage and promotes public participation in the protection of cultural heritage [66]). The survey was primarily focused on municipalities, since municipalities are (a) among the major owners of immovable cultural monuments in the country [67], (b) most actively implementing cultural heritage object development projects (for instance, out of 22 EU co-funded projects based on SAM 5.5.1., 19 were initiated and driven by the municipalities), (c) ensuring tourism development (tourism information providers in municipalities are basically a municipal structural unit (its department or an individual employee) or a municipal institution (or a structural unit of an institution), less often a municipal agency or its structural unit, also as an individual specialist or a specialist with partial responsibility for tourism development ([68], p. 74)), (d) deriving financial or other benefits from the use of cultural heritage objects, which, in turn, are used for the benefit of the local population. Each municipality (other institution and organization) was asked to fill out only one questionnaire from the institution (in certain cases up to 5 structural units of the respondent participated in filling out the questionnaire).
2.2. Construction of the Survey
The questionnaire given to the respondents for evaluation consisted of the following data:
- pre-given data sets: Category/subcategory (unifying category of indicators), Indicator (particular indicators under every category/subcategory), Suggested measurement (EUR, number, percentage or other measurement units);
- data sets to be filled in: Applicability (level of applicability of every indicator on a scale from “0” (not suitable) to “3” (well-suited)), Data Accessibility (ability to obtain data for measurement on a scale from “0” (impossible to obtain measurement data) to “3” (easy to obtain measurement data)) and Other possible measurement data acquisition sources/comments.
Respondents were asked to evaluate the indicators “Applicability” and “Data accessibility” (hereinafter ‘the dimensions’). It should be noted that for some indicators it may be relatively easy to obtain measurement data, for example “the number of local traditional food and drink companies/producers”, but it may suit less well certain respondents (for example, Riga State city, since it is generally less characteristic of them to follow, promote or specially support local food and drinks producers). It also happens that the indicator is well suited, but it is difficult to obtain measurement data, for example “municipal budget revenues from the tourism sector” (respondents have also mentioned, inter alia, difficulties in obtaining data for the indicator “visits to the site/designated area”, where site visits can be measured by the number of sold entrance tickets, while visits to the designated area (e.g., the town, etc.) is much harder to measure. The other comments concern the size of the municipality. Considering that 32% of the total population of Latvia lives in the capital city of Riga, which is the highest rate in the countries of the EU [69], the answers showed that some indicators are applicable to Riga/Riga metropolitan area (e.g., construction of new residential areas, because far from Riga (100+ km) it is hard to get grants for housing stock construction, while in Riga it is comparatively easy). On the other hand, some indicators are not directly applicable to Riga (e.g., the number of companies involved in tourism (both with and without tourism NACE codes, e.g., family-operated farms, home manufacturers, etc., involved in tourism, which have offers for tourists or parking lots)).
Respondents could have supplemented “Measurement data acquisition sources”, making notes on the already filled-in “Measurement” field, commenting on each indicator, mentioning other indicators that, in their opinion, should be used in development projects of cultural heritage objects.
The survey assumed that:
- all indicators describe the situation in the specified time period and on a particular territory (in this case, the territory was considered a municipality or a settlement if the indicators could be attributed to the specific settlement within the municipality for some reason);
- indicators are not always directly related to the development of cultural heritage objects, as their changes may be influenced by other factors;
- the indicators describe a development useful to society, without taking into account possible risks (e.g., with a significant increase in the number of tourists, environmental pollution increases, etc.);
- indicators of different categories are interconnected and can characterize several areas of socio-economic development (e.g., the indicators belonging to one category do not always refer to only one socio-economic area and the indicators belonging to another category may also apply to this area).
According to the Respondent comments, municipalities see the practical benefit of the application of indicators at different project realisation stages, including in convincing local residents and supervising authorities about the necessity of the projects’ development and implementation, in proving the usefulness of the implemented project, as well as in the drafting and implementation of public policy.
3. Results of the Survey
3.1. Informing the Local Residents and the Usefulness of Indicators
Before evaluating the indicators, the respondents were asked to answer questions about:
- informing local residents about the intention, initiation or implementation of development projects,
- the impact of local residents’ opinions on the possibilities of implementing a tangible cultural heritage development project,
- whether the use of socio-economic indicators can make the process of informing the local residents about the socio-economic utility of the project more effective.
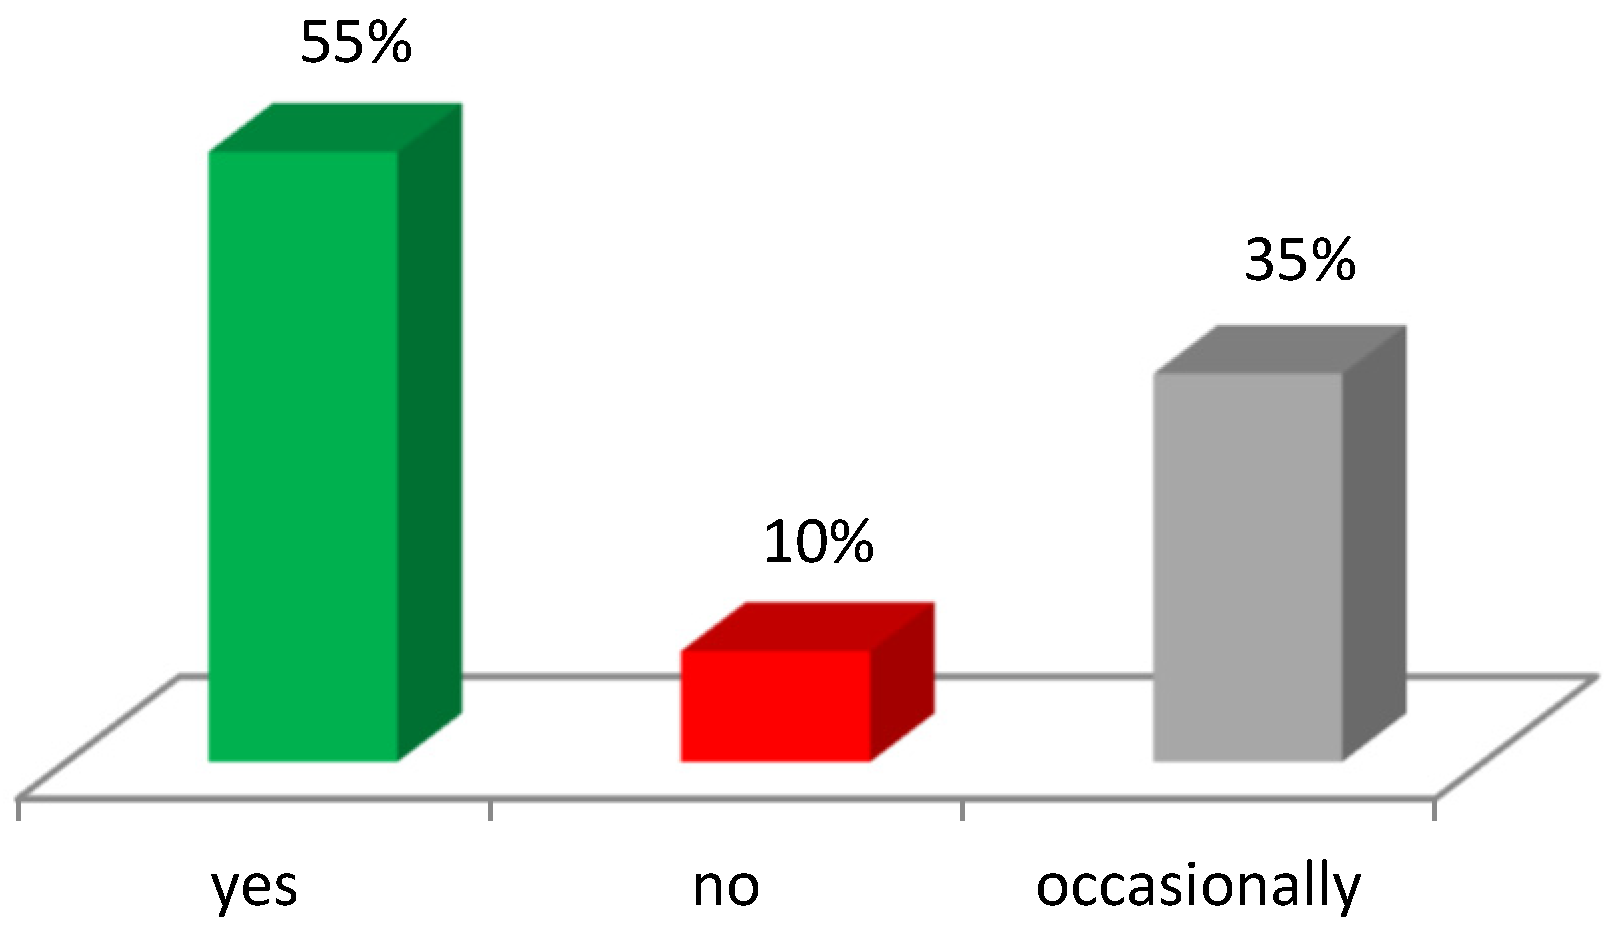
Are the local residents informed about the socio-economic usefulness of the project at the planning, starting or implementing stages? (n = 20). Please see Figure 1.
Although 55% of municipalities inform local residents about the socio-economic usefulness of a planned or implemented project, 35% do so irregularly, and 10% usually do not inform local residents. In general, municipal governments inform citizens more regularly than the State cities.
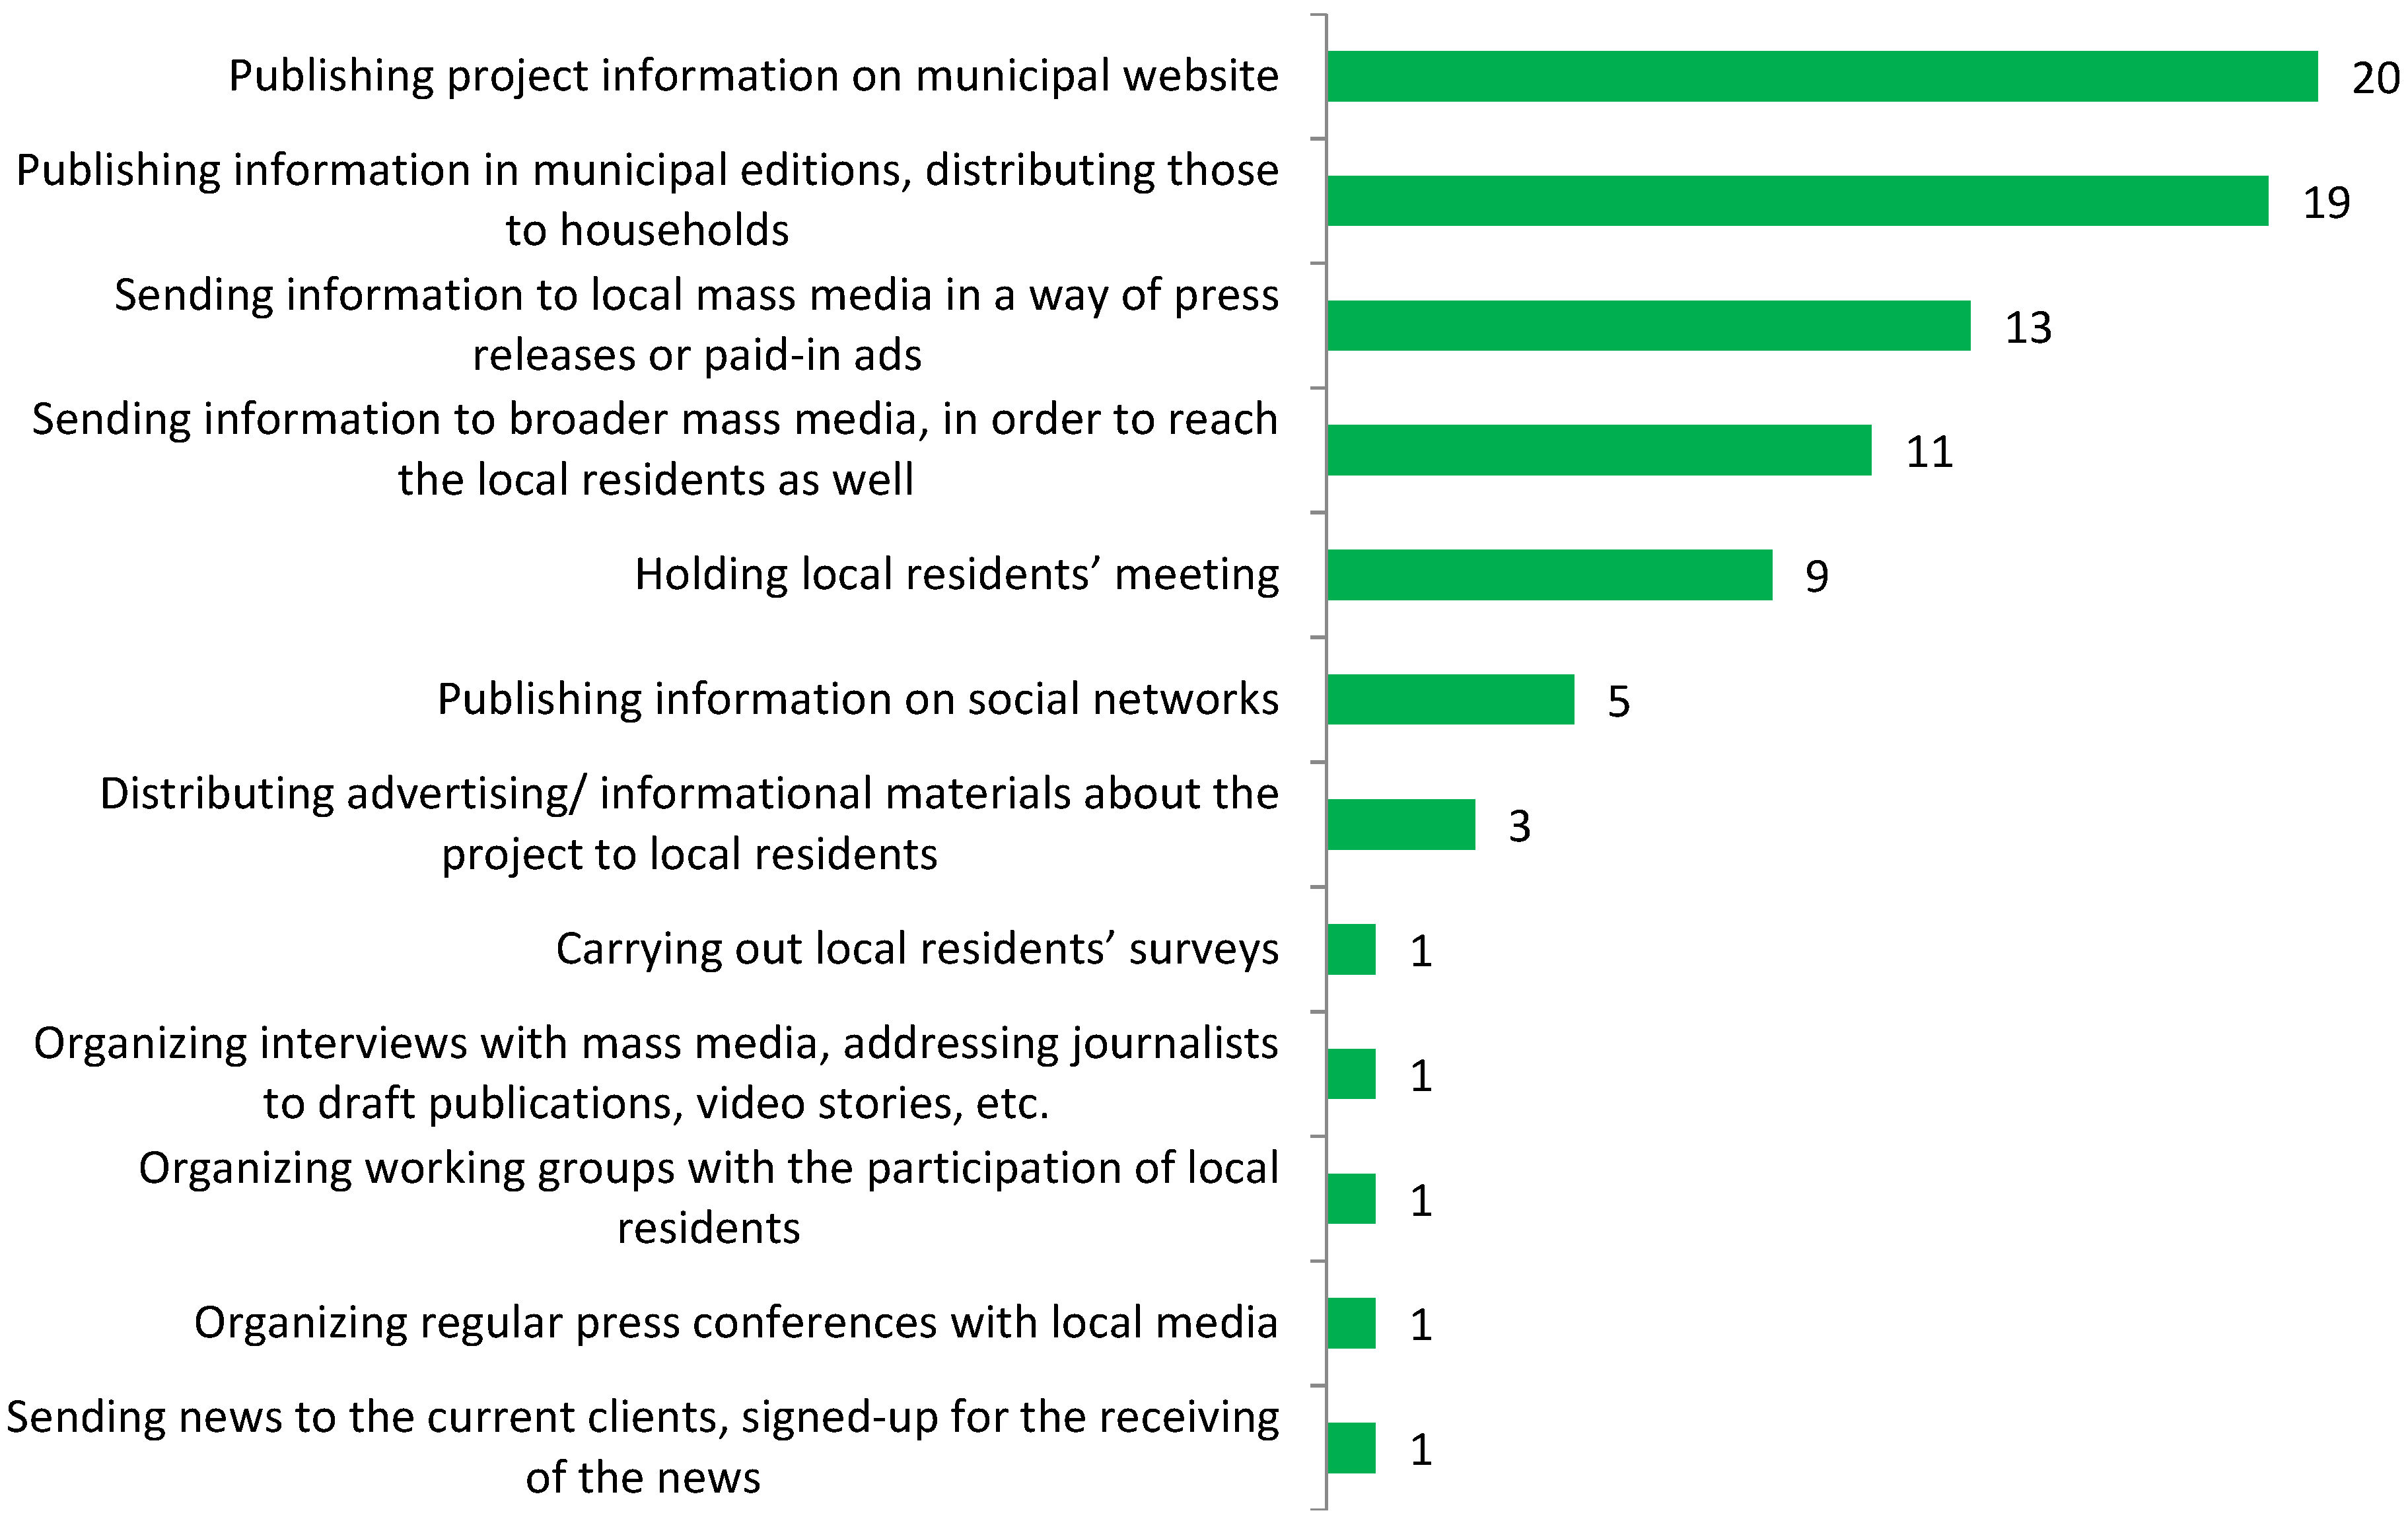
How are the local residents being informed number of responses, multi-response? (n = 20). Please see Figure 2.
Residents are usually informed through the municipal website and mass media, or through the resident meetings. Other forms of outreach and engagement are less common, perhaps because they are more resource-intensive or dependent on citizen activity. It should be noted that municipalities also combine different ways of providing information.
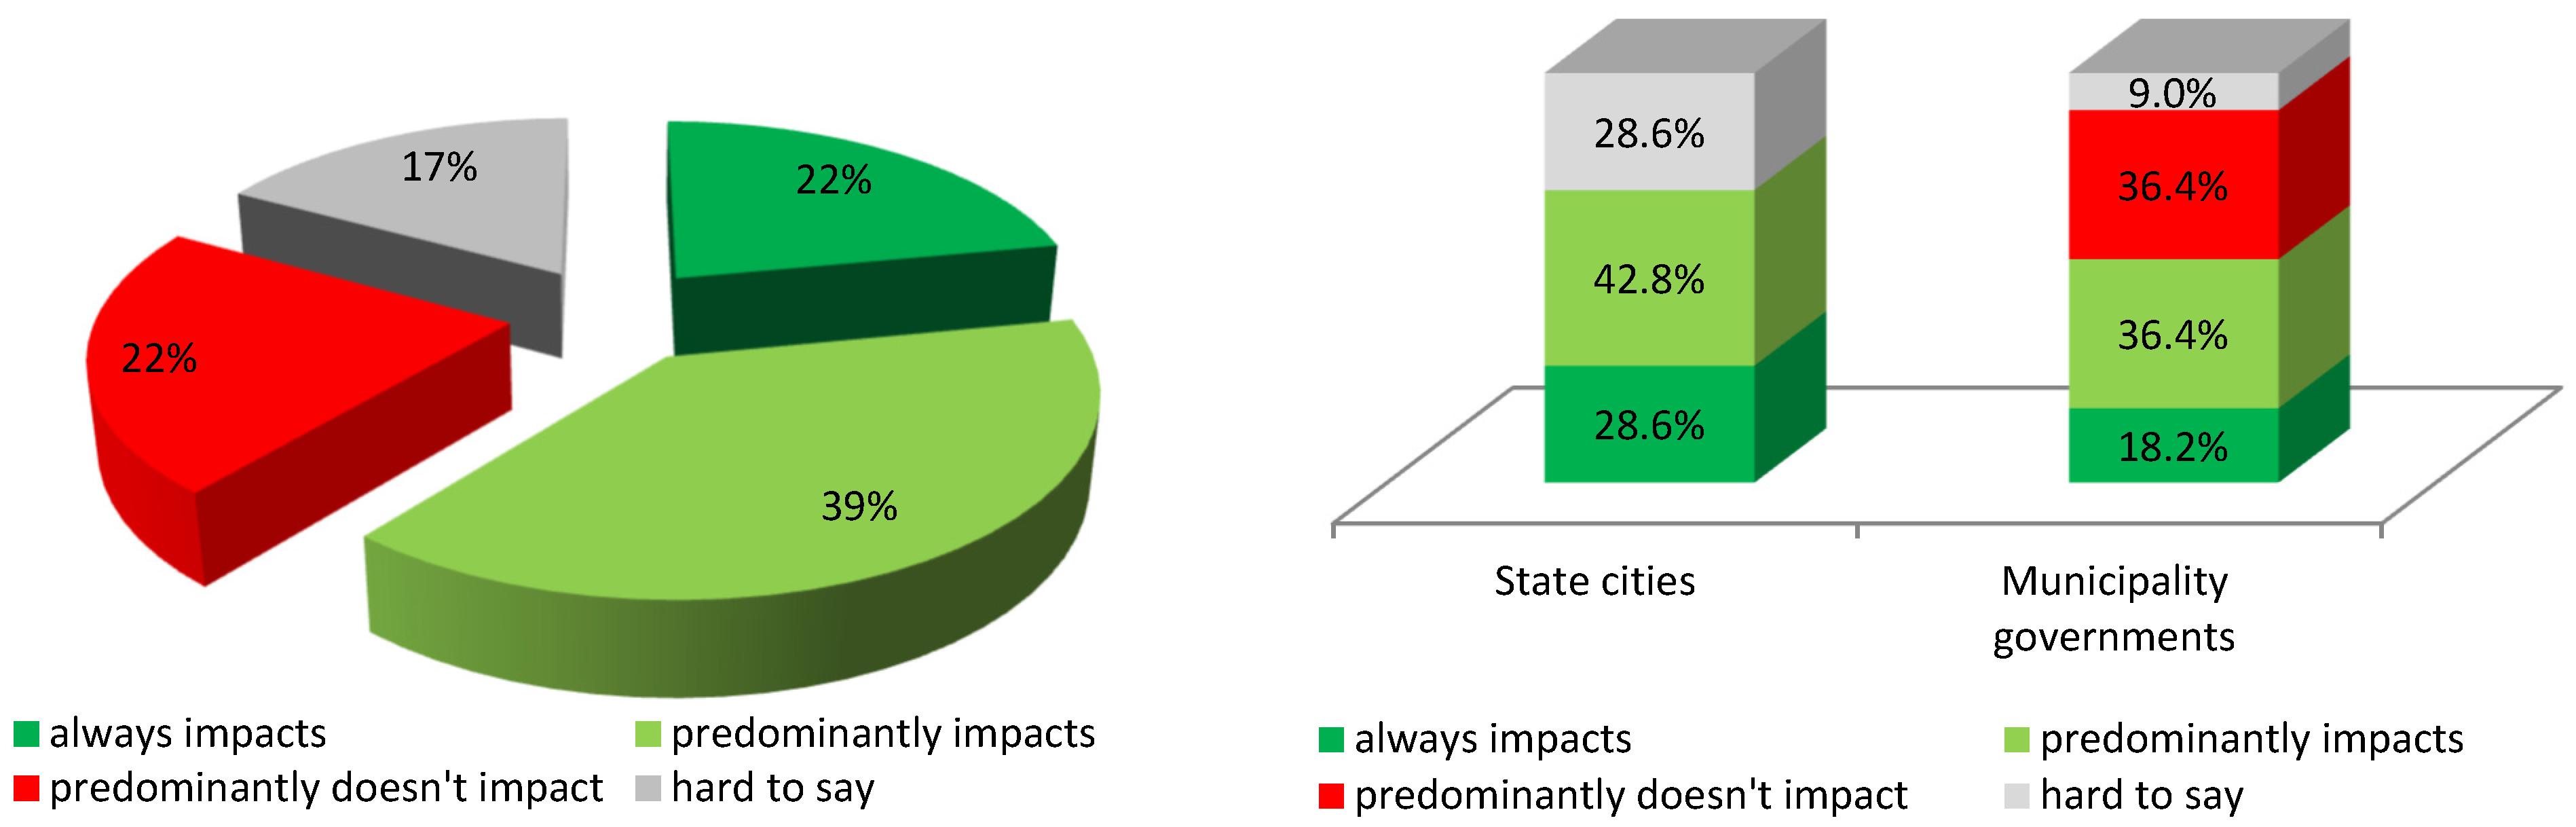
Does the residents’ opinion affect the implementation of the project? (n = 18). Please see Figure 3.
Although the residents’ opinion on the implementation of the projects is largely important for municipalities (in total, 61%), it is generally more important for State cities than for municipal governments. Therefore, even though State cities are less likely to inform their citizens in a targeted way, they are still more sensitive to their opinion if it is expressed.
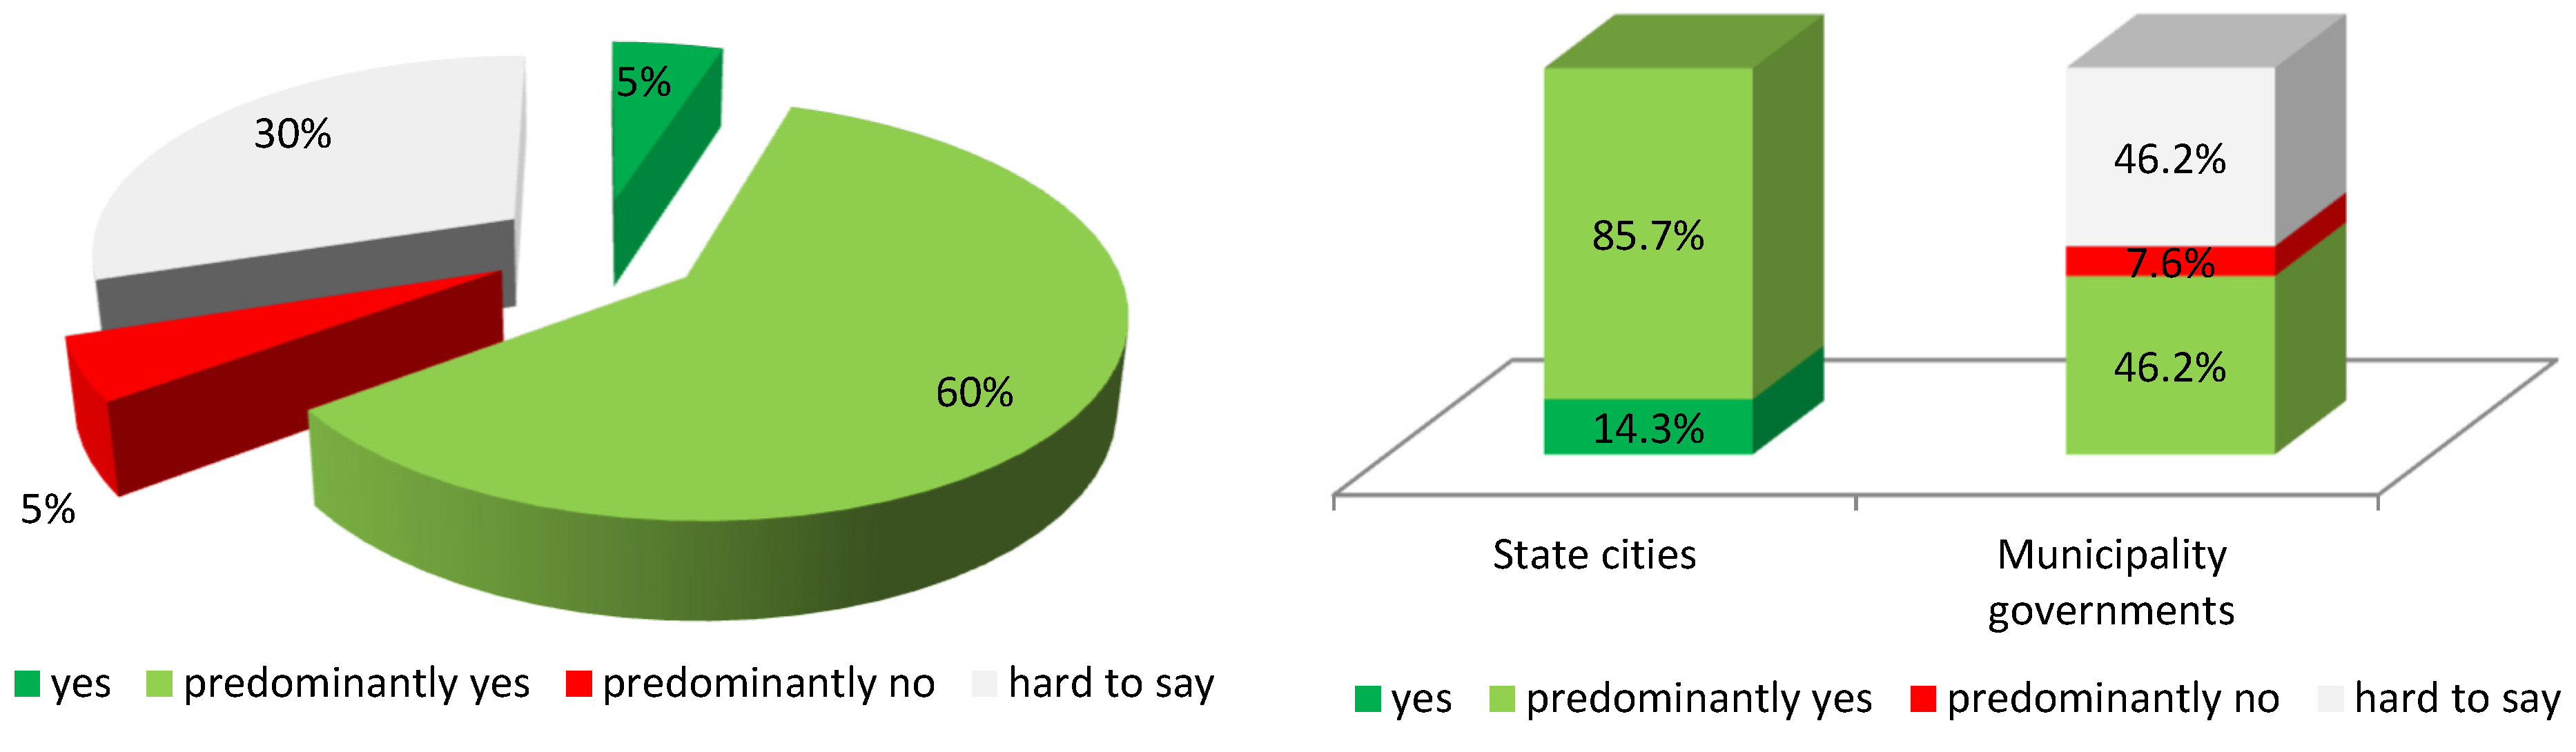
Can the use of socio-economic indicators make the process of informing local residents about the socio-economic usefulness of the project more effective? (n = 20) Please see Figure 4.
Of all municipalities, 65% believed that it would be useful to use socio-economic indicators to inform local residents. No municipality considered them to be completely useless, while 35% could not give an unequivocal answer. Significant differences in the answers to this question are between the State cities and municipal governments. All State cities explicitly believed that it is useful to use indicators, but almost half of the municipal governments found it difficult to give an unambiguous answer. Such a difference of opinion may be related to greater experience in using indicators, a more monolithic economy, as well as peculiarities of accounting and reporting procedures in State cities. Another explanation is related to more express consideration of residents’ opinions in planning or implementing a project in State cities.
Socio-economic value of heritage sites is often not obvious (e.g., [70]) for the local residents and other stakeholders. They do not always realise that cultural heritage objects, apart from the purely aesthetic view and as tourist attractions, ensure, inter alia, a positive impact on different economic areas and additional public income to cover actual social needs of the community [54,71]. Thus, many individuals do not connect their socio-economic benefits with the development of heritage sites. This leads to underestimation of advantages of investing in cultural heritage objects (e.g., [72,73]). Lack of informing and not taking into account opinions of the stakeholders deprives the projects of societal support, while local residents are deprived of understanding the additional sources of improvement of their well-being. Consequently, proper informing of the local residents and other stakeholders serves as a key factor in ensuring the success and sustainability of the cultural heritage development projects.
3.2. Evaluation of Indicators
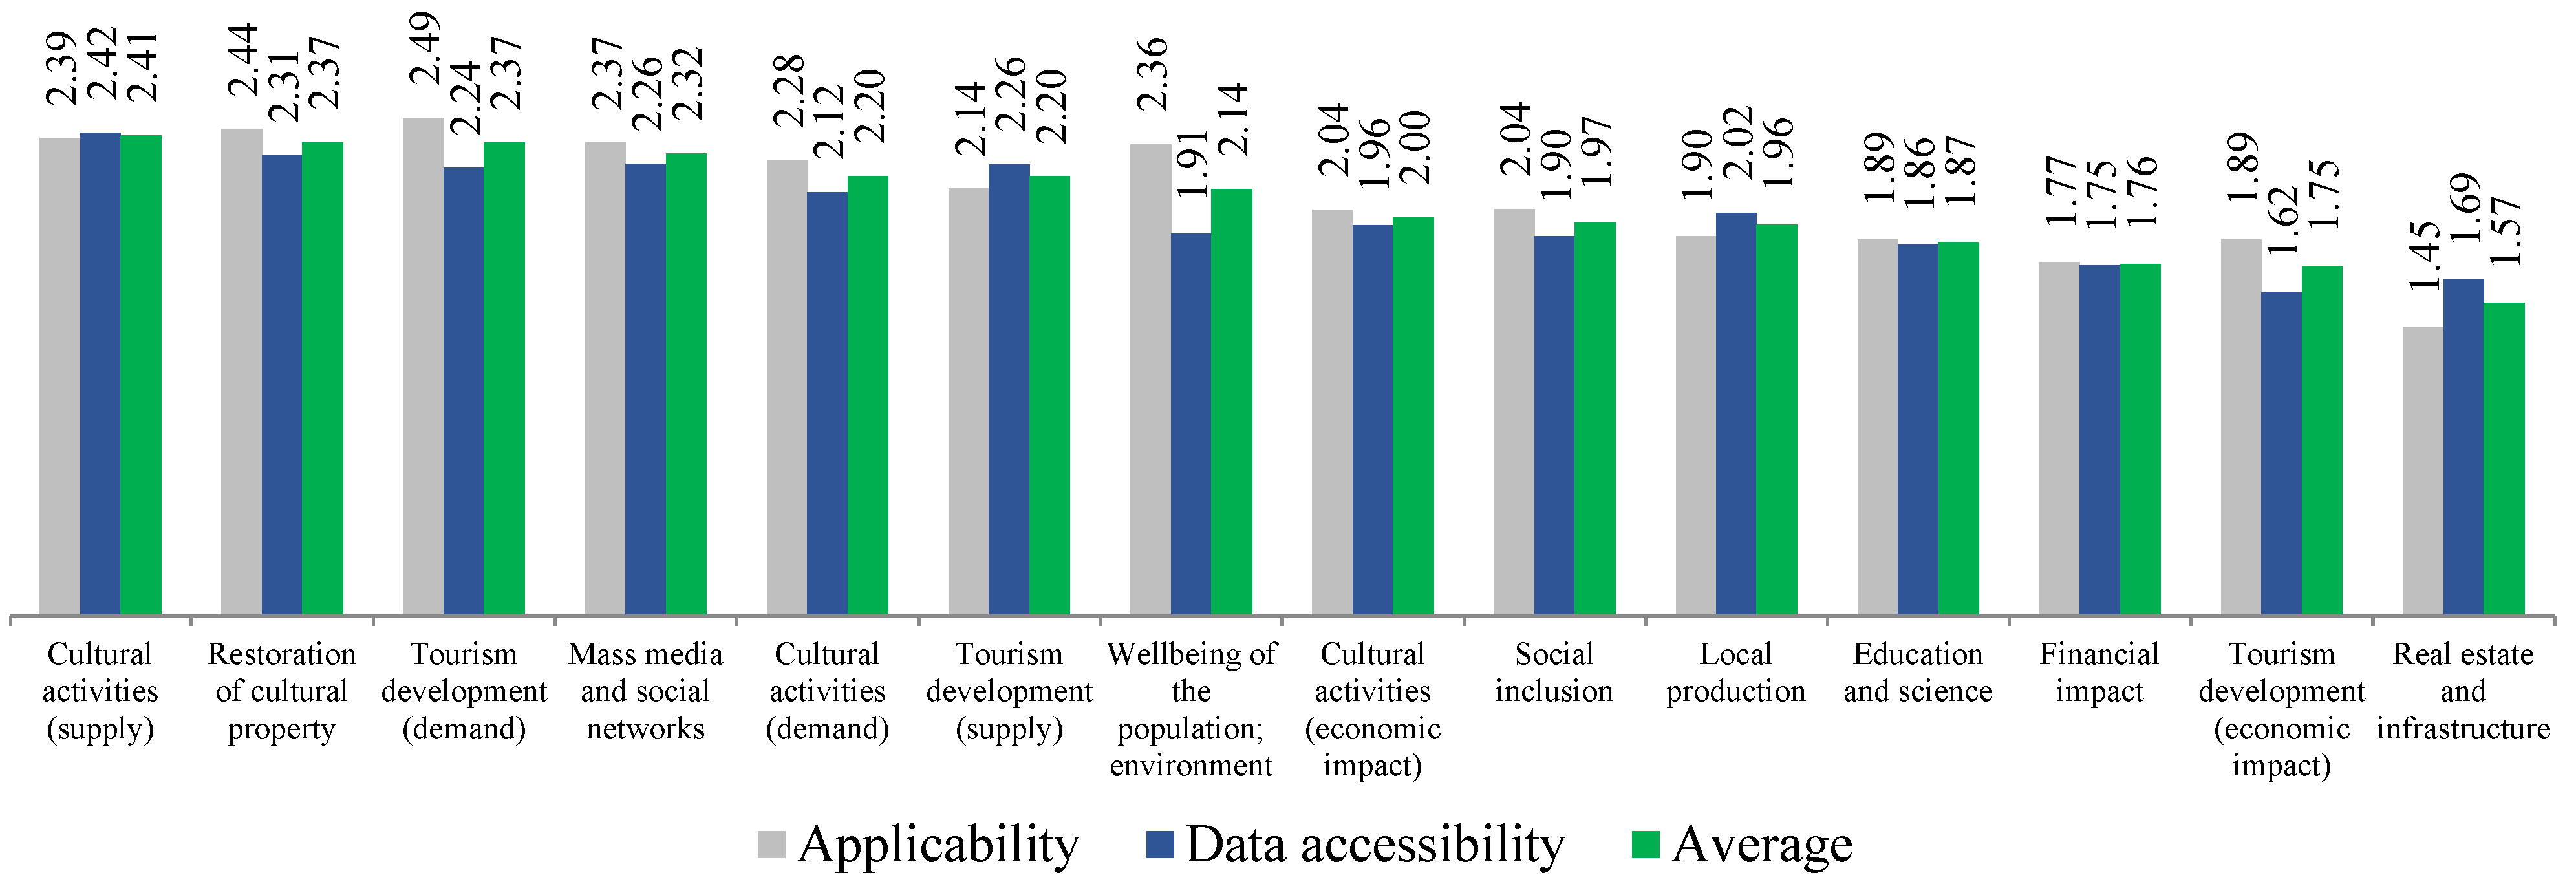
The indicators in Table 2 are arranged by the combined value of “Applicability” and “Data accessibility” (for illustration purposes combined value of “Applicability”, “Data accessibility” and “Average” is shown in Figure 5 as well). It is important to note that ranking the indicators by one of the dimensions, e.g., only by applicability, would have produced different results.
For some categories of indicators, the difference in dimension values is significant. For example, for “Wellbeing of the population; environment”, the difference exceeds 19% (“applicability” prevails), “Real estate and infrastructure”—16% (“data accessibility” prevails), “Tourism development (economic impact)”—14% (“applicability” prevails), “Tourism development (demand)”—10% (“applicability” prevails). The fact that “applicability” prevails might in certain cases indicate the municipalities’ understanding of the potential importance of this or another group of indicators, but signals difficulties in obtaining relevant data (non-accumulation or insufficient use) at the municipal level. As the cause for these difficulties, the respondents mentioned, inter alia, shortage of resources of the municipalities (incl. tourism information centres) in collecting and processing of data, difficulties in obtaining data from private parties and NGOs. In certain cases, the municipalities acknowledged non-collecting of specific data since they have not previously seen the usefulness of the particular indicator.
Cases where “Data accessibility” prevails indicate a smaller apparent or real interconnection (according to the respondents’ opinion) between the category of indicators and its potential impact on the results of the implemented project. This is especially characteristic of groups of long-term development (impact) indicators, such as “Real estate and infrastructure”.
The results show that the indicators that are easier to measure (tourism demand and supply, cultural activities, mass media and social networks) were rated the highest. Similarly, indicators directly related to project results (restoration of cultural property) were highly rated as well. Thus, from the six categories/subcategories of indicators (Cultural activities (supply), Restoration of cultural property, Tourism development (demand), Mass media and social networks, Cultural activities (demand), Tourism development (supply)), which shared the first five places, five categories are characterized by short-term impact and direct relation to project results.
Indicators related to financial calculations and forecasts (economic and financial impact), long-term development (real estate and infrastructure), social inclusion, scientific and educational development have been evaluated most modestly by all the municipalities. Indicators related to the well-being of the population and the environment were evaluated at the average level.
Analysing the categories of indicators that were not highly rated, in connection with the usefulness of informing citizens, it should be noted that for a large part of the local population, the economic benefit or the very “takeaway” of the project is relatively important. Thus, more attention should be paid to the economic and financial impact of the implemented projects. Infrastructural solutions are often important for visitors and other stakeholders (for example, the castle has been renovated, but it is difficult to approach it or park the car nearby). Young families care about the environment and the health of their children, so well-being and environmental indicators are important for them. Social inclusion might be important for retirees who are or want to be socially active, and as long as they are good artisans and local food makers, then also indicators of the development of local production. Indicators that characterize the long-term socio-economic impact are important for those wishing to settle down, work or develop a business in a stable and well-maintained environment. These indicators can be successfully used for creating a positive image of the area. Thus, as pointed out by F. Nocca, diverse social groups could have different values and beliefs, with different perceptions about what is relevant for their identity, attributing different values to a heritage place [27].
It should be noted that despite quite modest evaluation of indicators showing long-term and/or indirect impact, their importance should not be underestimated. Understanding of long-term outcomes is essential, if not vital, to performance of comprehensive socio-economic analysis and sustainability of cultural heritage development projects.
The analysis of the results leads to the assumption that sometimes the indicator is well suited, but there is not enough data to measure it (for example, there are no relevant statistics at the municipal level), or on the contrary, the data is or can be available, but the indicator is used less often because it is not really clear whether and how to apply it. The former cases, therefore, require paying more attention to the acquisition and processing of data, the latter to the possibilities of using the indicator itself, addressing it to the relevant interested parties.
Analysing the survey data of LAG (n = 3), State agencies (n = 2) and Association of Latvian Castles and Manors (n = 1) for comparison, it should be noted that their evaluation of categories/subcategories of indicators differs from the evaluation of municipalities. For example, LAG ranked Cultural activities (supply), Mass media and social networks, Cultural activities (economic impact), Local production and Cultural activities (demand) the highest (in the first five places). Focusing on categories of economic indicators, which sometimes have long-term impacts and an indirect relation to project results, is more visible here. LAGs, similarly to municipalities, rated the Real estate and infrastructure category of indicators the lowest. State agencies ranked Tourism development (demand), Cultural activities (demand), Cultural activities (supply), Education and science, Mass media and social networks the highest (in the first five places). This ranking of indicator categories can be explained by the nature of the activities of the surveyed state institutions (development of the tourism sector and promotion of the economic growth of the territories). State institutions rated the Social inclusion indicator category the lowest. The Association of Latvian Castles and Manors ranked Wellbeing of the population; Environment, Education and science, Mass media and social networks, Local production and Restoration of cultural property the highest (in the first five places). This ranking of indicator categories can be explained by the main field of activity of the surveyed association. The surveyed Association rated the Real estate and infrastructure category of indicators the lowest.
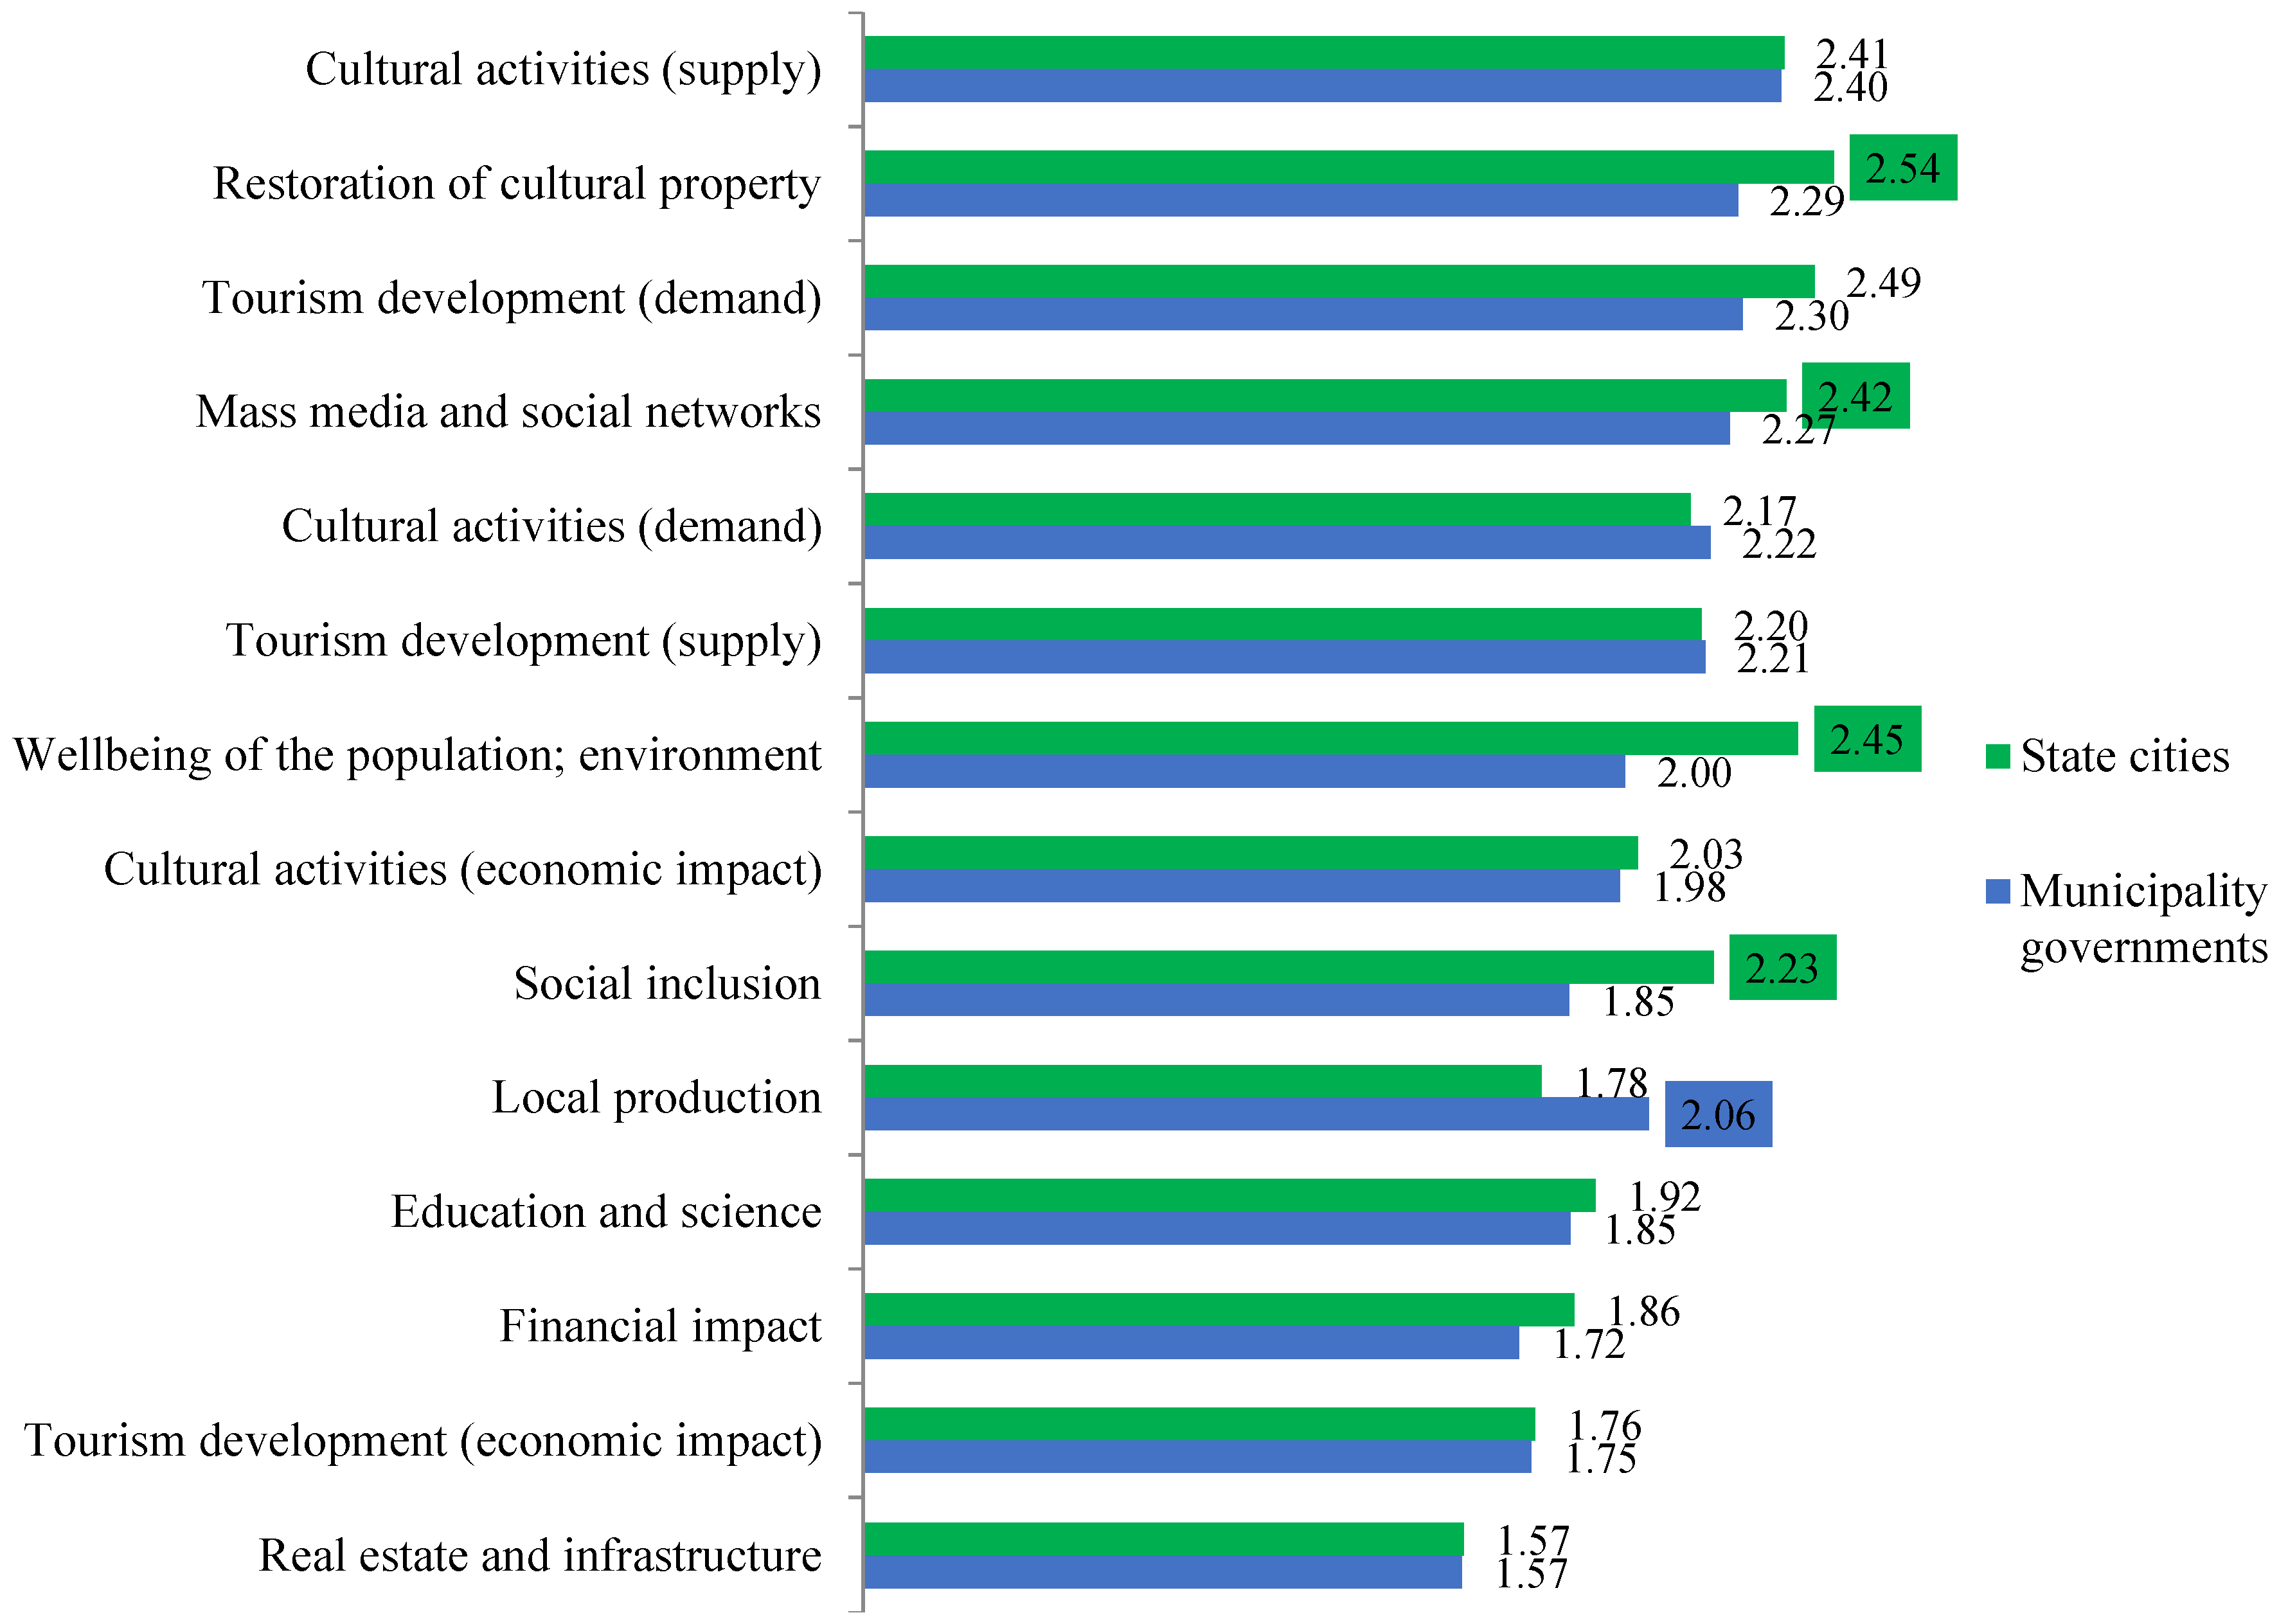
Dimension values that exceed the value of the other dimension by 10% are marked with the corresponding colour.
Figure 6 shows significant differences in the opinions of the State cities and municipal governments regarding several groups of indicators, which are most likely grounded in the solution of current social issues. Thus, the State cities place more emphasis on well-being, environment, social inclusion, restoration of cultural property, mass media and social networks, while municipal governments stress the importance of local economic traditions (local production). State cities value the use of financial and economic impact as well as tourism development (demand) indicators a little higher.
In general, the lowest ranks got indicators related to financial and economic impact, education and science development and especially real estate and infrastructure development. Most probably, such a ranking indicates complexities with their estimation and connection to the long-term development.
It should be noted that the State cities have a more pronounced tendency to evaluate the usefulness of using indicators (both applicability and data accessibility) higher than municipal governments.
Table 3 shows those indicators that are included in the top 10 (in bold in the Table 3) both by total average score and by applicability and data accessibility average scores (the full list of indicators with total average, applicability and data accessibility average scores, as well as ranks by total and ranks within categories, is attached in Appendix A). As can be seen from the table, only four indicators by total average score are included in the top 10 by applicability or data accessibility average scores. Indicator applicability or data accessibility average scores mostly (sometimes significantly) differ. This means that the inclusion of an indicator in the applicability or data accessibility top 10 does not guarantee its inclusion in the top 10 by total average score and indicates that both dimensions must be taken into account when evaluating the implementation of indicators in practice.
Looking at the top 10 indicators by the total average, it can be assumed that they are largely chosen according to interrelated criteria:
- direct links with the object visits/tourism (seven out of 10, e.g., visits to objects and websites, accessibility of objects, marketing materials, cultural events and organizing exhibitions, etc.),
- ease of measurement (seven out of 10, e.g., organizing cultural events, visiting tourist information centres, statistics of marketing materials, etc.),
- direct links with project results.
Some of the indicators included in the top 10 are static in nature and do not directly relate to the results produced by the project (e.g., number of immovable cultural monuments in the territory of the municipality or number of cultural institutions) but rather describe the pre-project environment. On the other hand, if the indicators are indirectly related to the project results or refer more to the well-being and satisfaction of the needs of local residents, they appear relatively more often in the top 10 by applicability or data accessibility average scores (e.g., domestic visitors, song, dance, etc., collectives that operate in (use) cultural objects, licenses issued for trade during cultural events, residents who are satisfied with the supply of cultural services). Most likely, the reason for this is (a) the indirect connection with the results of the project, e.g., less understanding of economic benefits which the municipality and the local residents get from trade during cultural events (which are often organized in cultural objects or in their immediate vicinity, thus, objects play the role of the cultural-historical background) or that it is useful for folk dance and song collectives to operate in a cultural-historical context in their activities (thus enriching the performances and attracting visitors) or (b) difficulties in obtaining relevant measurement data (e.g., residents who are satisfied with the supply of cultural services or attraction of domestic visitors).
It should be noted that indicators reflecting financial and long-term economic impact, social inclusion, education and science were not included in the top 10.
Looking at the top 10 indicators both by total average score and by applicability and data accessibility average scores, it can be seen that only some indicators partially correspond to the current project evaluation criteria defined in Regulation No. 635 [49], Application filling methodology [53] and Methodology for applying the criteria for evaluating project submissions [52] (see Table 1 above).
When analysing the results presented in Table 4 mathematically, it can be concluded that the highest ranks within the categories are mostly achieved by indicators with higher data accessibility (in 57.1% of cases, the data accessibility score is higher than the applicability score; average data accessibility score is 2.370, average applicability score is 2.308). The lowest ranks within the categories are mostly achieved by indicators with higher applicability (in 85.7% of cases, the applicability score is higher than the data accessibility score; average data accessibility score is 1.689, average applicability score is 1.899). This means that data accessibility is the more important dimension in the ranking of indicators, which has a greater influence on the assignment of the respective overall rating to the indicator. It can be found that the lowest places (ranks) in each category are taken by indicators which:
- require larger investment in obtaining measurement data (e.g., require financial analysis, conducting surveys, etc.), for instance, local residents who are satisfied with the use of public revenues, tax revenues from visiting cultural sites, related businesses and real estate, municipal budget revenues from the tourism sector. Additionally, several municipalities indicated that the surveys are not applicable for collecting specific data, as a very small percentage of local residents participate in them (in some cases no more than 1–2%).;
- relate to long-term impacts, e.g., average value of living space in residential areas (the value tends to rise in well-developed areas around cultural objects);
- relate to the results of the project indirectly, e.g., persons employed in the production and trade of crafts and local traditional food and drinks. If a cultural object is developed, it affects the inflow of visitors, which accordingly affects auxiliary spending and, thus, the demand for local crafts’ products, drinks and food, thereby increasing the number of employed persons, solving social problems, diversifying the economic activities of local residents and, accordingly, positively affecting their well-being;
- require additional investments (which tend to be long-term as well), e.g., students’ practices in cultural objects (Students’ practices and related scientific research, e.g., in archaeological objects, help to find the scientific basis for the international recognition of a cultural object. For instance, Grobiņa archaeological ensemble, despite its importance, was not accepted for inclusion in the UNESCO World Heritage List because, according to ICOMOS, the current state of knowledge and research on the object and its context is not sufficiently well advanced to justify the proposed Outstanding Universal Value ([74], p. 36) as well as otherwise positively affect visibility and acknowledgement of objects, but the organization of students’ practices and the support of scientific activity may require additional administrative and financial expenses from municipalities).

Table 4.
Indicators with highest and lowest ranks within categories.
| Category/Subcategory | Indicator | Score (Max = 3) | Total Rank (Out of All 96 Indicators) | ||
|---|---|---|---|---|---|
| Total | Applicability | Data Accessibility | |||
| 1.1. Tourism development (demand) | in-person visits to tourism information centres | 2.675 | 2.650 | 2.700 | 2 |
| average length of stay of tourists | 2.175 | 2.200 | 2.150 | 47 | |
| 1.2. Tourism development (supply) | cultural heritage objects (hillforts, castles, castle ruins, historical buildings, etc.) that are accessible to visitors | 2.575 | 2.550 | 2.600 | 5 |
| private apartments for rent | 1.550 | 1.800 | 1.300 | 86 | |
| 1.3. Tourism development (economic impact) | turnover of the tourism sector (accommodations, catering companies, tour operators, etc.) | 1.850 | 1.950 | 1.750 | 68 |
| municipal budget revenues from the tourism sector | 1.579 | 1.737 | 1.421 | 85 | |
| 2.1. Cultural activities (demand) | tickets sold to cultural events | 2.316 | 2.316 | 2.316 | 22 |
| visits to culture-related websites (number of lookups, unique visitors, returned visitors) | 2.026 | 2.053 | 2.000 | 57 | |
| 2.2. Cultural activities (supply) | cultural institutions (including museums, galleries, theatres, etc.) | 2.658 | 2.579 | 2.737 | 3 |
| cultural programs (including creative workshops, exhibitions, etc.), their projects | 2.158 | 2.211 | 2.105 | 48 | |
| 2.3. Cultural activities (economic impact) | attraction of investment to cultural activities | 2.079 | 2.158 | 2.000 | 52 |
| use of local cultural objects in branding, advertising activities, etc. | 1.895 | 2.211 | 1.579 | 66 | |
| 3. Local production | licenses issued for trade during cultural events (e.g., holidays, festivals, etc.) | 2.275 | 2.000 | 2.550 | 28 |
| persons employed in the production and trade of crafts and local traditional food and drinks | 1.450 | 1.550 | 1.350 | 91 | |
| 4. Social inclusion | song, dance, etc. collectives that operate in (use) cultural objects | 2.421 | 2.211 | 2.632 | 14 |
| persons with special needs in cultural development projects, events, etc. | 1.588 | 1.706 | 1.471 | 84 | |
| 5. Real estate and infrastructure | implementation of public infrastructure projects (roads, bridges, etc.) | 2.421 | 2.316 | 2.526 | 15 |
| average value of living space in residential areas | 1.320 | 1.167 | 1.474 | 96 | |
| 6. Restoration of cultural property | immovable cultural monuments in the territory of the municipality (distributed by type and significance) | 2.711 | 2.684 | 2.737 | 1 |
| residents who are satisfied with the condition of historical buildings and other cultural objects | 2.079 | 2.368 | 1.789 | 51 | |
| 7. Financial impact | average income of the local residents | 1.947 | 1.632 | 2.263 | 64 |
| tax revenues from visiting cultural sites, related businesses and real estate | 1.658 | 1.842 | 1.474 | 80 | |
| 8. Well-being of the residents; Environment | residents who are satisfied with the supply of cultural services | 2.263 | 2.579 | 1.947 | 30 |
| local residents who are satisfied with the use of public revenues (from the development of cultural objects) for the development of social and other services | 1.737 | 1.842 | 1.632 | 76 | |
| 9. Education and science | restoration projects | 2.105 | 2.158 | 2.053 | 50 |
| students’ practices | 1.711 | 1.684 | 1.737 | 78 | |
| 10. Mass media and social networks | reports, broadcasts, publications in the mass media | 2.447 | 2.526 | 2.368 | 11 |
| information in social networks | 2.184 | 2.211 | 2.158 | 43 | |
It should be noted that the indicator “average length of stay of tourists”, which partially corresponds to the current project evaluation criteria defined in Regulations No. 635 [49] and No. 130 [50], Application filling methodology [53] and Methodology for applying the criteria for evaluating project submissions [52] (see Table 1 above) has received the lowest rating in its category.
The highest ranks, respectively, are taken by those indicators that do not meet the above-mentioned conditions, are more directly and, perhaps, more demonstrably linked to project results.
4. Conclusions and Discussion
The socio-economic indicators currently recommended by the project supervisors (see, e.g., [49,50,52,53]) incompletely describe the impact of the implemented projects in the socio-economic and other areas. Several areas are essentially not affected, so the project implementers are guided by these indicators only partially.
Although project implementers mostly support the use of indicators to inform local residents about the socio-economic returns of projects during their planning, initiation and implementation phases, local residents are not always informed about the socio-economic benefits provided by these projects. Opinions of the local residents are not always taken into account during project planning and implementation. Moreover, State cities find it more useful to take into account the opinion of the local residents than municipal governments.
Most municipalities inform residents about project plans and implementation (predominantly through the municipal website or mass media; sometimes residents’ meetings are held). Municipal governments inform the residents more often than the State cities. Notwithstanding the rarer informing, it is more characteristic of the State cities to take into account residents’ opinions in implementation of the projects.
The majority of indicator categories (economic benefits and financial impact, local production, well-being, social inclusion, education and science, real estate and infrastructure) is currently not particularly used to inform residents or the supervising authorities.
Indicators characterized by easier quantification, data accessibility and easier/faster visualization of the achievements (showing short-term impact) are rated the highest, while the indicators requiring financial calculations and forecasts as well as surveys (showing long-term development (impact)), incl. social inclusion, scientific and educational development, are rated the most modestly. Perhaps this is due to a need for a substantial period of time and/or additional administrative and material investments in the aforementioned fields for the indicators to show development. Indicators showing changes in well-being of the local residents and the surrounding environment are evaluated at medium level.
The use of many indicators is hampered by the difficulty of obtaining measurement data at the municipal level or the need to invest more significant administrative resources to obtain them. This is especially relevant to the indicators showing financial and economic impact, changes in the well-being, real estate and infrastructure.
The fact that some categories of indicators, in particular the ones not reflecting an obvious direct connection with the implementation of projects (a direct causal relationship is not immediately visible), were evaluated less strongly (such as the impact on education and science) shows that municipalities may not have sufficient experience in using them or that there is an absence of deep-rooted traditions in the use of these indicators.
There are significant differences in the opinions of the State cities and municipal governments regarding several categories of indicators, which are most likely related to solving current social issues as well as local economic activities. State cities rate the use of financial and economic impact indicators slightly higher.
The socio-economic indicators currently provided by the project supervisors incompletely describe the impact of the implemented projects in the socio-economic and other areas (several areas are essentially not affected); moreover, the project implementers are only partially guided by these indicators.
Thus, the results of the conducted research confirmed the proposed hypothesis and allowed the authors to conclude that project implementers are generally less supportive of indicators that:
- are associated with a larger investment in obtaining measurement data;
- refers to the long-term impact;
- are indirectly related to the results of the project;
- might be related to additional further material investments.
Although the research was focused on Latvia, it is relevant to internationally shared problems (e.g., linking individual socio-economic benefits to the benefits of developing cultural heritage sites in the local area, sustainability aspects of cultural heritage development projects, etc.). It can therefore be assumed that the findings of the research can also be used in the context of other countries. The use of socio-economic indicators in practice is in itself a significant step forward. However, it should be noted that the effect of use of the socio-economic indicators may be reinforced by introduction and shared acceptance of the methodology of immovable cultural heritage management and socio-economic development. Socio-economic indicators form one element of the relevant methodology at national and regional/local level, where other elements include, inter alia, analysis and implementing of practical measures to address the impact of several groups of political, economic, social, legal and administrative, technological, environmental, and cooperation-related factors. The development and implementation of such a methodology is a matter for further research.
The current research was only focused on project implementers (municipalities) and less affected the development projects of cultural heritage objects implemented by subjects of private law (individuals, companies), because the number of responses received from local action groups (whose members are, inter alia, businessmen) was not sufficient for the analysis and drawing the relevant conclusions. Another limitation of the conducted research concerned the clarification of local residents’ opinions. Thus, the directions of further research should be related to the analysis of socio-economic indicators used by private individuals and merchants, as well as to clarifying the needs of local residents in the field of socio-economic indicators provided to them.
Recommendations
Since within the survey the respondents specified several indicators, proposed several new indicators and supplemented the measurement units of the indicators and ways of obtaining measurement data (suggesting and specifying the sources of obtaining measurement data), the initially developed list of indicators has been improved and can be used in practice. The authors propose to provide a full list of indicators to both the respondents and the supervisory authorities in order to promote the discussion on the selection and approval of such indicators at the national level, which would comprehensively picture the results of project implementation. Thus, the quality of projects will be improved, awareness of local residents will be raised, and funding will be more effectively allocated for the implementation of projects in the field of cultural heritage objects development.
Recommendations to project implementers:
- it is important to evaluate the possible socio-economic impact and the use of indicators at the very initial stage (design phase) of the project,
- it is beneficial to use socio-economic indicators to inform local residents and supervising institutions to increase support for project implementation (by linking personal benefits and project implementation) and the competitiveness of projects,
- it is necessary to determine how the implemented project will affect the socio-economic needs of local residents. Strengthening cooperation with local NGOs, businessmen and other stakeholders in order to receive information about their practical interests and to obtain measurement data necessary for the use of indicators (to measure “where we were–where we are–where we want to be”) is one of the key aspects for successful project implementation,
- it is expedient to use different categories of indicators to inform local residents and different social groups,
- the indirect impact (e.g., on employment, infrastructure development, businesses, well-being of the local residents) of the cultural heritage object development projects should not be underestimated (in particular because of the high additional value of these indicators for different groups of stakeholders), and the use of relevant indicators should be facilitated.
Author Contributions
Conceptualization, A.K., I.G. and I.O.-K.; Methodology, A.K.; Validation, A.K. and I.G.; Formal Analysis, A.K.; Investigation, A.K. and I.O.-K.; Data Curation, A.K. and I.G.; Writing—Original Draft Preparation, A.K. and I.O.-K.; Writing—Review and Editing, A.K. and I.G.; Supervision, I.G.; Project Administration, A.K. and I.O.-K.; Funding Acquisition, I.O.-K. All authors have read and agreed to the published version of the manuscript.
Funding
This research received no external funding.
Institutional Review Board Statement
Not applicable.
Informed Consent Statement
Not applicable.
Data Availability Statement
Not applicable.
Acknowledgments
The authors would like to thank representative of the Saeima (the Parliament of the Republic of Latvia) and the association Union of Riga and Pieriga Municipalities “RIGA METROPOLIS” Edvards Smiltēns for informational support; representative of the association Union of Riga and Pieriga Municipalities “RIGA METROPOLIS” Kristīne Cinkus for her assistance in conducting a survey throughout Riga Metropolis (comprising Riga (the capital or Latvia) and its surrounding municipalities); representative of LEADER Measures Division of the Rural Support Service of the Republic of Latvia Zane Jakušenoka, representative of Latvian Association of Castles, Palaces and Manors Jānis Lazdāns, representatives of the Tourism department of Investment and Development Agency of Latvia Inese Šīrava and Kristīne Mickāne for their professional opinion; the representative of the Department of Tourism and Heritage Development of Tukums municipality Ingrīda Smuškova for initial testing of the list of indicators and professional opinion. The authors would also like to thank all the respondents to the survey.
Conflicts of Interest
The authors declare no conflict of interest.
Appendix A
Table A1.
Table of Indicators.
| Category/Subcategory | Indicator | Measurement Unit | Average Total | Average Applicability | Average Data Accessibility | Rank by Total | Rank in the Category by Total |
|---|---|---|---|---|---|---|---|
| 1.1. Tourism development (demand) | 1.1.1. visits to the site/designated area | number or % | 2.625 | 2.950 | 2.300 | 4 | 2 |
| 1.1.2. foreign visitors | number or % | 2.175 | 2.450 | 1.900 | 44 | 6 | |
| 1.1.3. domestic visitors | number or % | 2.325 | 2.600 | 2.050 | 21 | 4 | |
| 1.1.4. in-person visits to tourism information centres | number or % | 2.675 | 2.650 | 2.700 | 2 | 1 | |
| 1.1.5. visits to the municipality’s tourism website (if possible, with data on cultural object (separating those that were covered by the projects) lookups in it) | number or % | 2.575 | 2.500 | 2.650 | 6 | 3 | |
| 1.1.6. visiting the websites of local tourism destinations (if possible, with data on cultural object (separating those that were covered by the projects) lookups in them) | number or % | 2.225 | 2.350 | 2.100 | 32 | 5 | |
| 1.1.7. occupancy of hotels or other tourists’ accommodations | % from the total number of places | 2.175 | 2.250 | 2.100 | 46 | 7 | |
| 1.1.8. average length of stay of tourists | nights per person per year (in another period) | 2.175 | 2.200 | 2.150 | 47 | 8 | |
| 1.2. Tourism development (supply) | 1.2.1. hotels or other tourist accommodations | number or % | 2.425 | 2.350 | 2.500 | 12 | 3 |
| 1.2.2. rooms in hotels or other tourist accommodations | number or % | 2.400 | 2.350 | 2.450 | 16 | 5 | |
| 1.2.3. private apartments for rent | number or % | 1.550 | 1.800 | 1.300 | 86 | 15 | |
| 1.2.4. catering companies (cafes, restaurants, etc.) | number or % | 2.075 | 2.050 | 2.100 | 54 | 11 | |
| 1.2.5. the number of companies involved in tourism (both with and without tourism NACE codes, e.g., family-operated farms, home manufacturers, etc., involved in tourism, which have offers for tourists) | number or % | 2.275 | 2.300 | 2.250 | 25 | 8 | |
| 1.2.6. new services for tourists | number | 2.222 | 2.111 | 2.333 | 34 | 10 | |
| 1.2.7. parking lots | number or % | 2.225 | 2.150 | 2.300 | 33 | 9 | |
| 1.2.8. parking capacity | % | 1.975 | 2.000 | 1.950 | 59 | 13 | |
| 1.2.9. bicycle, scooter rental points | number or % | 2.025 | 1.750 | 2.300 | 58 | 12 | |
| 1.2.10. rental bicycles, scooters | % | 1.850 | 1.600 | 2.100 | 70 | 14 | |
| 1.2.11. cultural objects included in the Latvian language materials of the tourism destination | number of copies per year; the number of objects included | 2.466 | 2.300 | 2.632 | 10 | 2 | |
| 1.2.12. cultural objects included in the foreign language materials of the tourism destination | number of copies per year; the number of objects included | 2.425 | 2.300 | 2.550 | 13 | 4 | |
| 1.2.13. information about cultural objects in national tourism materials in Latvian | number of copies per year; the number of objects included | 2.275 | 2.250 | 2.300 | 26 | 6 | |
| 1.2.14. information about cultural objects in national tourism materials in foreign languages | number of copies per year; the number of objects included | 2.275 | 2.250 | 2.300 | 27 | 7 | |
| 1.2.15. cultural heritage objects (hillforts, castles, castle ruins, historical buildings, etc.) that are accessible to visitors | number | 2.575 | 2.550 | 2.600 | 5 | 1 | |
| 1.3. Tourism development (economic impact) | 1.3.1. average expenditures of visitors (e.g., in catering companies, accommodations, shops, cultural sites/events) | EUR per day (or other period) | 1.725 | 1.950 | 1.500 | 77 | 3 |
| 1.3.2. municipal budget revenues from the tourism sector | EUR or % | 1.579 | 1.737 | 1.421 | 85 | 4 | |
| 1.3.3. turnover of the tourism sector (accommodations, catering companies, tour operators, etc.) | EUR or % | 1.850 | 1.950 | 1.750 | 68 | 1 | |
| 1.3.4. persons employed in the tourism sector (including accommodation, catering companies, shops, etc.). | number or % | 1.850 | 1.900 | 1.800 | 69 | 2 | |
| 2.1. Cultural activities (demand) | 2.1.1. visiting cultural events (including festivals, concerts, celebrations, etc.). | number or % | 2.263 | 2.474 | 2.053 | 29 | 2 |
| 2.1.2. visits to culture-related websites (number of lookups, unique visitors, returned visitors) | number or % | 2.026 | 2.053 | 2.000 | 57 | 3 | |
| 2.1.3. tickets sold to cultural events | number or % | 2.316 | 2.316 | 2.316 | 22 | 1 | |
| 2.2. Cultural activities (supply) | 2.2.1. cultural programs (including creative workshops, exhibitions, etc.), their projects | number or % | 2.158 | 2.211 | 2.105 | 48 | 6 |
| 2.2.2. organized cultural events | number or % | 2.474 | 2.368 | 2.579 | 9 | 3 | |
| 2.2.3. creative programs, concerts, performances, based on the local heritage/history of the cultural object | number or % | 2.289 | 2.316 | 2.263 | 24 | 5 | |
| 2.2.4. cultural institutions (including museums, galleries, theatres, etc.) | number or % | 2.658 | 2.579 | 2.737 | 3 | 1 | |
| 2.2.5. material exhibitions | number or % | 2.500 | 2.556 | 2.444 | 8 | 2 | |
| 2.2.6. digital exhibitions | number or % | 2.361 | 2.333 | 2.389 | 19 | 4 | |
| 2.3. Cultural activities (economic impact) | 2.3.1. attraction of investment to cultural activities | EUR | 2.079 | 2.158 | 2.000 | 52 | 1 |
| 2.3.2. economic return of organizing cultural events (income-expenses) | EUR | 1.947 | 2.105 | 1.789 | 63 | 4 | |
| 2.3.3. persons employed in cultural events | number | 2.079 | 2.000 | 2.158 | 53 | 2 | |
| 2.3.4. persons employed in cultural objects | number; % of the employed in the territory | 2.053 | 1.947 | 2.158 | 56 | 3 | |
| 2.3.5. average salary of persons employed in cultural objects | EUR | 1.921 | 1.789 | 2.053 | 65 | 5 | |
| 2.3.6. use of local cultural objects in branding, advertising activities, etc. | number or % | 1.895 | 2.211 | 1.579 | 66 | 6 | |
| 3. Local production | 3.1. artisans/manufacturers of crafts | number or % | 2.175 | 2.300 | 2.050 | 45 | 4 |
| 3.2. permanent craft and local traditional food and drink shops (markets) | number or % | 2.200 | 2.100 | 2.300 | 39 | 3 | |
| 3.3. crafts and local traditional food and drink trading places during cultural events (e.g., holidays, festivals, etc.) | number or % | 2.250 | 2.200 | 2.300 | 31 | 2 | |
| 3.4. licenses issued for trade during cultural events (e.g., holidays, festivals, etc.). | number or % | 2.275 | 2.000 | 2.550 | 28 | 1 | |
| 3.5. local traditional food and drink companies/producers | number or % | 2.075 | 2.000 | 2.150 | 55 | 5 | |
| 3.6. turnover of local traditional food and drink companies/producers | EUR | 1.600 | 1.600 | 1.600 | 83 | 7 | |
| 3.7. municipal budget revenues from crafts and local traditional food and drink production and trade | EUR | 1.650 | 1.450 | 1.850 | 81 | 6 | |
| 3.8. persons employed in the production and trade of crafts and local traditional food and drinks | number or % | 1.450 | 1.550 | 1.350 | 91 | 8 | |
| 4. Social inclusion | 4.1. local residents participating in cultural events | number or % | 1.974 | 2.316 | 1.632 | 60 | 3 |
| 4.2. local residents participating in the carrying out of cultural events | number or % | 1.842 | 1.947 | 1.737 | 71 | 5 | |
| 4.3. pupilsparticipating in cultural events | number or % | 1.868 | 2.000 | 1.737 | 67 | 4 | |
| 4.4. volunteers in cultural development projects, events, etc. | number or % | 1.842 | 1.789 | 1.895 | 74 | 6 | |
| 4.5. persons with special needs in cultural development projects, events, etc. | number or % | 1.588 | 1.706 | 1.471 | 84 | 7 | |
| 4.6. cultural societies, associations, centres, etc. | number/number per 10,000 (other quantity) local citizens | 2.211 | 2.263 | 2.158 | 37 | 2 | |
| 4.7. song, dance, etc. collectives that operate in (use) cultural objects | number | 2.421 | 2.211 | 2.632 | 14 | 1 | |
| 5. Real estate and infrastructure | 5.1. average rent in residential areas | EUR/m2 | 1.427 | 1.222 | 1.632 | 92 | 8 |
| 5.2. average rent in commercial buildings and offices | EUR/m2 | 1.413 | 1.353 | 1.474 | 93 | 9 | |
| 5.3. average value of living space in residential areas | EUR/m2 | 1.320 | 1.167 | 1.474 | 96 | 12 | |
| 5.4. average commercial area value | EUR/m2 | 1.459 | 1.444 | 1.474 | 89 | 6 | |
| 5.5. construction of new residential areas | number of objects or m2 | 1.458 | 1.389 | 1.526 | 90 | 7 | |
| 5.6. new commercial facilities and offices | number of objects or m2 | 1.510 | 1.389 | 1.632 | 87 | 4 | |
| 5.7. transactions in the field of real estate | number or EUR | 1.484 | 1.389 | 1.579 | 88 | 5 | |
| 5.8. vacant housing and premises | % or m2 | 1.323 | 1.278 | 1.368 | 95 | 11 | |
| 5.9. investments in the construction of residential areas, commercial objects and offices | EUR | 1.351 | 1.333 | 1.368 | 94 | 10 | |
| 5.10. tax revenue from real estate | EUR or % | 1.950 | 1.600 | 2.300 | 62 | 2 | |
| 5.11. implementation of public infrastructure projects (roads, bridges, etc.) | number | 2.421 | 2.316 | 2.526 | 15 | 1 | |
| 5.12. land value (distributed by type of use) | EUR/m2 | 1.632 | 1.421 | 1.842 | 82 | 3 | |
| 6. Restoration of cultural property | 6.1. immovable cultural monuments in the territory of the municipality (distributed by type and significance) | number | 2.711 | 2.684 | 2.737 | 1 | 1 |
| 6.2. the proportion of well-preserved (restored) historical buildings and other cultural objects in the pool of historical buildings and other cultural objects in a specific territory | % | 2.395 | 2.474 | 2.316 | 17 | 3 | |
| 6.3. the proportion of historical buildings (slums) and other cultural objects in poor condition in the pool of historical buildings and other cultural objects in a specific territory | % | 2.395 | 2.368 | 2.421 | 18 | 4 | |
| 6.4. the proportion of functionally usable historical buildings and other usable cultural objects in the pool of historical buildings and other cultural objects in a specific territory | % | 2.342 | 2.474 | 2.211 | 20 | 5 | |
| 6.5. energy efficiency of the renovated cultural object (building) | increase % | 2.303 | 2.313 | 2.294 | 23 | 6 | |
| 6.6. the proportion of free (unused) historical buildings in the pool of historical buildings in a given territory | % | 2.211 | 2.263 | 2.158 | 38 | 7 | |
| 6.7. renovation/restoration projects of historical buildings and other cultural objects | number | 2.526 | 2.526 | 2.526 | 7 | 2 | |
| 6.8. residents who are satisfied with the condition of historical buildings and other cultural objects | % | 2.079 | 2.368 | 1.789 | 51 | 8 | |
| 7. Financial impact | 7.1. financial return (income) per EUR invested (from public funds) in the development of cultural heritage objects | EUR | 1.684 | 1.842 | 1.526 | 79 | 2 |
| 7.2. tax revenues from visiting cultural sites, related businesses and real estate | EUR | 1.658 | 1.842 | 1.474 | 80 | 3 | |
| 7.3. average income of the local residents | EUR per year | 1.947 | 1.632 | 2.263 | 64 | 1 | |
| 8. Well-being of the residents; Environment | 8.1. residents who are satisfied with the supply of cultural services | % | 2.263 | 2.579 | 1.947 | 30 | 1 |
| 8.2. residents who are satisfied with the level of cleanliness of the neighbourhood | % | 2.184 | 2.421 | 1.947 | 40 | 4 | |
| 8.3. residents who are satisfied with the opportunities provided by the development of cultural heritage sites (e.g., employment in cultural sites and related businesses, craft development, local food and drink production and sales opportunities, infrastructure development, etc.) | % | 2.132 | 2.368 | 1.895 | 49 | 7 | |
| 8.4. residents who are satisfied with the use of public revenues (from the development of cultural objects) for the development of social and other services | % | 1.737 | 1.842 | 1.632 | 76 | 8 | |
| 8.5. residents who are satisfied with local green areas and recreational infrastructure | % | 2.211 | 2.421 | 2.000 | 36 | 3 | |
| 8.6. residents who are satisfied with the local transport and access road infrastructure | % | 2.184 | 2.368 | 2.000 | 42 | 5 | |
| 8.7. residents who are satisfied with the local cultural landscape | % | 2.184 | 2.421 | 1.947 | 41 | 6 | |
| 8.8. residents who feel pride of belonging to their place of residence, municipality | % | 2.211 | 2.474 | 1.947 | 35 | 2 | |
| 9. Education and science | 9.1. scientific research projects (related to cultural objects) | number | 1.842 | 1.842 | 1.842 | 73 | 3 |
| 9.2. archaeological research projects (if archaeological research is not mandatory requested by law) | number | 1.763 | 1.789 | 1.737 | 75 | 5 | |
| 9.3. restoration projects | number | 2.105 | 2.158 | 2.053 | 50 | 1 | |
| 9.4. scientific publications | number | 1.842 | 1.895 | 1.789 | 72 | 4 | |
| 9.5. students’ practices | number | 1.711 | 1.684 | 1.737 | 78 | 6 | |
| 9.6. pupils’ classes in cultural sites | number | 1.974 | 1.947 | 2.000 | 61 | 2 | |
| 10. Mass media and social networks | 10.1. reports, broadcasts, publications in the mass media | number | 2.447 | 2.526 | 2.368 | 11 | 1 |
| 10.2. information in social networks | number | 2.184 | 2.211 | 2.158 | 43 | 2 |
References
- Bossel, H. Indicators for Sustainable Development: Theory, Method, Applications: A Report to the Balaton Group; International Institute For Sustainable Development: Winnipeg, MB, USA, 1999; pp. 6–7. ISBN 1-895536-13-8. [Google Scholar]
- Mendes Zancheti, S.; Tone Ferreira Hidaka, L. Measuring urban heritage conservation: Theory and structure (part 1). J. Cult. Herit. Manag. Sustain. Dev. 2011, 1, 96–108. [Google Scholar] [CrossRef]
- Johnston, D.F.; Carley, M.J. Chapter 11: Social Measurement and Social Indicators. ANNALS Am. Acad. Political Soc. Sci. 1981, 453, 237–253. [Google Scholar] [CrossRef]
- Sowińska-Świerkosz, B. Review of cultural heritage indicators related to landscape: Types, categorisation schemes and their usefulness in quality assessment. Ecol. Indic. 2017, 81, 526–542. [Google Scholar] [CrossRef]
- Wong, C. Indicators in Use: Challenges to Urban and Environmental Planning in Britain. Town Plan. Rev. 2000, 71, 213–239. [Google Scholar] [CrossRef]
- Wong, C. Indicators at the Crossroads: Ideas, Methods and Applications. Town Plan. Rev. 2003, 74, 53–279. [Google Scholar] [CrossRef]
- Rypkema, D.; Cheong, C. Measurements and indicators of heritage as development. In Proceedings of the ICOMOS 17th General Assembly, Paris, France, 27 November–2 December 2011. [Google Scholar]
- Greffe, X. The Economic Value of Heritage, 2005. Available online: http://www.planningstudies.org/pdf/Raphael%20Greffe-%20E%20%28formatted%29.pdf (accessed on 1 June 2023).
- Auwera, S.V. Cultural heritage policies as a tool for development: Discourse or harmony? ENCATC J. Cult. Manag. Policy 2015, 4, 1. [Google Scholar]
- Brooks, G. Heritage as a driver for development: Its contribution to sustainable tourism in contemporary society. In Proceedings of the ICOMOS 17th General Assembly, Paris, France, 27 November–2 December 2011. [Google Scholar]
- ICOMOS 2017, Heritage as a Driver of Sustainability. Available online: https://artsandculture.google.com/story/heritage-as-a-driver-of-sustainability-icomos/ewVBpE8qiz0gUQ?hl=en (accessed on 1 June 2023).
- Agenda—UN GA Resolution A/RES/70/1, Transforming Our World: The 2030 Agenda for Sustainable Development. Available online: https://documents-dds-ny.un.org/doc/UNDOC/GEN/N15/291/89/PDF/N1529189.pdf?OpenElement (accessed on 1 June 2023).
- Labadi, S.; Giliberto, F.; Rosetti, I.; Shetabi, L.; Yildirim, E. Heritage and the Sustainable Development Goals: Policy Guidance for Heritage and Development Actors; ICOMOS: Manila, Philippines, 2021; 134p. [Google Scholar]
- New Urban Agenda—United Nations New Urban Agenda, Resolution A/RES/71/256; United Nations: New York, NY, USA, 2017; ISBN 978-92-1-132731-1. Available online: https://habitat3.org/wp-content/uploads/NUA-English.pdf (accessed on 1 June 2023).
- UN 2015—Historic New Sustainable Development Agenda Unanimously Adopted by 193 UN Members. Available online: https://www.un.org/sustainabledevelopment/blog/2015/09/historic-new-sustainable-development-agenda-unanimously-adopted-by-193-un-members/ (accessed on 1 June 2023).
- Kalapurakal, R. Cities 2030: Implementing the New Urban Agenda, 7 February 2018. Available online: https://www.undp.org/blog/cities-2030-implementing-new-urban-agenda (accessed on 1 June 2023).
- EU Conclusions 2018—Council Conclusions on the Need to Bring Cultural Heritage to the Fore Across Policies in the EU, Council of the European Union, 2018. Available online: https://eur-lex.europa.eu/legal-content/EN/TXT/?uri=CELEX:52018XG0608(02) (accessed on 1 June 2023).
- EP Resolution 2022/2047—European Parliament Resolution of 14 December 2022 on the Implementation of the New European Agenda for Culture and the EU Strategy for International Cultural Relations (2022/2047(INI)). Available online: https://www.europarl.europa.eu/doceo/document/TA-9-2022-0444_EN.html (accessed on 1 June 2023).
- Jakubowski, A. Resolution 2347: Mainstreaming the Protection of Cultural Heritage at the Global Level. Quest. Int. Law 2018, 48, 21–44. [Google Scholar]
- Fusco Girard, L. Toward a Smart Sustainable Development of Port Cities/Areas: The Role of the “Historic Urban Landscape” Approach. Sustainability 2013, 5, 4329–4348. [Google Scholar] [CrossRef] [Green Version]
- UNDESA. Indicators of Sustainable Development: Guidelines and Methodologies, 3rd ed.; UNDESA: New York, NY, USA, 2007; ISBN 978-92-1-104577-2. [Google Scholar]
- UNESCO. Indicators of Sustainability: Reliable Tools for Decision Making; UNESCO-SCOPE-UNEP Policy Briefs; UNESCO: Paris, France, 2006; Available online: https://unesdoc.unesco.org/ark:/48223/pf0000150005 (accessed on 1 June 2023).
- Mendes Zancheti, S.; Similä, K. Measuring Heritage Conservation Performance. In Proceedings of the 6th International Seminar on Urban Conservation, Recife, Brazil, 29–31 March 2011. [Google Scholar]
- Ost, C. Mapping Heritage Economics for Spatial Analysis in Historic City Cores. In The Economics of Uniqueness. Investing in Historic City Cores and Cultural Heritage Assets for Sustainable Development; Licciard, G., Amirtahmasebi, R., Eds.; World Bank Group: Washington, DC, USA, 2012; pp. 245–283. [Google Scholar]
- CHCfE Consortium. Cultural Heritage Counts for Europe; CHCfE Consortium: Krakow, Poland, 2015; ISBN 978-83-63463-27-4. [Google Scholar]
- Jelinčić, D.A. Indicators for Cultural and Creative Industries’ Impact Assessment on Cultural Heritage and Tourism. Sustainability 2021, 13, 7732. [Google Scholar] [CrossRef]
- Nocca, F. The Role of Cultural Heritage in Sustainable Development: Multidimensional Indicators as Decision-Making Tool. Sustainability 2017, 9, 1882. [Google Scholar] [CrossRef] [Green Version]
- Vecco, M.; Srakar, A. The unbearable sustainability of cultural heritage: An attempt to create an index of cultural heritage sustainability in conflict and war regions. J. Cult. Herit. 2018, 33, 293–302. [Google Scholar] [CrossRef]
- UN SDG Indicator Metadata. Available online: https://unstats.un.org/sdgs/metadata/files/Metadata-11-04-01.pdf (accessed on 1 June 2023).
- Tanguay, G.A.; Therrien, M.-C. Sustainable tourism indicators: Selection criteria for policy implementation and scientific recognition. J. Sustain. Tour. 2013, 21, 862–879. [Google Scholar] [CrossRef] [Green Version]
- Król, K. Assessment of the Cultural Heritage Potential in Poland. Sustainability 2021, 13, 6637. [Google Scholar] [CrossRef]
- EU Co-Funded Projects—Summaries of Submitted and Approved Special Support Purpose 5.5.1. Projects. Available online: https://www.esfondi.lv/es-fondu-projektu-mekletajs?form_name=projects-search-form&order_field=&order_dir=&ProjektaNosaukums=&ProjektaNumurs=5.5.1&EsFonds=Visi%20fondi&IesniedzejaNosaukums=&pSamNosaukums=&ProjektaStatuss=Visi%20projekti&IstenosanasVietasAdrese=&IstenosanasVietasRegions=Visa%20Latvija&IntervencesKategorijasNosaukums=&page=1 (accessed on 1 June 2023).
- Geipele, S.; Zeltins, N.; Ekmanis, J. The Development and Design of Engineering Economic Indicator System for Nanotechnology Industry Product Manufacturing: A Case Study of Latvia. Latv. J. Phys. Tech. Sci. 2015, 52, 3–19. [Google Scholar] [CrossRef] [Green Version]
- Judrupa, I.; Blagova, G. Criteria and Indicators of the Economic Sector for Sustainable Development Model of Kuldiga Municipality. Ilgtspējīga Telpiskā Attīstība 2011, 2, 30–36. [Google Scholar]
- Choi, J.-G. Developing an economic indicator system (a forecasting technique) for the hotel industry. Int. J. Hosp. Manag. 2003, 22, 147–159. [Google Scholar] [CrossRef]
- Anderson, V. Alternative Economic Indicators; Routledge: London, UK, 1991; p. 106. ISBN 0415041635. [Google Scholar]
- Throsby, D. Investment in Urban Heritage: Economic Impacts of Cultural Heritage Projects in FYR Macedonia and Georgia. In Urban Development Series Knowledge Papers 16; World Bank: Washington, DC, USA, 2012. [Google Scholar]
- Throsby, D. Investment in Urban Heritage Conservation in Developing Countries: Concepts, Methods and Data. City Cult. Soc. 2016, 7, 81–86. [Google Scholar] [CrossRef]
- Throsby, D. Culturally Sustainable Development: Theoretical Concept or Practical Policy Instrument? Int. J. Cult. Policy 2017, 23, 133–147. [Google Scholar] [CrossRef]
- Licciardi, G.; Amirtahmasebi, R. (Eds.) The Economics of Uniqueness: Investing in Historic City Cores and Cultural Heritage Assets for Sustainable Development; World Bank Publications: Washington, DC, USA, 2012. [Google Scholar]
- Ruijgrok, E.C.M. The three economic values of cultural heritage: A case study in the Netherlands. J. Cult. Herit. 2006, 7, 206–213. [Google Scholar] [CrossRef]
- Greffe, X. Is heritage an asset or a liability? J. Cult. Herit. 2004, 5, 301–309. [Google Scholar] [CrossRef]
- Appendino, F. Heritage-related Indicators for Urban Sustainable Development: A Systematic Review. Urban Transp. Constr. 2018, 4, 1. [Google Scholar]
- Tanguay, G.A.; Rajaonson, J.; Lefebvre, J.-F.; Lanoie, P. Measuring the sustainability of cities: An analysis of the use of local indicators. Ecol. Indic. 2010, 10, 407–418. [Google Scholar] [CrossRef]
- Tanguay, G.; Berthold, E.; Rajaonson, J. A Comprehensive Strategy to Identify Indicators of Sustainable Heritage Conservation. CRTP Working Papers. 2014. Available online: https://www.researchgate.net/publication/266343477_A_Comprehensive_Strategy_to_Identify_Indicators_of_Sustainable_Heritage_Conservation (accessed on 1 June 2023).
- Guzmán, P.C.; Pereira Roders, A.R.; Colenbrander, B.J.F. Measuring links between cultural heritage management and sustainable urban development: An overview of global monitoring tools. Cities 2017, 60, 192–201. [Google Scholar] [CrossRef]
- Ren, W.; Han, F. Indicators for Assessing the Sustainability of Built Heritage Attractions: An Anglo-Chinese Study. Sustainability 2018, 10, 2504. [Google Scholar] [CrossRef] [Green Version]
- UNESCO. Methodology Manual 2014—UNESCO Cultural for Development Indicators, Methodology Manual; UNESCO: Paris, France. Available online: www.unesco.org/creativity/cdis (accessed on 1 June 2023).
- Cabinet Regulation No. 635—Regulation No.635 of the Cabinet of Ministers as of 24.10.2017. “Darbības Programmas “Izaugsme un Nodarbinātība” Prioritārā Virziena “Vides Aizsardzības un Resursu Izmantošanas Efektivitāte” 5.5.1. Specifiskā Atbalsta Mērķa “Saglabāt, Aizsargāt un Attīstīt Nozīmīgu Kultūras un Dabas Mantojumu, kā arī Attīstīt ar to Saistītos Pakalpojumus” Trešās Projektu Iesniegumu Atlases Kārtas “Ieguldījumi Kultūras un Dabas Mantojuma Attīstībai Nacionālas Nozīmes Attīstības Centru Pašvaldībās” Īstenošanas Noteikumi”. Available online: https://likumi.lv/ta/id/294524-darbibas-programmas-izaugsme-un-nodarbinatiba-prioritara-virziena-vides-aizsardzibas-un-resursu-izmantosanas-efektivitate (accessed on 1 June 2023).
- Cabinet Regulation No.130—Regulation No.130 of the Cabinet of Ministers as of 10.03.2020. “Darbības Programmas “Izaugsme un Nodarbinātība” Prioritārā Virziena “Vides Aizsardzības un Resursu Izmantošanas Efektivitāte” 5.5.1. Specifiskā Atbalsta Mērķa “Saglabāt, Aizsargāt un Attīstīt Nozīmīgu Kultūras un Dabas Mantojumu, kā arī Attīstīt ar to Saistītos Pakalpojumus” Ceturtās Projektu Iesniegumu Atlases Kārtas “Kultūras Mantojuma Saglabāšana, Atjaunošana un ar to Saistītās Infrastruktūras Attīstība Rīgas Vēsturiskā Centra Teritorijā” Īstenošanas Noteikumi”. Available online: https://likumi.lv/ta/id/313139-darbibas-programmas-izaugsme-un-nodarbinatiba-prioritara-virziena-vides-aizsardzibas-un-resursu-izmantosanas-efektivitate (accessed on 1 June 2023).
- Cabinet Regulation No. 322—Regulation No.322 of the Cabinet of Ministers as of 24.05.2016. “Darbības Programmas “Izaugsme un nodarbinātība” Prioritārā Virziena “Vides Aizsardzības un Resursu Izmantošanas Efektivitāte” 5.5.1. Specifiskā Atbalsta mērķa “Saglabāt, Aizsargāt un Attīstīt Nozīmīgu Kultūras un Dabas Mantojumu, kā arī Attīstīt ar to Saistītos Pakalpojumus” Pirmās un Otrās Atlases kārtas īstenošanas Noteikumi”. Available online: https://likumi.lv/ta/id/282643-darbibas-programmas-izaugsme-un-nodarbinatiba-prioritara-virziena-vides-aizsardzibas-un-resursu-izmantosanas-efektivitate (accessed on 1 June 2023).
- Methodology for Applying the Criteria for Evaluating Project Submissions—City Development Department of Riga City Council, Methodology for Applying the Criteria for Evaluating Project Submissions. Available online: https://www.rdpad.lv/strategija/iti-ieviesana/5-5-1-sam/ (accessed on 1 June 2023).
- Application Filling Methodology—Action Programs “Growth and Employment” General Assumptions and Numerical Values of Parameters, Calculation Model and Filling Methodology Used in the Cost-Benefit Analysis of Project Submissions of the Specific Support Goal 5.5.1. “Preserve, Protect and Develop Important Cultural and Natural Heritage, as well as Develop Related Services”. Available online: https://www.km.gov.lv/lv/media/1126/download (accessed on 1 June 2023).
- Kairiss, A.; Olevska, I. Damage to Archaeological Sites: Assessment Criteria and Latvian Situation. Balt. J. Real Estate Econ. Constr. Manag. 2020, 8, 45–82. [Google Scholar] [CrossRef]
- Olevska-Kairisa, I.; Kairiss, A. Victims of Heritage Crimes: Aspects of Legal and Socio-Economic Justice. Open Archaeol. 2023, 9, 20220293. [Google Scholar] [CrossRef]
- Law on Administrative Territories and Populated Areas—Adopted 10.06.2020, Came into Force 23.06.2020. Available online: https://likumi.lv/ta/en/en/id/315654-law-on-administrative-territories-and-populated-areas (accessed on 1 June 2023).
- Statistics 2021—The Total Area of Regions, Republican Cities, Counties, County Towns and Parishes at the beginning of the Year—All Territories and Time Period, 2021. Available online: https://data.stat.gov.lv/pxweb/lv/OSP_PUB/START__ENV__DR__DRT/DRT010/table/tableViewLayout1/ (accessed on 1 June 2023).
- Statistics 2022—Population by Nationality in Regions, National Cities and Counties at the beginning of the Year 2022 (after the Administrative Territorial Reform in 2021). Available online: https://data.stat.gov.lv/pxweb/lv/OSP_PUB/START__POP__IR__IRE/IRE031/table/tableViewLayout1/ (accessed on 1 June 2023).
- Statistics 2022-1—Population at the beginning of the Year, Its Changes and Main Indicators of Natural Movement—Indicators and Time Period. Available online: https://data.stat.gov.lv/pxweb/lv/OSP_PUB/START__POP__IR__IRS/IRS010/table/tableViewLayout1/ (accessed on 1 June 2023).
- Law On Administrative Territories and Populated Areas—Adopted 18.12.2008, Came into Force 31.12.2008. Available online: https://likumi.lv/ta/id/185993-administrativo-teritoriju-un-apdzivoto-vietu-likums (accessed on 1 June 2023).
- Table of Proposed Amendments 2020—Amendments to the Draft Law “Law on Administrative Territories and Populated Areas” for the Third Reading of the Saeima (Parliament of Latvia). Available online: https://titania.saeima.lv/LIVS13/SaeimaLIVS13.nsf/0/14818BF131F13FE5C2258569004DDB5C?OpenDocument (accessed on 1 June 2023).
- Latvian Rural Forum—Webpage of the Latvian Rural Forum. Available online: https://laukuforums.lv/lv/vrg-karte-2 (accessed on 1 June 2023).
- Cabinet Regulation No.515—Ministru Kabineta 2008.Gada 7. Jūlija Noteikumi Nr.515 “Valsts un Eiropas Savienības Atbalsta Piešķiršanas Kārtība Vietējo Attīstības Stratēģiju Īstenošanai”. Available online: https://likumi.lv/ta/id/178093-valsts-un-eiropas-savienibas-atbalsta-pieskirsanas-kartiba-vietejo-attistibas-strategiju-istenosanai (accessed on 1 June 2023).
- Latvian Investment and Development Agency Webpage—Tourism Department. Available online: https://www.liaa.gov.lv/lv/strukturvieniba/turisma-departaments (accessed on 1 June 2023).
- Rural Support Service Webpage. Available online: lad.gov.lv (accessed on 1 June 2023).
- Association of Latvian Castles and Manors Webpage. Available online: www.pilis.lv (accessed on 1 June 2023).
- Cultural Policy Guidelines 2014–2020—Cultural Policy Guidelines for 2014–2020 “Radošā Latvija”: Protection of Cultural Monuments Industry Strategy, State Inspection for Protection of Cultural Monumnets, Riga, 2015. Available online: https://www.nkmp.gov.lv/lv/attistibas-planosanas-dokumenti/kulturas_piemineklu_aizsardzibas_nozares_strategija_201120151_0.pdf (accessed on 1 June 2023).
- Latvian Tourism Industry Analysis. Analysis of Latvia’s Tourism Industry: Actions for the Development of Latvia’s Tourism Offer Development Plan within the BRANDTour Project/Phase I of Interreg Europe Program, 2019; pp. 1–119. Available online: https://www.em.gov.lv/sites/em/files/latvijas_turisma_nozares_analize_20brandtour_20final1.pdf (accessed on 1 June 2023).
- Riga Planning Region 2020—Information from Riga Planning Region Official Portal. Available online: https://rpr.gov.lv/teritorija/iedzivotaji/ (accessed on 1 June 2023).
- Holtorf, C. The Changing Contribution of Cultural Heritage to Society. Mus. Int. 2012, 63, 249–250. [Google Scholar] [CrossRef]
- Latvian Academy of Sciences Economic Institute. Research of the Economic Institute of the Latvian Academy of Sciences “Attitude of Cultural Monument Owners toward the Status of Cultural Monuments as a Burden”, 2002. Available online: https://www.km.gov.lv/sites/km/files/kulturas_piemineklu_statuss_lza_ei1.pdf (accessed on 1 June 2023).
- Dümcke, C.; Gnedovsky, M. The Social and Econoic Value of Cultural Heritage: Literature Review, July 2013, EENC Paper. Available online: https://www.interarts.net/descargas/interarts2557.pdf (accessed on 1 June 2023).
- Klamer, A. The Values of Archaeological and Heritage Sites. Public Archaeol. 2014, 13, 59–70. [Google Scholar] [CrossRef]
- ICOMOS 2021, Addendum Evaluations of Nominations of Cultural and Mixed Properties. ICOMOS Report for the World Heritage Committee. In Proceedings of the 44th Extended Session, Fuzhou (China), Online Meeting, 16–31 July 2021; WHC-21/44.COM/INF.8B1. Available online: https://whc.unesco.org/en/documents/187993 (accessed on 1 June 2023).
Figure 1.
Informing the local residents.

Figure 2.
Ways of informing local residents.

Figure 3.
Level of influence of local resident opinions on the project implementation.

Figure 4.
Usefulness of socio-economic indicators in informing local residents.

Figure 5.
Evaluation of indicators categories/subcategories.

Figure 6.
Evaluation of indicators categories in the State cities and municipal governments.

Table 1.
Structure of indicators.
| Category and Subcategory (Number of Indicators) | Measurement Area (Changes to Be Measured)/Predominantly Short/Long-Term Impact */Direct/Indirect Relation to Results | Currently Measured in Latvia in the Project Development Area |
|---|---|---|
| 1. Tourism development (27): 1.1. demand (8) 1.2. supply (15) 1.3. economic impact (4) | Flow of visitors, subsequently resulting in public economic benefits. 1.1. Short-term impact and direct relation 1.2.–1.3. Long-term impact and indirect relation | Number of local/foreign tourists visits (one or several day trips) × average amount left by the traveller per day; number of newly created services in supported cultural heritage sites |
| 2. Cultural activities (15) 2.1. demand (3) 2.2. supply (6) 2.3. economic impact (6) | Development of cultural life and related public economic benefits. 2.1.–2.2. Short-term impact and direct relation 2.3. Long-term impact and indirect relation | - |
| 3. Local production (8) | Local craftsmanship/food production and related public economic benefits. Long-term impact and indirect relation | - |
| 4. Social inclusion (7) | Involvement of local inhabitants (incl. less protected groups of people) in cultural activities, development of NGOs et al. in the field of culture. Long-term impact and indirect relation | - |
| 5. Real estate and infrastructure (12) | Construction (incl. public infrastructure), rent, buildings usage et al. areas, and related public economic benefits. Long-term impact and indirect relation | - |
| 6. Restoration of cultural property (8) | Condition of historic buildings and other sites, usage of sites et al. areas, and related public economic benefits. Short-term impact and direct relation | Number of supported cultural heritage sites |
| 7. Financial impact (3) | Changes in tax revenues (at both national and local level), income of local population, etc. Long-term impact and indirect relation | Benefits from tax revenue on jobs created in supported cultural heritage sites |
| 8. Well-being of the residents; Environment (8) | Level of local residents’ satisfaction in the field of public infrastructure, environment, employment, public revenues et al., as well as level of pride in belonging to particular territory. Long-term impact and indirect relation | - |
| 9. Education and science (6) | Scientific research, publications, heritage object-related education, student practice, etc. Long-term impact and indirect relation | - |
| 10. Mass media and social networks (2) | Mass media interest and social networks activity. Short-term impact and direct relation | - |
* Terms are conditional and refer to time limits of how soon after the completion of the project the socio-economic development affected by the results of the project will be identifiable. it is assumed that short-term is up to 1 year, long-term–more than 1 year (in some cases–several years).
Table 2.
Ranks of indicators categories/subcategories.
| Category and Subcategory | Applicability (a) | Data Accessibility (b) | Difference (a − b) | Average ((a + b)/2) | Rank by Average |
|---|---|---|---|---|---|
| Cultural activities (supply) | 2.39 | 2.42 | −0.03 | 2.41 | 1 |
| Restoration of cultural property | 2.44 | 2.31 | 0.13 | 2.37 | 2 |
| Tourism development (demand) | 2.49 | 2.24 | 0.25 | 2.37 | 3 |
| Mass media and social networks | 2.37 | 2.26 | 0.11 | 2.32 | 4 |
| Cultural activities (demand) | 2.28 | 2.12 | 0.16 | 2.20 | 5 |
| Tourism development (supply) | 2.14 | 2.26 | −0.12 | 2.20 | 6 |
| Wellbeing of the population; environment | 2.36 | 1.91 | 0.45 | 2.14 | 7 |
| Cultural activities (economic impact) | 2.04 | 1.96 | 0.08 | 2.00 | 8 |
| Social inclusion | 2.04 | 1.90 | 0.14 | 1.97 | 9 |
| Local production | 1.90 | 2.02 | −0.12 | 1.96 | 10 |
| Education and science | 1.89 | 1.86 | 0.03 | 1.87 | 11 |
| Financial impact | 1.77 | 1.75 | 0.02 | 1.76 | 12 |
| Tourism development (economic impact) | 1.89 | 1.62 | 0.27 | 1.75 | 13 |
| Real estate and infrastructure | 1.45 | 1.69 | −0.24 | 1.57 | 14 |
Respective values were established by Average function (sum of values/number of values where the lowest value equals 0 and the highest equals 3; empty responses were ignored; the number of responses regarding both “Applicability” and “Data accessibility” dimensions were equal). Dimension values that exceed the value of the other dimension by 10% are marked with Bold.
Table 3.
Top 10 indicators (ranked by total, applicability and data accessibility).
| Indicator | Unit of Measure | Average Score (Max = 3) | Rank (Out of 96 Indicators) | ||||
|---|---|---|---|---|---|---|---|
| Total | Applicability | Data Accessibility | Total | Applicability | Data Accessibility | ||
| 6.1. immovable cultural monuments in the territory of the municipality (distributed by type and significance) | number | 2.711 | 2.684 | 2.737 | 1 | 2 | 1 |
| 1.1.4. in-person visits to tourism information centres | number or % | 2.675 | 2.650 | 2.700 | 2 | 3 | 3 |
| 2.2.4. cultural institutions (including museums, galleries, theatres, etc.) | number or % | 2.658 | 2.579 | 2.737 | 3 | 5 | 2 |
| 1.1.1. visits to the site/designated area | number or % | 2.625 | 2.950 | 2.300 | 4 | 1 | 22 |
| 1.2.15. cultural heritage objects (hillforts, castles, castle ruins, historical buildings, etc.) that are accessible to visitors | number | 2.575 | 2.550 | 2.600 | 5 | 8 | 7 |
| 1.1.5. visits to the municipality’s tourism website (if possible, with data on cultural object (separating those that were covered by the projects) lookups in it) | number or % | 2.575 | 2.500 | 2.650 | 6 | 11 | 4 |
| 6.7. renovation/restoration projects of historical buildings and other cultural objects | number | 2.526 | 2.526 | 2.526 | 7 | 9 | 11 |
| 2.2.5. material exhibitions | number or % | 2.500 | 2.556 | 2.444 | 8 | 7 | 15 |
| 2.2.2. organized cultural events | number or % | 2.474 | 2.368 | 2.579 | 9 | 20 | 8 |
| 1.2.11. cultural objects included in the Latvian language materials of the tourism destination | number of copies per year; number of objects included | 2.466 | 2.300 | 2.632 | 10 | 34 | 5 |
| 10.1. reports, broadcasts, publications in the mass media | number | 2.447 | 2.526 | 2.368 | 11 | 10 | 18 |
| 1.2.12. cultural objects included in the foreign language materials of the tourism destination | number of copies per year; number of objects included | 2.425 | 2.300 | 2.550 | 13 | 35 | 9 |
| 4.7. song, dance, etc. collectives that operate in (use) cultural objects | number | 2.421 | 2.211 | 2.632 | 14 | 43 | 6 |
| 1.1.3. domestic visitors | number or % | 2.325 | 2.600 | 2.050 | 21 | 4 | 50 |
| 3.4. licenses issued for trade during cultural events (e.g., holidays, festivals, etc.). | number or % | 2.275 | 2.000 | 2.550 | 28 | 57 | 10 |
| 8.1. residents who are satisfied with the supply of cultural services | % | 2.263 | 2.579 | 1.947 | 30 | 6 | 58 |
| Indicator is in all three tops | |||||||
| Indicator is in two tops | |||||||
| Indicator is in one top only (either in the top by applicability or data accessibility) | |||||||
The serial number of the indicator shows its belonging to the particular unifying category and/or subcategory of indicators. The indicators marked in italic are the ones partially corresponding to the current project evaluation criteria, provided for in the legislative acts (including methodologies and guidelines).
Disclaimer/Publisher’s Note: The statements, opinions and data contained in all publications are solely those of the individual author(s) and contributor(s) and not of MDPI and/or the editor(s). MDPI and/or the editor(s) disclaim responsibility for any injury to people or property resulting from any ideas, methods, instructions or products referred to in the content. |
© 2023 by the authors. Licensee MDPI, Basel, Switzerland. This article is an open access article distributed under the terms and conditions of the Creative Commons Attribution (CC BY) license (https://creativecommons.org/licenses/by/4.0/).
Share and Cite
MDPI and ACS Style
Kairiss, A.; Geipele, I.; Olevska-Kairisa, I. Sustainability of Cultural Heritage-Related Projects: Use of Socio-Economic Indicators in Latvia. Sustainability 2023, 15, 10109. https://doi.org/10.3390/su151310109
AMA Style
Kairiss A, Geipele I, Olevska-Kairisa I. Sustainability of Cultural Heritage-Related Projects: Use of Socio-Economic Indicators in Latvia. Sustainability. 2023; 15(13):10109. https://doi.org/10.3390/su151310109
Chicago/Turabian StyleKairiss, Andris, Ineta Geipele, and Irina Olevska-Kairisa. 2023. "Sustainability of Cultural Heritage-Related Projects: Use of Socio-Economic Indicators in Latvia" Sustainability 15, no. 13: 10109. https://doi.org/10.3390/su151310109
Note that from the first issue of 2016, this journal uses article numbers instead of page numbers. See further details here.