
Evaluation of MSWX Bias-Corrected Meteorological Forcing Datasets in China
by
 , and
, and
Hai Lin
1,2,
Yi Yang
1,2,
Shuguang Wang
1,2,
Shuyu Wang
2,
Jianping Tang
1,2,3,* and
Guangtao Dong
3 1
Key Laboratory of Mesoscale Severe Weather/Ministry of Education, Nanjing University, Nanjing 210023, China
2
School of Atmospheric Sciences, Nanjing University, Nanjing 210023, China
3
Key Laboratory of Citie’s Mitigation and Adaptation to Climate Change in Shanghai, China Meteorological Administration, Shanghai 200030, China
*
Author to whom correspondence should be addressed.
Sustainability 2023, 15(12), 9283; https://doi.org/10.3390/su15129283
Submission received: 12 April 2023
/
Revised: 21 May 2023
/
Accepted: 6 June 2023
/
Published: 8 June 2023
(This article belongs to the Special Issue The Impacts of East Asian Monsoon on Precipitation: Observation, Mechanism and Prediction)
Abstract
:Near-surface meteorological forcing (NSMF) datasets, mixed observations, and model forecasts are widely used in global climate change and sustainable development studies. For practical purposes, it is important to evaluate NSMF datasets, especially those released latest, and determine their strengths and limitations. In this study, we evaluate the performance of Multi-Source Weather (MSWX) in China over the period of 1979–2016. For comparison, ECMWF Reanalysis version 5 (ERA5), China Meteorological Forcing Dataset (CMFD) and Princeton Global Forcing (PGF) dataset are also evaluated to determine the strengths and weaknesses of MSWX. The following variables are compared with observations over 2400 stations: 2 m air temperature (T2m), 2 m daily maximum air temperature (Tmax), 2 m daily minimum air temperature (Tmin), precipitation (P), and 10 m wind speed (V10). The evaluation is conducted in terms of climatology, inter-annual variations and seasonal cycles. Results show that MSWX reasonably reproduces the spatial pattern of T2m with root-mean-square errors (RMSEs) below 1.12 °C and spatial correlations above 0.97, but underestimates Tmax and overestimates Tmin, with biases ranging from −2.0 °C to 2.0 °C, especially over the North China and Northeast China. Compared with ERA5 and PGF, MSWX can better simulate the inter-annual variations of surface air temperature with high spatial correlations (>0.97) but shows higher RMSEs than PGF. For precipitation, MSWX accurately captures the primary features of precipitation, including significant characteristics or patterns of the precipitation climatology and inter-annual variation. Its inter-annual variation shows low RMSEs ranging from 0.55 mm/day to 0.8 mm/day, compared to ERA5 and PGF. However, regions with abundant precipitation exhibit higher biases. Because the biased Global Wind Atlas (GWA3.1) is used for the wind bias correction of MSWX, MSWX significantly overestimates the annual mean wind speed, but it is consistently well-correlated with observations, with RMSEs less than 1.5 m/s and spatial correlations greater than 0.6 over the period of 1979–2016. This study reveals both the advantages and disadvantages of MSWX, and indicates the need for research into climate change and sustainable development in East Asia.
1. Introduction
Climate change is closely related to human sustainable development. Green and sustainable development will improve the stability of social production and reduce financial fluctuations [1]. Therefore, it is necessary to understand global climate change. Meteorological datasets are a great way to understand climate change and are widely used. There are typically two types of gridded meteorological forcing datasets: one is derived from reanalysis products using assimilation techniques, and the other one is generated using data blending methods, such as interpolation. Reanalysis datasets are the result of combining state-of-the-art numerical weather prediction or climate models with the data assimilation of historical observations [2]. There are many global meteorological forcing datasets that exist from global reanalysis, such as the National Centers for Environmental Prediction and the National Center for Atmospheric Research reanalysis (NCEP/NCAR) [3], the European Centre for Medium-Range Weather Forecasts (ECMWF) interim reanalysis (ERA-Interim) [4] and the fifth-generation reanalysis (ERA5) [5]). The other type of meteorological forcing datasets is generated using interpolation algorithms that consider elevation based on in situ observations, such as Princeton Global Forcing dataset [6] and China Meteorological Forcing Dataset (CMFD) [7]. These two kinds of datasets have inherent uncertainties that arise from the parameterization of physical processes, observational uncertainties, and data assimilation procedures [8]. These datasets can help researchers to generate higher-resolution datasets and better understand the relationship between climate change and sustainability [9]. Moreover, they can help governments to assess the impact of meteorological variables such as temperature, precipitation and wind speed on the economy and finance [10], as well as on water resource planning and production, such as “the South-to-North Water Diversion Project”. Therefore, it is necessary to evaluate the gridded meteorological forcing datasets before using them [11].
Many studies have been carried out to validate gridded meteorological forcing datasets. By comparing the ECMWF reanalysis datasets with the observations, Nogueira [12] showed that ERA5 had lower errors than ERA-Interim but overestimated precipitation, whereas Zou et al. [13] found that ERA5-Land hourly temperature had generally high accuracy but performed worse at high temperatures than at low temperatures. Yu et al. [14] evaluated the performances of five sets of reanalysis datasets in reproducing the climatological mean and inter-annual variation in near-surface wind speed in China, and found that reanalysis datasets can reasonably reproduce the spatial distribution of the climatology of near-surface wind speed. There are also several studies that focus on evaluating the performance of gridded meteorological forcing based on the blending of observations. Yang et al. [15] evaluated precipitation and shortwave radiation from different gridded forcing datasets over the major land areas of China. They found that CMFD performed well in producing annual mean precipitation and captured key features of the spatial distribution of shortwave radiation. Xie [16] evaluated the accuracy and reliability of CMFD meteorological forcing datasets for precipitation, surface air temperature and wind speed over the Tibetan Plateau. The results showed that CMFD had a higher level of accuracy and reliability in reproducing the observed meteorological variables than reanalysis. The evaluation of these datasets is crucial for researchers, particularly when it comes to untested or newly released datasets. Evaluating these datasets can provide a better understanding of the inherent uncertainty and precision of climate models, which in turn can enhance their effectiveness in weather forecasting.
Multi-Source Weather (MSWX) is a seamless global gridded near-surface meteorological product. Recently developed and released by Beck et al. (2022) [17], it consists of four sub-products, including MSWX-Past, MSWX-NRT, MSWX-Mid, and MSWX-Long. MSWX-Past is derived by bias-correcting the ERA5 reanalysis based on high-resolution monthly or annual reference climatologies. It is available at a spatial resolution of 0.1° × 0.1° and a temporal resolution of 3 h. The MSWX-Past product includes 10 widely used near-surface meteorological variables. It blends gauge, satellite, and reanalysis data to improve precipitation estimates, and it is compatible with the global Multi-Source Weighted-Ensemble Precipitation (MSWEP). To date, few studies have evaluated the performance of MSWX-Past over China.
In this study, the near-surface meteorological variables such as air temperature, wind speed and precipitation, which were derived from MSWX-Past dataset over China, will be evaluated using high-density in situ observations, and compared with those from the ERA5, PGF and CMFD datasests. The remainder of the paper is organized as follows: Section 2 describes the study area, observations and near-surface meteorological forcing datasets, as well as the analysis methods. Section 3 presents the results and discussion. Conclusions are given in Section 4.
2. Data and Methods
2.1. Observation Dataset
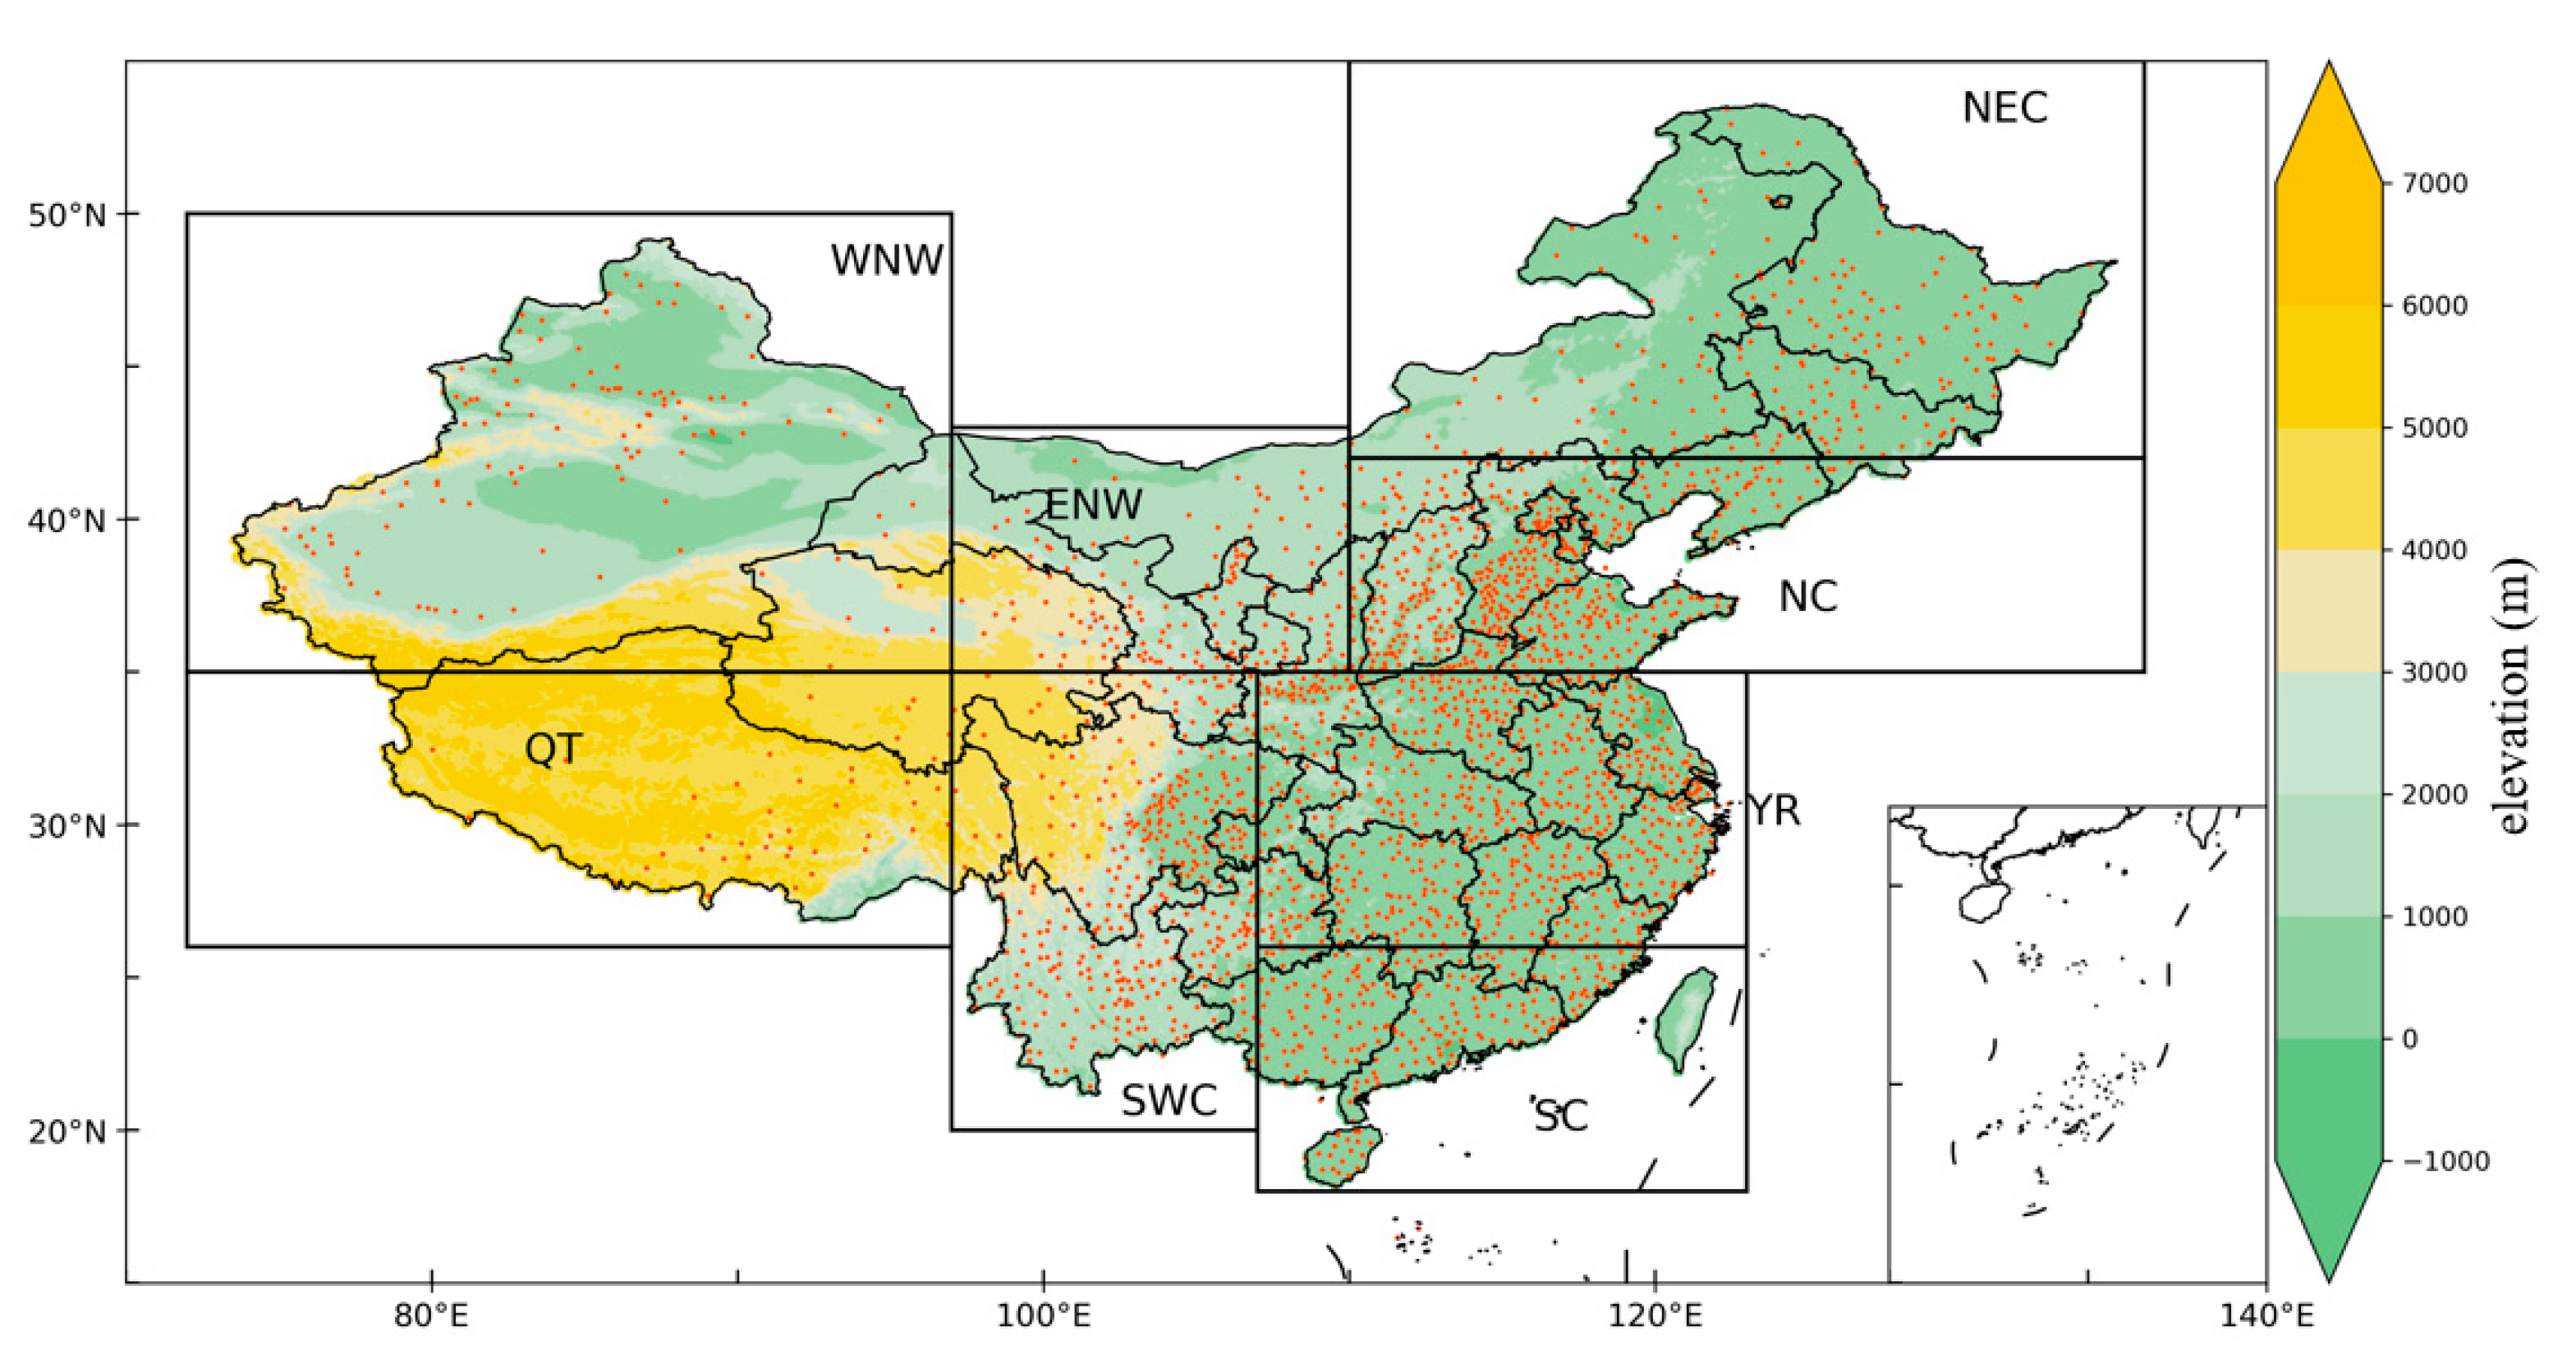
The observation dataset, which includes more than 2400 in situ observations in China, is obtained from China Meteorological Administration (CMA) (http://data.cma.cn/ (accessed on 1 May 2023)). The dataset provides variables including 2 m air temperature, 10 m wind speed and precipitation from 1979–2014. These observational records have undergone strict control and are reliable (Lu et al. 2014; Qian et al. 2007) [18,19]. The dataset has been widely used to evaluate reanalysis and gridded meteorological forcing [20]. Figure 1 shows the location of observational stations in China. Considering the topography and regional climate, eight sub-regions including Northeast China (NEC; north of 42.5° N, east of 110° E), North China (NC; 35° N–42.5° N, east of 110° E), Yangtze River (YR; 27.5° N–35° N, east of 107.5° E), South China (SC; south of 27.5° N, east of 107.5° E), Southwest China (SWC; south of 35° N, 97.5° E–107.5° E), the west of Northwest China (WNW; north of 35° N, west of 97.5° E), Qinghai–Tibet (QT; south of 35° N, west of 97.5° E) and the east of Northwest China (ENW; north of 35° N, 97.5° E–110° E), are used for evaluation [21,22].
2.2. Near-Surface Meteorological Forcing Datasets
Three variables, including air temperature, wind speed and precipitation, taken from four meteorological forcing datasets, namely, ERA5, PGF, MSWX, and CMFD, are evaluated against the observations.
ERA5 is the fifth-generation reanalysis from ECMWF. It provides hourly high-horizontal-resolution (0.25°) estimates for a large amount of land surface variables including precipitation, temperature, pressure, radiation, specific humidity, and wind. ERA5 applies the new IFS (Integrated Forecasting System) “Cy41r2” four-dimensional variational analysis (4D-var) and assimilates multiple observations from satellite or surface stations. Surface wind from land stations is not assimilated.
PGF provides precipitation, surface temperature and other near-surface meteorological variables that can be used to drive land surface models. It is constructed by blending reanalysis data with observations and is disaggregated in time and space. The PGF product (Version 3) has a high spatiotemporal resolution of 3-hourly and 0.25° globally for 1948–2016.
MSWX is a high-resolution bias-corrected near-surface meteorological product based on ERA5, with a horizontal high resolution of 0.1°. MSWX has a temporal resolution of 3 h and includes 10 widely used near-surface meteorological elements. It was released in 2021 and has barely been evaluated in detail over China.
CMFD is a high-spatial–temporal-resolution (0.1°, 3-hourly) near-surface meteorological dataset developed by the Institute of Qinghai-Tibet Plateau, Chinese Academy of Sciences. The dataset is produced through fusion of remote sensing data, reanalysis data and more than 700 in situ station observations. It contains seven near-surface meteorological variables, including precipitation, surface air temperature, surface wind speed and others, but not surface air maximum temperature and surface air minimum temperature.
Table 1 lists the datasets and variables which includes 2 m air temperature (T2m), maximum air temperature (Tmax), minimum air temperature (Tmin), 10 m wind speed () and precipitation (P) used in this study. Due to the elevation difference between the gridded datasets and in situ station observations, it is necessary to correct the surface air temperature using the temperature lapse rate (0.0065 °C/m).
2.3. Evaluation Methods
Three metrics, including bias, root-mean-square error (RMSE) and Pearson correlation coefficient (CC), are used to assess the skill of various datasets.
Bias can show the skew between reanalysis and observations. Zero bias indicates a perfect fit, a bias greater than zero means overestimation, and one less than zero means underestimation.
RMSE is widely used in model evaluation as an indicator of error spread. Low RMSE means good performance, and high RMSE means poor performance.
CC is a measure of the degree of similarity between two datasets, with values ranging from −1 to 1. The larger the absolute value of CC is, the stronger the correlation between the two datasets will be; the closer CC is to 0, the weaker the correlation between the two datasets.
where is the site observation value, is the value of analysis data, is the mean of , and m is the total number of samples that participate in inspection.
3. Results
In this section, the systematic errors in the meteorological forcing datasets are investigated. The surface meteorological variables, such as 2 m air temperature (T2m), maximum air temperature (Tmax), minimum air temperature (Tmin), 10 m wind speed (), and precipitation (P), are evaluated with in situ observations during 1979–2016. All the gridded meteorological forcing datasets are interpolated to the observation stations using bilinear interpolation.
3.1. Surface Air Temperature
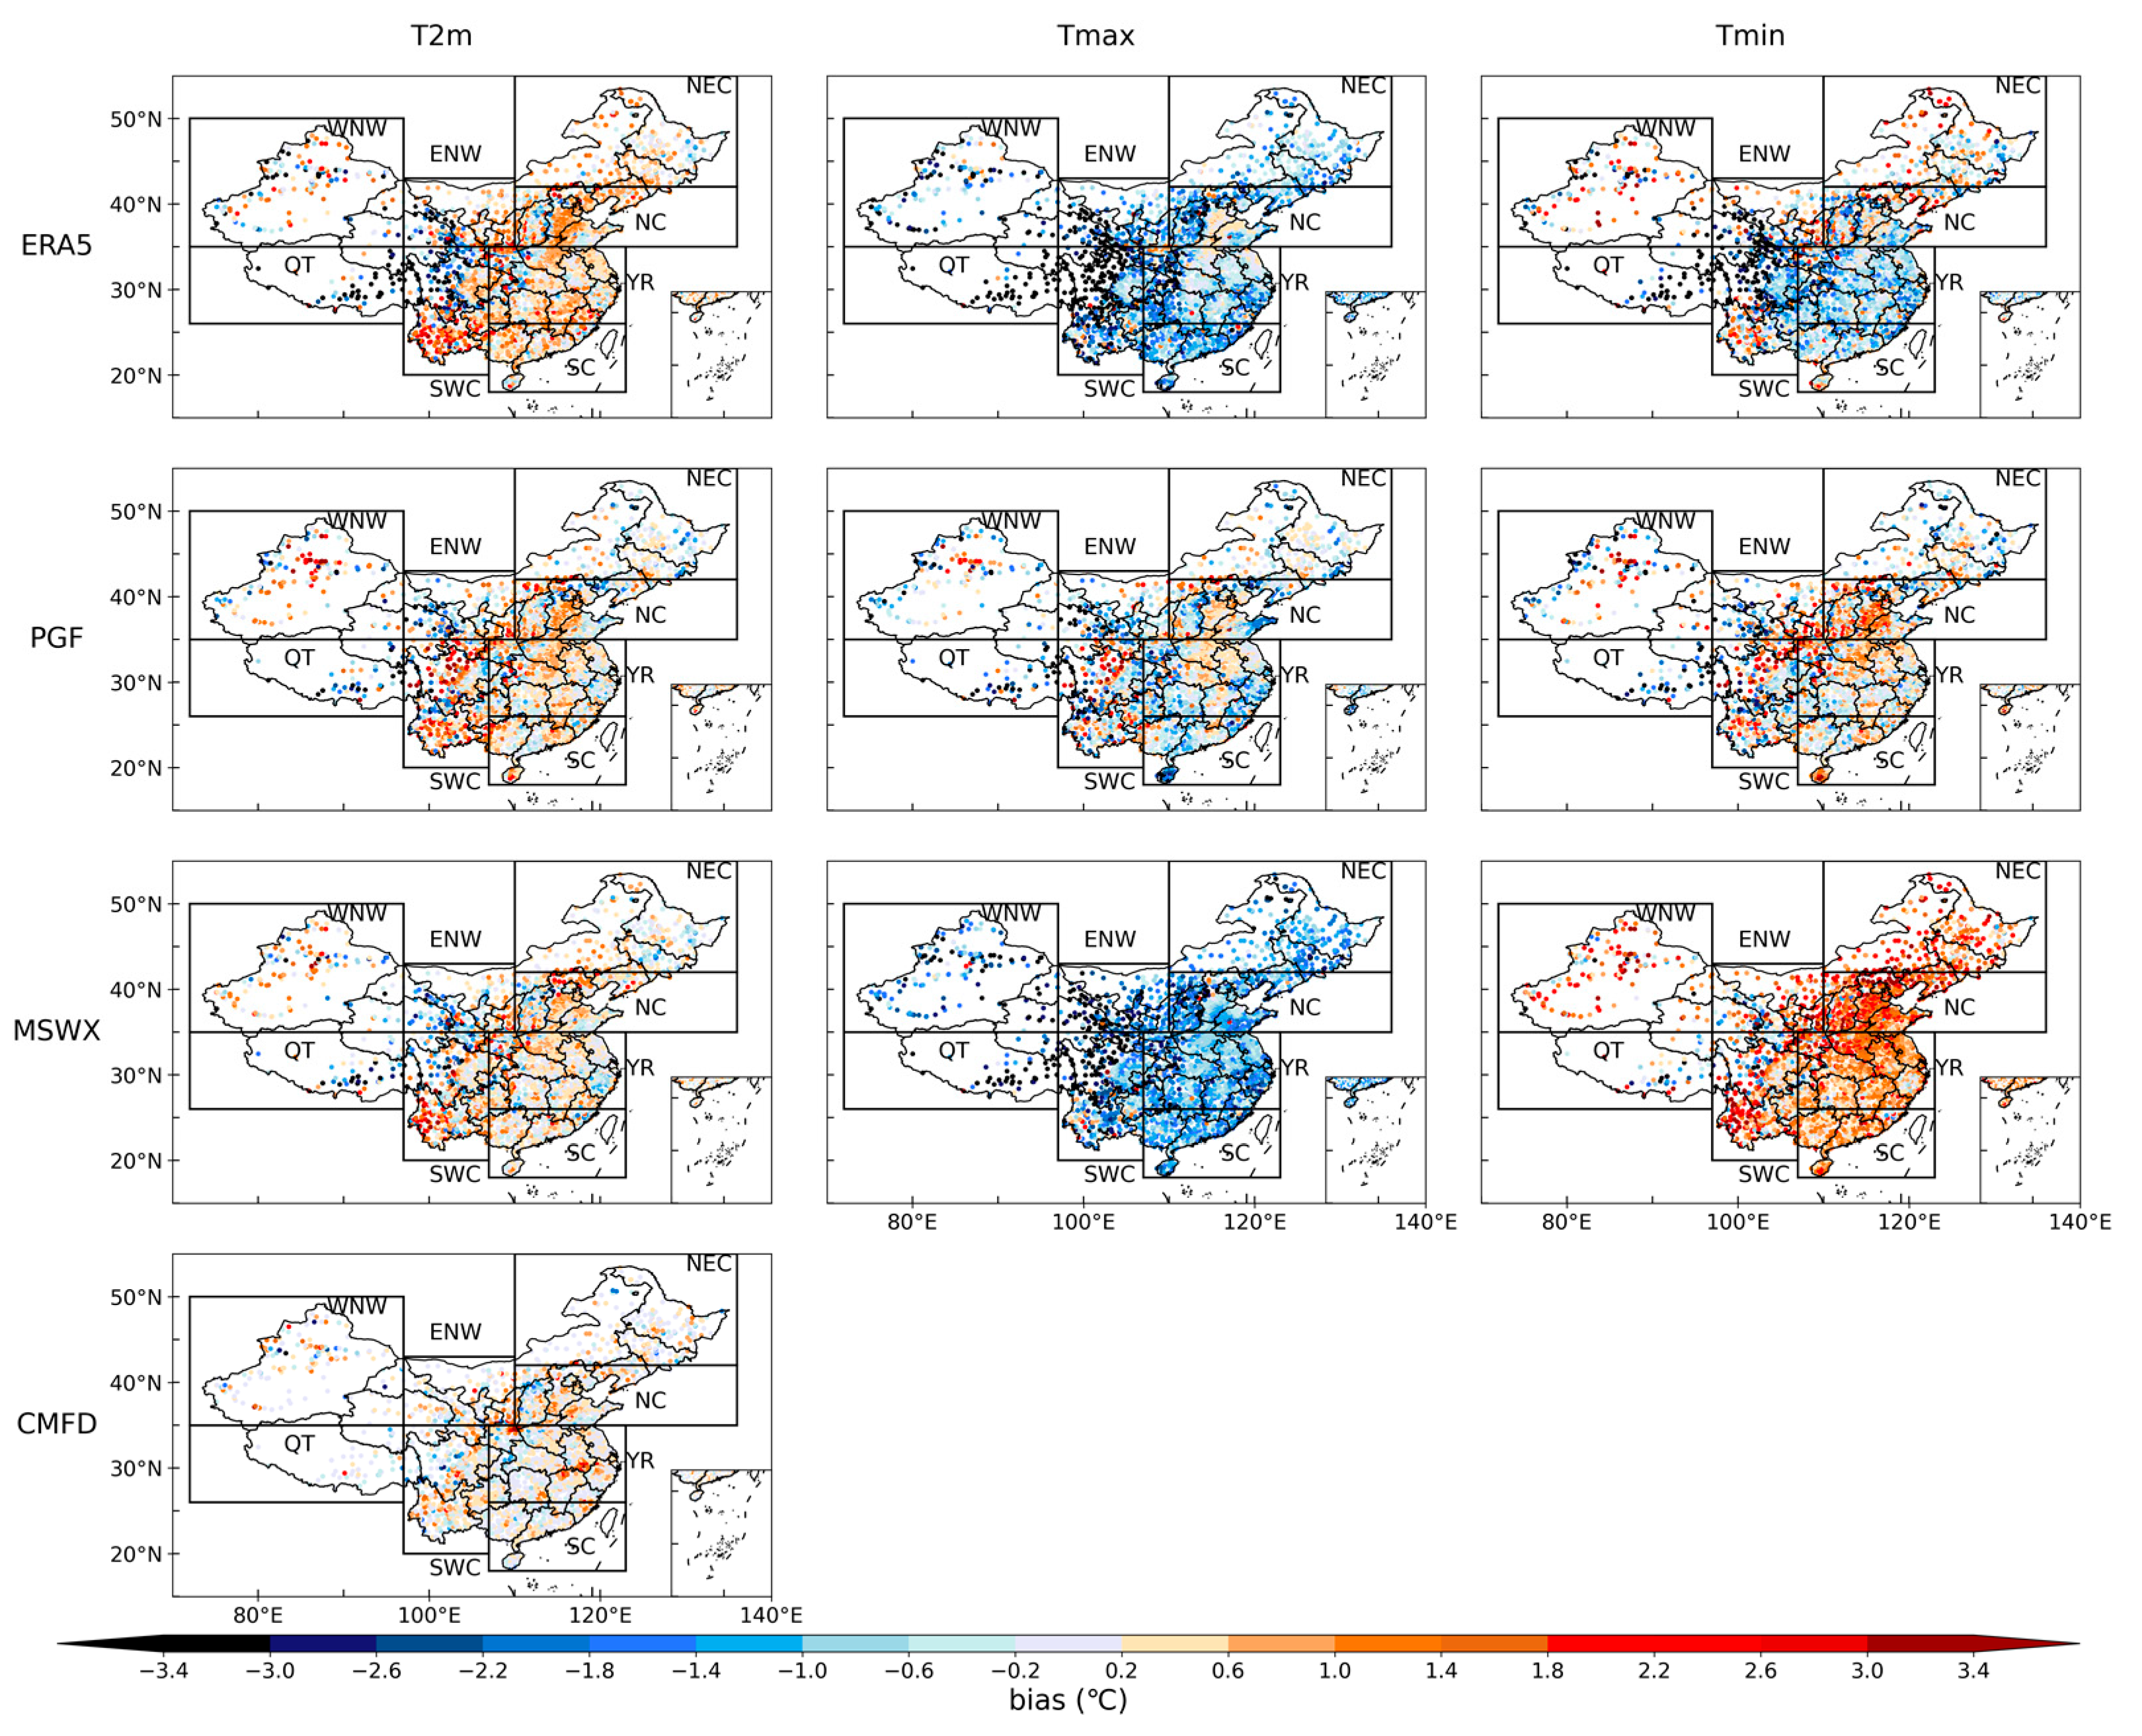
Figure 2 shows the spatial distribution of biases of a 37 year (1979–2016) annual mean T2m from the NSMF datasets. All the NSMF datasets can reproduce the distribution of T2m, with the biases ranging from −2.0 °C to 2.0 °C. Except for ERA5, the spatial correlation coefficient (SCC) of annual mean T2m between NSMF datasets and in situ observations are all above 0.97, and the RMSEs are below 1.40 °C (Table 2). Being derived from the station observations, CMFD shows the best performance in producing the distribution of T2m. ERA5 significantly underestimates T2m over the Tibetan Plateau, with cold biases reaching −3.0 °C, whilst MSWX reduces the biases and has lower RMSEs compared with ERA5. For Tmax, cold biases exist in ERA5 and MSWX, especially for ERA5, where there are cold biases of up to −3.0 °C over western China. MSWX can reduce the biases over western China and reduce the RMSEs, but its use increases the biases over NC and NEC. PGF has the best performance in producing the distribution of Tmax, with the lowest RMSE of about 1.22 °C. All NSMF datasets can reproduce the spatial pattern of annual mean Tmin, with high SCC (0.97) and low RMSE below 1.80 °C. ERA5 underestimates Tmin over most regions of China, whilst MSWX shows warm biases, especially over NC. Table 2 also lists the SCCs and RMSEs of seasonal mean surface air temperature between NSMF datasets and station observations. All the NSMF datasets can reproduce the spatial distribution of seasonal mean surface air temperature well, with high SCCs and low RMSEs. CMFD exhibits the lowest RMSEs, which are all below 1.0 °C for seasonal mean T2m, whilst ERA5 presents the highest RMSEs for seasonal mean T2m, especially in spring and winter. Compared with ERA5, MSWX can significantly reduce the RMSEs of T2m, Tmax and Tmin, especially in the cold season.
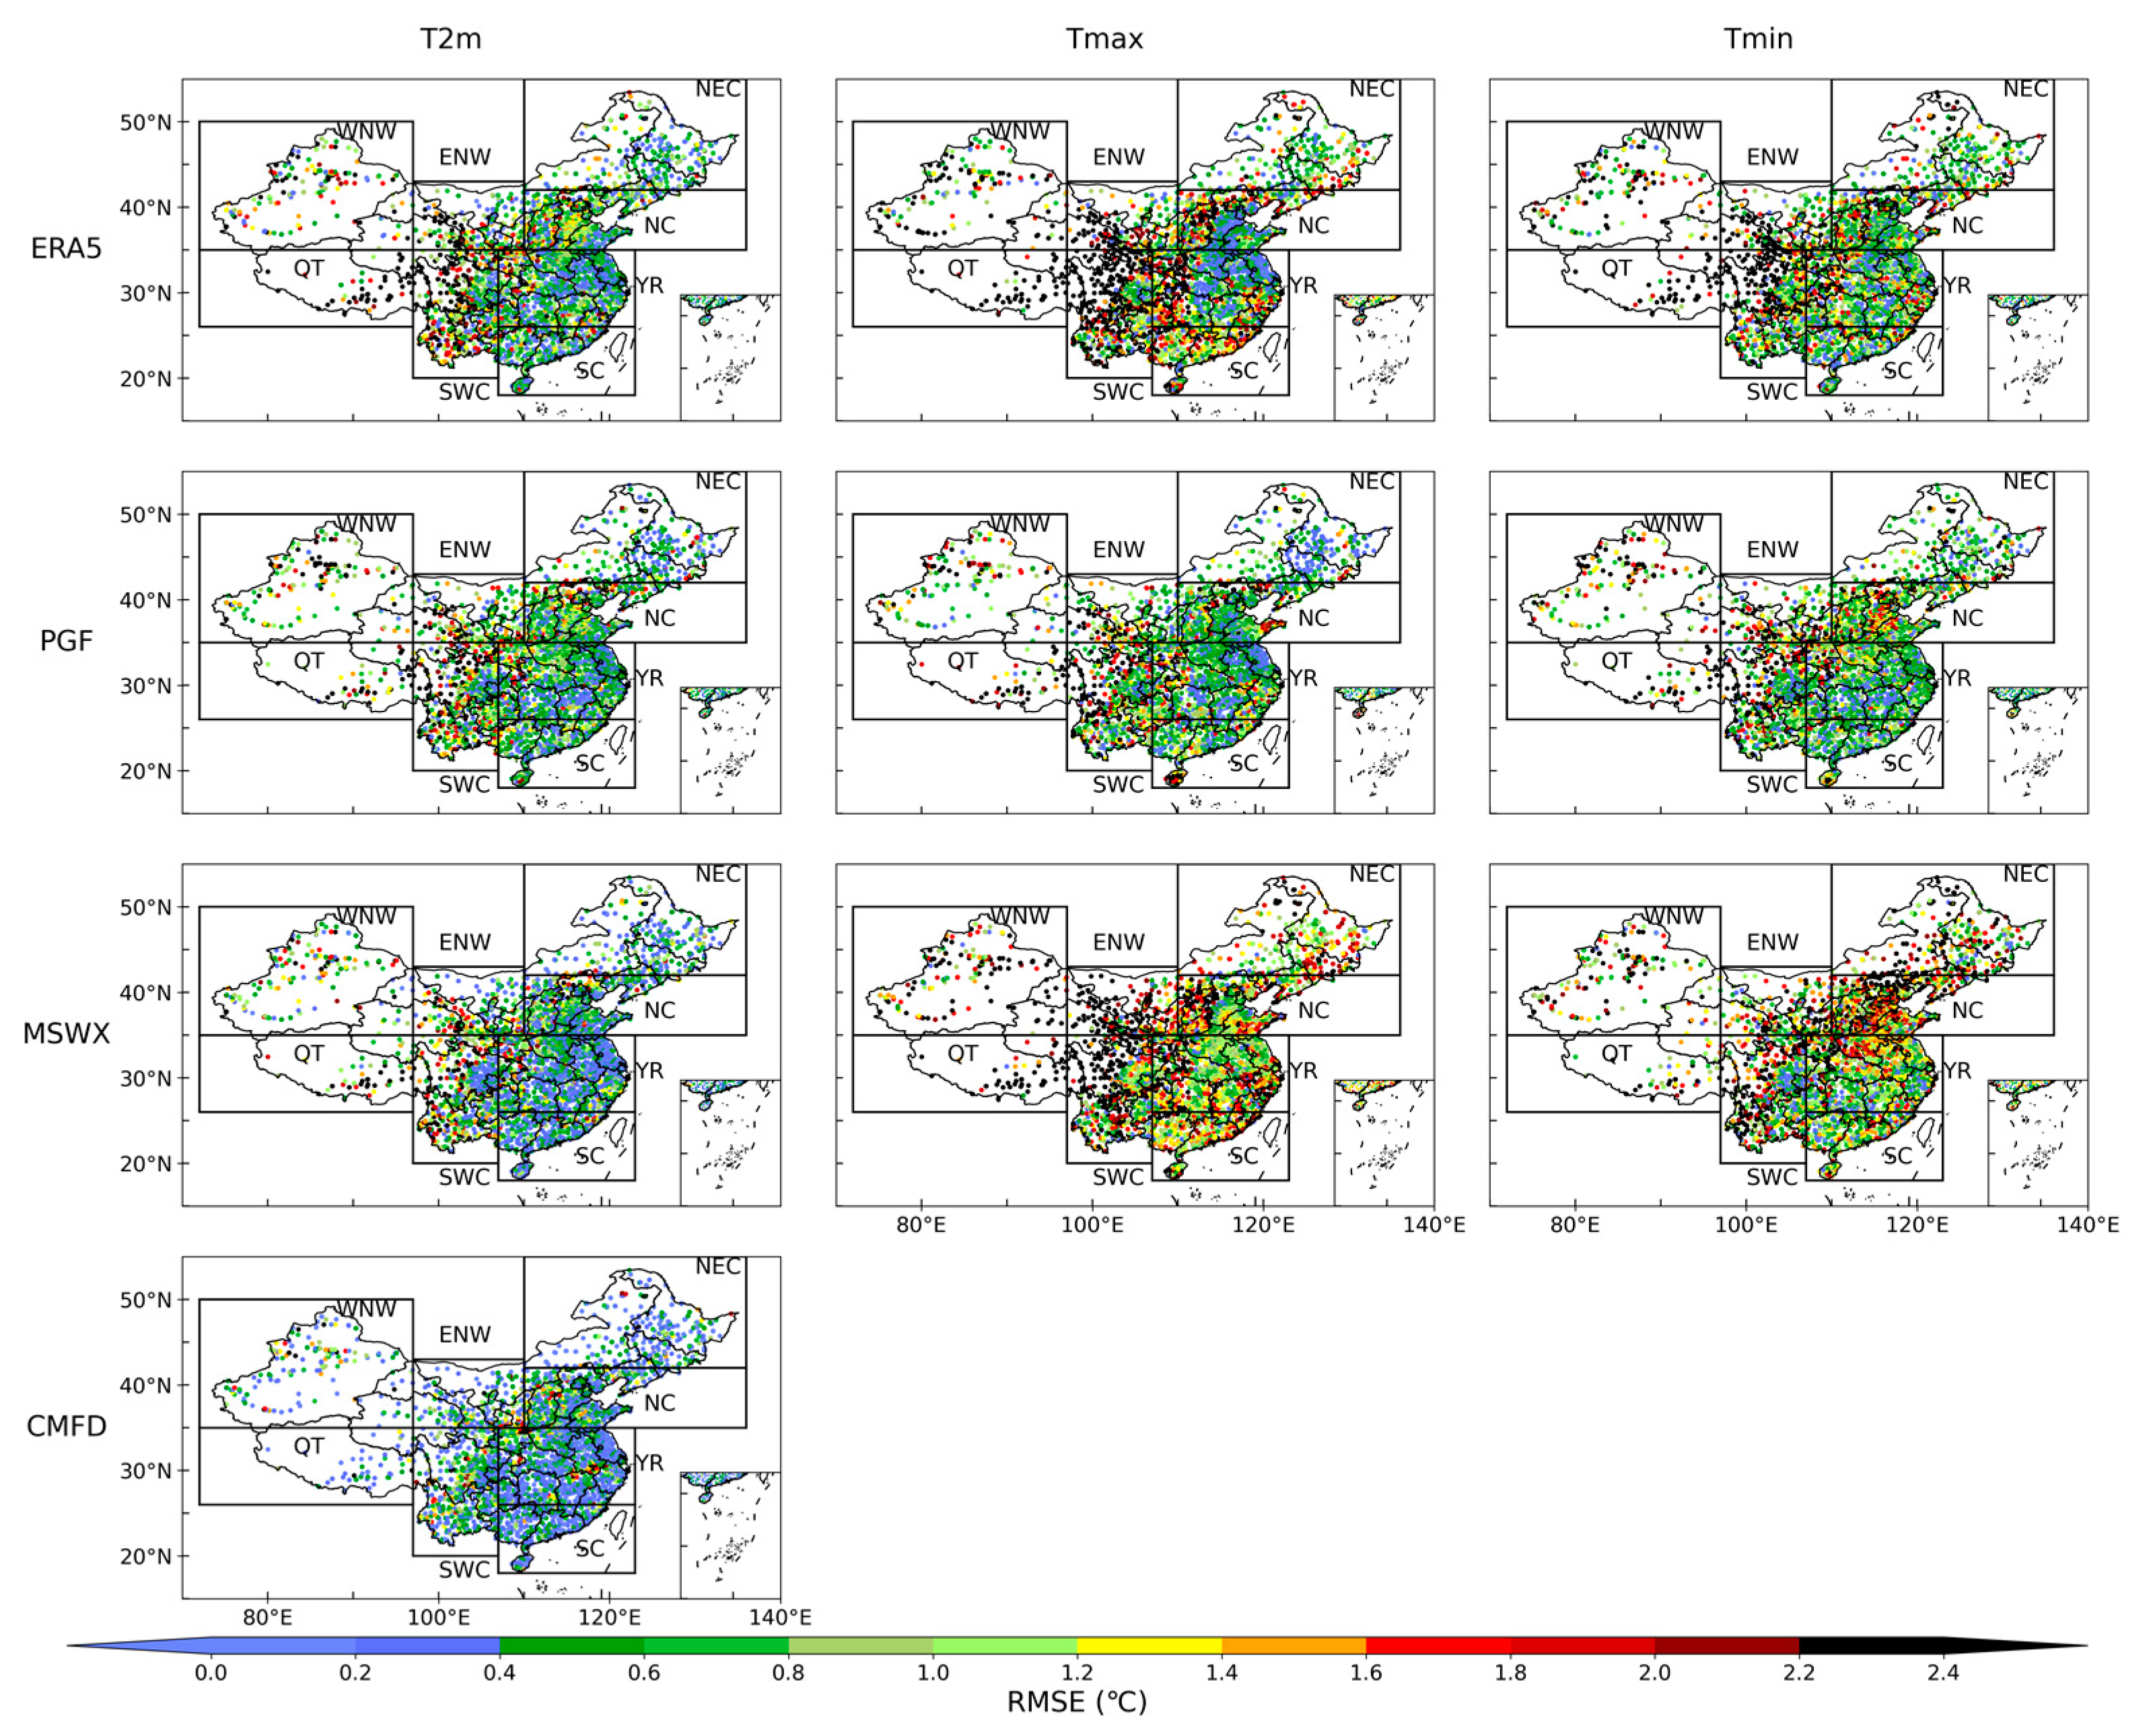
To evaluate the capability of NSMF datasets to produce the variation in annual mean surface air temperature, the RMSEs between NSMF datasets and in situ observations are calculated at each station and shown in Figure 3. CMFD is good at producing the variation in annual mean T2m, with most of the RMSEs being lower than 0.4 °C over China. MSWX also shows small RMSEs (<0.4 °C) over eastern China, but has large RMSEs (>2.0 °C) over western China. ERA5 and PGF produce larger RMSEs than MSWX and CMFD, especially over western China and northern China. For the variation in annual mean Tmax, ERA5 can reproduce the variability over the Yangtze–Huaihe River basin with RMSEs below 0.4 °C. However, ERA5 clearly overestimates the variation in annual mean Tmax over other regions in China, especially over western China, where the RMSEs can be larger than 2.4 °C. MSWX produces a similar distribution of RMSEs to ERA5 but reduces the RMSEs over SC and increases the RMSEs over NEC. PGF shows the best skill in producing the variation in annual mean Tmax, with the lowest RMSEs. For Tmin, MSWX produces low RMSEs below 0.8 °C over southern China, but it has large RMSEs above 1.6 °C over northern China. ERA5 and PGF can reproduce the variation over southeastern China with low RMSEs, although they both have large RMSEs over western China.
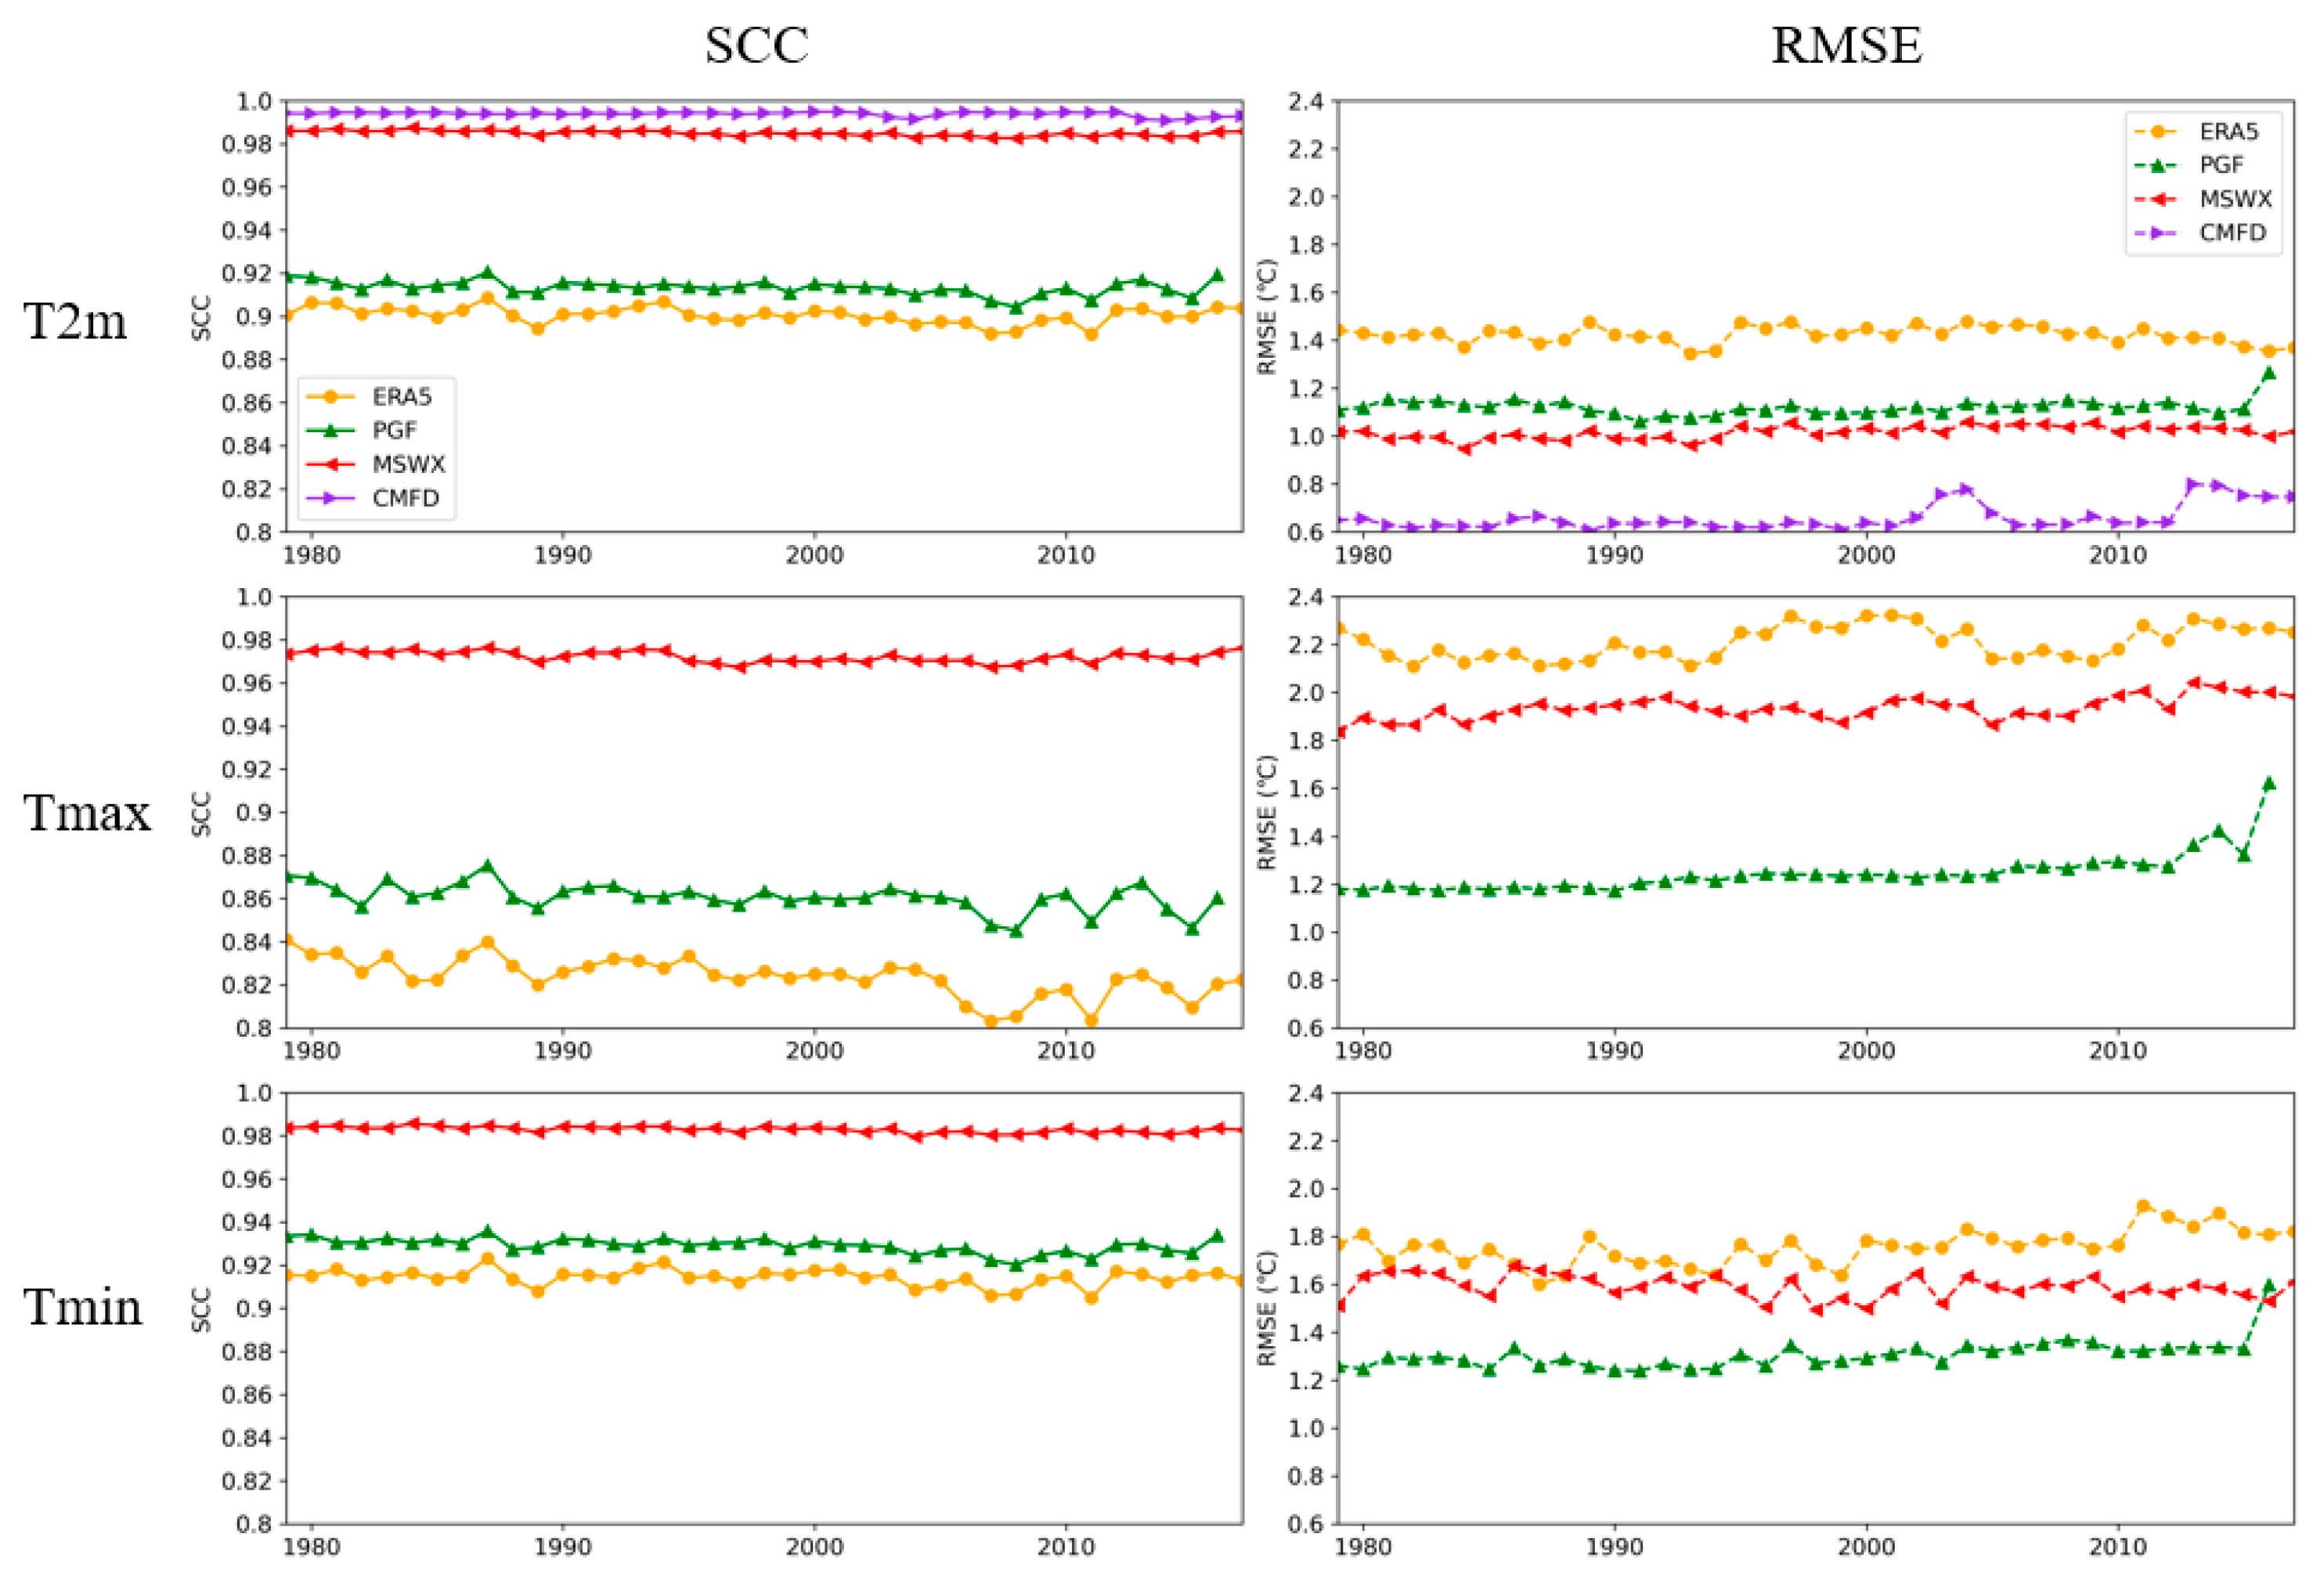
Figure 4 shows the inter-annual variability of SCC and RMSE in terms of regional averaged annual mean surface air temperature between NSMF datasets and observations during 1979–2016. For T2m, both CMFD and MSWX show high SCCs (>0.98) during this period, whereas PGF and ERA5 have relatively low SCCs, ranging from 0.90 to 0.92. CMFD produces the lowest RMSEs, being below 0.7 °C, and ERA5 has the largest RMSEs each year. PGF has larger RMSEs than MSWX, and this was especially on show in 2015. SCCs of MSWX for Tmax remain above 0.97 over the study period, whilst the SCCs of ERA5 and PGF are all below 0.9. PGF shows the lowest RMSEs of Tmax, with most values being below 1.4 °C. MSWX produces lower RMSEs than ERA5, but most RMSEs of MSWX are higher than 1.8 °C. Similar to Tmax, MSWX has the highest SCCs for Tmin, whilst ERA5 has the lowest SCCs. For Tmin, the RMSEs of MSWX (primarily between 1.5 °C and 1.7 °C) are higher than those of PGF over the period, whilst the RMSEs of ERA5 can reach about 2.0 °C and are substantially larger than those of other datasets. MSWX shows the highest SCCs and relatively low RMSEs among all NSMF datasets and exhibits a good spatiotemporal consistency over this period. Generally, compared to ERA5, MSWX can improve the simulation of the inter-annual variation in surface air temperature.
3.2. Precipitation
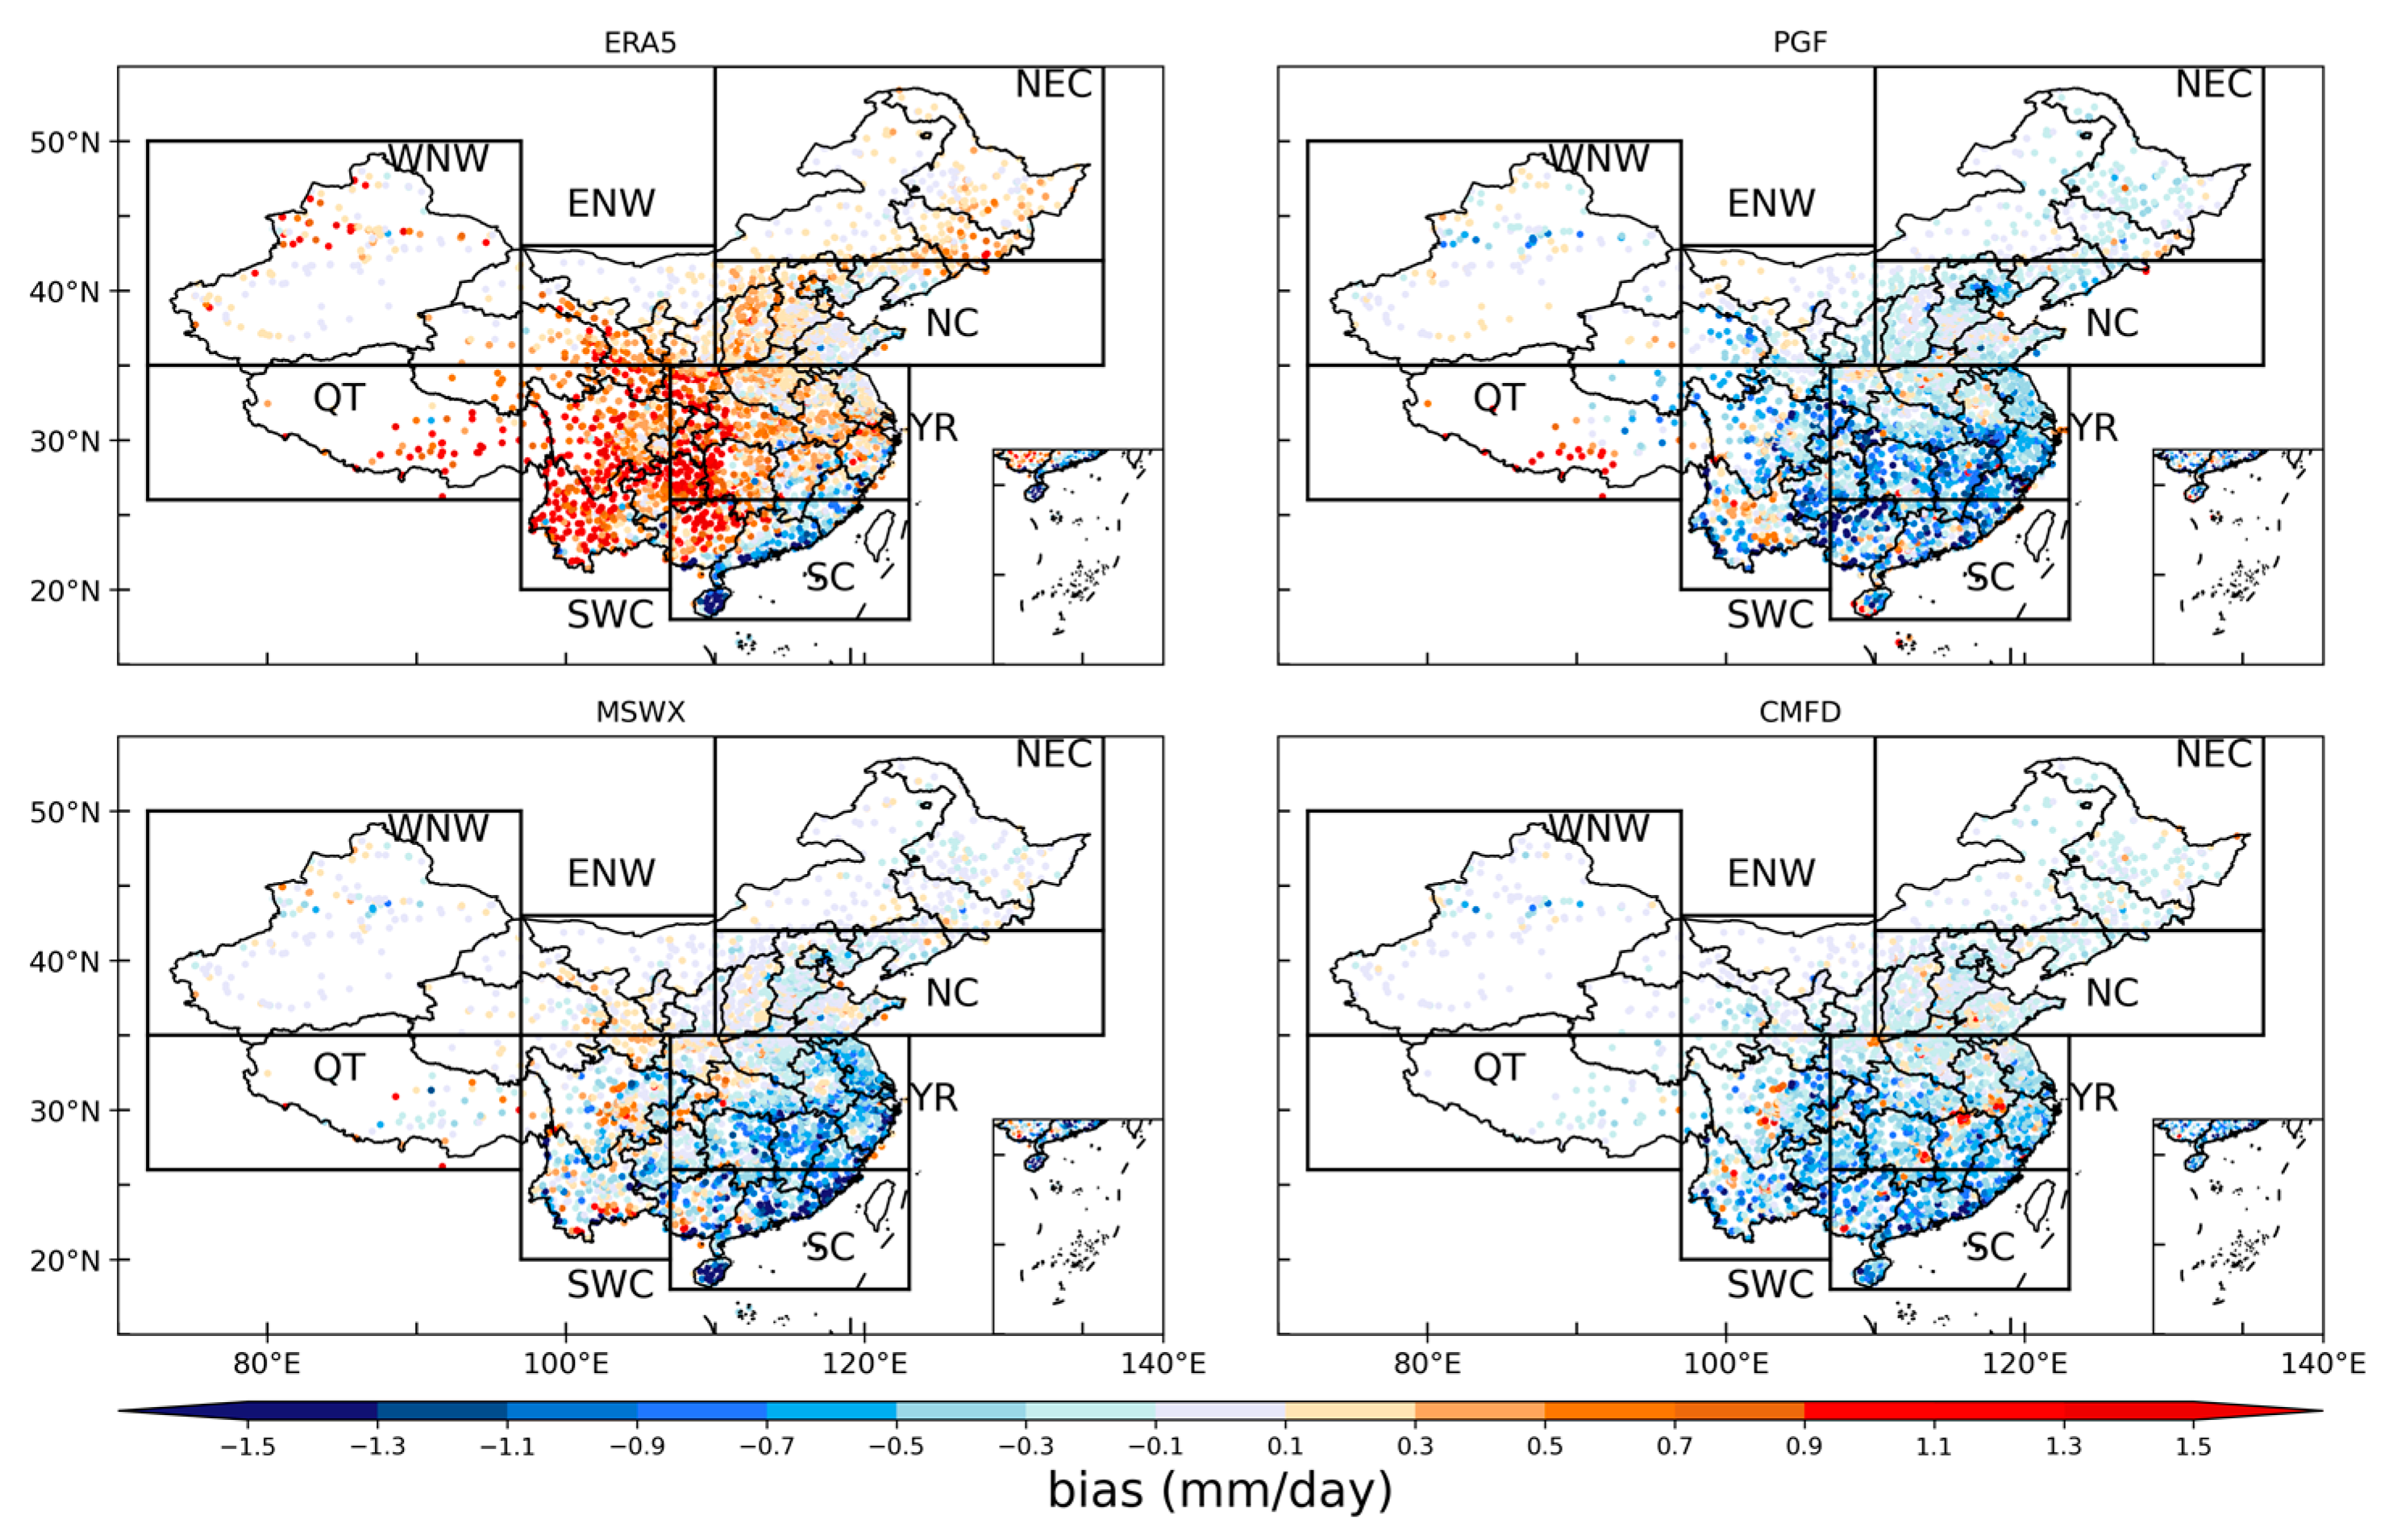
Figure 5 presents the spatial distribution of biases of annual mean precipitation between NSMF datasets and in situ observations over the 37 years period. It is clear that ERA5 overestimates precipitation over most parts of China except, for the coastal area of South China. The largest wet biases of ERA5 are located over southwestern China, with biases above 1.5 mm/day.
The PGF dataset has dry biases throughout China, except for the Tibetan Plateau and Yunnan province, and the dry biases can reach up to −1.3 mm/day over the Yangtze River basin. MSWX can reproduce the spatial pattern of annual mean precipitation with SCC of 0.93 and RMSE of 0.64 mm/day and also shows better performance than ERA5 (SCC of 0.87 and RMSE of 0.89 mm/day) (Table 3). The dry biases of MSWX primarily exist over southeastern China, especially along the coastal regions, and are above 1.1 mm/day. By fusing the ground-based observations with several gridded datasets from remote sensing and reanalysis, CMFD shows the best performance in producing the spatial distribution of annual mean precipitation, with the highest SCC (0.94) and lowest RMSE (0.6 mm/day), although it slightly underestimates the precipitation over China, with biases below 1.1 mm/day.
For all datasets, SCCs of annual mean precipitation are above 0.87, and RMSEs are below 0.89 mm/day throughout the study period, indicating that all the NSMF datasets can reasonably reproduce the distribution of annual mean precipitation (Table 3). CMFD has the lowest RMSE and highest SCC, whereas MSWX outperforms ERA5 with lower RMSE (0.64 mm/day) and higher SCC (0.93). For seasonal mean precipitation, all the NSMF datasets can produce the spatial distribution of precipitation in spring with high SCCs above 0.94 and low RMSEs below 1.0 mm/day. In contrast, the performance is relatively poor for summer mean precipitation, especially for ERA5 and PGF, which have RMSEs larger than 1.4 mm/day and SCCs below 0.86.
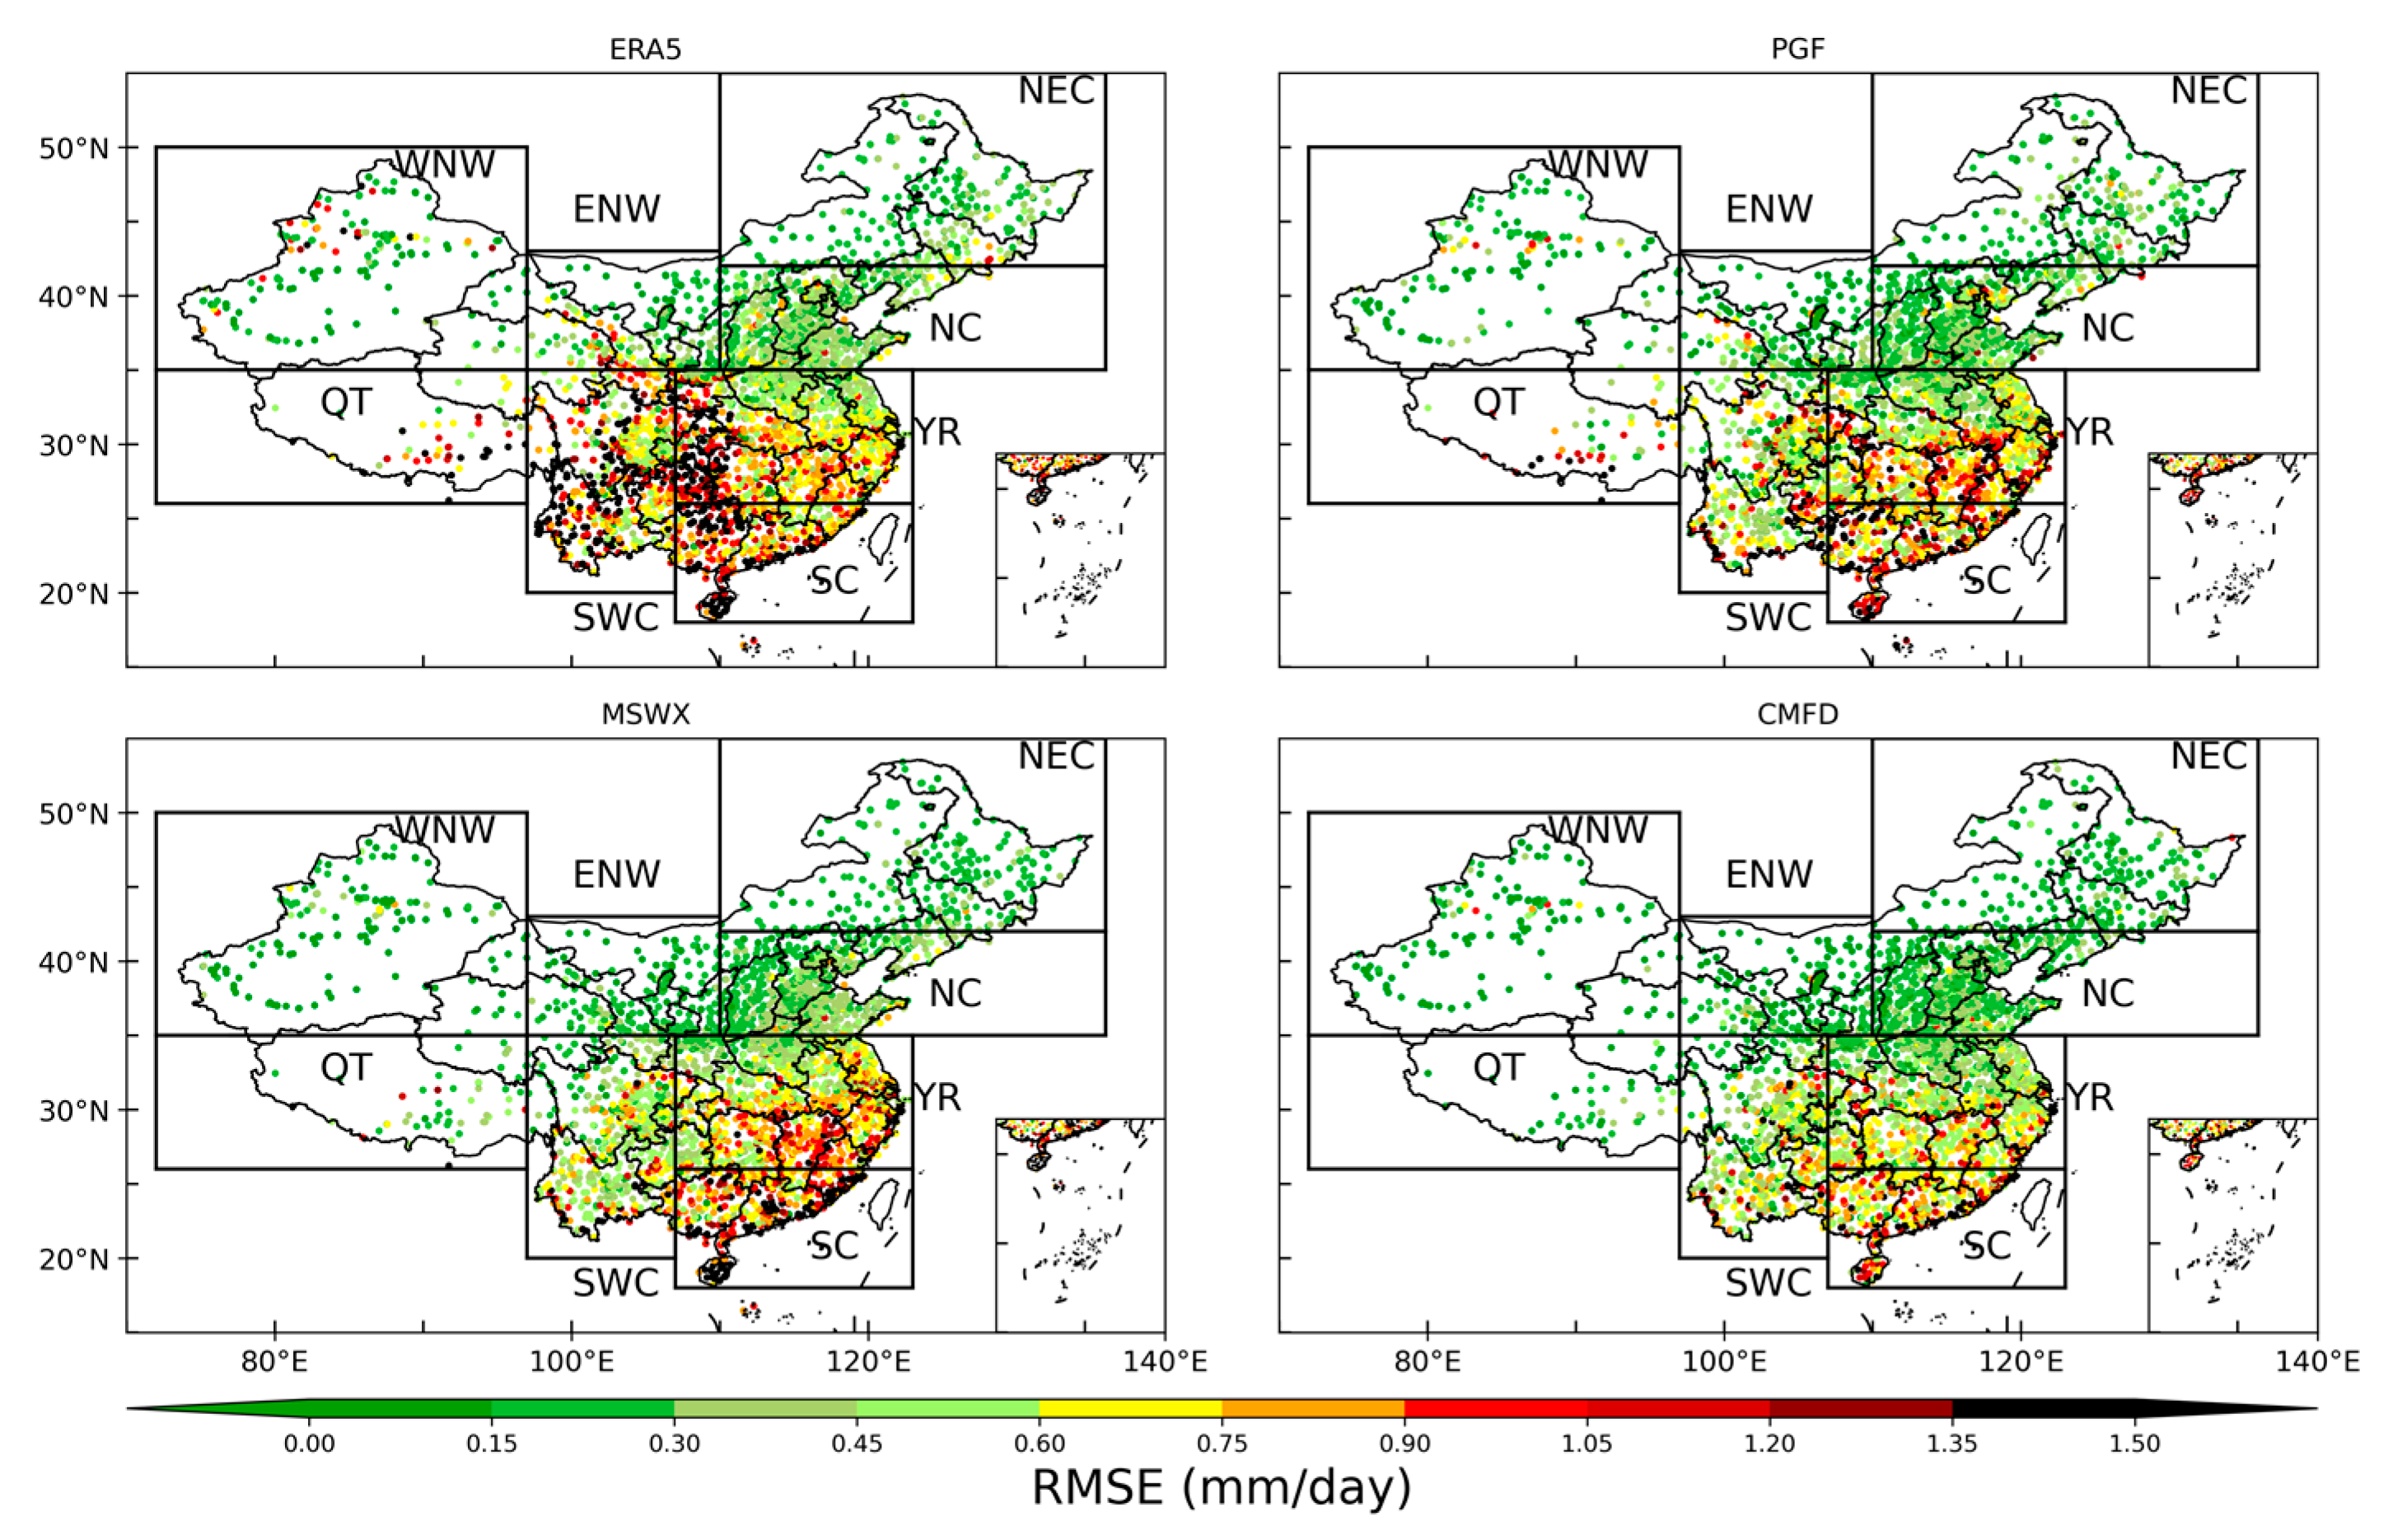
Figure 6 shows the spatial distribution of RMSEs between the annual mean precipitation from NSMF datasets and station observations.
The RMSEs decrease from south to north in China, which is similar to the distribution of annual mean precipitation [23]. ERA5 has the highest RMSEs over China. This is especially true over southwestern China, where the maximum RMSEs can be above 1.35 mm/day. Obvious RMSEs also exist over the Tibetan Plateau and some regions in Xinjiang. By bias-correcting the ERA5 precipitation based on reference climatology, which was generated by resampling the station-based Climatologies at High resolution for the Earth’s Land Surface Areas (CHELSA) dataset [24], MSWX greatly reduces the RMSEs over southwestern China and the Tibetan Plateau, but it increases the RMSEs over southeastern China, especially the coastal area. PGF also shows low RMSEs below 0.6 mm/day over northern China and high RMSEs above 1.2 mm/day over regions south of the Yangtze River. Among the four NSMF datasets, CMFD has the best performance in reproducing the variation in annual mean precipitation, with most of the RMSEs being lower than 0.75 mm/day over China.
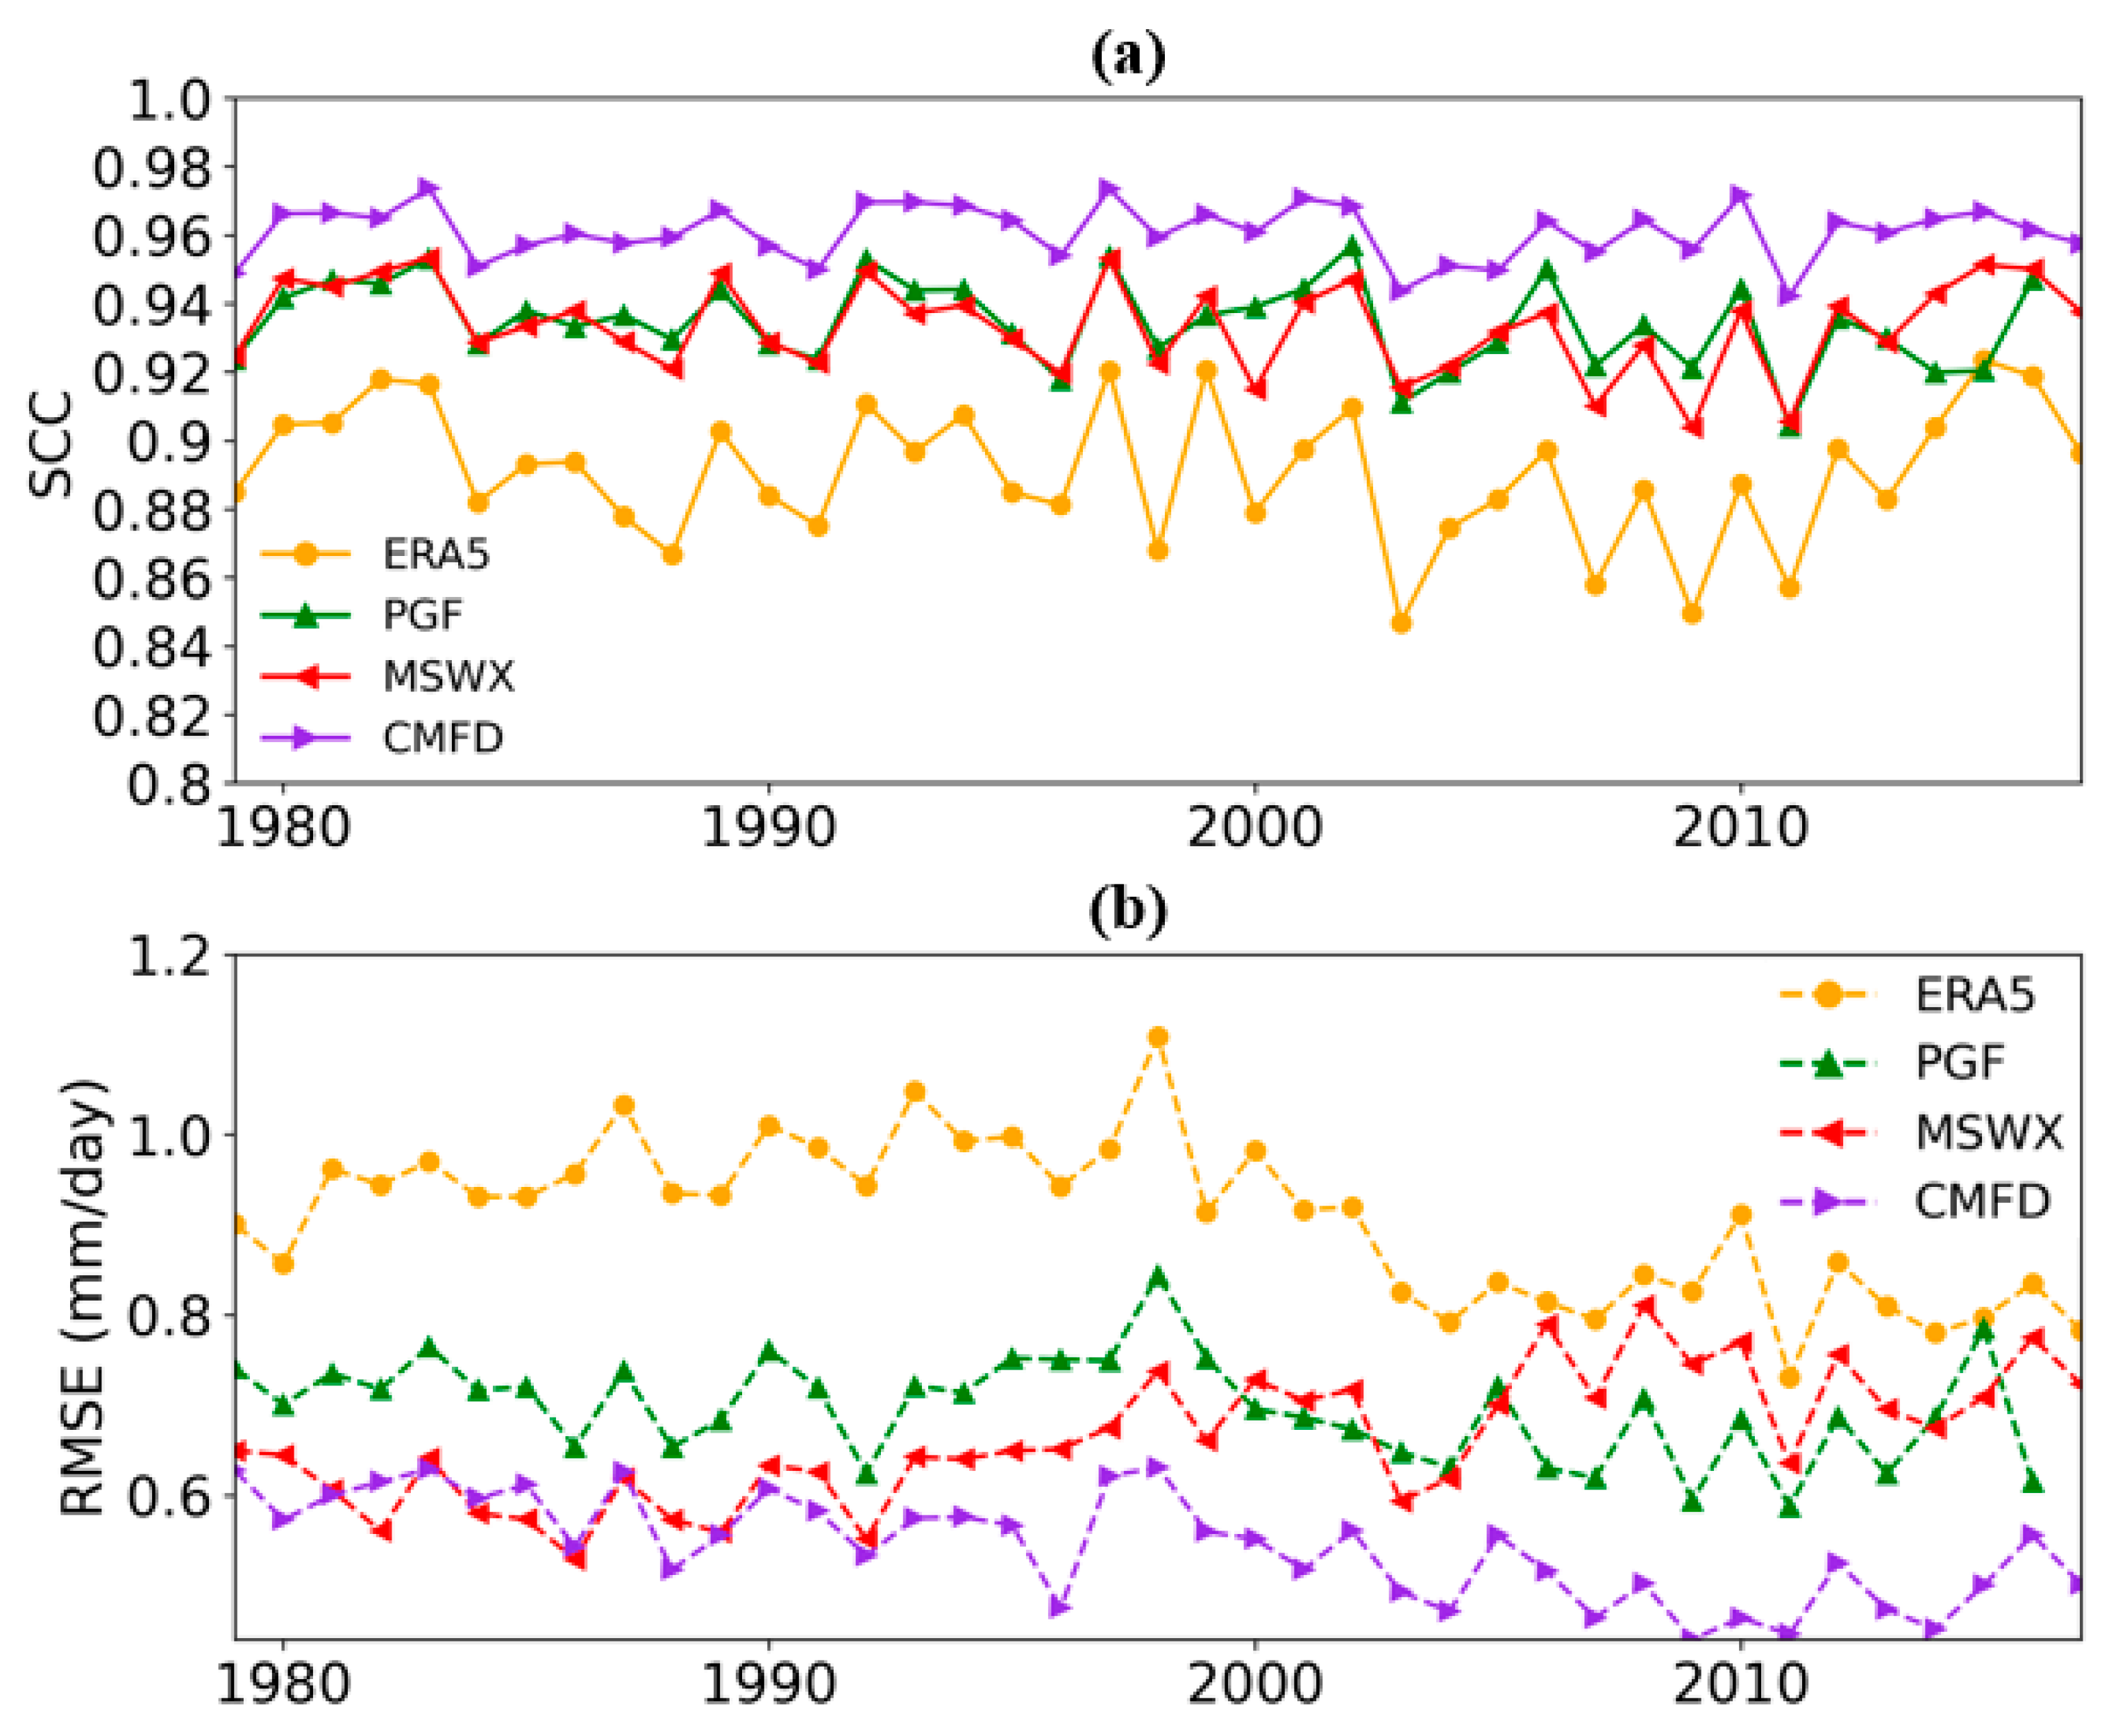
The inter-annual variation in SCCs and RMSEs of the regional average annual mean precipitation for NSMF datasets from 1979–2016 is shown in Figure 7. CMFD shows high SCCs (>0.94) throughout the years. PGF and MSWX also have relatively high SCCs ranging from 0.90 to 0.95. Conversely, most of the SCCs in ERA5 have been below 0.90 during the past 37 years, which is consistently lower than those in the other NSMF datasets. For RMSEs, CMFD has the lowest RMSEs at below 0.6 mm/day, and ERA5 produces the largest RMSEs among the four datasets (above 0.7 mm/day), with the maximum RMSE being larger than 1.0 mm/day. MSWX and PGF show RMSEs ranging from 0.55 mm/day to 0.8 mm/day. Compared with ERA5 and PGF, MSWX clearly reduces the RMSEs, especially before 2004. However, the RMSE of MSWX tends to increase after 2004. This may be due to the bias correction method based on the reference climatology for 1979–2013, which may record the large wet bias in ERA5 during 1979–2014. Although ERA5 has a small bias in terms of precipitation after 2004, the same bias correction is applied to decrease the precipitation in MSWX, something which leads to the increasing RMSE after 2004.
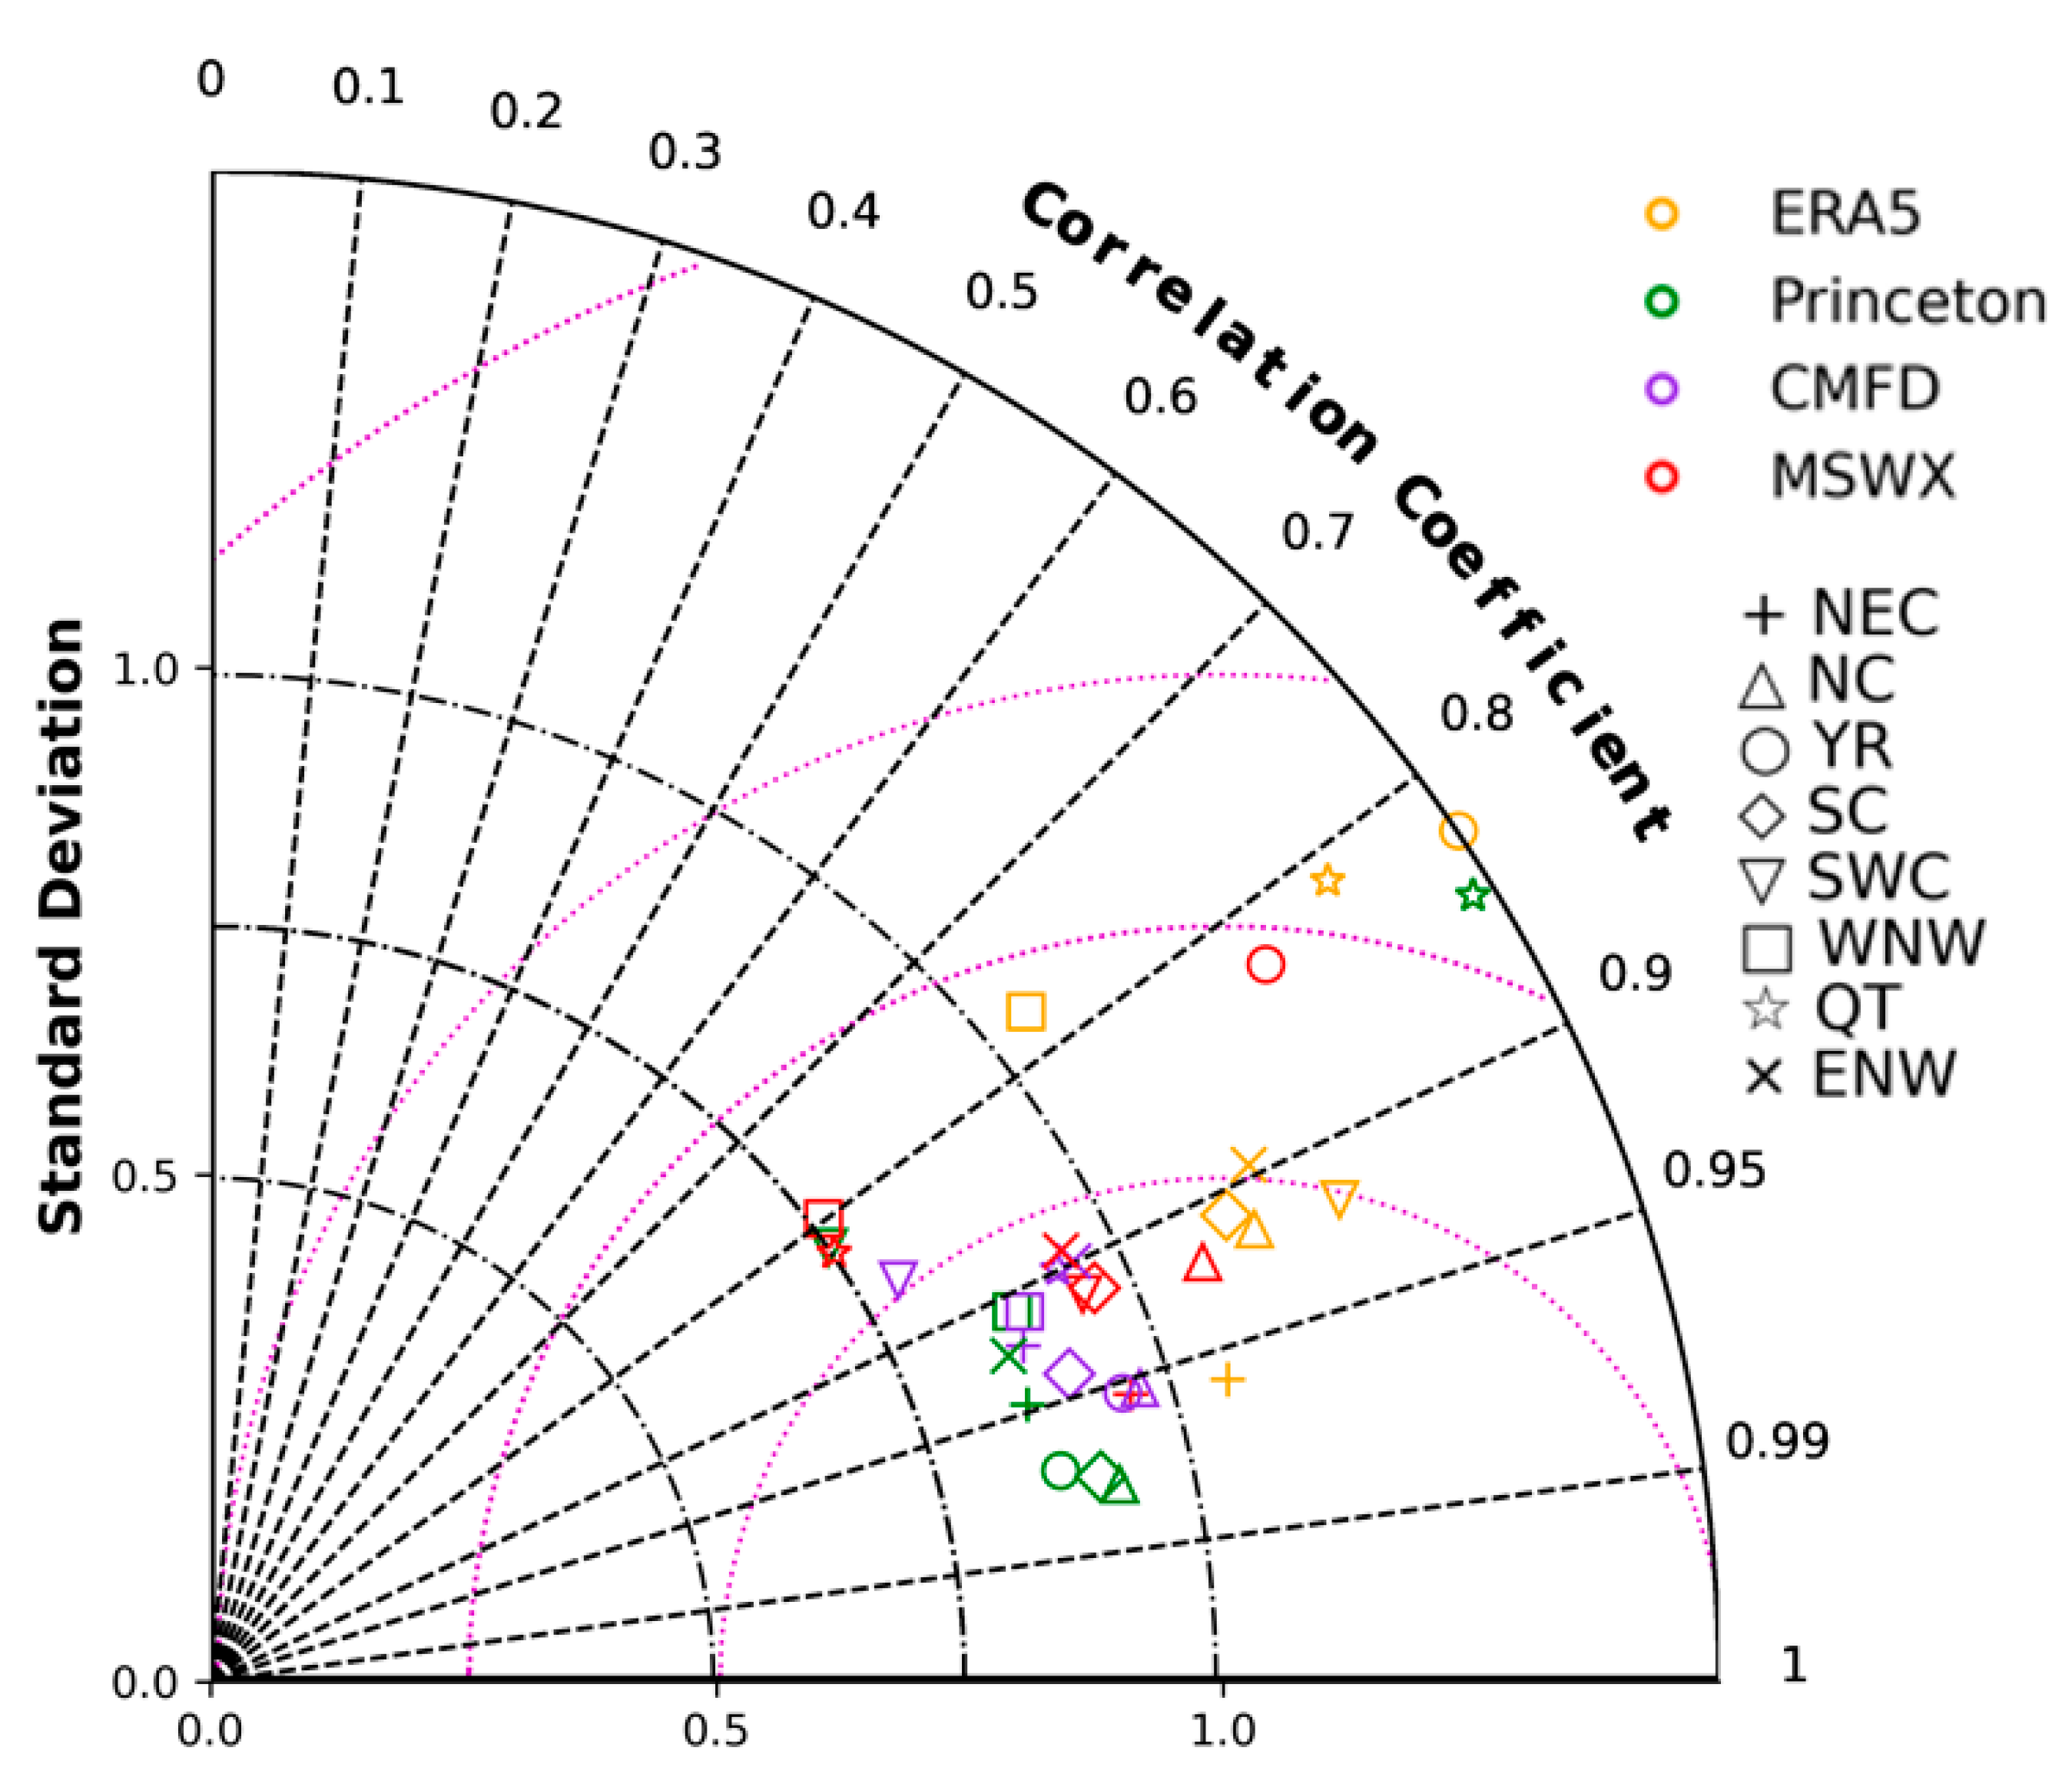
Taylor diagrams [25] are further used to assess the NSMF datasets in producing the inter-annual variability of precipitation in each sub-region of China for the period 1979–2016 (Figure 8). PGF generally shows the best consistency with in situ observations over North China, Yangtze River basin and South China, with the highest correlations and lowest RMSEs. CMFD has high correlations above 0.9 over most regions in China, and it shows the best performance in simulating the inter-annual variations of precipitation over North China. However, it shows the worst performance over Southwest China, with correlations below 0.9. Although ERA5 can reasonably reproduce the inter-annual variations of precipitation, it clearly overestimates the variability across China, especially over the Yangtze River basin, Southwest China and Qinghai–Tibet. MSWX significantly underestimates the variability over the Qinghai–Tibet and the west of Northwest China, and clearly overestimates the variability over the Yangtze River basin. Overall, the correlations and inter-annual variations exhibit significant differences in different regions. The ENW, NEC, SC, and NC regions show high correlation and inter-annual variations across all NSMF datasets. However, over the QT region, all NSMF datasets are notably distant from the reference point. Additionally, in the YR and WNW regions, ERA5 and MSWX demonstrate weaker correlations relative to PGF and CMFD. Although the MSWX has close correlations with ERA5 in eight sub-regions, MSWX can significantly improve the simulation of inter-annual variance with the results closer to the reference point (observation).
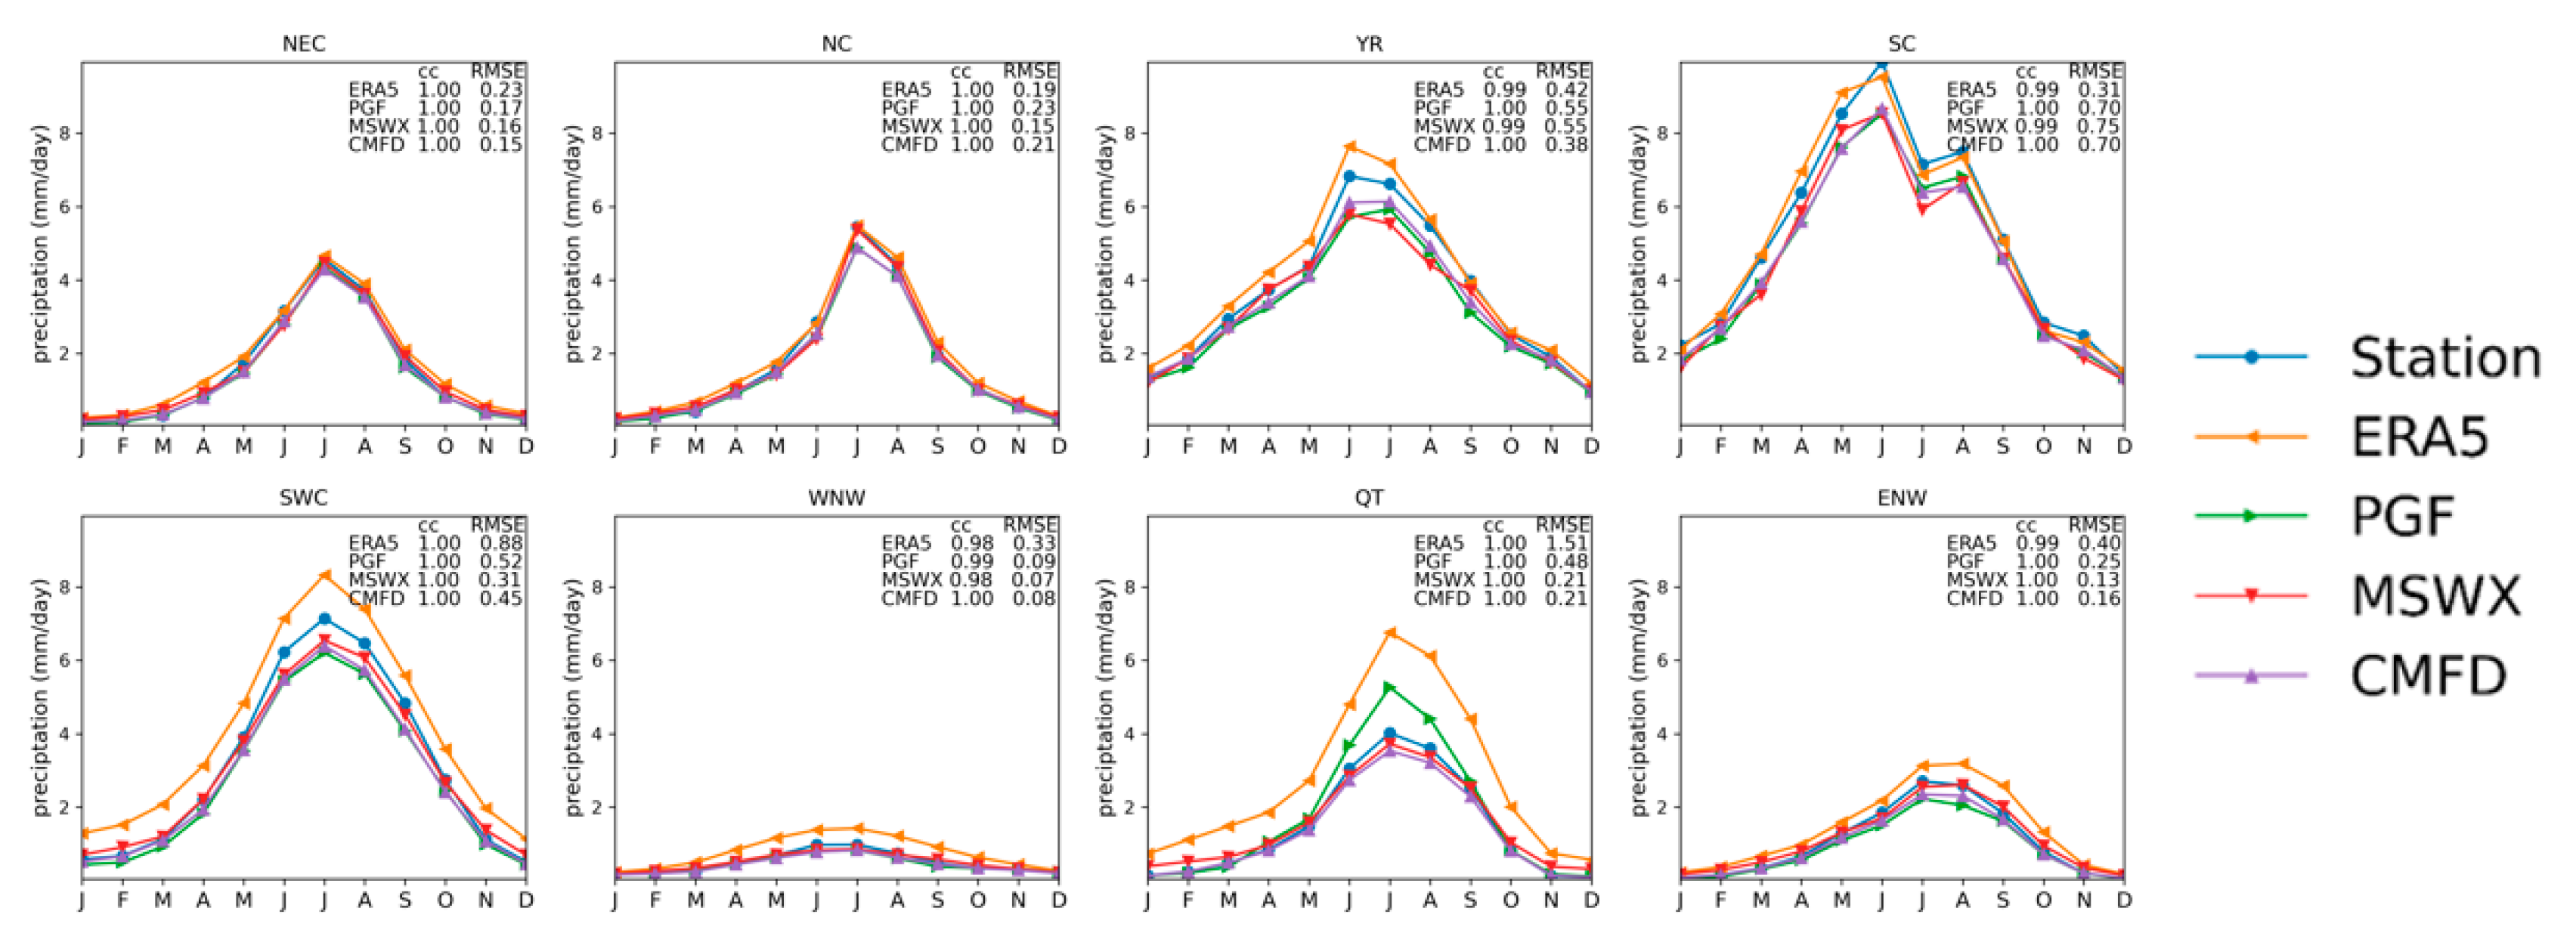
Figure 9 illustrates the seasonal cycle of regional averaged precipitation over eight sub-regions in China. All NSMF datasets can reproduce the seasonal cycle of precipitation with correlations above 0.99 and RMSEs below 0.25 mm/day over Northeast China and North China. Over the Yangtze River basin, all the datasets can capture the peak precipitation in June, although ERA5 tends to overestimate the precipitation during the warm season, whereas the other datasets underestimate it. Over South China, the two peaks of monthly precipitation in June and August are reproduced well in the NSMF datasets. ERA5 shows the seasonal variation closest to the observations, whilst others have dry biases. Over Southwest China, the west of Northwest China and the east of Northwest China, ERA5 clearly shows wet biases at each month, whilst the others can produce the seasonal variation well, with slight dry biases in summer. Large wet biases can be found in ERA5 over Qinghai–Tibet, especially in warm seasons, and PGF also shows clear wet biases in summer. MSWX and CMFD can produce the seasonal cycle over Qinghai–Tibet well, with an RMSE of about 0.24 mm/day, which is much smaller than that in ERA5 (1.45 mm/day).
3.3. Wind Speed
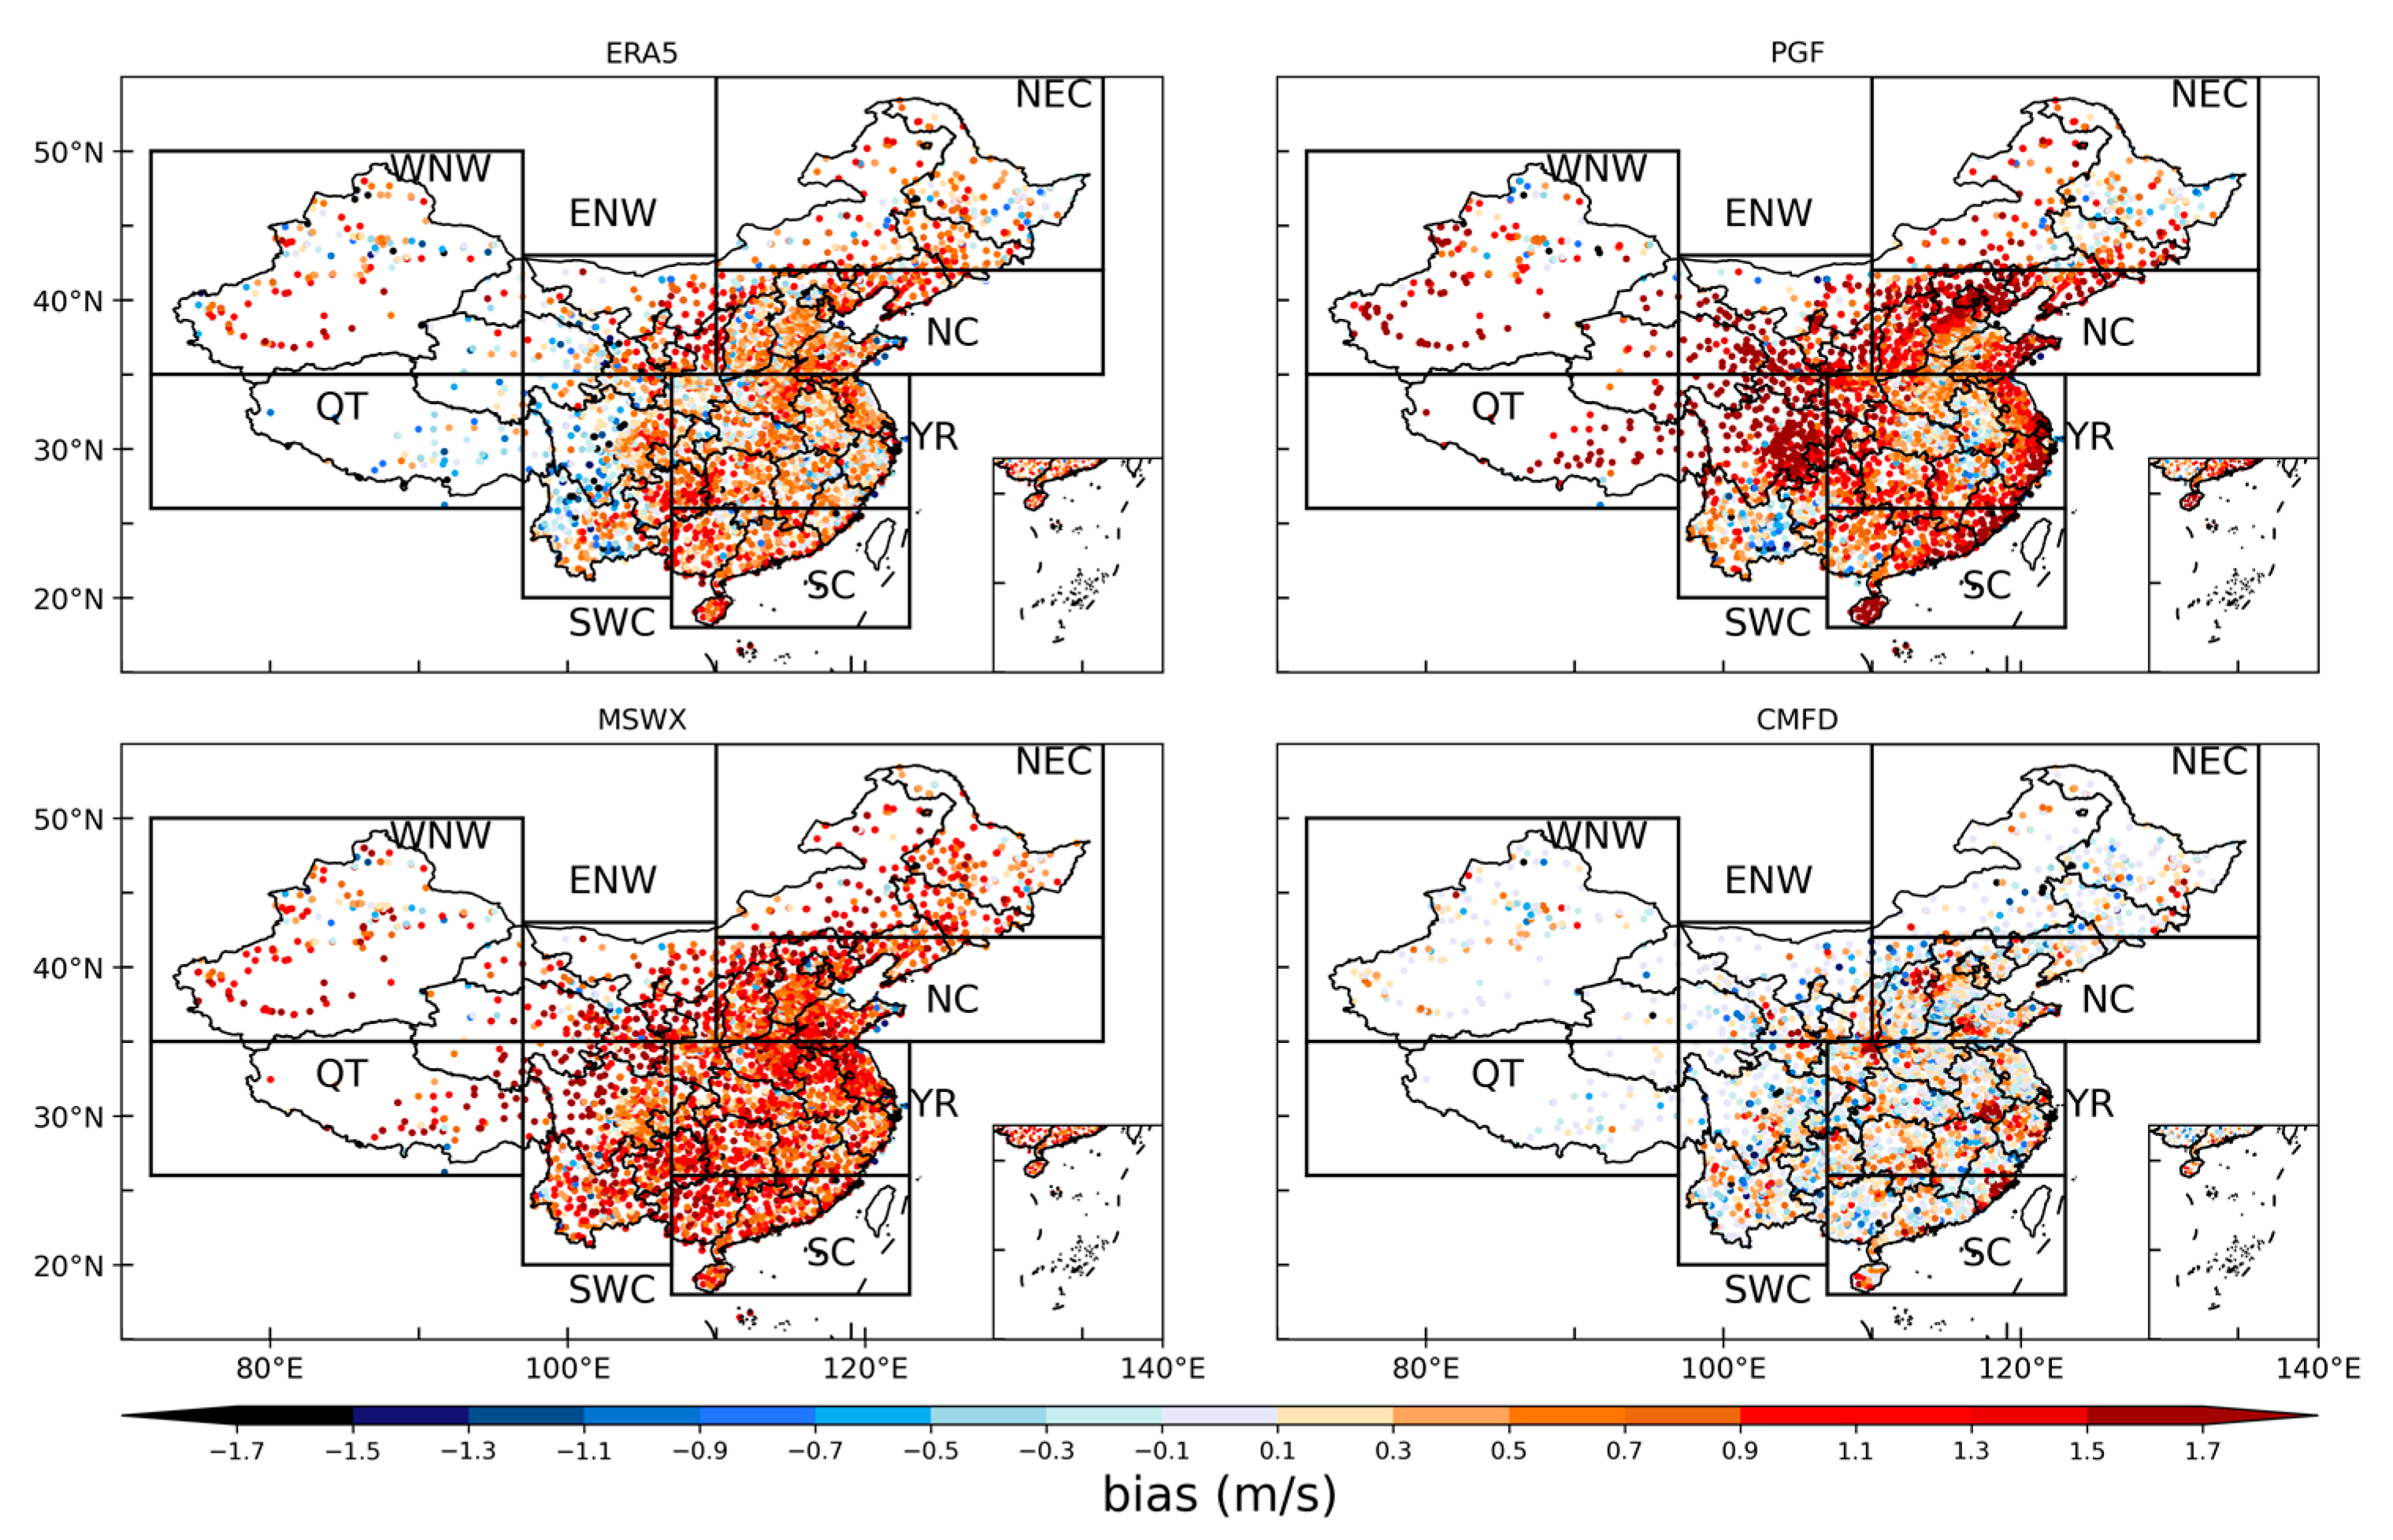
Figure 10 depicts the spatial distribution of biases of 37 years annual mean wind speed between the NSMF datasets and in situ observations. All NSMF datasets except PGF can simulate the spatial pattern of annual mean wind speed well, with SCCs greater than 0.6 and RMSEs below 1.20 m/s (Table 4). PGF clearly overestimates annual mean wind speed over western China, North China, and along the coastal region with a maximum bias up to 1.9 m/s. This results in a largest RMSE of 1.36 m/s and lowest SCC of 0.37. MSWX also shows positive biases in most parts of China, and has a relatively large RMSE of 1.18 m/s.
Although MSWX slightly overestimates the wind speed over the coastal area of China, there is significant overestimation over the inland area, especially from SWC, QT and ENW (Table 4). Compared with PGF and MSWX, ERA5 and CMFD show better skill in producing the spatial pattern of annual mean wind speed, with RMSEs below 0.81 m/s. The SCCs and RMSEs of the seasonal mean wind speed between the NSMF datasets and in situ observations are also shown in Table 4. Except for PGF, these NSMF datasets can produce the distribution of seasonal mean wind speed, with high SCCs above 0.6 and low RMSEs below 1.27 m/s. CMFD shows the lowest RMSEs below 0.76 m/s for seasonal mean wind speed, while PGF shows the highest RMSEs above 1.12 m/s for seasonal mean wind speed, especially in fall and winter. Compared with ERA5, MSWX has similar SCCs but larger RMSEs, a fact which is related to the stronger wind speed in MSWX. The large positive biases between MSWX and in situ observations in the island area leads to the large RMSEs.
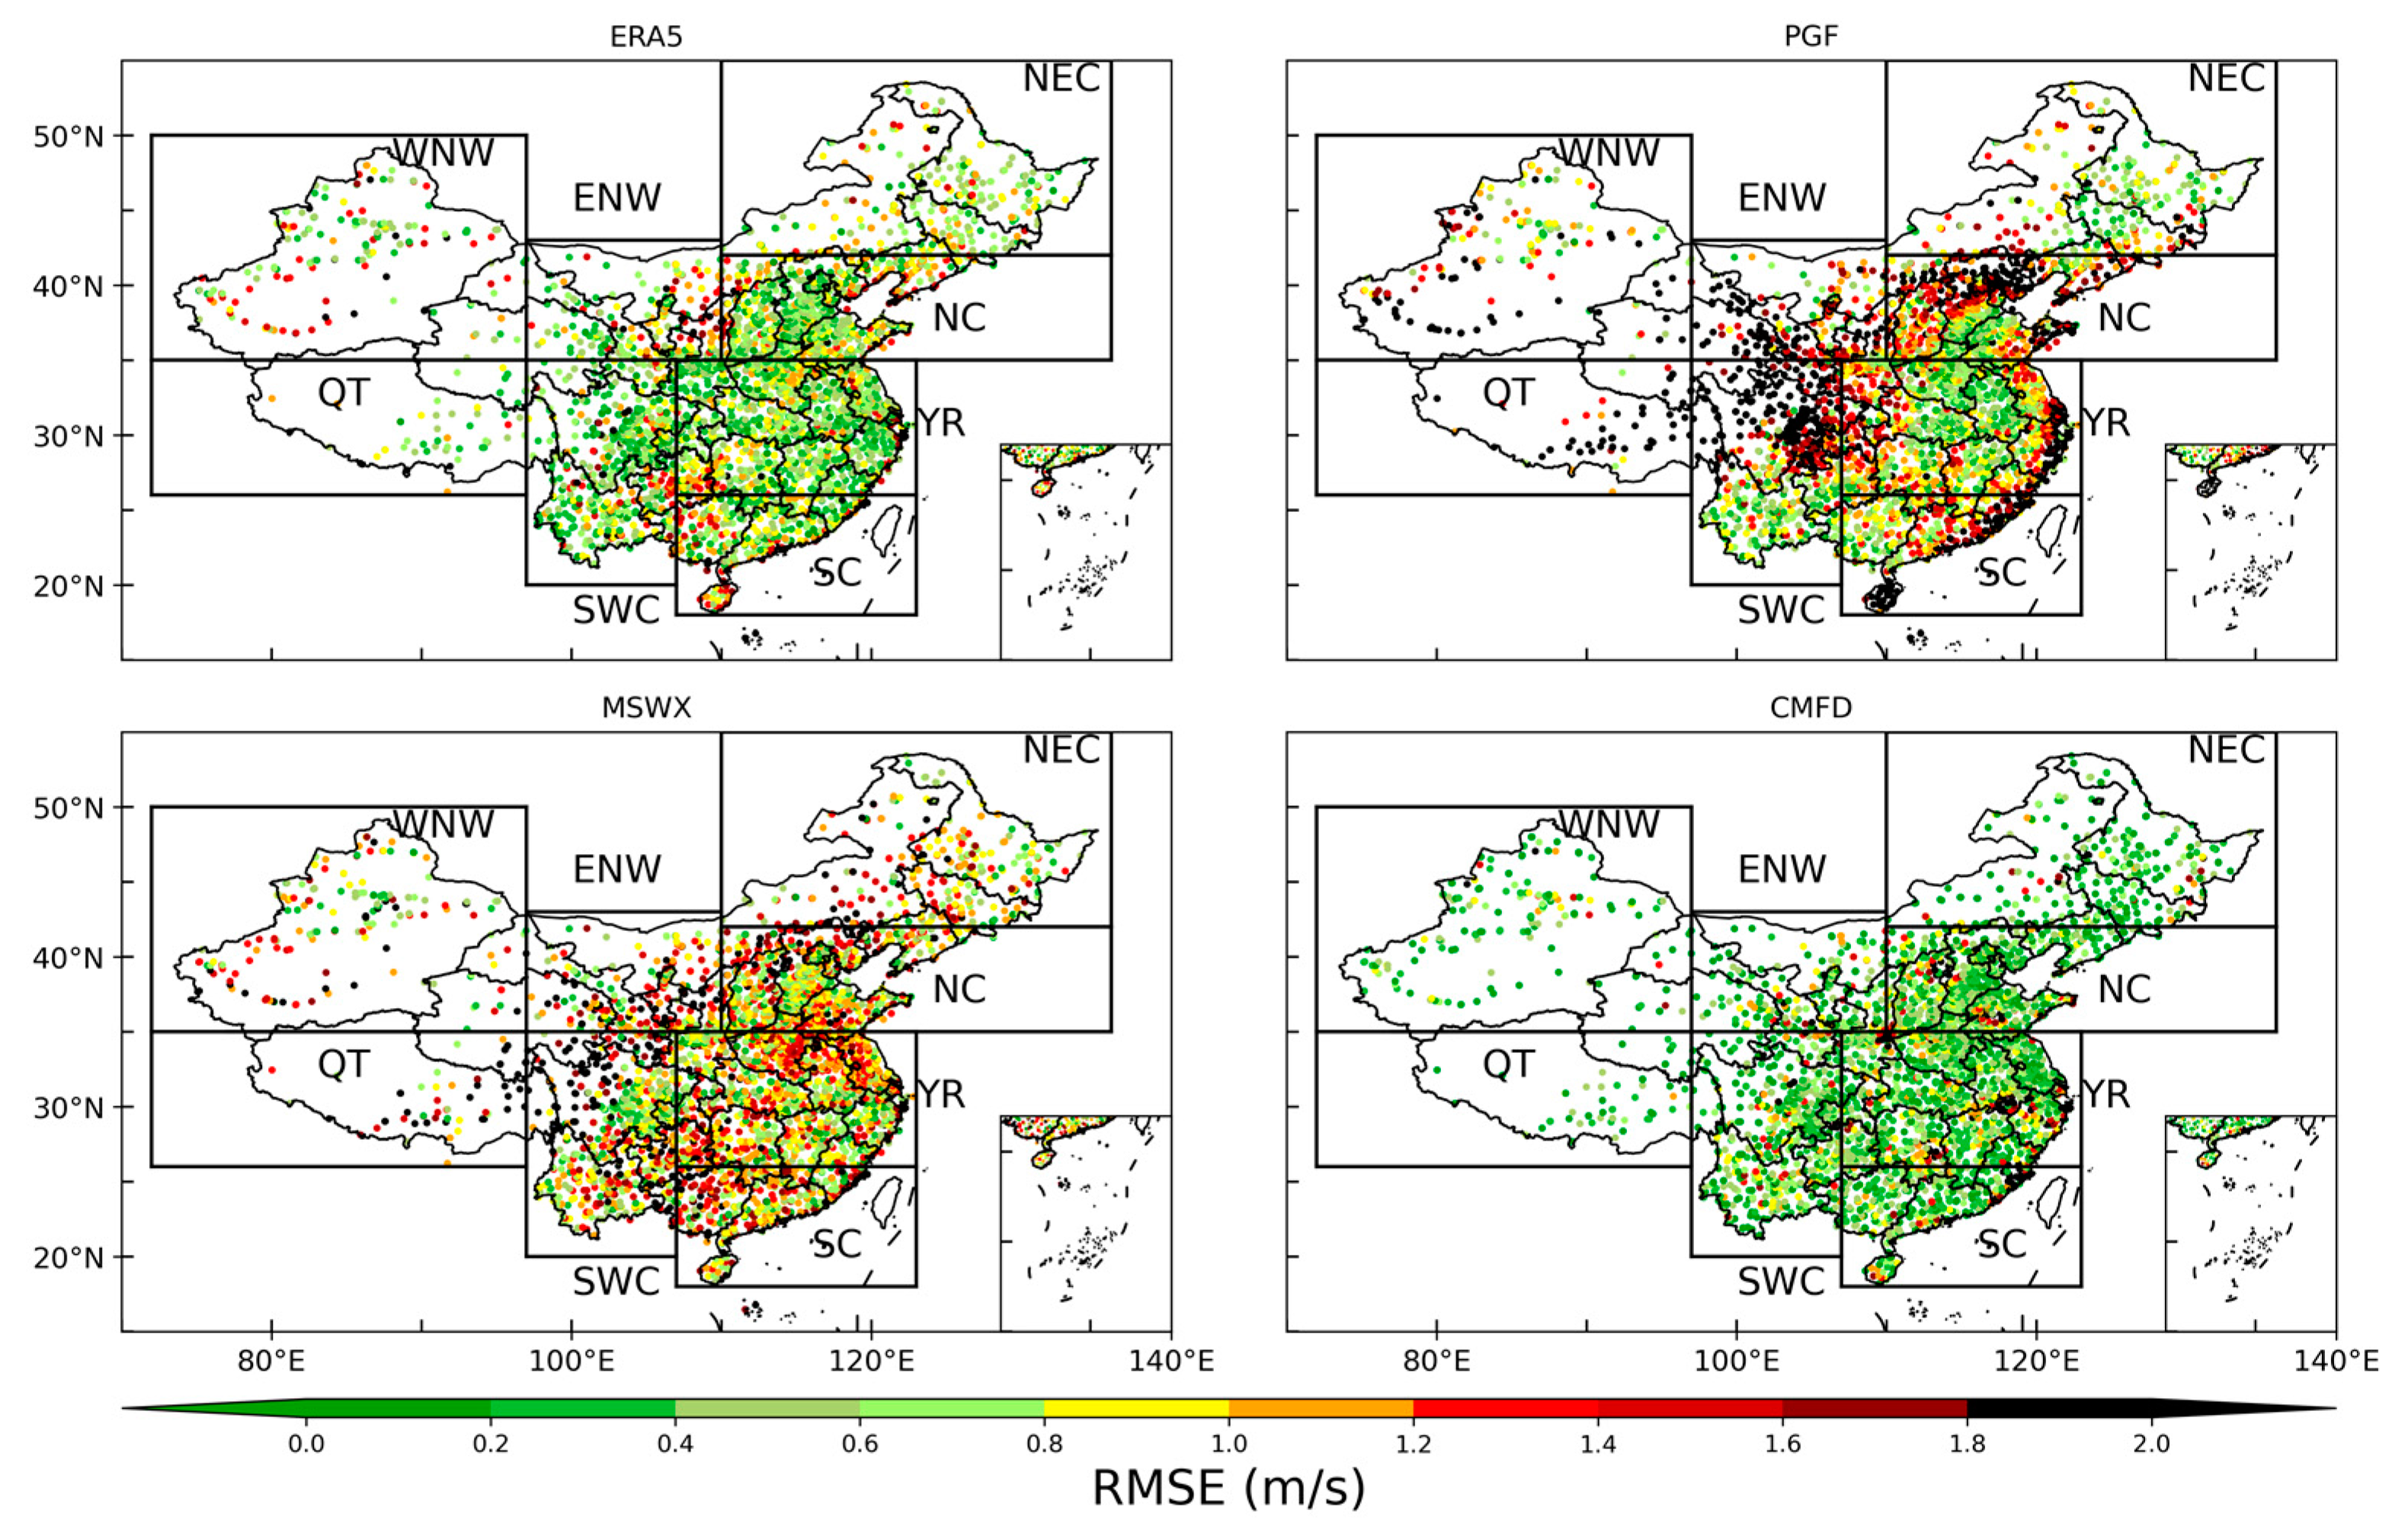
Figure 11 shows the spatial pattern of RMSEs for wind speed from NSMF datasets. It is clear that CMFD and ERA5 can simulate the variation in annual mean wind speed well, with most RMSEs being below 0.6 m/s. MSWX has larger RMSEs (most of RMSEs being above 1.2 m/s) than ERA5, especially over western China, North China and Southwestern China. This may be due to the bias correction of wind speed using the Global Wind Atlas (GWA3.1, https://globalwindatlas.info/, accessed on 1 May 2023) dataset for a period of only 10 years (2008–2017) as the reference climatology, possibly leading to biases in wind speed in specific regions [26,27,28]. PGF can reproduce the variation in annual mean wind speed over the Yangtze River Basin and southwestern China, but it significantly overestimates the variation over other regions in China, especially western China, where the RMSEs can be larger than 1.8 m/s.
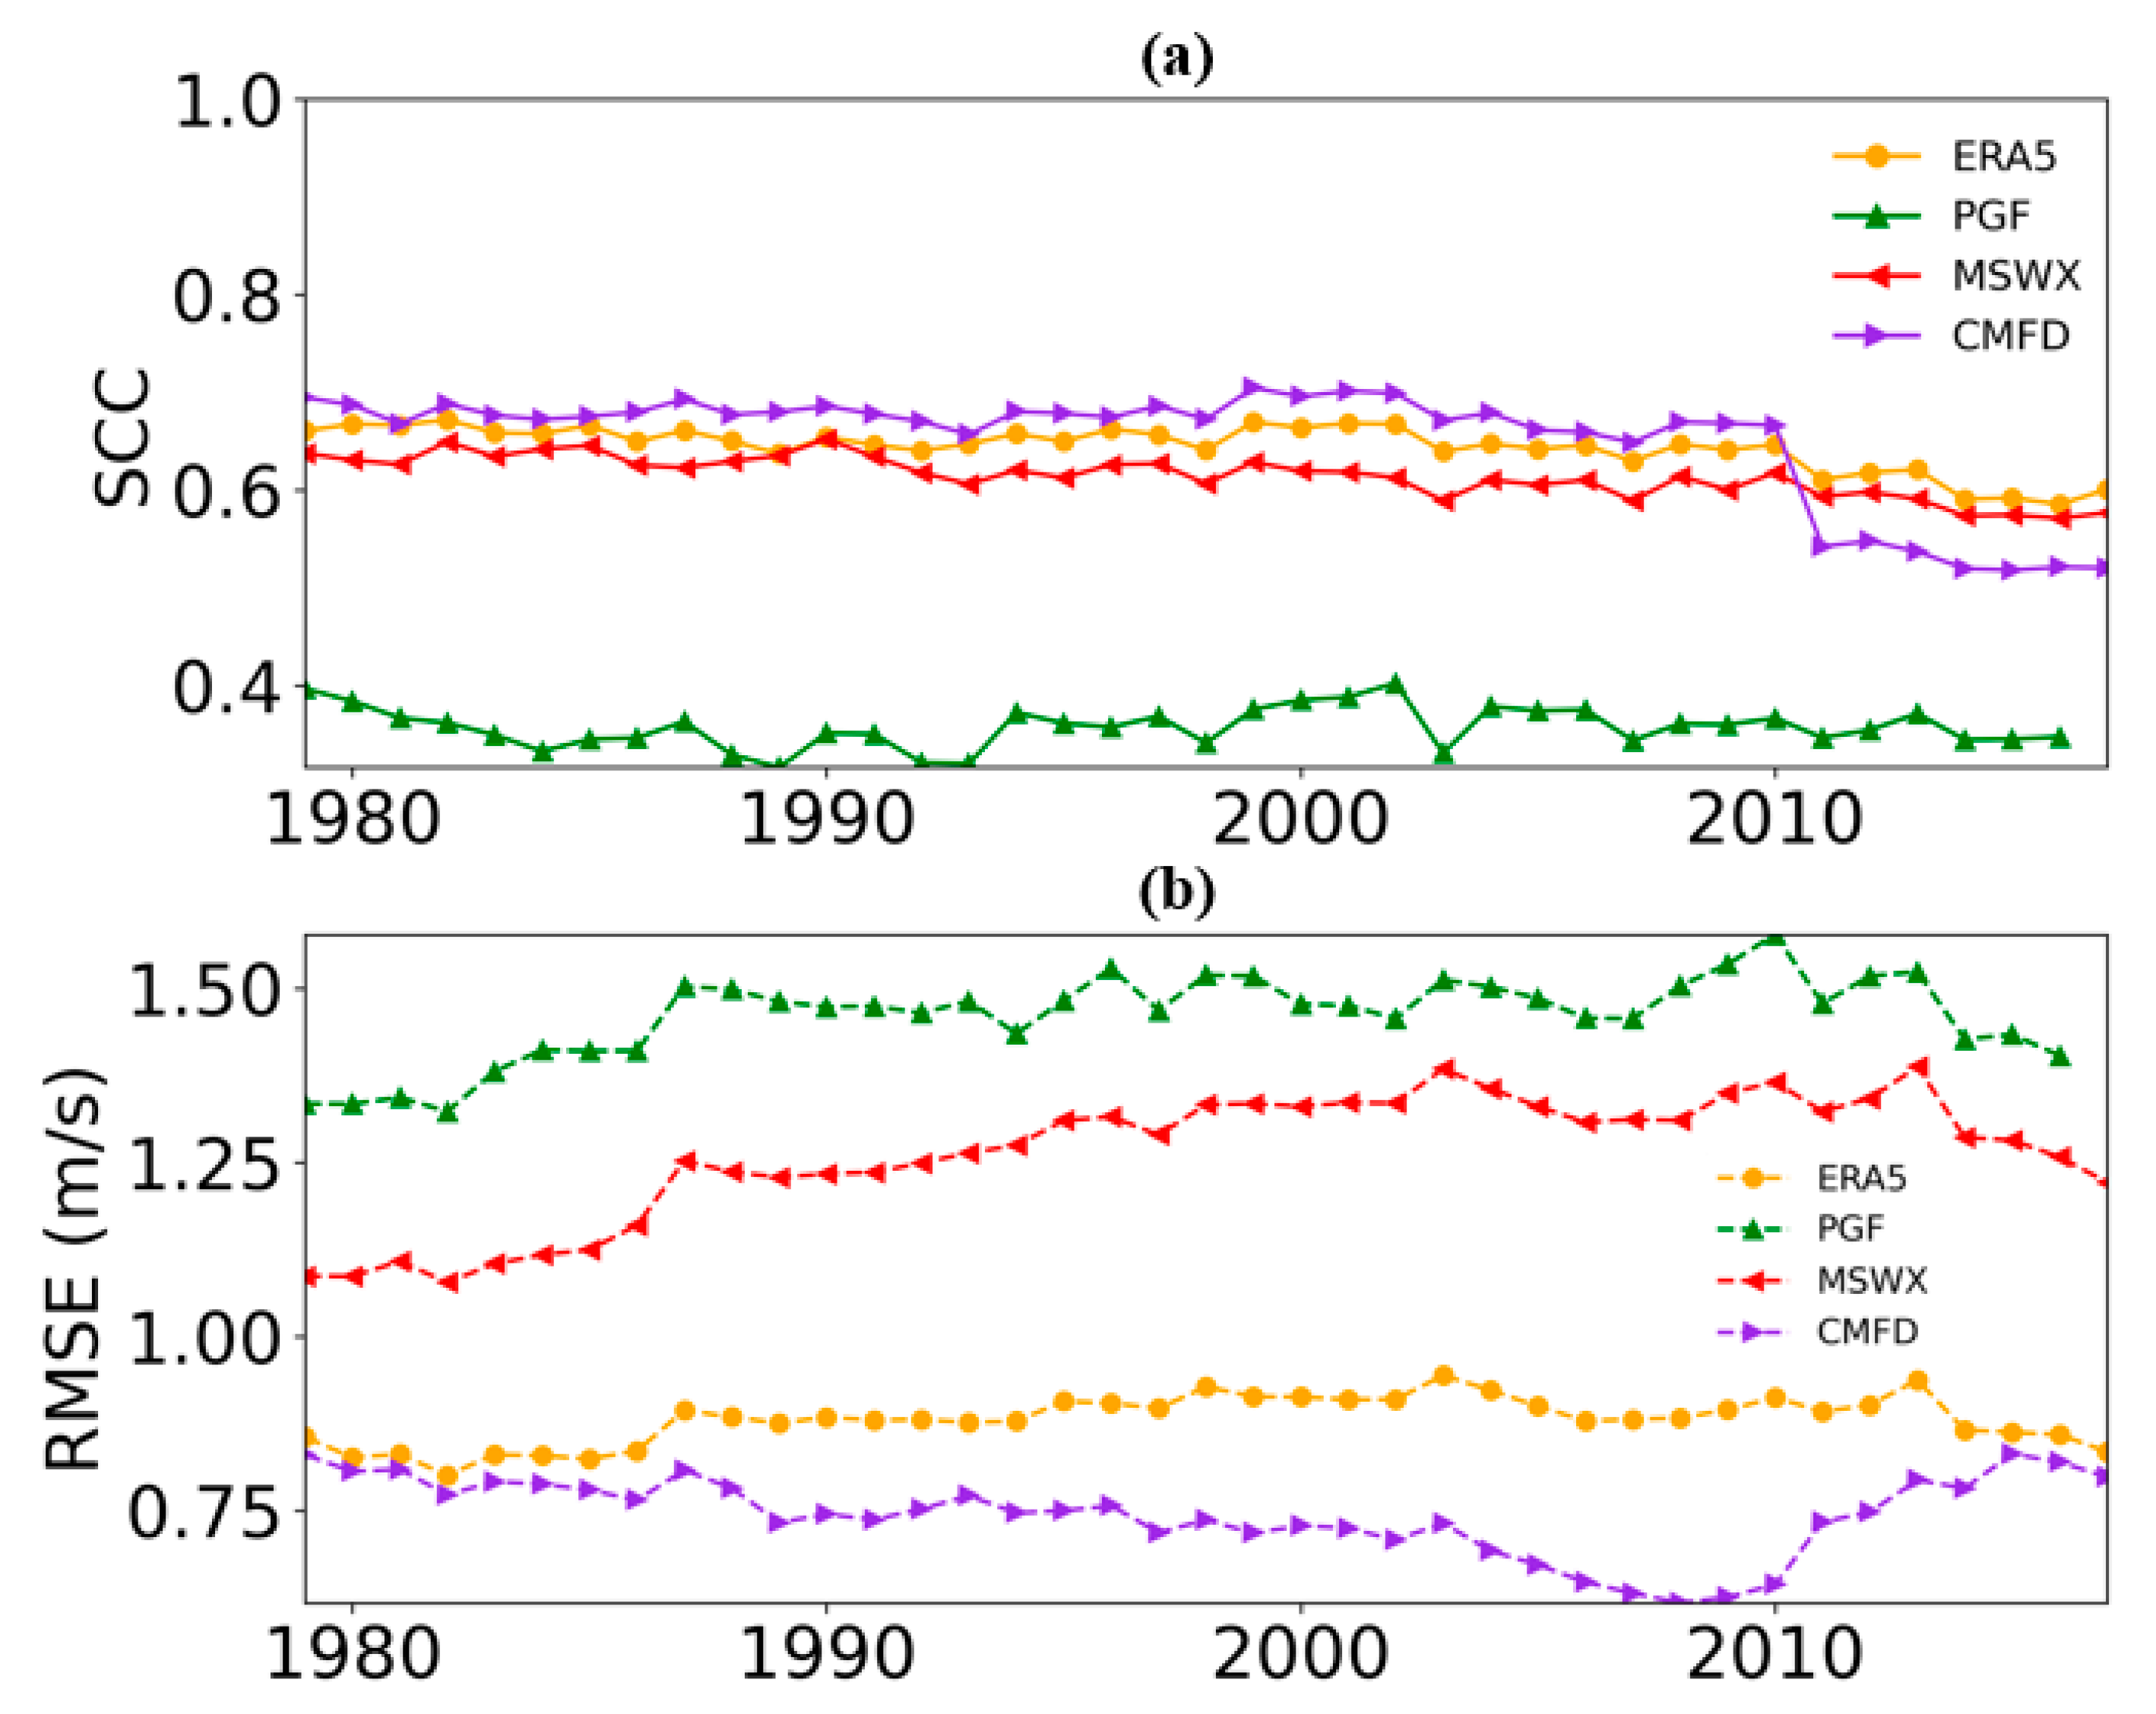
Figure 12 describes the inter-annual variation displayed by SCCs and RMSEs in annual mean wind speed between NSMF and in situ observations from 1979–2016. All the NSMF datasets except PGF show high SCCs above 0.60 during 1979–2016, especially before 2010, and CMFD demonstrates a clear decrease in SCCs after 2010 [29]. PGF shows poor performance in producing the spatiotemporal variation in annual mean wind speed. It has the lowest SCCs, with most values being below 0.40. For the RMSEs, CMFD has the lowest RMSEs, which are mostly below 0.8 m/s during the period, but the RMSE increases quickly after 2010. PGF has the largest RMSEs, with the maximum RMSE being above 1.5 m/s. Compared with ERA5, MSWX shows larger RMSE, which is related to the overestimation of wind speed over most regions of China.
4. Conclusions and Discussion
In this study, we have comprehensively evaluated four NSMF datasets (ERA5, PGF, MSWX and CMFD) for five variables, including T2m, Tmax, Tmin, precipitation and wind speed, during 1979–2016 over China. The performance of NSMF datasets is evaluated in terms of climatology, inter-annual variability and seasonal cycle against observations collected from more than 2400 surface observational stations.
All the NSMF datasets can reproduce the spatial pattern of T2m well, with high SCCs above 0.97 and low RMSEs below 1.69 °C. MSWX underestimates Tmax and overestimates Tmin to a larger degree than PGF, but to a lower one than ERA5, especially in western China. However, MSWX shows more underestimation for Tmax and more overestimations for Tmin over the NC and NEC. Compared with ERA5, MSWX significantly reduces the RMSEs of seasonal mean T2m (≤1.12 °C), Tmax (≤2.12 °C) and Tmin (≤1.75 °C), especially in the autumn and winter. For the inter-annual variations of surface air temperature, MSWX shows higher SCCs and lower RMSEs than ERA5, but higher RMSEs than PGF. CMFD and MSWX show better agreement with observations than ERA5 and PGF.
Evaluation of precipitation reveals that MSWX can produce the spatial pattern of annual mean precipitation well, with high SCCs above 0.89 and low RMSEs below 1.34 mm/day, but dry biases exist in southeastern China, especially the coastal area. On the contrary, ERA5 substantially overestimates precipitation in China, especially in southwestern China. CMFD generally shows the lowest biases over China, but still underestimates South China. Compared to other seasons, all NSMF datasets show a relatively poor performance for summer mean precipitation (RMSEs ≥ 1.11 mm/day), especially ERA5 (1.45 mm/day) and PGF (1.43 mm/day). For the inter-annual variation in SCC and RMSEs, CMFD has the best performance (RMSEs below 0.6 mm/day), while ERA5 is the worst one (RMSEs above 0.7 mm/day). Compared with ERA5, MSWX and PGF increase the SCCs and reduce the RMSEs. For the intra-annual variability of precipitation in eight sub-regions, Taylor diagram shows that PGF has the best consistency with in situ observations, while ERA5 and MSWX show relatively low performance. All NSMF datasets can capture the seasonal cycle of precipitation well, especially over Northeast China and North China (RMSEs below 0.25 mm/day and correlations above 0.99). ERA5 generally overestimates precipitation over the 8 sub-regions, while other datasets generally underestimate precipitation. Furthermore, the characteristics of precipitation in different regions can result in varying degrees of bias, with regions that receive abundant precipitation exhibiting higher bias.
All the NSMF datasets, especially PGF and MSWX, tend to overestimate wind speed over China. PGF significantly overestimates surface wind speed over the Yangtze River basin and western China, which leads to the lowest SCCs (below 0.42) and highest RMSEs (above 1.12 m/s) among the four products. Because of the reference climatology from GWA3.1 which has strong wind speed, significant positive biases exist in MSWX over China, especially the inland area including SWC, QT and ENW, which leads to the relatively high RMSEs above 1.09 m/s. CMFD performs the best in reproducing the distribution of wind with the highest SCCs and lowest RMSEs. Time series of SCCs and RMSEs of these NSMF datasets indicate that CMFD and ERA5 exhibit SCCs that are mostly above 0.6 and lower RMSE than PGF, especially before 2010. MSWX has relatively low SCCs (slightly above 0.6) and high RMSEs (above 1.0 m/s), indicating the poorer performance than ERA5 and CMFD.
Despite biases in NSMF and observations, these NSMF datasets have great potential for use in climatological applications if used with care. The assessment also reveals that MSWX needs to be further improved, particularly for wind speed. In the future, bias correction of MSWX could be considered to bring it closer to the in situ observations.
Although CMFD provides good performance, it lacks consistency between different variables. While MSWX is based on the bias correction of ERA5 reanalysis, the variables in MSWX are spatio-temporally consistent. Additionally, MSWX also consists of four sub-products, namely, MXWX-Past, MSWX-NRT, MSWX-Mid and MSWX-Long. These products make it easy to be used for different research purposes. For example, MSWX can be used in near real time and in mid-term forecast study.
Although MSWX is produced based on bias correction of the ERA5 reanalysis, there are several future issues that must be addressed in the future work, such as (1) the way in which the bias correction method in MSWX affects the performance of MSWX; (2) or the ways to reduce MSWX uncertainty.
Author Contributions
J.T. provided the funding, downloaded the data for model evaluation, and revised the text. H.L. calculated the metrics of variables, plot the figures and tables, and wrote the manuscript text. G.D., Y.Y., S.W. (Shuguang Wang) and S.W. (Shuyu Wang) revised the text. All authors have read and agreed to the published version of the manuscript.
Funding
The Second Tibetan Plateau Scientific Expedition and Research Program (STEP, Grant No. 2019QZKK0206) and National Key Research and Development Program of China (2018YFA0606003) and jointly fund this work.
Institutional Review Board Statement
Not applicable.
Informed Consent Statement
Not applicable.
Data Availability Statement
The ERA5 dataset can be downloaded in https://www.ecmwf.int/ (accessed on 1 May 2023). The PGF dataset can be downloaded in http://hydrology.princeton.edu/data.pgf.php (accessed on 1 May 2023). The MSWX dataset can be downloaded in http://www.gloh2o.org/mswx/ (accessed on 1 May 2023). The CMFD dataset can be downloaded in https://data.tpdc.ac.cn/zh-hans/data/8028b944-daaa-4511-8769-965612652c49/ (accessed on 1 May 2023). The stations data can be downloaded in http://data.cma.cn/ (accessed on 1 May 2023). All data used in this study can be accessed by contacting Jianping Tang ([email protected]).
Conflicts of Interest
The authors declare no competing interests.
References
- Cao, J.; Law, S.H.; Samad, A.R.B.A.; Mohamad, W.N.B.W.; Wang, J.; Yang, X. Impact of financial development and technological innovation on the volatility of green growth—Evidence from China. Environ. Sci. Pollut. Res. 2021, 28, 48053–48069. [Google Scholar] [CrossRef] [PubMed]
- Fujiwara, M.; Wright, J.S.; Manney, G.L.; Gray, L.J.; Anstey, J.; Birner, T.; Davis, S.; Gerber, E.P.; Harvey, V.L.; Hegglin, M.I.; et al. Introduction to the SPARC Reanalysis Intercomparison Project (S-RIP) and overview of the reanalysis systems. Atmos. Chem. Phys. 2017, 17, 1417–1452. [Google Scholar] [CrossRef] [Green Version]
- Kalnay, E. The NCEP/NCAR 40-Year Reanalysis Project. Bull. Am. Meteor. Soc. 1996, 77, 437–472. [Google Scholar] [CrossRef]
- Dee, D.P.; Uppala, S.M.; Simmons, A.J.; Berrisford, P.; Poli, P.; Kobayashi, S.; Andrae, U.; Balmaseda, M.A.; Balsamo, G.; Bauer, P.; et al. The ERA-Interim reanalysis: Configuration and performance of the data assimilation system. Q. J. R. Meteorol. Soc. 2011, 137, 553–597. [Google Scholar] [CrossRef]
- Hersbach, H.; Bell, B.; Berrisford, P.; Hirahara, S.; Horányi, A.; Muñoz-Sabater, J.; Nicolas, J.; Peubey, C.; Radu, R.; Schepers, D.; et al. The ERA5 global reanalysis. Q. J. R. Meteorol. Soc. 2020, 146, 1999–2049. [Google Scholar] [CrossRef]
- Abatzoglou, J.T. Development of gridded surface meteorological data for ecological applications and modelling. Int. J. Climatol. 2013, 33, 121–131. [Google Scholar] [CrossRef]
- He, J.; Yang, K.; Tang, W.; Lu, H.; Qin, J.; Chen, Y.; Li, X. The first high-resolution meteorological forcing dataset for land process studies over China. Sci. Data 2020, 7, 25. [Google Scholar] [CrossRef] [Green Version]
- Nie, S.; Luo, Y.; Wu, T.; Shi, X.; Wang, Z. A merging scheme for constructing daily precipitation analyses based on objective bias-correction and error estimation techniques. J. Geophys. Res. Atmos. 2015, 120, 8671–8692. [Google Scholar] [CrossRef] [Green Version]
- Ballarin, A.S.; Sone, J.S.; Gesualdo, G.C.; Schwamback, D.; Reis, A.; Almagro, A.; Wendland, E.C. CLIMBra—Climate Change Dataset for Brazil. Sci. Data 2023, 10, 47. [Google Scholar] [CrossRef]
- Popescu, C.R.G. Corporate Social Responsibility, Corporate Governance and Business Performance: Limits and Challenges Imposed by the Implementation of Directive 2013/34/EU in Romania. Sustainability 2019, 11, 5146. [Google Scholar] [CrossRef] [Green Version]
- Zhang, P.; Zhang, J.; Chen, M. Economic impacts of climate change on agriculture: The importance of additional climatic variables other than temperature and precipitation. J. Environ. Econ. Manag. 2017, 83, 8–31. [Google Scholar] [CrossRef]
- Nogueira, M. Inter-comparison of ERA-5, ERA-interim and GPCP rainfall over the last 40 years: Process-based analysis of systematic and random differences. J. Hydrol. 2020, 583, 124632. [Google Scholar] [CrossRef]
- Zou, J.; Lu, N.; Jiang, H.; Qin, J.; Yao, L.; Xin, Y.; Su, F. Performance of air temperature from ERA5-Land reanalysis in coastal urban agglomeration of Southeast China. Sci. Total Environ. 2022, 828, 154459. [Google Scholar] [CrossRef] [PubMed]
- Yu, J.; Zhou, T.; Jiang, Z.; Zou, L. Evaluation of Near-Surface Wind Speed Changes during 1979 to 2011 over China Based on Five Reanalysis Datasets. Atmosphere 2019, 10, 804. [Google Scholar] [CrossRef] [Green Version]
- Yang, F.; Lu, H.; Yang, K.; He, J.; Wang, W.; Wright, J.S.; Li, C.; Han, M.; Li, Y. Evaluation of multiple forcing data sets for precipitation and shortwave radiation over major land areas of China. Hydrol. Earth Syst. Sci. 2017, 21, 5805–5821. [Google Scholar] [CrossRef] [Green Version]
- Xie, Z.; Hu, Z.; Gu, L.; Sun, G.; Du, Y.; Yan, X. Meteorological Forcing Datasets for Blowing Snow Modeling on the Tibetan Plateau: Evaluation and Intercomparison. J. Hydrometeor. 2017, 18, 2761–2780. [Google Scholar] [CrossRef]
- Beck, H.E.; van Dijk, A.I.J.M.; Larraondo, P.R.; McVicar, T.R.; Pan, M.; Dutra, E.; Miralles, D.G. MSWX: Global 3-Hourly 0.1° Bias-Corrected Meteorological Data Including Near-Real-Time Updates and Forecast Ensembles. Bull. Am. Meteor. Soc. 2022, 103, E710–E732. [Google Scholar] [CrossRef]
- Lu, E.; Zeng, Y.; Luo, Y.; Ding, Y.; Zhao, W.; Liu, S.; Gong, L.; Jiang, Y.; Jiang, Z.; Chen, H. Changes of summer precipitation in China: The dominance of frequency and intensity and linkage with changes in moisture and air temperature. J. Geophys. Res. Atmos. 2014, 119, 12575–12587. [Google Scholar] [CrossRef]
- Qian, W.; Fu, J.; Yan, Z. Decrease of light rain events in summer associated with a warming environment in China during 1961–2005. Geophys. Res. Lett. 2007, 34, 11. [Google Scholar] [CrossRef]
- Liang, X.; Jiang, L.; Pan, Y.; Shi, C.; Liu, Z.; Zhou, Z. A 10-Yr Global Land Surface Reanalysis Interim Dataset (CRA-Interim/Land): Implementation and Preliminary Evaluation. J. Meteorol. Res. 2020, 34, 101–116. [Google Scholar] [CrossRef]
- Shi, X.; Xu, X. Regional characteristics of the interdecadal turning of winter/summer climate modes in Chinese mainland. Chin. Sci. Bull. 2007, 52, 101–112. [Google Scholar] [CrossRef]
- Wu, Y.; Miao, C.; Duan, Q.; Shen, C.; Fan, X. Evaluation and projection of daily maximum and minimum temperatures over China using the high-resolution NEX-GDDP dataset. Clim. Dyn. 2020, 55, 2615–2629. [Google Scholar] [CrossRef]
- Jiao, D.; Xu, N.; Yang, F.; Xu, K. Evaluation of spatial-temporal variation performance of ERA5 precipitation data in China. Sci. Rep. 2021, 11, 17956. [Google Scholar] [CrossRef]
- Karger, D.N.; Wilson, A.M.; Mahony, C.; Zimmermann, N.E.; Jetz, W. Global daily 1 km land surface precipitation based on cloud cover-informed downscaling. Sci. Data 2021, 8, 307. [Google Scholar] [CrossRef] [PubMed]
- Taylor, K.E. Summarizing multiple aspects of model performance in a single diagram. J. Geophys. Res. 2001, 106, 7183–7192. [Google Scholar] [CrossRef]
- Bosch, J.; Staffell, I.; Hawkes, A.D. Temporally explicit and spatially resolved global offshore wind energy potentials. Energy 2018, 163, 766–781. [Google Scholar] [CrossRef]
- Gruber, K.; Klöckl, C.; Regner, P.; Johann, B.; Johannes, S. Assessing the Global Wind Atlas and local measurements for bias correction of wind power generation simulated from MERRA-2 in Brazil. Energy 2019, 189, 116212. [Google Scholar] [CrossRef] [Green Version]
- Lledó, L.; Torralba, V.; Soret, A.; Ramon, J.; Doblas-Reyes, F.J. Seasonal forecasts of wind power generation. Renew. Energy 2019, 143, 91–100. [Google Scholar] [CrossRef]
- Jiang, Y.; Gao, Y.; He, C.; Liu, B.; Pan, Y.; Li, X. Spatiotemporal distribution and variation of wind erosion over the Tibetan Plateau based on a coupled land-surface wind-erosion model. Aeolian Res. 2021, 50, 100699. [Google Scholar] [CrossRef]
Figure 1.
Elevation (unit: m) of the Chinese Mainland; red points are the distribution of the stations over Chinese Mainland; black dotted frames show the eight sub-regions.
Figure 1.
Elevation (unit: m) of the Chinese Mainland; red points are the distribution of the stations over Chinese Mainland; black dotted frames show the eight sub-regions.

Figure 2.
Spatial distribution of temperature bias of NSMF datasets against observations (unit: °C). From left to right column, the results of T2m, Tmax and Tmin are shown, respectively.
Figure 2.
Spatial distribution of temperature bias of NSMF datasets against observations (unit: °C). From left to right column, the results of T2m, Tmax and Tmin are shown, respectively.

Figure 3.
The same as Figure 2, but for RMSE (unit: °C) of surface air temperature.
Figure 3.
The same as Figure 2, but for RMSE (unit: °C) of surface air temperature.

Figure 4.
Inter-annual variation in SCC (left column) and RMSE (right column) between NSMF datasets and observations over China for surface air temperature.
Figure 4.
Inter-annual variation in SCC (left column) and RMSE (right column) between NSMF datasets and observations over China for surface air temperature.

Figure 5.
Spatial distribution of bias in annual mean precipitation for NSMF datasets (unit: mm/day).
Figure 5.
Spatial distribution of bias in annual mean precipitation for NSMF datasets (unit: mm/day).

Figure 6.
The same as Figure 5, but for RMSE (unit: mm/day) of annual mean precipitation.
Figure 6.
The same as Figure 5, but for RMSE (unit: mm/day) of annual mean precipitation.

Figure 7.
Time series of (a) SCC and (b) RMSE between NSMF datasets and observations for annual mean precipitation over China.
Figure 7.
Time series of (a) SCC and (b) RMSE between NSMF datasets and observations for annual mean precipitation over China.

Figure 8.
Taylor diagram for NSMF datasets in simulating the inter-annual variation in annual mean precipitation over eight sub-regions.
Figure 8.
Taylor diagram for NSMF datasets in simulating the inter-annual variation in annual mean precipitation over eight sub-regions.

Figure 9.
Seasonal cycles of precipitation (unit: mm/day) over eight sub-regions for observations and the four NSMF datasets.
Figure 9.
Seasonal cycles of precipitation (unit: mm/day) over eight sub-regions for observations and the four NSMF datasets.

Figure 10.
The same as Figure 5, but for bias (unit: m/s) in annual mean wind speed.
Figure 10.
The same as Figure 5, but for bias (unit: m/s) in annual mean wind speed.

Figure 11.
The same as Figure 5, but for RMSE (unit: m/s) of annual mean wind speed.
Figure 11.
The same as Figure 5, but for RMSE (unit: m/s) of annual mean wind speed.

Figure 12.
Inter-annual variation in (a) SCC and (b) RMSE for wind speed from the four NSMF datasets.
Figure 12.
Inter-annual variation in (a) SCC and (b) RMSE for wind speed from the four NSMF datasets.


Table 1.
Summary of the four NSMF datasets and observations used in this study.
| Datasets | Type | Spatial Scope | Variables | Temporal Resolution | Horizontal Resolution | Time Scope | Source |
|---|---|---|---|---|---|---|---|
| ERA5 | Gridded | Global | Monthly | 0.25° | January 1979–December 2017 | https://www.ecmwf.int/ (accessed on 1 May 2023) | |
| PGF | Gridded | Global | Daily | 0.25° | January 1979–December 2016 | http://hydrology.princeton.edu/data.pgf.php (accessed on 1 May 2023) | |
| MSWX | Gridded | Global | Daily | 0.1° | January 1979–December 2017 | http://www.gloh2o.org/mswx/ (accessed on 1 May 2023) | |
| CMFD | Gridded | China | Daily | 0.1° | January 1979–December 2017 | https://data.tpdc.ac.cn/zh-hans/data/8028b944-daaa-4511-8769-965612652c49/ (accessed on 1 May 2023) | |
| Observations | Station | China | Daily | over 2400 stations | January 1979–December 2017 | http://data.cma.cn/ (accessed on 1 May 2023) |
Table 2.
RMSEs (unit: °C) and SCCs between NSMF datasets and observations for annual and seasonal mean surface air temperature.
Table 2.
RMSEs (unit: °C) and SCCs between NSMF datasets and observations for annual and seasonal mean surface air temperature.
| T2m | Tmax | Tmin | |||||
|---|---|---|---|---|---|---|---|
| RMSE | SCC | RMSE | SCC | RMSE | SCC | ||
| ERA5 | 1.36 | 0.97 | 2.1 | 0.95 | 1.71 | 0.97 | |
| Annual | PGF | 1.11 | 0.98 | 1.22 | 0.97 | 1.27 | 0.98 |
| MSWX | 0.97 | 0.99 | 1.84 | 0.98 | 1.59 | 0.98 | |
| CMFD | 0.63 | 0.99 | |||||
| ERA5 | 1.49 | 0.96 | 2.29 | 0.92 | 1.97 | 0.97 | |
| Spring | PGF | 1.11 | 0.98 | 1.32 | 0.96 | 1.28 | 0.98 |
| MSWX | 1.02 | 0.98 | 2.12 | 0.96 | 1.75 | 0.98 | |
| CMFD | 0.62 | 0.99 | |||||
| ERA5 | 1.21 | 0.96 | 2.16 | 0.91 | 1.36 | 0.97 | |
| Summer | PGF | 1.01 | 0.97 | 1.26 | 0.94 | 1.1 | 0.97 |
| MSWX | 0.97 | 0.97 | 2.01 | 0.95 | 1.5 | 0.98 | |
| CMFD | 0.47 | 0.99 | |||||
| ERA5 | 1.3 | 0.98 | 2.07 | 0.96 | 1.63 | 0.97 | |
| Fall | PGF | 1.09 | 0.98 | 1.12 | 0.98 | 1.27 | 0.98 |
| MSWX | 0.97 | 0.99 | 1.65 | 0.98 | 1.6 | 0.98 | |
| CMFD | 0.64 | 0.99 | |||||
| ERA5 | 1.69 | 0.98 | 2.22 | 0.96 | 2.23 | 0.97 | |
| Winter | PGF | 1.32 | 0.99 | 1.33 | 0.99 | 1.54 | 0.99 |
| MSWX | 1.12 | 0.99 | 1.7 | 0.99 | 1.71 | 0.99 | |
| CMFD | 0.94 | 0.99 | |||||
Table 3.
RMSEs (unit: mm/day) and SCCs between NSMF datasets and observations for annual and seasonal mean precipitation.
Table 3.
RMSEs (unit: mm/day) and SCCs between NSMF datasets and observations for annual and seasonal mean precipitation.
| Annual | Spring | Summer | Fall | Winter | ||||||
|---|---|---|---|---|---|---|---|---|---|---|
| RMSE | SCC | RMSE | SCC | RMSE | SCC | RMSE | SCC | RMSE | SCC | |
| ERA5 | 0.89 | 0.87 | 0.97 | 0.94 | 1.45 | 0.83 | 0.84 | 0.8 | 0.55 | 0.86 |
| PGF | 0.71 | 0.92 | 0.71 | 0.97 | 1.43 | 0.86 | 0.68 | 0.89 | 0.3 | 0.95 |
| MSWX | 0.64 | 0.93 | 0.59 | 0.97 | 1.34 | 0.92 | 0.63 | 0.89 | 0.3 | 0.95 |
| CMFD | 0.6 | 0.94 | 0.56 | 0.98 | 1.11 | 0.86 | 0.61 | 0.91 | 0.24 | 0.96 |
Table 4.
RMSEs (unit: m/s) and SCCs of NSMF datasets for annual and seasonal mean wind speed.
| Annual | Spring | Summer | Fall | Winter | ||||||
|---|---|---|---|---|---|---|---|---|---|---|
| RMSE | SCC | RMSE | SCC | RMSE | SCC | RMSE | SCC | RMSE | SCC | |
| ERA5 | 0.81 | 0.63 | 0.83 | 0.66 | 0.74 | 0.62 | 0.86 | 0.66 | 0.9 | 0.61 |
| PGF | 1.36 | 0.37 | 1.33 | 0.42 | 1.12 | 0.31 | 1.42 | 0.39 | 1.75 | 0.35 |
| MSWX | 1.18 | 0.63 | 1.19 | 0.68 | 1.09 | 0.6 | 1.25 | 0.63 | 1.27 | 0.6 |
| CMFD | 0.67 | 0.65 | 0.7 | 0.71 | 0.62 | 0.65 | 0.66 | 0.65 | 0.76 | 0.61 |
Disclaimer/Publisher’s Note: The statements, opinions and data contained in all publications are solely those of the individual author(s) and contributor(s) and not of MDPI and/or the editor(s). MDPI and/or the editor(s) disclaim responsibility for any injury to people or property resulting from any ideas, methods, instructions or products referred to in the content. |
© 2023 by the authors. Licensee MDPI, Basel, Switzerland. This article is an open access article distributed under the terms and conditions of the Creative Commons Attribution (CC BY) license (https://creativecommons.org/licenses/by/4.0/).
Share and Cite
MDPI and ACS Style
Lin, H.; Yang, Y.; Wang, S.; Wang, S.; Tang, J.; Dong, G. Evaluation of MSWX Bias-Corrected Meteorological Forcing Datasets in China. Sustainability 2023, 15, 9283. https://doi.org/10.3390/su15129283
AMA Style
Lin H, Yang Y, Wang S, Wang S, Tang J, Dong G. Evaluation of MSWX Bias-Corrected Meteorological Forcing Datasets in China. Sustainability. 2023; 15(12):9283. https://doi.org/10.3390/su15129283
Chicago/Turabian StyleLin, Hai, Yi Yang, Shuguang Wang, Shuyu Wang, Jianping Tang, and Guangtao Dong. 2023. "Evaluation of MSWX Bias-Corrected Meteorological Forcing Datasets in China" Sustainability 15, no. 12: 9283. https://doi.org/10.3390/su15129283
Note that from the first issue of 2016, this journal uses article numbers instead of page numbers. See further details here.