
Evaluation of a Team-Based Collection and Delivery Operation


1
Department of Architecture and Building Engineering, School of Environment and Society, Tokyo Institute of Technology, Tokyo 152-8550, Japan
2
Department of Geography, Geology and the Environment, Kingston University, Kingston upon Thames KT1 2EE, UK
3
Department of Geography, Birkbeck, University of London, London WC1E 7HX, UK
*
Author to whom correspondence should be addressed.
Sustainability 2023, 15(11), 9117; https://doi.org/10.3390/su15119117
Submission received: 5 March 2023
/
Revised: 25 May 2023
/
Accepted: 29 May 2023
/
Published: 5 June 2023
(This article belongs to the Section Sustainability in Geographic Science)
Abstract
:The rise in the volume of e-commerce is adding increasing pressure on the logistics of parcel delivery. To improve the efficiency of their operations, the parcel industry in Japan is exploring team-based collection and delivery (TCD), whereby the sales driver (SD) hands out parcels to the field crews (FC), who subsequently deliver them to the door. However, the efficiency of TCD is still understudied. This study proposes a method for optimizing the delivery route for TCD and evaluates the efficiency of the ongoing operation. The TCD delivery problem focuses on minimizing the task completion time using parameters derived through surveys of the actual operations. Comparison between seven different methods show that the newly proposed method of fuzzy c-means clustering with a genetic algorithm outperforms the rest, rapidly computing sufficiently accurate results. Results suggest that the proposed optimal route reduces the total delivery time by up to 18.7%. However, the amount of time saved varies considerably by the area and the number of parcels delivered. Additional constraints for improving driver safety, the cost-benefit of increasing FCs, and the impact on the environmental cost are also considered. The proposed method also helps spread the workload and the travel time of the FCs more evenly, thus further reducing the total delivery time.
1. Introduction
The volume of parcel delivery is increasing rapidly at a global scale, as consumers shop more items online. The global market size of the parcel industry stands in the region of USD 381 billion (as of 2021), which is projected to grow by 5.7% each year to reach USD 658 billion by 2031 [1]. In Japan alone, the number of parcels delivered to homes exceeded 4.3 billion in 2018, an increase of more than 34% over the previous decade [2]. The COVID-19 pandemic has accelerated this tendency even further, and an early report suggests that over 5 billion parcels were delivered to homes in Japan in 2022. This has added considerable pressure on the parcel industry businesses, and they have started to explore ways to improve the efficiency of their operations so that they can cope with the increase in the volume of parcels.
One such attempt is to have a two-people team deliver the parcels. Until recently, parcel deliveries were primarily handled by single sales drivers (SDs) who drove their trucks around the delivery routes to collect and deliver parcels at the doors themselves. However, given the increase in the use of delivery services, some companies recently introduced a team-based collection and delivery (TCD) involving two people, namely, a sales driver (SD) who sets down the truck at a strategic access point and a field crew (FC) who receives the parcels from their respective SDs and delivers them by a handcart. The aim of adopting TCD is to improve the performance of the collection-and-delivery operation by reducing the total delivery time. This, in turn, allows them to complete deliveries during the morning hours, which is when people are more likely at home and, therefore, this reduces the number of redelivery cases [3]. From the standpoint of equal employment opportunity, keeping the delivery operation in the morning helps female workers to take delivery jobs without having to compromise their childcare needs.
The TCD is currently in its exploratory stage, and no systematic study has been carried out to optimise the delivery route for minimising the total delivery time. Finding an optimal route solution, if it exists, would maximise the utility of TCD and will help their logistics immensely. This study proposes a method for identifying the optimal route for TCD such that the time spent travelling around the delivery destinations is minimised. These routes will be compared with the actual delivery routes, and their efficiency will be measured using simulated data. The scope to further enhance the efficiency of TCD operations will be also explored by evaluating different combinations of delivery teams and the destination area whilst also incorporating additional constraints to better reflect the real-world scenarios. While the problem setting is similar to that of the multiple travelling salesman problem, this study considers how the SDs and the FCs assemble and disperse repeatedly at multiple P locations. In doing so, we formulate a new subcategory of a spatial-optimisation problem and propose its solution, numerically examine the efficiency of the proposed method through simulations, and verify the scope to expand it to the real-world context by conducting a field survey and comparing the actual delivery behaviour with the optimised delivery pattern derived by using the proposed method.
2. Literature Review
2.1. Existing Studies in Parcel Delivery
Studies of freight logistics and parcel delivery are many. Sachan and Datta (2005) carried out a systematic review of studies of logistics and supply chain management (SCM) with a focus on the methodology applied in each study [4]. Specifically, they reviewed research designs, hypothesis tests, and research methods, as well as the techniques for data analysis used by studies that appeared in highly rated academic journals: International Journal of Physical Distribution & Logistics Management (IJPDLM), Journal of Business Logistics (JBL), and Supply Chain Management: An International Journal (SCMIJ). The research methods used by these studies were broadly classified into six categories, namely, survey, interviews, simulation, mathematical modelling, case studies, conceptual model, and others. For instance, Haughton (2002) suggested that the metrics are affected by the capacity of delivery vehicles and the frequency of the delivery orders by the customers [5]. The study incorporated complex scenarios of real-world context in the vehicle routing problems, whilst also accounting for additional factors such as the equity in workloads across the drivers and the effect of customer concentration. Punakivi et al. (2001) discussed issues pertaining to the last-mile delivery and showed through simulation that the delivery of parcels with no confirmation of receipt could reduce the home delivery costs by up to 60 percent [6]. On mathematical modelling, Caplice and Sheffi (2003) discussed how shippers can use optimisation-based techniques for procuring transportation services [7]. They presented a theoretical underpinning to explain why conditional bidding and optimisation-based procurement make financial sense for improving the efficiency of transportation. Giddings et al. (2001) applied a response surface for finding the optimal cost coefficients in mixed integer linear programming problems to solve a large-scale location-allocation problem of the supply chain [8]. Gonzalez and Fernandez (2000) investigated the freight distribution from multiple origins to multiple destinations and concluded that use of fuzzy sets represents the provisional information such as costs, demands, and other variables while including the problem of the shortest route for the distribution vehicles [9]. They proposed using a genetic algorithm (GA) with a fuzzy fitness function, which can be adopted as a framework for solving a complex logistics problem, which this study will refer to. Others such as Lee and Ueng (1999) proposed a method to achieve a sense of fairness by balancing the load between the delivery persons through an integer programming model for vehicle routing problems [10]. Their study pursued dual objectives, to minimise the total distance and to balance the workload as much as possible. They also developed a heuristic algorithm to solve the problems. Considering additional criteria such as equitability of workload among the delivery persons is not only important for their morale but also helps to further improve the overall efficiency, and this study will also take this into account in later sections. Finally, Koç et al. (2020) pointed out that vehicle routing problems with simultaneous pickup and delivery (VRPSPD) has been pursued for over 30 years and that significant progress has been made in those years on this problem and its variants [11]. They conducted a comprehensive review of the existing work on the VRPSPDs, including their mathematical formulations, algorithms, variants, case studies, and industrial applications.
Within Japan, the recent shortage of drivers and increase in redeliveries have prompted a series of research on home delivery services, many of which introduce novel and creative ideas to improve the efficiency of delivery services [12]. For instance, Kawanishi and Suzuki (2018) used a simulation approach to measure the impact of introducing collection/delivery points (e.g., parcel lockers) and time-slot deliveries on vehicle mileage [13]. Similarly, Liu and Suzuki (2019) examined a delivery system that combines deliveries by trucks and drones [14]. With respect to the TCD, Miyatake et al. (2016) examined the logistics of such a framework from the operation management perspective and assessed the suitability of its application in areas TCD had been introduced [15]. However, their study did not discuss the impact of TCD on travel routes.
In Europe and the United States, home delivery services also saw a significant growth in recent years, but parcel collection methods have been investigated from quite early on [12]. For instance, Gevaers et al. (2009) compared several collection methods with respect to their delivery costs and concluded that home delivery is the most expensive option, while collecting parcels at stores or delivery points is the least expensive [16]. Similarly, Song et al. (2013) examined the impact of using retail stores, train stations, and other facilities in the UK as collection-and-delivery points and how that helped reduce CO2 emissions [17]. In addition, Iwan et al. (2015) showed that installing parcel lockers would help reduce delivery vehicle mileage [18]. However, their studies did not discuss the efficient arrangement of collection-and-delivery points or the choice of routes.
Another group of studies focuses on the use of simulation analysis. For instance, Boyer et al. (2009) used simulation analysis to demonstrate that specifying the delivery time slots results in increased mileage of the delivery trucks [19]. Their study serves as a reference for employing simulation analysis to measure the impact of new delivery routine and compare it to the status quo, and this study will adopt this framework for the comparative analysis between the proposed and the actual delivery routes. Another study that inspired our approach was the analysis by Campbell et al. (2006) on the ways in which delivery costs are reduced through the introduction of incentives to select specific time slots for home deliveries [20]. Their research serves as a reference for our study on the effect of possessing information on whether the recipient is at home and how that affects the efficiency of the delivery operation. In terms of studying the optimal allocation of routes and delivery persons, Dantzig and Ramser (1956) used linear programming to identify the assignment of gasoline delivery trucks to their destination gas stations that would minimise the total mileage covered by all trucks [21]. Their study offers an interesting reference for this study, although it is different in that this study has no fixed number of stops (e.g., gas stations) nor are their locations fixed to specific locations. More recently, Chang et al. (2018) formulated a drone delivery problem as a variant of the travelling salesperson problem (Ogawa and Inoue, 2014) and proposed to consolidate the delivery destinations using k-means clustering, although their study did not extend to detailed settings that reflect the real-world context [22,23].
When a study is conducted for minimising the total distance to reach all destinations, it becomes a variant of the travelling salesperson problem [24]. The computational complexity of this category of problems is NP-hard, thus making them increasingly difficult to solve within a reasonable amount of time as the number of travellers (or delivery persons) and the number of destinations increase. To resolve this challenge, several heuristic solutions have been proposed. For example, Ono et al. (2004) proposed a clustering method that can flexibly adopt predetermined conditions by defining degrees of attribution to multiple sets of points (or clusters) using the fuzzy c-means method [25]. In addition, Frederickson et al. (1978) proposed a tour-split method that divides the workload evenly across multiple people by splitting the optimal route for all points [26]. Similarly, Miyata and Hamamatsu (1998) proposed a method that uses perspective ratios to allocate the intermediary points to be visited between a pair of points for multiple people [27]. Furthermore, Gillett and Miller (1974) proposed the sweep method, which divides the target area into circular sectors (zones) that determine the set of points to be visited [28].
In terms of the last-mile delivery, a series of optimisation techniques have been proposed by a large body of research. For instance, Pahwa and Jaller (2022) developed a multi-echelon last-mile distribution model using continuous approximation (CA) techniques to evaluate the cost and benefit under diverse delivery conditions [29]. They suggested the use of low-volume, low-pollution vehicles to directly link local consolidation facilities with a nearby market to provide expedited deliveries whilst maintaining low cost and low emission. In addition, Liu et al. (2021) pointed out that driverless delivery robots (DDRs) are becoming a new attractive option for more customers looking for grocery or medication delivery [30]. They developed an algorithm for a multi-objective, multi-depot, two-tier location routing problem with parcel transshipment, where vans and DDRs comprise the two tiers. The idea of a tiered delivery approach resembles that of the team-based collection and delivery system discussed in this study. Janjevic et al. (2019) formulated a nonlinear optimisation model to decide on the locations of collection-and-delivery points (CDPs) and account for changes in demand patterns that may occur in reflection of their placement [31]. They also proposed a heuristic method to apply their model in a real-world context of last-mile distribution by a major Brazilian e-commerce player. Their research had a high impact as the evaluation of their model was based on a real-world case study. Ozarık et al. (2021) also considered the last-mile vehicle routing and scheduling problems in which they take into account the probability data for customer presence [32]. They solved the problem using an adaptive large neighbourhood search metaheuristic approach that iterates between the routing and scheduling components of the problem. Their research has addressed the major logistics issue of low successful deliveries, which we will discuss in this study.
2.2. Gap in the Literature and the Structure of this Study
The studies reviewed in the previous section collectively offer inspiration to our research on the conceptual framework for comparing different methods, the simulation-based analysis, and the evaluation of the actual routing data against the simulated solution. At the same time, existing studies tend to focus on the capacity of delivery trucks and the frequency of delivery with the aim to consolidate the delivery trips and the cost of redeliveries incurred by absent households. The optimal solution is usually obtained by deriving the optimal cost coefficients for the large-scale facility location and allocation problems, in which vehicle routing problems are analysed to minimise the total distance. They also developed a heuristic algorithm to solve the problems, and lessons learned in practice were used to improve theoretical and analytical framed works. Our research adopts many of these concepts and utilises them towards solving a team-based collection and delivery (TCD) problem. Specifically, this study formulates the problem of multiple people travelling around destinations while repeatedly gathering and dispersing TCD and propose a method for solving this problem efficiently. We will also examine the efficiency of the proposed method by comparing its output to the actual operations, extracting the travel characteristics of the delivery persons, and conducting a comparative analysis with the optimal routes. The efficiency of the delivery operation in relation to the characteristics of the delivery area and the impact of unattended destinations will be also considered.
The rest of this study is structured as follows. The methodology section introduces the theoretical framework of a team-based collection-and-delivery system (TCD) and its optimisation problem, which is formulated as an NP-hard problem. A total of seven methods will be presented and their outcomes will be compared with one another. This is followed by the analysis section, which uses parameters observed through field surveys of the actual delivery operation. The strengths and weaknesses of each method is examined through simulation analysis, comparing their computational times, as well as the choice of delivery route and handover points. Once the best method is decided and the optimal solution is calculated, the actual delivery route observed through the field survey will be compared. The optimisation problem will be also refined with further constraints to increase its feasibility in a real-world context. It will incorporate a new index of social cost, consisting of the operating and the environmental costs, to evaluate the delivery operation. The number of delivery persons and rebalancing their workload will be also discussed with respect to the time required for completing the delivery work and the associated social cost. The study concludes with discussion of findings and scope for refinement and future research directions.
3. Methodologies
3.1. The Delivery Route Optimisation Problem
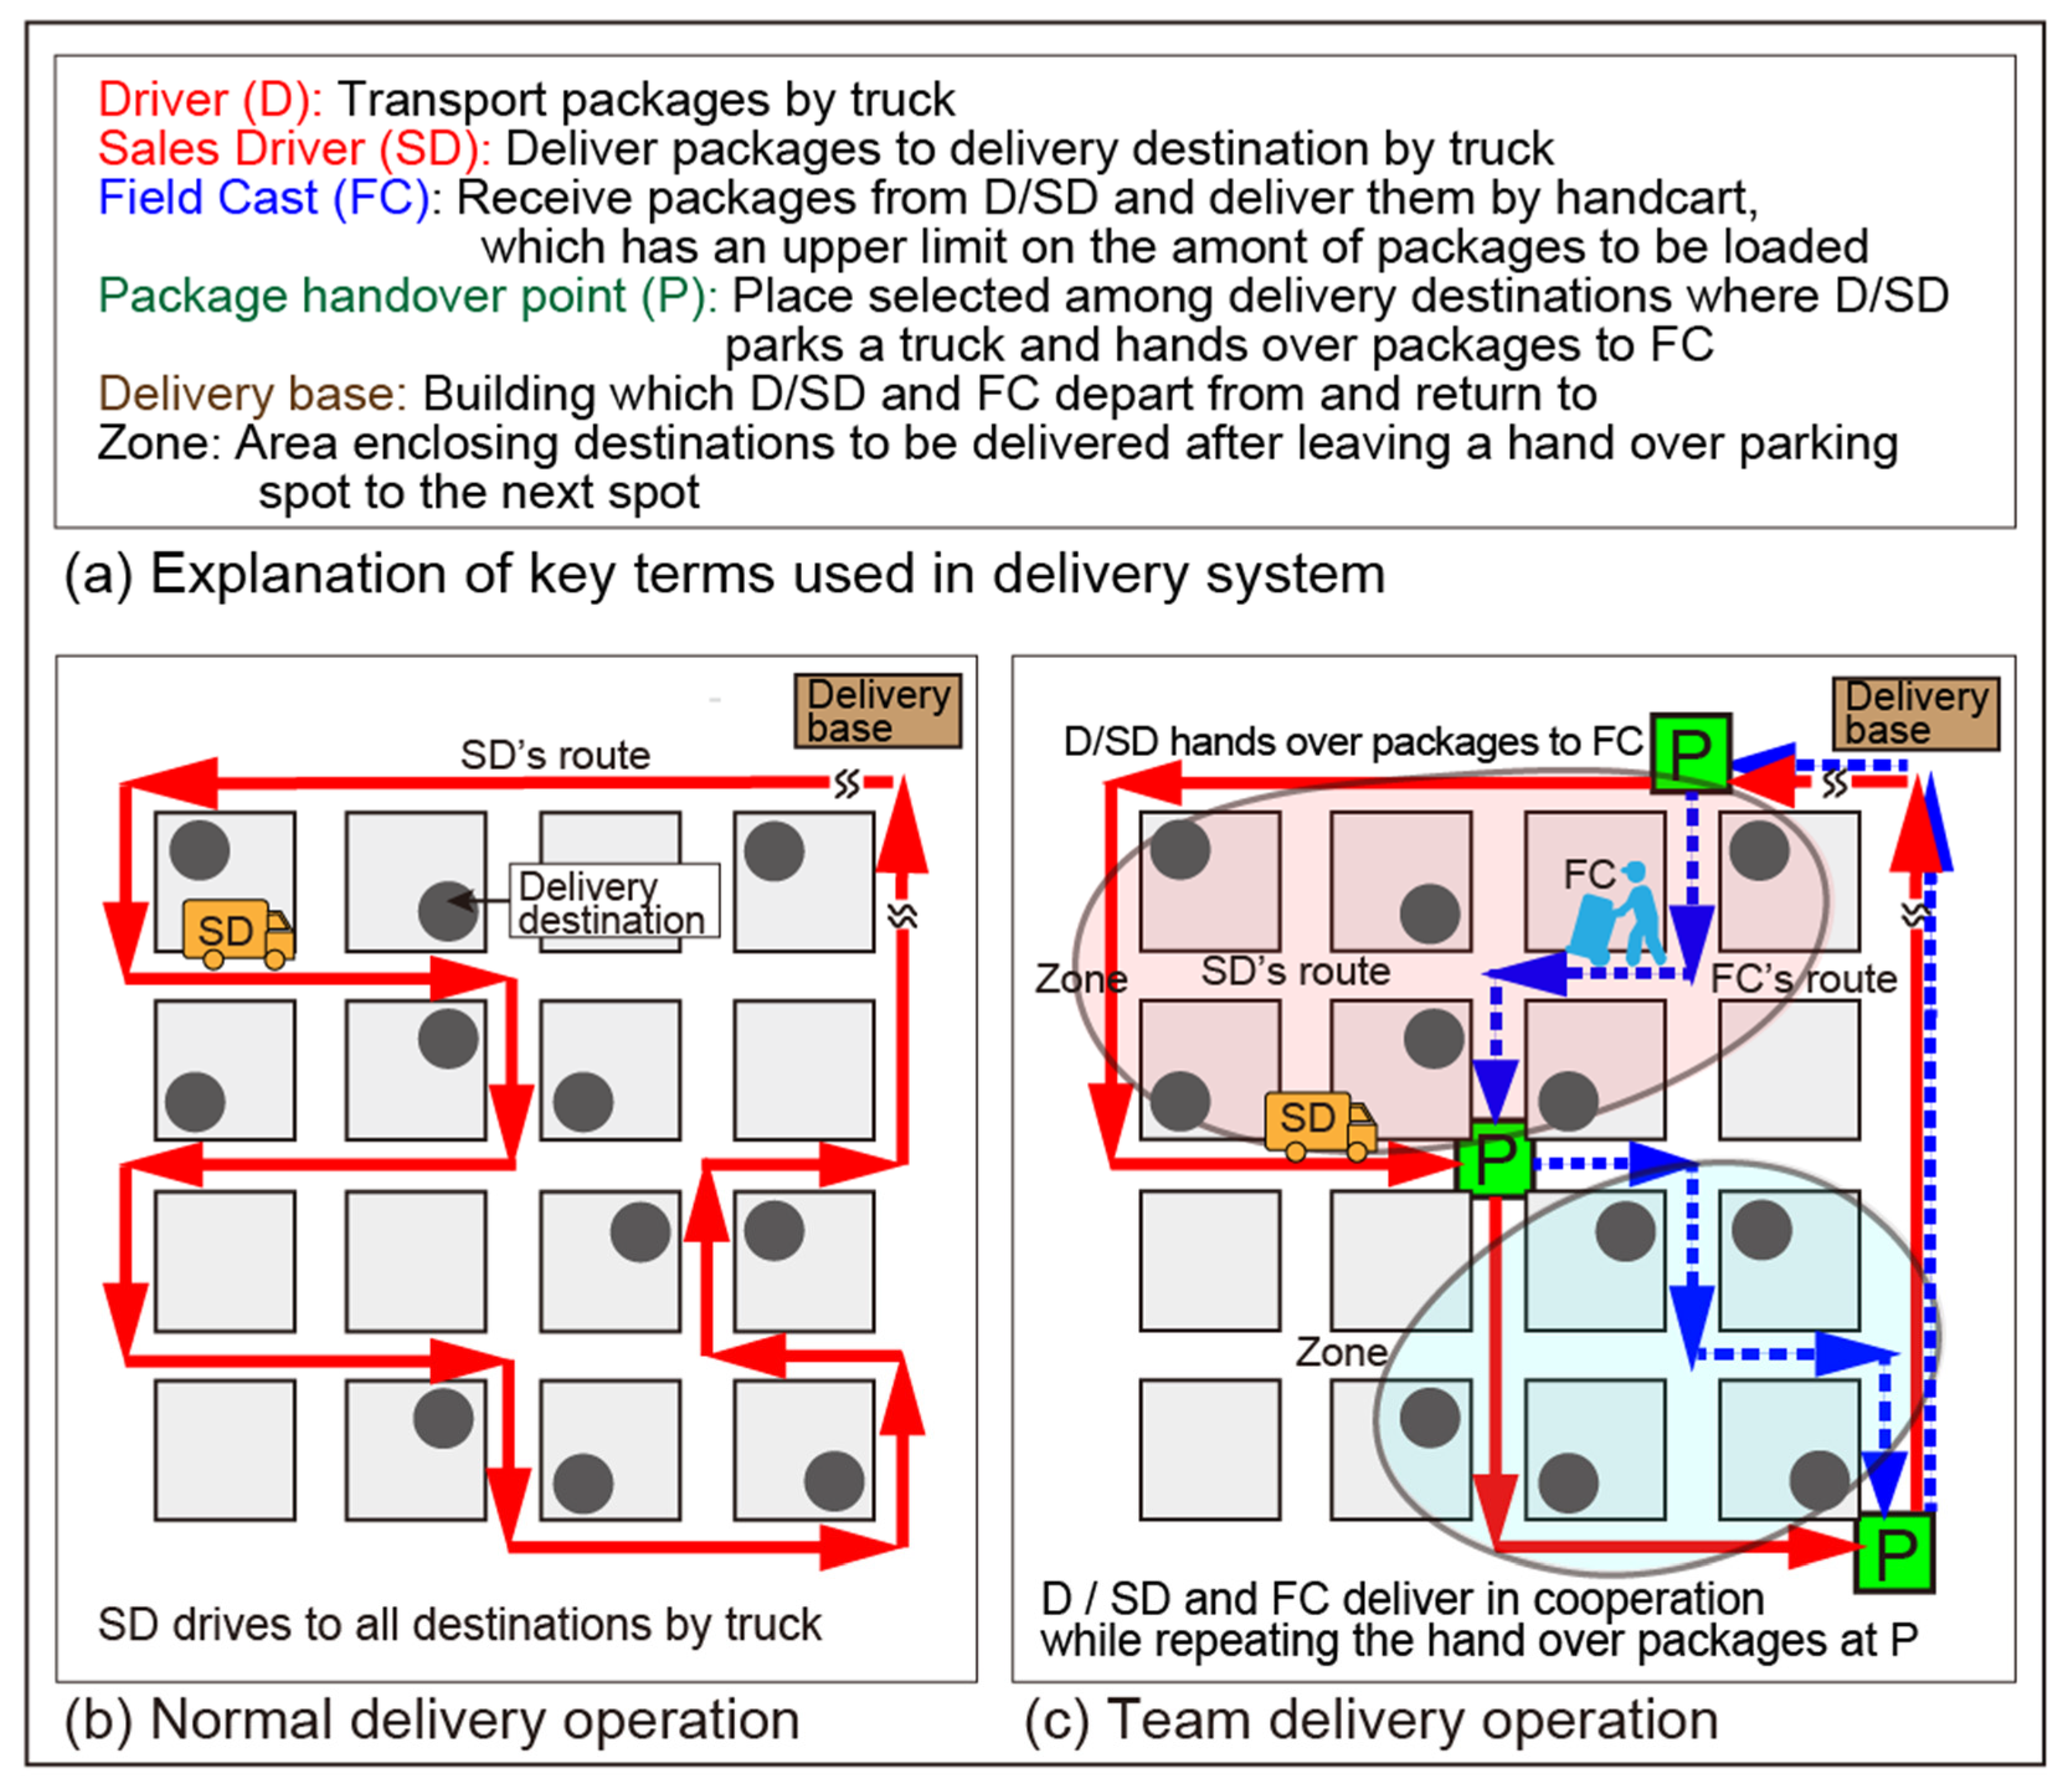
Figure 1 illustrates the concept of the regular- and the team-based collection-and-delivery operations. Under the TCD, an SD transports parcels by a truck and delivers parcels themselves, whereas a driver (D) only transports parcels by a truck and delegates the parcel delivery to the door to the FC(s). The FC(s) receive parcels from the SD (or D) at a parcel handover point P and deliver them on a handcart that has a limited loading capacity. The TCD is a system where the SD (or D) and FC work together as a team to visit the destinations while repeatedly gathering and dispersing at handover points. The delivery area covered by a given Pi is hereafter called a zone i. In other words, when a truck arrives at Pi, parcels to be delivered within zone I are dispersed from Pi to the respective households within zone i, before the truck moves on to the next handover point Pj. The problem can be summarised as follows:
Problem:
Suppose there are k + 1 delivery people in the delivery team (1 D/SD and k FCs). The D/SD hands over parcels to FC at P, each delivery person (SD and FCs) collects and delivers parcels to the door and gathers again at next P. Repeat these processes. When the delivery team gathers at the final P, the operation is completed. Then, find the locations of P and the routes to all destinations so that the delivery time is minimised.
Constraints:
(1) SD and FC collect from or deliver to at least one destination within each zone. (2) Destinations should be located within d meters away in one zone. (3) FC can carry maximum q pieces of parcels on their handcart for each delivery.
Table 1 shows the variables used in formulating the delivery routing problem for the TCD delivery problem. It seeks the combination of the route and the set of handover points P that minimises the total time required for one SD (or D) and k FCs to visit all delivery destinations and complete the deliveries (in completion time T).
The TCD delivery problem can be formulated as Equation (1) below, where we wish to minimise the total completion time T, which is the sum of delivery time in each zone tZr (time required to complete deliveries in zone r) and handover time tP at each of n number of handover points Ps (P = 1, 2, …, n) where a sales driver (SD) hands out parcels to field crews (FCs). Configuration of the locations and the number of handover points are the key determinants, as they would directly affect the efficiency of the delivery operations. Equations (2) and (3) hold true for the number of destinations that the SD and the uth FC are responsible for in zone r (mSDr and mFCru) and the number of parcels FC (q) can load on their handcart in one trip. In addition, Equations (4) and (5) hold true for the number of FCs (k), the total number of destinations including handover points (m), and the total number of handover points (n). The delivery time in zone r (tZr) is the maximum of the sum of delivery response time and travel time of the individual delivery persons (tSDr, tFCru), as shown in Equation (6). This is because either delivery person needs to wait for another delivery person at handover points.
The minimisation of travel time in zone r (tSDr, tFCru) is formulated as Equation (7) (which also applies for tFCru) using the travel distance between destinations i and j (crij) and the travel speed of each delivery person (vSD, vFC) [33]. Equations (8)–(11) set the constraints.
3.2. Formulation of the Team-Based Collection and Delivery Problem
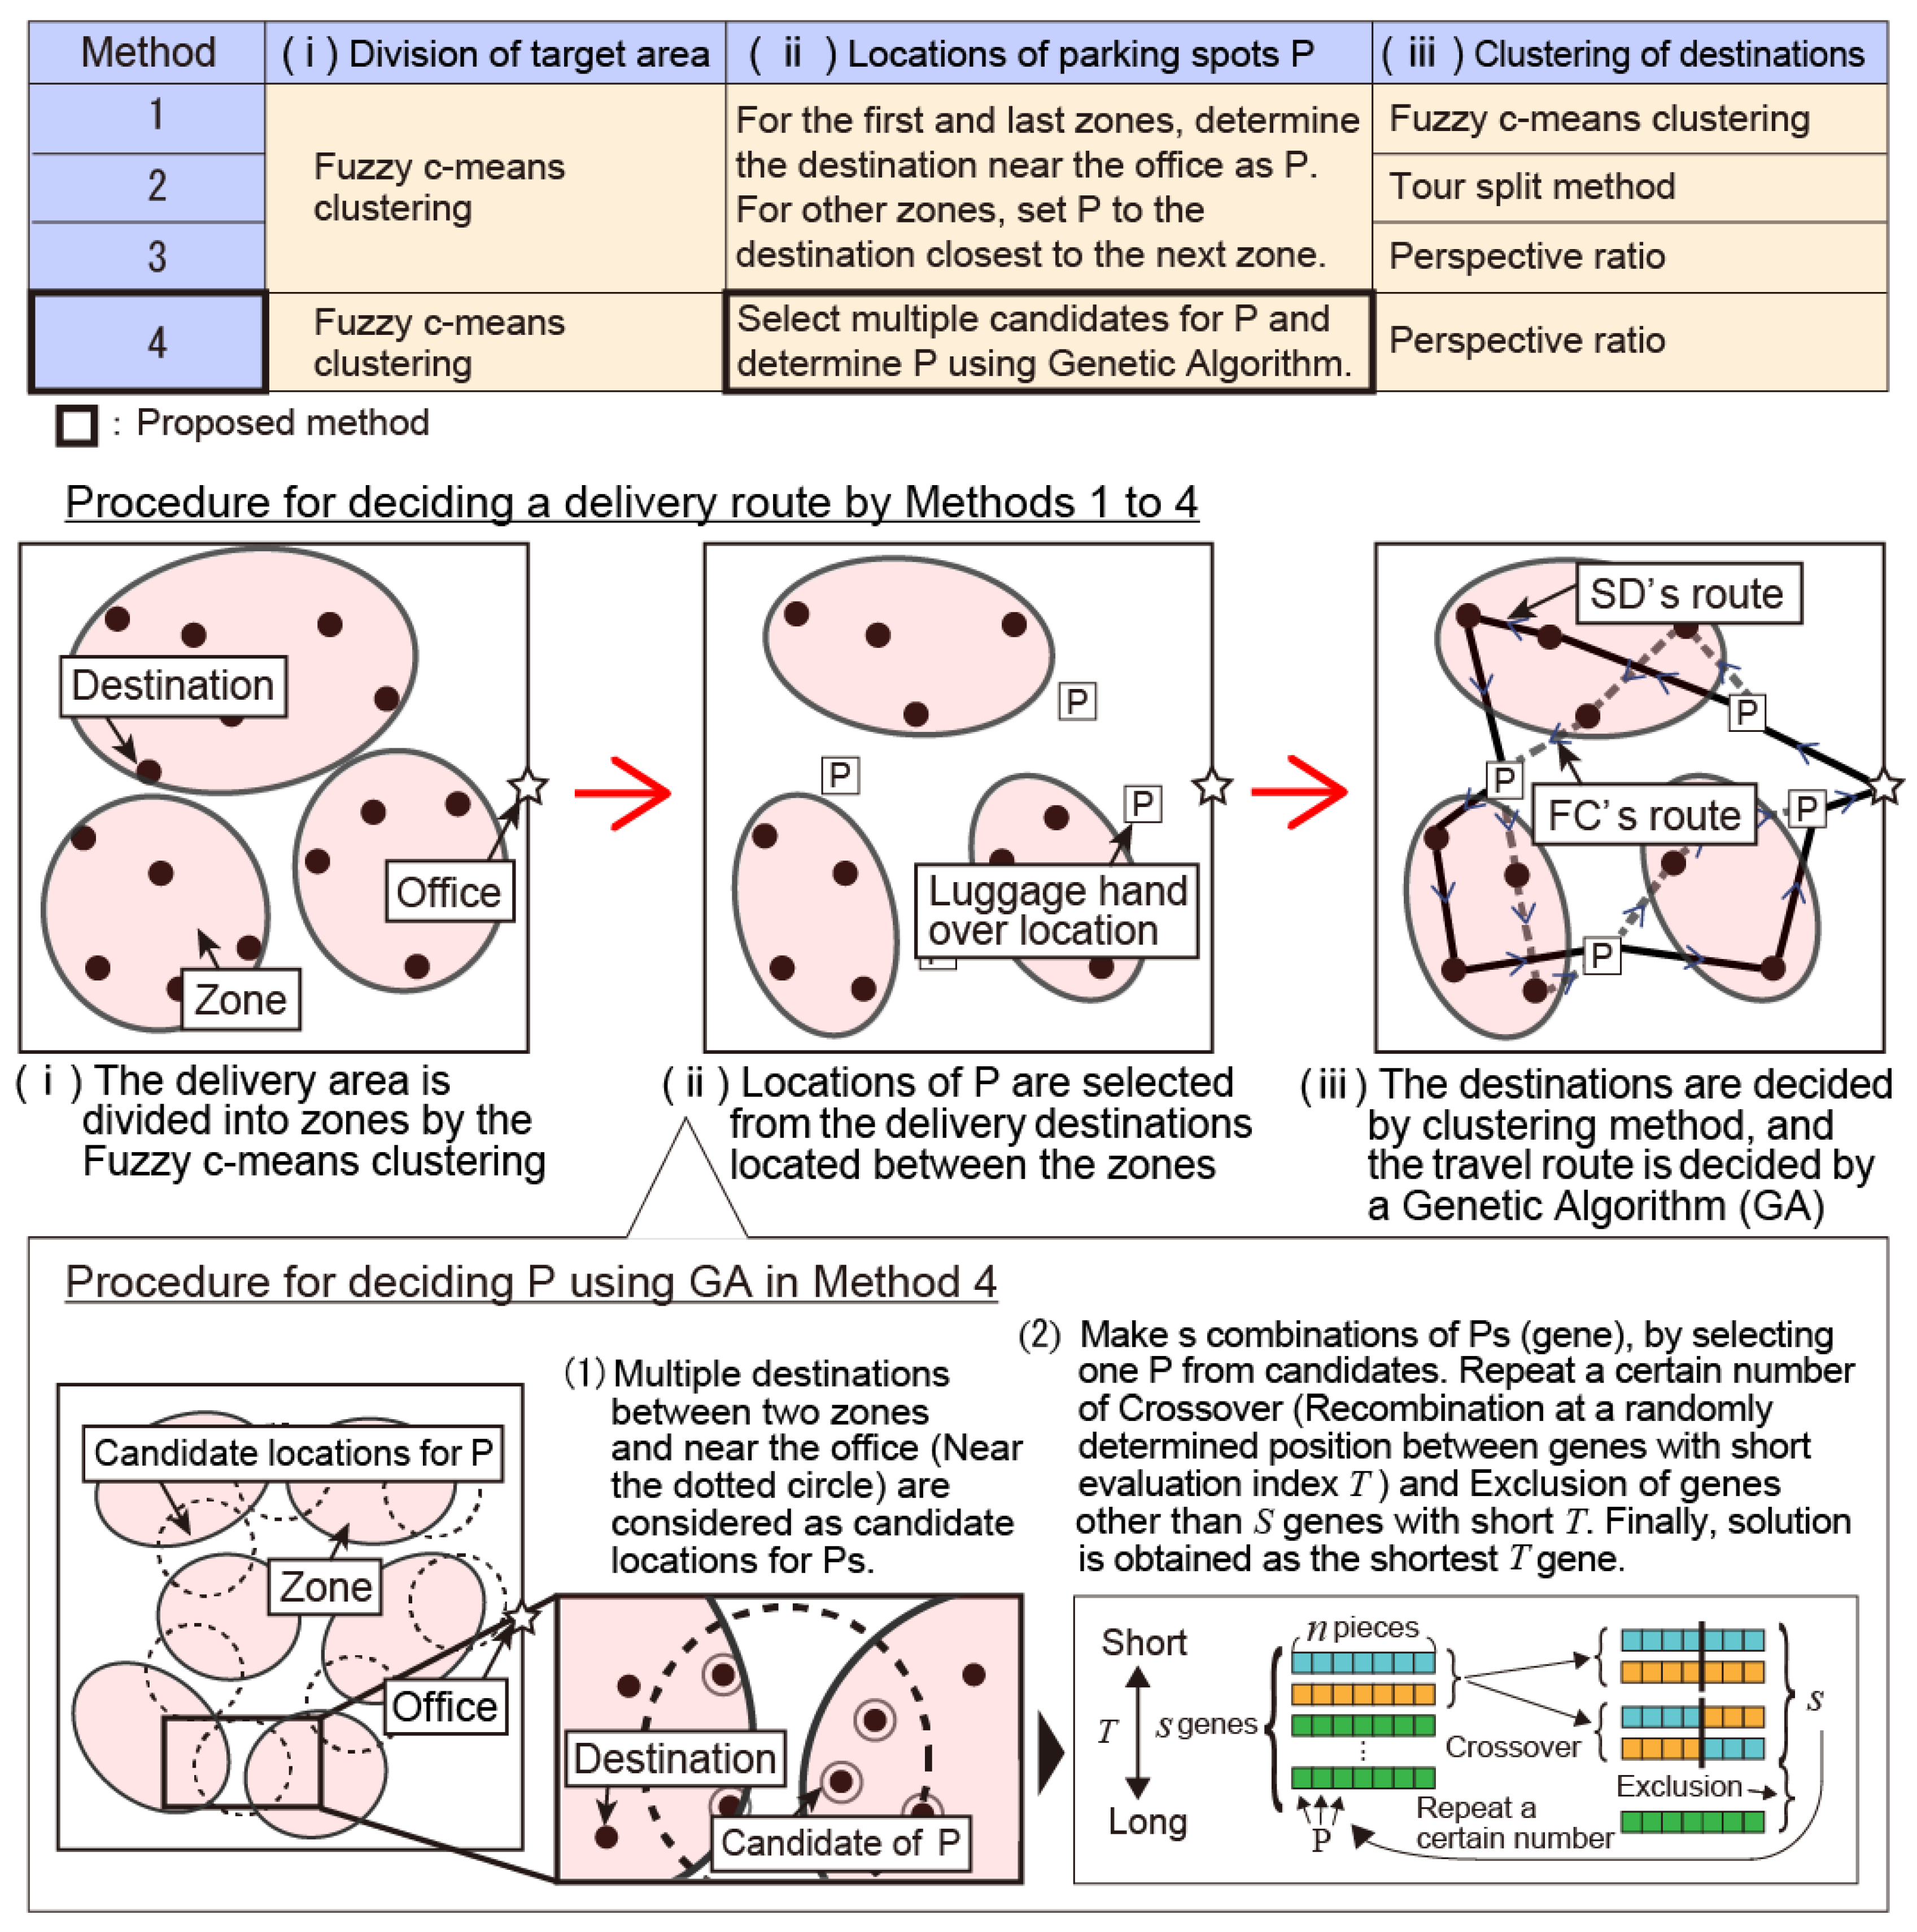
The TCD delivery problem is similar to the multiple travelling salesperson problem (hereafter multiple TSP) as they both seek solutions for multiple people traveling to multiple points, but they are also different in that the TCD delivery problem requires the travellers to repeatedly gather and disperse at each handover point. Therefore, solutions to the TCD delivery problem were investigated through a combination of methods employed by previous studies on the multiple TSP. Figure 2 and Figure 3 illustrate the range of possible methods for the TCD delivery problem. Both figures help clarify the comparison between different methods. The first group of methods (Figure 2) uses fuzzy c-means clustering and derives the solution through the following process:
- (i)
- Decide on the number of handover points: for methods 1–4, destinations are first classified into multiple zones by fuzzy c-means clustering using degrees of attribution measured in terms of the distance to the centre of gravity of the respective zone [25]. It is a heuristic solution whereby the attribution or the clusters are updated repeatedly and the search for the optimal route is carried out each time the attribution is changed.
- (ii)
- Determine the locations of handover points: destinations that clearly belong to one zone will be assigned, and those located around the boundary of two zones will be taken as candidates for either zone.
- (iii)
- Identify the cluster configuration of destinations: in methods 1–3, destinations within each zone are allocated to the delivery persons by applying fuzzy c-means clustering, the tour split method, and perspective ratios, respectively. Method 4, on the other hand, determines the optimal route through the application of a genetic algorithm (GA) [34].
Method 4 is a new method we propose in this study that extends method 3 by applying a genetic algorithm (GA) [34]. It uses GA for the purpose of determining the number and the locations of Ps but retains some flexibility in deriving the optimal P (as illustrated at the bottom of Figure 2). Specifically, it considers multiple destinations between two zones and nearby offices/homes as candidate locations for Ps, and subsequently computes s combinations of Ps (gene) by selecting a single P from the candidates’ pool. This is followed by repeating a certain number of crossovers, i.e., recombination at a randomly determined position between genes with short evaluation index T (i.e., the minimum total delivery time) and exclusion of genes other than S genes with short T. The solution is obtained by deriving the shortest T gene.
While GA may seem ill-fitted for obtaining the optimal solution, it is used for (1) determining the optimal location of P and (2) deriving the optimal route. Identifying the best arrangement of P locations is a simple combinatorial optimisation problem in which the optimum combination is identified among the combinations of multiple candidate locations that are finite and discrete. To simplify and improve the efficiency of calculation, GA is also incorporated in the calculation of the optimum route. The number of possible combinations from one P to the next P is confined by the road configurations, and our pilot exploration confirmed that GA yields sufficiently accurate results.
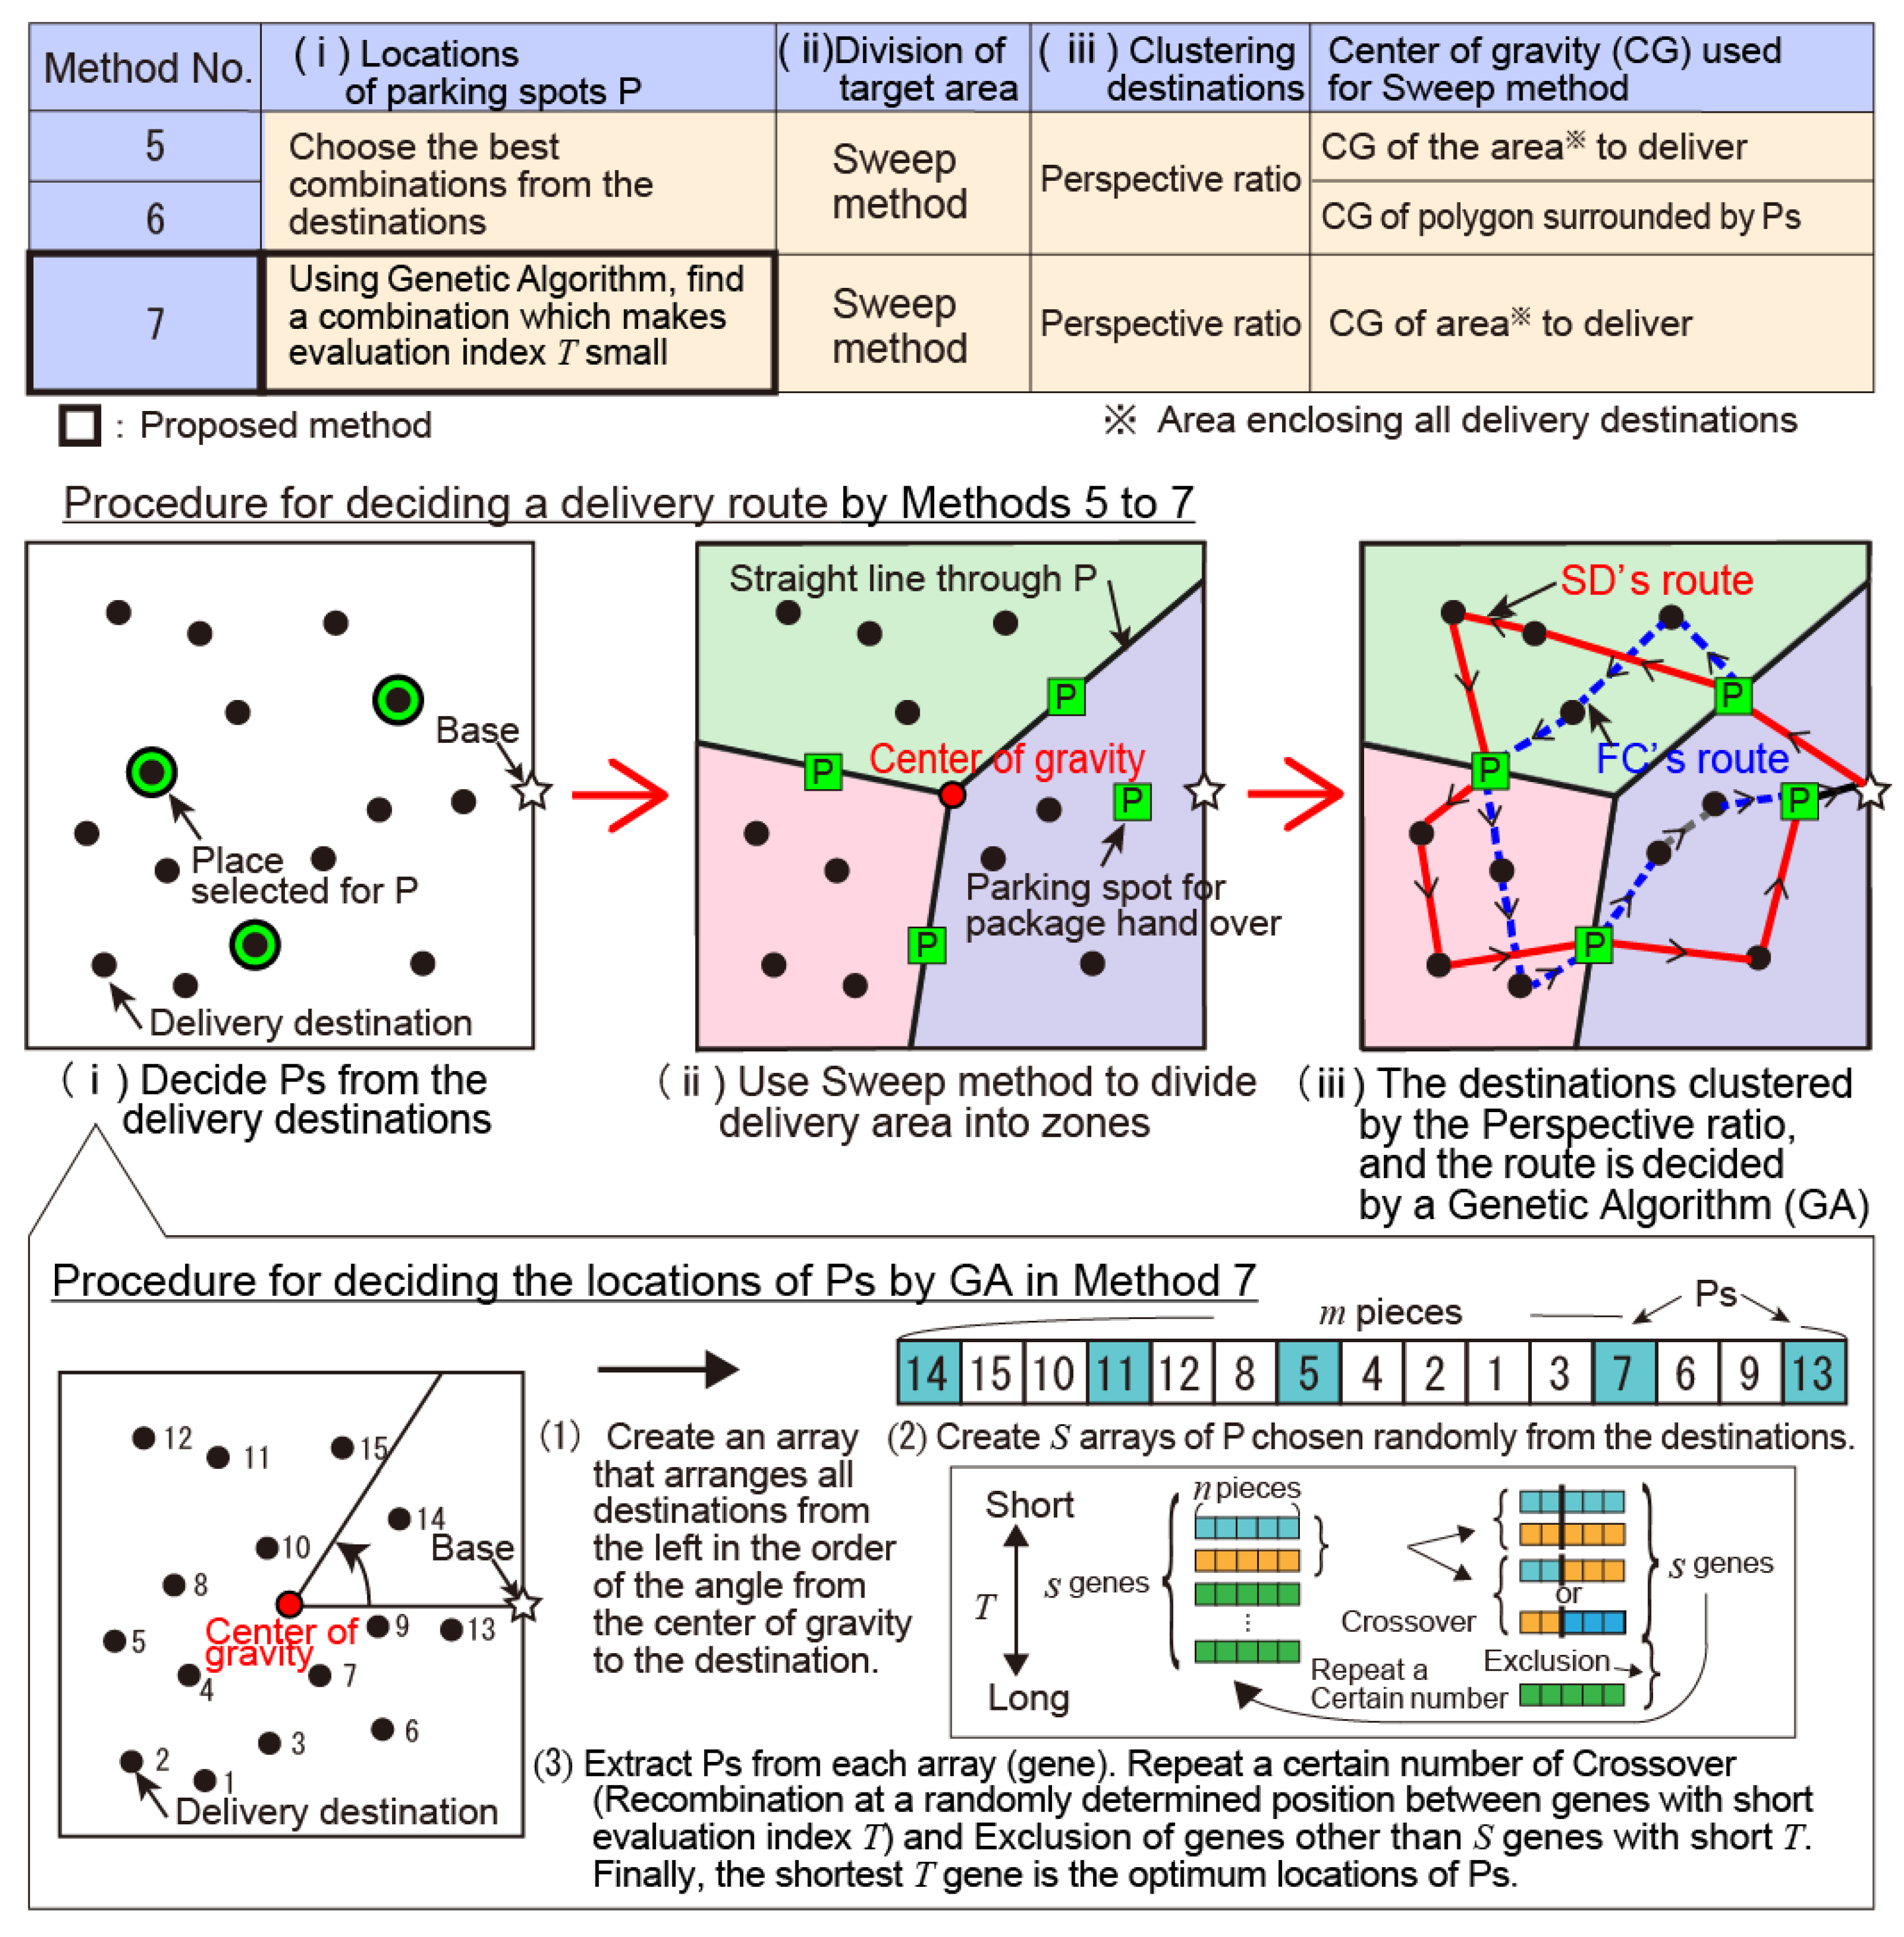
Figure 3 summarises the other group of methods (methods 5–7) we consider for calculating the TCD delivery problem, and their process can be summarised as follows:
- (i)
- Determine the locations of handover points: using the sweep method, locations of handover points are identified and their respective zones (or the circular sectors) are determined. Method 7 is a new method proposed in this study that identifies a small value for evaluation index T using GA (bottom section of Figure 3). The process consists of (1) the creation of an array that arranges all destinations from the left in the order of the angle from the centre of gravity to the destination, (2) establishment of S arrays of handover points selected randomly from the destinations, and (3) extraction of the handover points from each array (gene). This is followed by repeating a certain number of crossovers, i.e., recombination at a randomly determined position between genes with short evaluation index T and exclusion of genes other than S genes with short T. The solution is obtained by deriving the shortest T gene.
- (ii)
- Dividing the target area: the delivery area is divided into zones using the sweep method. In this process, the centre of gravity is used.
- (iii)
- Clustering the destinations: destinations in a zone are allocated to each delivery person (SD and FCs) using perspective ratios. The optimal route is determined using GA (middle section of Figure 3).
4. Analysis
4.1. Surveys and Evaluation of Team-Based Collection and Delivery
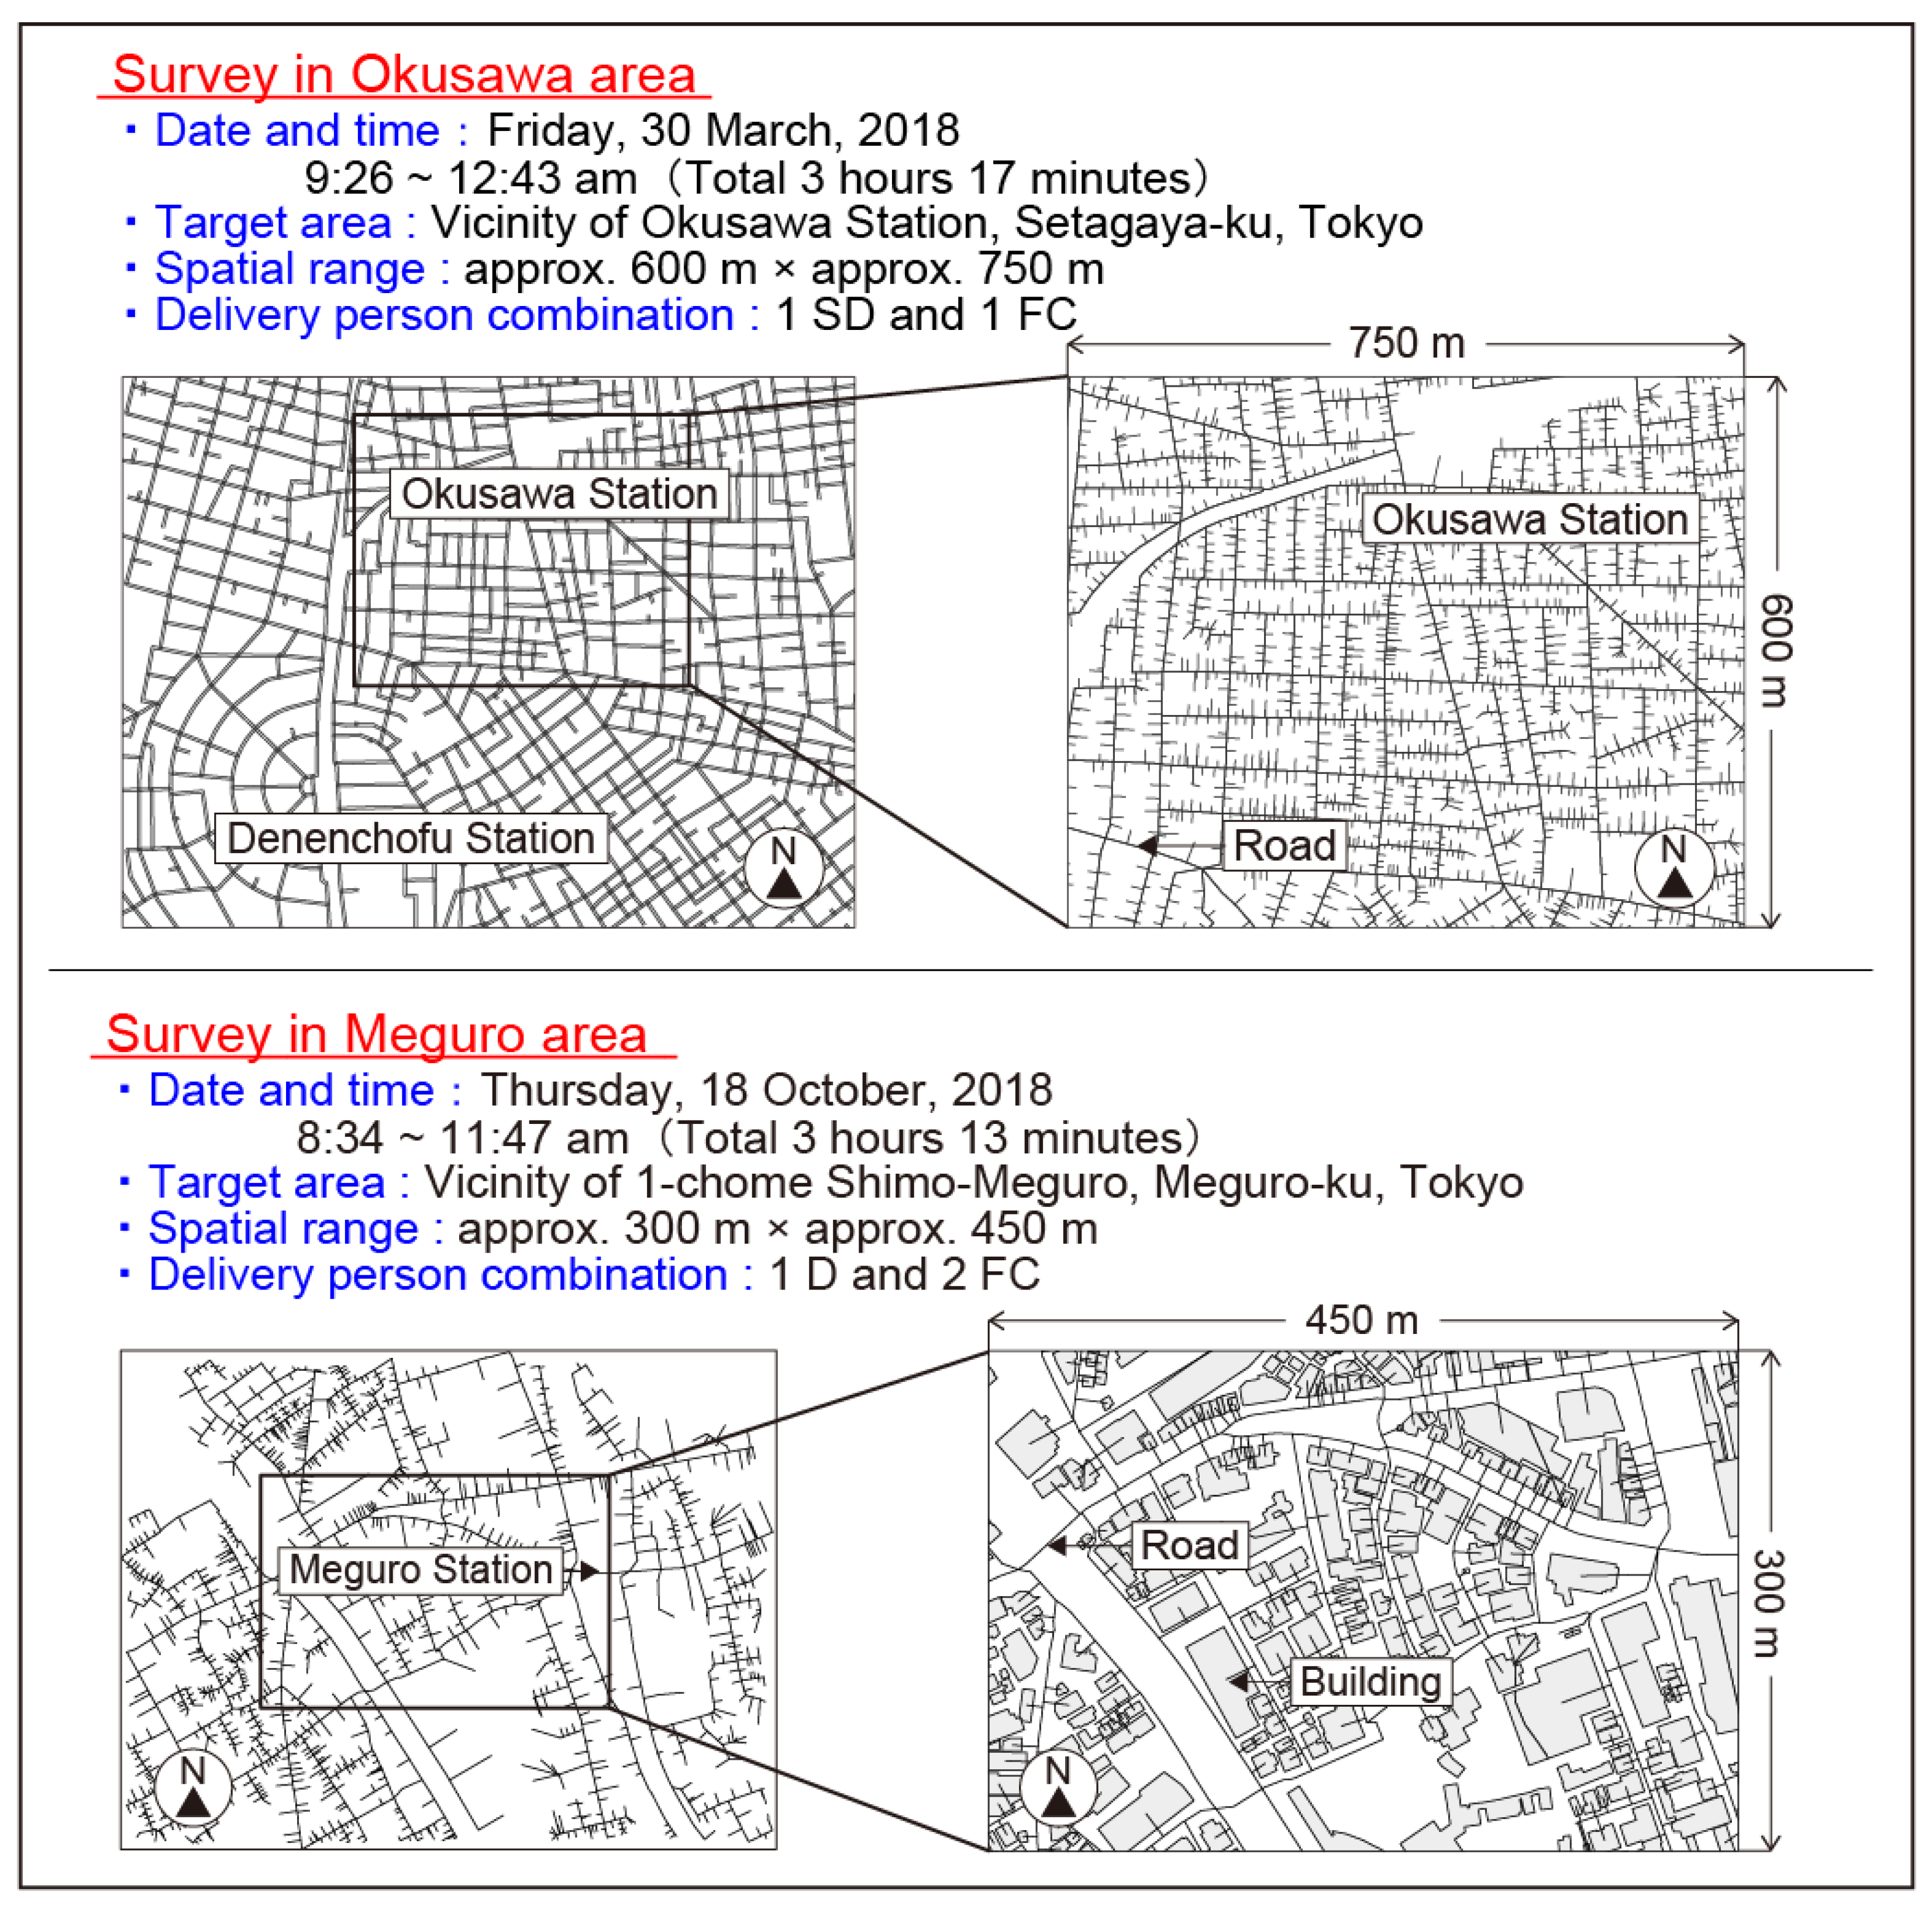
To collect empirical data, two field surveys were conducted. The first survey covered a low-rise residential area extending to approximately 600 m × 750 m near Okusawa Station in Setagaya-ku, Tokyo (hereafter called the Okusawa area). The second survey covered an approximately 300 m × 450 m area of medium- and high-rise housing and commercial buildings in the vicinity of Shimomeguro 1-chome, Meguro-ku, Tokyo (hereafter the Meguro area). In both areas, the survey data were collected from the actual delivery operations performed by the team-based delivery-and-collection teams from Yamato Transport Co., Ltd. (Tokyo, Japan), a leading door-to-door parcel delivery service company with a market share of 41% in Japan (Figure 4).
In each survey, an investigator accompanied each delivery person engaged in the operation during the morning hours when delivery volumes were high, and the investigator recorded the time, location, speed, and other attributes related to each instance of delivery using a GPS tracker and a bespoke recording app created for the purpose of that survey. In addition, to conduct the simulation discussed below using realistic conditions, one-way streets were surveyed and reflected in the road network data.
On the days of surveys, the TCD delivery in Okusawa was carried out by a team of one SD and one FC, while the TCD in Meguro was conducted by one D and two FCs. Duration of the delivery response time was consistently around 1 min with any delivery person when the destination was a detached house, but it varied widely (from 0.5 min to 30 min) with a housing complex or an office building, reflecting the number of parcels that required collection or delivery. Delivery parcels had been pre-sorted at the time of loading them onto the truck, and the parcel handover time at P was approximately 2–3 min (Table 2 and Table 3). However, there were instances when the same route had to be travelled repeatedly, extending the waiting time at the handover point. Results of the survey were reflected on the parameters in Equations (1)–(11), including the number of destinations including the handover points (m), number of handover points (n), number of loadable parcels for an FC (q), and the hours of operation (Table 4). However, because the response time at the delivery destination (tC) varied, two different values were set in the Okusawa area (1 min, 3 min), and three different values were set in the Meguro area (1 min, 10 min, 30 min).
4.2. Simulation Tests on the Optimisation Methods
Using the parameters extracted from the surveys (Table 4), a series of simulation tests were performed to compare the performance of methods 1–7. All models were coded in-house in C# on the Microsoft Visual Studio 2019 platform and were run on a regular notebook PC (Intel (R) Core (TM) i5-4210U CPU @ 1.70 GHz, 2.40 GHz). In this sense, the computational complexity would not be an issue for the proposed solutions, which returned results within a reasonable amount of time (e.g., 17.2 s when m = 200, n = 20).
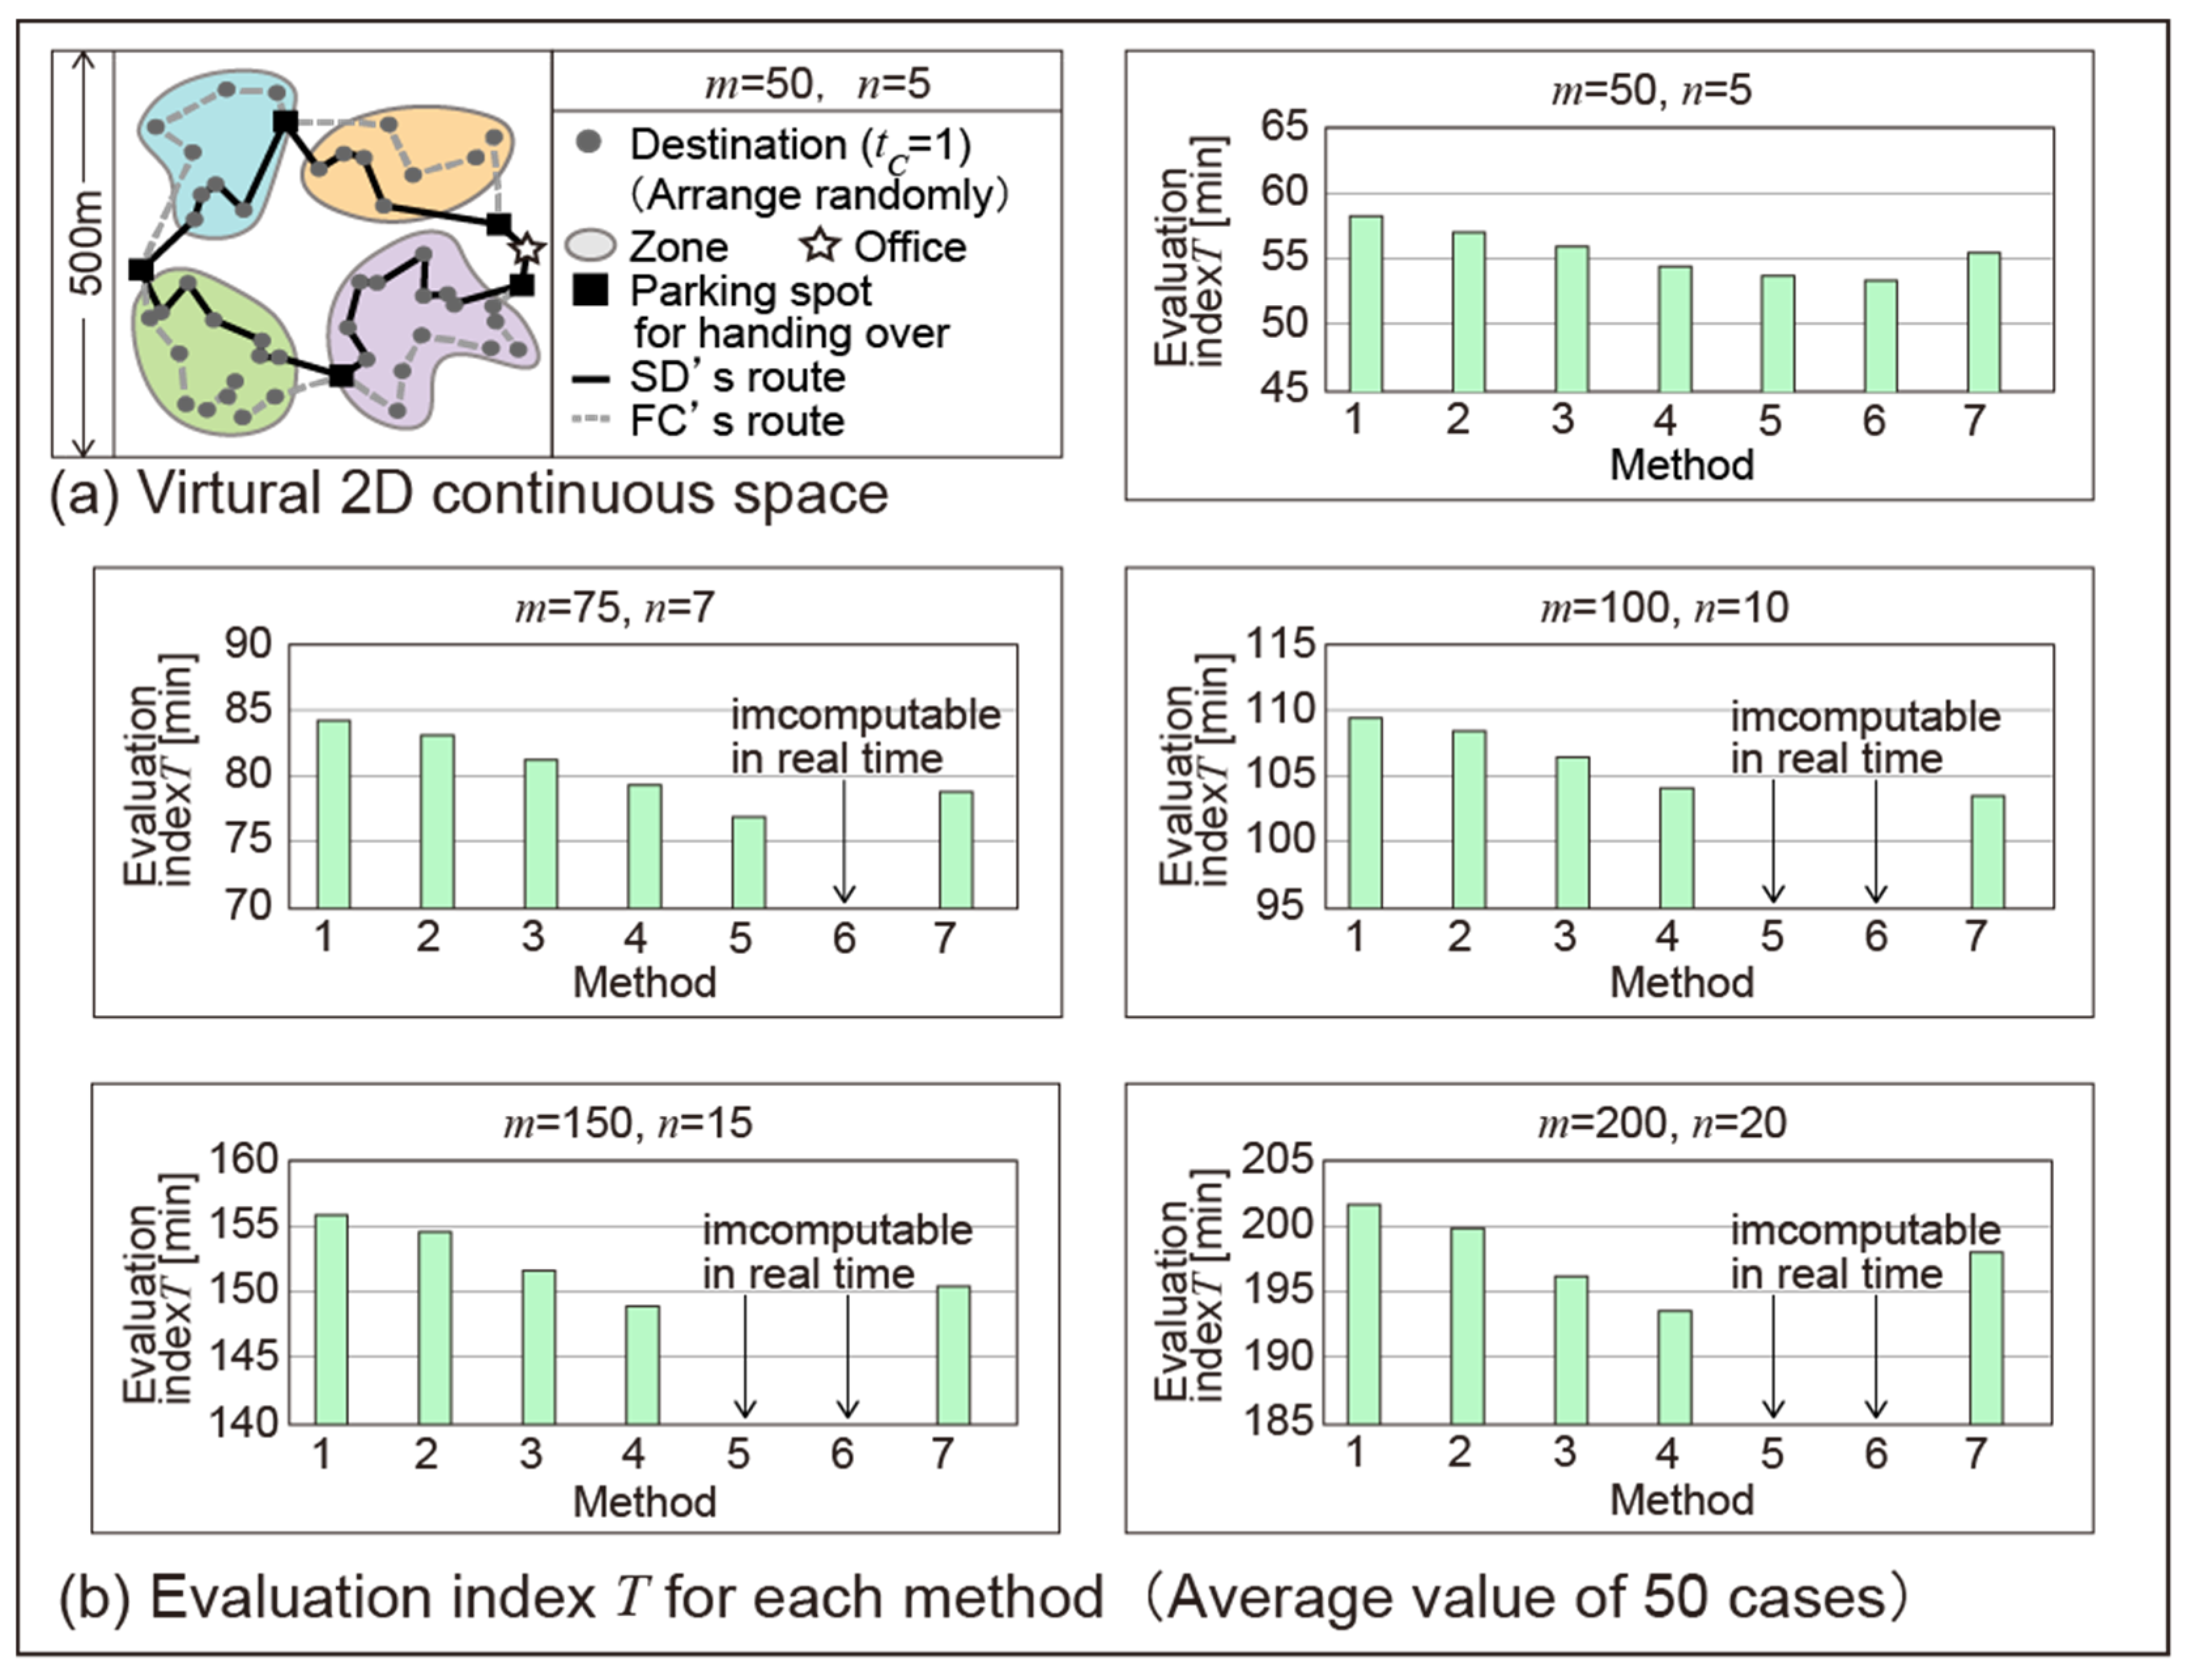
To ensure that the outcomes are independent of the road configuration, the simulation test was carried out in a contiguous two-dimensional space of 500 m × 500 m where destinations with response time tC = 1 were randomly generated (Figure 5a). The route with the shortest total delivery time T (evaluation index) was identified for a number of different combinations of (m, n) with different spatial distributions of destinations using methods 1–7 in Figure 2 and Figure 3. The simulation tests were carried out as follows:
- (i)
- The parameters were set, and the travel route was determined against the destination locations given.
- (ii)
- The objective function was set as the minimisation of the total delivery time T (Equation (1)).
- (iii)
Figure 5b shows the results from the simulation tests where the existing methods (methods 1, 2, 3, 5, and 6) and the methods newly proposed in this study (methods 4 and 7) were applied against the same set of simulated data. The histograms indicate that, in terms of the computation time, method 5 outperforms other methods in deriving evaluation index T when the number of destinations including Ps (m) is small. However, for a sufficiently large m, the complexity of the problem makes method 5 incomputable within a reasonable amount of time. In contrast, method 4 remains computable across all cases and outperforms other methods as illustrated in Figure 2 and Figure 3. The fact that we are exploring fuzzy c-means clusters using GA means that the solution derived may be a local optimum, but other methods have the same issue. For this reason, we will adopt method 4, namely, one of the new methods proposed in this study, to be the most suitable method for calculating the optimal route for TCD deliveries.
Further comparison of the computation time was made with a case (m = 15, n = 4) that is sufficiently small to allow the computation of the exact solution (i.e., global optimum where all permutations of stops and deliveries were exhaustively searched) in 9 h 56 min (Table 5). Overall, method 4 succeeded in maintaining the increase in T at around 2% and returns a reasonably short computation time across the board.
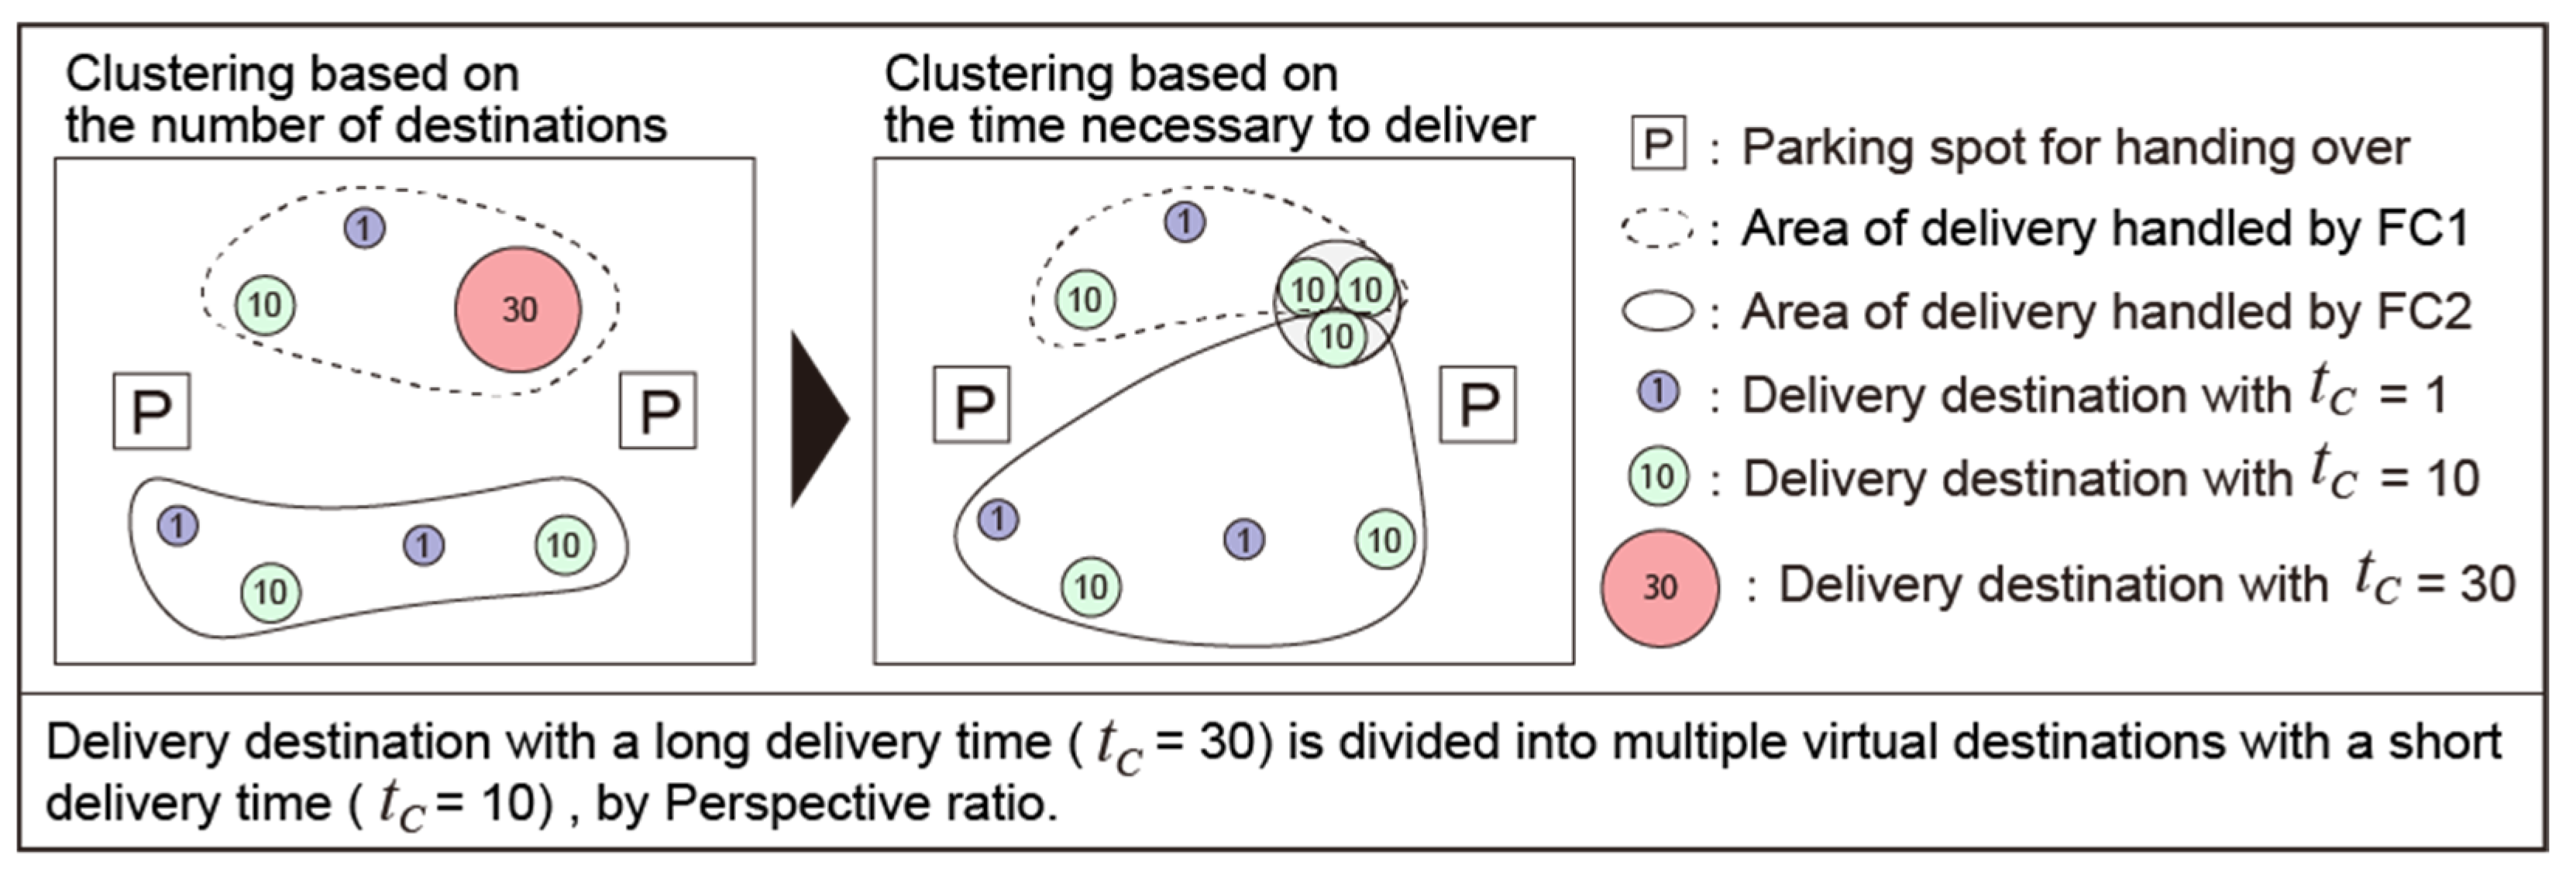
As mentioned earlier, the Meguro area consists of medium- and high-rise housing and commercial buildings, and the number of parcels vary widely among different destinations (buildings). If destinations are evenly split by the number of destinations, delivery persons with a small volume of delivery will complete their trip early and must wait at P, and this reduces the efficiency of the overall operation. To prevent this, we will now consider a framework that equalises the delivery work among the delivery persons by sharing destinations with large delivery volumes. Specifically, this study proposes an algorithm that divides destinations and allocates them between the delivery persons using perspective ratios. Figure 6 shows an example in which a destination with tC = 30 was divided into three destinations with tC = 10.
4.3. Comparative Analysis of the Optimal Route and the Actual Route
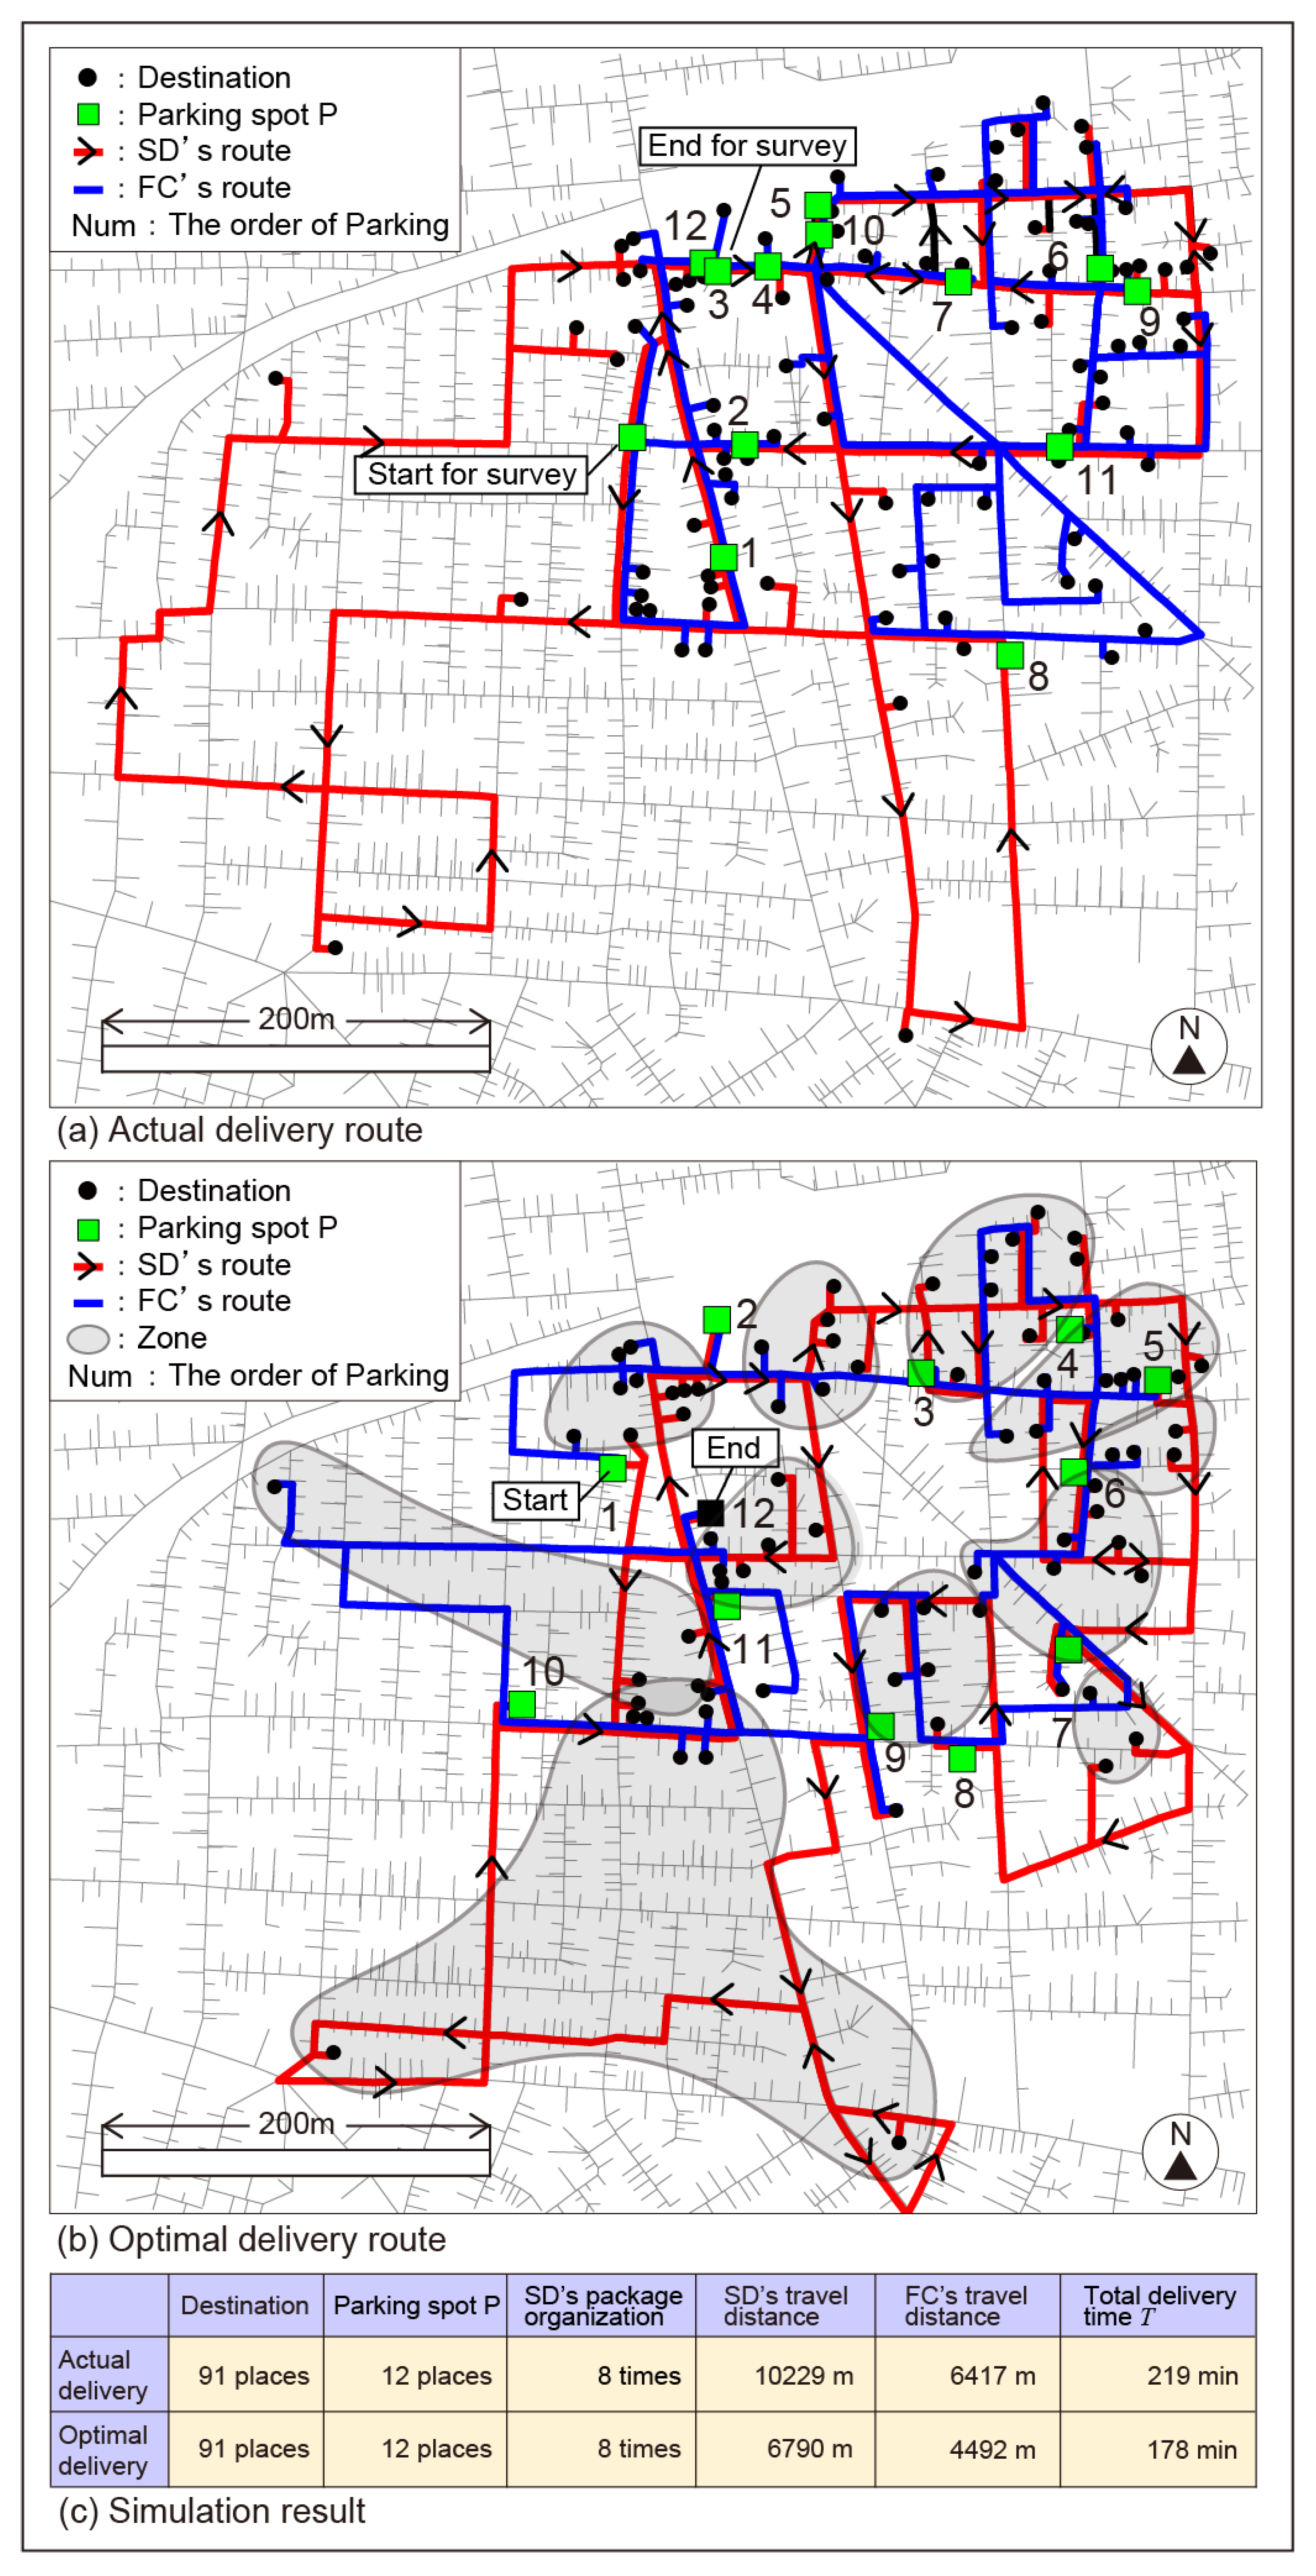
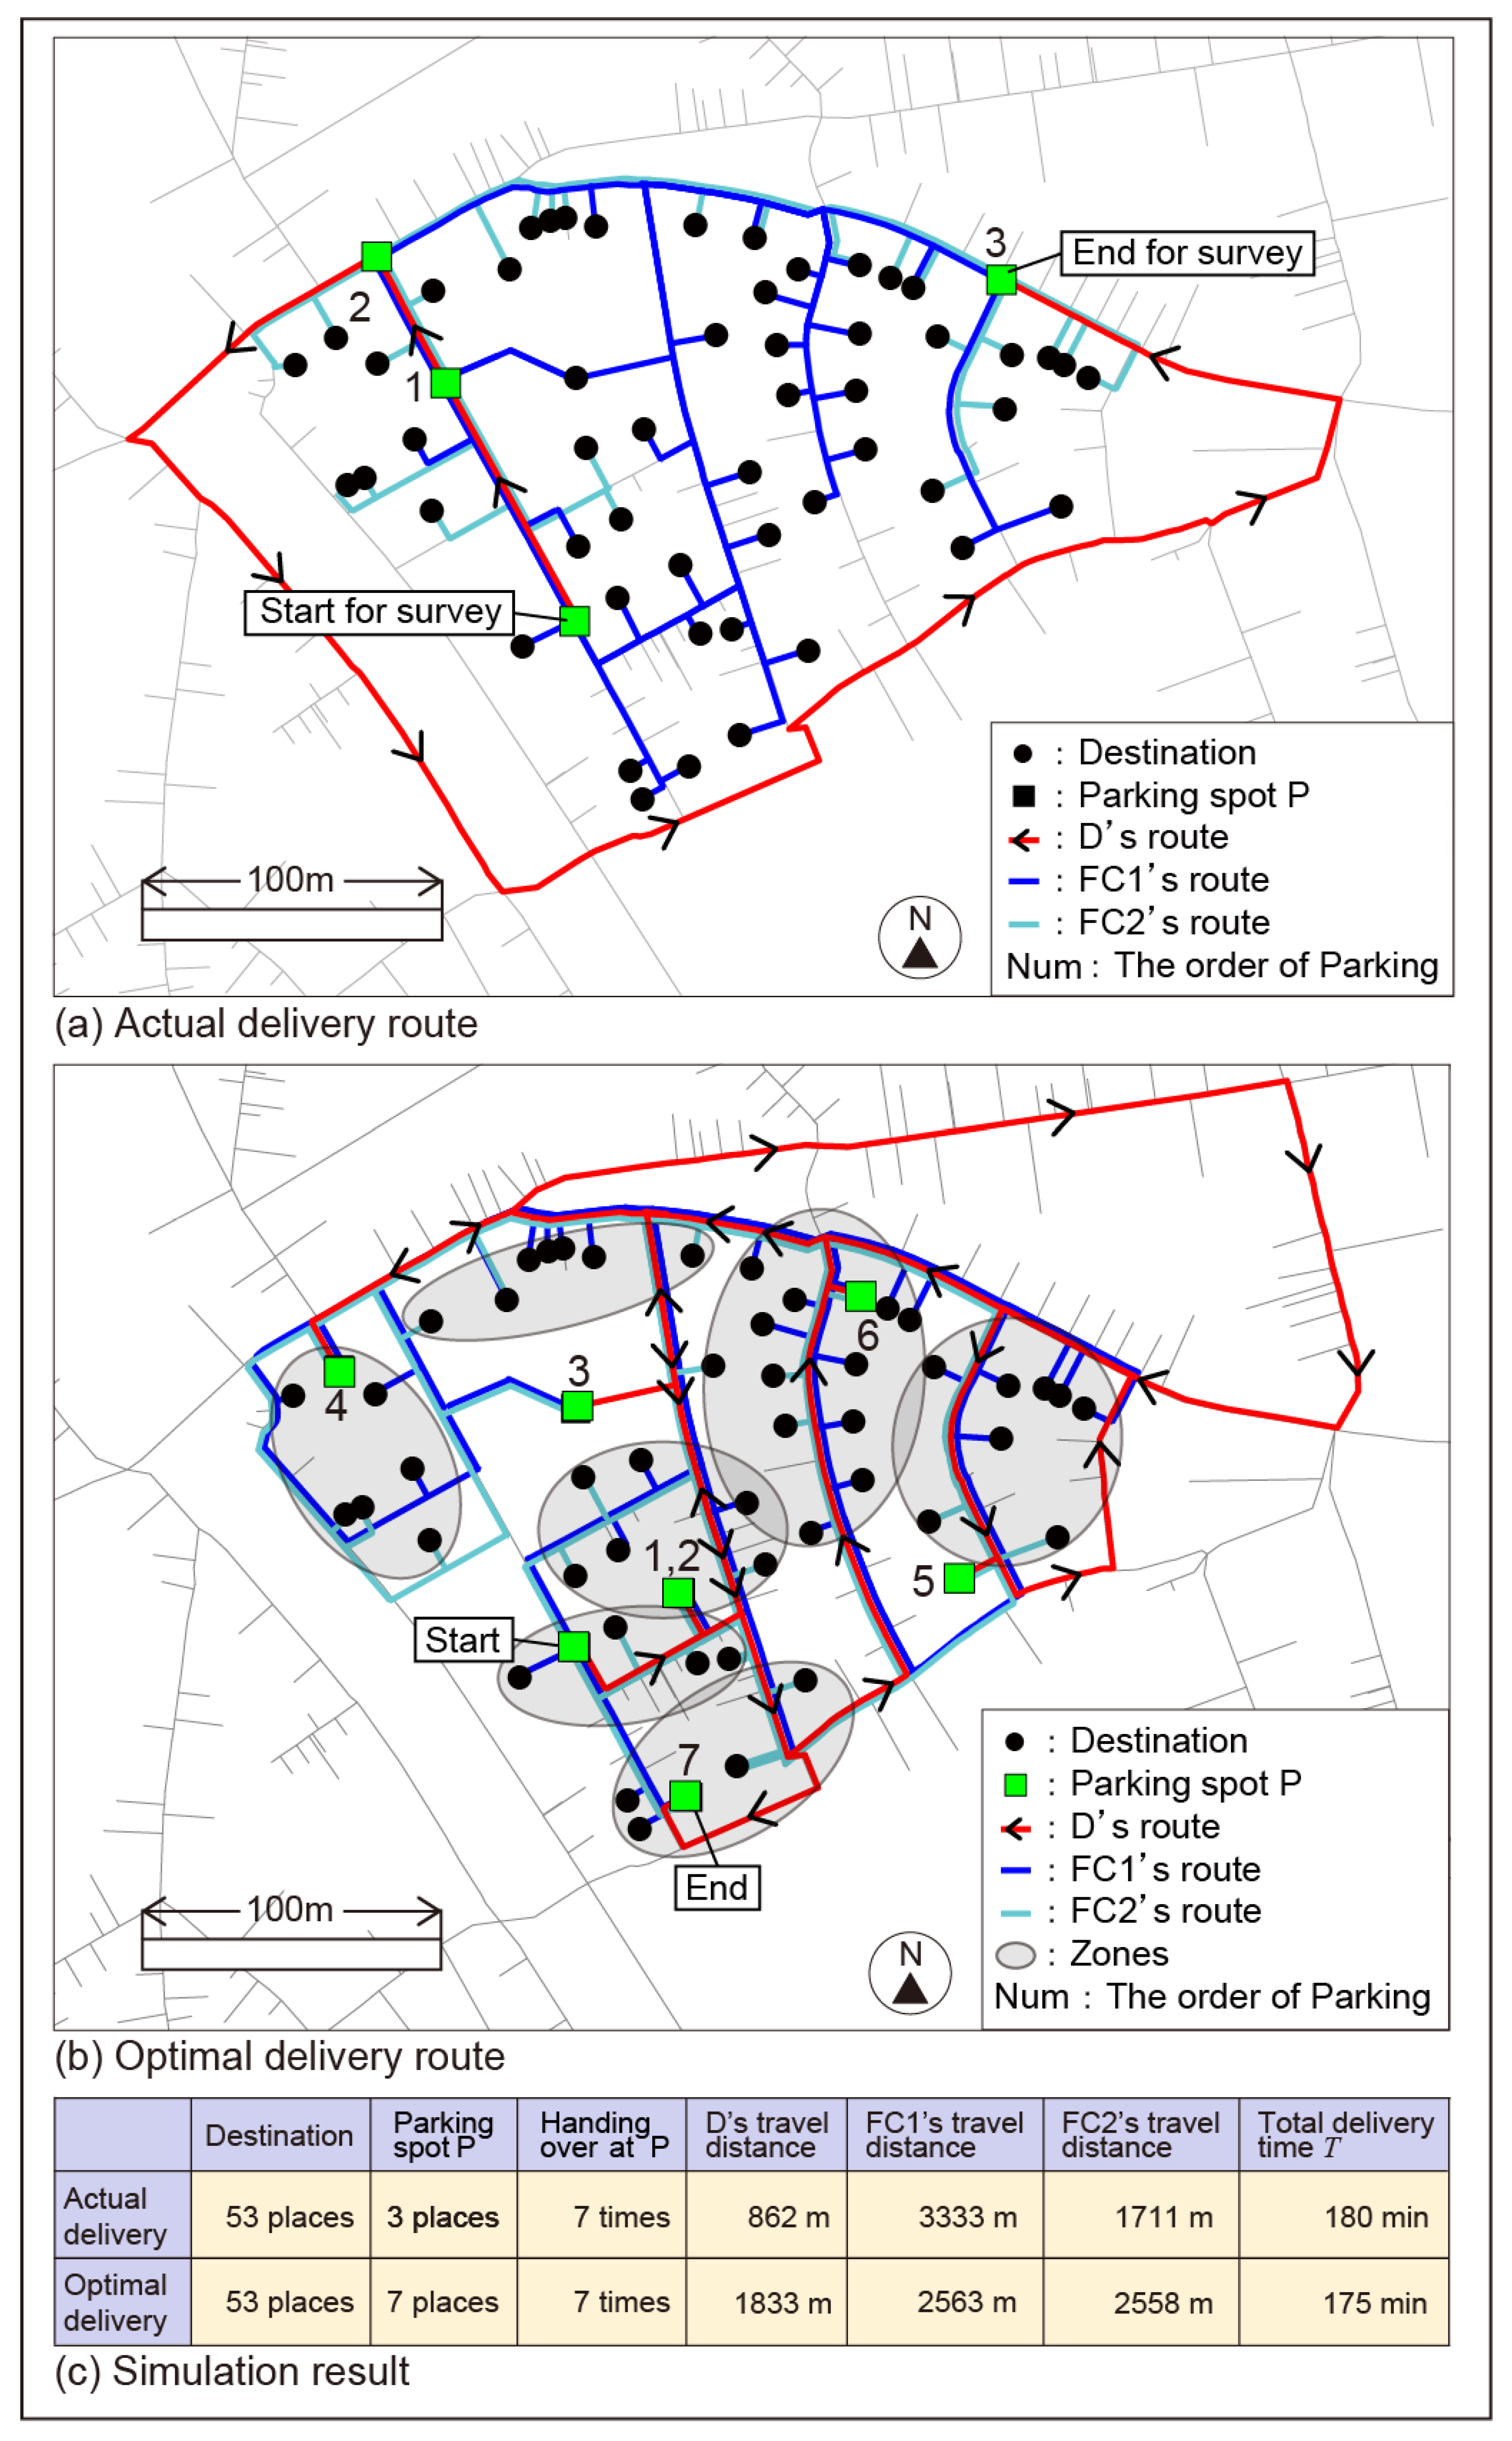
To evaluate the effectiveness of the proposed method in the real-world context, this section first computes the optimal route using method 4 with adjustments of the delivery volume and, subsequently, compares the outcome with the actual route taken by the TCD delivery team during the surveys. Care should be taken in making a comparison between them, as many unpredictable incidents may occur during an actual operation, including an ad hoc break by the delivery persons and additional stops made for collecting parcels. Therefore, duration of the actual operation was also simulated by retracing the actual route but adopting the parameters set by the simulation test, rather than reflecting the actual time recorded (Figure 4). The combination of the delivery persons was adopted from the actual survey data, i.e., one SD and one FC in the Okusawa area and one D and two FCs in the Meguro area. Together with other parameters (Table 2, Table 3 and Table 4), the simulation was run with the same parcel handover points and routes as in reality. Figure 7a and Figure 8a show the respective results.
Next, the locations of parcel handover points and the travel routes were optimised using method 4, with which a simulation was also run. Figure 7b and Figure 8b show the respective results. To evaluate the effect of optimisation for the delivery route and the parcel handover points, the amount of parcel handover times was kept in line with the actual data. As method 4 uses heuristics to derive the optimal solution, the optimisation process is achieved by iterating the calculation with different initial values, and the best result among them is adopted as the optimum solution. In reality, the results do not show a significant difference between results derived from different initial values, and this suggests that multiple approximate solutions exist with slight differences around the optimal solution. In other words, the solution obtained by this method seems to be sufficiently robust even though there is likely to be other solutions returning similar delivery time.
In the Okusawa area, the optimal route helped reduce the travel distances of the SD and FC by approximately 3500 m and 2000 m, respectively, and the total delivery time T was reduced by 41 min (18.7%) (Figure 7c).
In contrast, in the Meguro area, the optimal route helped split the travel distances of the FCs more evenly with a 5 min reduction in the duration of the trip (Figure 8c). However, this was achieved by increasing the number of handover points from three locations to seven locations, with the cumulative distance covered by all delivery persons increasing by 1050 m or 17.7%. This suggests that, during an actual delivery, the route and the parcel handover points are decided by the experience and intuition of the delivery persons, and it may be that they intuitively know that splitting the delivery load and the distance evenly between the FCs would result in an increase in the collective delivery distance, which in turn, resulted in an increase in the total delivery time.
To understand the logics behind the decision-making for the actual delivery route, this study interviewed the parcel delivery company and identified their demands in addition to minimising the total delivery time. Table 6 shows how the total delivery time T is affected by adding more conditions that correspond to these demands, namely, (1) avoiding right turns and (2) restricting the trucks from parking on slopes.
First, avoiding right turns indeed makes the delivery trip safer, as cars run on the left-hand side of the road in Japan. A simulation with only left turns resulted in a slight increase in the total delivery time T by 5 min in the Okusawa area (Figure 7c, Table 6). In the Meguro area, avoiding right turns made no difference to the total delivery time T (Figure 8c, Table 6). These results suggest that the safety of the truck driving operation can be improved without greatly increasing the total delivery time T.
Second, when a parcel handover point is located on a steep slope, the handling of parcels inside the truck becomes awkward and less efficient, with the added risk of the truck rolling down the hill while the SD is busy delivering parcels. This condition was not applied to the delivery in the Okusawa area where the topography is flat. Examining it for the Meguro area, where many hills exist, it proved possible to complete the deliveries without locating P on a slope while keeping down the increase in total delivery time T to approximately 1 min (Figure 8c, Table 6).
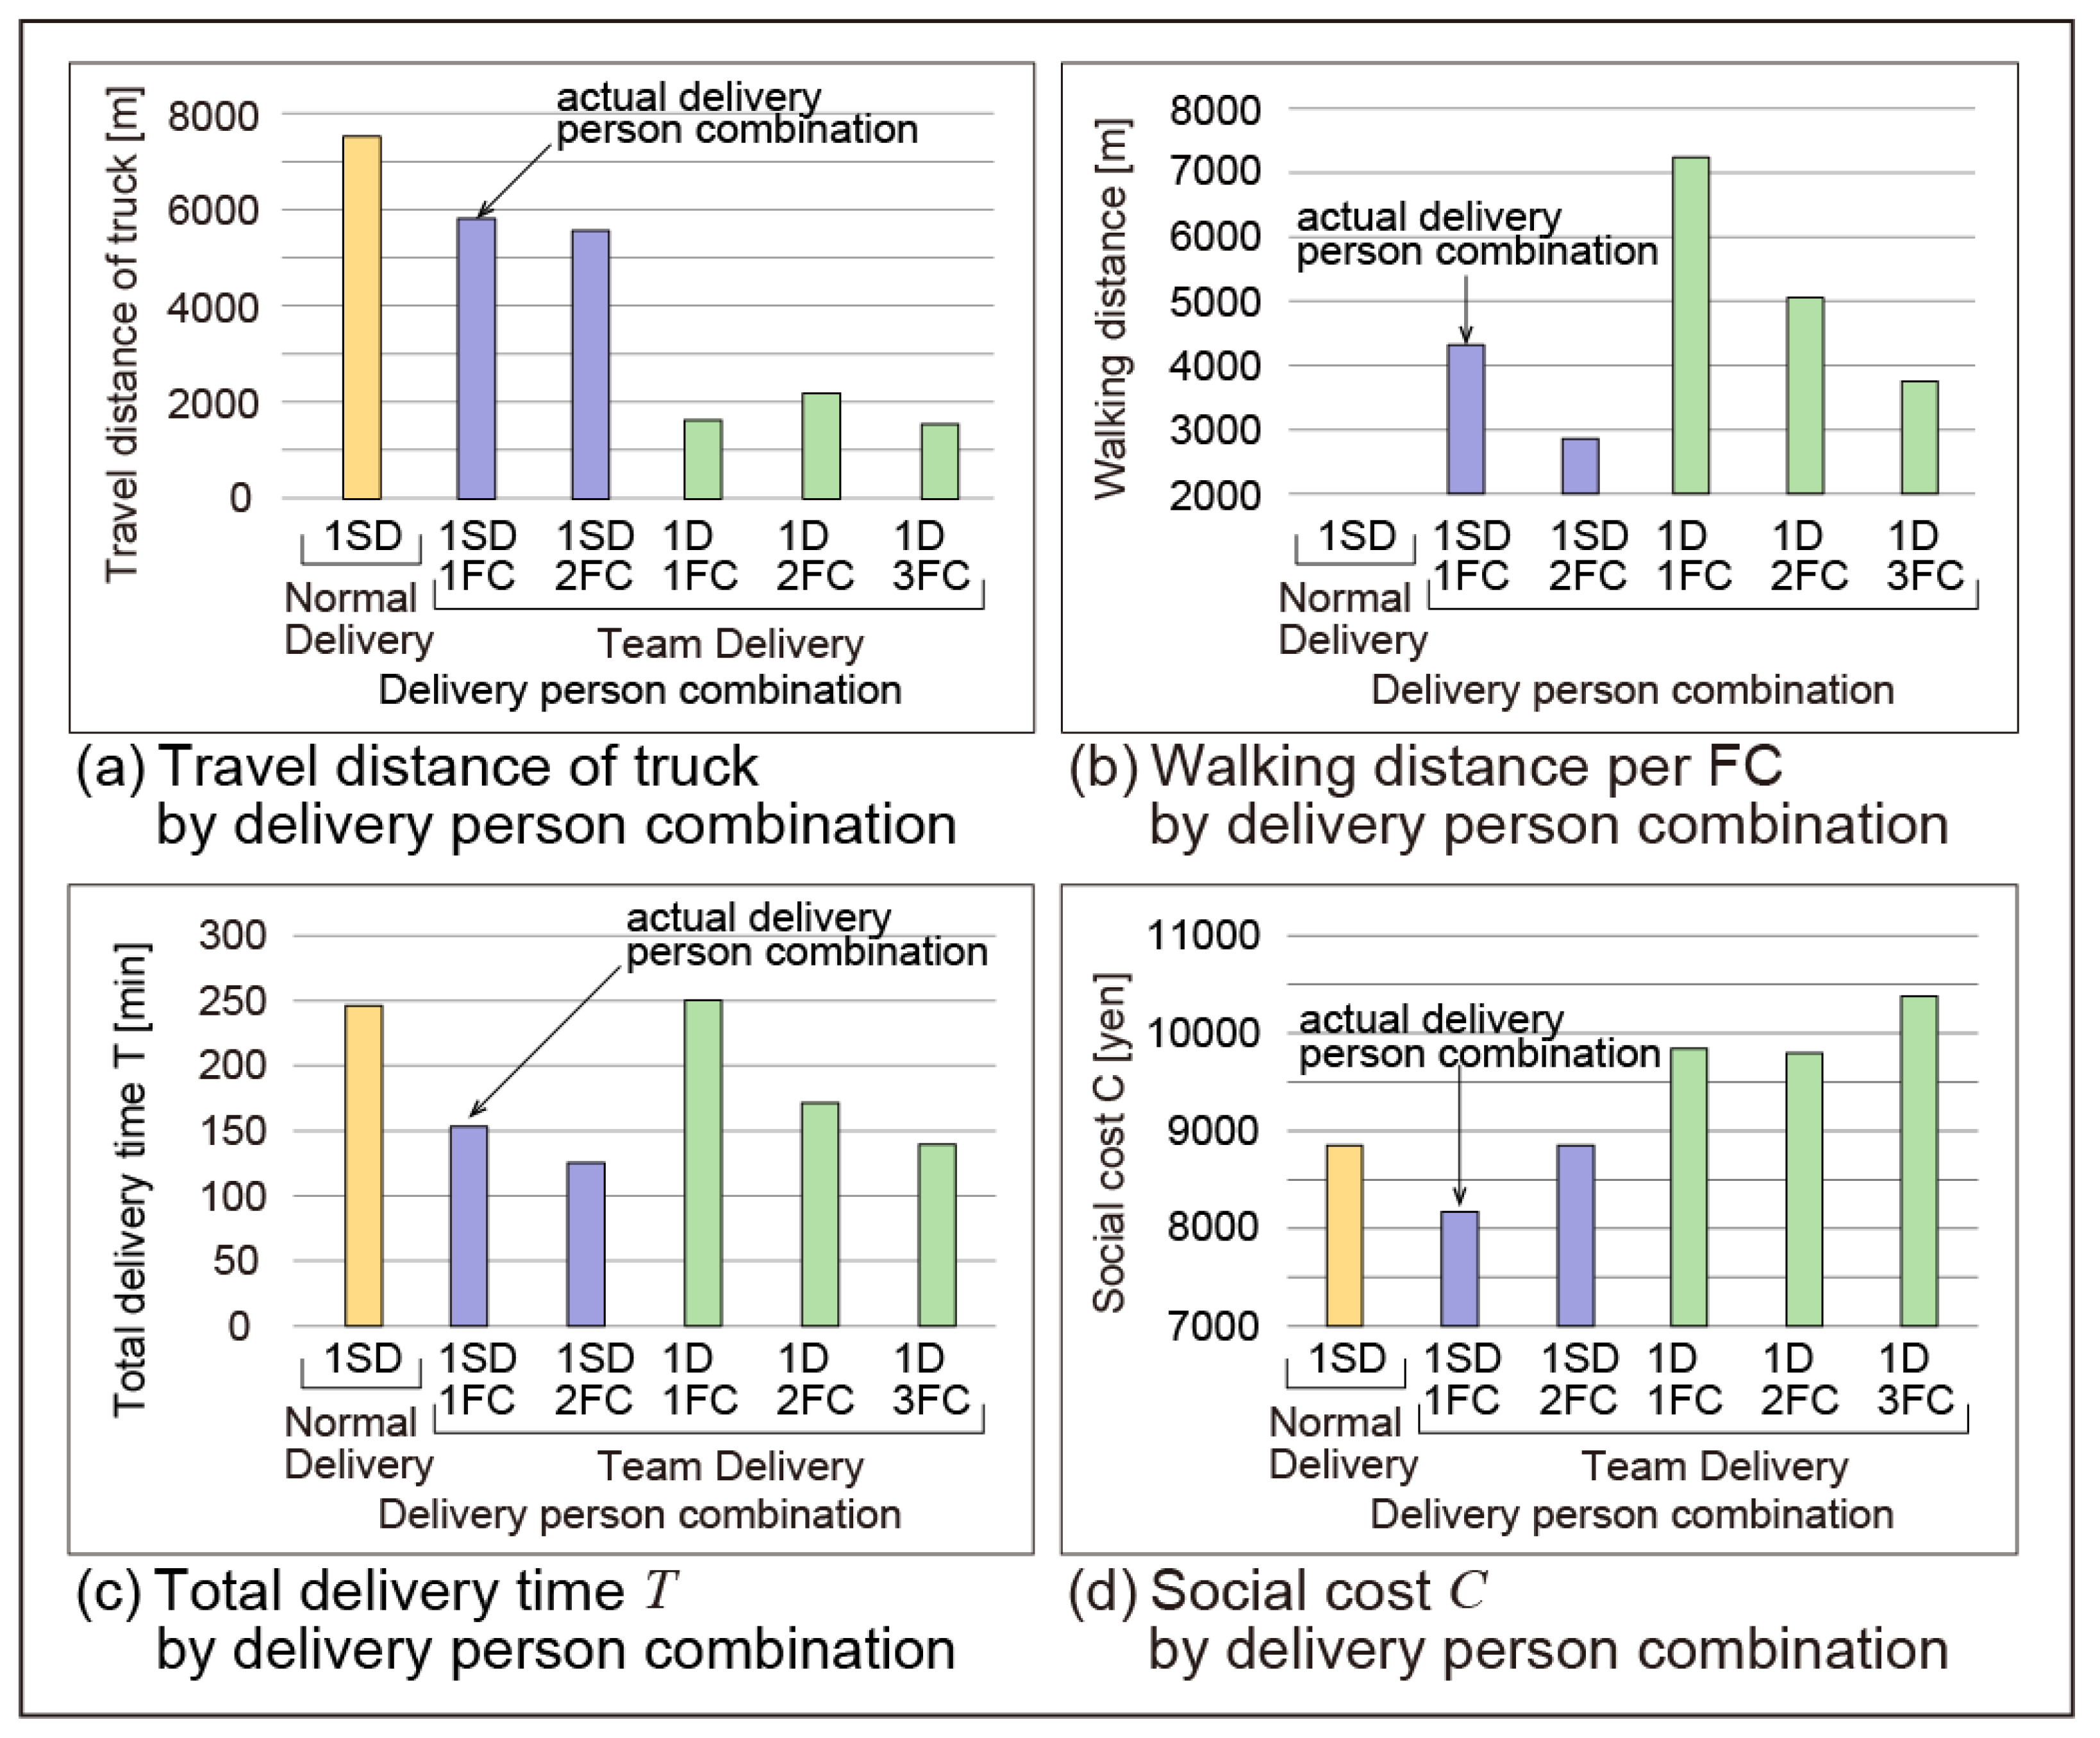
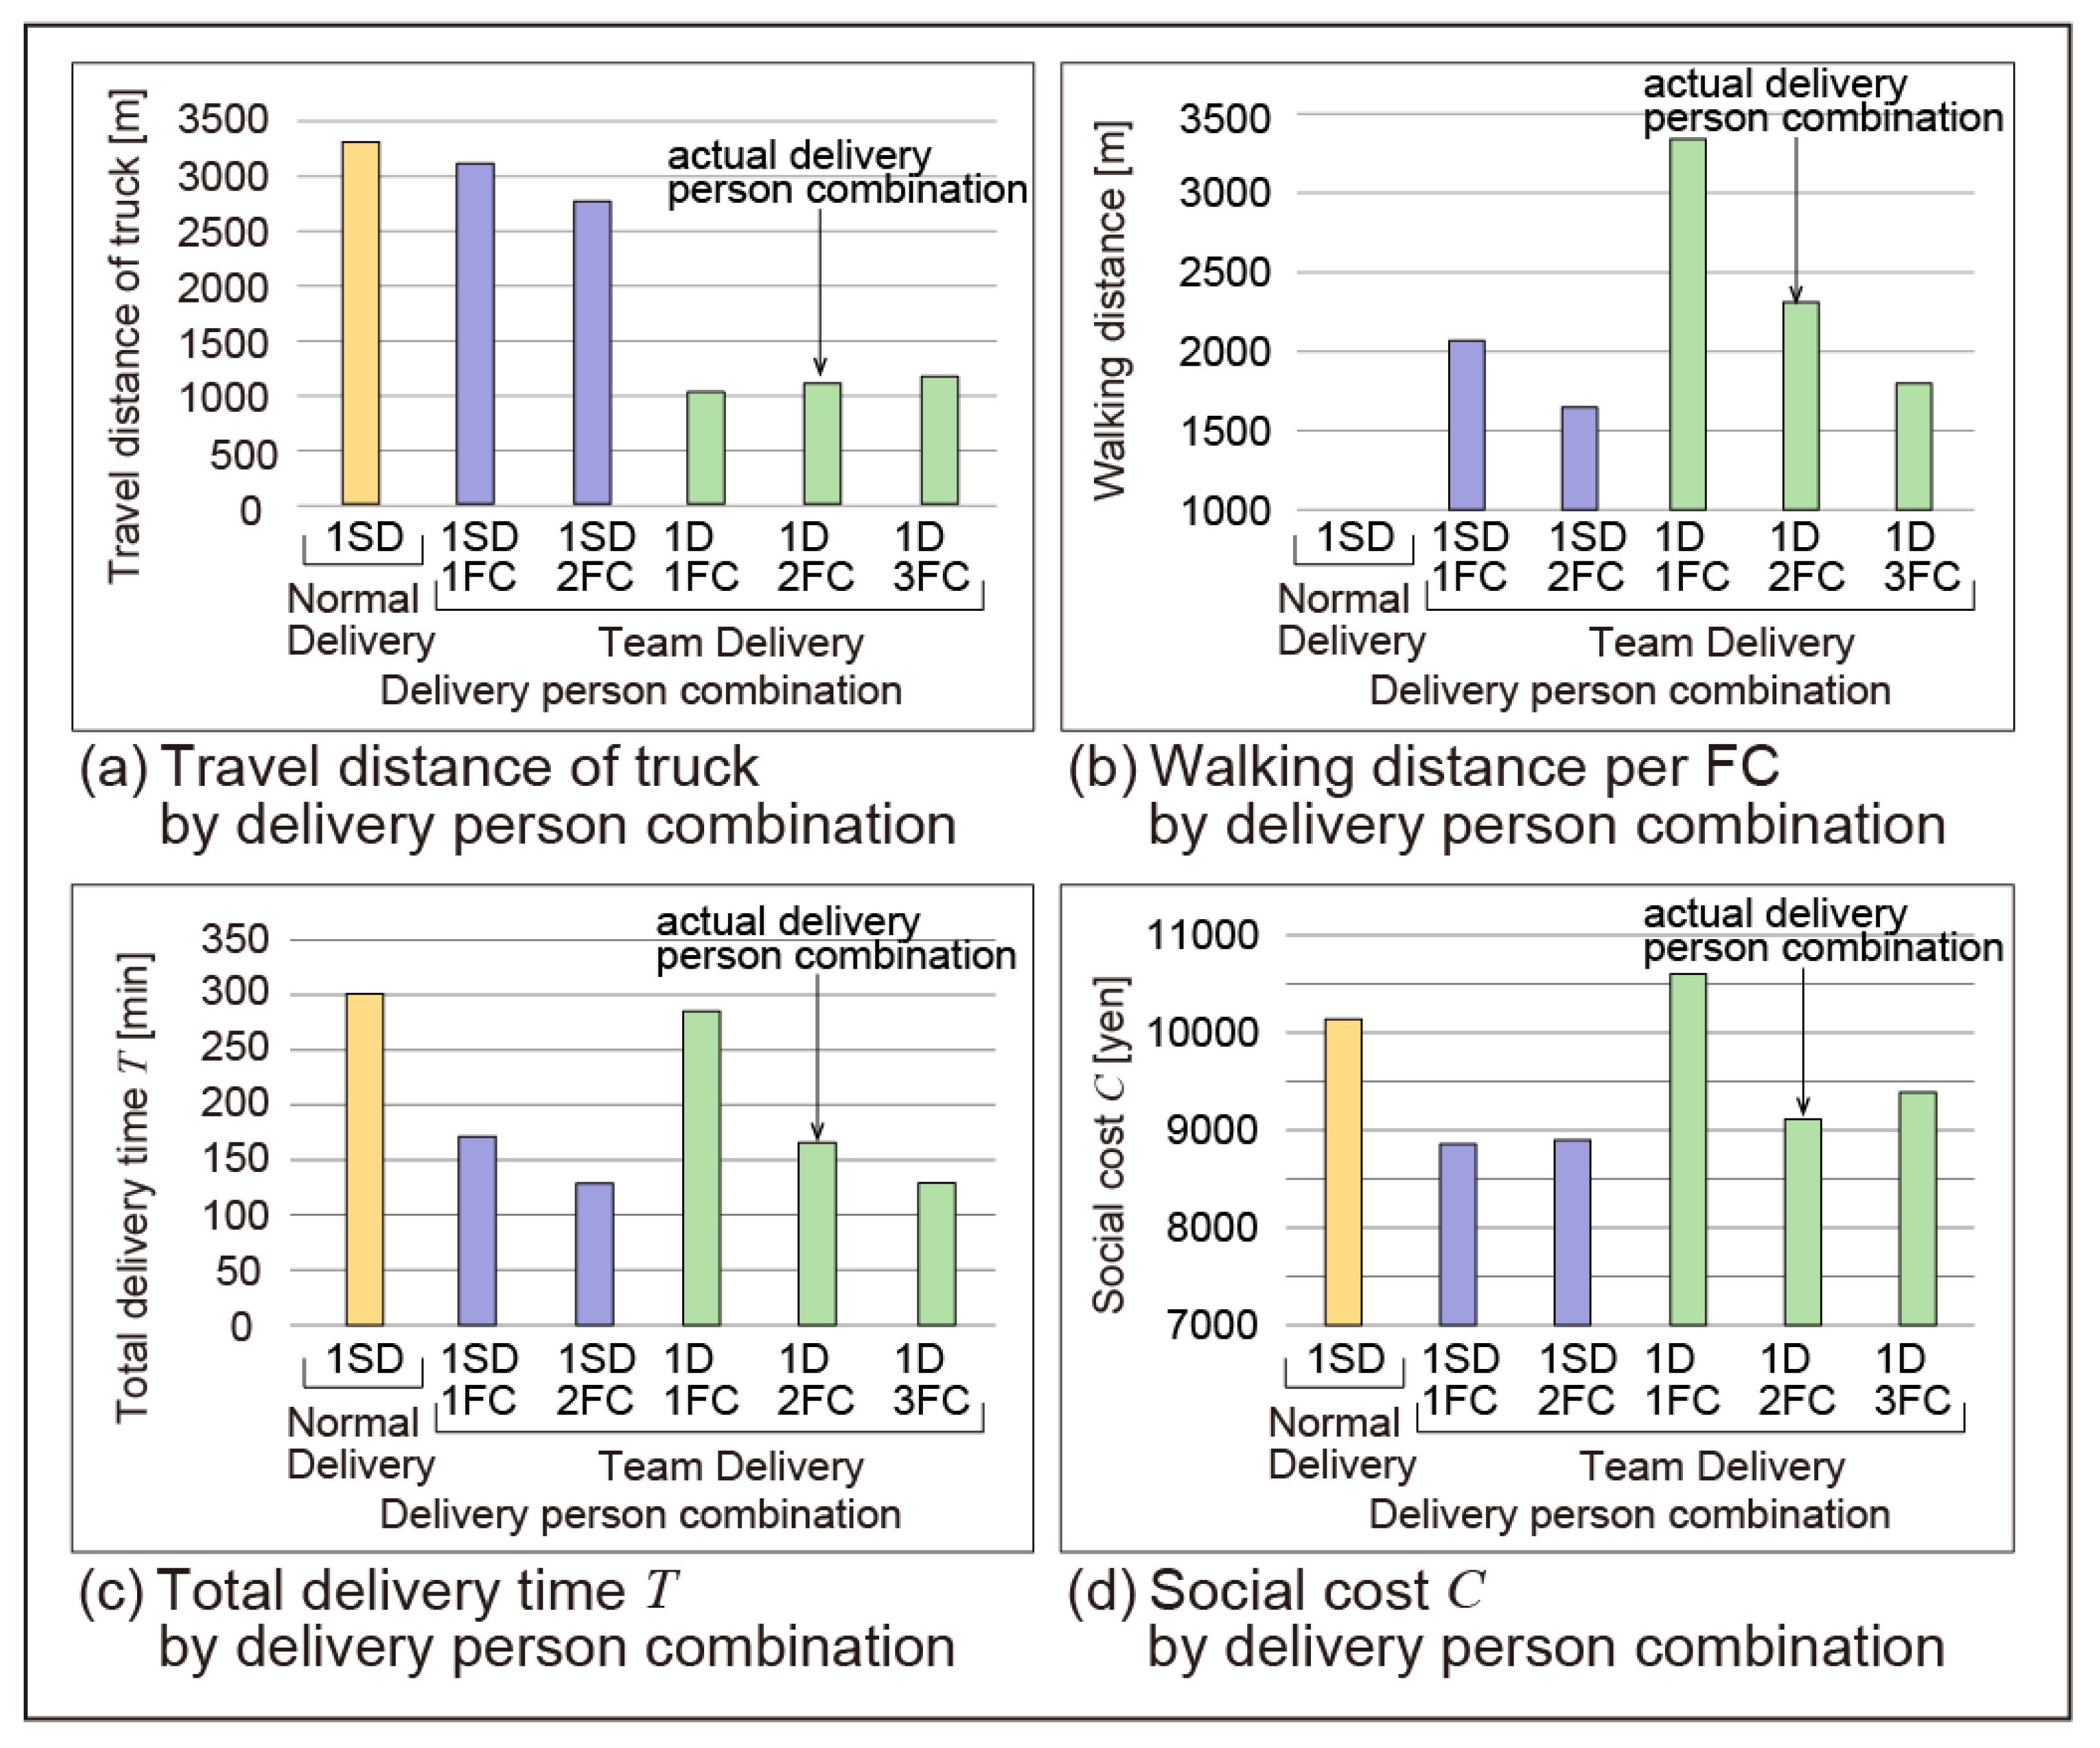
4.4. Efficiency Evaluation in Terms of Delivery Person Combination and Social Cost
During the interviews, we learned that the combinations of delivery persons (D, SD, and FC) vary by the area. Therefore, three combinations (1 SD + 2 FCs, 1 D + 1 FC, and 1 D + 3 FCs) and a standard delivery method in which 1 SD travels around the delivery destinations (Figure 1b) were added to the actual combinations (1 SD + 1 FC, 1 D + 2 FCs), making it a comparison between six different combinations of delivery persons. In this section, the combination of delivery persons is indirectly considered as an optimisation parameter in that the overall performance in delivery time will be compared between different combinations of delivery persons, even though it was not explicitly treated as an optimisation parameter earlier. Such a discussion leads to the investigation of the travel distance by each delivery person and the social cost of the delivery, even though we are solving an optimisation problem that minimises the total delivery time T. While the profit of the delivery company (minimisation of delivery cost) and the wider profit for the society (minimisation of social cost) often conflict with each other, it will be shown that both benefits can be obtained by the optimisation method proposed in this study.
The social cost is defined in reference to the work by Miyatake et al. (2016), where the social cost C is the sum of operation cost OC and environmental cost EC (Equation (12)) [15]. The operation cost OC is the sum of labour cost LC, truck fuel cost f, and redelivery cost RC derived from the probability of absence (unattended destination) when surveyed (Table 7).
where
C = OC + EC = (LC + f + RC) + EC
- C: Social cost (JPY)
- OC: Delivery operation cost (JPY)
- EC: Environmental cost (JPY)
- LC: Labour costs for delivery person (JPY)
- f: Truck fuel cost (JPY)
- RC: Redelivery cost (JPY)

Table 7.
Probability of absence (unattended destination).
| 8–9 am | 9–10 am | 10–11 am | 11–12 am | 12– pm | |
|---|---|---|---|---|---|
| Okusawa area | – | 6.98% | 3.39% | 24.1% | 25.8% |
| Meguro area | 6.52% | 9.23% | 9.52% | 13.8% | 13.8% |
Figure 9 and Figure 10 respectively show the results of the efficiency evaluation, which vary by the combination of delivery persons in the Okusawa and Meguro areas. Figure 9a and Figure 10a are the results of the efficiency evaluation on the travel distance of the truck. The results show that D’s mileage is not influenced by the number of FCs, since D only drives their truck between handover points and do not deliver themselves. However, the number of destinations for which SD is responsible decreases as the number of cooperating FCs increases, so their travel distance (mileage) of the truck decreases.
Figure 9b and Figure 10b are the results of efficiency evaluation on the walking distance per FC. The histogram shows that a greater number of FCs is associated with a shorter walking distance. In addition, when the total number of delivery people (total number of SDs and FCs) is the same, the walking distance per FC is shorter when they are working with an SD than with a D because the SD is responsible for delivering to distant destinations by truck.
In the Okusawa area, when the total number of delivery people (total number of SDs and FCs) is the same, T is shorter with the combination of SD and FC than it is with D and FC (Figure 9c). However, in the Meguro area, T is shorter with the combination of D and FC (Figure 10c). These histograms show that in places like Meguro, where the delivery destinations are concentrated, it is more efficient for the truck to wait and the deliveries to be handled with manoeuvrable handcarts. Conversely, in places like Okusawa, where the density of delivery destinations is low, it is more efficient for the deliveries to be done by a truck, which has a fast travel speed.
The total labour cost (Table 8) has a large impact on social cost C. The value of C depends heavily on the number of delivery persons and the delivery time. In the case of the Okusawa area, the histogram (Figure 9d) shows that C was at its lowest when the combination with the shortest T was reduced by 1 FC (1 SD + 1 FC). The same principle applies to as the actual delivery person combination. Meanwhile, in the Meguro area, C was lowest when there was 1 SD + 1 FC. While this is a different arrangement from the actual delivery person combination (1 D + 2 FCs), the difference in social cost C is small as shown in the histogram of Figure 10d. In actual delivery operations, the optimal combination of the delivery persons and travel route are established through a trial-and-error process. While it is an empirical and exploratory process, additional factors such as the operation and labour costs and the safety of travelling by truck are taken into account, thus implementing the delivery route and a TCD team that are considered to be the most logical solution.
4.5. Effect of Unattended Destinations
Recently, home delivery companies have been trying to reduce the burden of redelivery by communicating closely with customers to determine when they will be at home. Assuming that it is possible to determine in advance whether delivery destinations are unattended, this section considers to what extent delivery efficiency is affected.
A case calculated by excluding the unattended delivery destinations (Okusawa area, 18; Meguro area, 17) was compared with a case calculated by taking all delivery destinations into account. Specifically, for detached houses with delivery response time tC = 1, an unattended destination is set to tC = 0, and for housing complexes where tC = 3 and 10, if one unit was unattended, these are set to tC = 2 and 9, respectively. Table 9 shows the results, where the total delivery time was reduced by approximately 20 min in both areas. In addition, the social cost C decreased by approximately JPY 1000 with the reduction in travel distance and total delivery time T. It goes to show that more efficient operations can be implemented by knowing the unattended destinations in advance.
5. Discussion and Conclusions
This study developed a new methodological framework for optimising the delivery routes under the team collection-and-delivery (TCD) system and evaluated the efficiency of the ongoing operation. The problem was defined as a combinatorial problem between route selection and local coverage with the aim to find the optimal solution that minimises the total delivery time. The complexity of the TCD problem increases by (1) the density and the type of buildings to which parcels are delivered to and collected from and (2) the number and the type of delivery persons and the associated labour cost, but the optimisation method proved to be effective in deriving a very good approximation of the optimal solution, derived in a sufficiently short period of time. The study demonstrated the benefit of TCD delivery over the regular single-driver delivery through a series of simulated analyses. However, the empirical data also revealed that the actual delivery route and the handover points of the TCD delivery are currently selected in an intuitive and ad hoc manner. In other words, the ongoing TCD operation may not be utilising its advantage over the regular delivery system to its full extent, and applying the optimisation method proposed in this study could help maximise its benefit.
Finding optimal solution to the TCD delivery also yields indirect benefits. As pointed out earlier, by minimising the total delivery time, TCD delivery could increase the likelihood of completing collection and delivery in the morning, thus reducing the risk of unattended destinations. Reducing the total operation time could also enable part-time workers with childcare and other responsibilities to work as delivery crews. On a more general note, reduction in delivery time and resources helps alleviate the negative impact of freight transportation while supporting economic and social development [35]. Muñuzuri et al. (2010) argued that the efficient use of couriers for delivering goods within large and medium-sized cities contributes significantly to the problems of congestion, lack of parking, pollution, and energy consumption [36]. The key to a successful operation is to ensure the efficiency of the delivery operation. For instance, Kawamura and Rashidi (2010) compared the economic impact of the truck industry with the negative external indicators of congestion and greenhouse gas emissions, concluding that economically inefficient cargo movement overburdens the road network and emits unjustifiable amounts of CO2 [37]. Russo and Comi (2011) evaluated how well city managers mitigated the adverse effects of freight transportation on a city scale [38]. They confirm the need to assess the impact of delivery operations, given their economic objectives and environmental concerns. Qi et al. (2018) addressed this need by providing new logistics planning models and managerial insights [39].
We also surveyed TCD operations in an area of low-rise housing (near Okusawa Station) and those with medium- to high-rise housing and commercial buildings (near Meguro Station) in Tokyo to set the parameters for the simulations. In addition, we compared seven different methods for route optimisation that build on methods previously employed for the multiple travelling salesperson problem (m-TSP). The simulations reported method 4 to be the most efficient.
Using simulations of the current operations implemented by the delivery company, there is also scope to improve safety by avoiding right turns and improve the efficiency of parcel handling by avoiding parking on slopes, without a significant increase in the total delivery time. Simulations were also run against six different combinations of delivery persons. The TCD was also assessed with respect to the travel distance, the total delivery time, and the social cost. The evaluation results differed by the area and the combination of delivery persons. This result demonstrates that the proposed method allows new delivery persons to work efficiently, like experienced delivery persons, thereby reducing unnecessary travel and redeliveries. Finally, we ran simulations assuming that it is possible to determine in advance when parcel recipients are at home. The results showed that obtaining information on absent recipients in advance is of great value for improving the efficiency of operations, as well as for reducing redelivered parcels and reducing unnecessary travel. They also demonstrated the importance of eliminating the inefficiency of redeliveries through the reliable handover of parcels in reducing social costs.
In terms of maintaining an efficient management of the delivery operation, reducing unattended destinations would not only benefit the delivery industry but also lower the social costs. Based on interviews with delivery persons, the extra costs wasted for redelivery could be anywhere from 5% to 30% of the total cost. Using the proposed method to conduct numerous simulations of possible redelivery scenarios would help identify the likely solutions for their reduction and unnecessary travels itself. This study showed that our proposed method could play a decisive role in the choice of the delivery method, and we should develop an effective and efficient means to reduce the frequency of redeliveries.
In the delivery industry, securing a sufficient number of delivery persons is becoming a major obstacle. It could take a long time before new recruits can start working with the same efficiency as more experienced workers, and they require training by such experienced persons. Condensing the delivery service to the morning hours would help alleviate the shortage of labour, whilst a live tracker of the delivery could also reduce unattended destinations, and these can be built on our proposed framework.
The range of parameters such as the load capacity and the rate of delivery per person were collected through empirical observations, and further surveys can help calibrate the parameters used in our method. This may be achieved by developing a mobile app that incorporates the proposed method so that the delivery persons can log their delivery patterns whilst the customers can track the delivery of their orders.
Finally, the proposed method is particularly relevant in a dense metropolitan area. In contrast, TCD may not be the most efficient solution if the delivery destinations are sparse and in the rural areas. A systematic investigation between the efficiency of TCD and the density in the delivery areas would help understand what situation calls for TCD and what other settings would be better served through the conventional single-driver operation, and how the wider management of the logistics should combine the different modes of delivery and collection.
Author Contributions
Conceptualisation, T.O. and Y.T.; methodology, T.O. and Y.T.; validation, T.O., Y.T., N.S. and S.S.; formal analysis, T.O. and Y.T.; writing—original draft preparation, T.O., Y.T.; writing—review and editing, N.S. and S.S.; visualisation, T.O. and Y.T.; supervision, T.O. All authors have read and agreed to the published version of the manuscript.
Funding
This research received no external funding.
Institutional Review Board Statement
Ethical review and approval were waived for this study due to the research not dealing with data including privacy issues.
Informed Consent Statement
Informed consent was obtained from all subjects involved in the study.
Data Availability Statement
Data are not available because of commercial restrictions. Due to the nature of this research, participants of this study did not agree for their data to be shared publicly.
Conflicts of Interest
The authors declare no conflict of interest.
References
- Gunjan, M.; Sonja, M. Courier Services Market by Service Type (B2B, B2C, C2C), by Destination (Domestic, International), by End Use (Services, Wholesale and Retail Trade, Healthcare, Industrial and Manufacturing, Others): Global Opportunity Analysis and Industry Forecast, 2021–2031, Allied Market Research. 2022. Available online: https://www.alliedmarketresearch.com/courier-services-market-A06423 (accessed on 1 March 2023).
- Ministry of Land, Infrastructure, Transport and Tourism. Survey and Counting Methods for the Number of Courier Services in 2018. 2018. Available online: https://www.mlit.go.jp/report/press/content/001310399.pdf (accessed on 1 March 2023).
- Ministry of Land, Infrastructure, Transport and Tourism. Results of “Survey on Mail Order and Redelivery” (December 2018 Survey). 2018. Available online: http://www.mlit.go.jp/monitor/H30-kadai01/9.pdf (accessed on 1 March 2023).
- Sachan, A.; Datta, S. Review of supply chain management and logistics research. Int. J. Phys. Distrib. 2005, 35, 664–705. [Google Scholar] [CrossRef]
- Haughton, M.A. Measuring and managing the learning requirements of route reoptimization of delivery vehicles drivers. J. Bus. Logist. 2002, 23, 45–66. [Google Scholar] [CrossRef]
- Punakivi, M.; Yrjölä, H.; Holmström, J. Solving the last mile issue: Reception box or delivery box? Int. J. Phys. Distrib. 2001, 31, 427–439. [Google Scholar] [CrossRef] [Green Version]
- Caplice, C.; Sheffi, Y. Optimization-based procurement for transportation services. J. Bus. Logist. 2003, 24, 109–128. [Google Scholar] [CrossRef]
- Giddings, A.P.; Bailey, T.G.; Moore, J.T. Optimality analysis of facility location problems using response surface methodology. Int. J. Phys. Distrib. 2001, 31, 38–52. [Google Scholar] [CrossRef]
- González, E.L.; Fernández, M.A.R. Genetic optimisation of a fuzzy distribution model. Int. J. Phys. Distrib. 2000, 30, 681–696. [Google Scholar] [CrossRef]
- Lee, T.-R.; Ueng, J.-H. A study of vehicle routing problems with load-balancing. Int. J. Phys. Distrib. 1999, 29, 646–657. [Google Scholar] [CrossRef]
- Koç, Ç; Laporte, G.; Tükenmez, İ. A review of vehicle routing with simultaneous pickup and delivery. Comput. Oper. Res. 2020, 122, 104987. [Google Scholar] [CrossRef]
- Li, Y. Research trends on online shopping logistics with focus on the last mile problem. Bull. Fac. Commer. Meiji Univ. 2018, 100, 115–128. [Google Scholar]
- Kawanishi, Y.; Suzuki, T. Effect of the improvement in delivery method on vehicle mileage reduction in home delivery service system. J. City Plan. Inst. Jpn 2018, 53, 51–56. [Google Scholar] [CrossRef]
- Liu, Y.; Suzuki, T. Model analysis on delivery efficiency improvement combining truck and drone. In Papers and Proceedings of the Geographic Information Systems Association [CD-ROM]; Reconstruction Agency: Tokyo, Japan, 2019. [Google Scholar]
- Miyatake, H.; Nemoto, T.; Hyashi, K. Delivery density requirements for the introduction of “team delivery” in a courier network. Jpn. J. Transp. Econ. 2016, 59, 205–212. [Google Scholar]
- Gevaers, R.; Van de Voorde, E.; Vanelslander, T. Characteristics of innovations in last-mile logistics: Using best practices, case studies and making the link with green and sustainable logistics. In Proceedings of the European Transport Conference, Leiden, The Netherlands, 5–7 October 2009; p. 21. [Google Scholar]
- Song, L.; Guan, W.; Cherrett, T.; Li, B. Quantifying the greenhouse gas emissions of local collection-and-delivery points for last-mile deliveries. Transp. Res. Rec. 2013, 2340, 66–73. [Google Scholar] [CrossRef]
- Iwan, S.; Kijewska, K.; Lemke, J. Analysis of parcel lockers’ efficiency as the last mile delivery solution—The results of the research in Poland. Transp. Res. Procedia 2015, 12, 644–655. [Google Scholar] [CrossRef] [Green Version]
- Boyer, K.K.; Prud’homme, A.M.; Chung, W. The last mile challenge: Evaluating the effects of customer density and delivery window patterns. J. Bus. Logist. 2009, 30, 185–201. [Google Scholar] [CrossRef]
- Campbell, A.M.; Savelsbergh, M. Incentive schemes for attended home delivery services. Transp. Sci. 2006, 40, 327–341. [Google Scholar] [CrossRef] [Green Version]
- Dantzig, G.B.; Ramser, J.H. The truck dispatching problem. Manag. Sci. 1956, 6, 80–91. [Google Scholar] [CrossRef]
- Ogawa, M.; Inoue, M. Enumerating all the optimal solutions of multiple travelling salesman problem by using simpath algorithm. Inf. Process. Soc. Jpn. 2014, 114, 321–328. [Google Scholar]
- Chang, Y.S.; Lee, H.J. Optimal delivery routing with wider drone-delivery areas along a shorter truck-route. Expert Syst. Appl. 2018, 104, 307–317. [Google Scholar] [CrossRef]
- Nakayama, T.; Maeda, M.; Nakanishi, S. Transport planning of supplies using genetic algorithms under consideration for roads of plural vehicles. In Proceedings of the 21st Fuzzy System Symposium, Tokyo, Japan, 7–8 September 2005; pp. 290–293. [Google Scholar]
- Ono, T.; Kanagawa, A.; Takahashi, H. Heuristic solution for multiple traveling salesman problems with multiple depots using fuzzy c-means clustering method. Inst. Electron. Inf. Commun. Eng. A 2004, J87-A, 938–948. [Google Scholar]
- Frederickson, G.N.; Hecht, M.S.; Kim, C.E. Approximation algorithms for some routing problems. SIAM J. Comput. 1978, 7, 178–193. [Google Scholar] [CrossRef]
- Miyata, E.; Hamamatsu, Y. An optimization method for the multi-route searching problem. Trans. Inst. Electr. Eng. Jpn. 1998, 118-C, 1540–1541. [Google Scholar]
- Gillett, B.E.; Miller, L.R. A heuristic algorithm for the vehicle-dispatch problem. Oper. Res. 1974, 22, 340–349. [Google Scholar] [CrossRef]
- Pahwa, A.; Jaller, M. A cost-based comparative analysis of different last-mile strategies for e-commerce delivery. Transp. Res. E 2022, 164, 102783. [Google Scholar] [CrossRef]
- Liu, D.; Yan, P.; Pu, Z.; Wang, Y.; Kaisar, E.I. Hybrid artificial immune algorithm for optimizing a Van-Robot E-grocery delivery system. Transp. Res. E 2021, 154, 102466. [Google Scholar] [CrossRef]
- Janjevic, M.; Winkenbach, M.; Merchan, D. Integrating collection-and-delivery points in the strategic design of urban last-mile e-commerce distribution networks. Transp. Res. E 2019, 131, 37–67. [Google Scholar] [CrossRef]
- Ozarık, S.S.; Veelenturf, L.P.; Woensel, T.V.; Laporte, G. Optimizing e-commerce last-mile vehicle routing and scheduling under uncertain customer presence. Transp. Res. E 2021, 148, 102263. [Google Scholar] [CrossRef]
- Imada, S.; Nakajima, J.; Furukawa, M. Practical Solution for n-TSP by Use of LCO. In Proceedings of the The Japan Society for Precision Engineering Spring Meeting, Chiba, Japan, 15–17 March 2016; Volume H19, pp. 587–588. [Google Scholar]
- Kitano, H. Genetic algorithms. J. Jpn. Soc. Artif. Intell. 1992, 7, 26–37. [Google Scholar]
- Browne, M.; Allen, J.; Nemoto, T.; Visser, J. Light goods vehicles in urban areas. Procedia Soc. Behav. Sci. 2010, 2, 5911–5919. [Google Scholar] [CrossRef] [Green Version]
- Muñuzuri, J.; van Duin, J.H.R.; Escudero, A. How efficient is city logistics? Estimating ecological footprints for urban freight deliveries. Procedia Soc. Behav. Sci. 2010, 2, 6165–6176. [Google Scholar] [CrossRef] [Green Version]
- Kawamura, K.; Rashidi, L.H. Economic, environmental and congestion impacts of trucking. Procedia Soc. Behav. Sci. 2010, 2, 5920–5930. [Google Scholar] [CrossRef] [Green Version]
- Russo, F.; Comi, A. Measures for sustainable freight transportation at urban scale: Expected goals and tested results in Europe. J. Urban Plan. Dev. 2011, 137, 142–152. [Google Scholar] [CrossRef]
- Qi, W.; Li, L.; Liu, S.; Shen, Z.J.M. Shared mobility for last-mile delivery: Design, operational prescriptions, and environmental impact. Manuf. Serv. Oper. Manag. 2018, 20, 737–751. [Google Scholar] [CrossRef]
Figure 1.
An illustrative example of the regular- and the team-based collection and delivery operations. Black dots are delivery destinations.
Figure 1.
An illustrative example of the regular- and the team-based collection and delivery operations. Black dots are delivery destinations.

Figure 2.
Illustration of the procedures for calculating the TCD delivery problem using fuzzy c-means clustering.
Figure 2.
Illustration of the procedures for calculating the TCD delivery problem using fuzzy c-means clustering.

Figure 3.
Calculation procedures of methods 5–7.

Figure 4.
A summary of the surveys of TCD deliveries.

Figure 5.
Evaluation index T for each method (results of two-dimensional continuous space of 500 m × 500 m).
Figure 5.
Evaluation index T for each method (results of two-dimensional continuous space of 500 m × 500 m).

Figure 6.
A clustering method for splitting the quantity of delivery evenly between the delivery persons.
Figure 6.
A clustering method for splitting the quantity of delivery evenly between the delivery persons.

Figure 7.
Comparison of the suggested optimal route and the actual route used in the Okusawa area.

Figure 8.
Comparison of the suggested optimal route and the actual route used in the Meguro area.

Figure 9.
Efficient delivery in the Okusawa area (colours correspond to the different combinations of delivery persons: SD with no FCs, SD with FC(s), and D with FC(s)).
Figure 9.
Efficient delivery in the Okusawa area (colours correspond to the different combinations of delivery persons: SD with no FCs, SD with FC(s), and D with FC(s)).

Figure 10.
Efficient delivery in the Meguro area (colours correspond to the different combinations of delivery persons: SD with no FCs, SD with FC(s), and D with FC(s).
Figure 10.
Efficient delivery in the Meguro area (colours correspond to the different combinations of delivery persons: SD with no FCs, SD with FC(s), and D with FC(s).

Table 1.
Variables used in formulating the TCD delivery problem.
| m | Total number of delivery destinations and parking spots |
| n | Number of P (parking spots) |
| k | Number of FC |
| d | Maximum distance between delivery destinations within a zone |
| q | Number of maximum loadable package capacity for FC |
| r | Suffix of zone |
| u | Suffix of FC |
| tp | Time to hand over the packages at one P |
| tc | Time to respond at one delivery destination |
| tA | Time to organise packages at one location |
| tZr | Delivery time in zone r |
| tDr | Travel time of D in zone r |
| tSDr | Travel time of SD in zone r |
| tfCru | Travel time of u-th FC in zone r |
| mSDr | Number of destinations delivered by SD in zone r |
| mfCru | Number of destinations delivered by u-th FC in zone r |
| I | Set of delivery destinations for SD in zone r (I = {i|i = 1, 2, …, mSDr}) |
| vD | Moving speed of D |
| vSD | Moving speed of SD |
| vFC | Moving speed of FC |
| crij | Travel distance between delivery destinations i and j in zone r |
| o | Route number |
| xroij | Variable that takes 1 if j is delivered next to delivery destination i on route o in zone r and 0 otherwise |
| yroi | The variable that takes 1 if delivery destination i is included in route o in zone r and 0 otherwise |
Table 2.
The survey data from the TCD trips in the Okusawa area.
| Package | Destination | Detached House | Housing Complex (Number of Units) | Hand over Parking Spot P | Package Organisation | ||
|---|---|---|---|---|---|---|---|
| SD’s delivery | Number | 51 pieces | 35 places | 25 places | 9 buildings (21 units) | 12 places | 8 places |
| Average time [min:sec] | — | 01:13 | 01:00 | 01:51 (00:48) | 03:14 | 01:10 | |
| FC’s delivery | Number | 109 pieces | 56 places | 43 places | 13 buildings (54 units) | 12 places | 3 places |
| Average time [min:sec] | — | 01:45 | 01:03 | 04:01 (00:58) | 02:12 | 04:20 | |
| Movement of each delivery person | SD (all) | SD (walking) | SD (truck) | FC | |||
| Total travel distance [m] | 9368 | 3285 | 6083 | 5385 | |||
| Travel time [h:min:sec] | 01:37:45 | 00:57:05 | 00:40:40 | 01:22:30 | |||
| Average moving speed [m/min] | 96 | 58 | 150 | 65 | |||
Table 3.
The survey data from the TCD trips in the Meguro area.
| Package | Destination | Detached House | Housing Complex | Office Building | Store | Hand over Parking Spot P | ||
|---|---|---|---|---|---|---|---|---|
| FC1’s delivery | Number | 128 pieces | 31 places | 4 places | 18 buildings | 7 places | 2 places | 7 places |
| Average time [min:sec] | — | 04:02 | 01:07 | 04:36 | 05:14 | 00:43 | 03:19 | |
| FC2’s delivery | Number | 109 pieces | 25 places | 4 places | 14 buildings | 2 places | 4 places | 11 places |
| Average time [min:sec] | — | 05:32 | 01:23 | 07:29 | 08:08 | 00:56 | 02:05 | |
| Movement of each delivery person | D | FC1 | FC2 | FC average | ||||
| Total travel distance [m] | 820 | 2764 | 1255 | 2010 | ||||
| Travel time [h:min:sec] | 00:06:40 | 00:31:20 | 00:20:45 | 00:26:03 | ||||
| Average moving speed [m/min] | 123 | 88 | 60 | 74 | ||||
Table 4.
Parameter values adopted for the simulation study.
| Variable | Numeric | |
|---|---|---|
| Common conditions | m [places] | 50–200 |
| n [places] | 2–20 | |
| k [people] | 0–3 | |
| d [m] | 300 | |
| q [pieces] | 20 | |
| tp [min] | 3 1 | |
| tA [min] | 1 | |
| Okusawa area | tc (Detached house) [min] | 1 |
| tc (Housing complex) [min] | 3 | |
| vD [m/min] | 120 | |
| vSD [m/min] | 100 | |
| vFC [m/min] | 65 | |
| Meguro area | tc (Detached house) [min] | 1 |
| tc (Store) [min] | 1 | |
| vD [m/min] | 120 | |
| vSD [m/min] | 100 | |
| vFC [m/min] | 75 | |
| tc (Small housing complex and small office building) [min] | 1 | |
| tc (Medium housing complex and medium office building) [min] | 10 | |
| tc (Big housing complex and big office building) [min] | 30 |
1 Time for handing over packages; SD: handover (2 min) + package organisation (1 min) = 3 min in total; FC: handover (2 min) + responses to nearby destinations (1 min) = 3 min in total.
Table 5.
Comparison of calculation time for each method and exact solution.
| Method | Exact Solution | 1 | 2 | 4 | 5 | 7 |
|---|---|---|---|---|---|---|
| Ratio to the exact solution for T 1 | 1.000 | 1.034 | 1.041 | 1.022 | 1.008 | 1.008 |
| Calculation time (m = 15, n = 4) 1 | 9 h 56 m | 0.04 s | 0.05 s | 0.06 s | 0.02 s | 0.05 s |
| Calculation time (m = 200, n = 20) | – 2 | 11.2 s | 11.8 s | 17.2 s | – 2 | 75.0 s |
1 Combination (m = 15, n = 4) is possible to calculate in real time. 2 Combination (m = 200, n = 20) is impossible to calculate in real time.
Table 6.
Options in delivery and total delivery time T.
| Options | Avoid Right Turn | Prohibit Parking Truck on Slopes 1 | |
|---|---|---|---|
| Okusawa area | Destination | 91 places | - |
| Parking spot P | 12 places | - | |
| SD’s package organisation | 8 times | - | |
| SD’s travel distance | 7535 m | - | |
| FC’s travel distance | 5027 m | - | |
| Total delivery time T | 183 min | - | |
| Meguro area | Destination | 53 places | 53 places |
| Parking spot P | 7 places | 7 places | |
| Parking spot P | 2020 m | 2195 m | |
| FC1’s travel distance | 2804 m | 2740 m | |
| FC2’s travel distance | 2677 m | 2902 m | |
| Total delivery time T | 175 min | 181 min |
1 Since the Okusawa area is flat, truck parking restrictions are not considered here.
Table 8.
Hourly labour cost for delivery person combination.
| Delivery Person Combination | Hourly Wage (JPY/hour) |
|---|---|
| D | 1000 |
| SD | 1800 |
| FC | 1000 |
| 1 SD + 1 FC | 2800 |
| 1 SD + 2 FCs | 3800 |
| 1 D + 1 FC | 2000 |
| 1 D + 2 FCs | 3000 |
| 1 D + 3 FCs | 4000 |
Table 9.
Evaluations of removing absence destinations.
| Whether to Remove | Destination | Parking Spot P | Truck Travel Distance | Walking Distance per FC | Total Delivery Time T | Social Cost C | |
|---|---|---|---|---|---|---|---|
| Okusawa area 1,3 | Not remove | 91 places | 12 places | 7188 m | 5138 m | 180 min | 9804 JPY |
| Remove | 81 places | 11 places | 6359 m | 4324 m | 159 min | 8500 JPY | |
| Meguro area 2,3 | Not remove | 53 places | 7 places | 1981 m | 2875 m | 180 min | 9963 JPY |
| Remove | 43 places | 6 places | 1699 m | 2214 m | 161 min | 8839 JPY |
1 Remove 18 units (10 destinations) that were absent in the survey. 2 Remove 17 units (10 destinations) that were absent in the survey. 3 For detached houses with time to respond tC = 1, remove absence destination. In addition, if 1 unit in the housing complex with tC = 3, 10 is absent, set tC = 2, 9.
Disclaimer/Publisher’s Note: The statements, opinions and data contained in all publications are solely those of the individual author(s) and contributor(s) and not of MDPI and/or the editor(s). MDPI and/or the editor(s) disclaim responsibility for any injury to people or property resulting from any ideas, methods, instructions or products referred to in the content. |
© 2023 by the authors. Licensee MDPI, Basel, Switzerland. This article is an open access article distributed under the terms and conditions of the Creative Commons Attribution (CC BY) license (https://creativecommons.org/licenses/by/4.0/).
Share and Cite
MDPI and ACS Style
Osaragi, T.; Taguchi, Y.; Shiode, N.; Shiode, S. Evaluation of a Team-Based Collection and Delivery Operation. Sustainability 2023, 15, 9117. https://doi.org/10.3390/su15119117
AMA Style
Osaragi T, Taguchi Y, Shiode N, Shiode S. Evaluation of a Team-Based Collection and Delivery Operation. Sustainability. 2023; 15(11):9117. https://doi.org/10.3390/su15119117
Chicago/Turabian StyleOsaragi, Toshihiro, Yuya Taguchi, Narushige Shiode, and Shino Shiode. 2023. "Evaluation of a Team-Based Collection and Delivery Operation" Sustainability 15, no. 11: 9117. https://doi.org/10.3390/su15119117
Note that from the first issue of 2016, this journal uses article numbers instead of page numbers. See further details here.