
Variation in Certain Soil Properties Based on Land Use Type, and Elevation in Arhavi Sub-Basin, Artvin, Turkiye

 , , and
Abstract
:1. Introduction
2. Materials and Methods
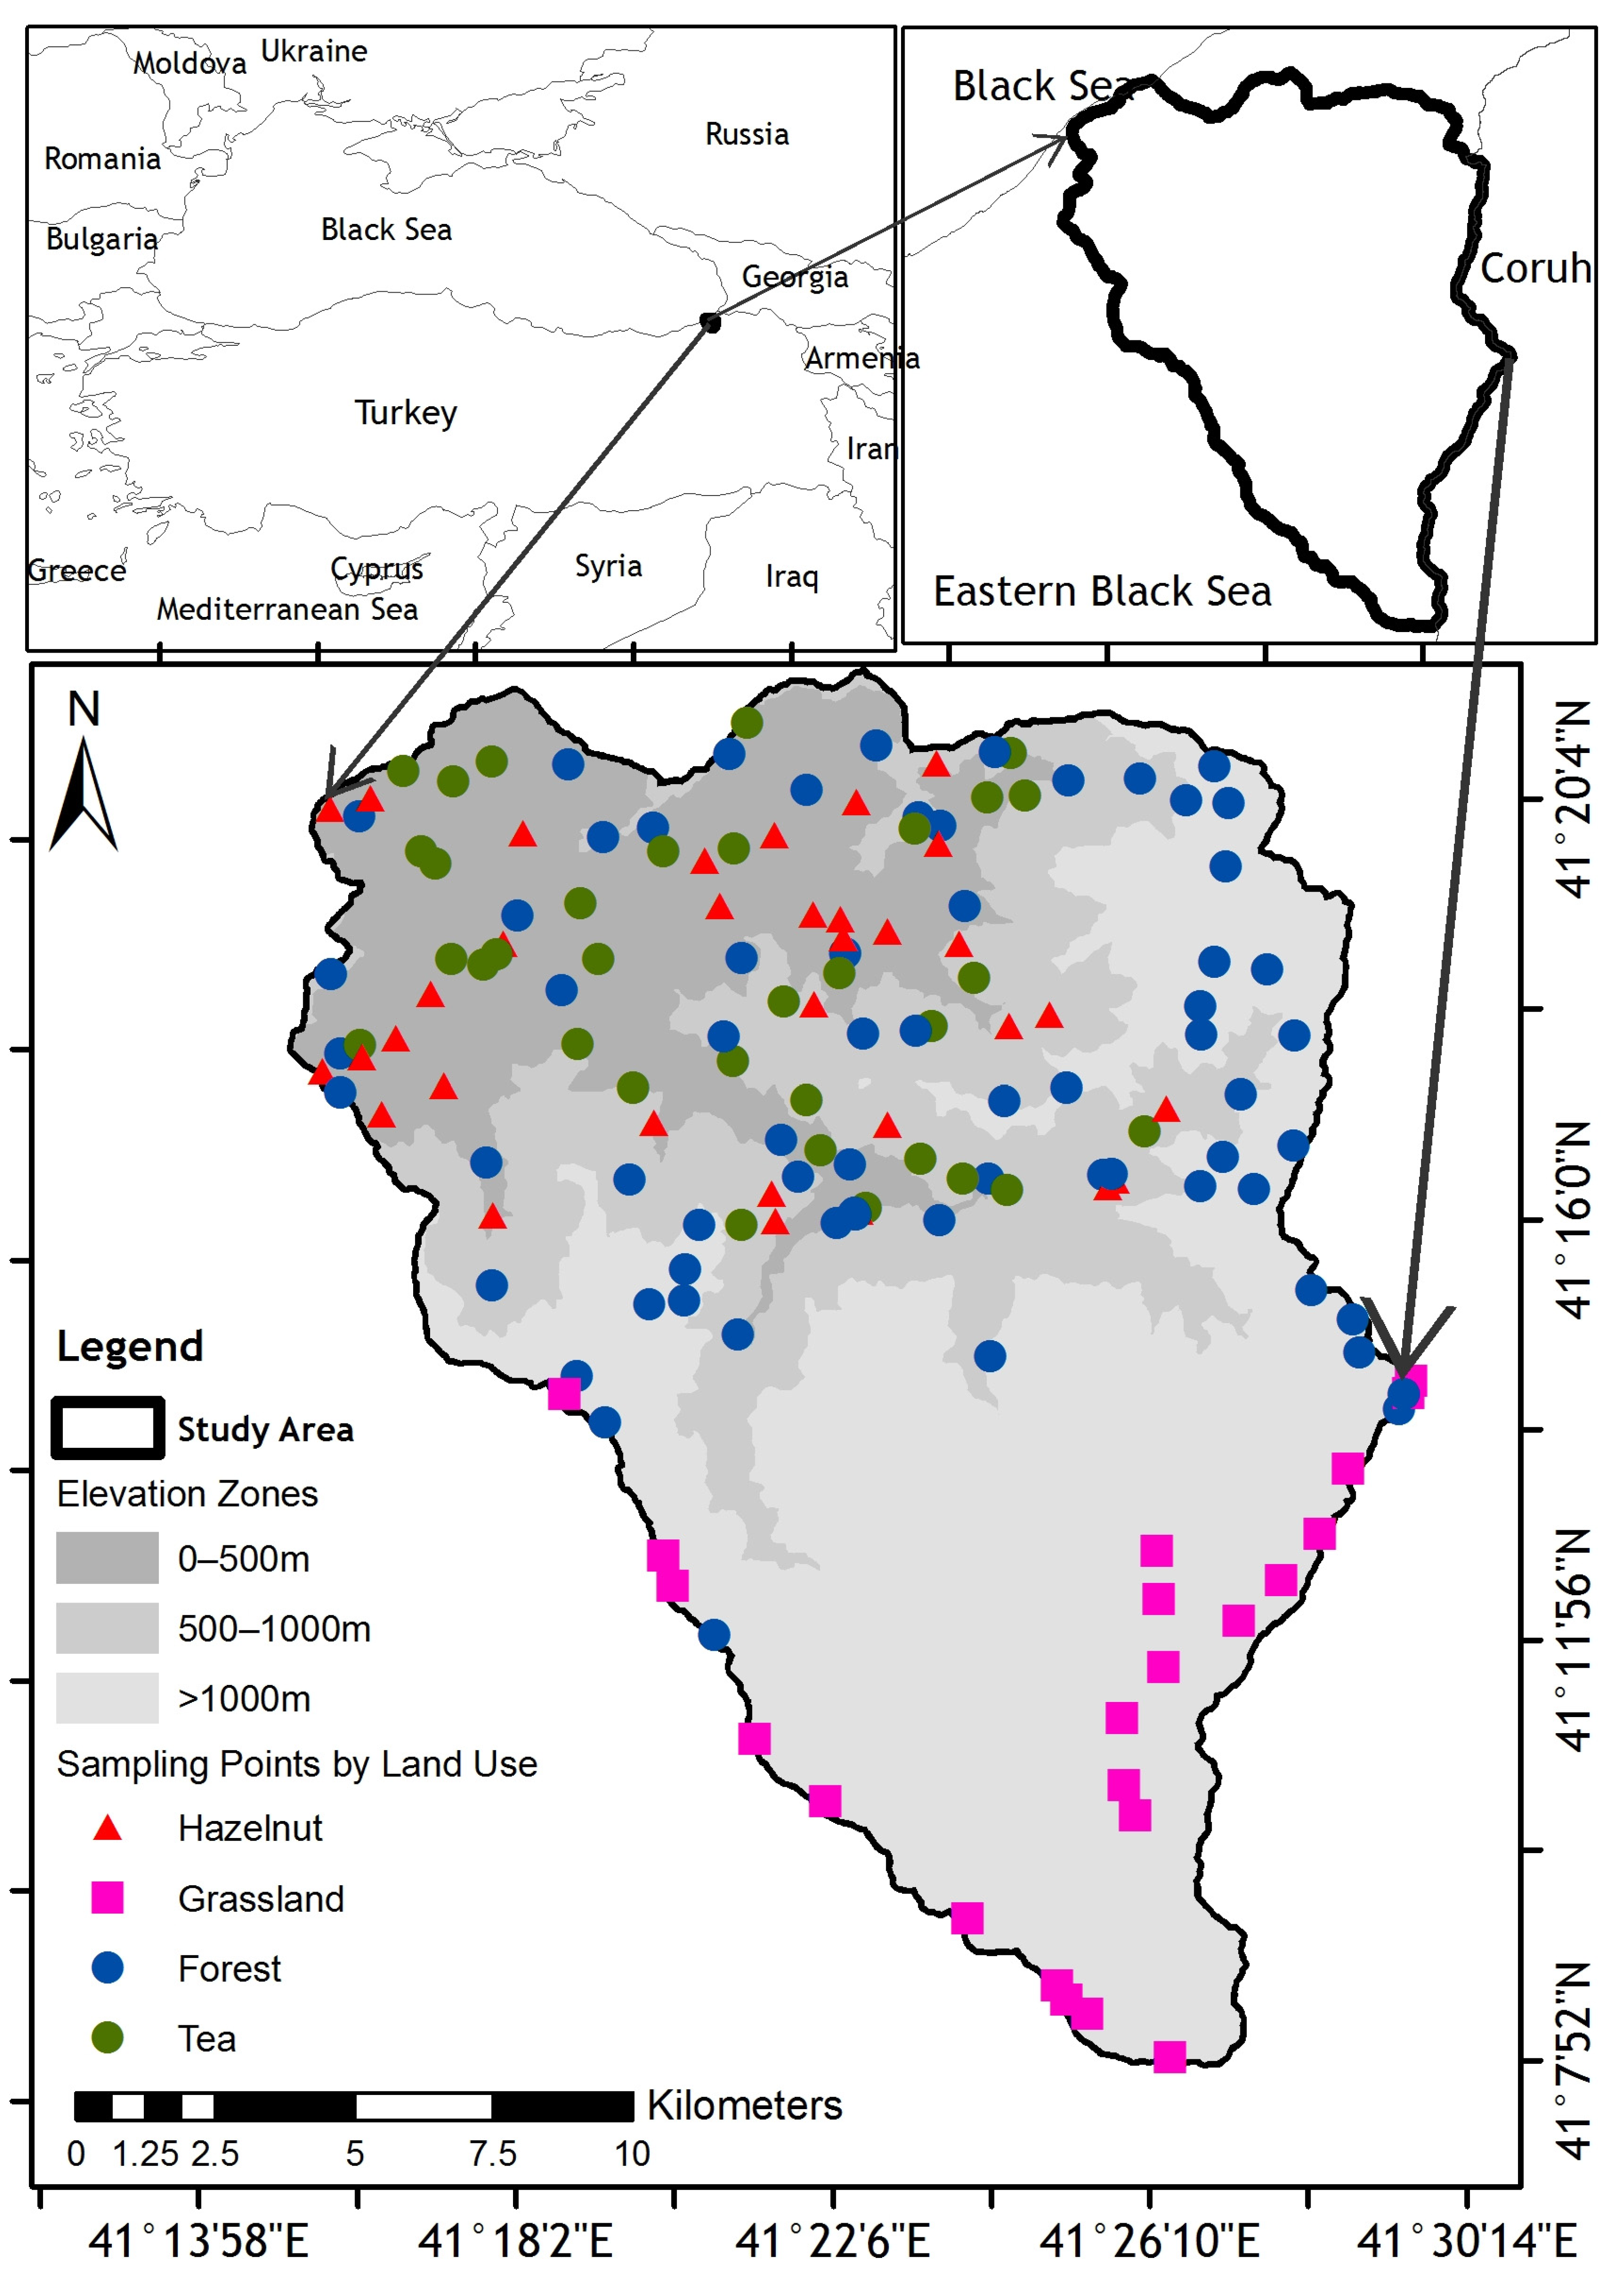
2.1. Study Area and Sampling Locations
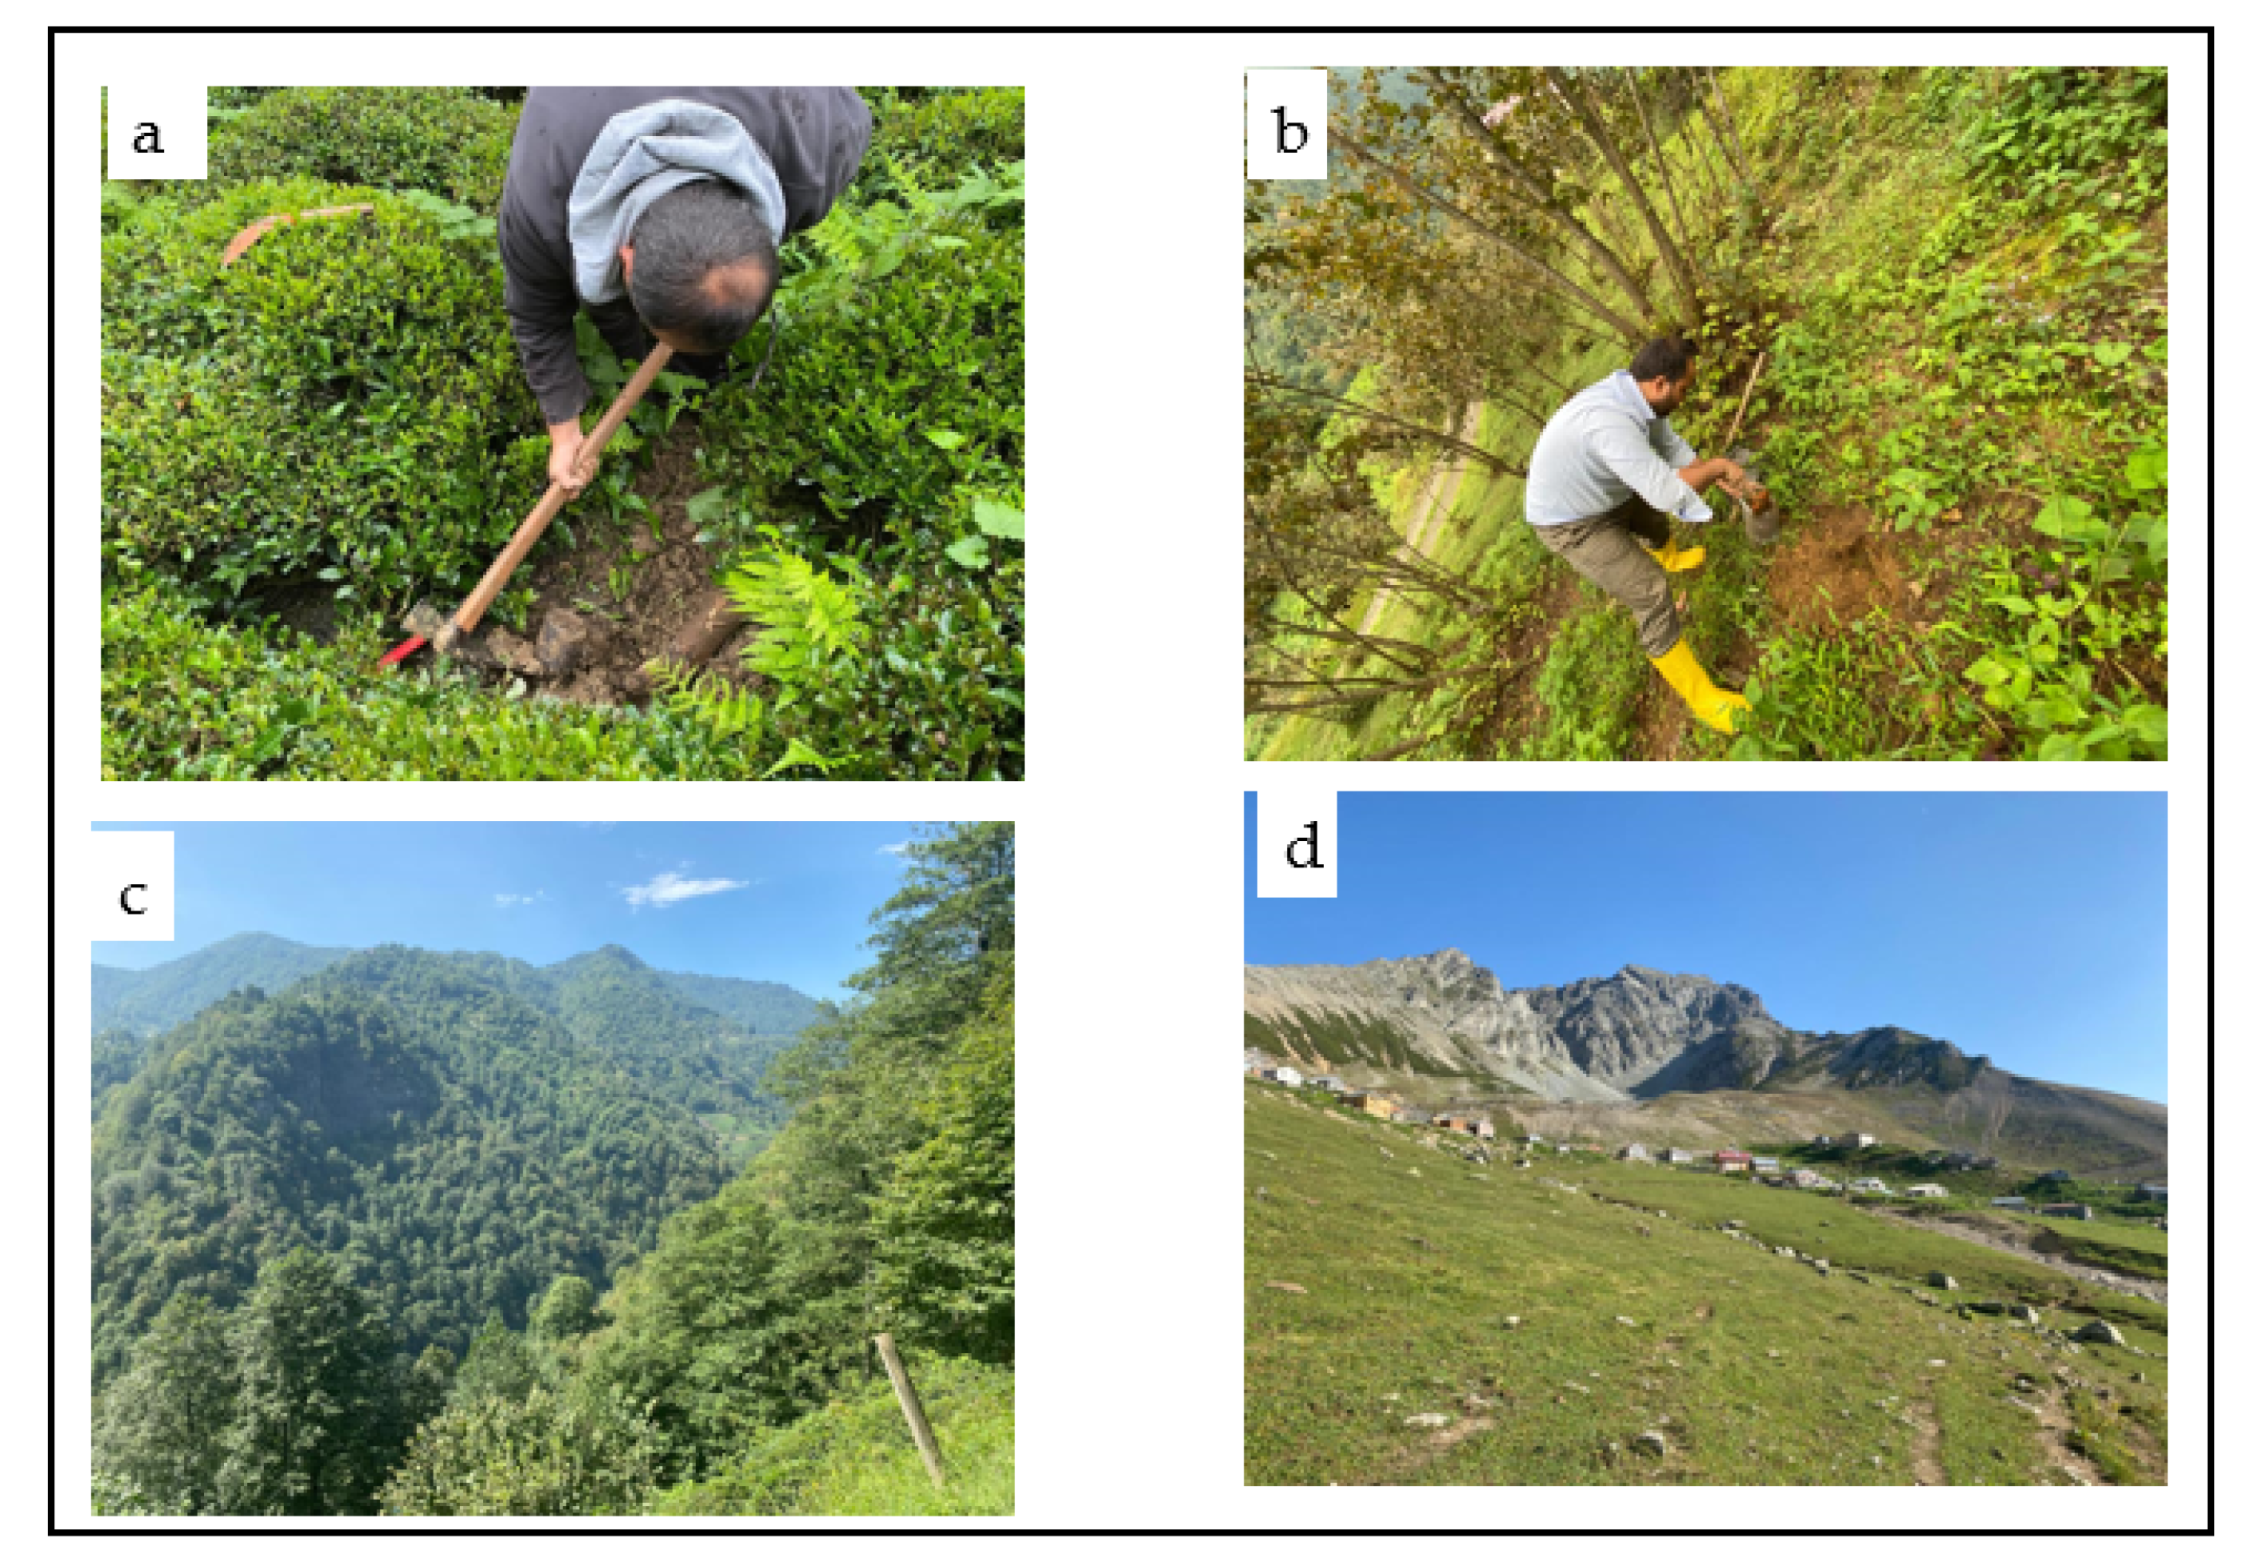
2.2. Sampling and Analysis Methods
2.3. Data Analysis
3. Results and Discussion
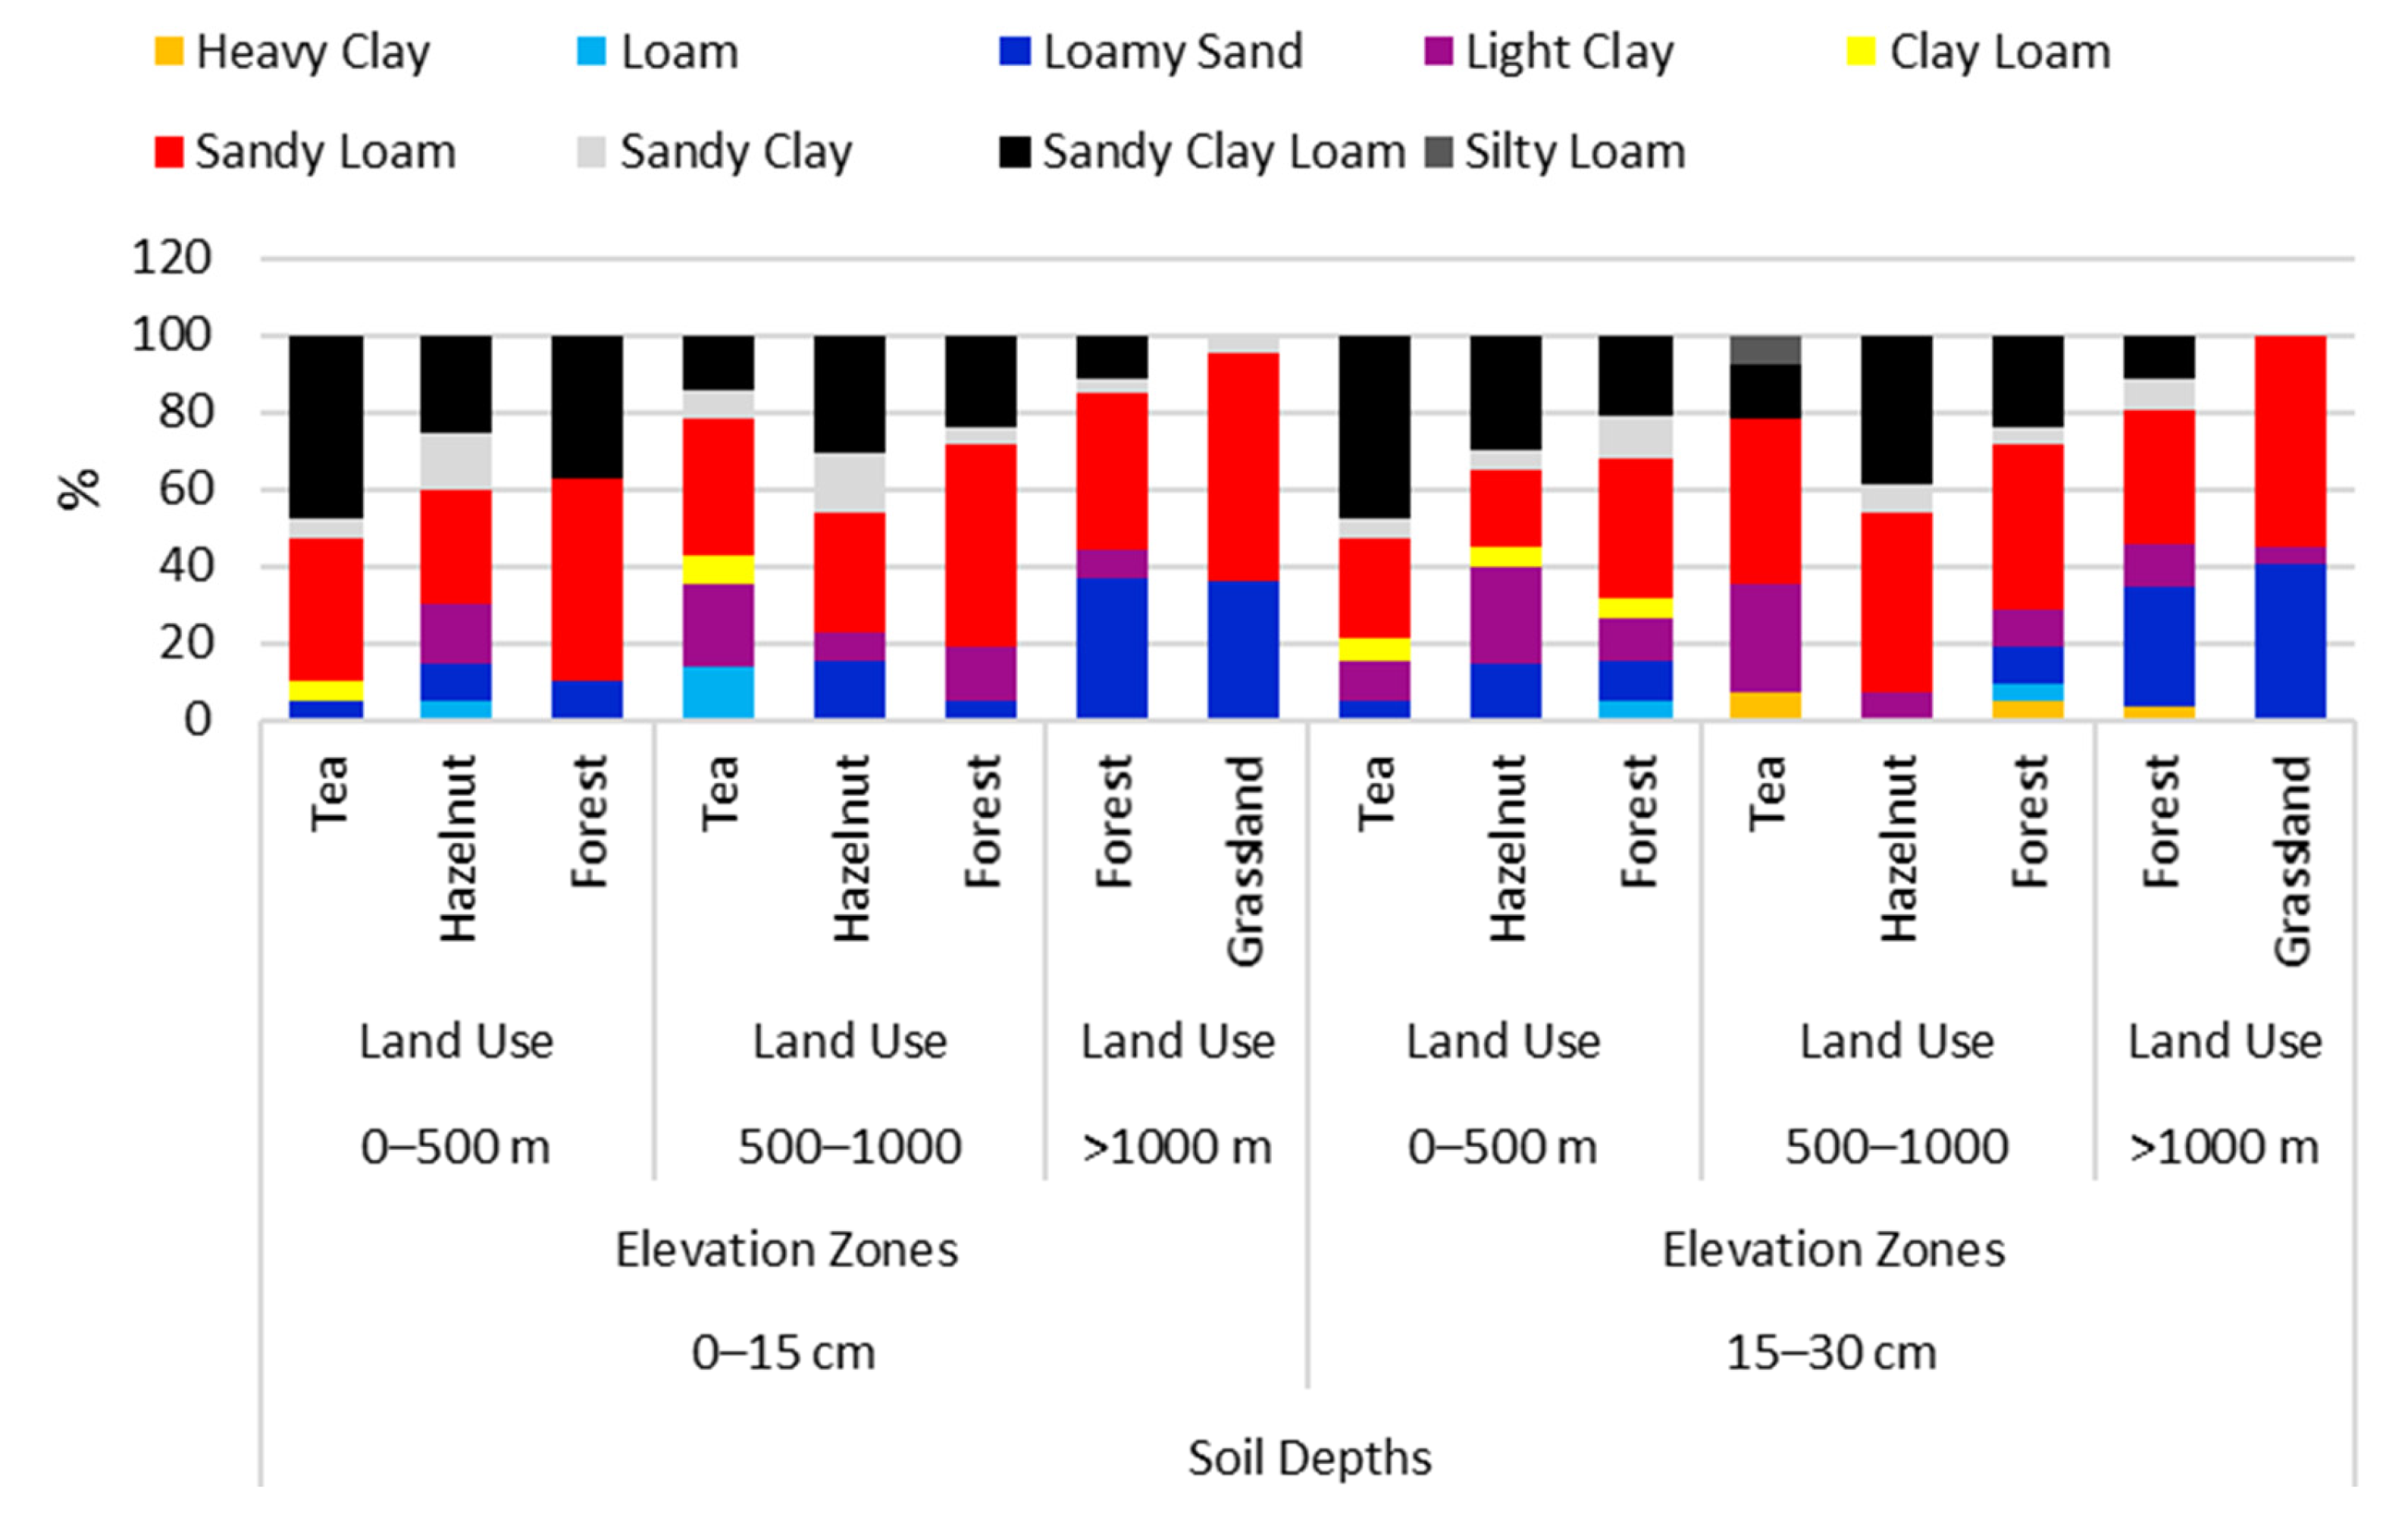
3.1. Soil Texture
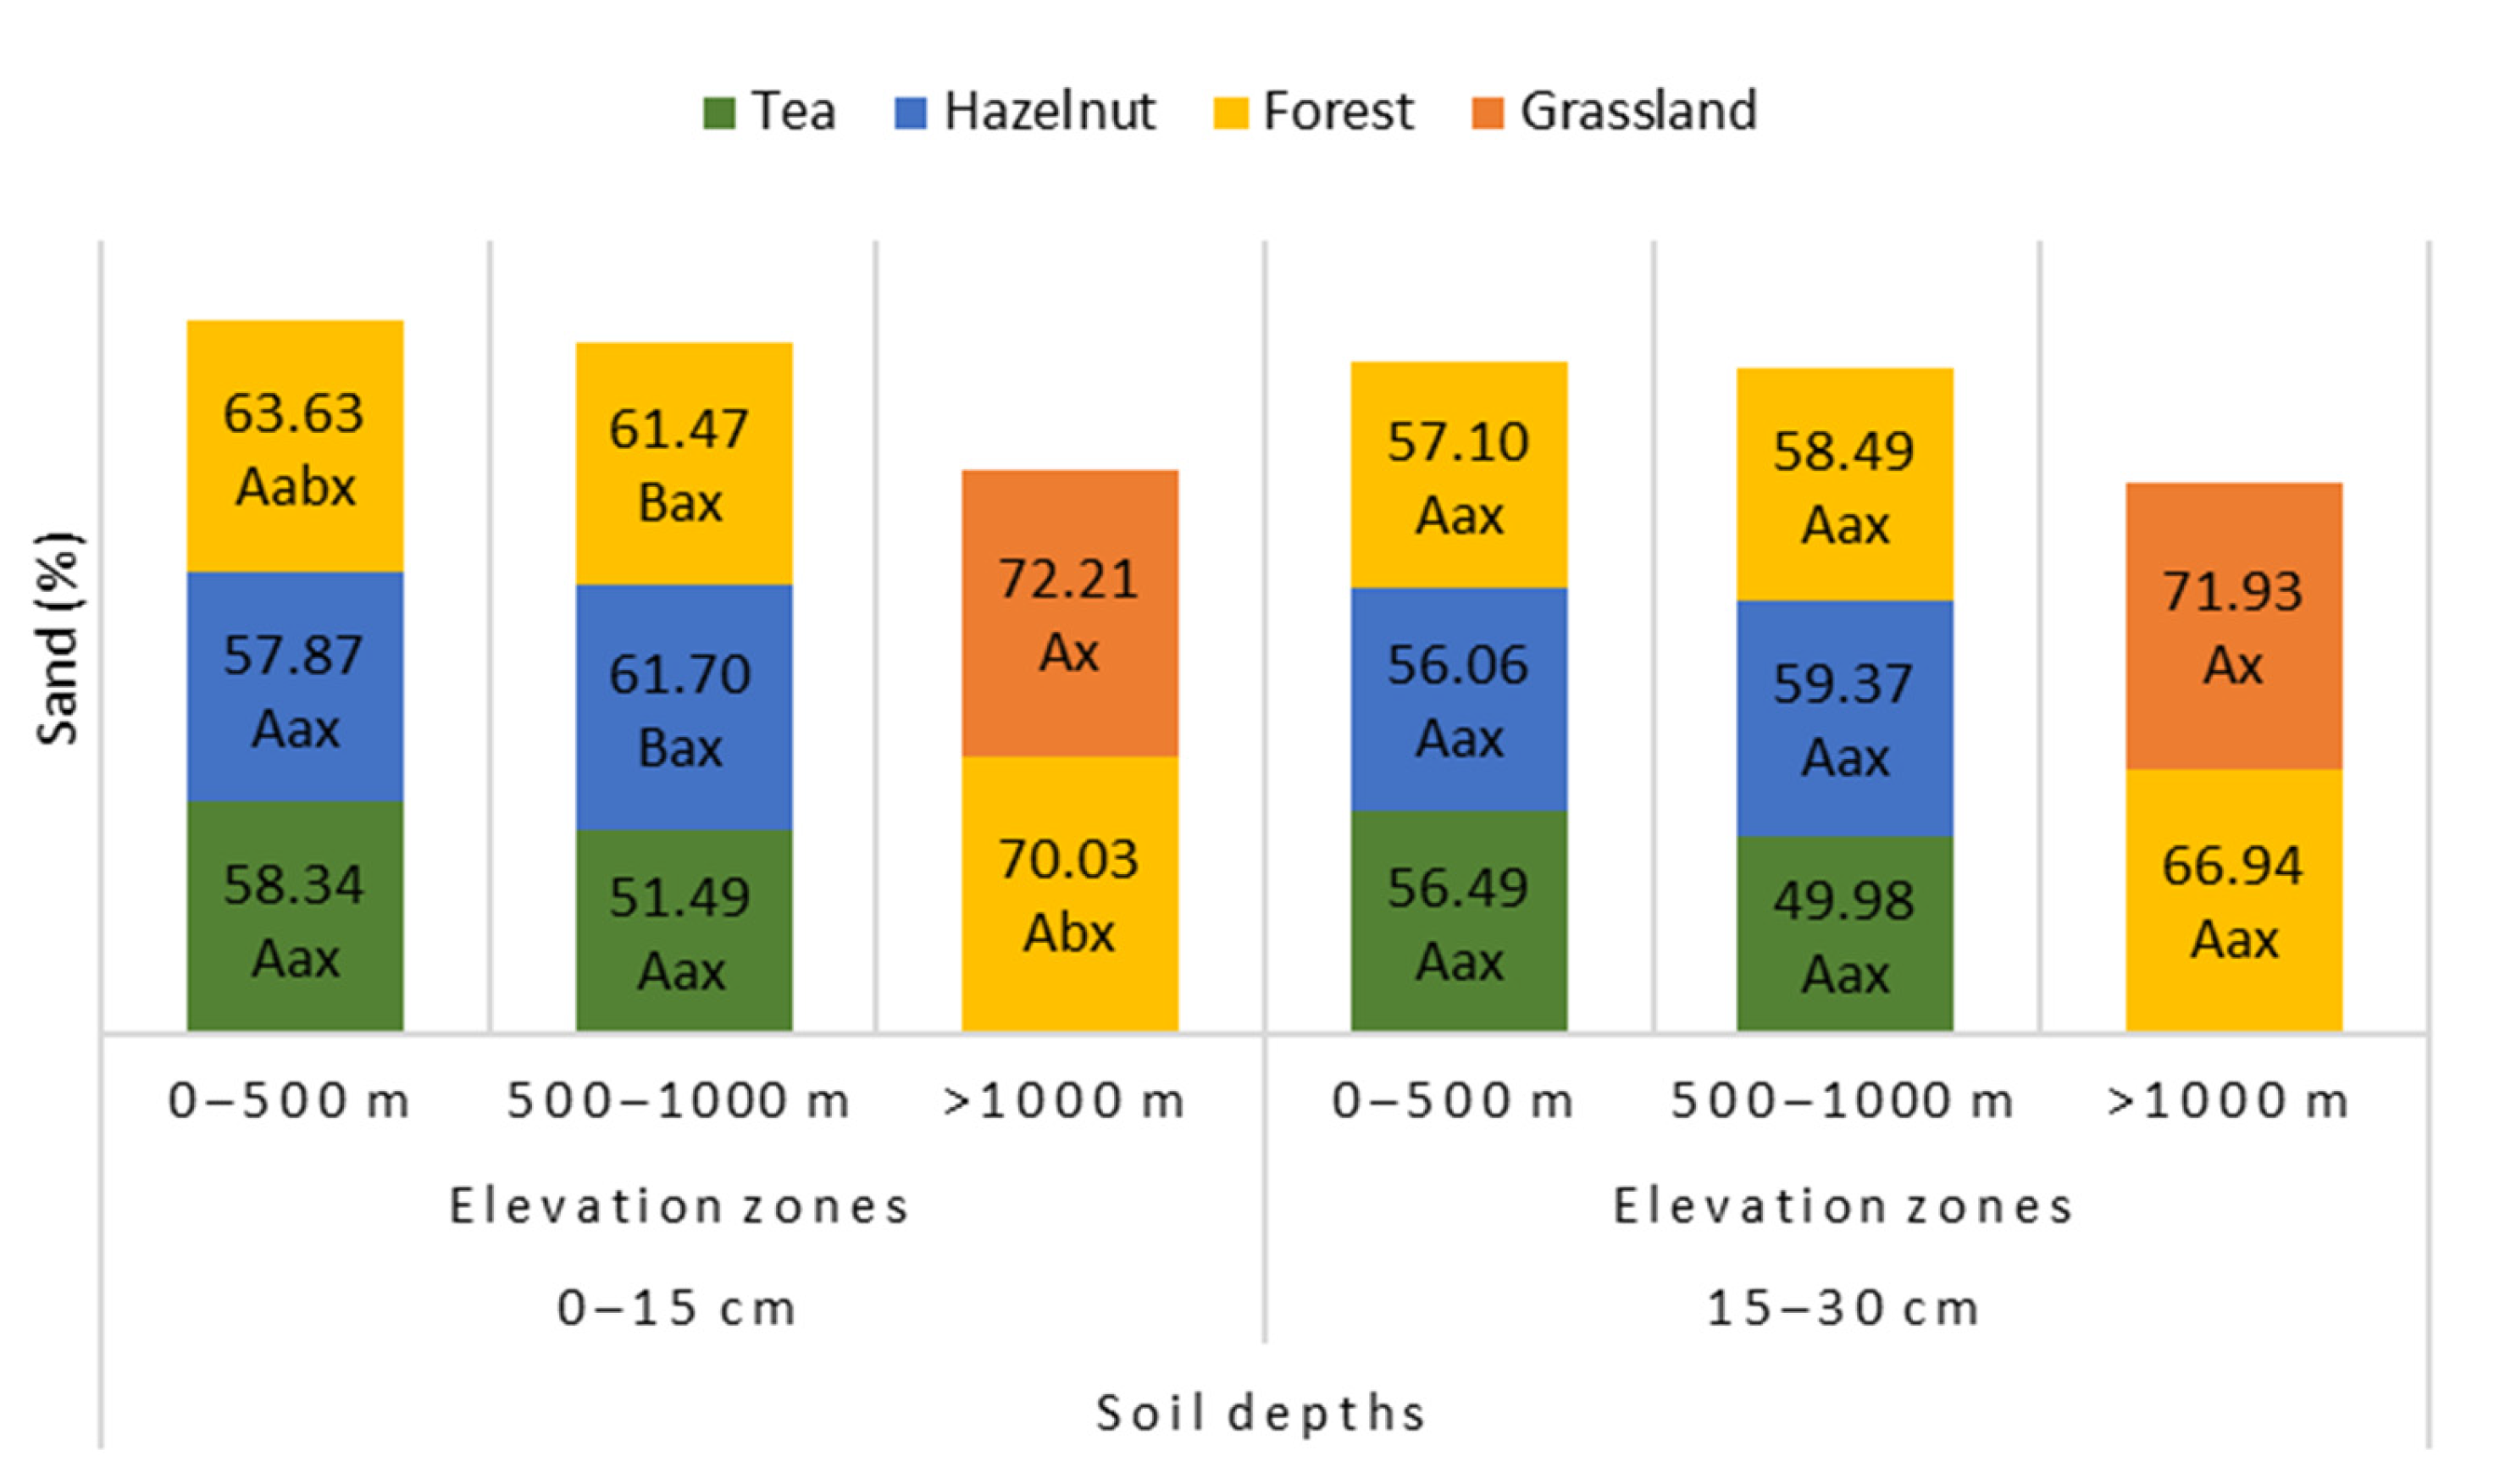
3.1.1. Sand (%)
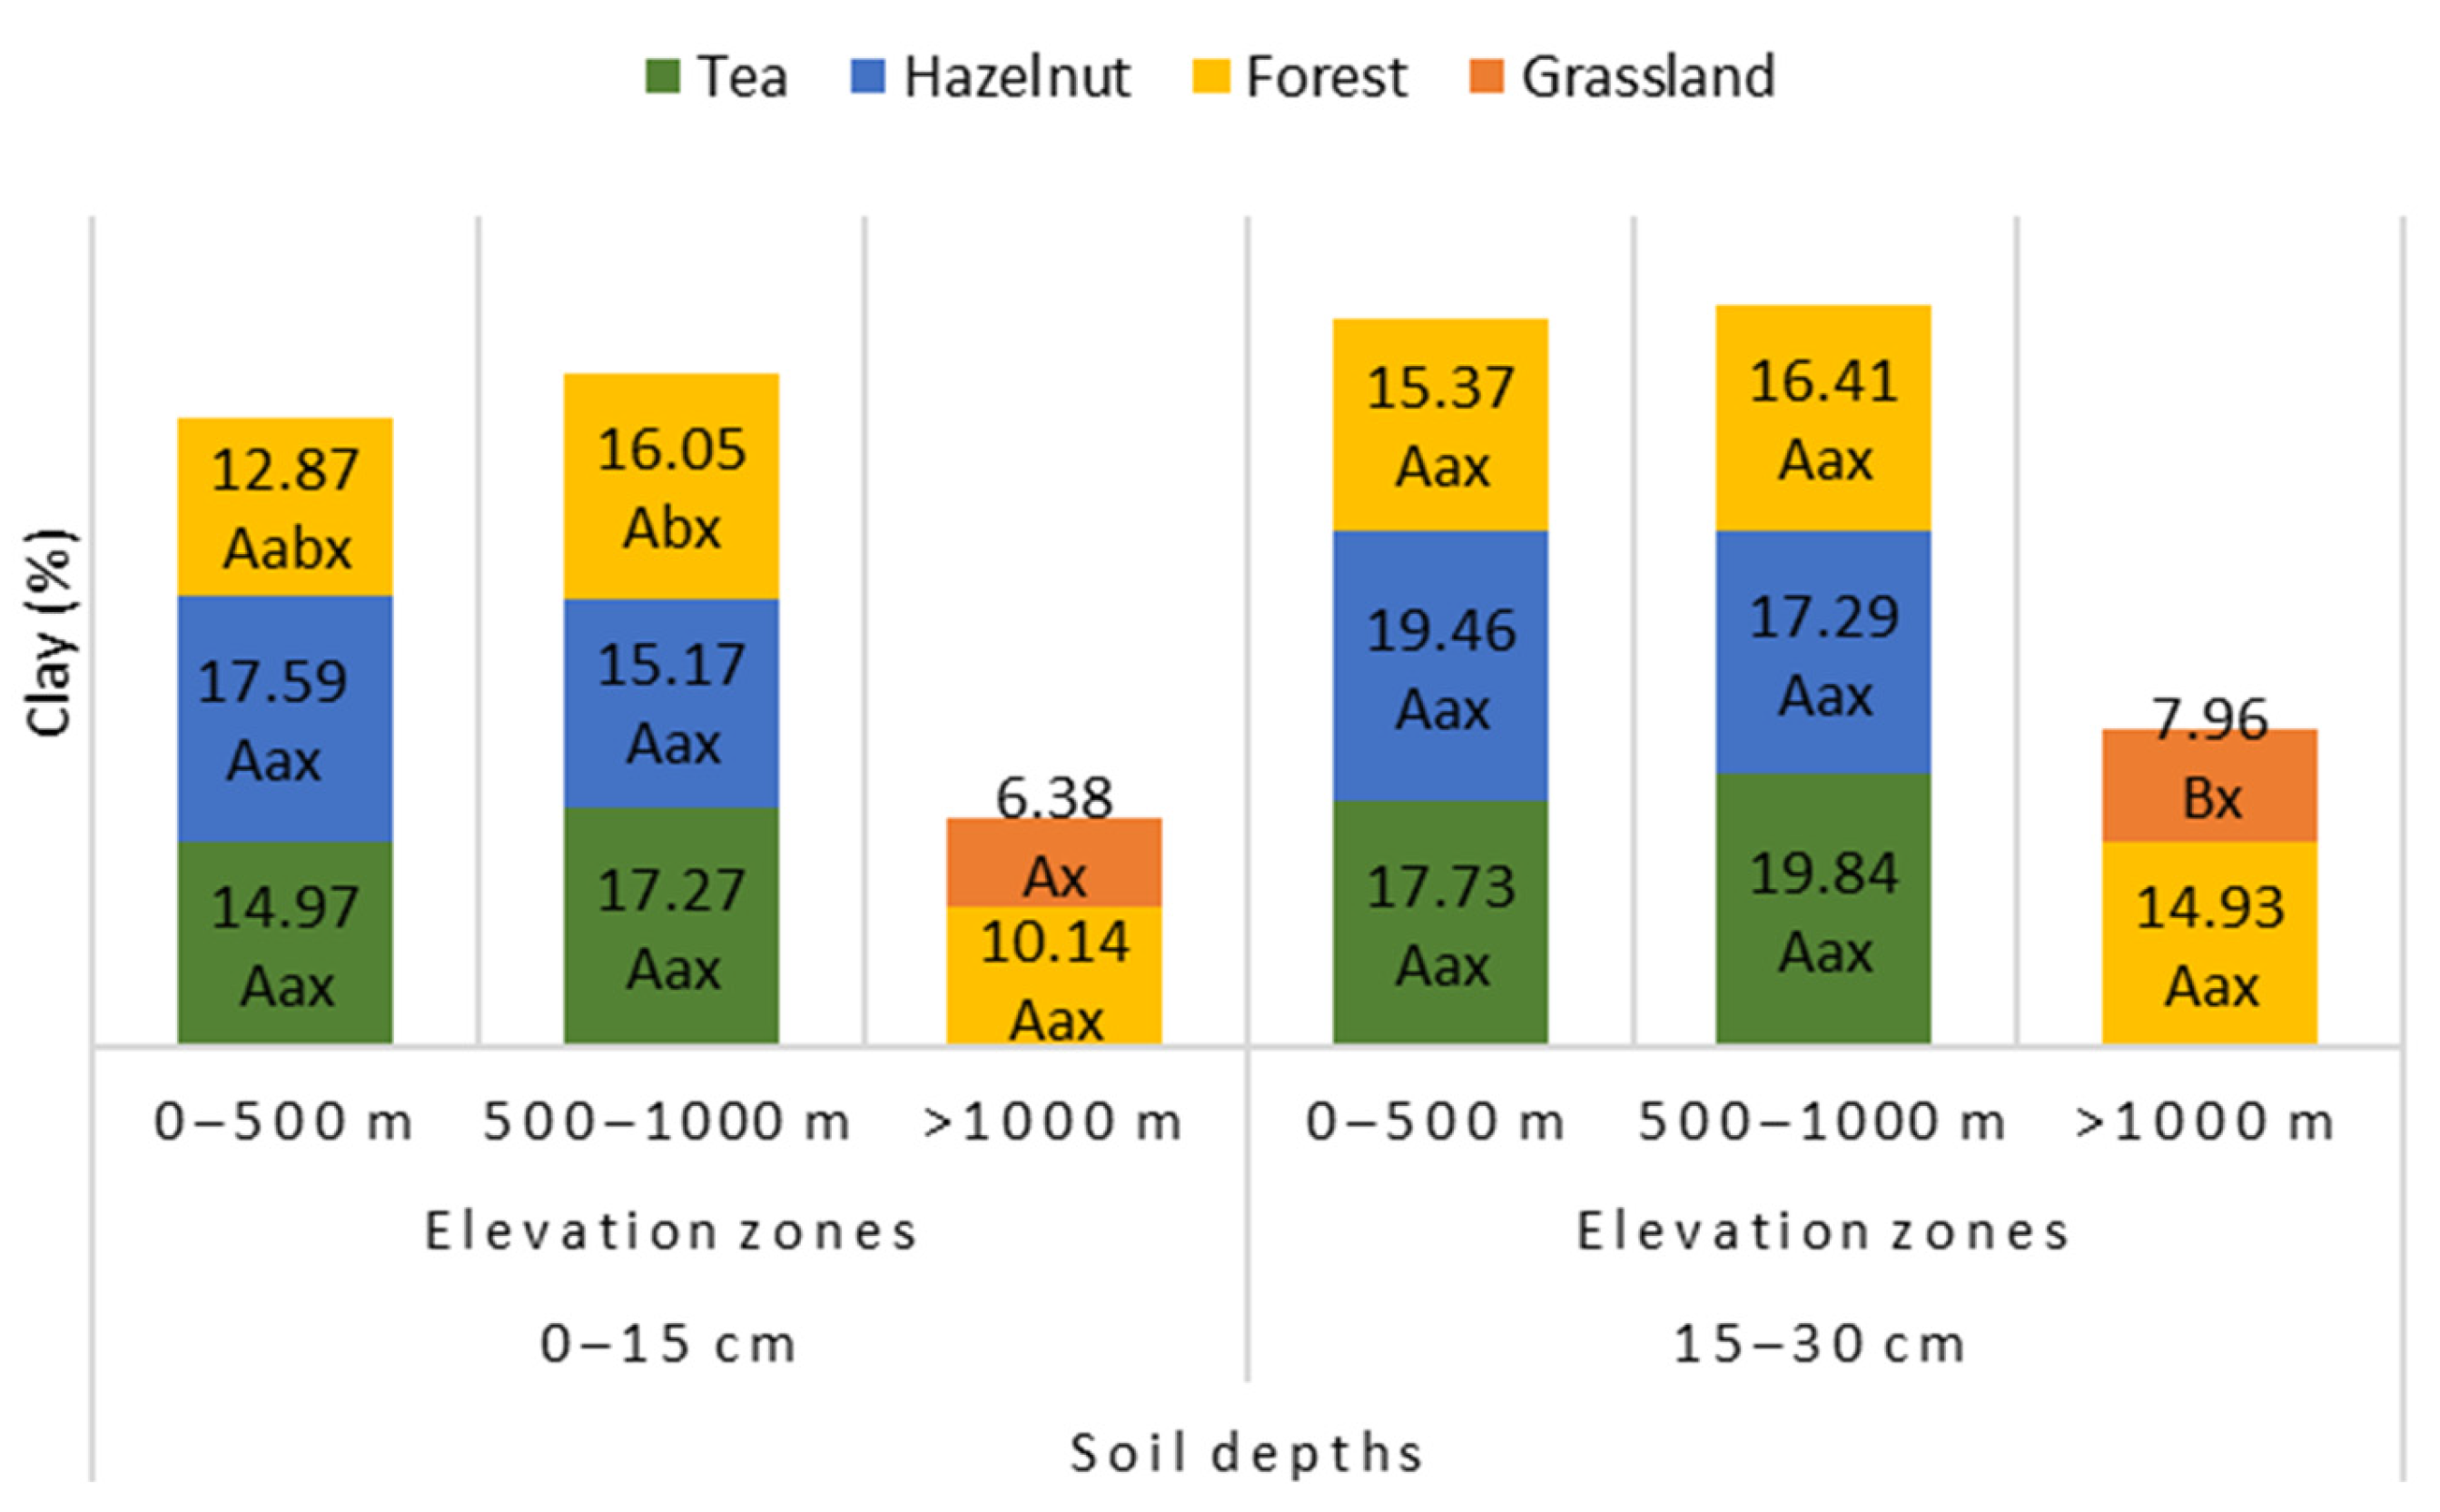
3.1.2. Clay (%)
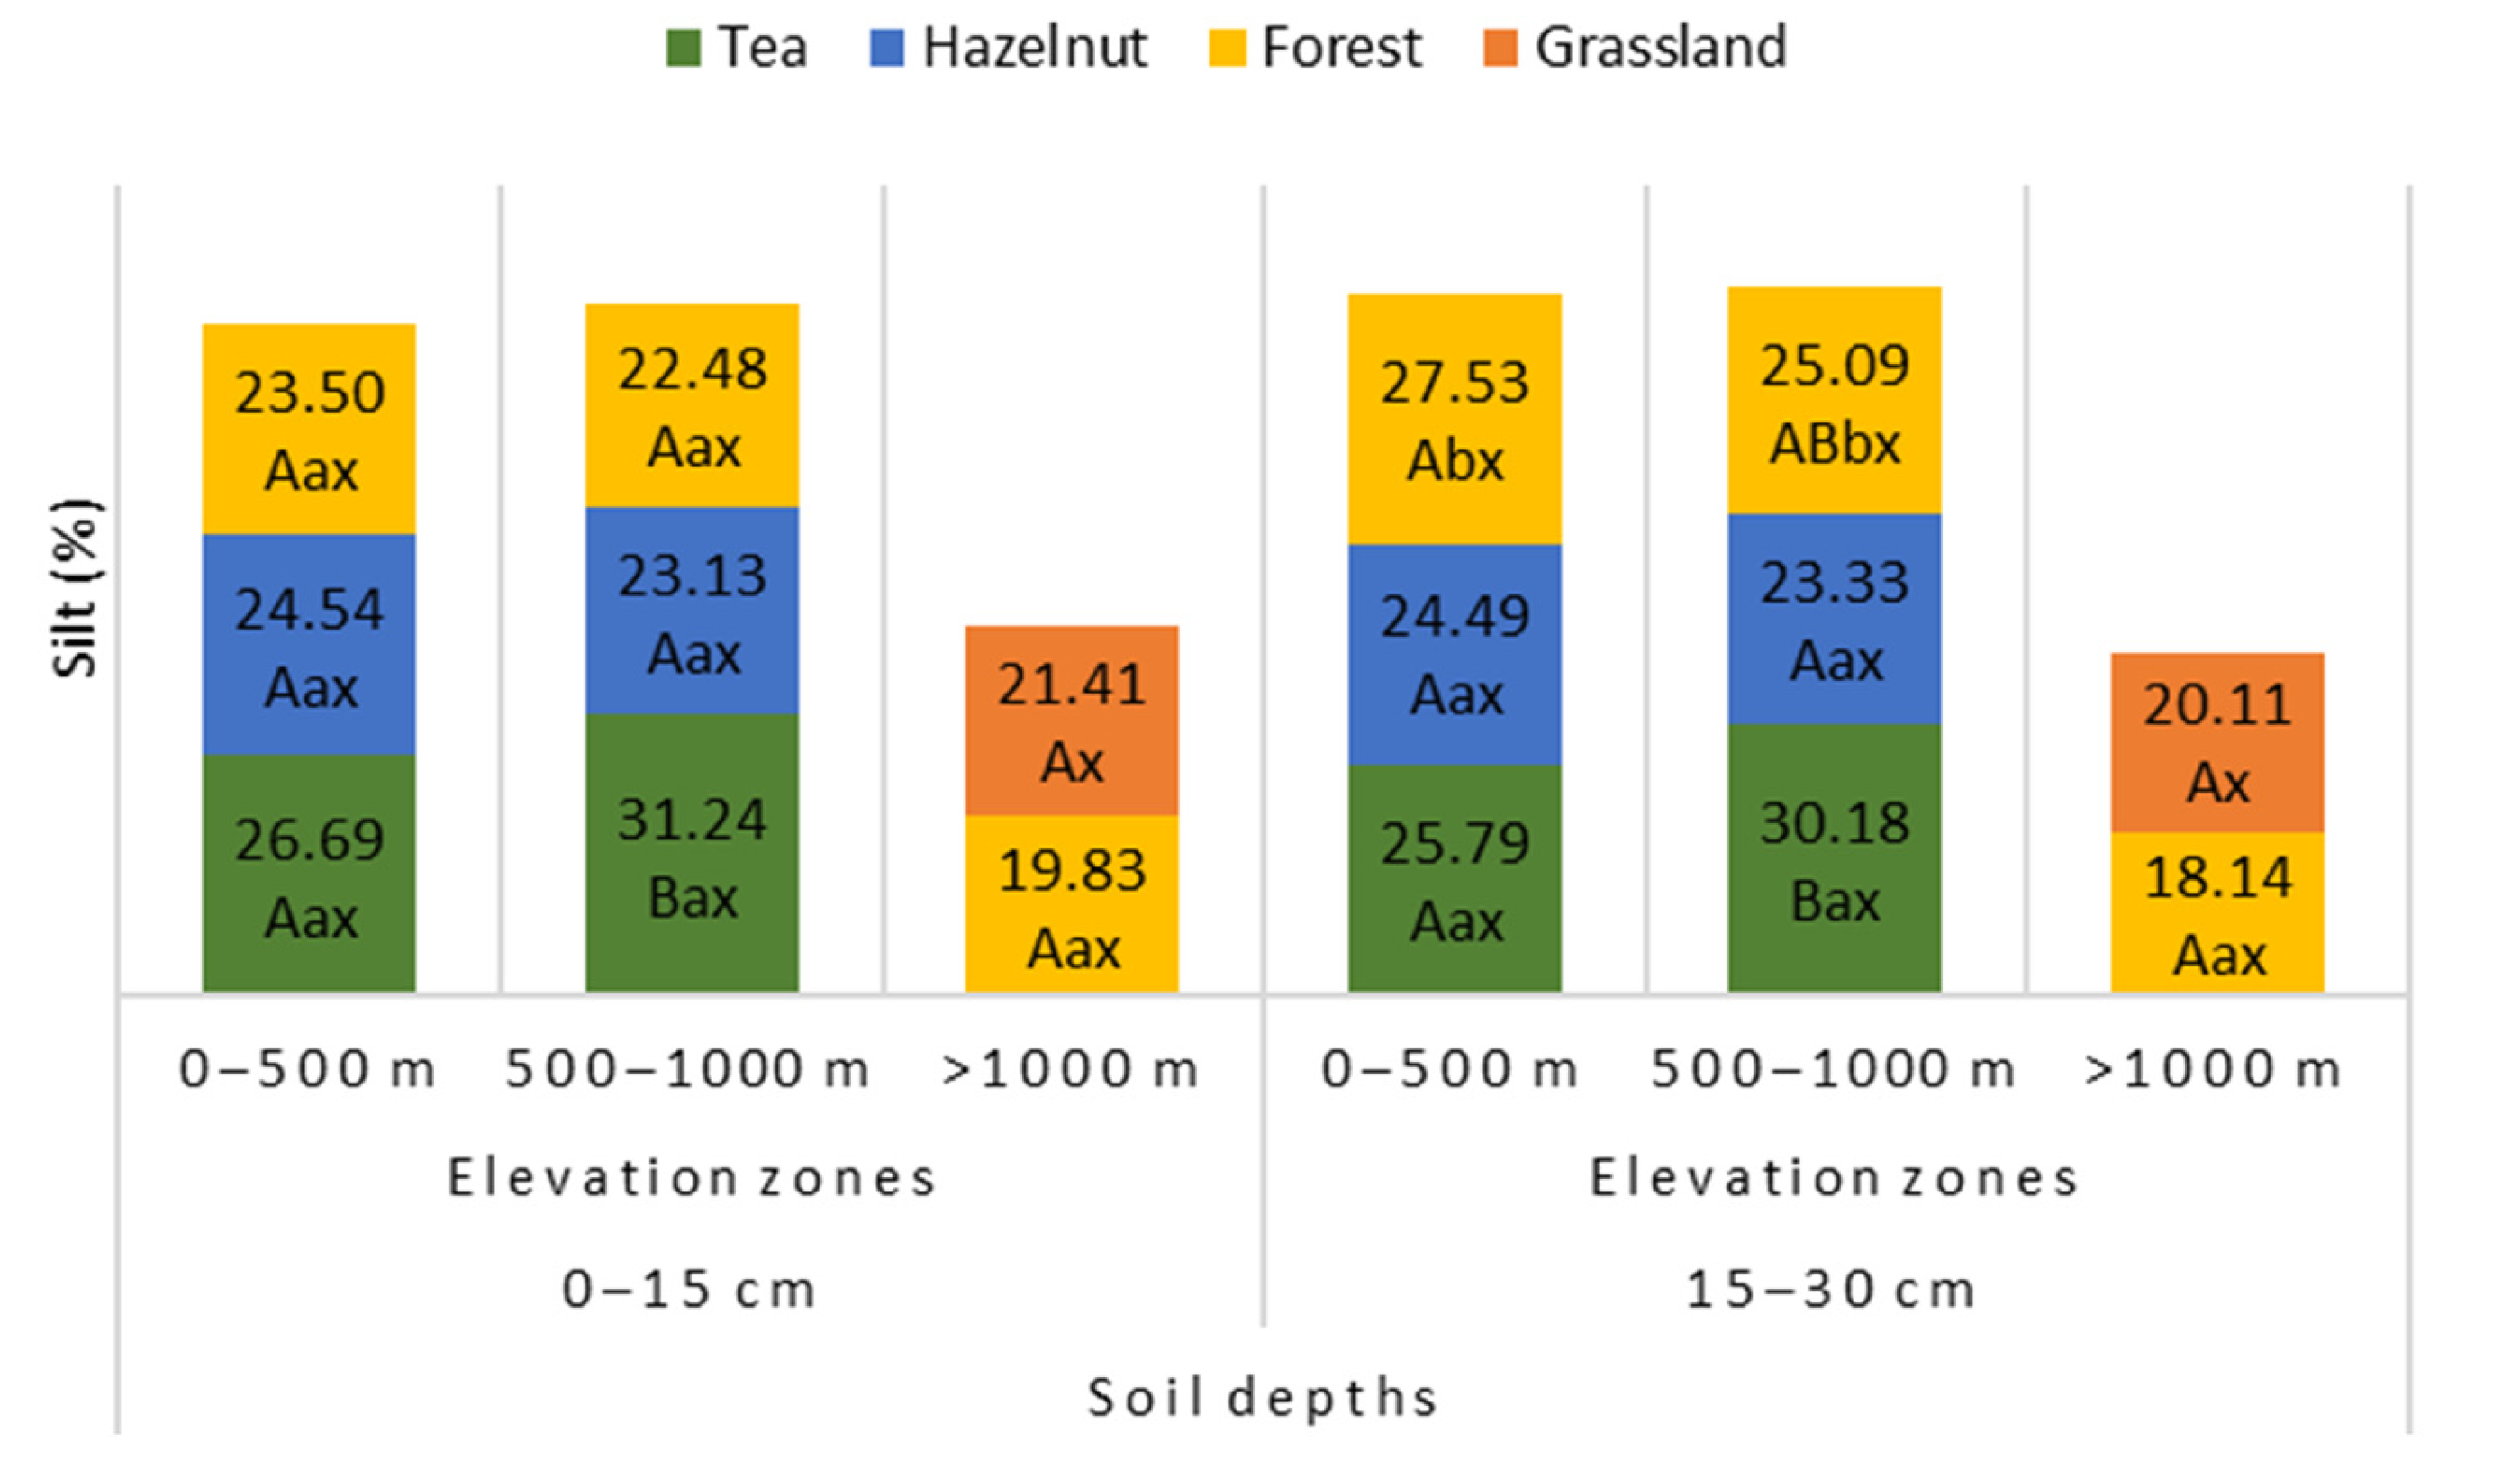
3.1.3. Silt (%)
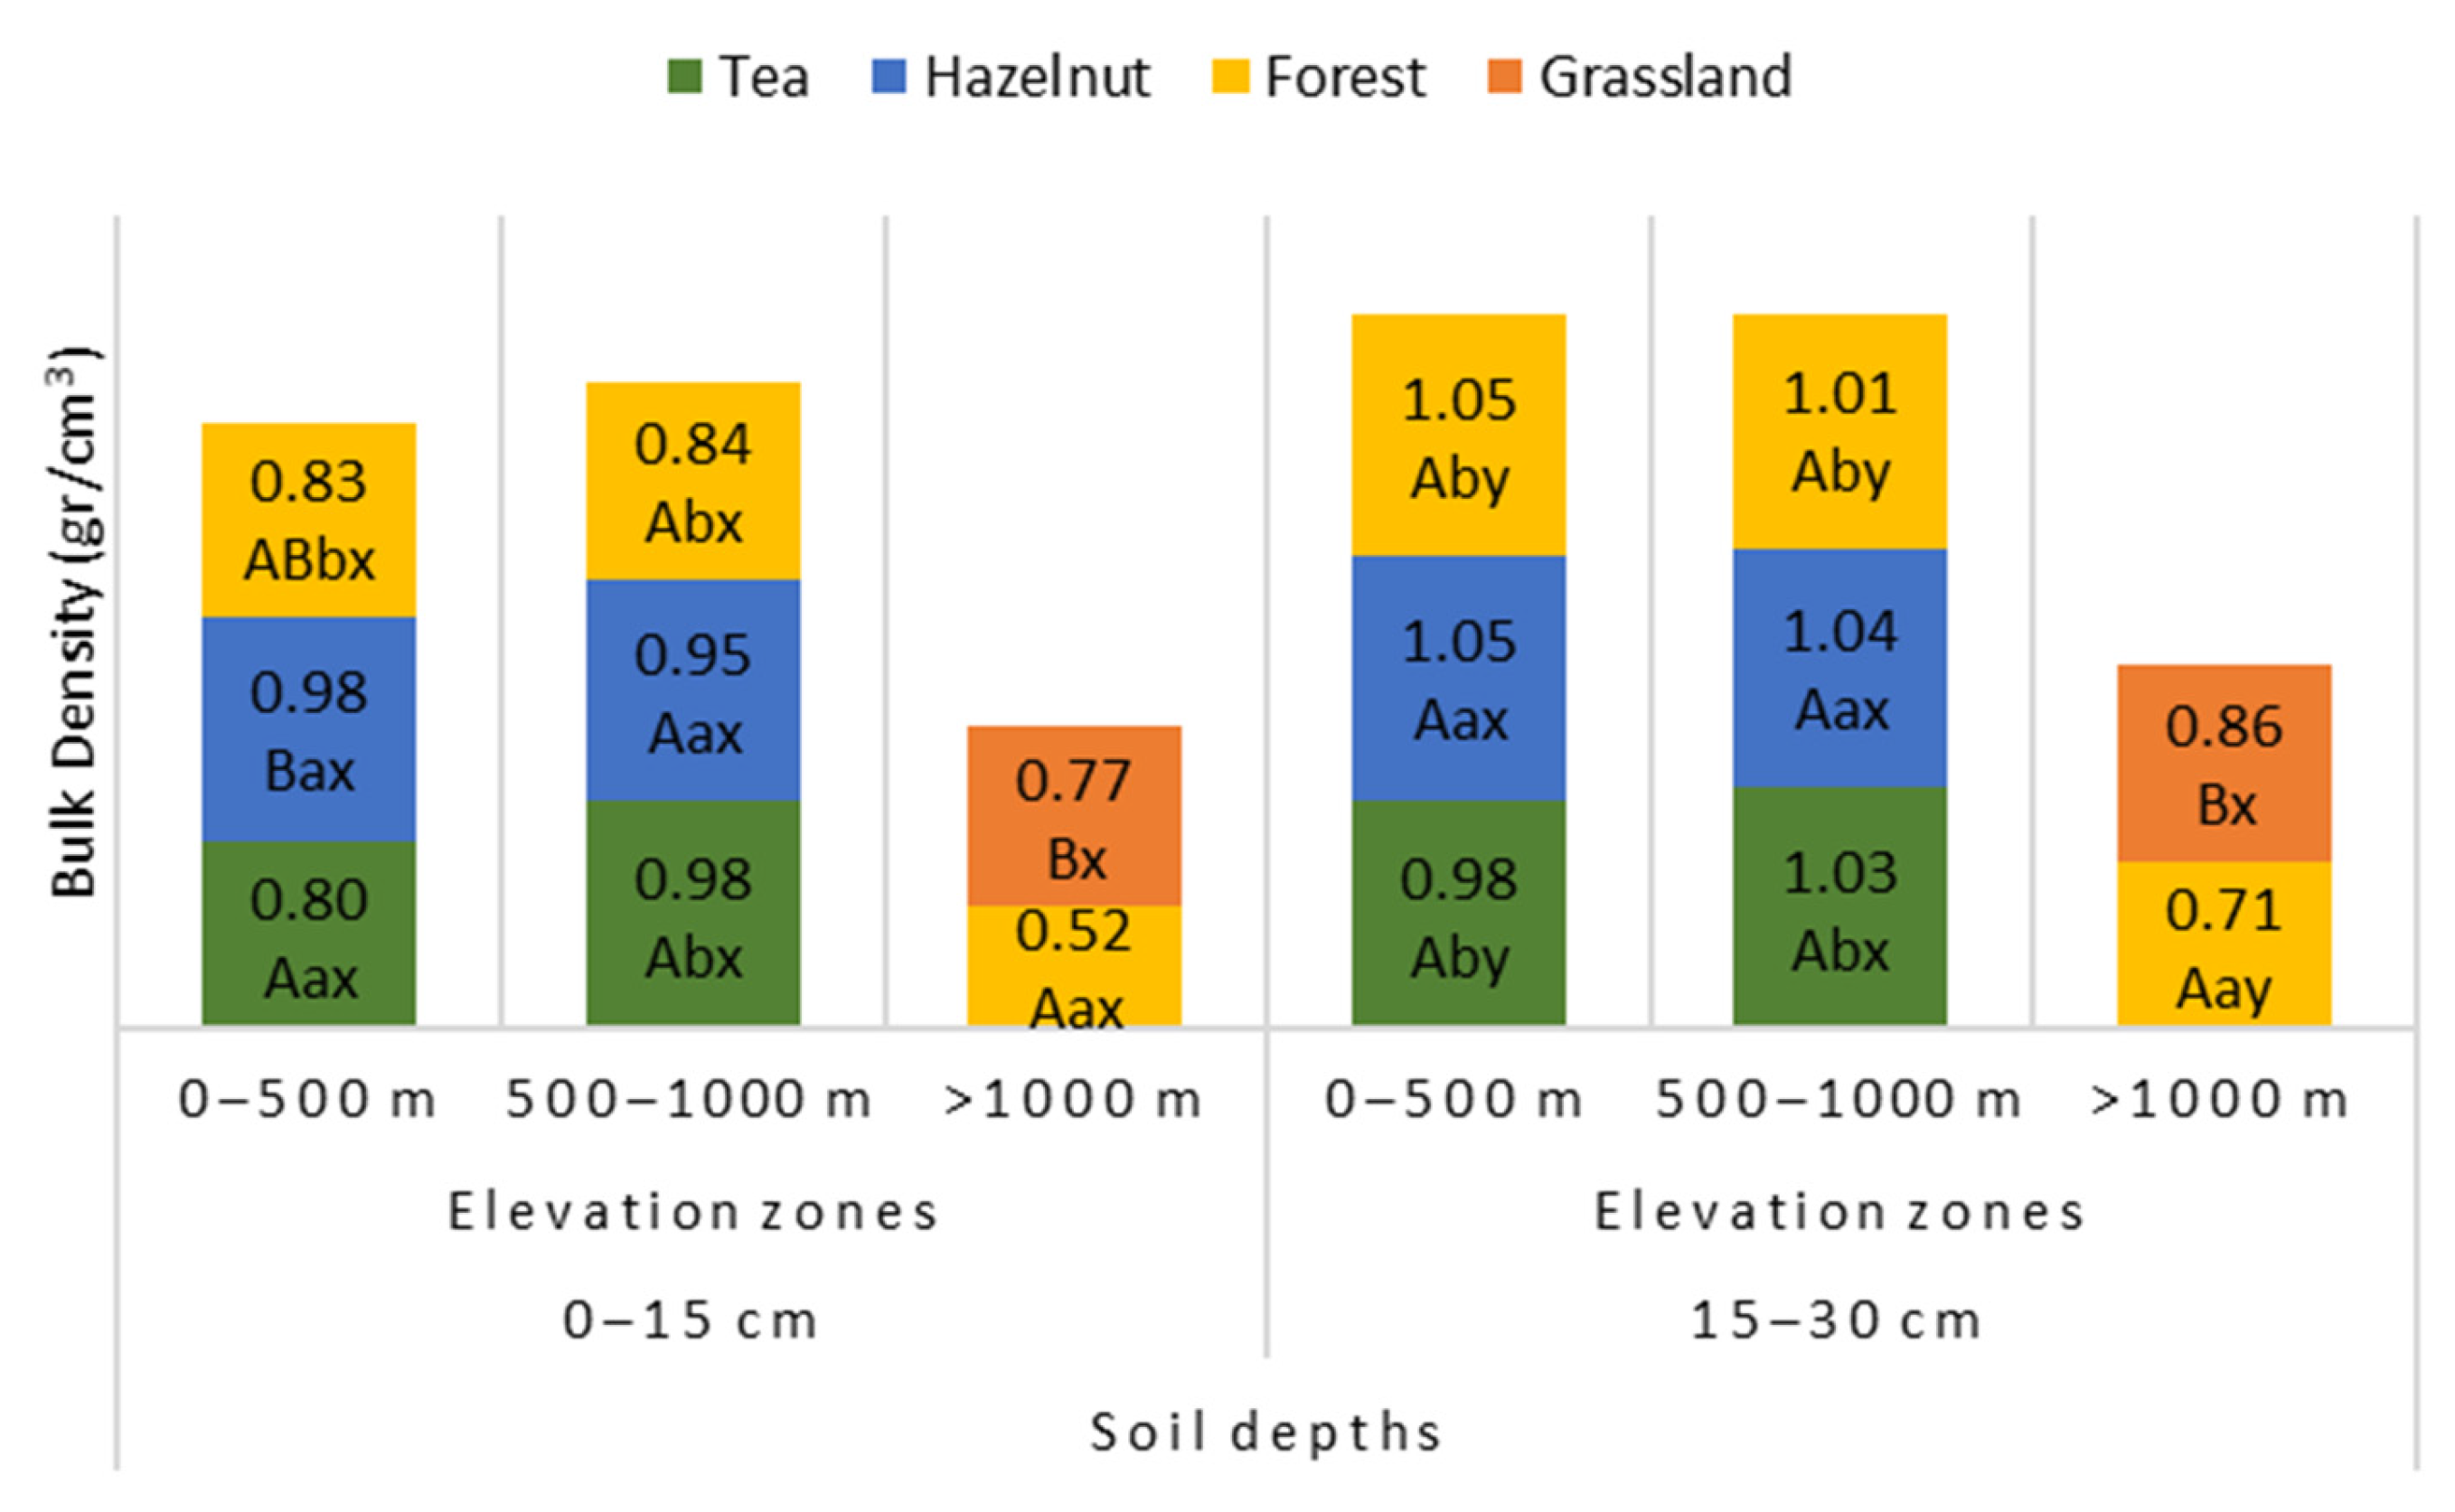
3.2. Soil Bulk Density (g/cm3)
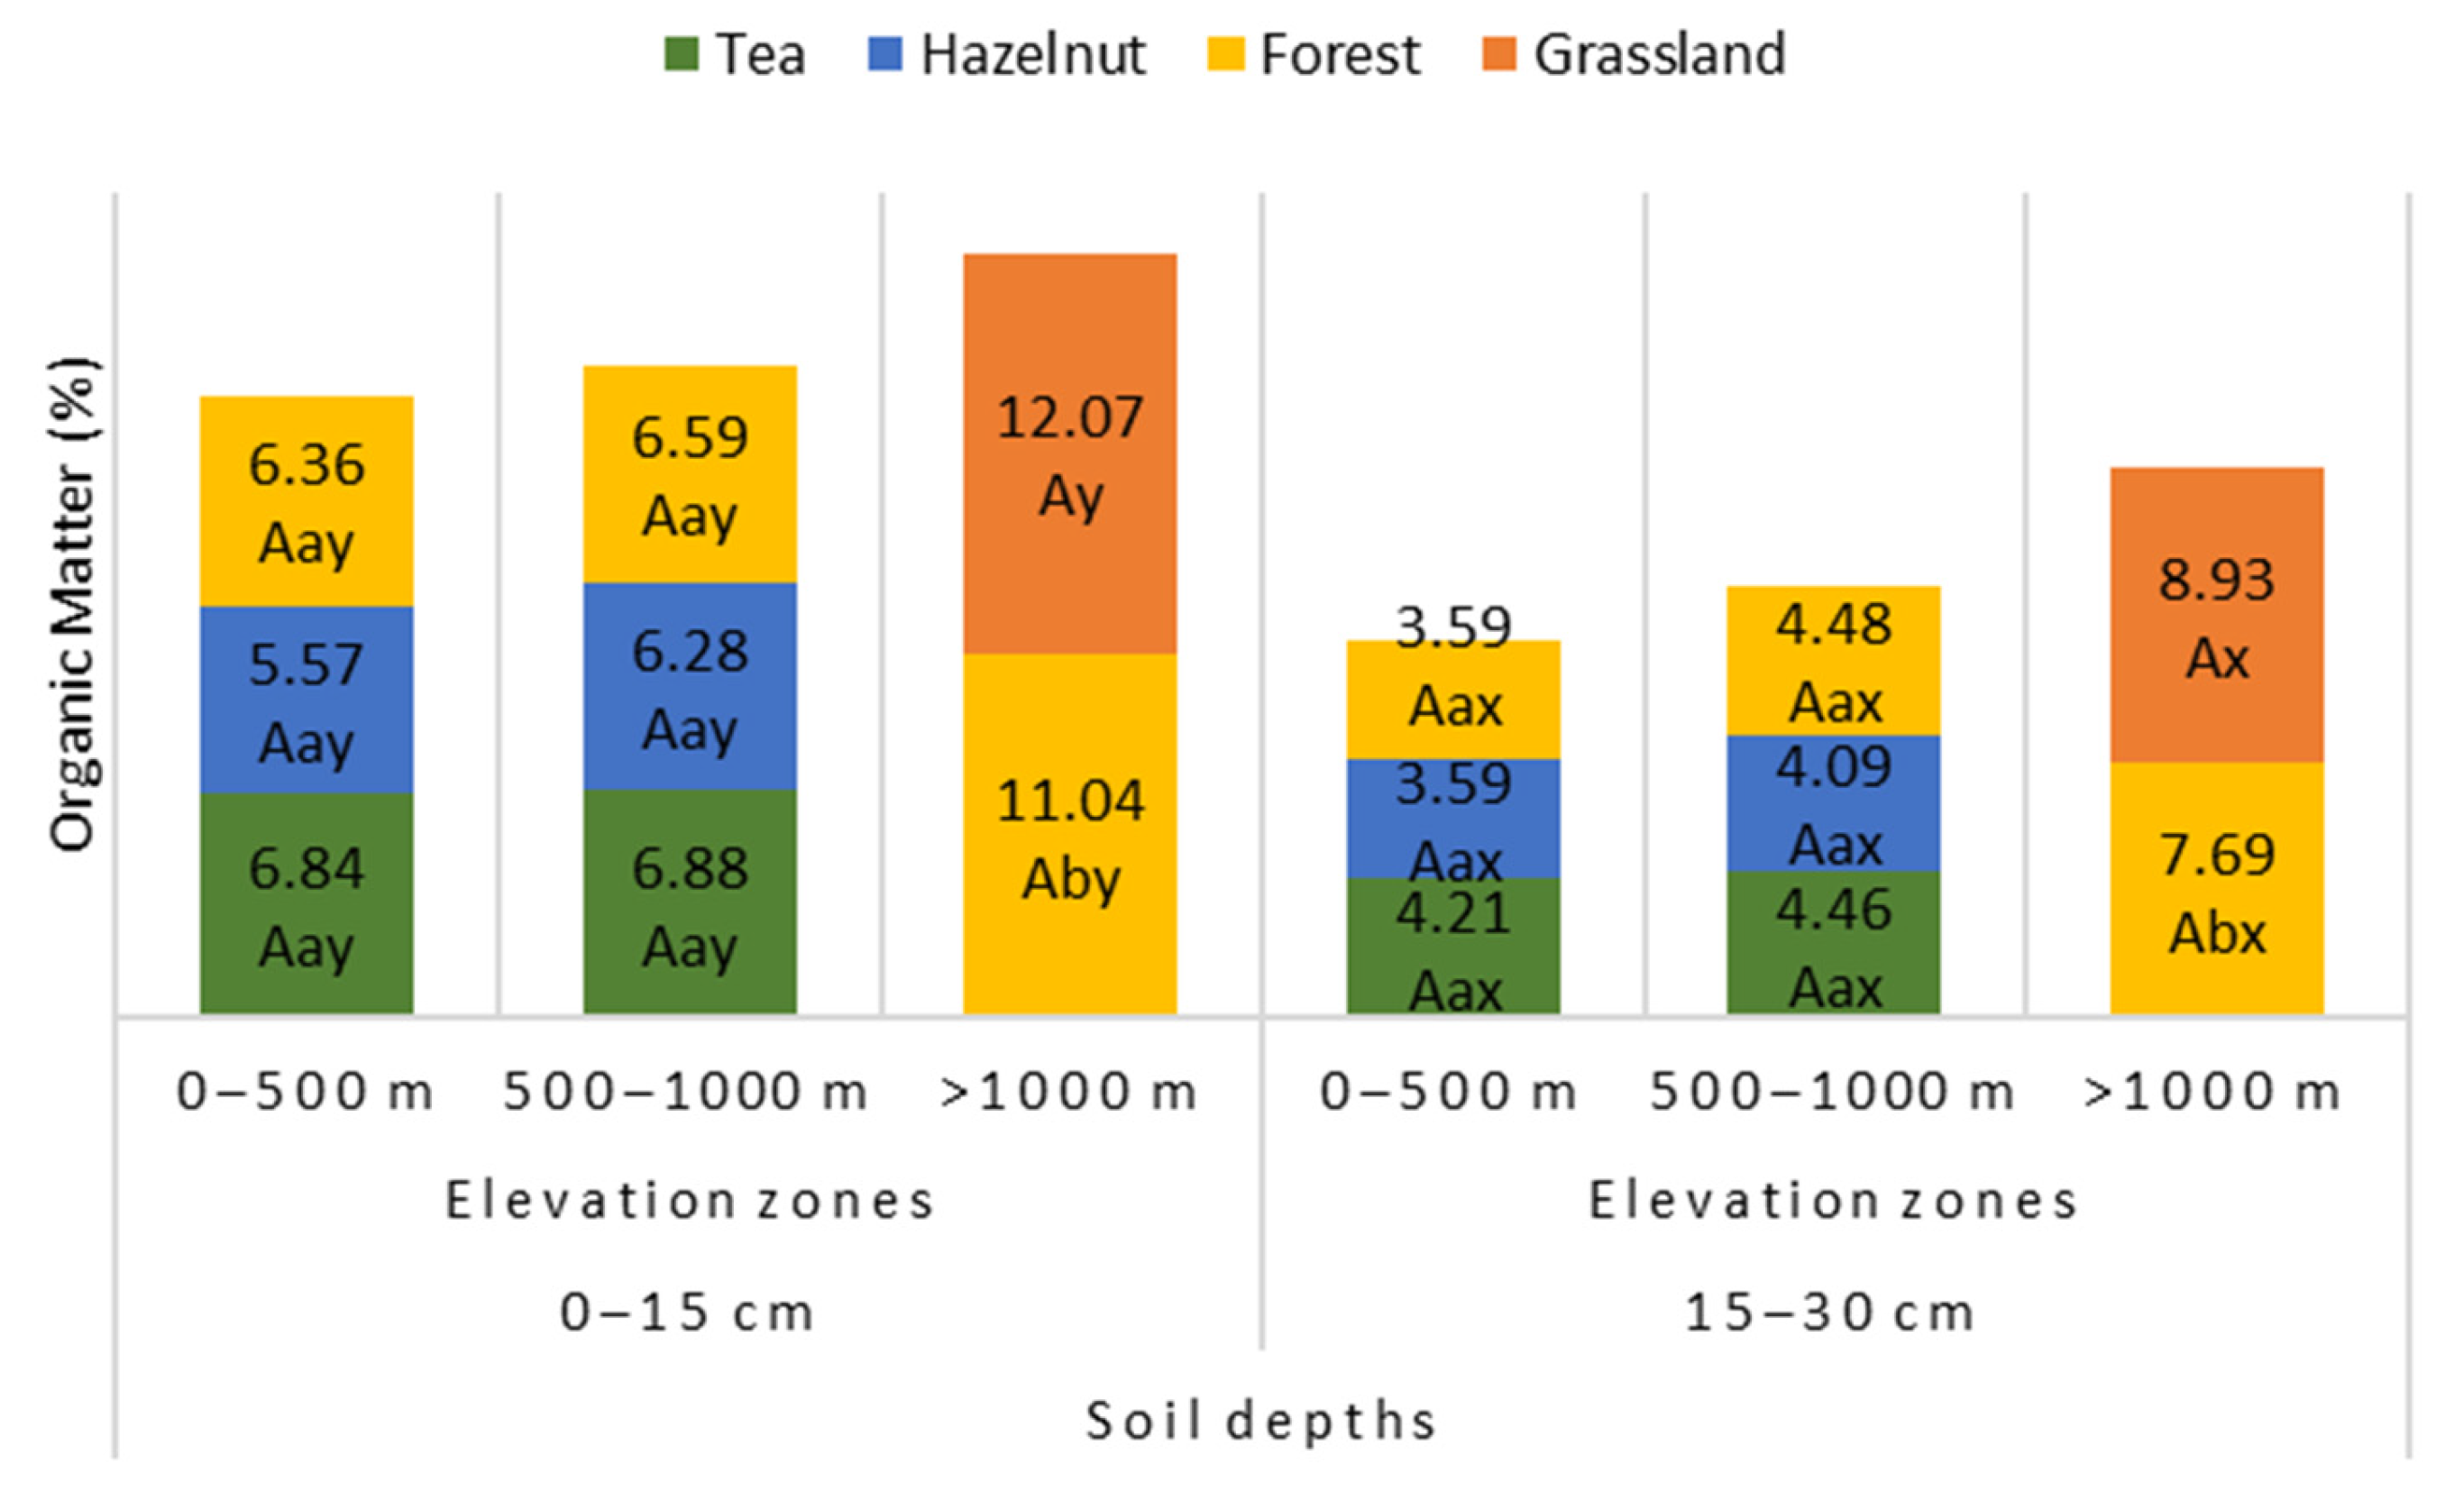
3.3. Soil Organic Matter (%)
3.4. Soil pH
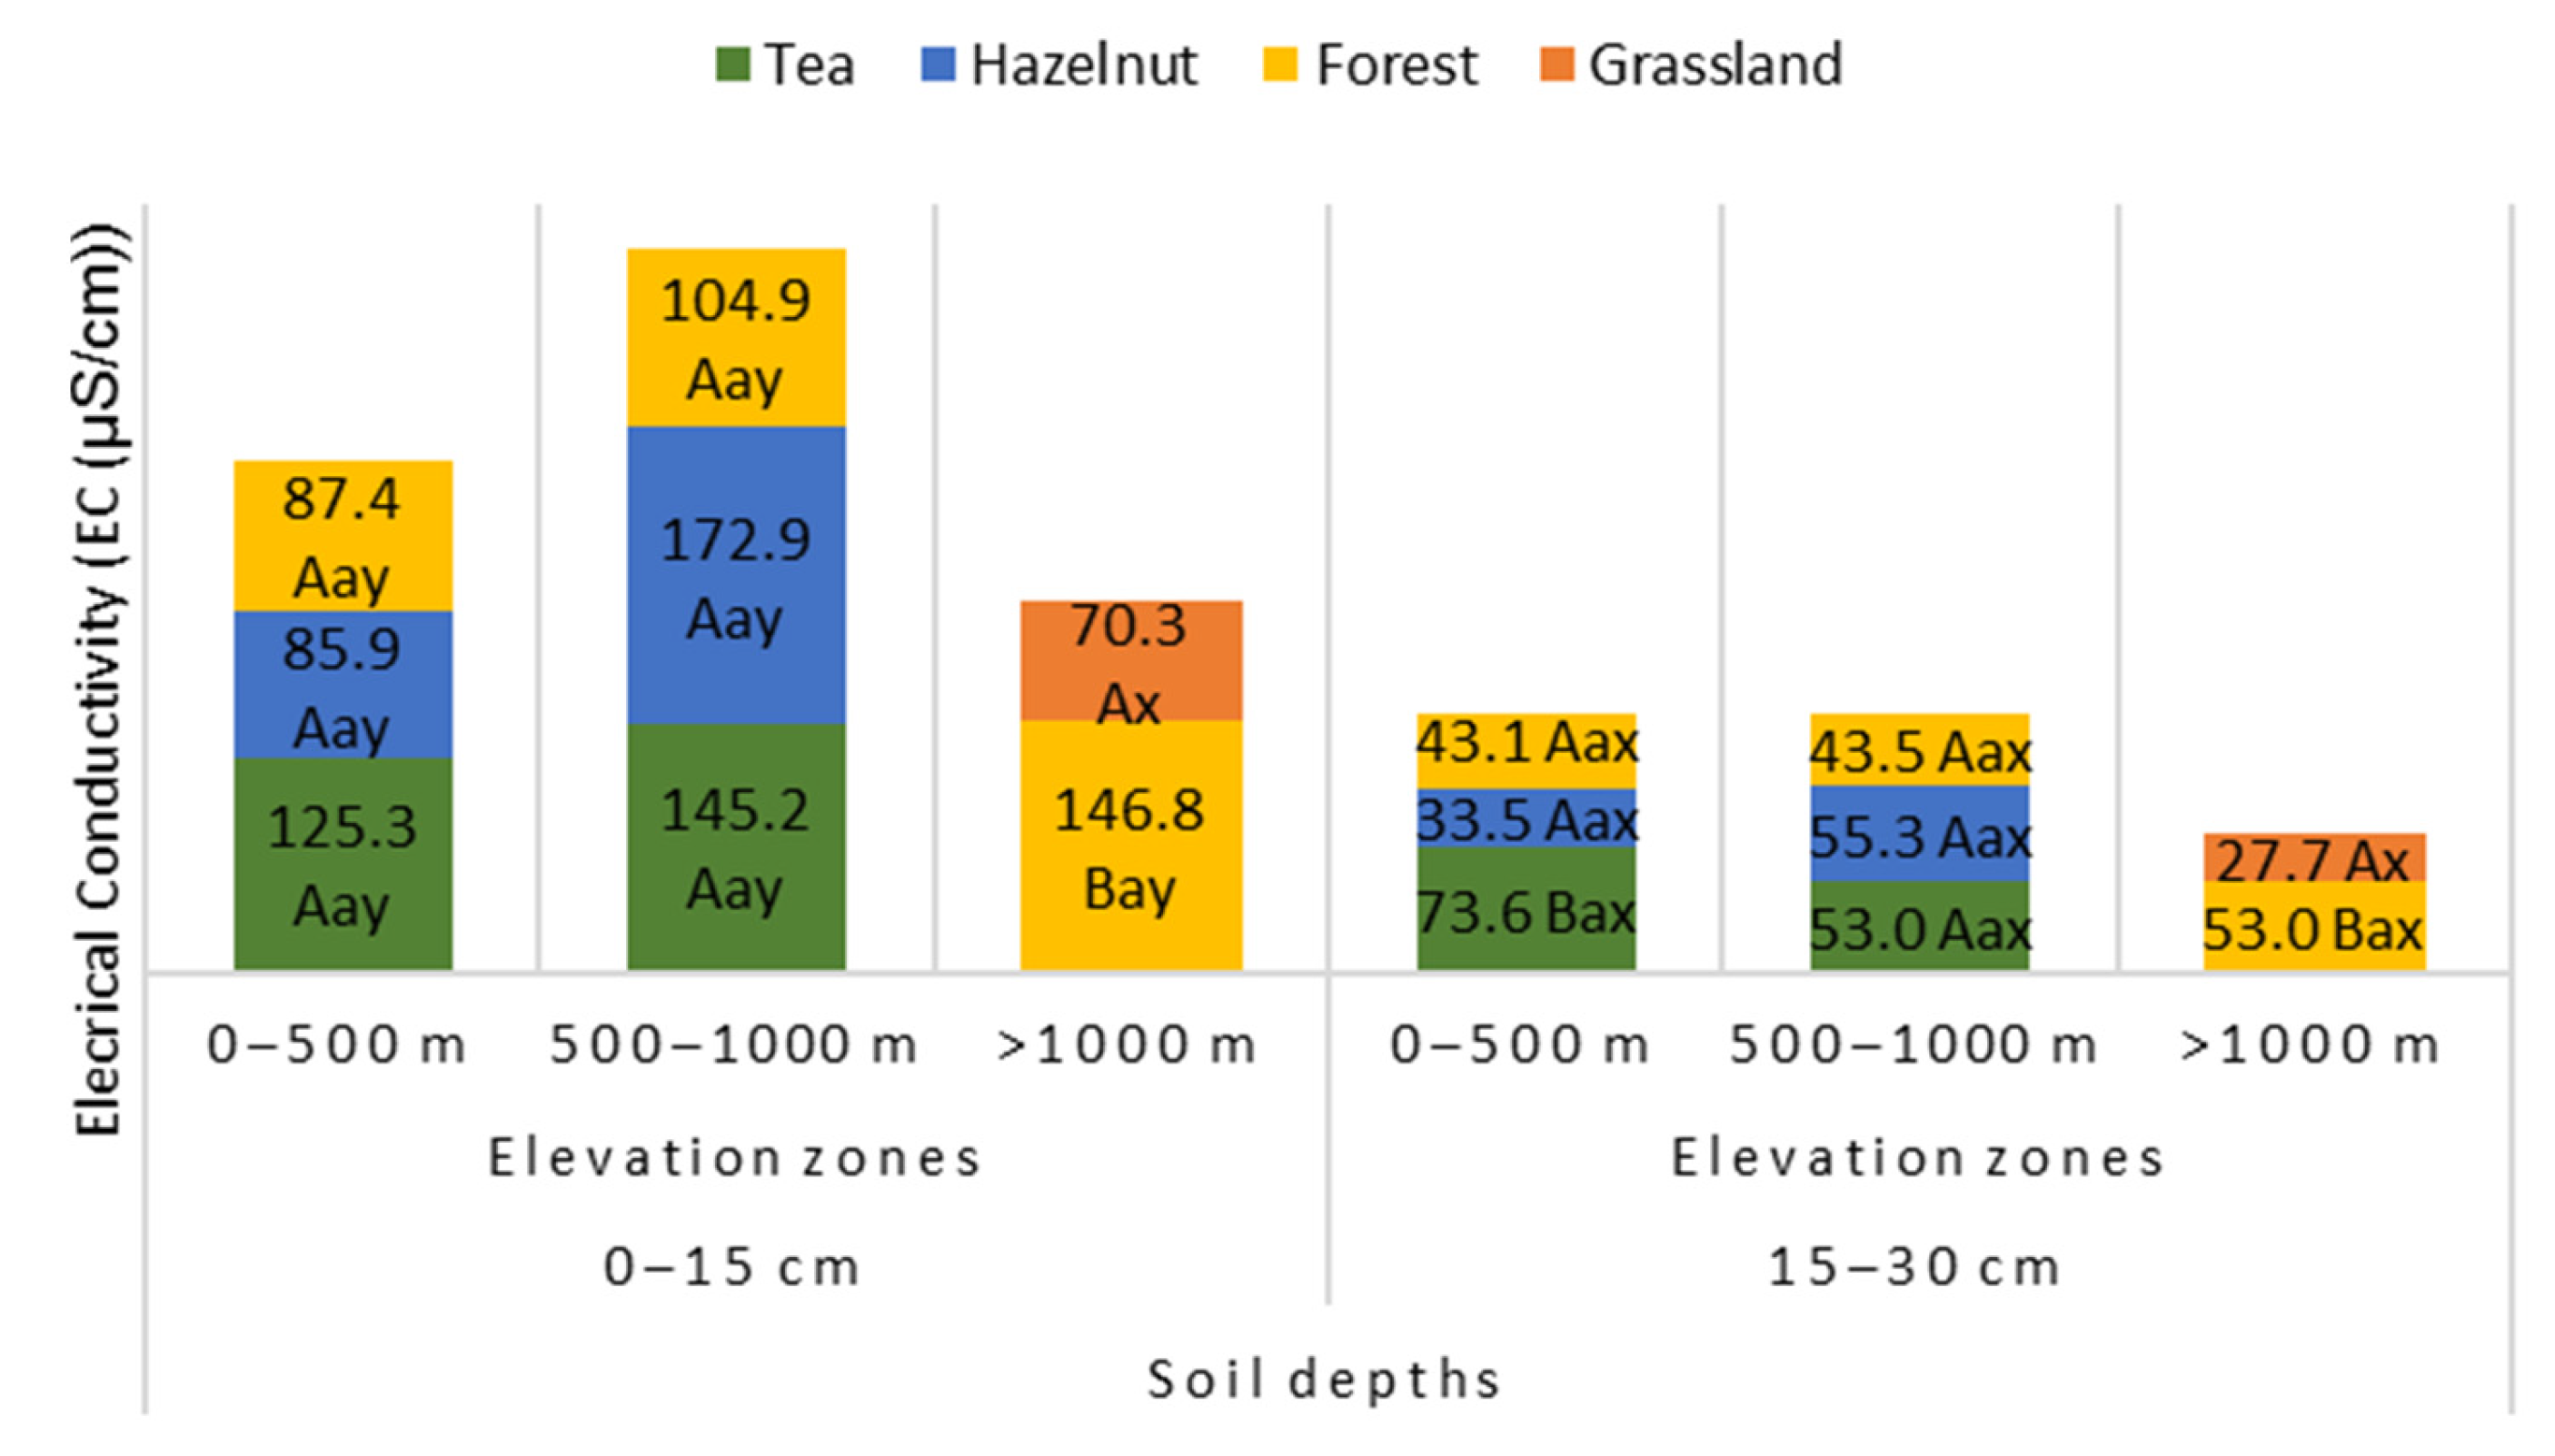
3.5. Electrical Conductivity (µS/cm) (EC)
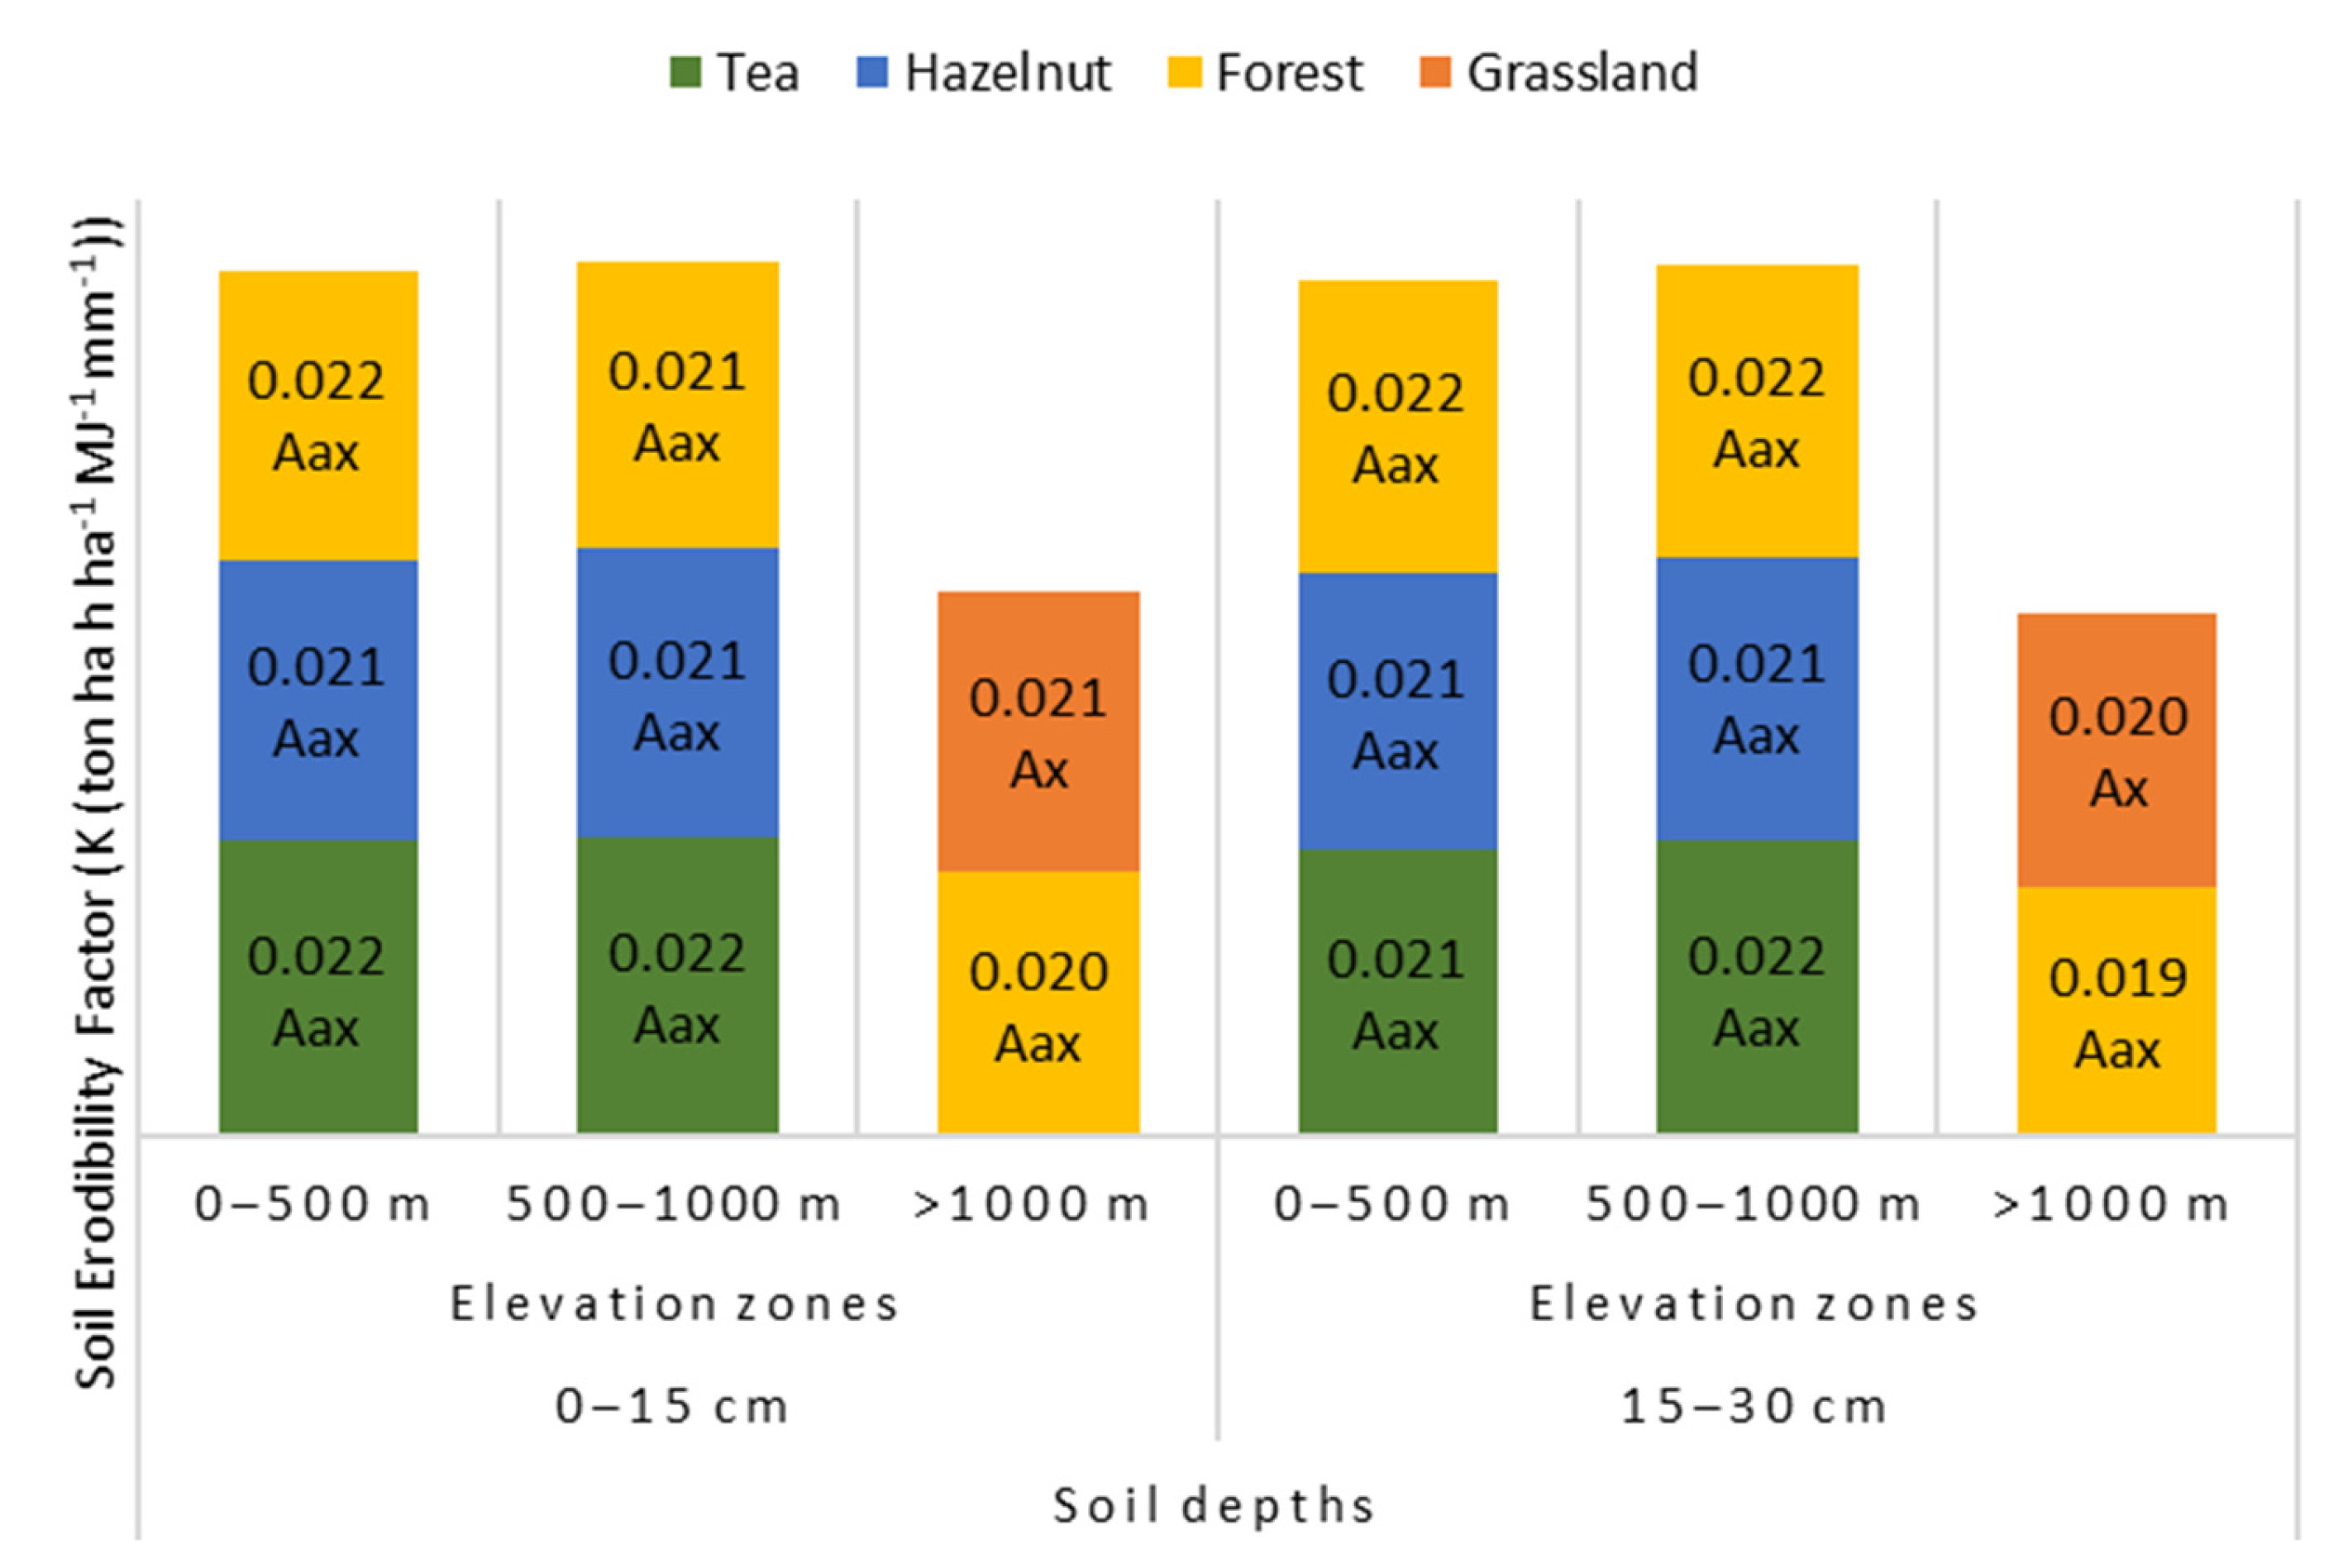
3.6. Soil Erodibility Factor (K)
4. Conclusions and Recommendations
Author Contributions
Funding
Institutional Review Board Statement
Informed Consent Statement
Data Availability Statement
Conflicts of Interest
References
- Duman, A. Determination and Modelling of Soil Properties of Degraded Forest and Grassland Areas in Some Micro-Catchments of Artvin, Erzurum and Bayburt Using Satellite Images. Ph.D. Thesis, Artvin Coruh University, Artvin, Turkey, 2017. [Google Scholar]
- Karas, E.; Oguz, E. Evaluation of Soil Erosion and Sustainable Land Use Management in the Sarısu Basin. Turk. J. Agric. Food Sci. Technol. 2017, 5, 864–872. [Google Scholar]
- Yihenew, G.S.; Getachew, A. Effects of different land use systems on selected physicochemical properties of soils in Northwestern Ethiopia. J. Agric. Sci. 2013, 5, 112–120. [Google Scholar]
- Dengiz, O.; İmamoğlu, A. Determination of variability of soil erodibility factor based on land use land cover using different interpolations models. In Proceedings of the International Geography Symposium, Ankara, Turkey, 13–14 October 2016; pp. 750–759. [Google Scholar]
- Küçük, M.; Yener, İ. Effect of Different Land Uses on Some Properties and N-Mineralization of The Soils (A case study from Rize, Kalkandere). J. Bartin Fac. For. 2019, 21, 899–910. [Google Scholar]
- Celik, I. Land-use effects on organic matter and physical properties of soil in a southern Mediterranean highland of Turkey. Soil Tillage Res. 2005, 83, 270–277. [Google Scholar] [CrossRef]
- Yılmaz, M.; Dengiz, O. The Effect of Land Use and Land Cover on Soil Organic Carbon Stock in Relation to Some Soil Properties. Turk. J. Agric. Res. 2021, 8, 154–167. [Google Scholar]
- Turudu, O.A. Comparative Investigation of Some Physical and Chemical Properties of Spruce Forest, Beech Forest, Meadow and Cornfield Soils at the Same View in the High Land in Trabzon Province Hamsiköy Region K.T.Ü.; Faculty of Forestry: Trabzon, Turkey, 1981. [Google Scholar]
- Yener, İ.; Duman, A.; Satıral, C.; Avşar, H. Changes in Some Physical and Chemical Properties of Soils under Alder Stands and Tea Plantations as A Result of Land Use Conversion (A case study from Arhavi). J. Bartin Fac. For. 2017, 19, 203–213. [Google Scholar]
- Molla, E.; Getnet, K.; Mekonnen, M. Land use change and its effect on selected soil properties in the northwest highlands of Ethiopia. Heliyon 2023, 8, E10157. [Google Scholar] [CrossRef]
- Asmare, T.K.; Abayneh, B.; Yigzaw, M.; Birhan, T.A. The effect of land use type on selected soil physicochemical properties in Shihatig watershed, Dabat district, Northwest Ethiopia. Heliyon 2023, 9, E16038. [Google Scholar] [CrossRef]
- Yitbarek, T.; Gebrekidan, H.; Kibret, K.; Beyene, S. Impacts of Land Use on Selected Physicochemical Properties of Soils of Abobo Area, Western Ethiopia. Agric. For. Fish. 2013, 2, 177–183. [Google Scholar] [CrossRef]
- Abindaw, T.; Hanyabui, E.; Atiah, K.; Akwasi, E.A.; Ziblim, I.A. Influence of land use types on the distribution of selected soil properties in tropical soils of the Coastal Savanna zone. Heliyon 2023, 9, E14002. [Google Scholar] [CrossRef]
- Gowthamchand; Dhaliwal, S.S.; Sharma, V.; Verma, G.; Singh, J.; Kaur, M. Variation of Physico-Chemical Properties among Different Soil Orders under Different Land Use Systems of the Majha Region in North-Western India. Sustainability 2023, 15, 4779. [Google Scholar] [CrossRef]
- Yeboah, S.O.; Amponsah, I.K.; Kaba, J.S.; Abunyewa, A.A. Variability of soil physicochemical properties under different land use types in the Guinea savanna zone of northern Ghana. Cogent Food Agric. 2022, 8, 2105906. [Google Scholar] [CrossRef]
- Girma, D. Effect of Land Use Types on Selected Soil Physical and Chemical Properties at Sire Morose Sub Watershed, Central Highland of Ethiopia. Int. J. Eng. Res. Technol. 2020, 9, 770–779. [Google Scholar]
- Geetha, K.; Chaitanya, T.; Padmaja, G.; Krishna, A. Effect of different land use systems on soil properties. Pharma Innov. J. 2021, 10, 1–6. [Google Scholar]
- Jemal, A. Selected Physicochemical Properties of the Soils Under Different Land Uses in Some Areas of Ethiopia. J. Biol. Agric. Healthc. 2021, 11, 15–23. [Google Scholar]
- Negasa, T.; Ketema, H.; Legesse, A.; Sisay, M.; Temesgen, H. Variation in soil properties under different land use types managed by smallholder farmers along the toposequence in southern Ethiopia. Geoderma 2017, 290, 40–50. [Google Scholar] [CrossRef]
- Mulugeta, T.; Melese, A.; Wondwosen, T. Effects of land use types on selected soil physical and chemical properties: The case of Kuyu District, Ethiopia. Eurasian J. Soil Sci. 2019, 8, 94–109. [Google Scholar]
- Tan, Z.X.; Lal, R.; Smeck, N.E.; Calhoun, F.G. Relationships between Surface Soil Organic Carbon Pool and Site Variables. Geoderma 2004, 121, 185–187. [Google Scholar] [CrossRef]
- Tekeş, A.; Cürebal, İ. Analysis of Relationship Between Land Use and Elevation and Slope Properties in Sehzadeler (Manisa-Turkey) District. Turk. Study-Soc. Sci. 2019, 14, 1787–1806. [Google Scholar]
- Bayrakli, B.; Dengiz, O. An evaluation of heavy metal pollution risk in tea cultivation soils of micro-catchments using various pollution indexes under humid environmental condition. Rend. Lincei. Sci. Fis. Nat. 2020, 31, 393–409. [Google Scholar] [CrossRef]
- Yüksek, T.; Göl, C.; Yüksek, F.; Yüksel, E.E. The effect of land-use changes on soil properties: The conversion of alder coppice to tea plantations in the Humid Northern Black Sea Region. Afr. J. Agric. Res. 2009, 4, 665–674. [Google Scholar]
- Karagül, R. Investigations on Soil Erodibility and Some Properties of the Soils Under Different Land Use Types in Sögütlüdere Creek Watershed Near Trabzon. Turk. J. Agric. For. Tubitak 1996, 23, 53–68. [Google Scholar]
- Yuksek, T.; Yuksek, F. Effects of altitude, aspect, and soil depth on carbon stocks and properties soils in a tea plantation in the humid Balac Sea region. Land Degrad. Dev. 2021, 32, 4267–4276. [Google Scholar] [CrossRef]
- Yüksek, F.; Altun, L.; Karaöz, Ö.; Şengönül, K.; Yüksek, T.; Küçük, M. The Effect of Altitude on Soil Properties and Leaf Traits in Wild Vaccinium arctostaphylos L. Populations in the Forest Understory in Fırtına River Basin. In Proceedings of the International Caucasian Forestry Symposium, Artvin, Turkey, 24–26 October 2013; pp. 577–583. [Google Scholar]
- Tüfekçioğlu, A. Changes in Vegetation and Some Soil Properties in Forest Ecosystems in the Ordu-Melet River Basin According to Elevation and Aspect Factors. Master’s Thesis, Karadeniz Technical University, Trabzon, Turkey, 1995. [Google Scholar]
- Available online: https://en.climate-data.org/asia/turkey/artvin/arhavi-8541/ (accessed on 12 January 2023).
- Available online: http://www.orrbodies.com/resources/item/orr118 (accessed on 15 October 2016).
- Available online: http://www.arhavi.bel.tr/belediye-meclisi-kararlari/2018/agustos/ARASTIRMA_RAPORU_2018.pdf (accessed on 10 January 2023).
- Available online: https://www.caykur.gov.tr/Pages/Unite/Hakkimizda.aspx?ParentId=4 (accessed on 10 January 2023).
- Available online: https://dergipark.org.tr/tr/download/article-file/26692 (accessed on 10 January 2023).
- Pennock, D.; Yates, T.; Braidek, J. Soil sampling designs. In Soil Sampling and Methods of Analysis; Carter, M.R., Gregorich, E.G., Eds.; Taylor and Francis Group: Saskatoon, SK, Canada, 2007; pp. 1–14. [Google Scholar]
- Bouyoucos, G.J. Hydrometer method improved for making particle size analysis of soils. Agron. J. 1962, 54, 464–465. [Google Scholar] [CrossRef]
- Gülçur, F. Physical and Chemical Analysis Methods of Soil; Faculty of Forestry Publications, Liberation Printing House: Istanbul, Turkey, 1974; pp. 19–37. [Google Scholar]
- Walkley, A. A critical examination of a rapid method for determining organic carbon in soils-effect of variations in digestion conditions and inorganic soil constituents. Soil Sci. 1974, 63, 251–264. [Google Scholar] [CrossRef]
- Sharpley, A.N.; Willams, J.R. EPIC-Erosion/Productivity Impact Calculator: 1 Model Documentation; Technical Bulletin No. 1768; Department of Agriculture: Washington, DC, USA, 1990; pp. 26–27. [Google Scholar]
- IBM. SPSS Statistics for Windows, Version 20.0; IBM: Armonk, NY, USA, 2011. [Google Scholar]
- Tellen, V.A.; Yermia, P.K. Effects of land use change on soil physicochemical properties in selected areas in the North West region of Cameroon. Environ. Syst. Resarch 2018, 7, 1–29. [Google Scholar]
- Tufekcioglu, A.; Kucuk, M. Soil Respiration in Young and Old Oriental Spruce Stands and in Adjacent Grasslands in Artvin, Turkey. Turk. J. Agric. For. 2004, 28, 429–434. [Google Scholar]
- Shamsher, A.; Farida, B.; Rifat, H.; Brendan, J.M.B. Variation in soil organic carbon stock in different land uses and altitudes in Bagrot Valley, Northern Karakoram. Acta Agric. Scand. Sect. B-Soil Plant Sci. 2017, 67, 551–561. [Google Scholar]
- Kebebew, S.; Bedadi, B.; Erkossa, T.; Yimer, F.; Wogi, L. Effect of Different Land-Use Types on Soil Properties in Cheha District, South-Central Ethiopia. Sustainability 2022, 14, 1323. [Google Scholar] [CrossRef]
- Khaldoon, A.; Theobald, B.; Alexis, K.; Noel, M. The Effect of Land Use Systems on Soil Properties; A case study from Rwanda. Sustain. Agric. Resarch 2018, 7, 30–40. [Google Scholar]
- Hayatu, N.G.; Abdulwahap, M.O.; Haruna, F.D.; Anka, A.B.; Jabbi, F.F.; Bai, Y.J.; Darma, A.I.; Dahiru, S.; Shawai, R.S. Impact of Different Land Use Types on Some Selected Soil Physical and Chemical Properties of Soils in Kware Local Government Area, Skoto State, Nigeria. FUDMA J. Agric. Agric. Technol. 2020, 6, 1–14. [Google Scholar]
- Kidanemariam, A.; Gebrekidan, H.; Mamo, T.; Kibret, K. Impact of Altitude and Land Use Type on Some Physical and Chemical Properties of Acidic Soils in Tsegede Highlands, Northern Ethiopia. Open J. Soil Sci. 2012, 2, 223–233. [Google Scholar] [CrossRef] [Green Version]
- Tecimen, H.B.; Sevgi, O.; Altundağ, E. Alteration of Nitrogen Mineralization Along Altitudinal Gradient at Kaz Mountains. J. Fac. For. Istanb. Univ. 2012, 62, 19–29. [Google Scholar]
- Özkan, S. Natural and Human Principles of Tea Cultivation in Arhavi. Master’s Thesis, Istanbul University, İstanbul, Turkey, 1994. [Google Scholar]
- Adiloglu, A.; Adiloglu, S. An investigation on nutritional status of tea (Camellia sinensis L.) grown in eastern black sea region of Turkey. Pak. J. Biol. Sci. 2006, 9, 365–370. [Google Scholar] [CrossRef] [Green Version]
- Ulgen, N. Productivity of Tea Soils; Technical Publication, No: 6; General Directorate of Soil Water, Institute of Soil and Fertilizer: Ankara, Turkey, 1961. [Google Scholar]
- Sarimehmet, M.; Muftuoglu, N.M.; Yılmaz, E. Plant Nutrient Content and Physical Structures of Tea Soils in Our Country; Directorate of Tea Research Institute: Rize, Turkey, 1982. [Google Scholar]
- Yan, P.; Wu, L.; Wang, D.; Fua, J.; Shen, C.; Li, X.; Zhang, L. Soil acidification in Chinese tea plantations. Sci. Total Environ. 2020, 715, 136963. [Google Scholar] [CrossRef]
- Fan, L.; Han, W. Soil respiration after forest conversion to tea gardens: A chronosequence study. Catena 2020, 190, 104532. [Google Scholar] [CrossRef]
- Richards, L.A. Diagnosis and Improvement of Saline and Alkali Soils. In Department of Agriculture Handbook No: 60; US Department of Agriculture: Washington, DC, USA, 1954; pp. 1–160. [Google Scholar]
- Wischmeier, W.H.; Smith, D.D. Predicting rainfall erosion losses—A guide to conservation planning. In Agriculture Handbook No: 537; Department of Agriculture Science and Education Administration: Washington, DC, USA, 1978; pp. 1–163. [Google Scholar]
- Arunrat, N.; Sereenonchai, S.; Kongsurakan, P.; Hatano, R. Soil organic carbon and soil erodibility response to various land-use changes in northern Thailand. Catena 2022, 219, 106595. [Google Scholar] [CrossRef]
- Erol, A.; Babalık, A.A.; Sönmez, K.; Serin, N. The change of the sensitivity to erosion in the soils of Isparta- Darıdere basin depending on the land use patterns. Suleyman Demirel University. J. For. Fac. 2009, 2, 21–36. [Google Scholar]


| Land Use Type | Tea | Hazelnut | Grassland | Forest | ||||
|---|---|---|---|---|---|---|---|---|
| Soil Depth/ Soil Properties | 0–15 cm | 15–30 cm | 0–15 cm | 15–30 cm | 0–15 cm | 15–30 cm | 0–15 cm | 15–30 cm |
| Sand (%) | −0.31 | −0.2 | 0.219 | 0.128 | −0.404 | −0.294 | 0.351 ** | 0.277 * |
| Clay (%) | 0.198 | 0.139 | −0.136 | −0.068 | 0.125 | 0.022 | −0.229 | −0.006 |
| Silt (%) | 0.243 | 0.163 | −0.271 | −0.198 | 0.485 * | 0.468 * | −0.400 ** | −0.461 ** |
| BD (g/cm3) | 0.493 ** | 0.094 | −0.012 | −0.003 | 0.794 ** | 0.691 ** | −0.593 ** | −0.545 ** |
| OM (%) | −0.007 | 0.104 | 0.275 | 0.229 | −0.292 | −0.12 | 0.638 ** | 0.587 ** |
| pH | 0.283 | 0.239 | 0.343 | 0.27 | 0.14 | 0.102 | −0.354 ** | −0.309 * |
| EC (µS/cm) | 0.08 | −0.286 | 0.221 | 0.291 | 0.235 | 0.371 | 0.148 | 0.154 |
| K (ton ha h ha−1 MJ−1 mm−1) | 0.012 | 0.155 | −0.049 | −0.05 | 0.442 * | 0.4 | −0.443 ** | −0.520 ** |
Disclaimer/Publisher’s Note: The statements, opinions and data contained in all publications are solely those of the individual author(s) and contributor(s) and not of MDPI and/or the editor(s). MDPI and/or the editor(s) disclaim responsibility for any injury to people or property resulting from any ideas, methods, instructions or products referred to in the content. |
© 2023 by the authors. Licensee MDPI, Basel, Switzerland. This article is an open access article distributed under the terms and conditions of the Creative Commons Attribution (CC BY) license (https://creativecommons.org/licenses/by/4.0/).
Share and Cite
Duman, A.; Yildirim, C.; Tufekcioglu, M.; Tufekcioglu, A.; Satiral, C. Variation in Certain Soil Properties Based on Land Use Type, and Elevation in Arhavi Sub-Basin, Artvin, Turkiye. Sustainability 2023, 15, 9114. https://doi.org/10.3390/su15119114
Duman A, Yildirim C, Tufekcioglu M, Tufekcioglu A, Satiral C. Variation in Certain Soil Properties Based on Land Use Type, and Elevation in Arhavi Sub-Basin, Artvin, Turkiye. Sustainability. 2023; 15(11):9114. https://doi.org/10.3390/su15119114
Chicago/Turabian StyleDuman, Ahmet, Cengizhan Yildirim, Mustafa Tufekcioglu, Aydın Tufekcioglu, and Caner Satiral. 2023. "Variation in Certain Soil Properties Based on Land Use Type, and Elevation in Arhavi Sub-Basin, Artvin, Turkiye" Sustainability 15, no. 11: 9114. https://doi.org/10.3390/su15119114