

Suitability Assessment Method of Red Tourism Development Using Geospatial and Social Humanity Data: A Case Study of Ruijin City, East China

 , , ,
, , ,
Abstract
:1. Introduction
2. Materials and Methods
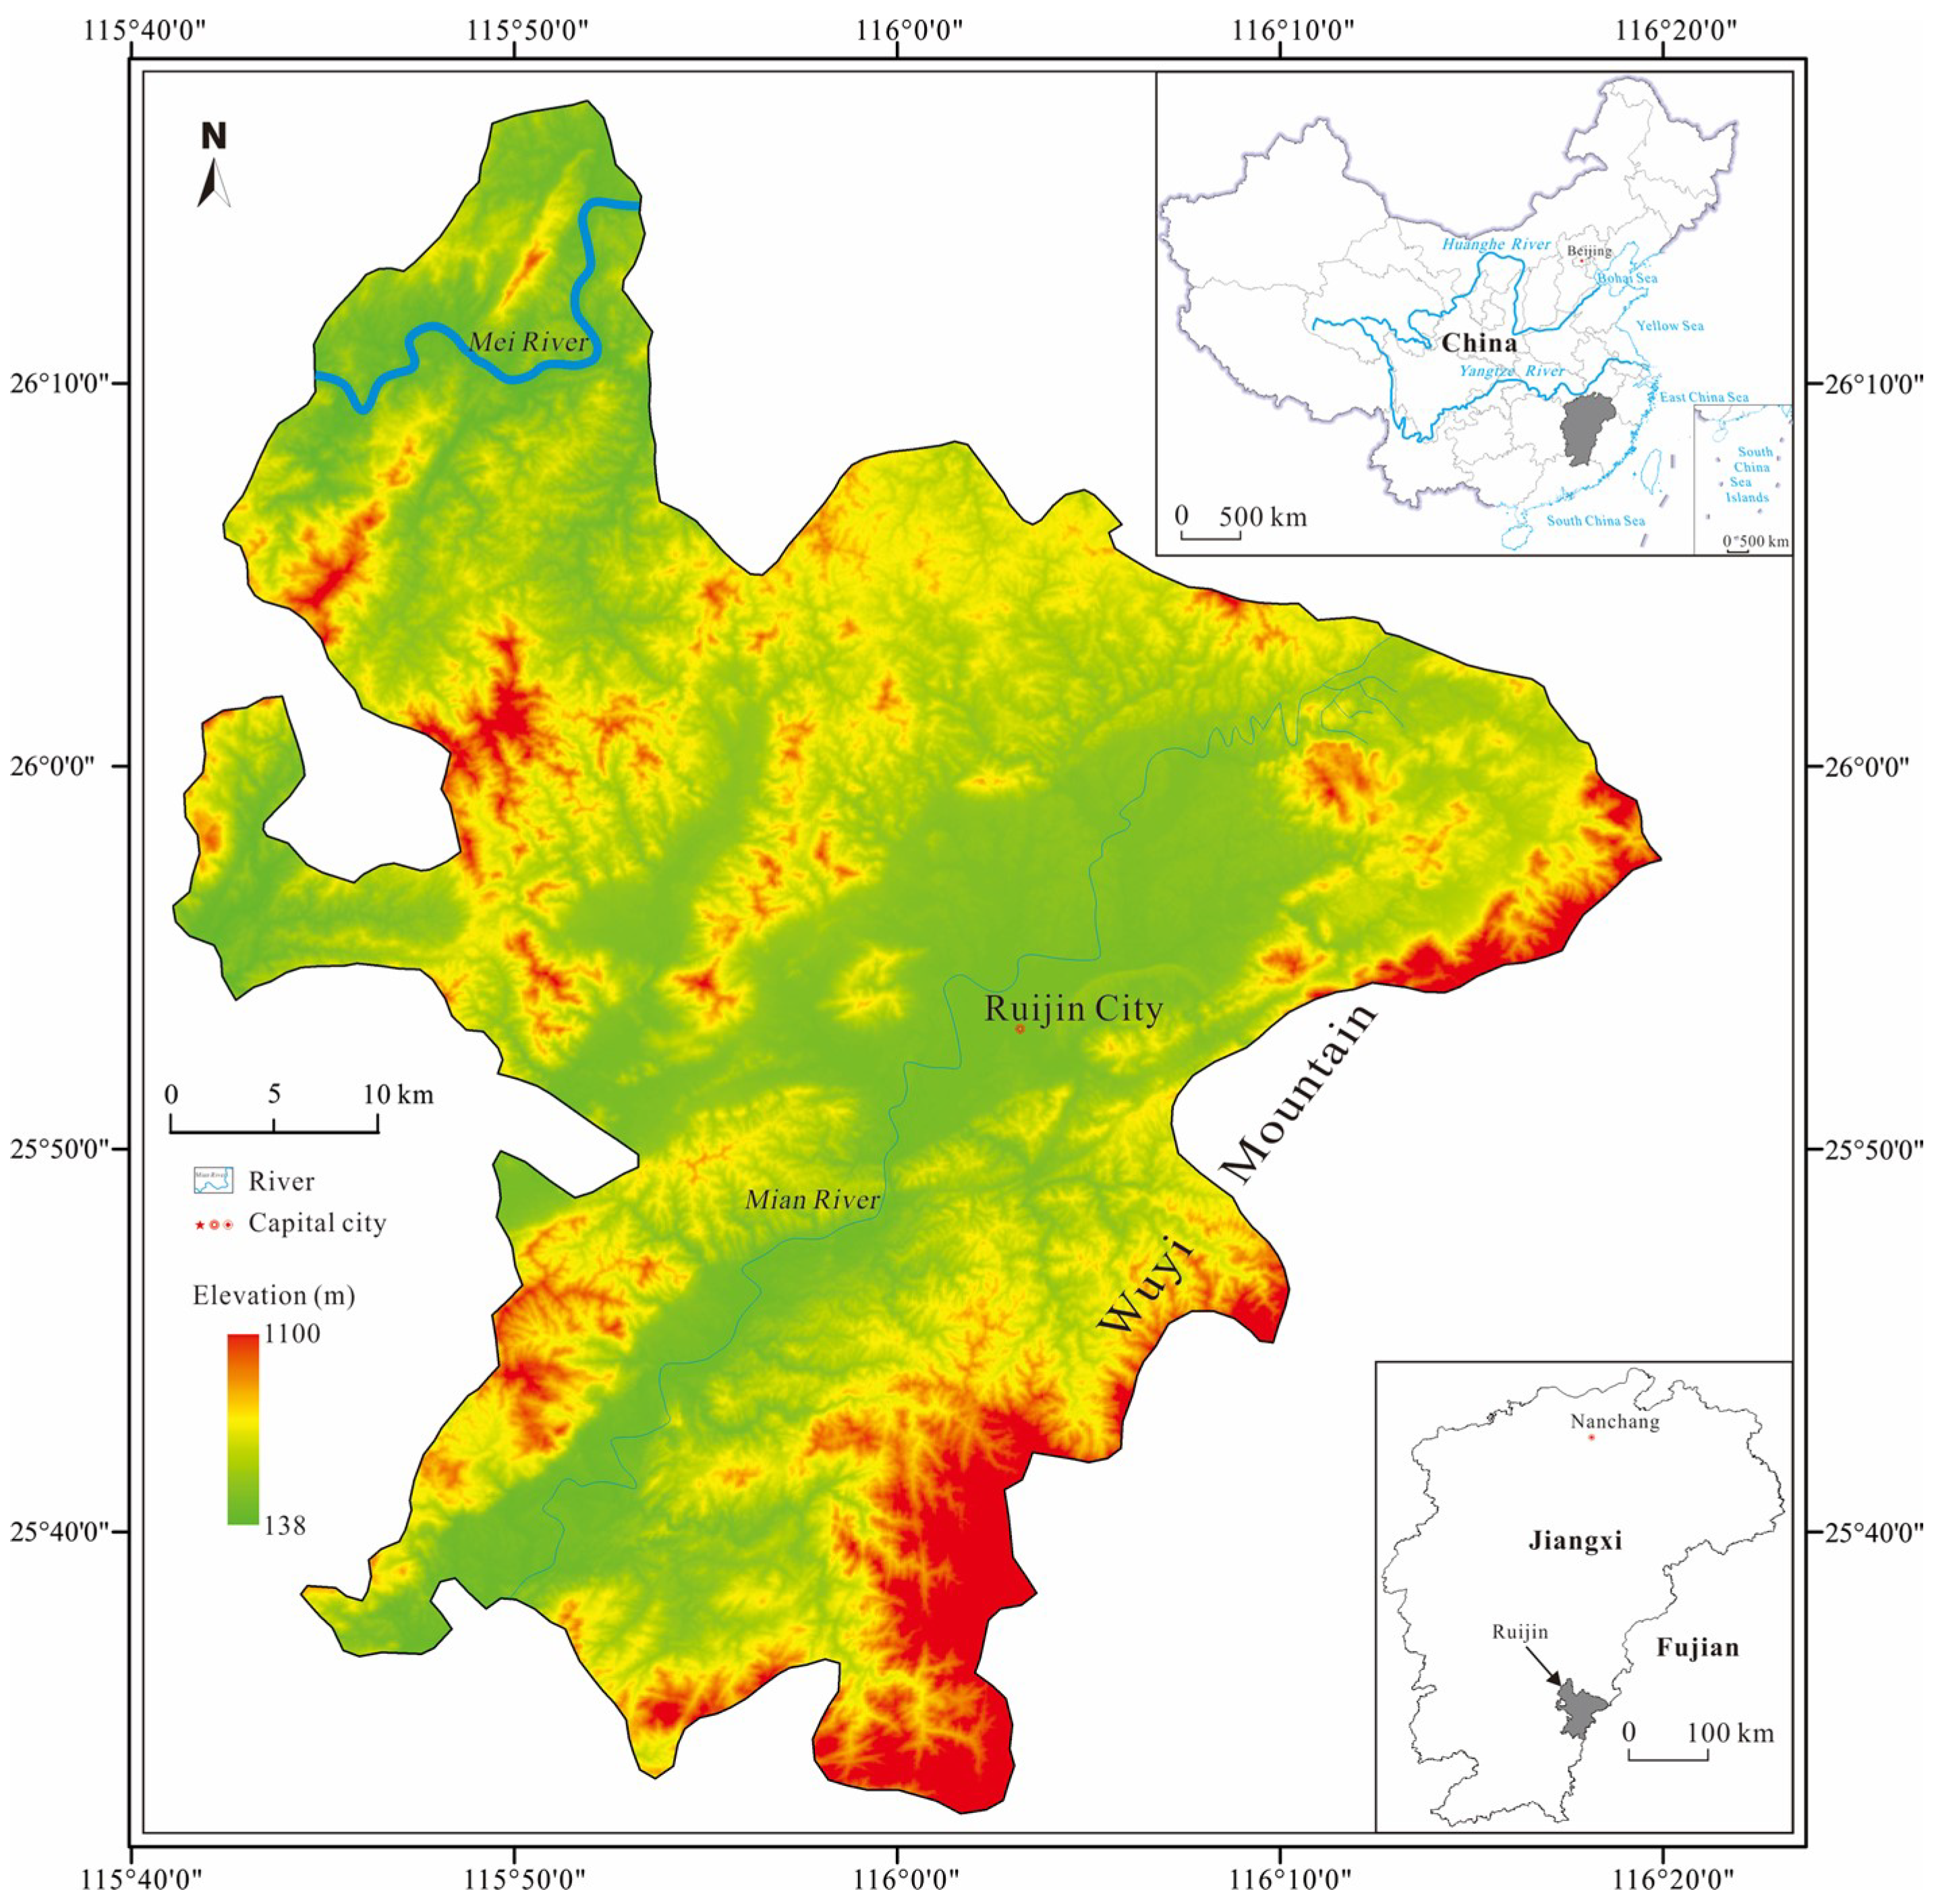
2.1. Study Area
2.2. Dataset
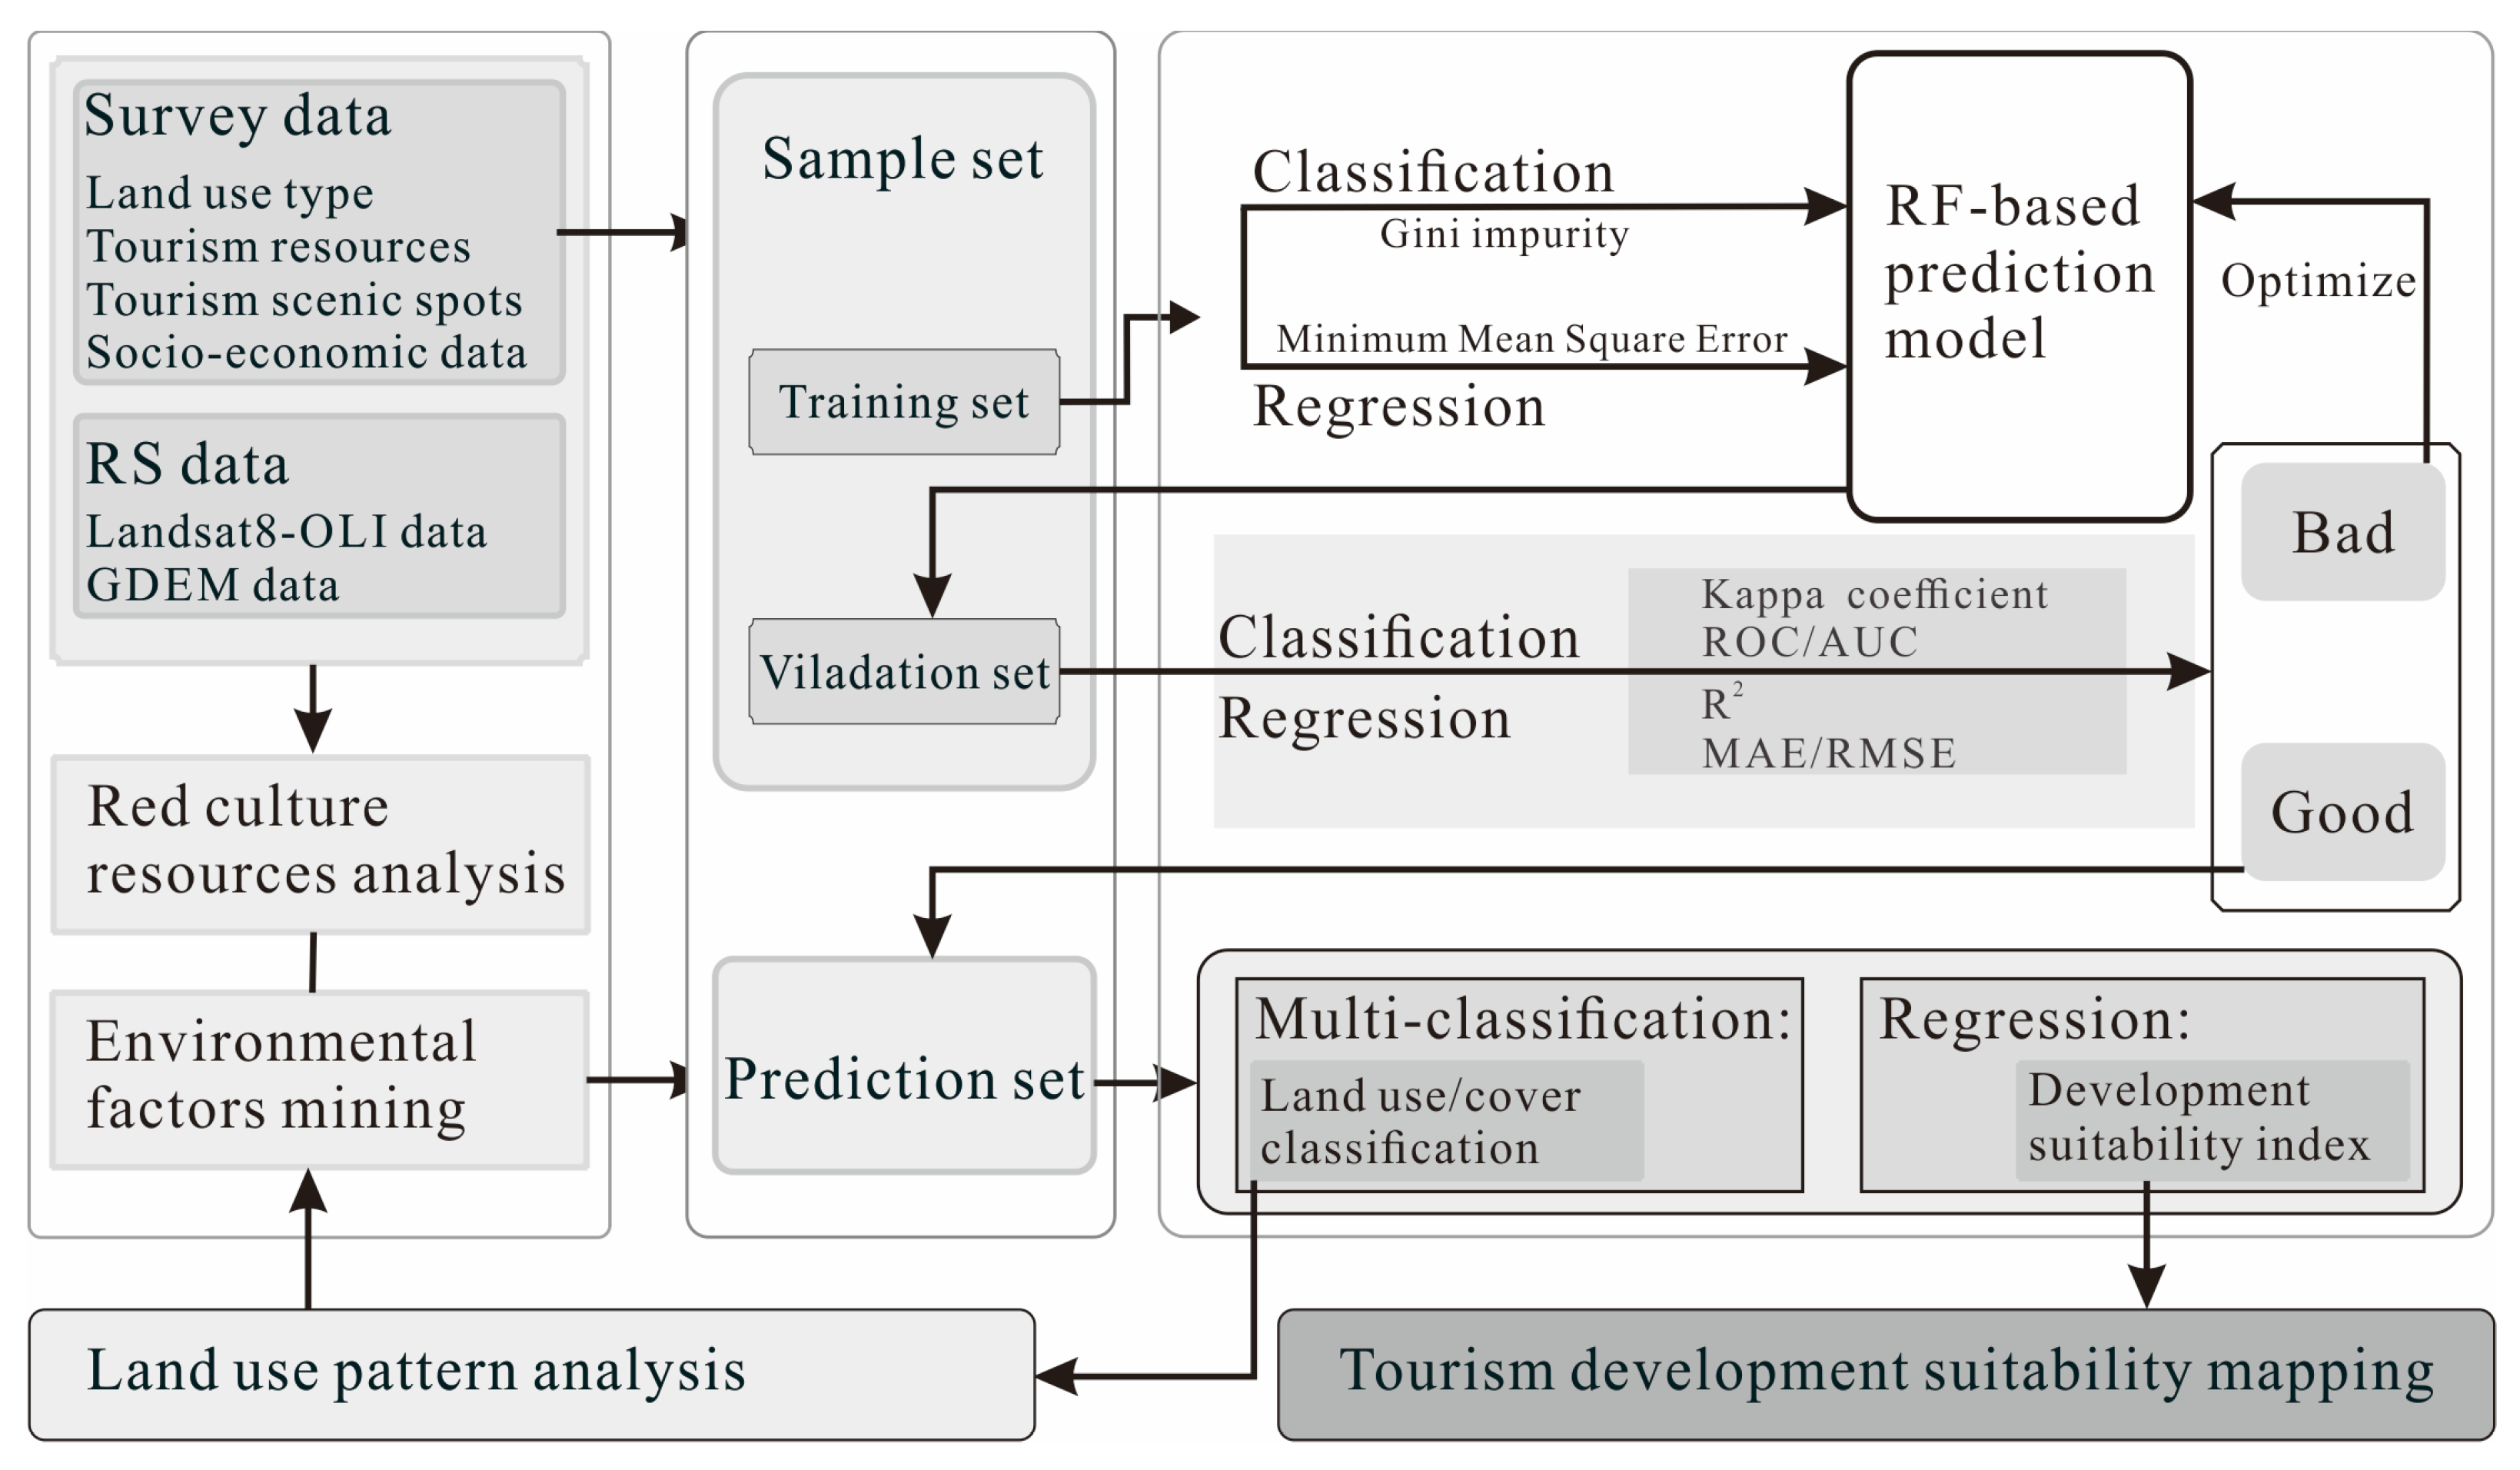
2.3. Methodology
2.3.1. RF Classification and Regression
2.3.2. Model Construction
- (i)
- Divide samples into training and validation sets according to the ratio of 7:3, and a new training set will be generated by using the Bagging method;
- (ii)
- Randomly select m features form M. Usually, m is equal to . Construct a decision tree by using Gini index or MMSE method;
- (iii)
- Create a series of trees to construct RF model;
- (iv)
- Use the RF model to classification and regression if it acquires the required performance in validation step, or it will be revised and optimized.
2.3.3. Performance Evaluation
2.3.4. Landscape Pattern Index
3. Results and Discussion
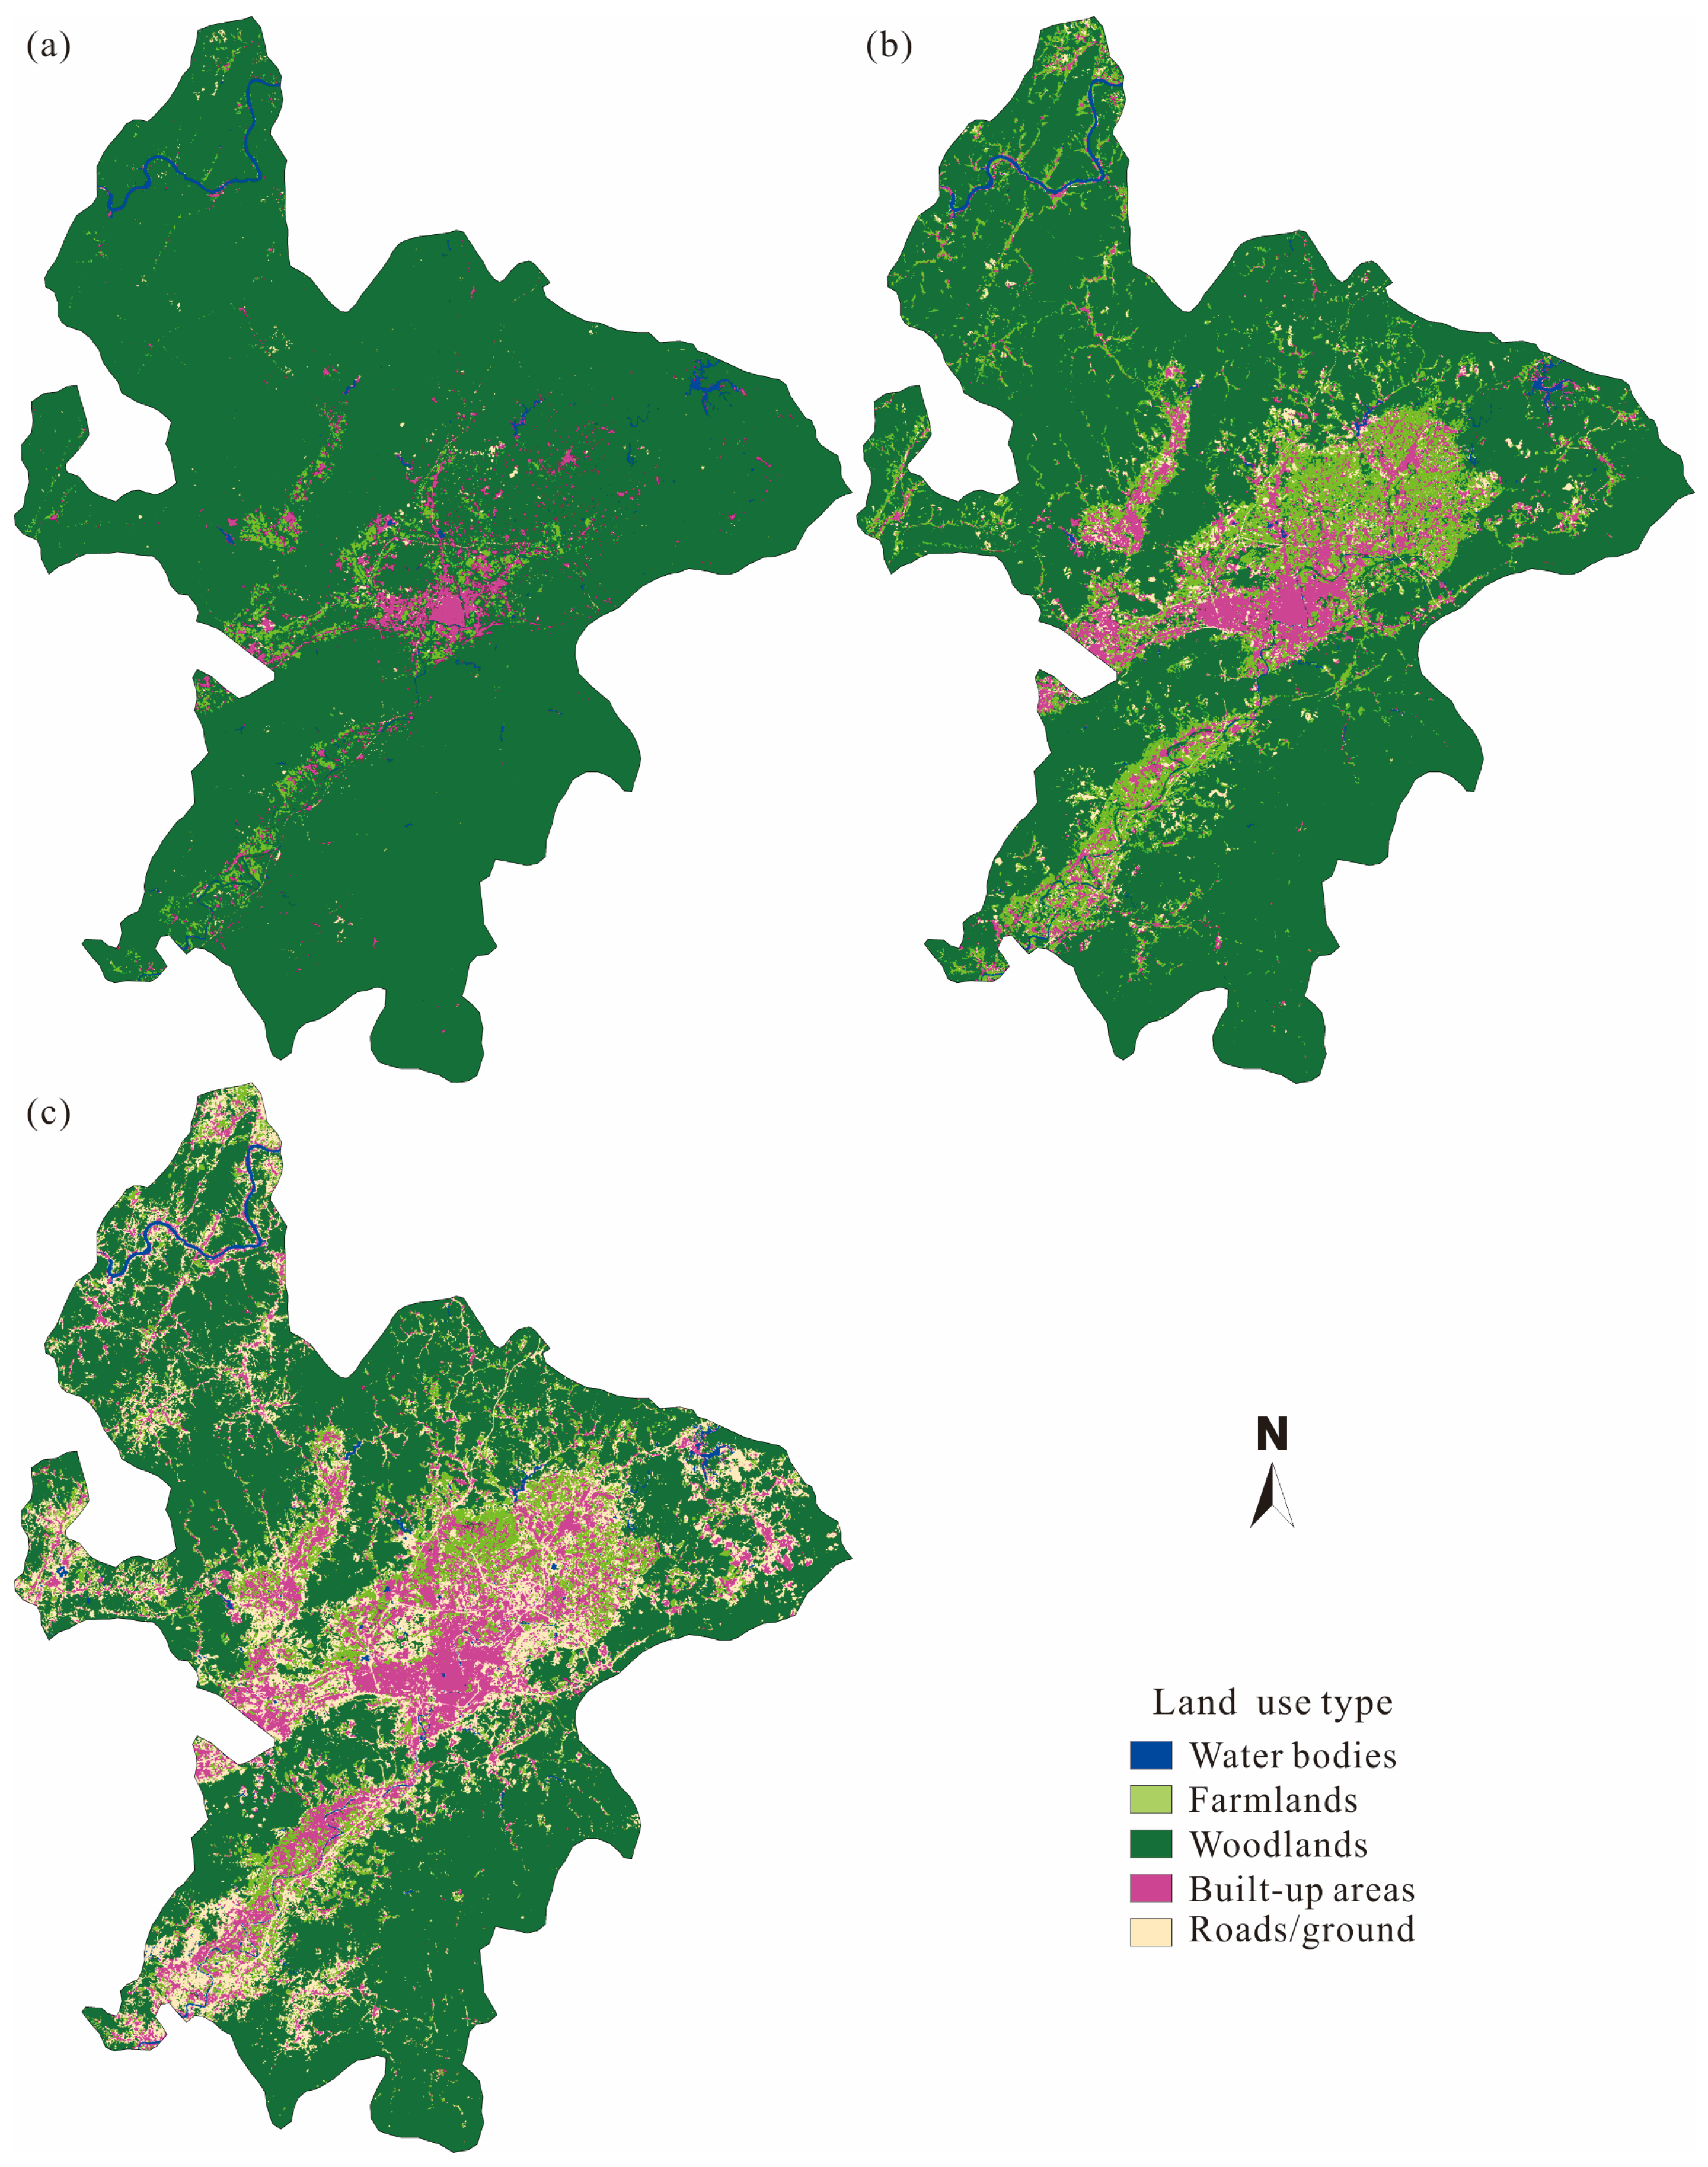
3.1. Land Use Change Analysis
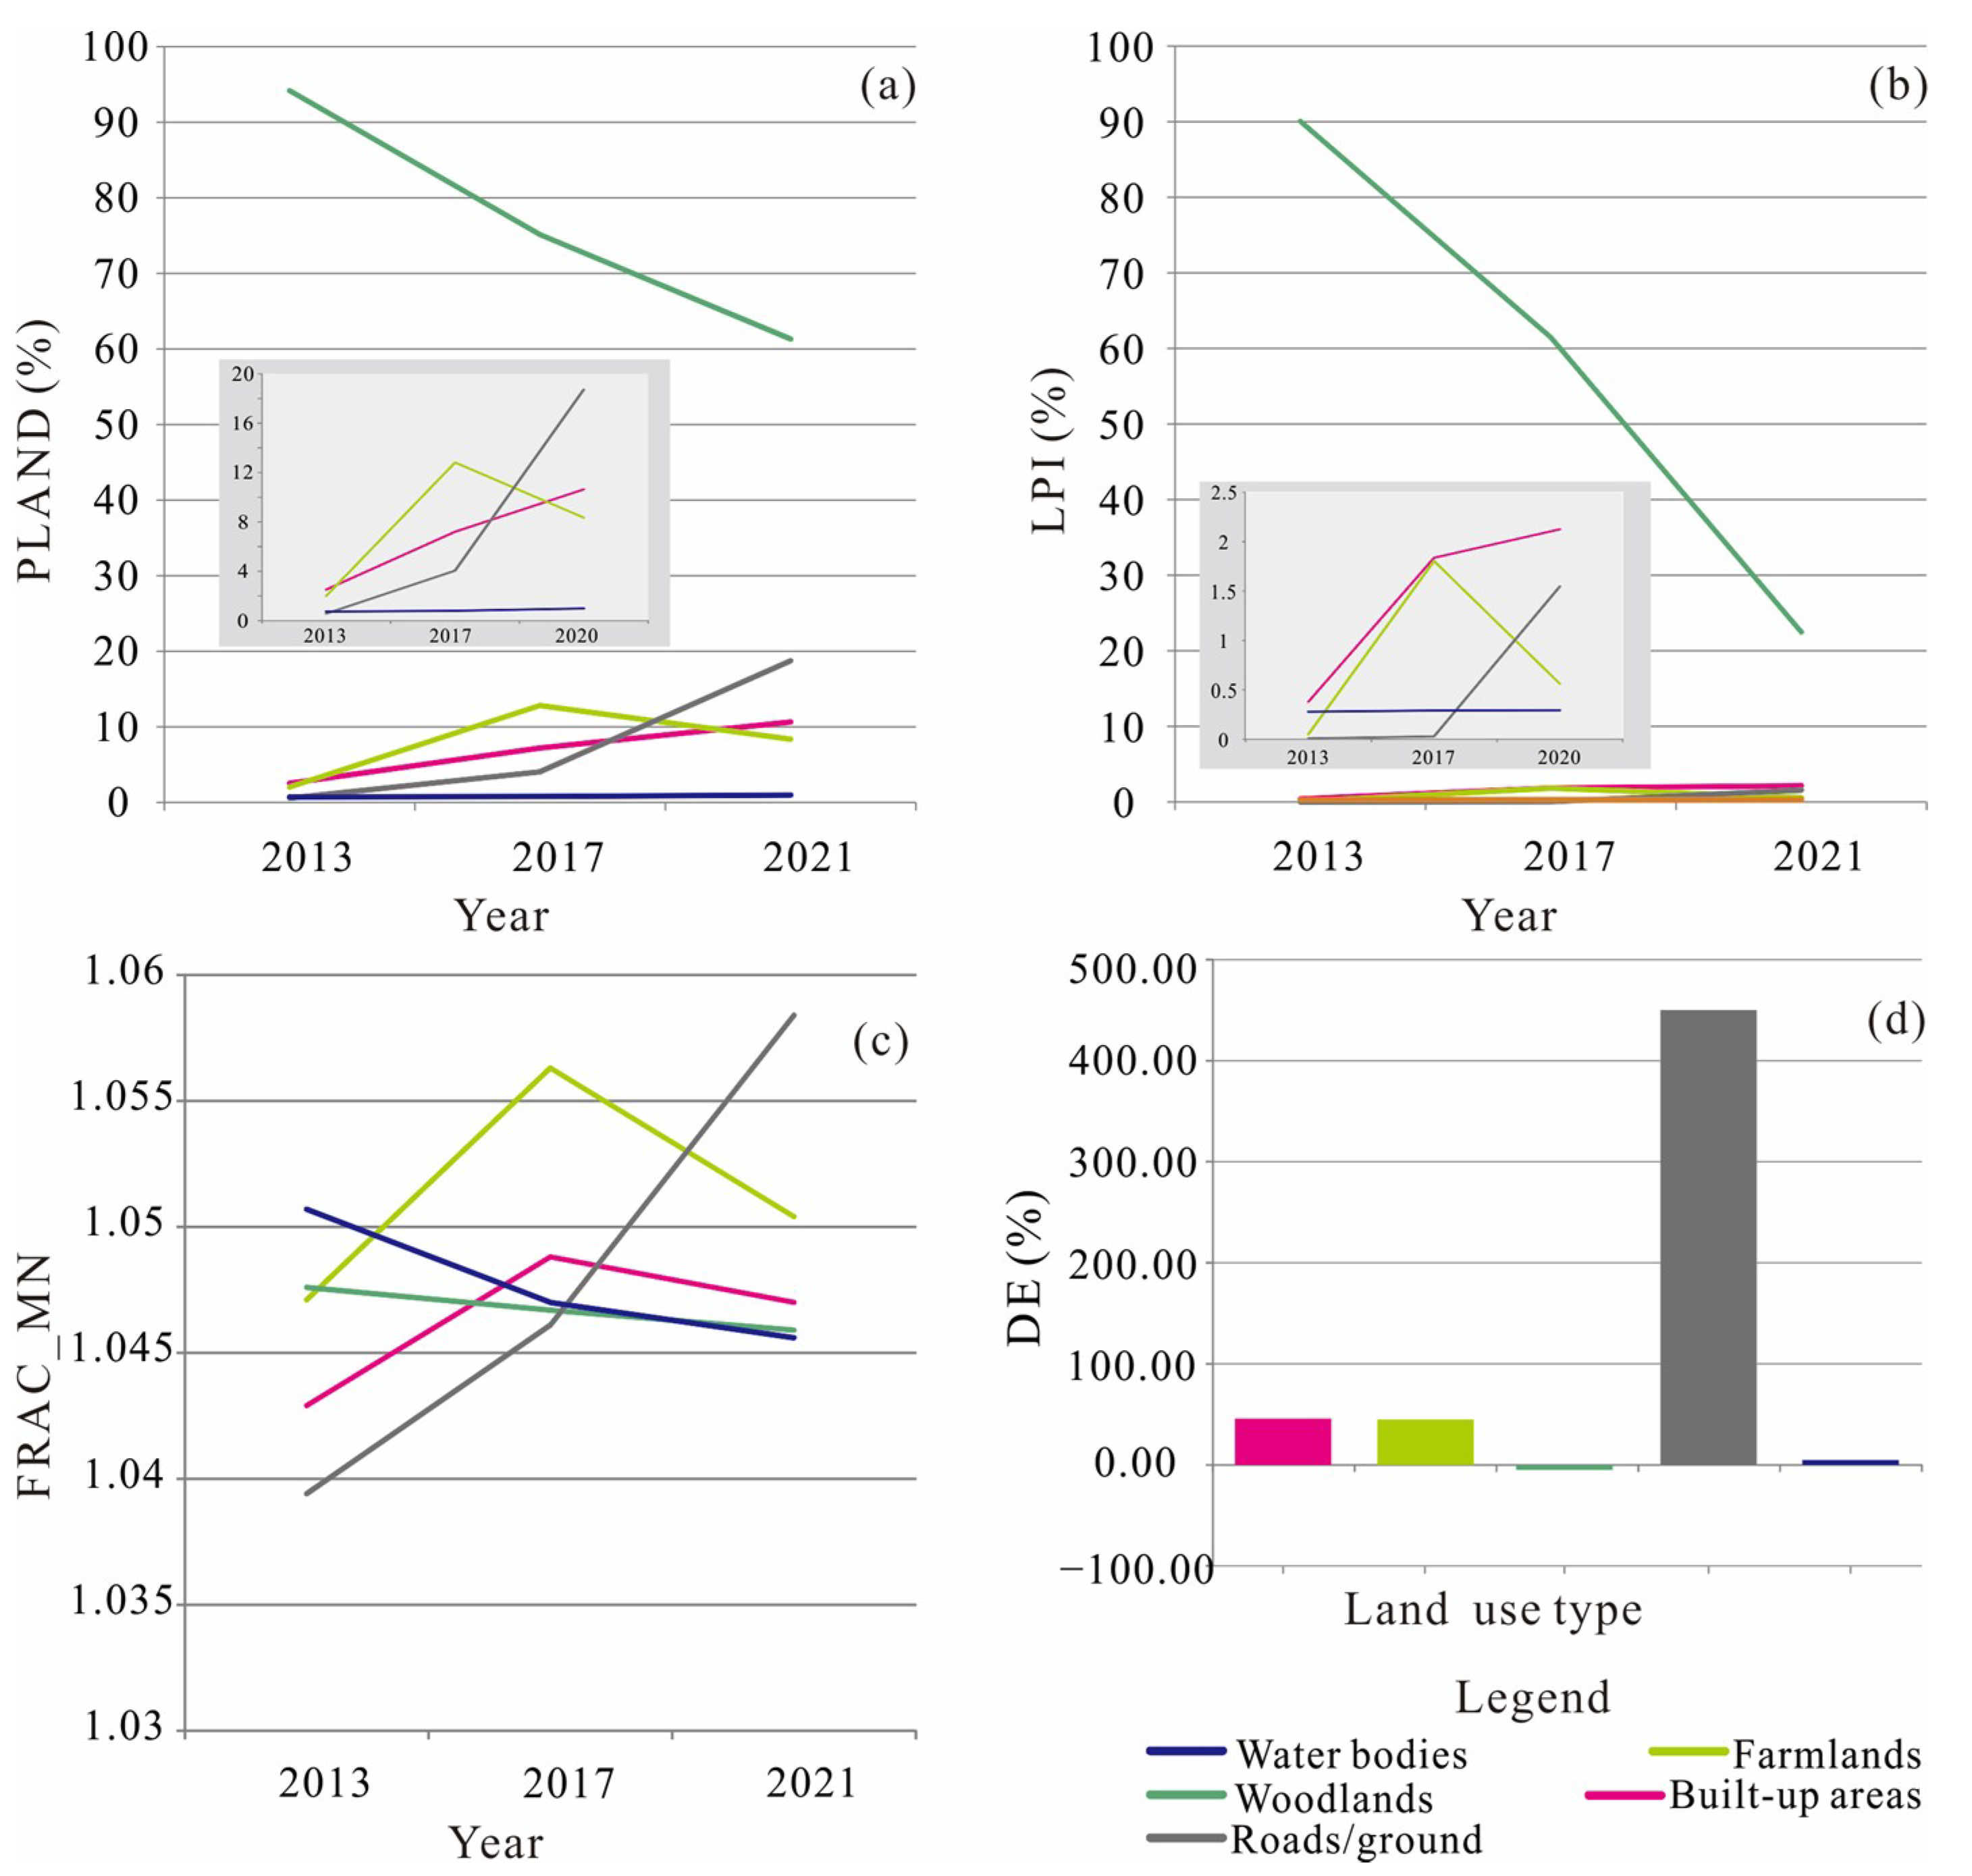
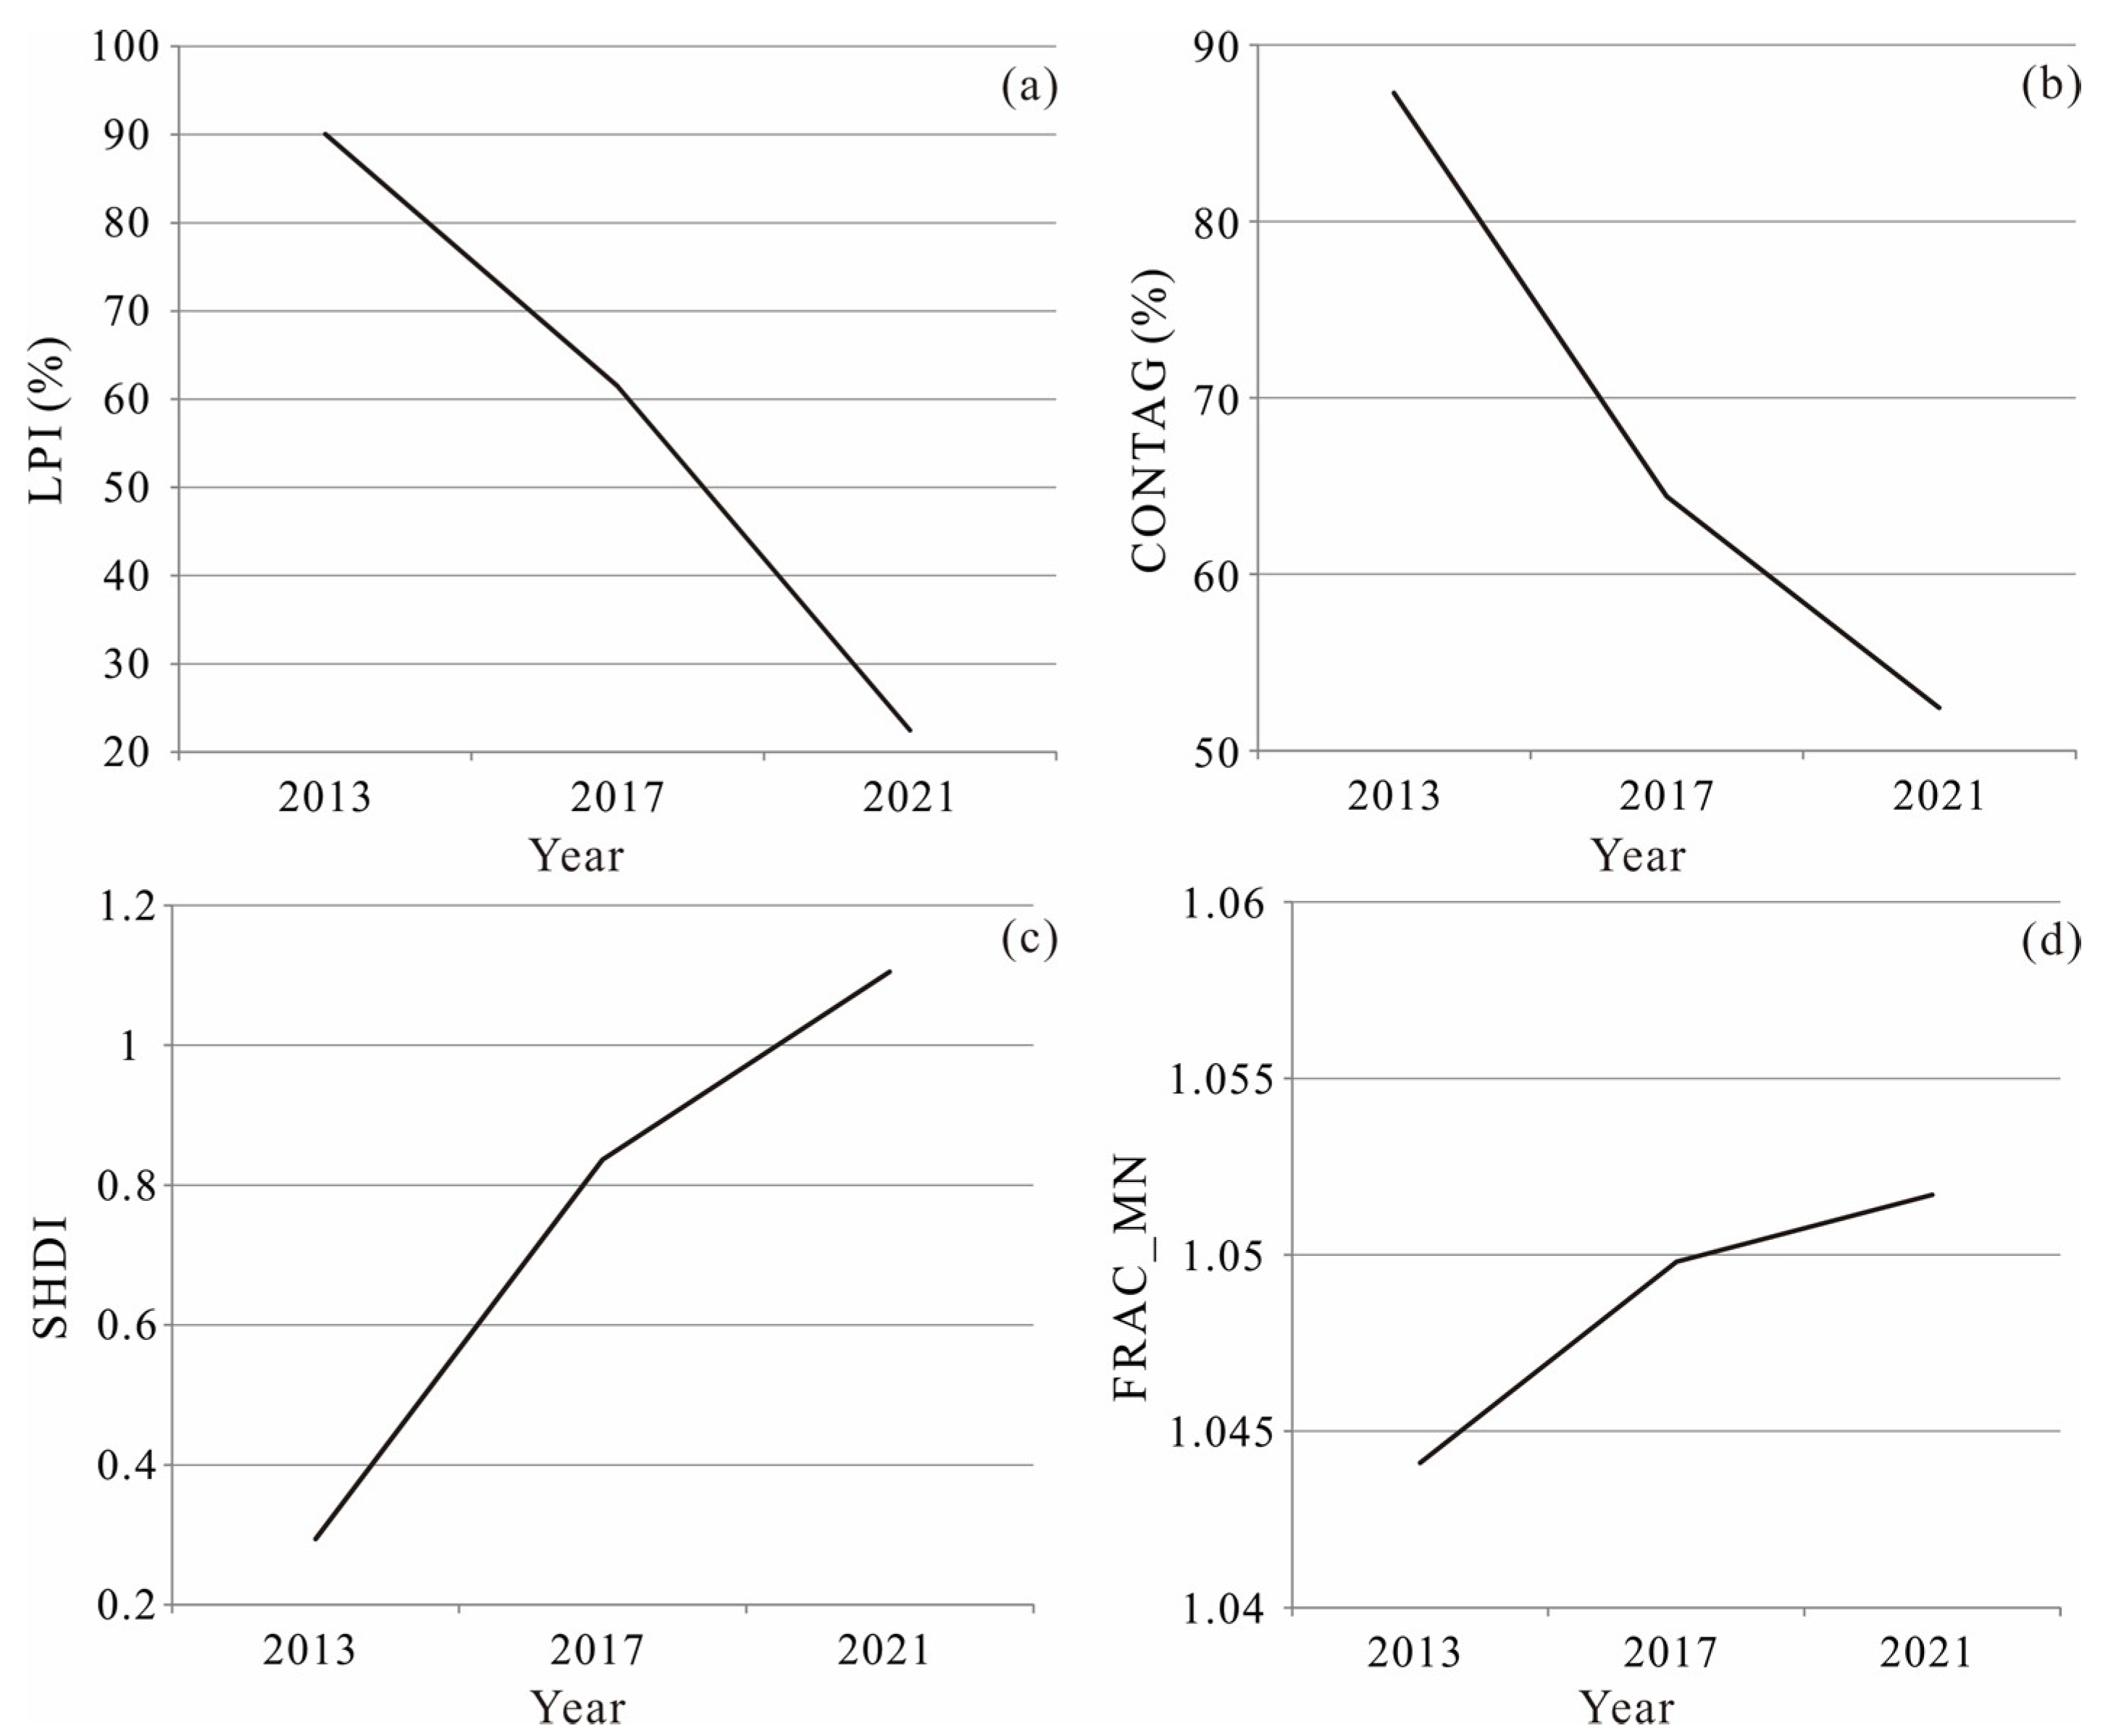
3.2. Landscape Pattern Analysis
3.3. Analysis of Red Culture Resources
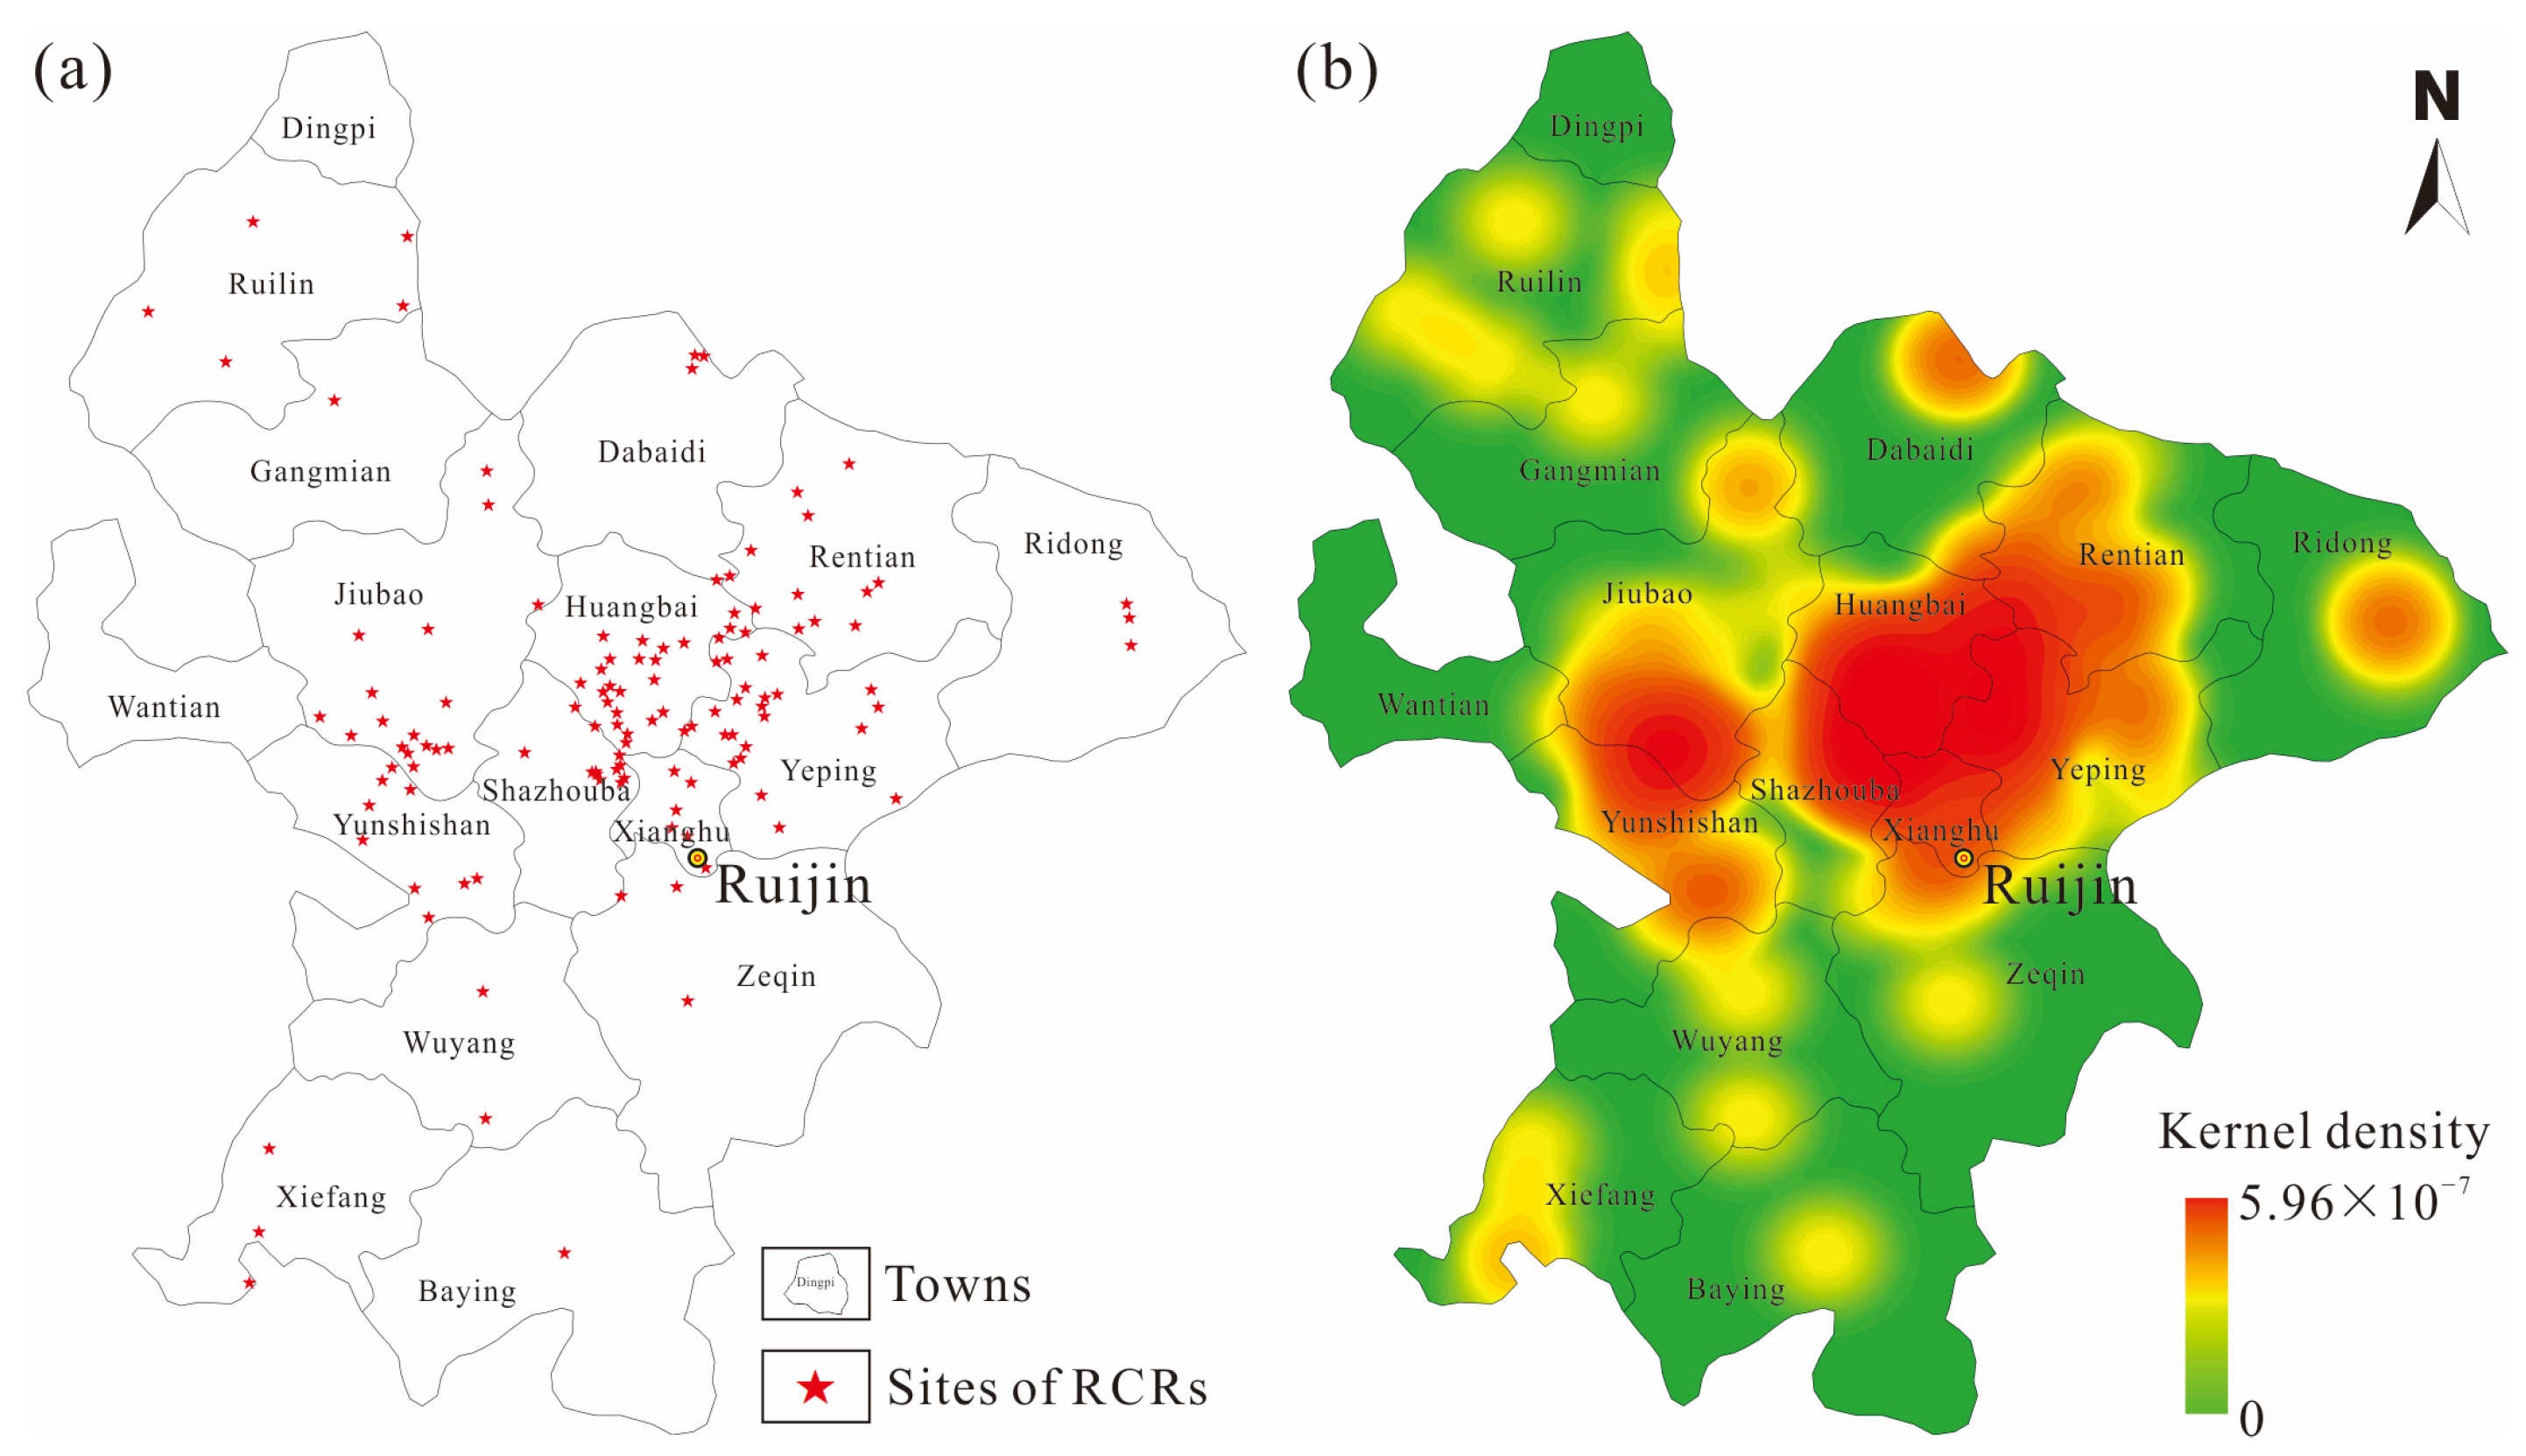
3.3.1. Spatial Distribution of the RCRs
3.3.2. Relationship of RCRs and Red Tourism Scenic-Spot (RTS)
3.4. Suitability Assessment of Red Tourism Development
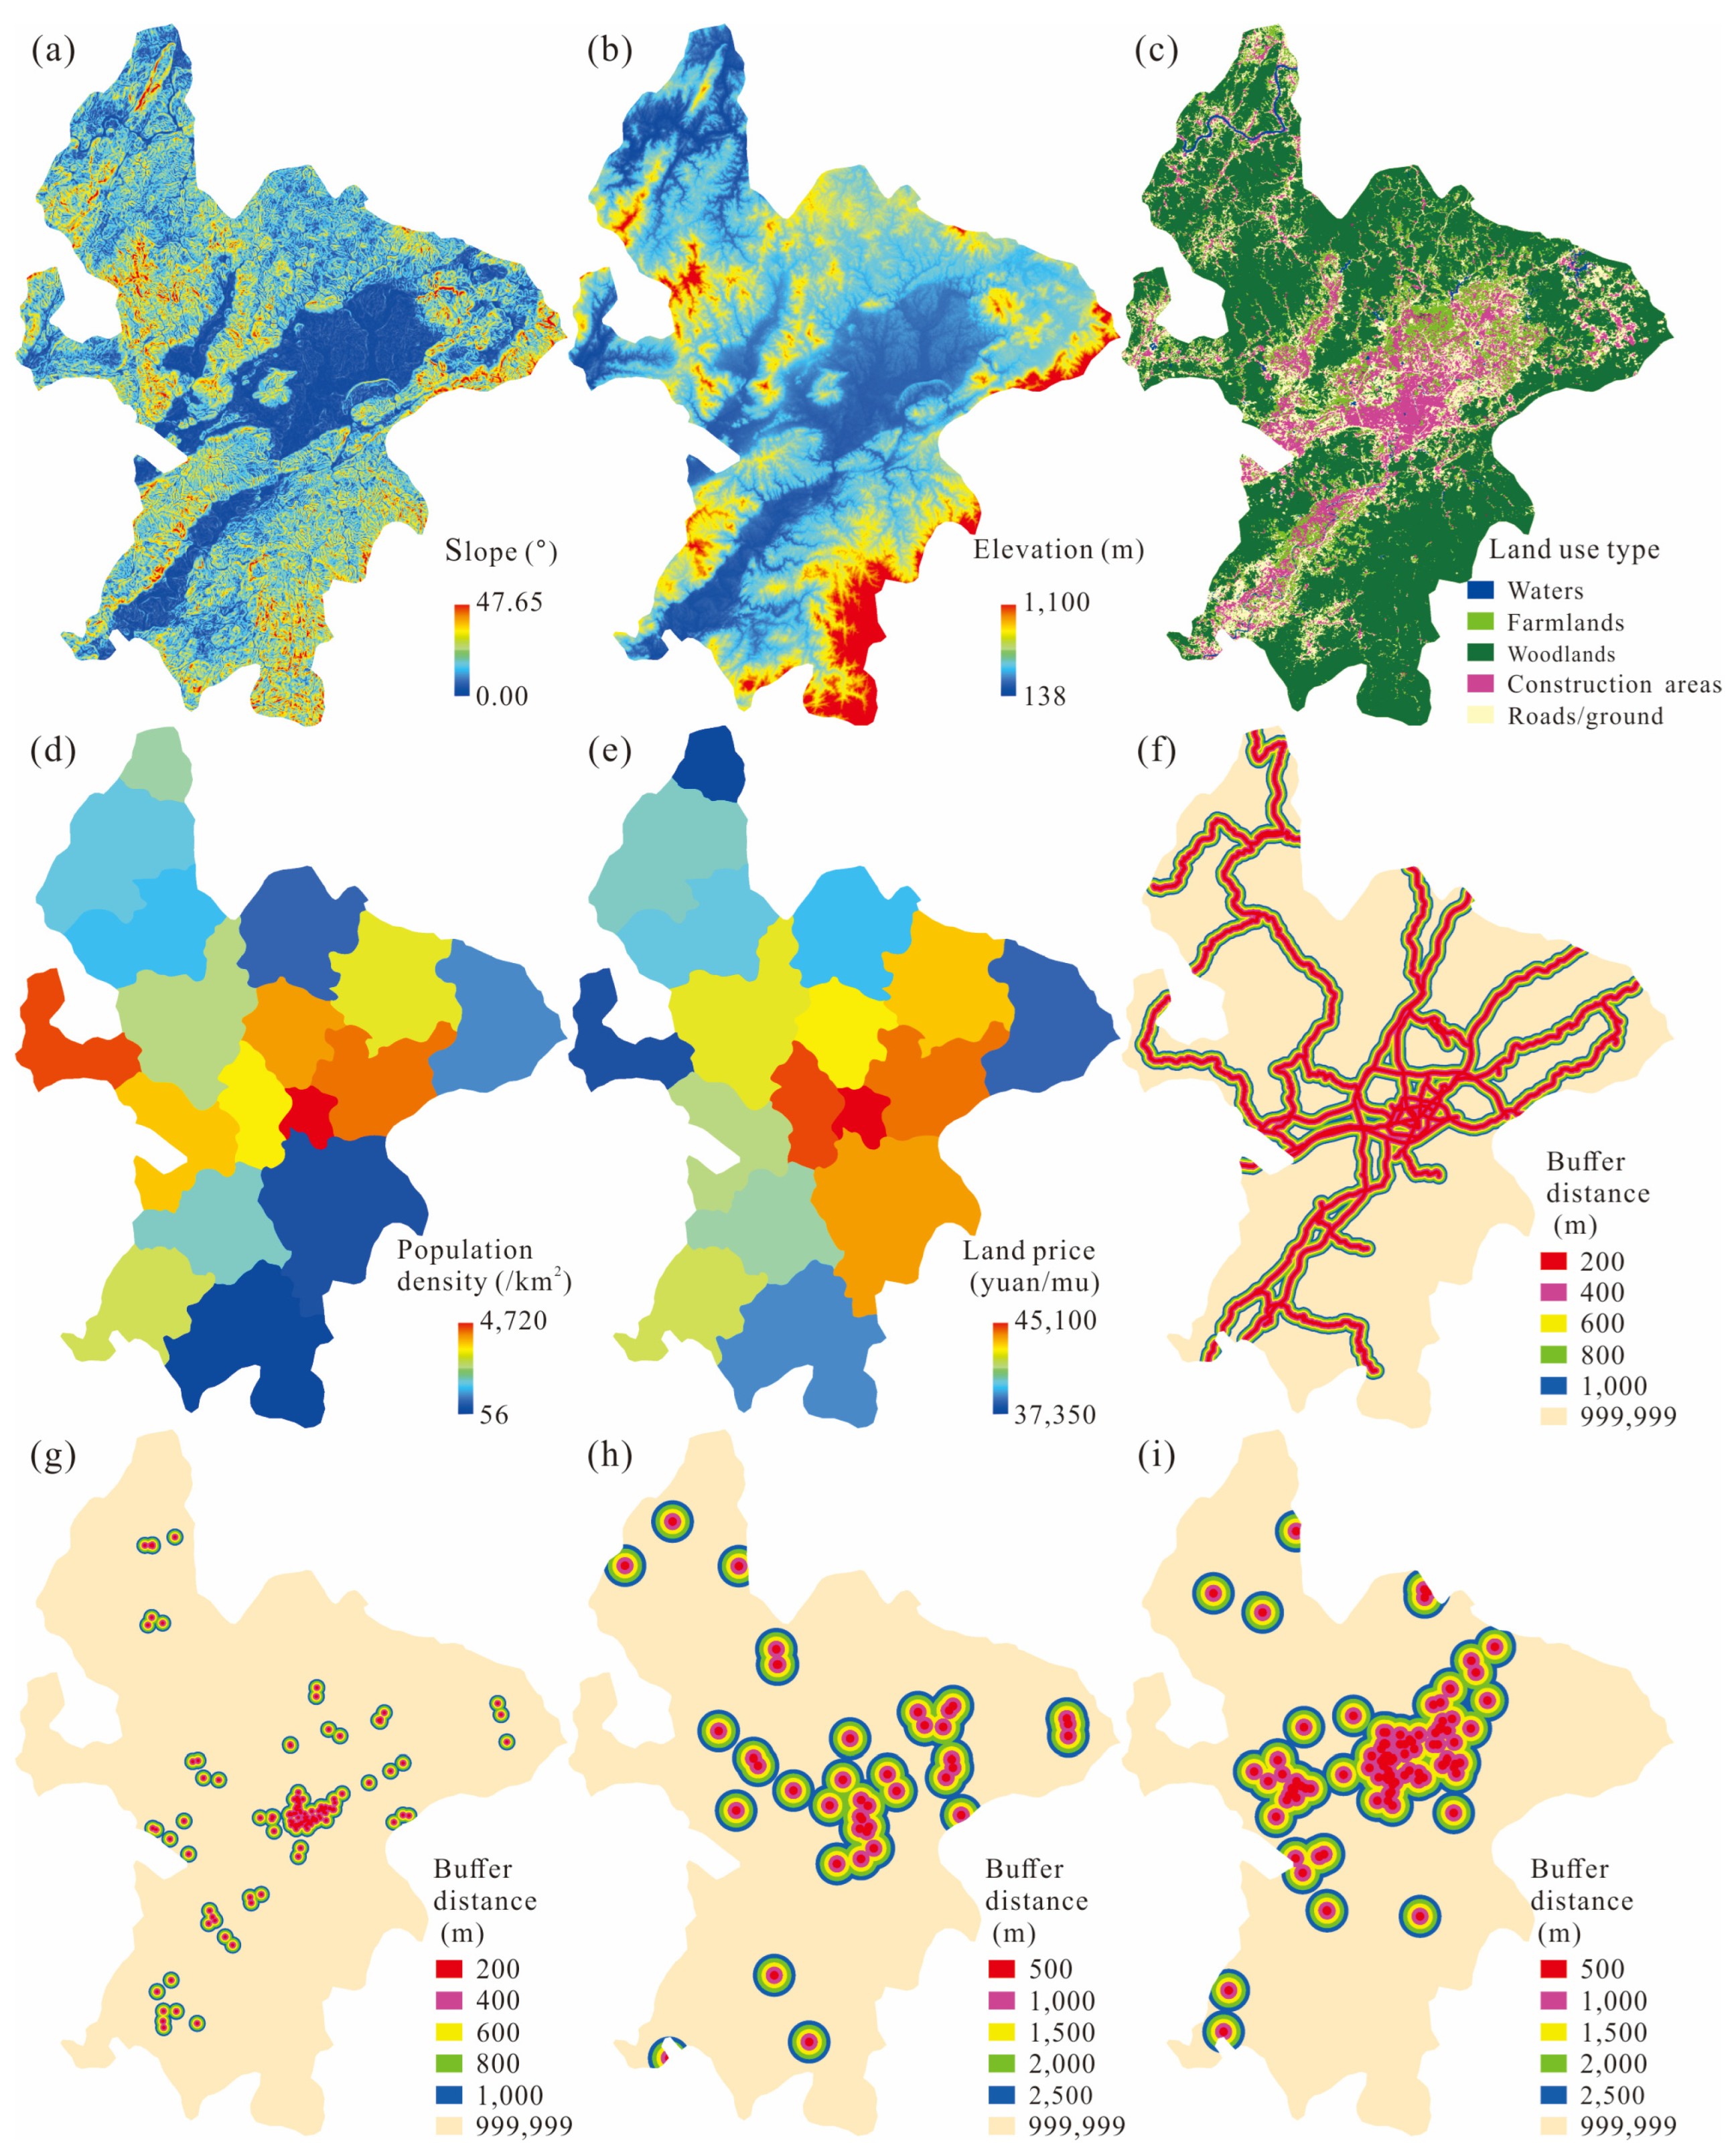
3.4.1. Assessment Factors
3.4.2. Response Variables
3.4.3. Construction and Evaluation of Regression Model
3.4.4. Red Tourism Suitability Mapping
4. Conclusions
- (i)
- Increasing the scope and intensity of human activities with continuously improved economic vitality provides a benign social environment for developing tourism resources.
- (ii)
- Highly concentrated red culture resources are conducive to the large-scale development of red tourism scenic spots. This can be developed relying on a single red resource or by exploring local characteristic culture related to red resources.
- (iii)
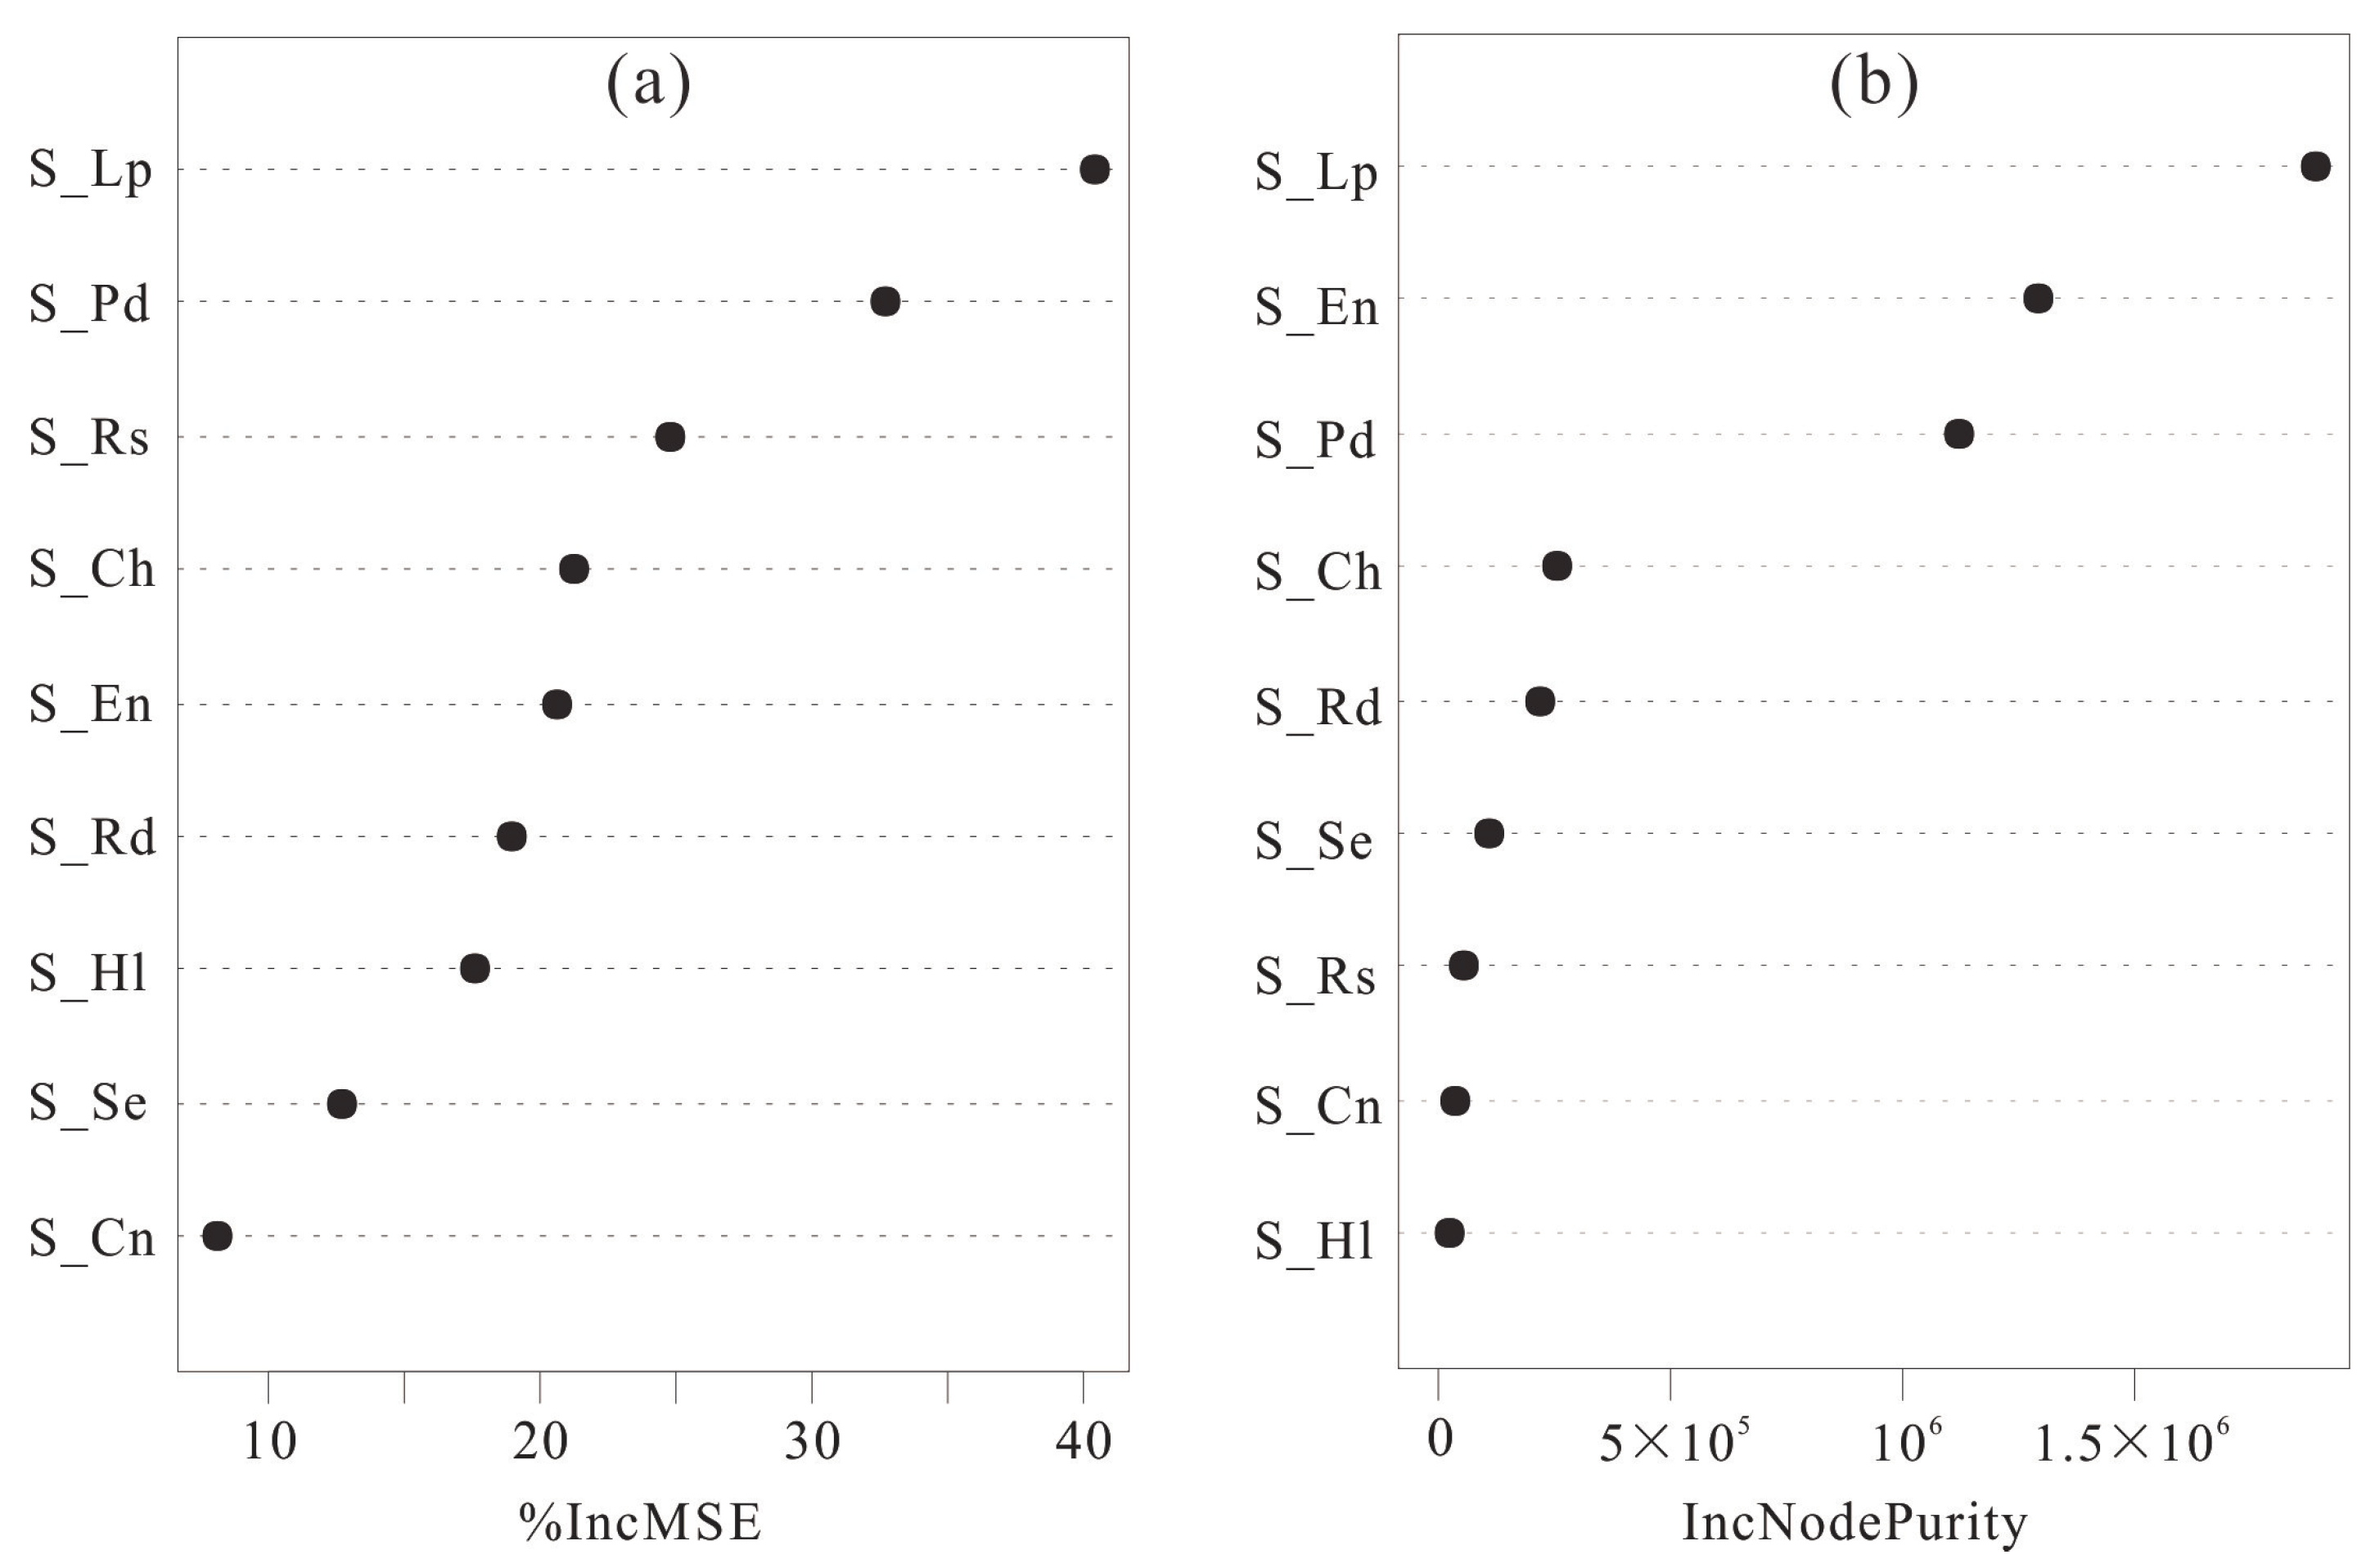
- Environmental factors such as altitude, land price, population density, revolutionary sites, and cultural–relic/historic sites contribute significantly to the construction of the suitability assessment model, meaning that their feature variables are more closely related to the development of red tourism resources.
- (iv)
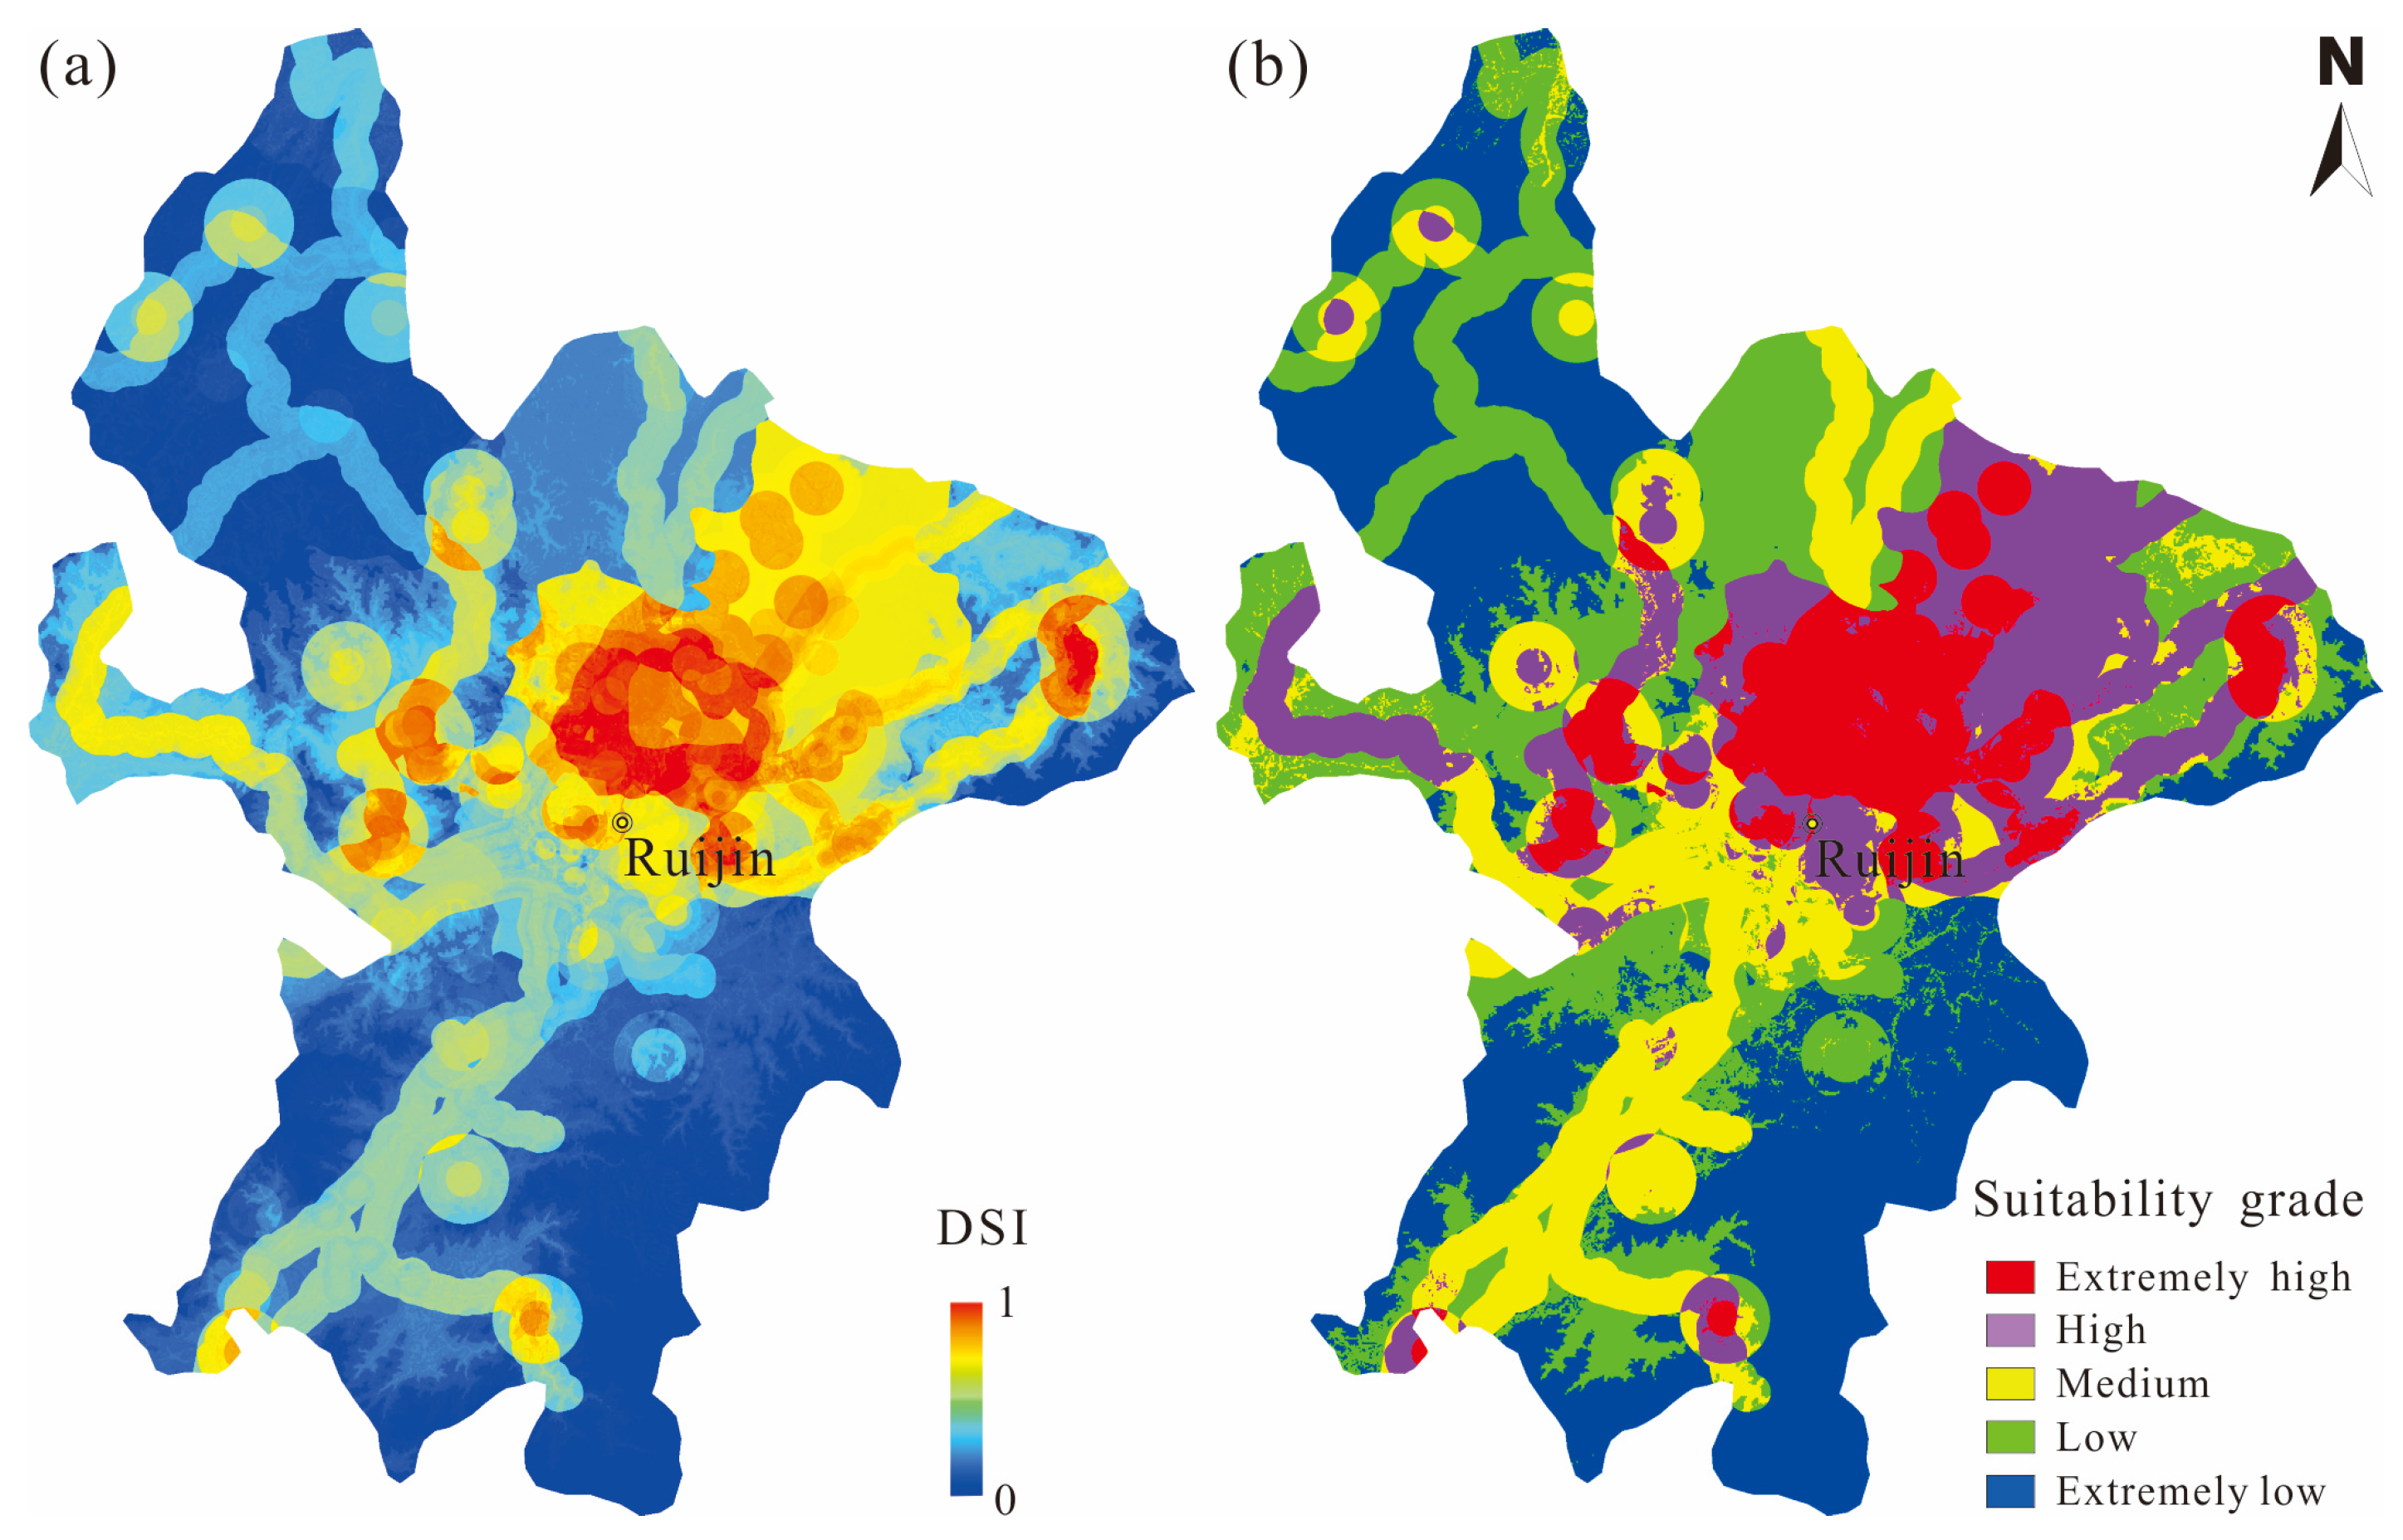
- The further development potential areas of red tourism resources are preferentially located in the central and eastern Ruijin, including the northeast and west of the downtown area, followed by the areas distributed around the high potential sites or along the main roads.
- (v)
- The importance ranking of the environmental factors and assessment results based on developed suitability model are consistent with the local knowledge on red tourism in Ruijin.
- (vi)
- From a local perspective, in the last eight years, the landscape pattern of Ruijin has experienced significant changes, showing that the intensity and influence of human activities is gradually increasing, and the economic vitality is constantly improving.
Author Contributions
Funding
Institutional Review Board Statement
Informed Consent Statement
Data Availability Statement
Conflicts of Interest
References
- Ning, C.; Hoon, O.D. Sustainable development strategy of tourism resources offered by regional advantage: Exploring the feasibility of developing an ‘exotic culture’ resource for Weihai City of China. Procedia Eng. 2011, 21, 543–552. [Google Scholar] [CrossRef] [PubMed]
- Jin, Y.; Xi, H.; Wang, X.; Ren, X.; Yuan, L. Evaluation of the Integration Policy in China: Does the Integration of Culture and Tourism Promote Tourism Development? Ann. Tour. Res. 2022, 97, 103491. [Google Scholar] [CrossRef]
- Xiao, Y.; Tang, X.; Wang, J.; Huang, H.; Liu, L. Assessment of coordinated development between tourism development and resource environment carrying capacity: A case study of Yangtze River economic Belt in China. Ecol. Indic. 2022, 141, 109125. [Google Scholar] [CrossRef]
- Wang, Q.; Yang, L.; Yue, Z. Research on development of digital finance in improving efficiency of tourism resource allocation. Resour. Environ. Sustain. 2022, 8, 100054. [Google Scholar] [CrossRef]
- Zhao, S.; Timothy, D.J. Governance of red tourism in China: Perspectives on power and guanxi. Tour. Manag. 2015, 46, 489–500. [Google Scholar] [CrossRef]
- Zuo, B.; Gursoy, D.; Wall, G. Residents’ support for red tourism in China: The moderating effect of central government. Ann. Tour. Res. 2017, 64, 51–63. [Google Scholar] [CrossRef]
- Li, Y.P.; Hu, Z.Y.; Zhang, C.Z. Red tourism: Sustaining communist identity in a rapidly changing China. J. Tour. Cult. Chang. 2010, 8, 101–119. [Google Scholar] [CrossRef]
- Yin, X.Y.; Zhu, H.; Gan, M.Y. Study on product characteristics and developing modes of red tourism. Hum. Geogr. 2005, 2, 34–37 + 76, (In Chinese with English Abstract). [Google Scholar]
- Chai, J.X. The Integrated Development of Red Tourism and Marine Characteristic Town under the Background of One Belt, One Road. J. Coast. Res. 2020, 112, 77–80. [Google Scholar] [CrossRef]
- Li, X.B. Explanation of land use changes. Prog. Geogr. 2002, 3, 195–203, (In Chinese with English Abstract). [Google Scholar]
- Peng, J.; Wang, Y.L.; Zhang, Y.; Ye, M.T.; Wu, J.S. Research on the influence of land use classification on landscape metrics. Acta Geogr. Sin. 2006, 2, 157–168, (In Chinese with English Abstract). [Google Scholar]
- Wang, Y.; Li, X.; Xin, L.; Tan, M. Farmland marginalization and its drivers in mountainous areas of China. Sci. Total Environ. 2020, 719, 135132. [Google Scholar] [CrossRef] [PubMed]
- Ou-Yang, X.; Zhu, X. Spatio-temporal characteristics of urban land expansion in Chinese urban agglomerations. Acta Geogr. Sin. 2020, 75, 571–588, (In Chinese with English Abstract). [Google Scholar]
- Sun, H.; Wei, J.; Han, Q. Assessing land-use change and landscape connectivity under multiple green infrastructure conservation scenarios. Ecol. Indic. 2022, 142, 109236. [Google Scholar] [CrossRef]
- Wang, Q.; Wang, H. Spatiotemporal dynamics and evolution relationships between land-use/land cover change and landscape pattern in response to rapid urban sprawl process: A case study in Wuhan, China. Ecol. Eng. 2022, 182, 106716. [Google Scholar] [CrossRef]
- Deng, L.; Zhang, Q.; Cheng, Y.; Cao, Q.; Wang, Z.; Wu, Q.; Qiao, J. Underlying the influencing factors behind the heterogeneous change of urban landscape patterns since 1990: A multiple dimension analysis. Ecol. Indic. 2022, 140, 108967. [Google Scholar] [CrossRef]
- Lambin, E.F.; Turner, B.L.; Geist, H.J.; Agbola, S.B.; Angelsen, A.; Bruce, J.W.; Coomes, O.T.; Dirzo, R.; Fischer, G.; Folke, C.; et al. The causes of land-use and land-cover change: Moving beyond the myths. Glob. Environ. Chang. 2001, 11, 261–269. [Google Scholar] [CrossRef]
- Hassan, M.M. Monitoring land use/land cover change, urban growth dynamics and landscape pattern analysis in five fastest urbanized cities in Bangladesh. Remote Sens. Appl. Soc. Environ. 2017, 7, 69–83. [Google Scholar] [CrossRef]
- Zhu, Q.Q.; Lei, Y.; Sun, X.L.; Guan, Q.F.; Zhong, Y.F.; Zhang, L.P.; Li, D.R. Knowledge-guided land pattern depiction for urban land use mapping: A case study of Chinese cities. Remote Sens. Environ. 2022, 272, 112916. [Google Scholar] [CrossRef]
- Ouyang, X.; Tang, L.; Wei, X.; Li, Y. Spatial interaction between urbanization and ecosystem services in Chinese urban agglomerations. Land Use Policy 2021, 109, 105587. [Google Scholar] [CrossRef]
- Xie, J.; Xie, B.; Zhou, K.; Li, J.; Xiao, J.; Liu, C. Impacts of landscape pattern on ecological network evolution in Changsha-Zhuzhou-Xiangtan Urban Agglomeration, China. Ecol. Indic. 2022, 145, 109716. [Google Scholar] [CrossRef]
- Alphan, H.; Karamanli, E.; Derse, M.A.; Uslu, C. Analyzing pattern features of urban/rural residential land use change: The case of the southern coast of Turkey. Land Use Policy 2022, 122, 106348. [Google Scholar] [CrossRef]
- Duan, X.; Chen, Y.; Wang, L.; Zheng, G.; Liang, T. The impact of land use and land cover changes on the landscape pattern and ecosystem service value in Sanjiangyuan region of the Qinghai-Tibet Plateau. J. Environ. Manag. 2023, 325, 116539. [Google Scholar] [CrossRef]
- Chu, Y.F. A study on the evaluation of tourist areas in China. Acta Geogr. Sin. 1991, 46, 396–404, (In Chinese with English Abstract). [Google Scholar]
- Guo, Y.; Jiang, J.B.; Li, S.C. A Sustainable Tourism Policy Research Review. Sustainability 2019, 11, 3187. [Google Scholar] [CrossRef]
- Baloch, Q.B.; Shah, S.N.; Iqbal, N.; Sheeraz, M.; Asadullah, M.; Mahar, S.; Khan, A.U. Impact of tourism development upon environmental sustainability: A suggested framework for sustainable ecotourism. Environ. Sci. Pollut. Res. 2023, 30, 5917–5930. [Google Scholar] [CrossRef] [PubMed]
- Fadafan, F.K.; Danehkar, A.; Pourebrahim, S. Developing a non-compensatory approach to identify suitable zones for intensive tourism in an environmentally sensitive landscape. Ecol. Indic. 2018, 87, 152–166. [Google Scholar] [CrossRef]
- Schirpke, U.; Tappeiner, G.; Tasser, E.; Tappeiner, U. Using conjoint analysis to gain deeper insights into aesthetic landscape preferences. Ecol. Indic. 2019, 96, 202–212. [Google Scholar] [CrossRef]
- Howard, R.A. Information value theory. IEEE Trans. Syst. Sci. Cybern. 1966, 2, 22–26. [Google Scholar] [CrossRef]
- Bonham-Carter, G.F.; Agterberg, F.P.; Wright, D.F. Weights of evidence modeling: A new approach to mapping mineral potential. Geol. Surv. Can. 1989, 89, 171–183. [Google Scholar]
- Cheng, E.; Li, H. Analytic hierarchy process. Meas. Bus. Excell. 1997, 5, 30–37. [Google Scholar] [CrossRef]
- Masih, M.; Jozi, S.A.; Lahijanian, A.A.; Danehkar, A.; Vafaeinejad, A. Capability assessment and tourism development model verification of Haraz watershed using analytical hierarchy process (AHP). Environ. Monit. Assess. 2018, 190, 16. [Google Scholar] [CrossRef] [PubMed]
- Deng, J.; Che, T.; Xiao, C.D.; Wang, S.J.; Dai, L.Y.; Meerzhan, A. Suitability analysis of ski areas in China: An integrated study based on natural and socioeconomic conditions. Cryosphere 2019, 13, 2149–2167. [Google Scholar] [CrossRef]
- Adrianto, L.; Kurniawan, F.; Romadhon, A.; Bengen, D.G.; Sjafrie, N.D.M.; Damar, A.; Kleinertz, S. Assessing social-ecological system carrying capacity for urban small island tourism: The case of Tidung Islands, Jakarta Capital Province, Indonesia. Ocean Coast. Manag. 2021, 212, 12. [Google Scholar] [CrossRef]
- Chaudhary, S.; Kumar, A.; Pramanik, M.; Negi, M.S. Land evaluation and sustainable development of ecotourism in the Garhwal Himalayan region using geospatial technology and analytical hierarchy process. Environ. Dev. Sustain. 2022, 24, 2225–2266. [Google Scholar] [CrossRef]
- Cortes, C.; Vapnik, V. Suppor-vector networks. Mach. Learn. 1995, 20, 273–297. [Google Scholar] [CrossRef]
- Breiman, L. Random forests. Mach. Learn. 2001, 45, 5–32. [Google Scholar] [CrossRef]
- Friedman, J.H. Greedy function approximation: A gradient boosting machine. Ann. Stat. 2001, 29, 1189–1232. [Google Scholar] [CrossRef]
- Cramer, J.S. The origins of logistic regression. Tinbergen Inst. Discuss. Pap. 2002, 119, 1–15. [Google Scholar] [CrossRef]
- Lawrence, S.; Giles, C.L.; Tsoi, A.C.; Back, A.D. Face recognition: A convolutional neural network approach. IEEE Trans. Neural Netw. 1997, 8, 98–113. [Google Scholar] [CrossRef]
- Mao, W.L.; Lu, D.B.; Hou, L.; Liu, X.; Yue, W.Z. Comparison of Machine-Learning Methods for Urban Land-Use Mapping in Hangzhou City, China. Remote Sens. 2020, 12, 2817. [Google Scholar] [CrossRef]
- Talukdar, S.; Singha, P.; Mahato, S.; Shahfahad; Pal, S.; Liou, Y.A.; Rahman, A. Land-Use Land-Cover Classification by Machine Learning Classifiers for Satellite Observations—A Review. Remote Sens. 2020, 12, 1135. [Google Scholar] [CrossRef]
- Abdi, A.M. Land cover and land use classification performance of machine learning algorithms in a boreal landscape using Sentinel-2 data. GISci. Remote Sens. 2020, 57, 1–20. [Google Scholar] [CrossRef]
- Zhang, T.L.; Hou, M.Z.; Zhou, T.; Liu, Z.D.; Cheng, W.R.; Cheng, Y.J. Land-use classification via ensemble dropout information discriminative extreme learning machine based on deep convolution feature. Comput. Sci. Inf. Syst. 2020, 17, 427–443. [Google Scholar] [CrossRef]
- Liang, J.; Xu, J.C.; Shen, H.F.; Fang, L. Land-use classification via constrained extreme learning classifier based on cascaded deep convolutional neural networks. Eur. J. Remote Sens. 2020, 53, 219–232. [Google Scholar] [CrossRef]
- Reznik, T.; Chytry, J.; Trojanova, K. Machine Learning-Based Processing Proof-of-Concept Pipeline for Semi-Automatic Sentinel-2 Imagery Download, Cloudiness Filtering, Classifications, and Updates of Open Land Use/Land Cover Datasets. ISPRS Int. J. Geo-Inf. 2021, 10, 102. [Google Scholar] [CrossRef]
- Xiang, J.; Xiao, K.Y.; Carranza, E.J.M.; Chen, J.P.; Li, S. 3D Mineral Prospectivity Mapping with Random Forests: A Case Study of Tongling, Anhui, China. Nat. Resour. Res. 2020, 29, 395–414. [Google Scholar] [CrossRef]
- Qin, Y.Z.; Liu, L.M.; Wu, W.C. Machine Learning-Based 3D Modeling of Mineral Prospectivity Mapping in the Anqing Orefield, Eastern China. Nat. Resour. Res. 2021, 30, 3099–3120. [Google Scholar] [CrossRef]
- Deng, H.; Zheng, Y.; Chen, J.; Yu, S.Y.; Xiao, K.Y.; Mao, X.C. Learning 3D mineral prospectivity from 3D geological models using convolutional neural networks: Application to a structure-controlled hydrothermal gold deposit. Comput. Geosci. 2022, 161, 105074. [Google Scholar] [CrossRef]
- Zuo, R.G.; Xu, Y. Graph Deep Learning Model for Mapping Mineral Prospectivity. Math. Geosci. 2023, 55, 1–21. [Google Scholar] [CrossRef]
- Nguyen, H.; Mehrabi, M.; Kalantar, B.; Moayedi, H.; Abdullahi, M.M. Potential of hybrid evolutionary approaches for assessment of geo-hazard landslide susceptibility mapping. Geomat. Nat. Hazards Risk 2019, 10, 1667–1693. [Google Scholar] [CrossRef]
- Zhang, Y.; Wu, W.; Qin, Y.; Lin, Z.; Zhang, G.; Chen, R.; Song, Y.; Lang, T.; Zhou, X.; Huangfu, W.; et al. Mapping Landslide Hazard Risk Using Random Forest Algorithm in Guixi, Jiangxi, China. ISPRS Int. J. Geo-Inf. 2020, 9, 695. [Google Scholar] [CrossRef]
- Qin, Y.Z.; Cao, L.; Boloorani, A.D.; Wu, W.C. High-Resolution Mining-Induced Geo-Hazard Mapping Using Random Forest: A Case Study of Liaojiaping Orefield, Central China. Remote Sens. 2021, 13, 3638. [Google Scholar] [CrossRef]
- Zhou, X.T.; Wu, W.C.; Qin, Y.Z.; Fu, X. Geoinformation-based landslide susceptibility mapping in subtropical area. Sci. Rep. 2021, 11, 24325. [Google Scholar] [CrossRef] [PubMed]
- Torre-Tojal, L.; Lopez-Guede, J.M.; Romay, M.M.G. Estimation of forest biomass from light detection and ranging data by using machine learning. Expert Syst. 2019, 36, 15. [Google Scholar] [CrossRef]
- Mansaray, L.R.; Zhang, K.Y.; Kanu, A.S. Dry biomass estimation of paddy rice with Sentinel-1A satellite data using machine learning regression algorithms. Comput. Electron. Agric. 2020, 176, 9. [Google Scholar] [CrossRef]
- Huang, X.; Wu, W.; Shen, T.; Xie, L.; Qin, Y.; Peng, S.; Zhou, X.; Fu, X.; Li, J.; Zhang, Z.; et al. Estimating Forest Canopy Cover by Multiscale Remote Sensing in Northeast Jiangxi, China. Land 2021, 10, 433. [Google Scholar] [CrossRef]
- Sharma, P.; Leigh, L.; Chang, J.Y.; Maimaitijiang, M.; Caffe, M. Above-Ground Biomass Estimation in Oats Using UAV Remote Sensing and Machine Learning. Sensors 2022, 22, 601. [Google Scholar] [CrossRef]
- Boloorani, A.D.; Samany, N.N.; Papi, R.; Soleimani, M. Dust source susceptibility mapping in Tigris and Euphrates basin using remotely sensed imagery. Catena 2022, 209, 105795. [Google Scholar] [CrossRef]
- Papi, R.; Attarchi, S.; Boloorani, A.D.; Samany, N.N. Knowledge discovery of Middle East dust sources using Apriori spatial data mining algorithm. Ecol. Inform. 2022, 72, 101867. [Google Scholar] [CrossRef]
- Van-der, L.; Rabe, S.; Held, A.; Jakimow, M.; Leitão, B.; Okujeni, P.J.; Schwieder, A.M.; Suess, S.; Hostert, P. The EnMAP-Box—A toolbox and application programming interface for EnMAP data processing. Remote Sens. 2015, 7, 11249–11266. [Google Scholar] [CrossRef]
- Mcgarigal, K. FRAGSTATS: Spatial Pattern Analysis Program for Quantifying Landscape Structure; US Department of Agriculture, Forest Service, Pacific Northwest Research Station: Portland, OR, USA, 1995; pp. 1–132.
- Raines, G.L. Description and comparison of geologic maps with FRAGSTATS—A spatial statistics program. Comput. Geosci. 2002, 28, 169–177. [Google Scholar] [CrossRef]
- Quinlan, J.R. Induction of Decision Trees. Mach. Learn. 1986, 1, 81–106. [Google Scholar] [CrossRef]
- Breiman, L. Bagging predictors. Mach. Learn. 1996, 24, 123–140. [Google Scholar] [CrossRef]
- Loomis, J.M. Analysis of tactile and visual confusion matrices. Percept. Psychophys. 1982, 31, 41–52. [Google Scholar] [CrossRef]
- Wu, J.G. Landscape Ecology—Concepts and Theories. Chin. J. Ecol. 2000, 1, 42–52, (In Chinese with English Abstract). [Google Scholar]
- Li, X.; Lu, L.; Cheng, G.; Xiao, H. Quantifying landscape structure of the Heihe River Basin, north-west China using FRAGSTATS. J. Arid. Environ. 2001, 48, 521–535. [Google Scholar] [CrossRef]
- Kaufman, Y.J.; Tanre, D. Atmospherically resistant vegetation index (ARVI) for eos-modis. IEEE Trans. Geosci. Remote Sens. 1992, 30, 261–270. [Google Scholar] [CrossRef]
- Gao, B.C. NDWI—A normalized difference water index for remote sensing of vegetation liquid water from space. Remote Sens. Environ. 1996, 58, 257–266. [Google Scholar] [CrossRef]
- Zhang, H.; Du, P.J.; Lu, J.Q.; Li, E.Z. Ecological change analysis of nanjing city based on remote sensing ecological index. Geospat. Inf. 2017, 15, 58–62 + 10, (In Chinese with English Abstract). [Google Scholar]
- Li, B.L.; Ti, C.P.; Yan, X.Y. Study of derivation of tasseled cap transformation for landsat 8 oli images. Sci. Surv. Mapp. 2016, 41, 102–107, (In Chinese with English Abstract). [Google Scholar]
- Yang, R.B. A new attempt to protect and use the former revolutionary residence site—On the site management of Ruijin Central Revolutionary Base Memorial. Cult. Relics South. China 2005, 2, 113–115. (In Chinese) [Google Scholar]
- Jenks, G.F. The data model concept in statistical mapping. Int. Yearb. Cartogr. 1967, 7, 186–190. [Google Scholar]


| Data Type | Source | Purpose |
|---|---|---|
| Remote sensing data | Landsat 8 OLI images of 2013, 2017, and 2021 DEM of 30 m resolution from GDEM V3 | land use classification, landscape pattern analysis |
| Development data of scenic spot | Total annual income Total annual tourist numbers Scenic spot score | Dependent variable of sample for evaluation model |
| Environmental factors | Revolutionary sites Cultural relics Population density Land price Slope Elevation Roads Hotel classes | Independent variable of dataset for evaluation model |
| Year | 2013 | 2017 | 2021 | |
|---|---|---|---|---|
| Parameters | ||||
| RF classifier construction | No. of trees | 95 | 105 | 100 |
| No. of feature variables | 3 | 3 | 3 | |
| RF classifier performance | Overall accuracy | 96.25 | 96.58 | 97.99 |
| Kappa coefficient | 87.86 | 88.23 | 90.21 |
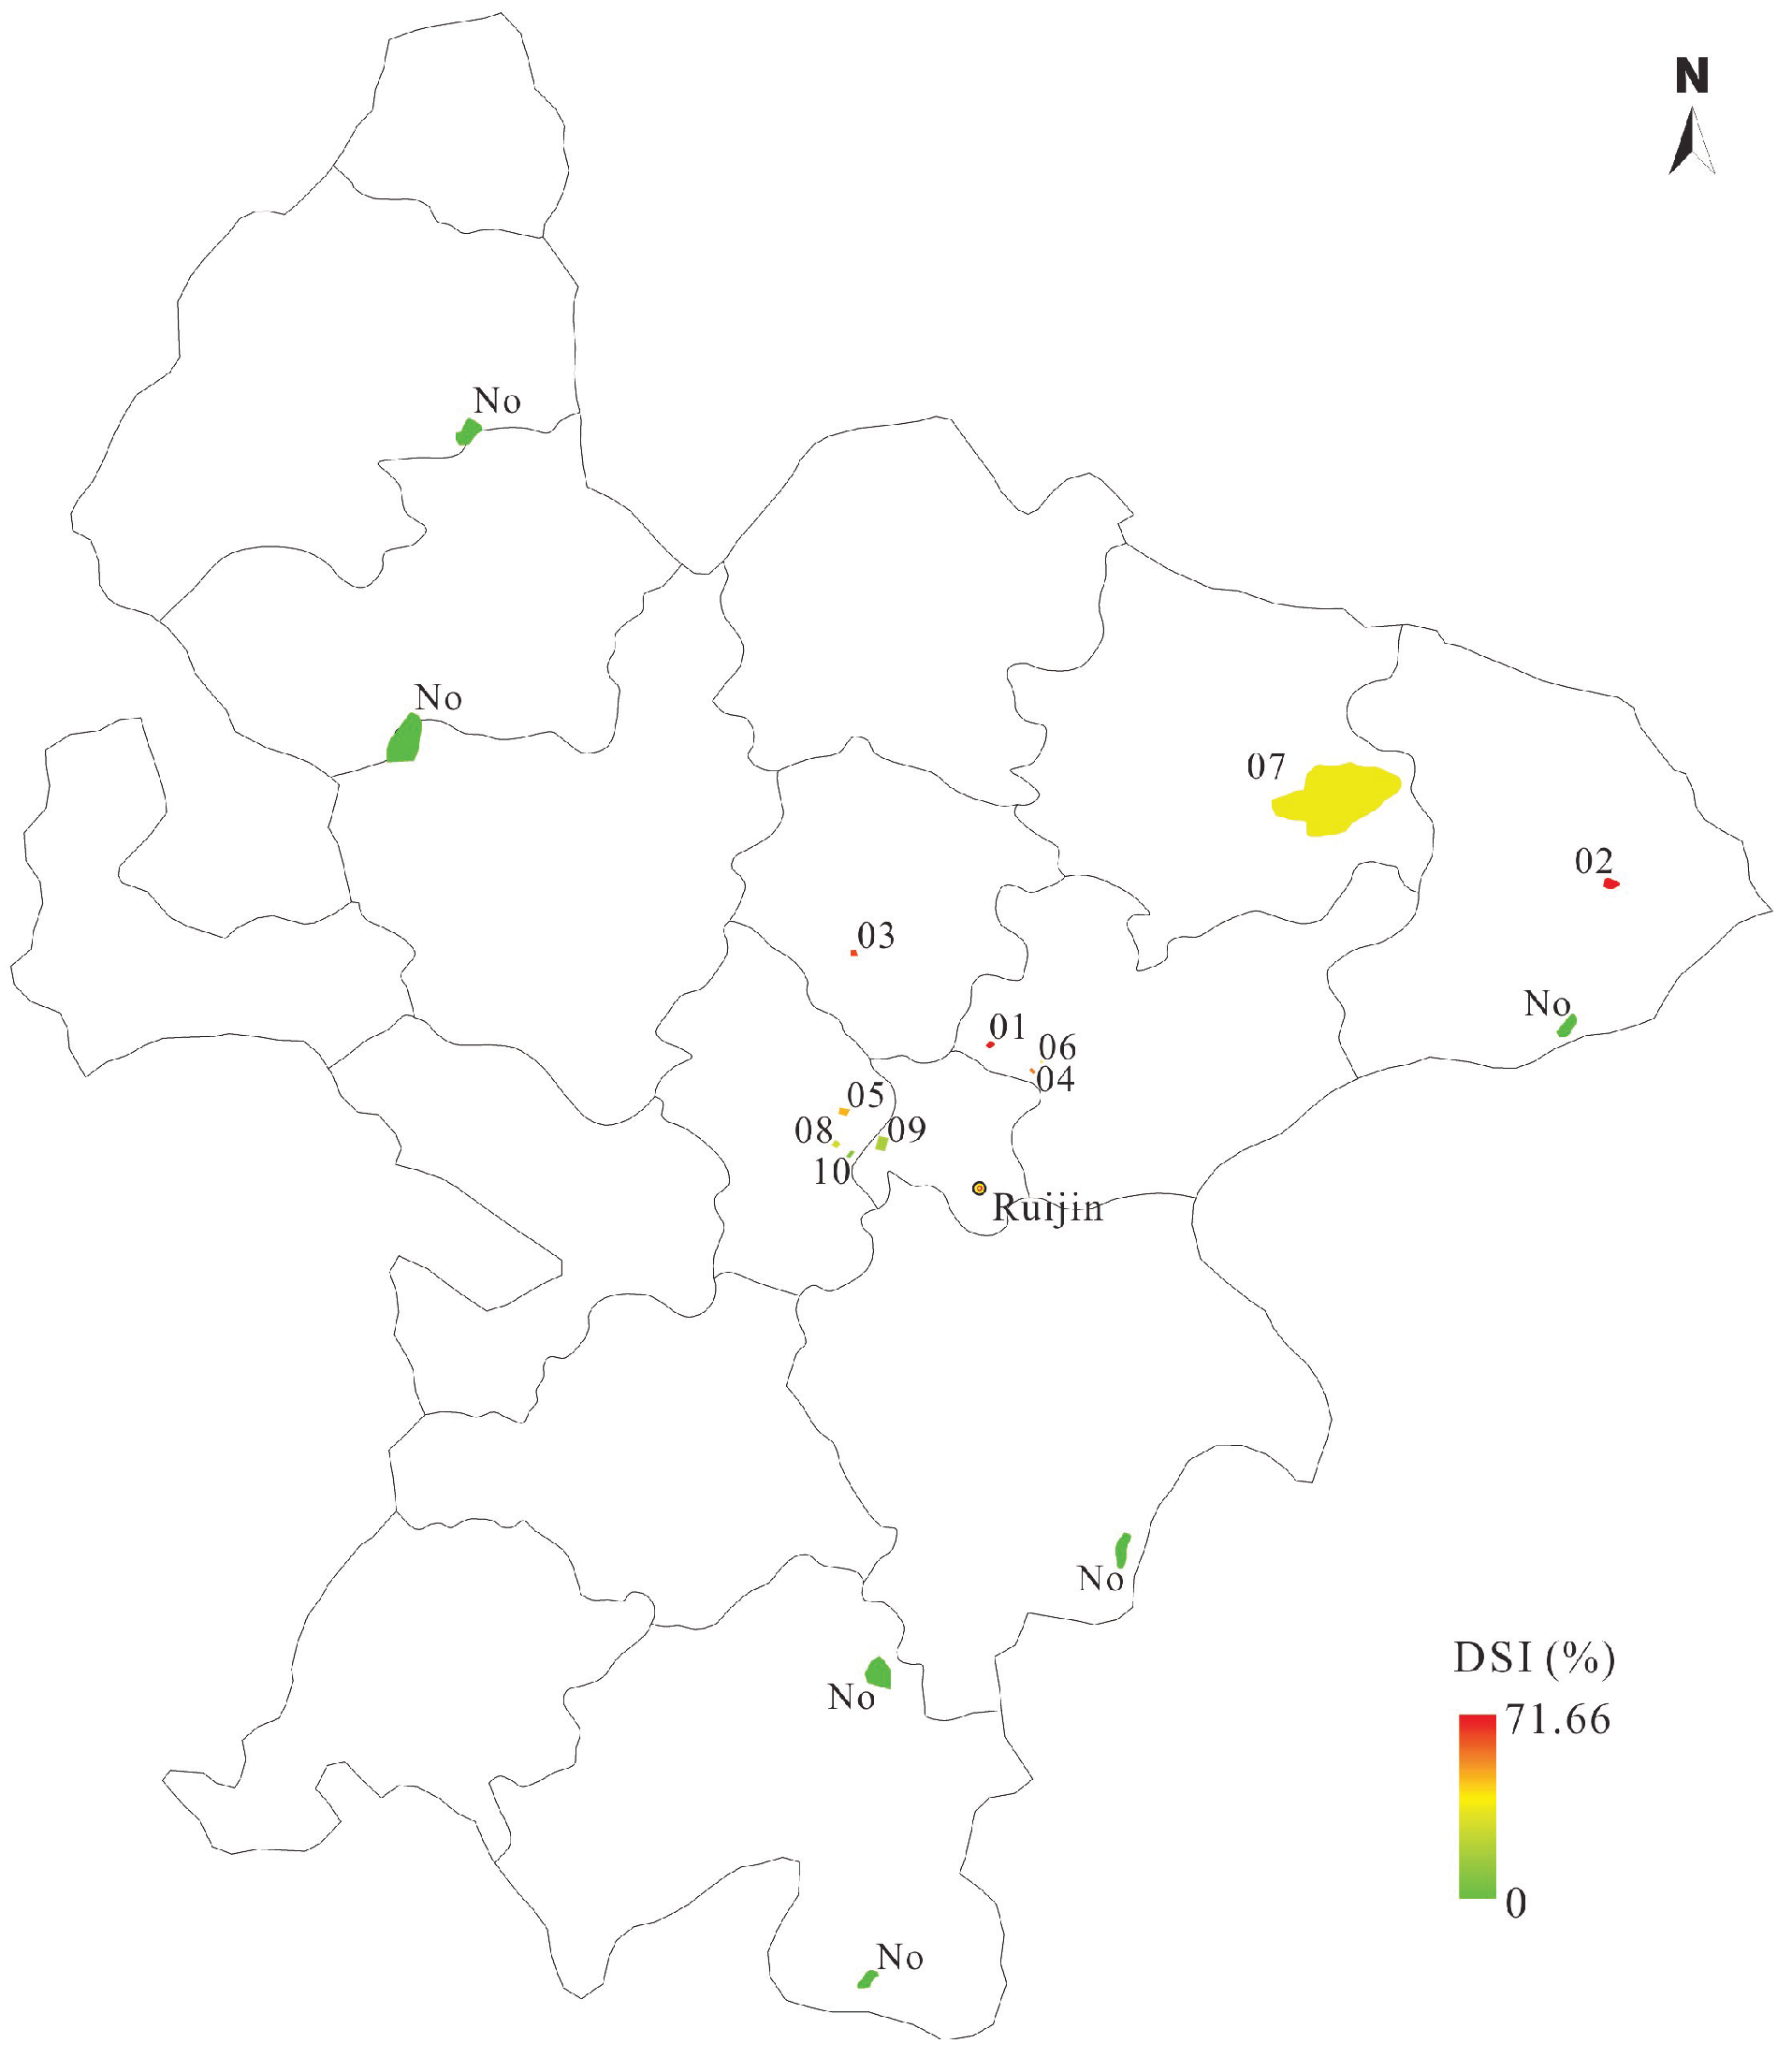
| Code | Scenic Spot | Area Covered (ha) | DSI (100%) |
|---|---|---|---|
| 01 | Polar Ocean Park | 5.53 | 71.66 |
| 02 | Wooden Fish Mountain | 19.95 | 71.46 |
| 03 | Hongjing | 6.21 | 67.94 |
| 04 | Cradle of the Republic | 2.80 | 67.72 |
| 05 | 2nd Soviet Congress of the Soviet Republic of China | 9.74 | 60.45 |
| 06 | Yeping | 0.67 | 53.98 |
| 07 | Arhat Rock | 869.39 | 44.18 |
| 08 | Happy Flower Sea of Red Capital | 5.80 | 40.41 |
| 09 | Historical Museum of Central Base | 19.95 | 33.53 |
| 10 | Former Site of the Central Revolutionary Military Commission | 4.40 | 10.92 |
| No | Non-Scenic Space | 456.92 | 0 |
| Grade | Interval of DSI (%) | Area Covered (km2) | Percentage of Land Occupied (%) |
|---|---|---|---|
| Extremely high | 0.72–1.00 | 254.25 | 10.45 |
| High | 0.52–0.72 | 388.92 | 15.99 |
| Medium | 0.32–0.52 | 431.70 | 17.75 |
| Low | 0.13–0.32 | 624.73 | 25.68 |
| Extremely low | 0.00–0.13 | 733.17 | 30.14 |
Disclaimer/Publisher’s Note: The statements, opinions and data contained in all publications are solely those of the individual author(s) and contributor(s) and not of MDPI and/or the editor(s). MDPI and/or the editor(s) disclaim responsibility for any injury to people or property resulting from any ideas, methods, instructions or products referred to in the content. |
© 2023 by the authors. Licensee MDPI, Basel, Switzerland. This article is an open access article distributed under the terms and conditions of the Creative Commons Attribution (CC BY) license (https://creativecommons.org/licenses/by/4.0/).
Share and Cite
Qin, Y.; Cao, L.; Li, W.; Darvishi Boloorani, A.; Li, Y.; Ke, X.; Soleimani, M.; Yu, Q.; Zhou, C. Suitability Assessment Method of Red Tourism Development Using Geospatial and Social Humanity Data: A Case Study of Ruijin City, East China. Sustainability 2023, 15, 8582. https://doi.org/10.3390/su15118582
Qin Y, Cao L, Li W, Darvishi Boloorani A, Li Y, Ke X, Soleimani M, Yu Q, Zhou C. Suitability Assessment Method of Red Tourism Development Using Geospatial and Social Humanity Data: A Case Study of Ruijin City, East China. Sustainability. 2023; 15(11):8582. https://doi.org/10.3390/su15118582
Chicago/Turabian StyleQin, Yaozu, Li Cao, Wenjing Li, Ali Darvishi Boloorani, Yuan Li, Xinxin Ke, Masoud Soleimani, Qian Yu, and Cuimin Zhou. 2023. "Suitability Assessment Method of Red Tourism Development Using Geospatial and Social Humanity Data: A Case Study of Ruijin City, East China" Sustainability 15, no. 11: 8582. https://doi.org/10.3390/su15118582