
An Maximum Power Point Tracker of Photovoltaic Module Arrays Based on Improved Firefly Algorithm


Department of Electrical Engineering, National Chin-Yi University of Technology, Taichung 41170, Taiwan
*
Author to whom correspondence should be addressed.
Sustainability 2023, 15(11), 8550; https://doi.org/10.3390/su15118550
Submission received: 30 March 2023
/
Revised: 19 May 2023
/
Accepted: 19 May 2023
/
Published: 24 May 2023
(This article belongs to the Special Issue Photovoltaic Solar Energy Utilization)
Abstract
:In this paper, an improved firefly algorithm (FA) was proposed for application on photovoltaic module arrays (PVMAs) with partial modules under shading so that the maximum power point tracking (MPPT) could be implemented. Firstly, a new model of high voltage step-up converter was developed for executing the MPPT of the PVMA. For the energy storage inductor of the developed converter, the architecture of the coupled inductor was adopted so that the converter switch did not need to operate under an excessive duty cycle, which could increase the voltage gain and reduce the ripple of the output voltage at the same time. To prevent shading on the partial modules within the PVMA and generate more than one peak on the power-voltage (P-V) output characteristic curve, where the conventional MPPT could only track the local maximum power point (LMPP) and reduce the output power of the PVMA, the maximum power tracker, based on the improved FA, was proposed in this paper. Such a tracker could perform an automatic online adjustment on the FA iteration parameters, according to the slope of the P-V output characteristic curve, for the PVMA and, at the same time, perform at 0.8 times of the maximum power point (MPP) voltage for the module array under standard test condition (STC), serving as the initial tracking voltage for implementing the global maximum power point tracking (GMPPT). Lastly, the actual test results were applied to verify that the proposed converter indeed contained a high voltage step-up and low-ripple output voltage. The improved FA could also track GMPP faster and further improve the power-generating efficiency of the PVMA.
1. Introduction
Generally, the conventional algorithms more commonly used for maximum power point tracking (MPPT) of PVMAs include the perturbation and observation (P&O) [1,2,3,4,5] and incremental conductance (INC) methods [6,7,8]. Although the two conventional methods could effectively track the maximum power point (MPP) of PVMAs under normal working conditions, when shading occurs on the photovoltaic modules, these conventional methods could only possibly track the local maximum power point (LMPP) instead of the global maximum power point (GMPP), the power generating efficiency of the PVMA was therefore reduced.
Regarding multiple peak values generated from the P-V characteristic curve, due to the shading of certain modules in the PVMA over recent years, many scholars have devoted their studies to MPPT. The common smart algorithms currently include fuzzy control [9,10,11], neural network (NN) [12,13,14], grey wolf optimization (GWO) [15,16,17], differential evolution (DE) [18,19,20,21], artificial bee colony (ABC) algorithm [22,23,24], firefly algorithm (FA) [25,26,27] and teaching-learning-based optimization [28]. Among them, the fuzzy control method consists of fuzzy inference, fuzzy logic, fuzzification, defuzzification, and fuzzy control. The method is implemented by the fuzzification of the precision values, measured externally into fuzzy values, and utilizing the membership function (MF) to reflect the membership characteristics. However, the control process of such a method is more complicated and the magnitude of computation is larger and not easy to realize. The neural network (NN) [10,11] was an information processing technology applied for simplifying the non-linear and complicated models by imitating the biological NN, which was extensively utilized in artificial intelligence (AI) and deep learning. However, such methods required additional illuminometers and the calculation of the correct fill factor (FF) [29] when applied to conduct the MPPT for the PVMAs, which may easily cause additional expenses and precision issues. The grey wolf algorithm is a swarm intelligence algorithm inspired by the hunting behavior of grey wolves and proposed for the maximum power point tracking of the PVMAs [15,16,17]. Although the grey wolf algorithm provided advantages, such as a simple structure and fewer parameters required during the process of search optimization, the disadvantages included the possibility of being stuck in the local optimum, poor precision, and slow convergence. The DE [18,19,20,21] method was an inspired random search optimization method based on swarm difference and is similar to the genetic algorithm (GA). The method adopted real number coding on certain race data, which achieved the capability of the global search optimum through the process of differential calculation on a variance and survival strategy from the one-on-one competition. However, a problem included an individual mutation that required calculations of multiple formulae. This increased tracking time and inadequate parameter setting may easily cause excessively fast convergence and the possibility of being stuck in local optimum. Due to the fewer number of race individuals, the new fitness value generated was worse than the original fitness value, which caused difficulty in renewal and failure of converging to optimum. The ABC algorithm [22,23,24] was a method that mimicked the foraging behavior of bees in nature for problem-solving. Such an algorithm was bionic with swarm intelligence and this global optimization algorithm sent out the worker bees to look for food sources, which would optimize the process of swarm foraging by allowing other bees to learn the location and orientation via dancing. Since the worker bees adopted random values when looking for food sources, the searching capability was rather unstable. Moreover, upon searching for food sources, the quantity of worker bees sent out was directly proportional to the search time; the more the worker bees spent searching, the longer the time they needed. Therefore, despite the fact that the ABC algorithm provided advantages, such as high stability and fewer parameters required, the problem of pre-mature convergence existed. The inspiration for the FA [25,26,27] mainly came from the flickering behavior of fireflies. The flashing signal was used to attract the other fireflies and the level of attraction was directly proportional to the luminance. The fireflies with higher luminance would generate greater attraction for fireflies nearby. When the luminance became the same, the fireflies would move randomly and the brightest firefly would be the function optimum. The advantages included fewer parameters, a more extensive range of searching, fast convergence, and stable performance, while the disadvantages included ease of being stuck in the local optimum, which occurred more easily on a multi-dimensional problem at a higher dimension especially. Teaching-learning-based optimization [28] can be used to perform continuous and complex searches and entails the configuration of only a few parameters. Because its principle is easy to understand, teaching-learning-based optimization has been extensively used in system optimization. However, because each learner has a variable performance, the limited range of parameters (i.e., teaching factors) may result in the use of inappropriate parameters, thereby causing poor learning outcomes and an excessively long tracking response.
Based on the reasons mentioned above, the improved FA was developed in this paper for the MPPT of the PVMAs when the partial modules experienced shading and malfunction. With the advantages of fewer setting parameters, a simple structure, and principles easy to comprehend, if the initial voltage for the MPPT was set to 0.8 times of the MPPT voltage for the PVMAs, under an STC, and the parameters for the step factor of the MPPT were adjusted according to the slope of the P-V characteristic curve for the PVMAs, the tracking time could be reduced extensively. This could swiftly track the global optimum without being stuck with the local optimum when the PVMAs experienced partial shading.
In addition, along with the progressive development of power electronics, converters for such technologies nowadays have been applied in photovoltaic power-generating systems extensively for MPPT, so the power-generating efficiency of the PVMAs can be improved. However, for a conventional DC-DC converter [29,30,31,32] with the switch operating within the normal range of the duty cycle, the voltage conversion ratio would be limited. To generate a greater DC output voltage, the duty cycle for the switch component should be greater, so the nominal current of the switch would increase relatively. Should the switch operate under a high-duty cycle over a long term, there would be a risk of damaging the switch component due to overheating. In view of this, many scholars had proposed the architecture of a high-voltage step-up converter over the recent years. Although the turn ratio for the coupled inductor [33,34,35,36,37] could be utilized to obtain a greater voltage gain, the excessively high turn ratio for the coupled inductor would increase the ripple of the output voltage. To eliminate the disadvantages of the high-voltage step-up converter mentioned above, the architecture of an inductor-coupled, high-voltage step-up converter [33,34,35,36,37] was proposed in this paper, which used a coupled inductor to replace the general inductor for enhancing the voltage conversion ratio for the converter. At the same time, the clamp capacitor in the circuit was applied to reduce the output voltage ripple for the converter, which further enhanced the converter’s performance. In the paper, the actual test results were applied to verify that the proposed converter indeed provided a better conversion performance.
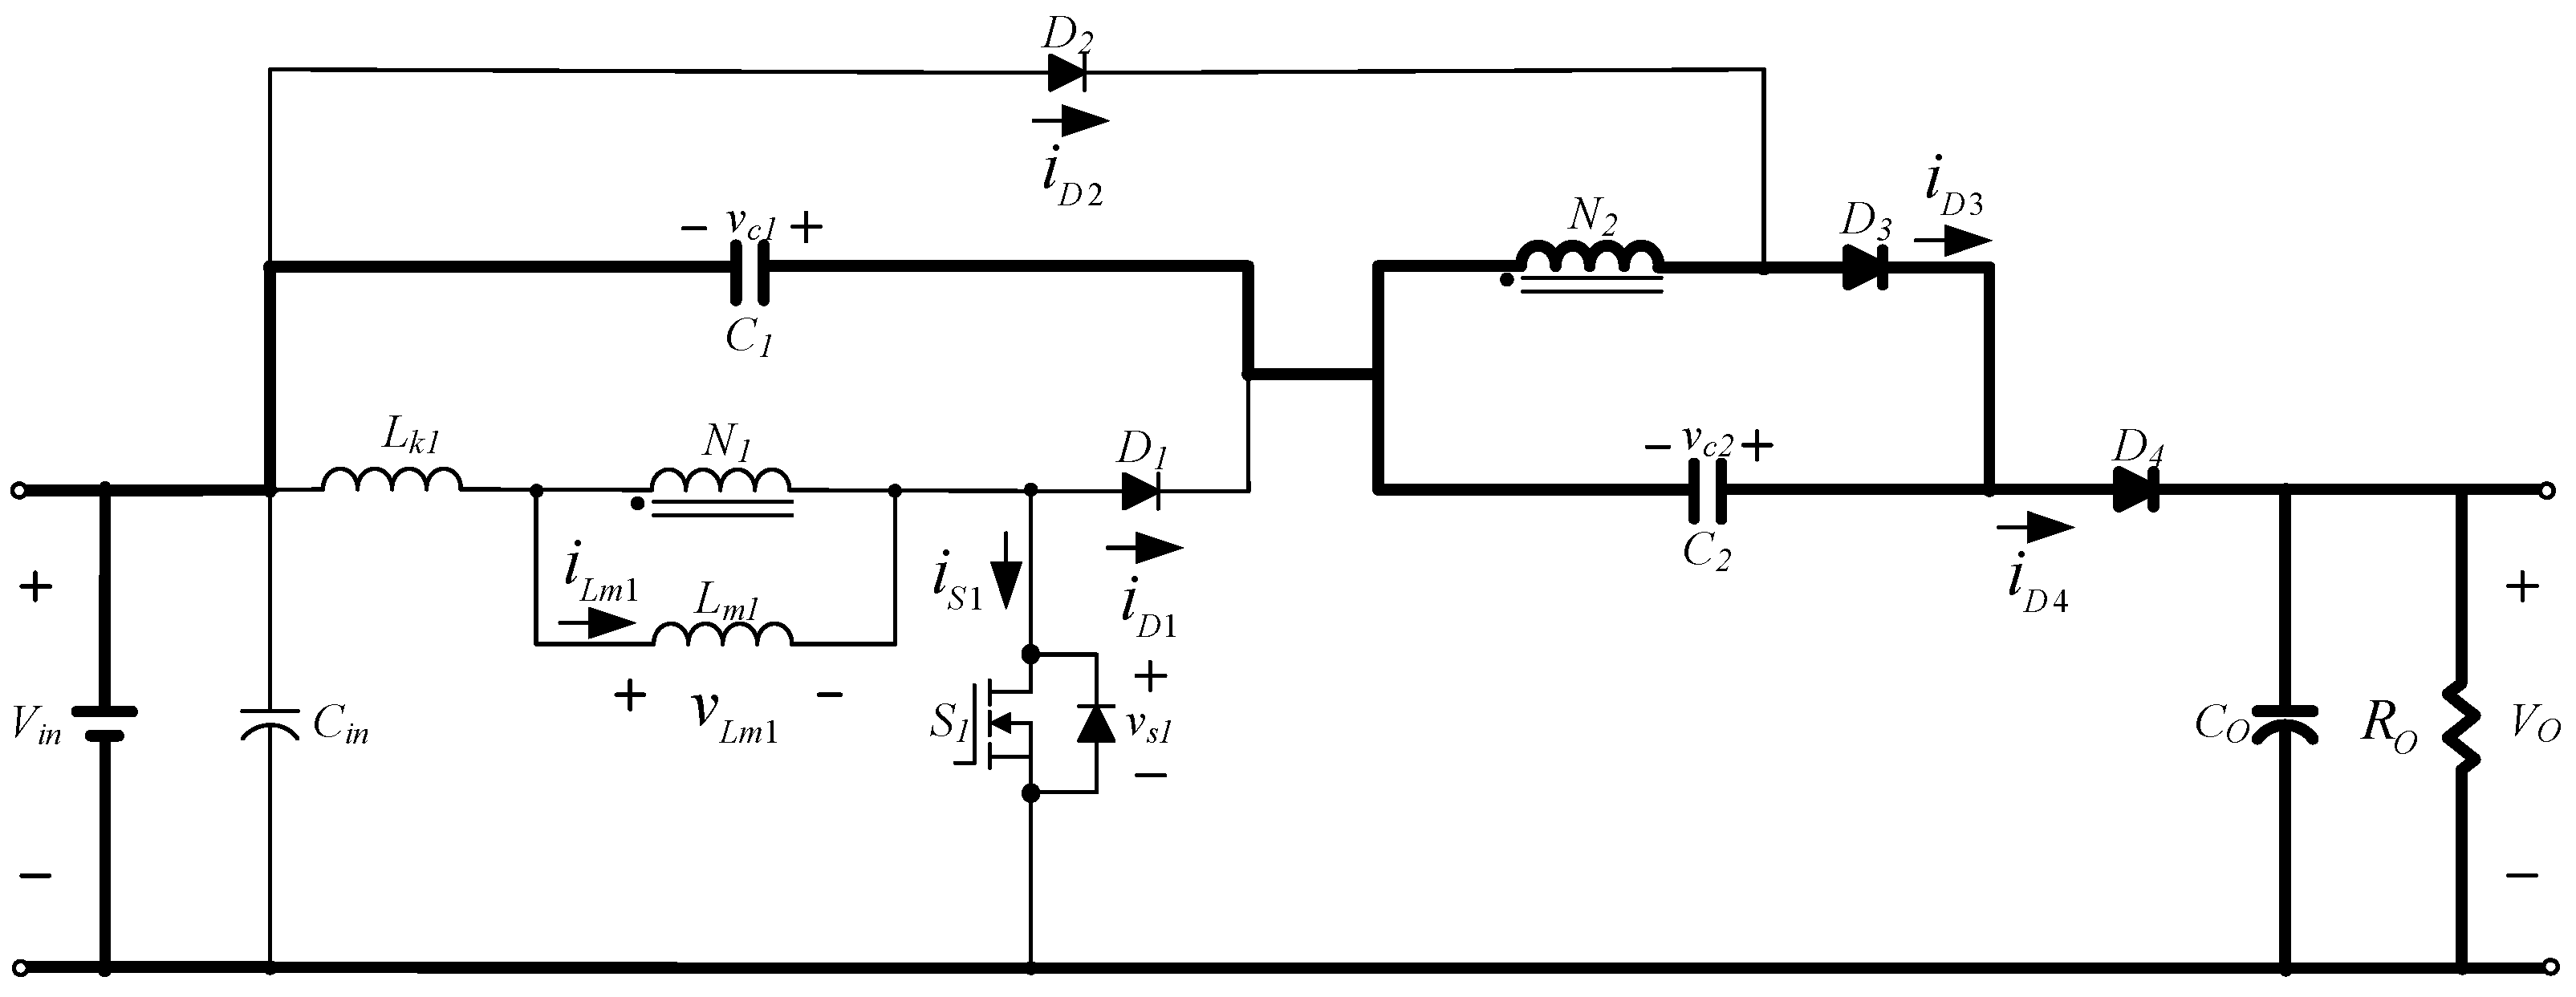
2. High Voltage Step-Up Converter
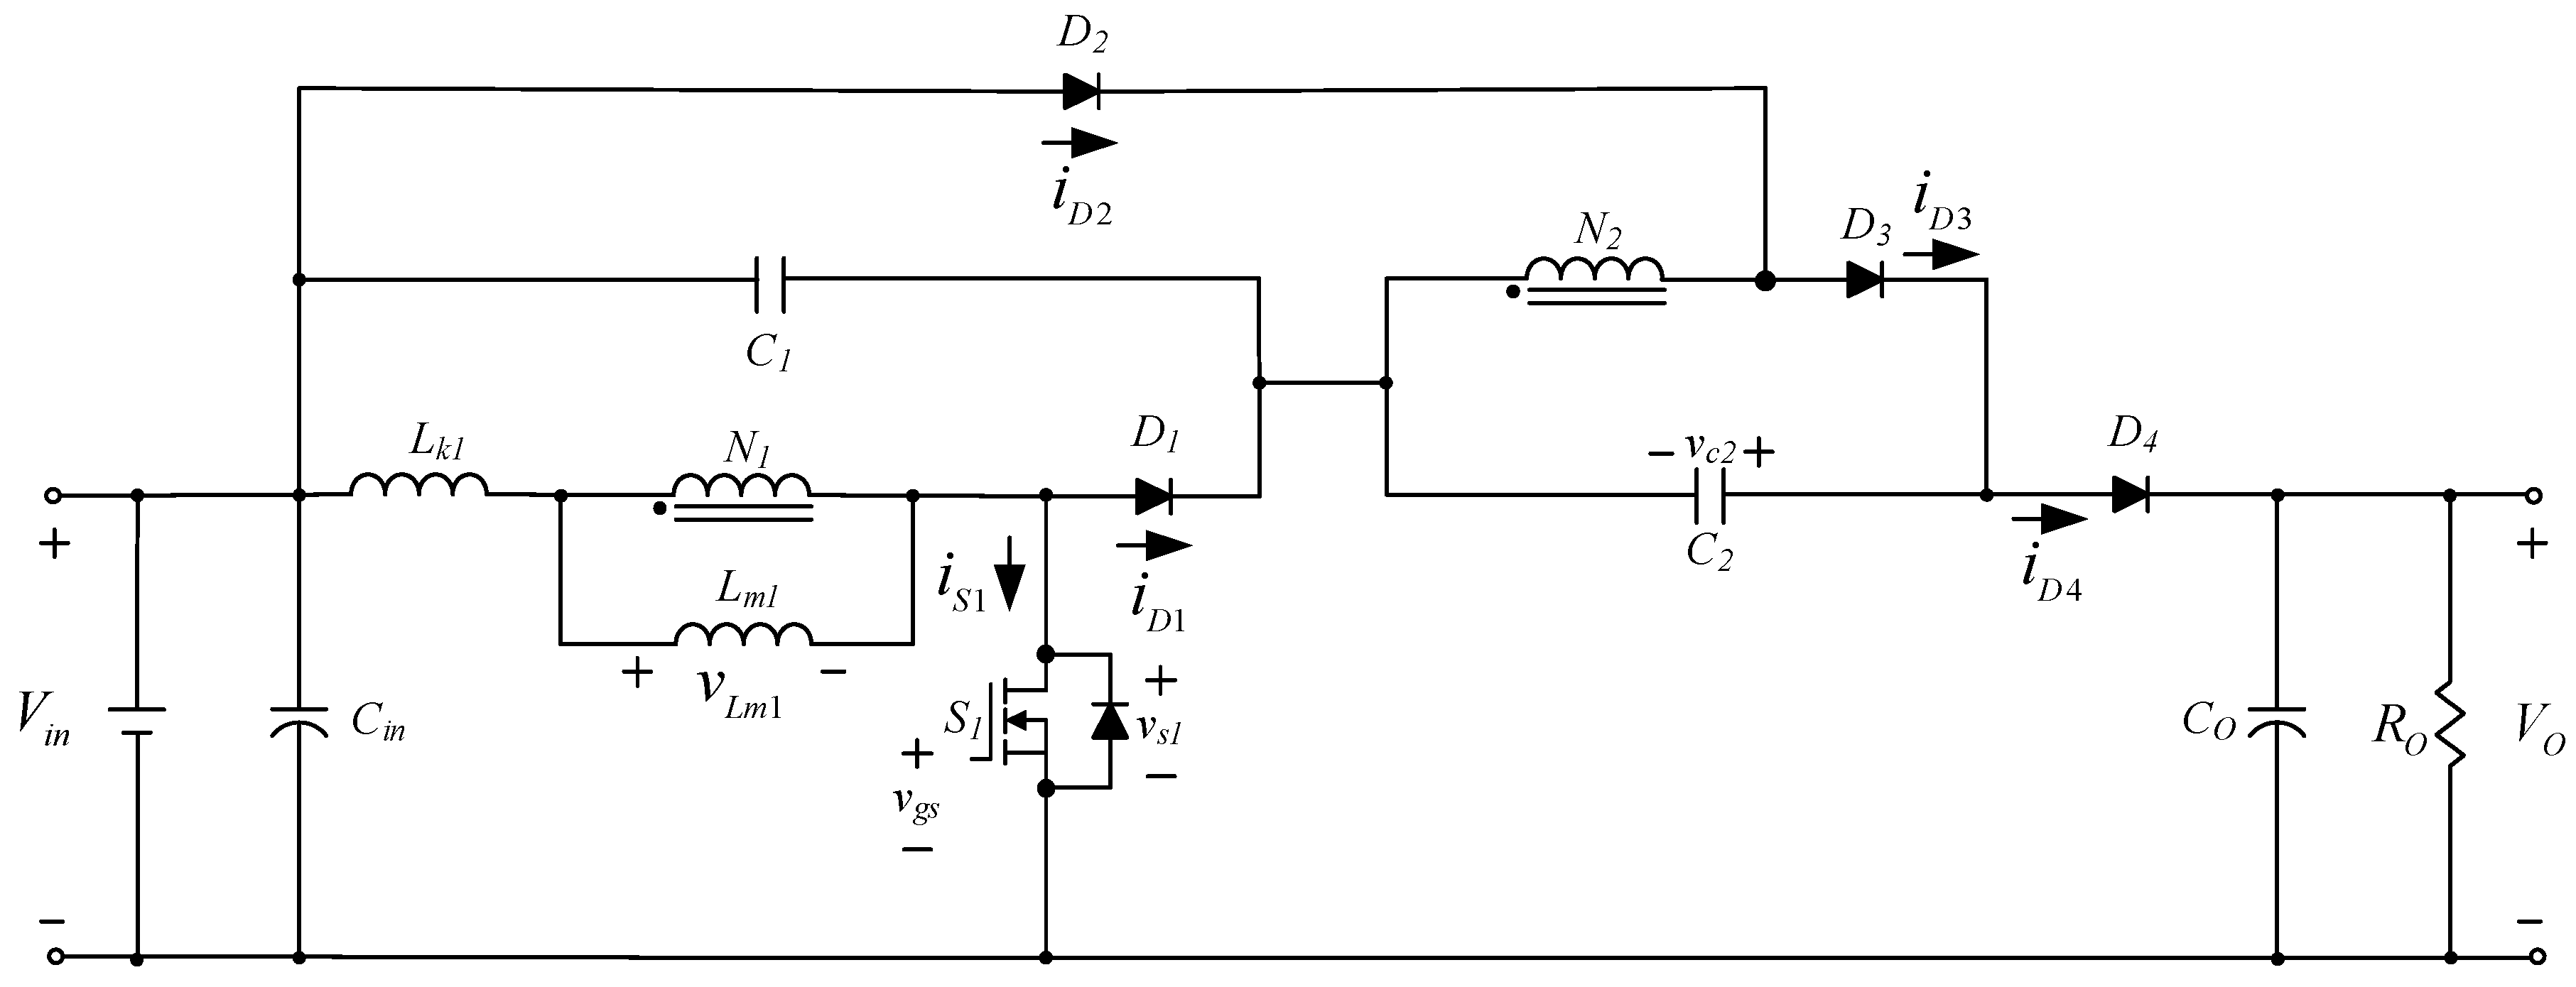
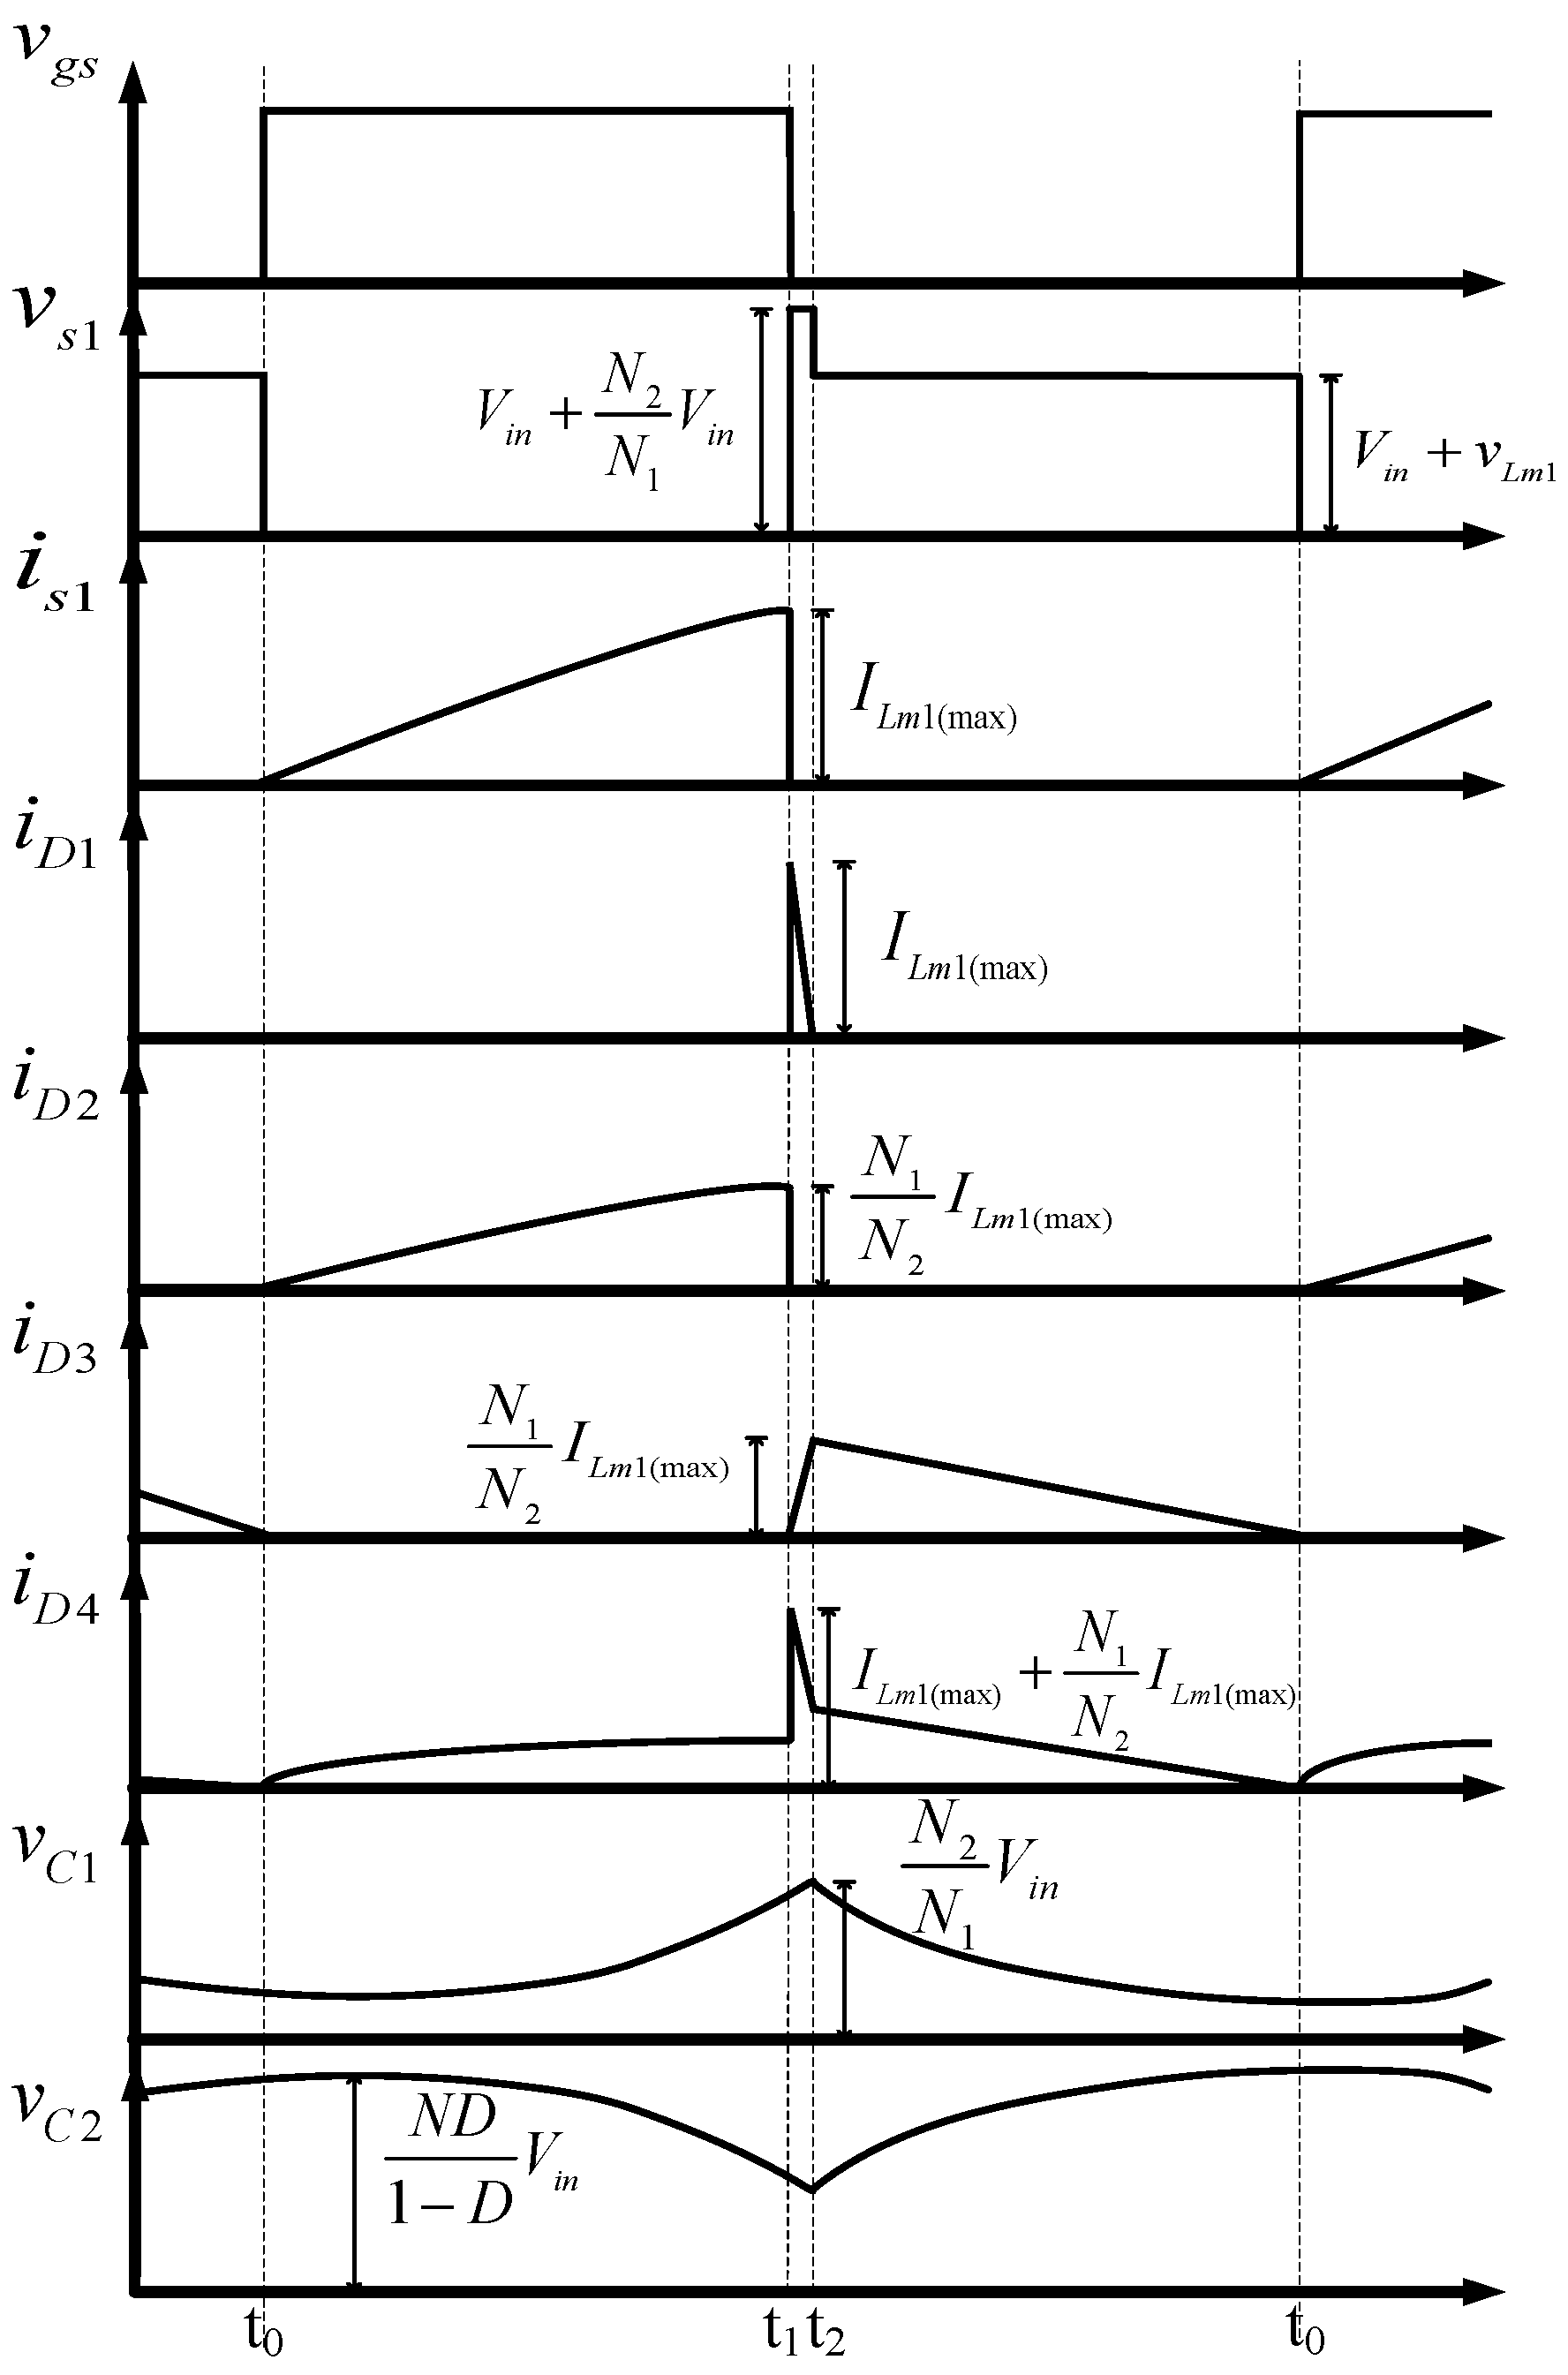
The nominal input voltage () for the high-voltage step-up converter developed under this paper was 80 V, the nominal output voltage () was 400 V, and the circuit architecture is shown in Figure 1. The working principles of the overall circuit are split into three operating modes, which operated on the switch waves of each component under various modes (shown in Figure 2, respectively).
To simplify the derivation process, the following two assumptions were made in advance: All components were ideal, thus, there was no conduction voltage drop and was neglected. In one complete operation period cycle of the converter, the ratio between the closed duration of the switch and T was defined as the “duty cycle” D, which is expressed in Equation (1).
- (1)
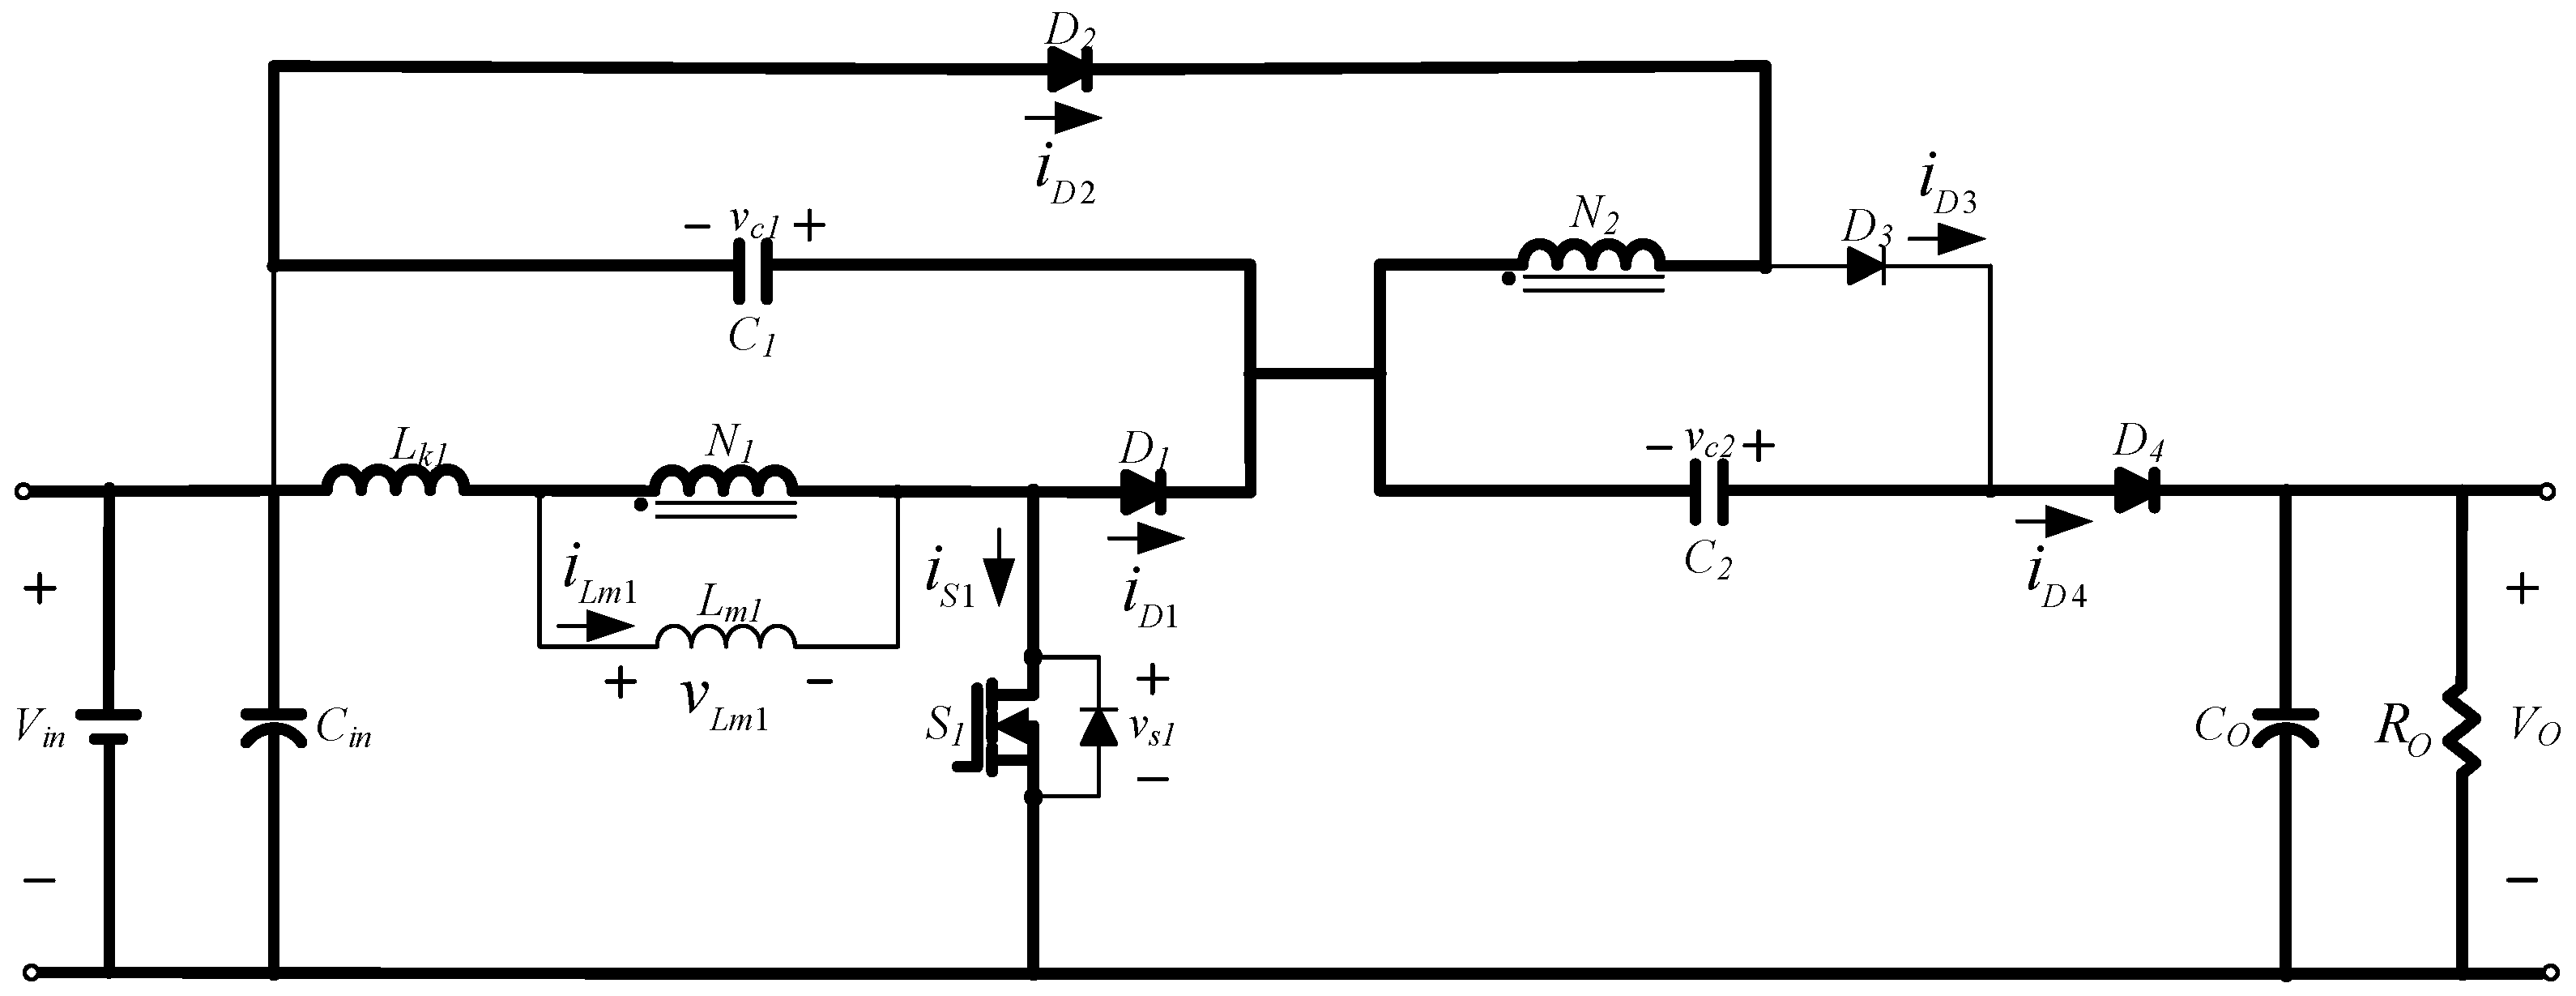
- Operating Mode 1 ()
Upon entry into operating Mode 1, the status of the circuit conduction is shown in Figure 3. Thus, the main switch () entered from termination into conduction and the input voltage () crossed over the primary side of the coupled inductor (), where , while the current of the coupled inductor increased linearly and stored energy. For the secondary side of the coupled inductor (), its current would store energy towards capacitor , due to the voltage polarity of the coil induction, and diode would undergo forward induction. Such a mode would continue until the main switch () entered from conduction to termination, thus the conduction time for the main switch () was . Within the conduction time of for the main switch (), the ascending amount of the inductor current can be derived in Equation (2); therefore, the maximum value (ILm1(max)) and minimum value (ILm1(min)) of the current for the magnetized inductor can be derived in Equations (3) and (4), respectively.
- (2)
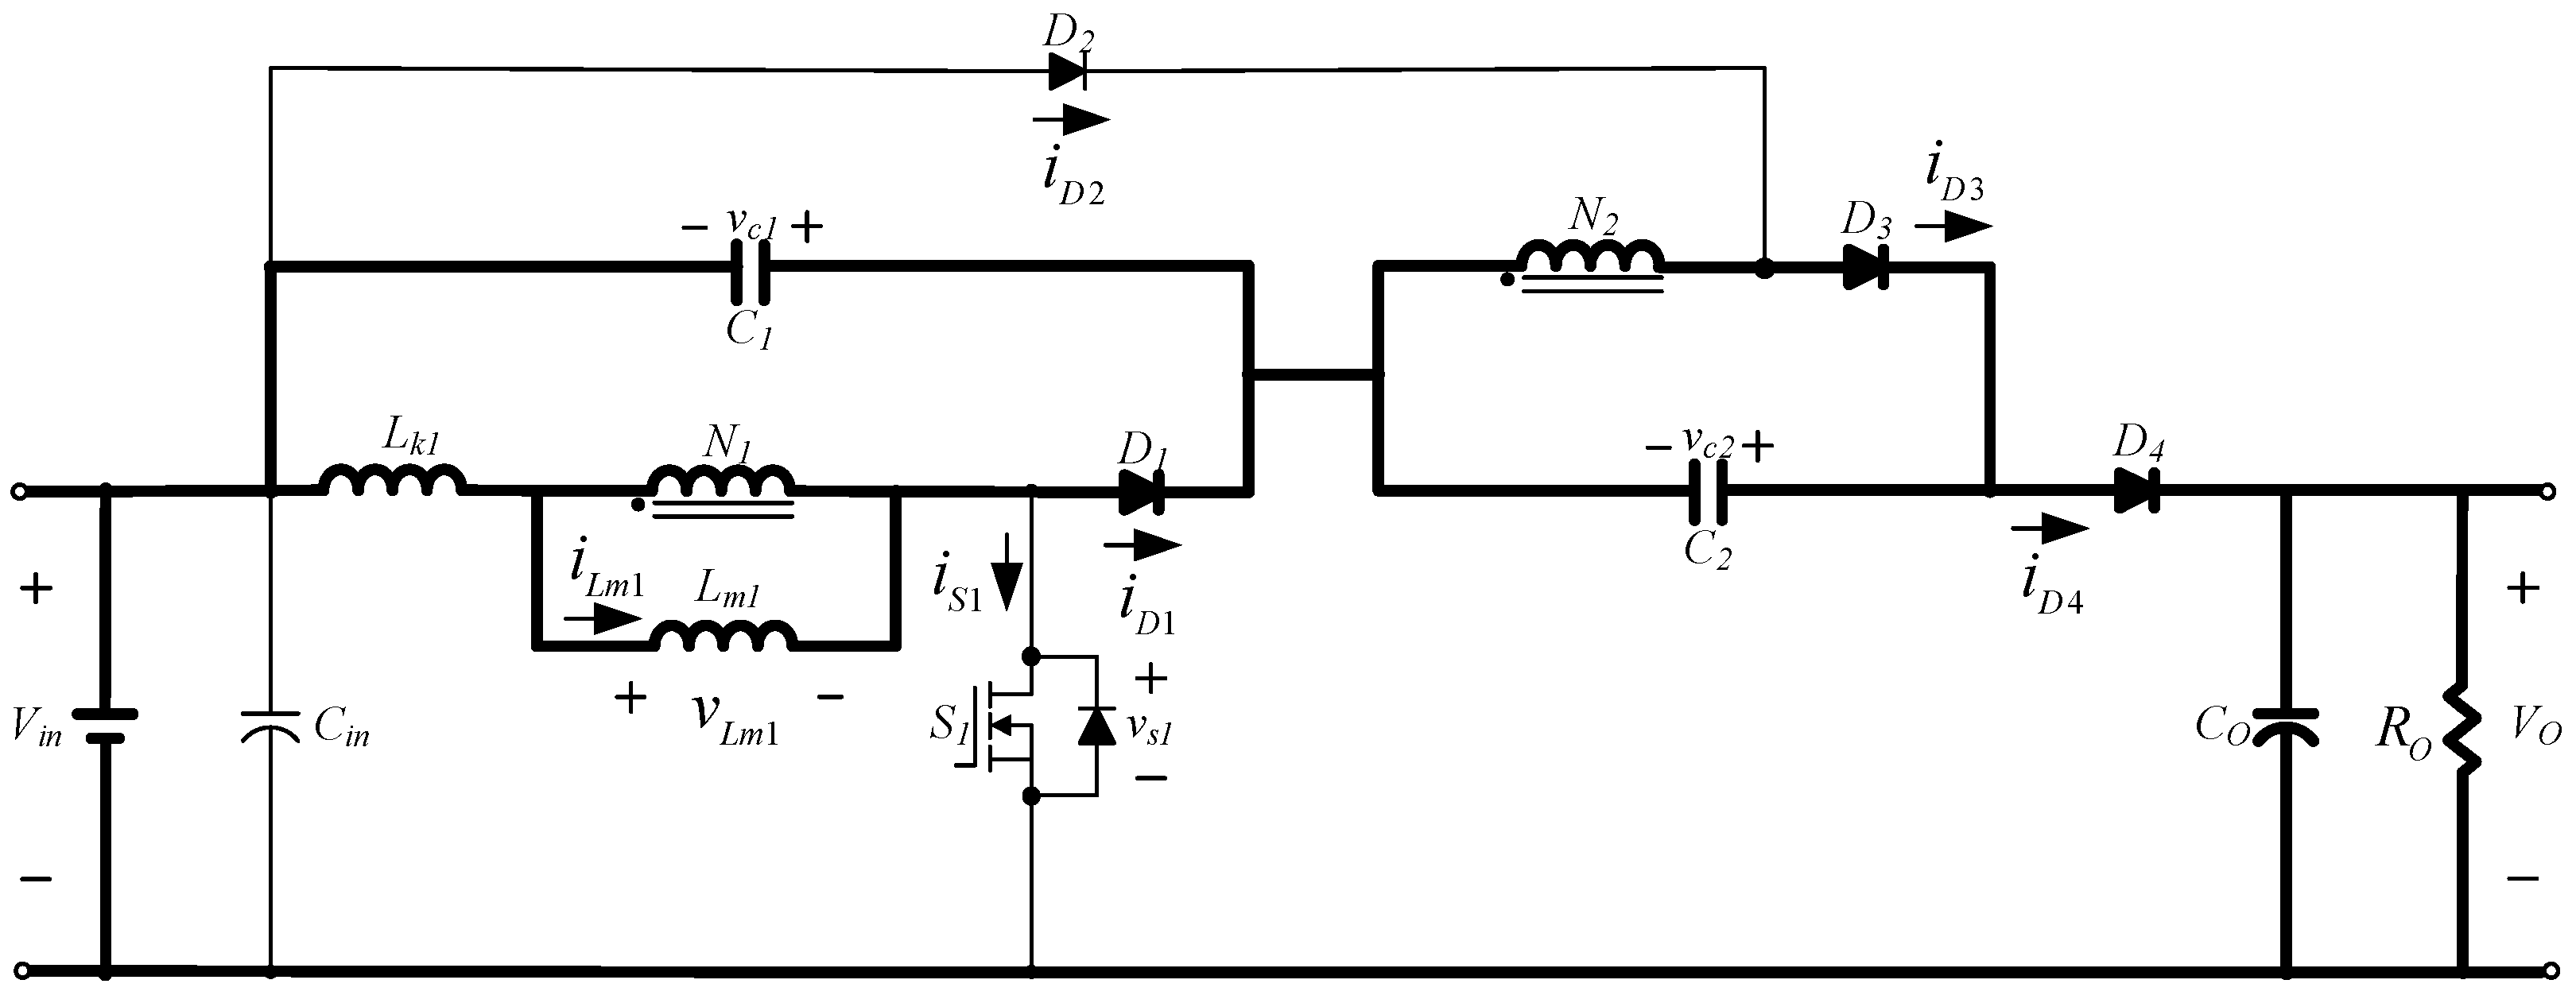
- Operating Mode 2 ()
Upon entry into operating Mode 2, the status of the circuit conduction is shown in Figure 4, where the main switch () entered from conduction into termination, diode underwent forward conduction, and the primary side of the coupled inductor () released energy into capacitor . Due to the inverse polarity for induction at the secondary side of the coupled inductor, , ; thus, diode underwent forward conduction and stored energy in capacitor . Such a mode would continue until the primary side of the coupled inductor () released energy to zero.
- (3)
- Operating Mode 3 ()
Upon entry into operating Mode 3, the status of the circuit conduction is shown in Figure 5, where the main switch () was still maintained in the off state. Thus, the energy of and were transferred to the loading end via the diode () to complete the circuit operating mode of one complete cycle, thus, the off time of the main switch was .
Based on the inductor volt-second balance theory, it could therefore be derived that:
After compiling Equation (5), could be derived as:
Since the output voltage could be expressed as:
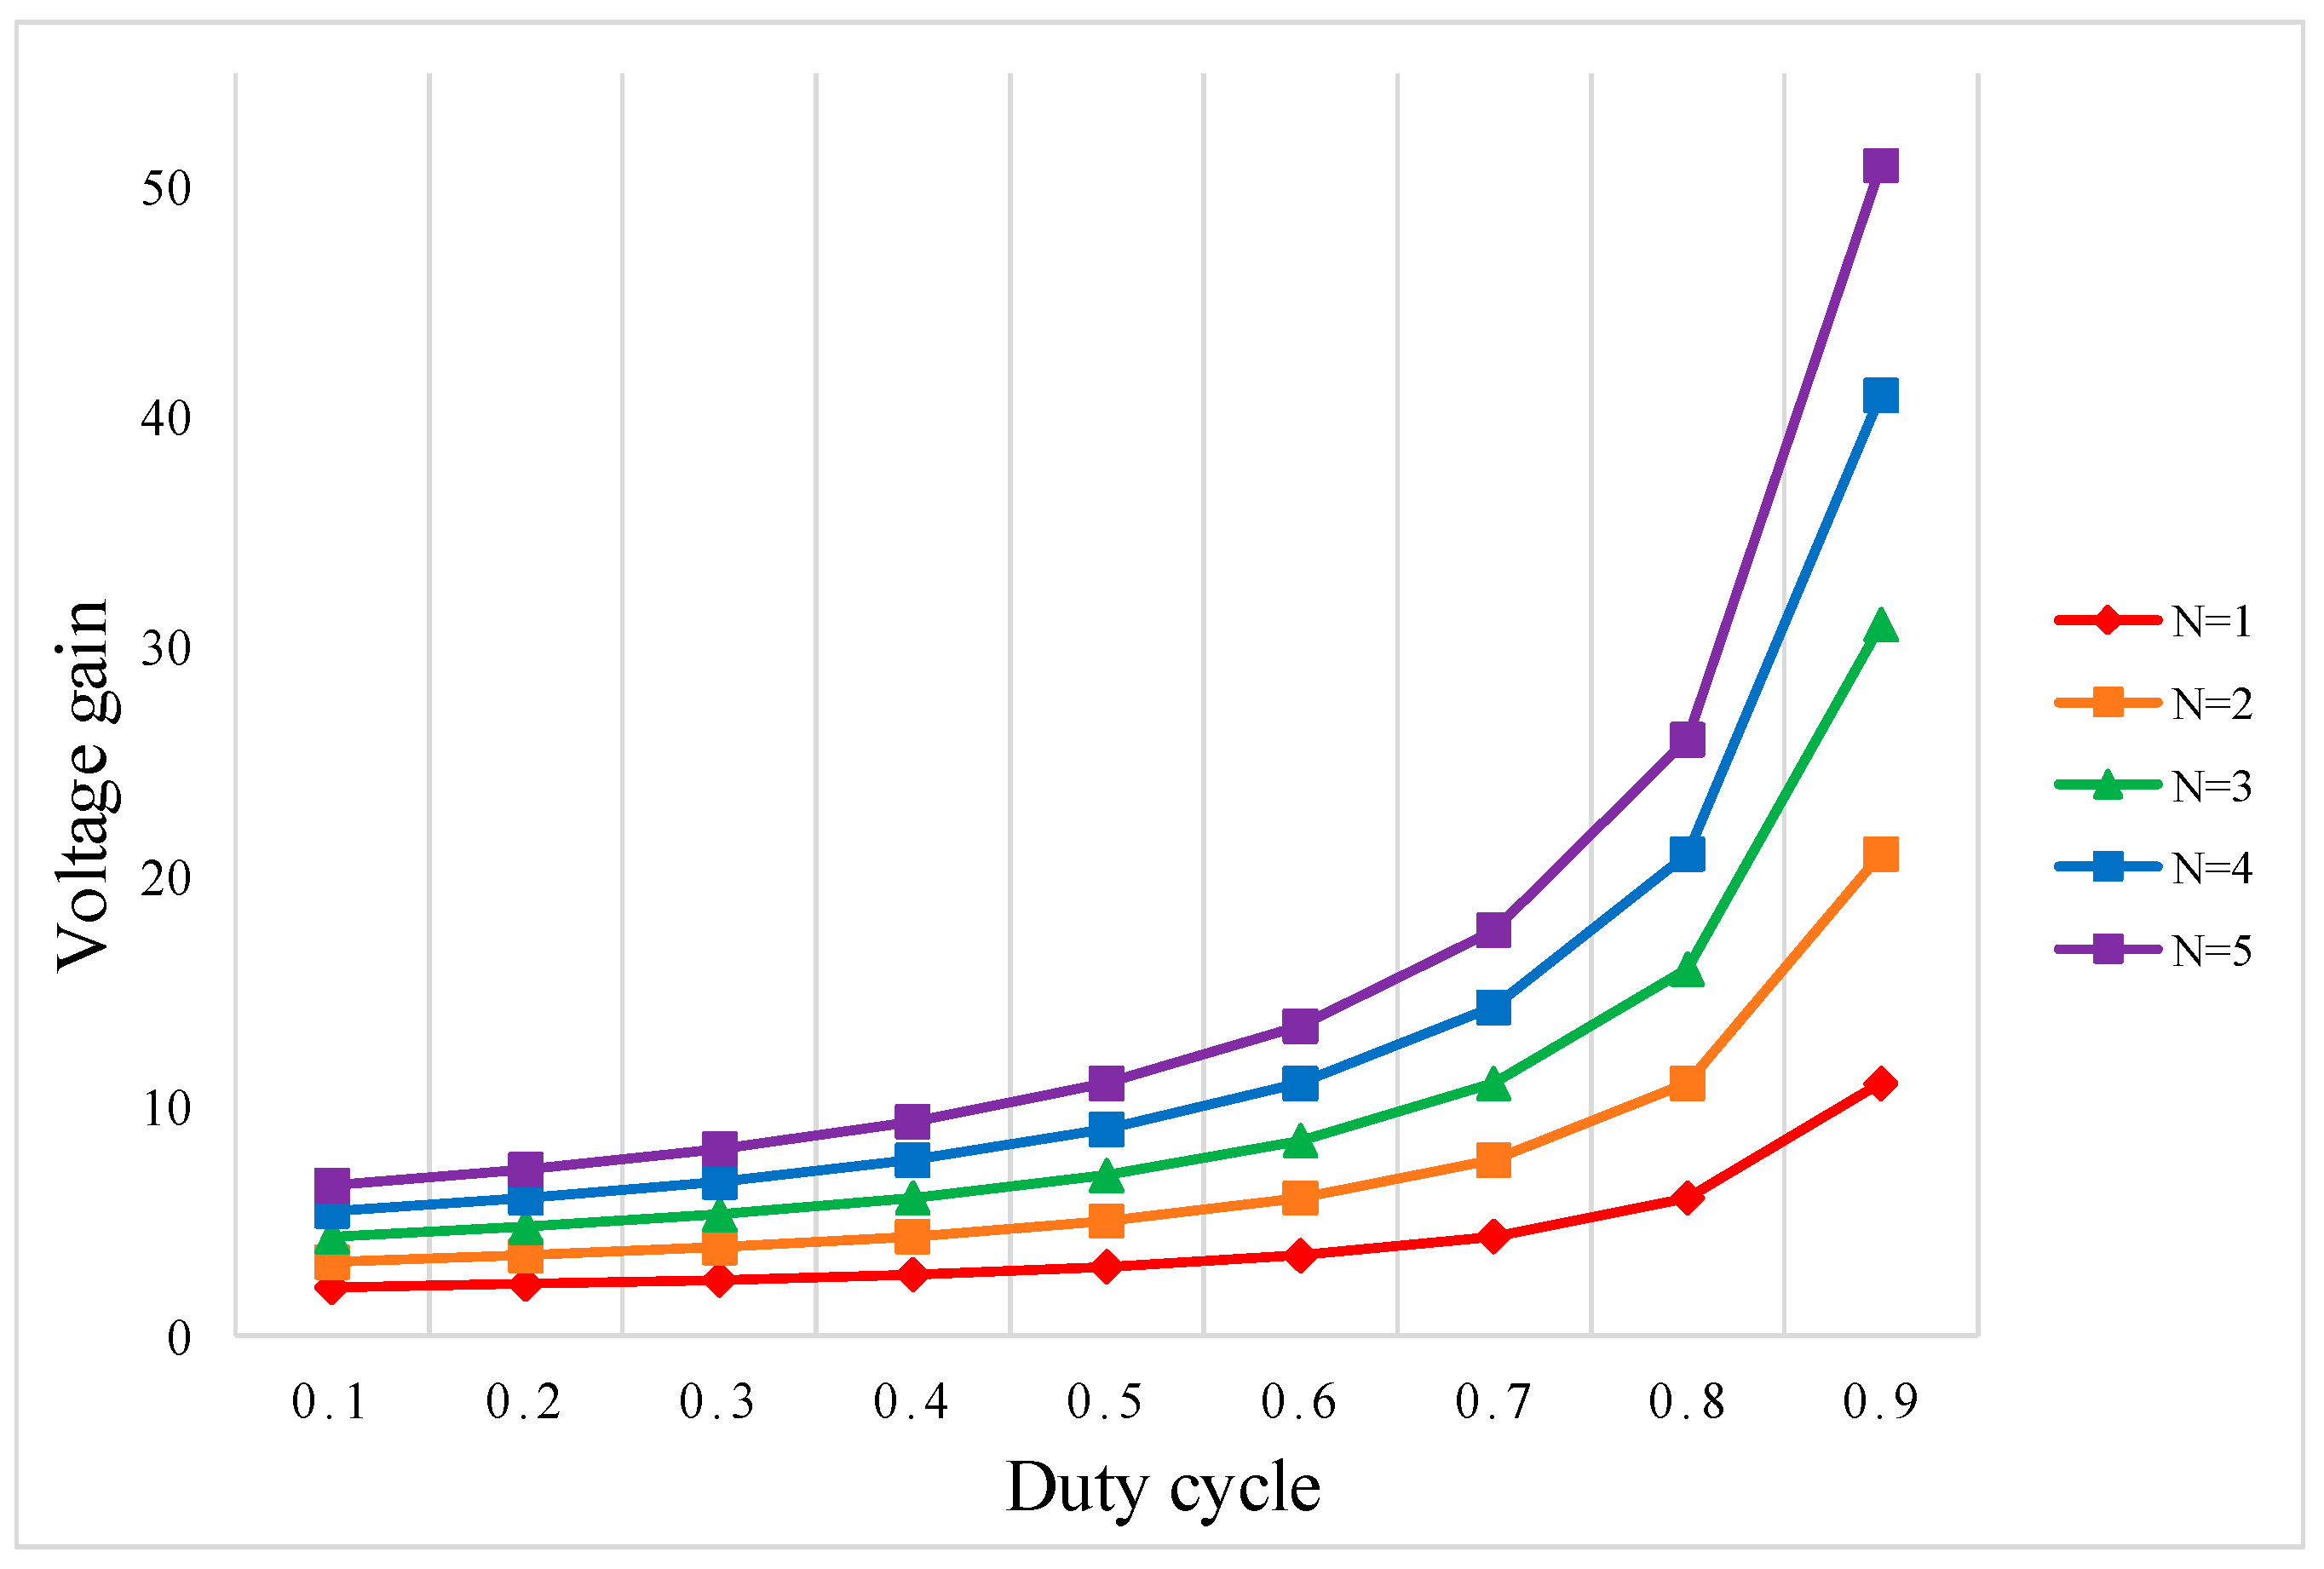
The voltage conversion ratio for such a circuit could be derived as:
For the high-voltage step-up converter proposed in this paper, the nominal output power was 300 W, the relevant parameters are shown in Table 1 and the parameter specifications of the circuit components are shown in Table 2.
From Equation (8), the relationship between the voltage gain and duty cycle for the proposed high step-up converter can be derived in Figure 6.
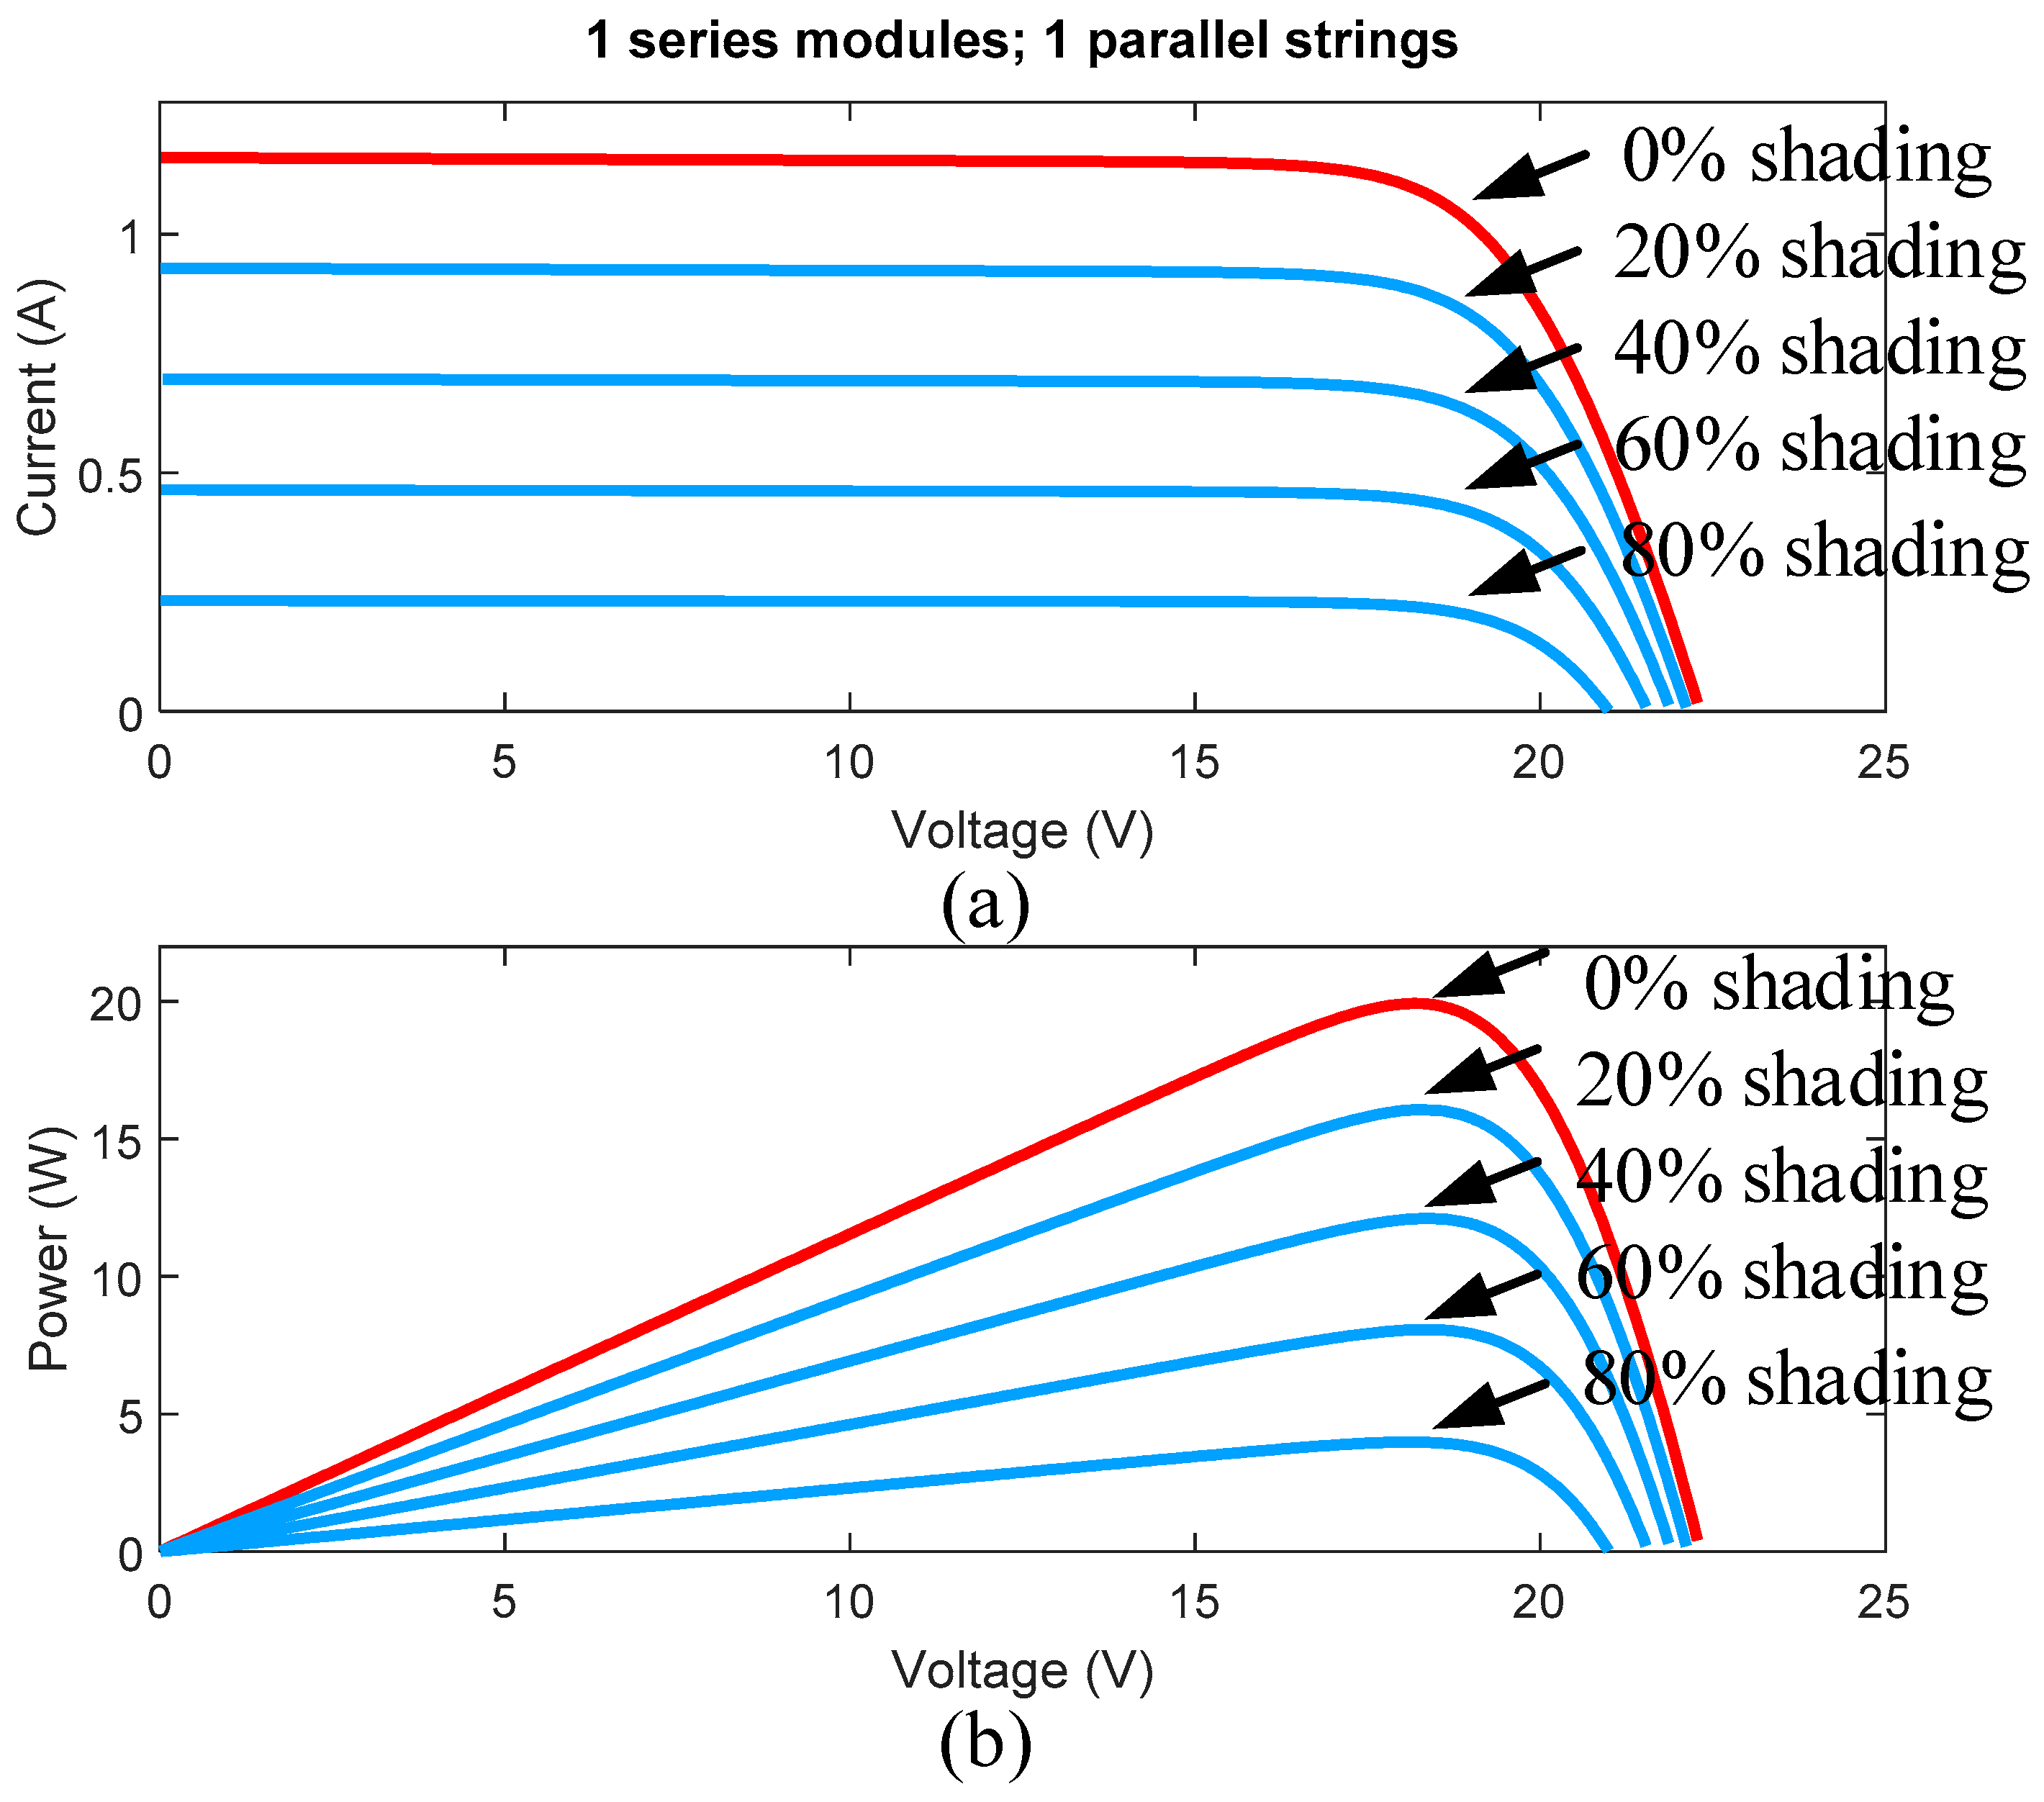
3. PVMA Output Characteristics under Different Shading Conditions
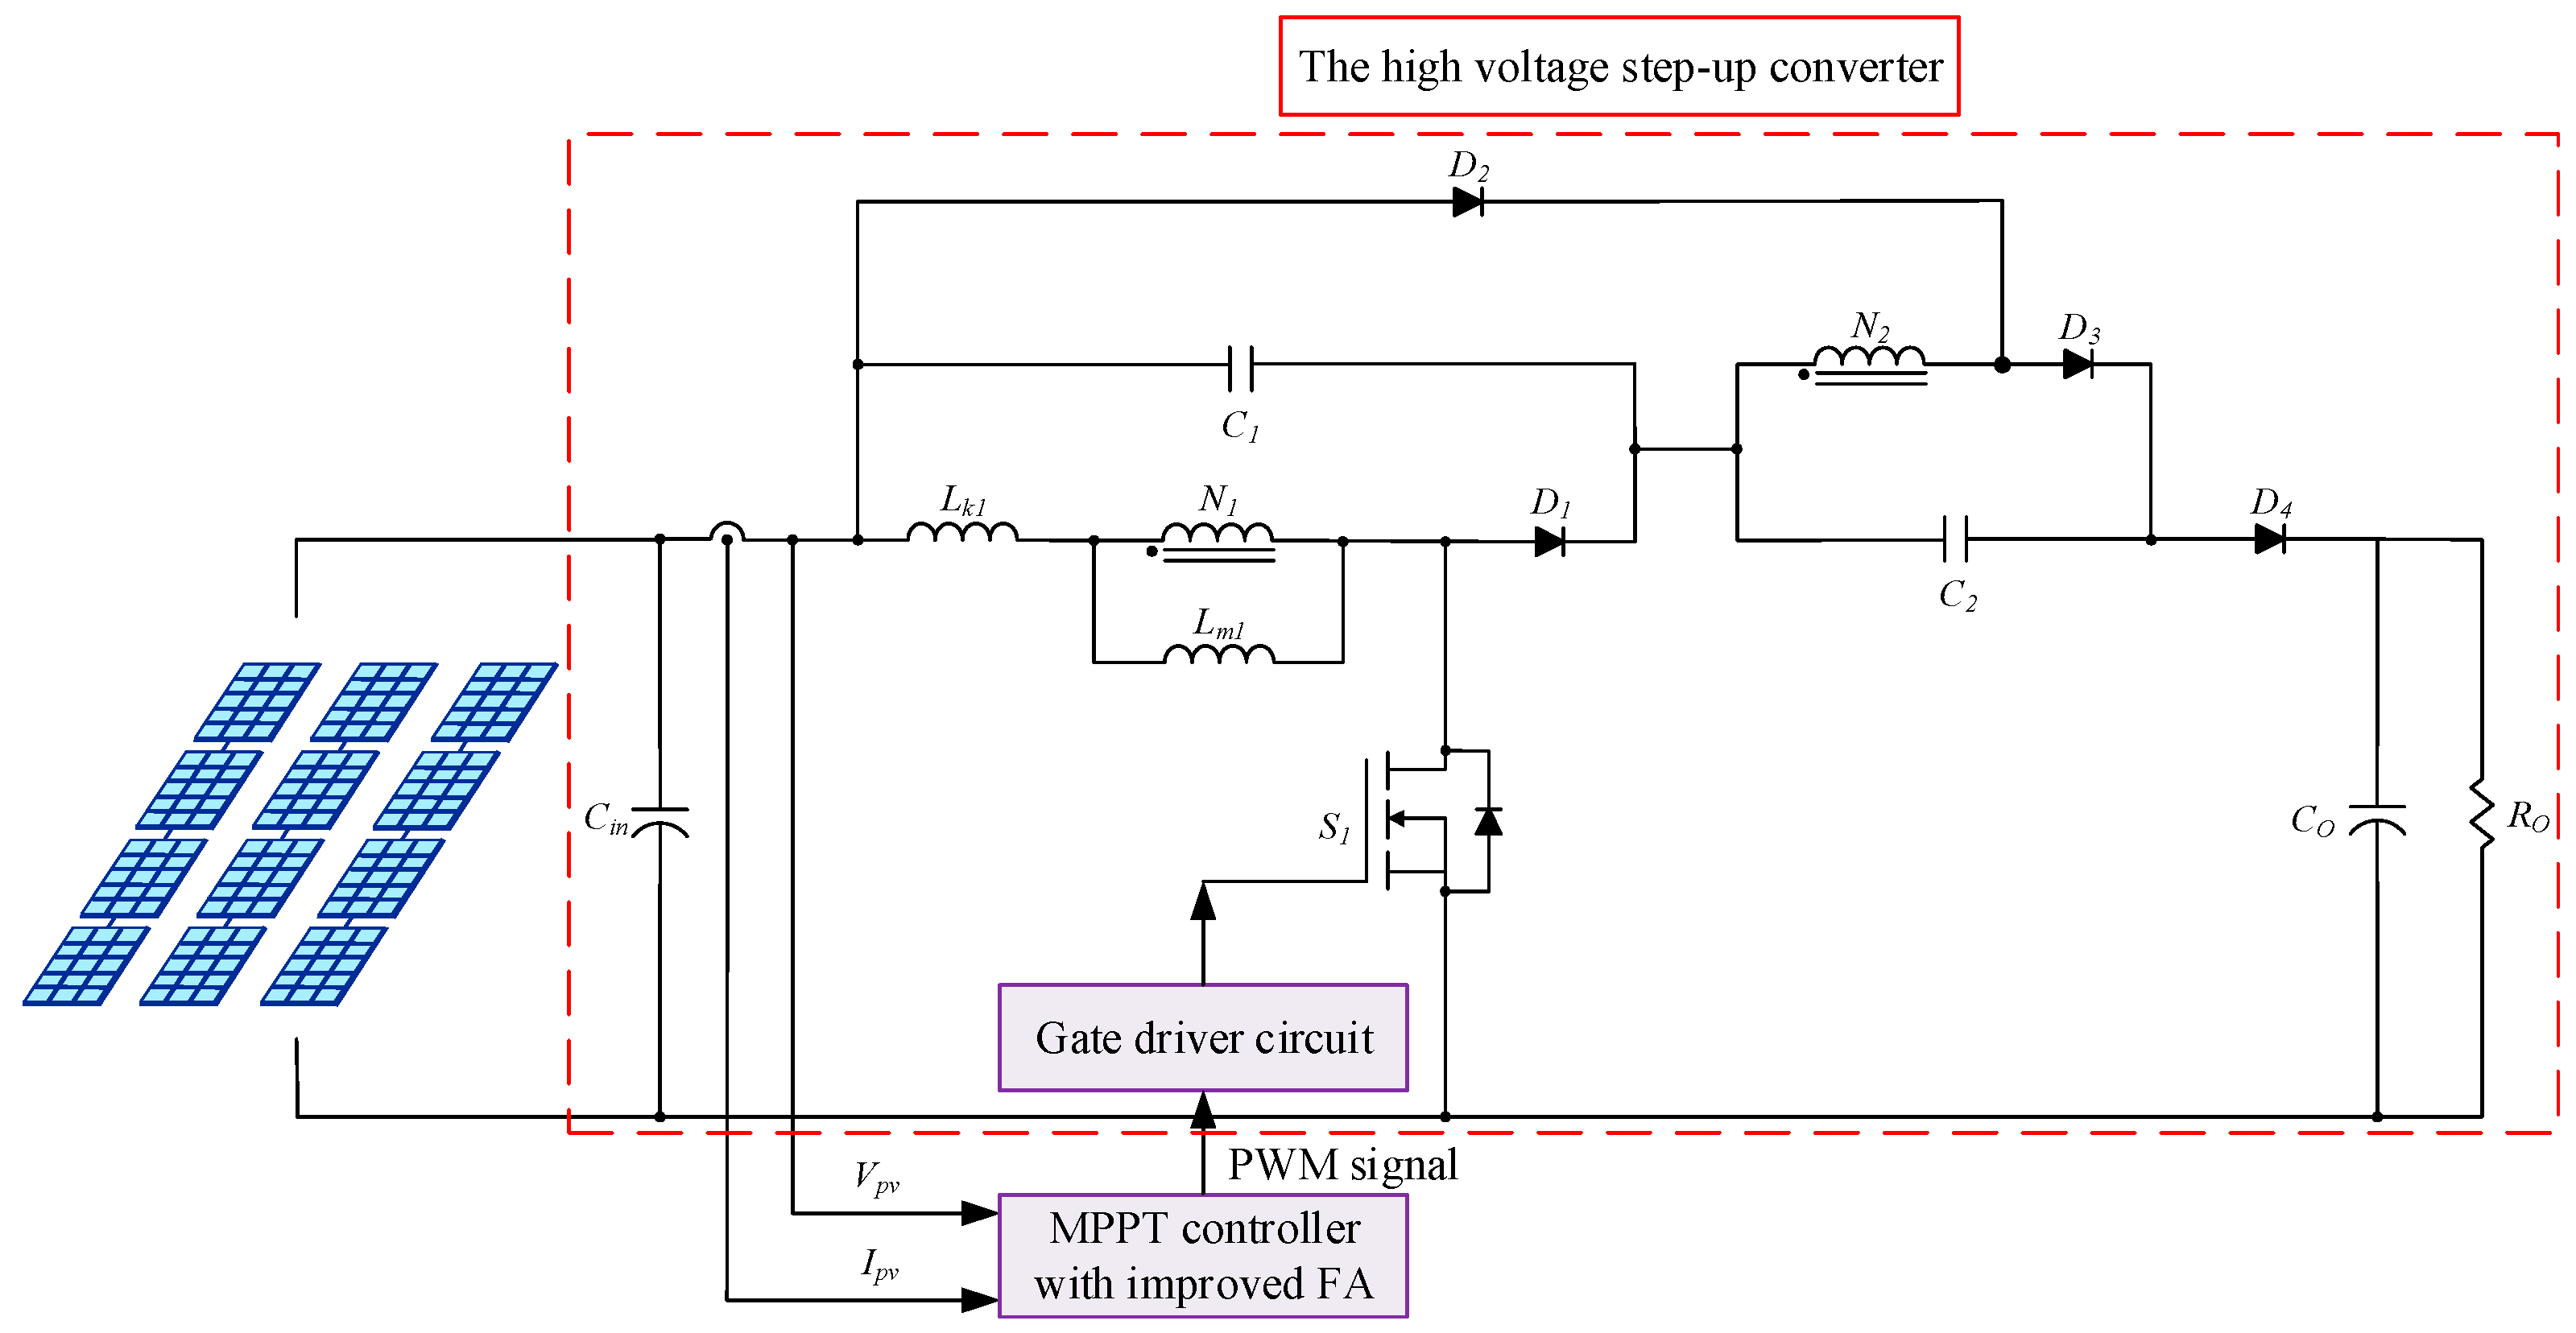
For a PVMA with a different connection in series or parallel, should partial modules be exposed to different shading conditions, multiple peaks would occur on the P-V output characteristic curve. Therefore, the photovoltaic modules SWM-20W (produced by MPPTSUN Co., Ltd. (Dongguan, China)) were adopted under this paper to assemble the PVMA and the parameter specifications for the electrical performance of a single module are shown in Table 3. In this paper, the Matlab software would be utilized to construct the model of a single photovoltaic module. The simulation results of the I-V and P-V characteristic curves, with zero shading and a different shading percentage under STCs (i.e., solar radiance at , a temperature of 25 °C, and an air mass (AM) of 1.5), are shown in Figure 7. Figure 8, on the other hand, displayed the system architecture of the MPPT control implemented with the proposed FA.
4. Firefly Algorithm (FA)
The FA was a heuristic algorithm. The inspiration mainly came from the flickering behavior of fireflies. The flashing was a signal to attract other fireflies and the search process related to the firefly’s characteristics, where the level of attraction connected with the luminance. The fireflies with a higher luminance would possess the characteristic of attracting fireflies with a weaker luminance. Higher luminance indicated that the current position was better, hence the brightest firefly would be the function optimum. The fireflies with a higher luminance would generate a greater attraction for fireflies nearby, and when the luminance was the same, the fireflies would move randomly. The advantages of such a method included fewer parameters required, a more extensive range of searching, faster convergence, and good performance in a steady state. However, should the starting point for searching and step size of the searching process be planned inadequately, the local optimum would be allocated easily instead of the global optimum, especially in the case of a multi-dimensional system.
4.1. Conventional FA
The assumptions of the FA were as follows:
- (1)
- All fireflies were assumed as gender-neutral and attracted to each other.
- (2)
- The degree of attraction only related to the luminance and distance, the brighter fireflies would attract fireflies of less luminance nearby. Along with a greater distance and the degree of attraction reducing slowly, the brighter fireflies would then move randomly.
The main steps of acquiring optimum with the FA were as follows:
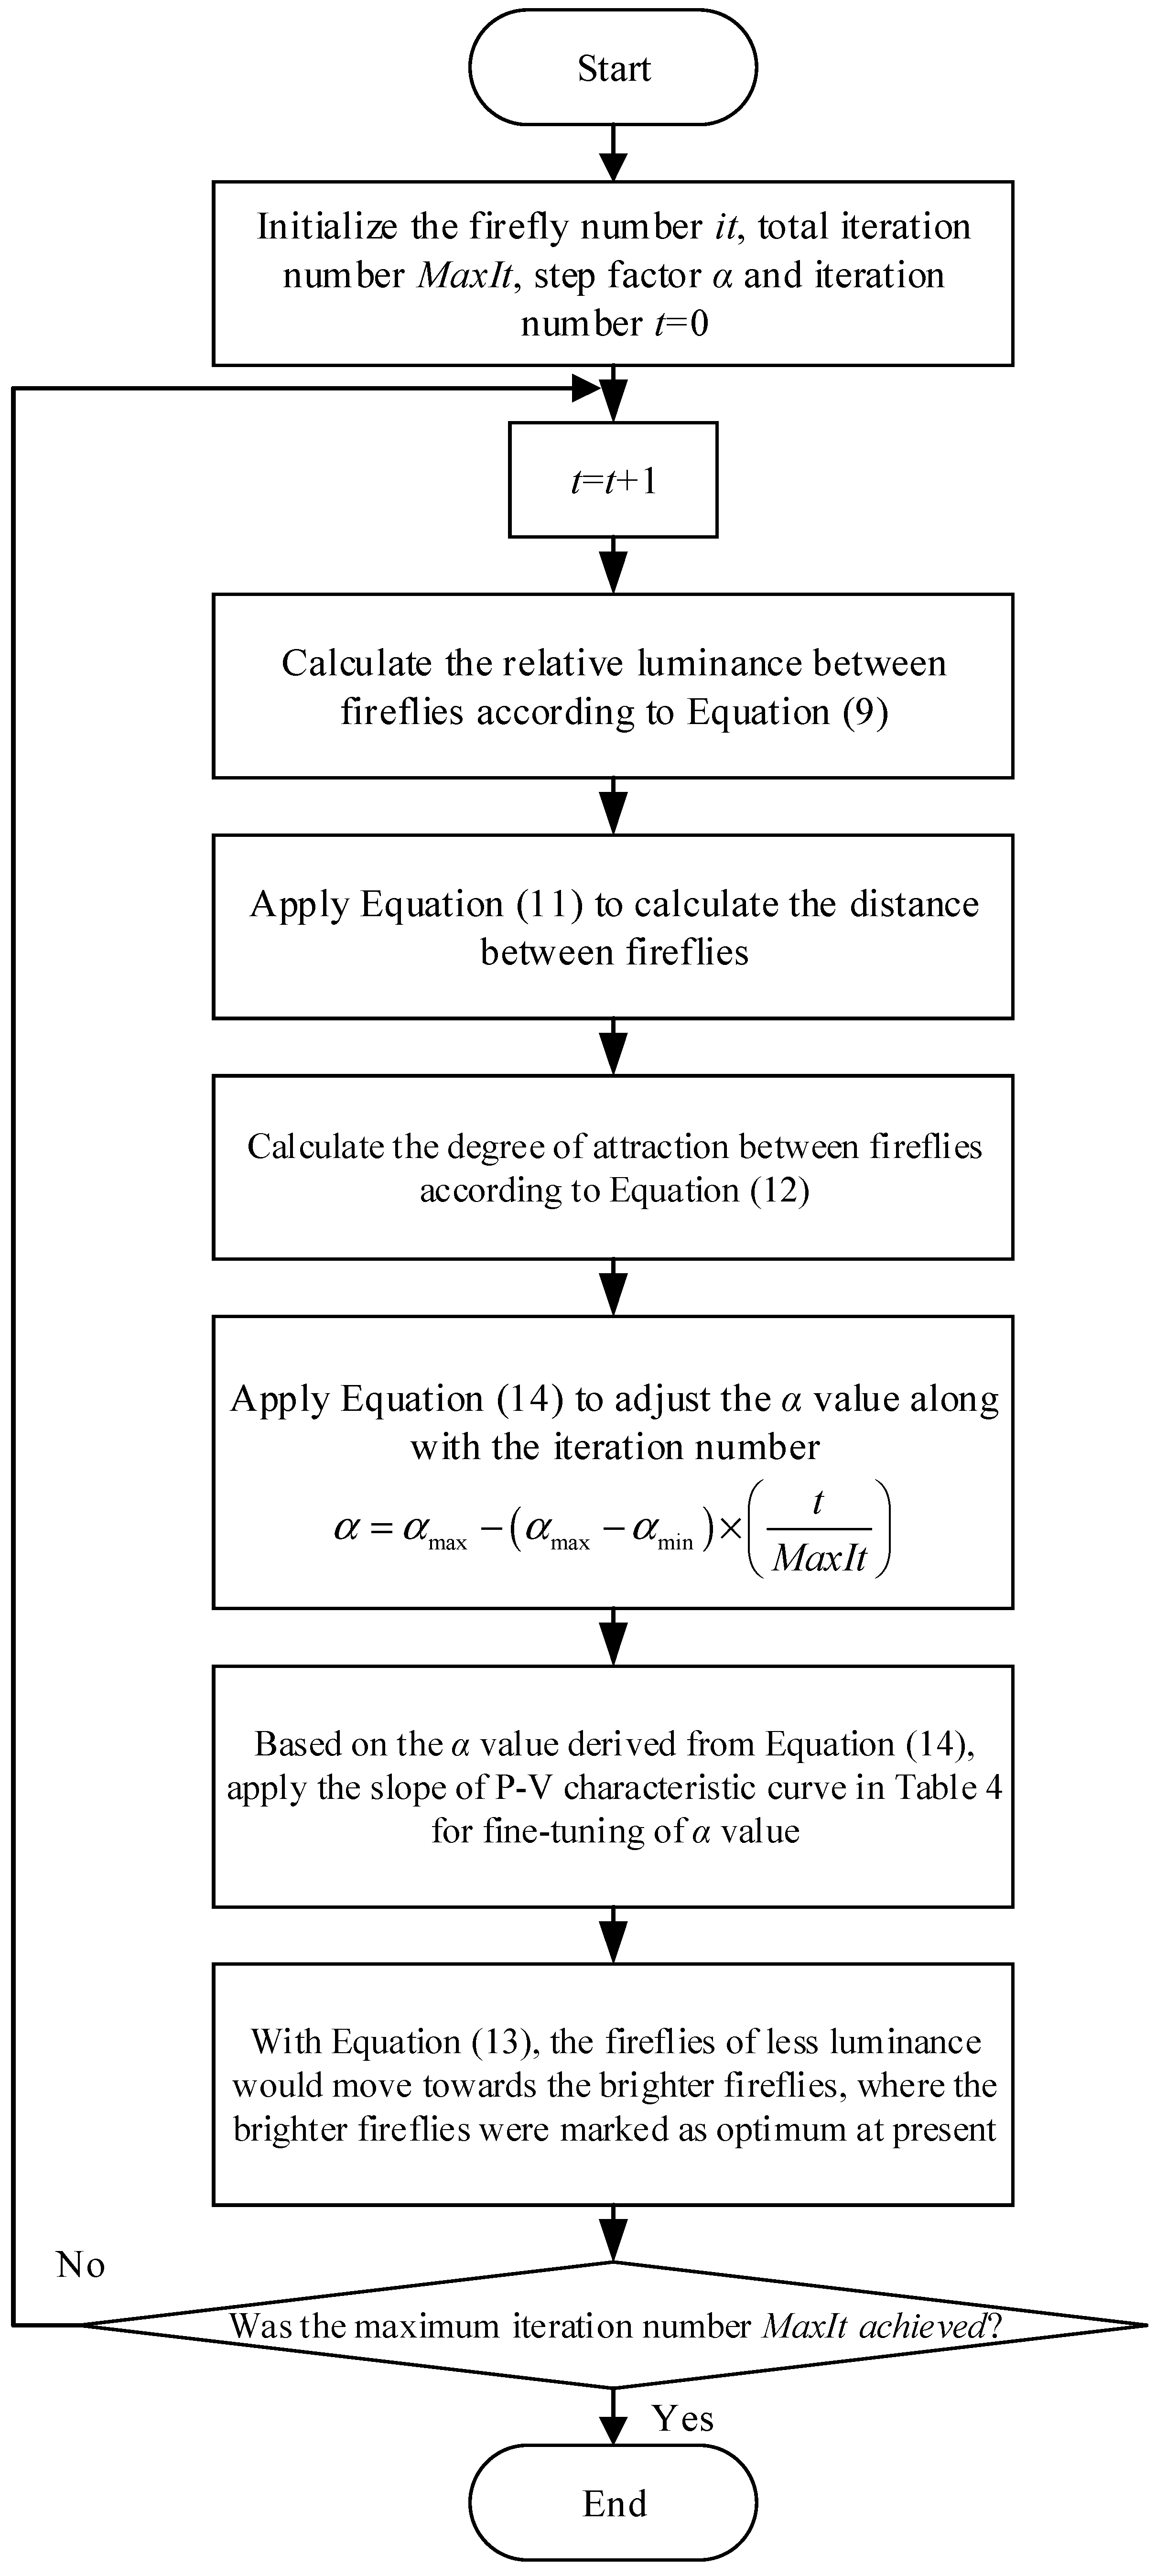
Step 1: Initialization of firefly number it, total iteration number MaxIt, and step factor α.
Step 2: Calculation of relative luminance between each firefly with Equation (9).
where was the luminance for each firefly at a distance of , which was its self-luminance. was the absorption coefficient of the propagation medium, where the luminance would gradually decay along with an increase in distance. The absorption coefficient of the propagation medium was often set as a constant.
Step 3: Calculate the distance between fireflies. The distance between firefly i and firefly j on the d-dimension coordinate is expressed in Equation (10).
where was the d-dimension coordinate for firefly j in the spatial coordinate and Equation (10) was the calculating formula d-dimensional space. For the MPPT of the PVMAs applied in this paper, two-dimensional space was utilized for the calculation. Therefore, the distance between firefly i and firefly j in the two-dimensional space is expressed in Equation (11).
Step 4: Calculation on the degree of attraction between fireflies as shown in Equation (12).
where represented the maximum attraction upon .
Step 5: The fireflies of less luminance would move towards the brighter fireflies, and the new solution was produced through iteration with Equation (13).
where was the location value of the brighter firefly and was the location value for the firefly with less luminance. α was the step factor and ε was the random value in [0,1].
Step 6: Should the iteration number reach the maximum iteration number that was set, the iteration stopped and was exported. In case of incompliant conditions, the process returned to Step 3.
4.2. Proposed Improved FA
For the improved FA proposed in this paper, improvements were made to the conventional FA as follows:
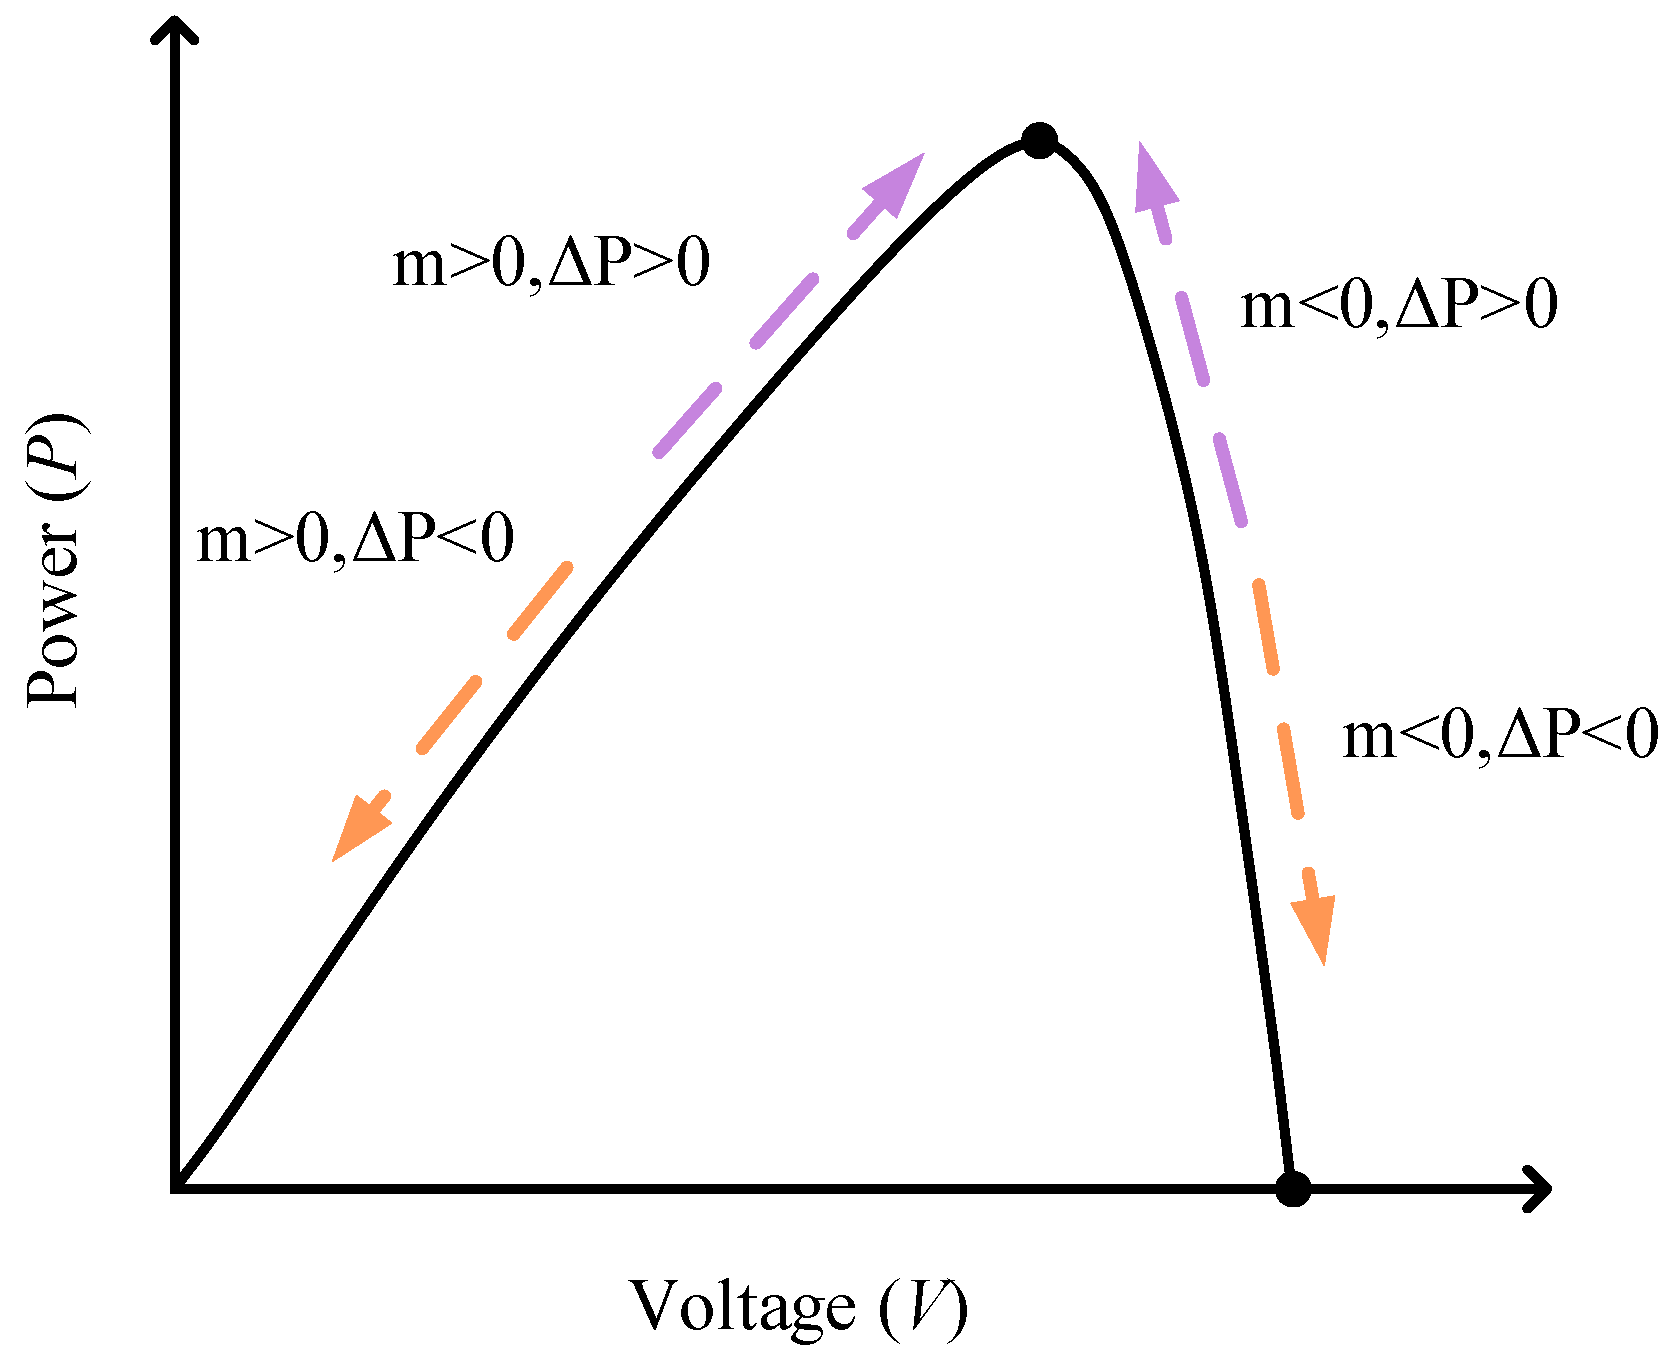
Improvement 1: The upper and lower limits of the step factors were set and such factors were adjusted along with the iteration number. Fine-tuning was then conducted as the slope of the P-V characteristic curve in Figure 9, where α was derived with Equation (14) according to methods of adjusting the iteration numbers. Consequently, fine-tuning the α value was conducted according to the slope of the P-V characteristic curve. The fine-tuning is illustrated in Table 4. The step factor of the iteration parameter of α in Table 4 was only adjusted upon . represented the adjustment of the step factor of α for the iteration parameter at present, which increased the output power of the PVMA, so the step factor of the next iteration parameter of α would track towards the MPP direction upon adjustment.
Among them, α was the step factor, and αmax and αmin were the upper and lower limit of the step factor, respectively; t represented the iteration number and MaxIt was the maximum iteration number.
Improvement 2: The initial tracking voltage of the MPPT was set as 0.8 times of the MPP voltage for the PVMA under an STC.
The flow chart of the proposed improved FA is shown in Figure 10.
5. Test Results
For the pulse width modulation (PWM) control of the high-voltage step-up converter, as well as the conventional and improved FA adopted in this paper, a digital signal processor (DSP), TMS320F2809, served as the controlling core for realization. At the same time, the 62050H-600S [38] programmable DC power supply, produced by Chroma ATE Inc., was utilized to simulate the output of the PVMAs. The parameters adopted by the conventional FA are shown in Table 5 and the parameter setting for the two improved FAs is shown in Table 6. Table 7 listed the six test cases for the PVMAs with four modules in series and three modules in parallel under different shading conditions. Due to the different shading conditions, the number of peaks that appeared on the P-V characteristic curves also differed. In the following sections, the actual tests on the GMPPT were conducted on cases with single, double, triple, and quadruple peaks appearing on the P-V characteristic curves, while the global maximum values were on different sides respectively, so the robustness for the proposed improved FA can be verified.
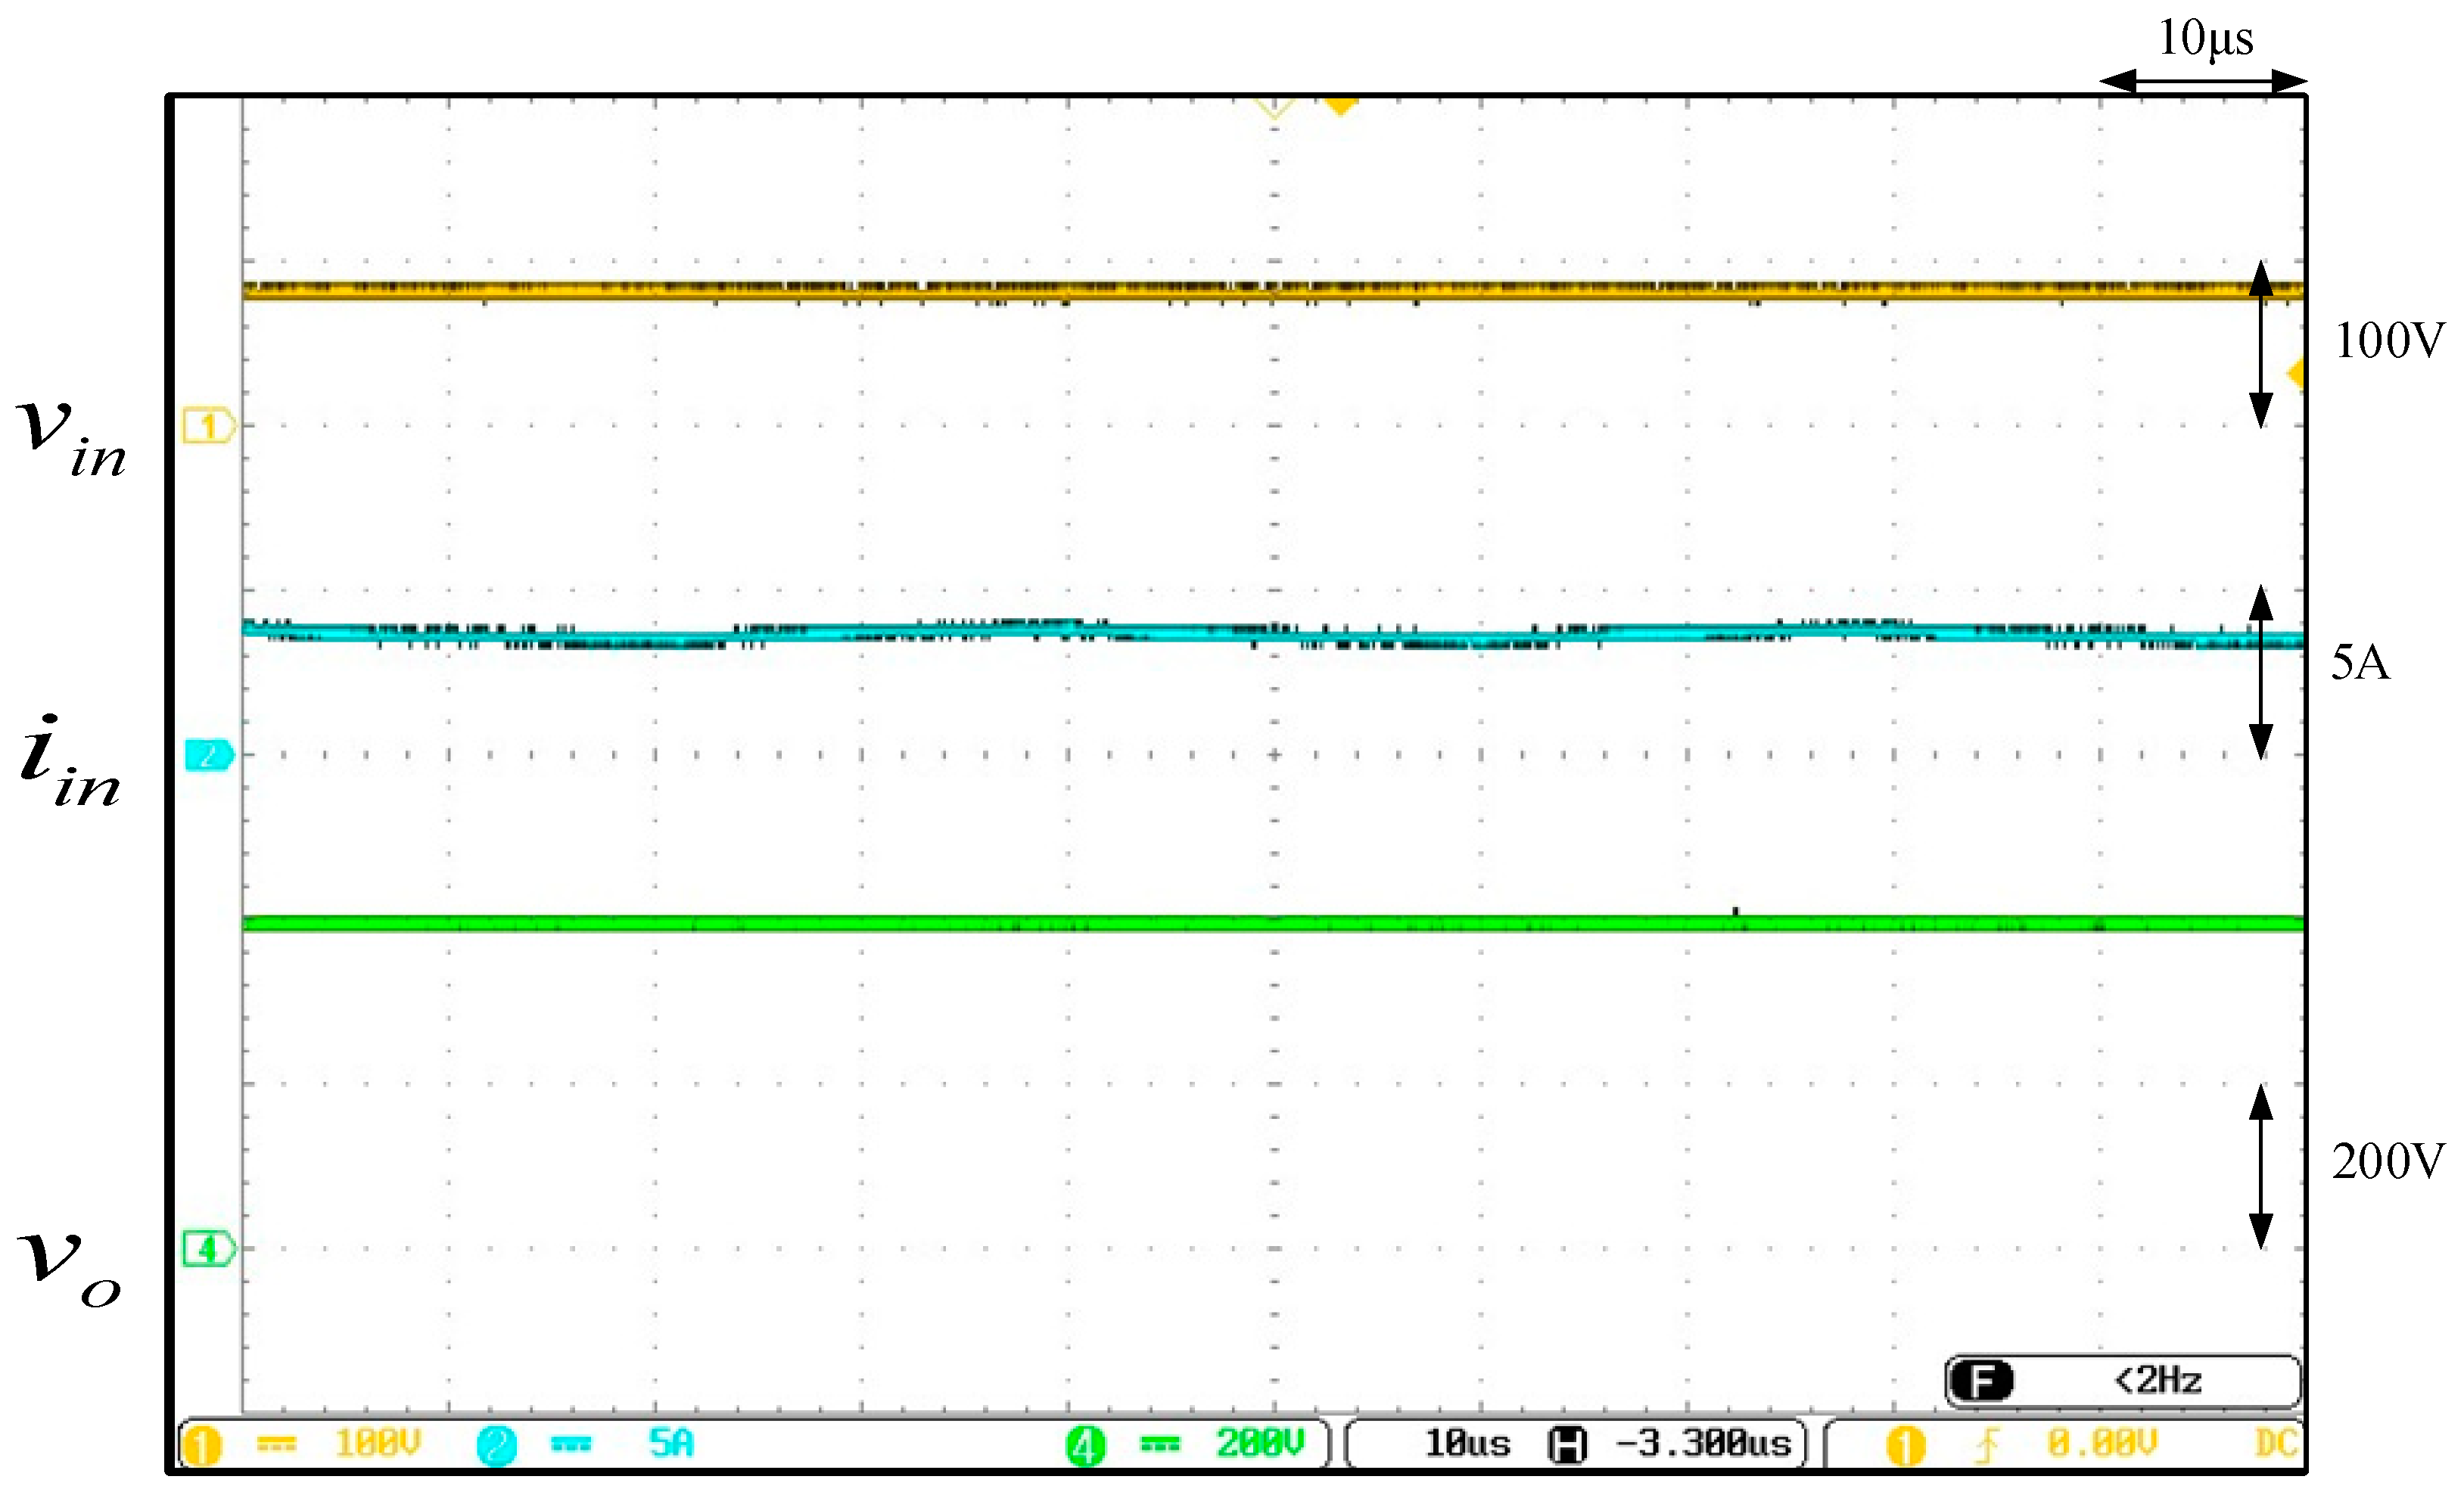
5.1. Actual Test on the High Voltage Step-Up Converter
Figure 11 displays the waves of the input voltage (), input current (), and output voltage () under an actual test when the proposed high-voltage step-up converter was operating at a full load of 300 W. From the actual test results, it can be observed that under the load of 300 W, the developed converter could indeed raise the input voltage from 80 V to 400 V; hence, the converter provided a characteristic of high-voltage step-up.
5.2. Actual Test for MPPT
- (1)
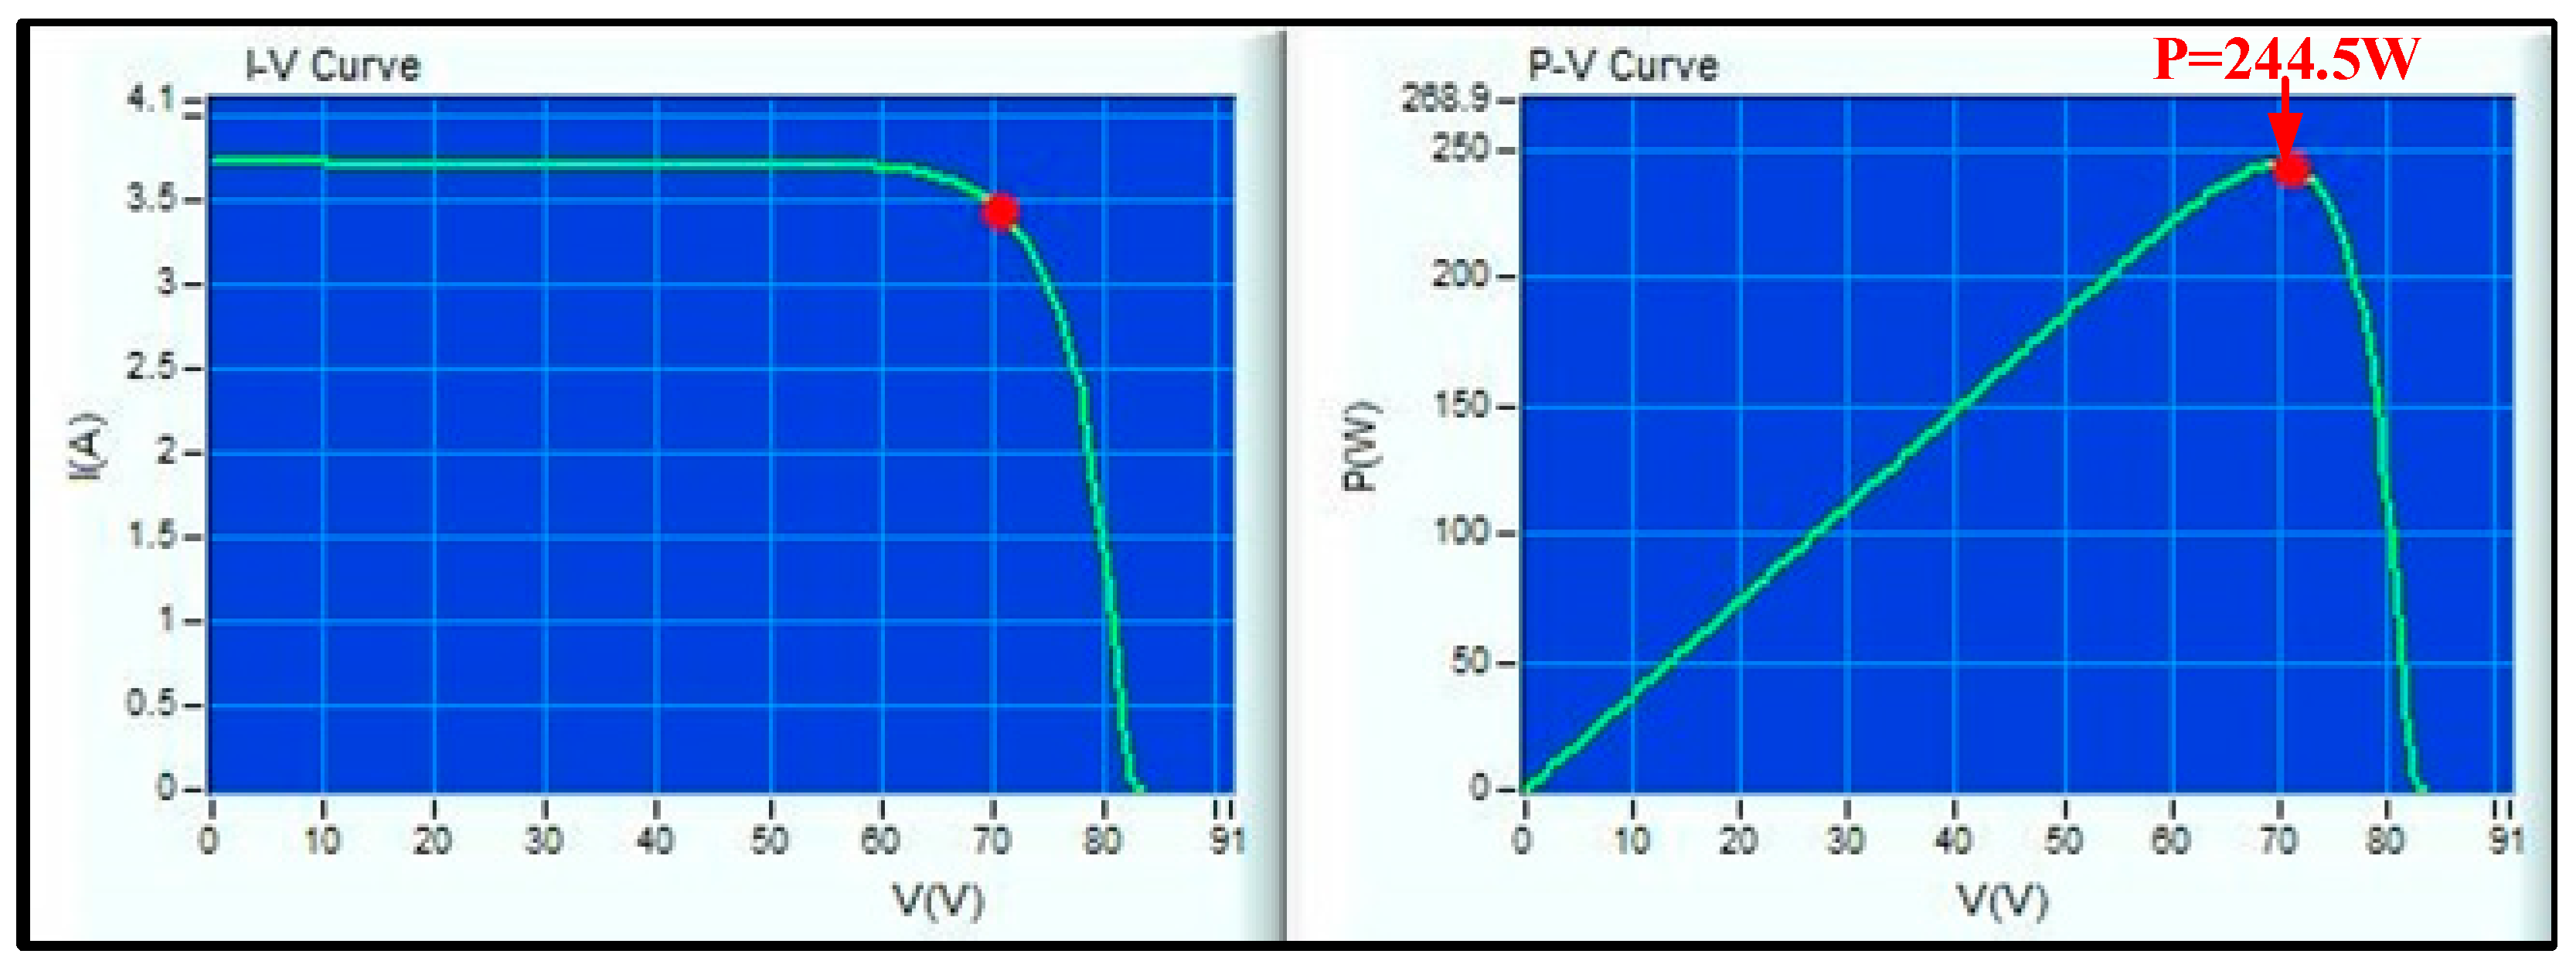
- Actual test in Case 1
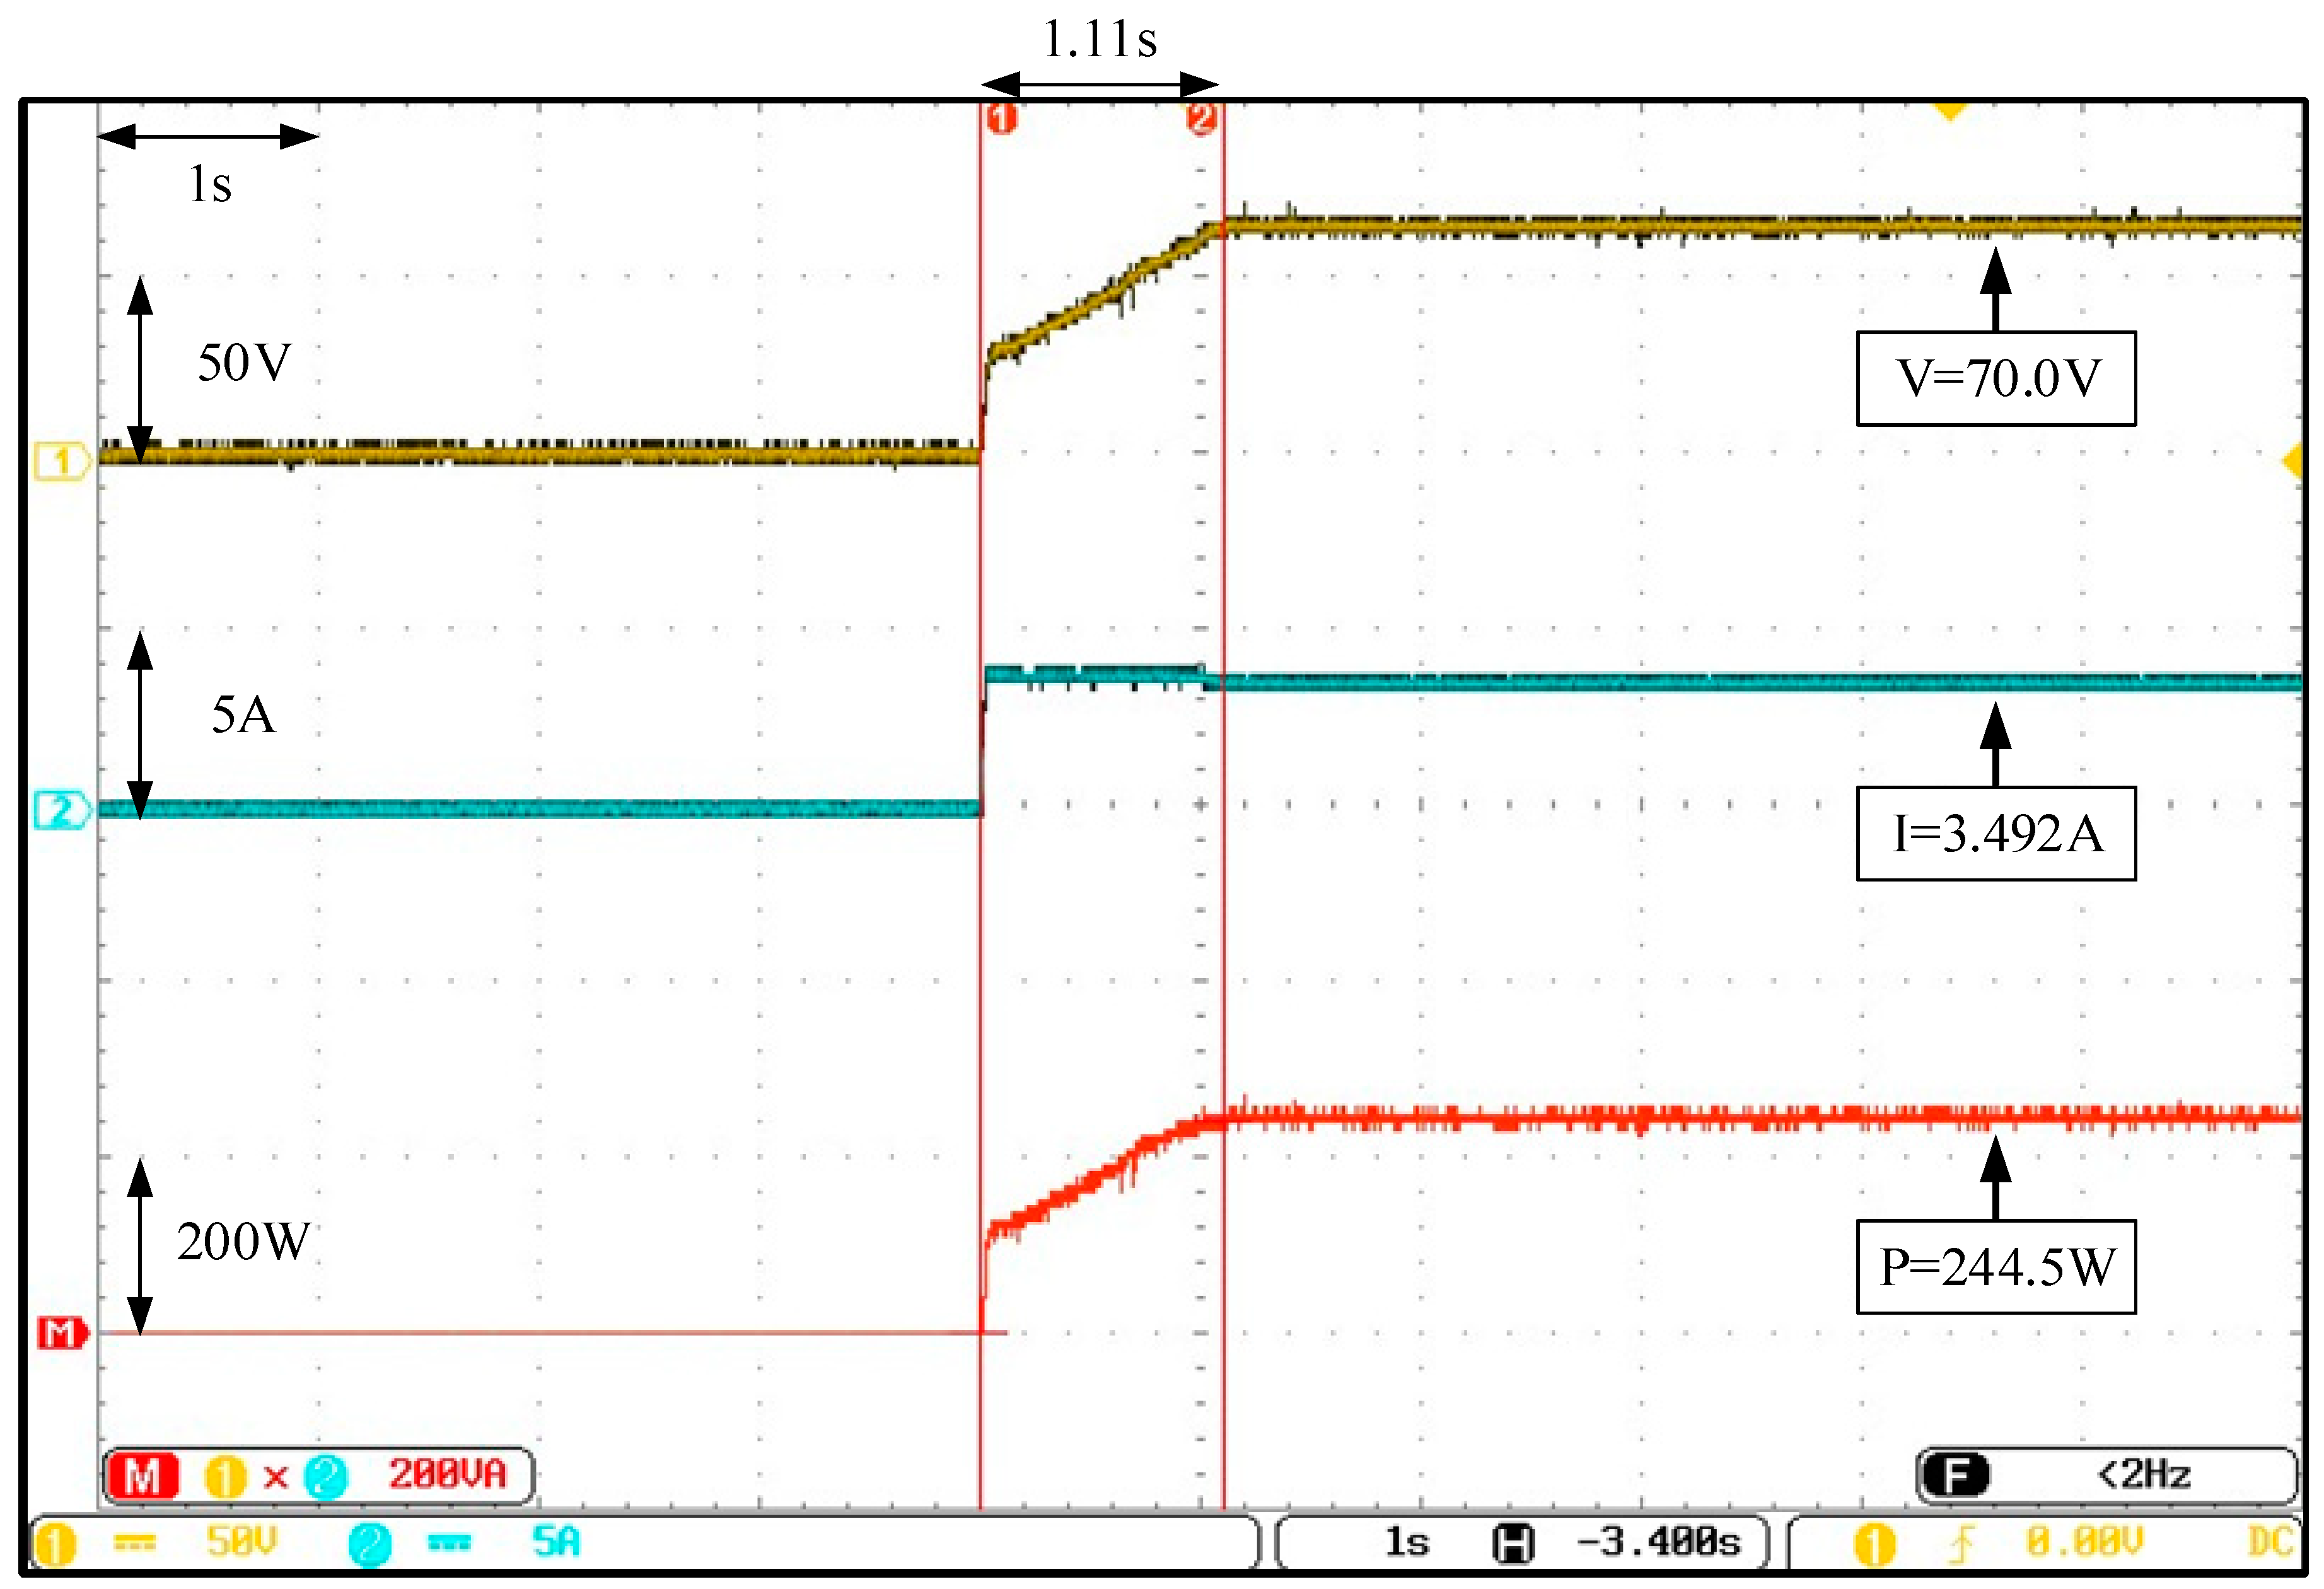
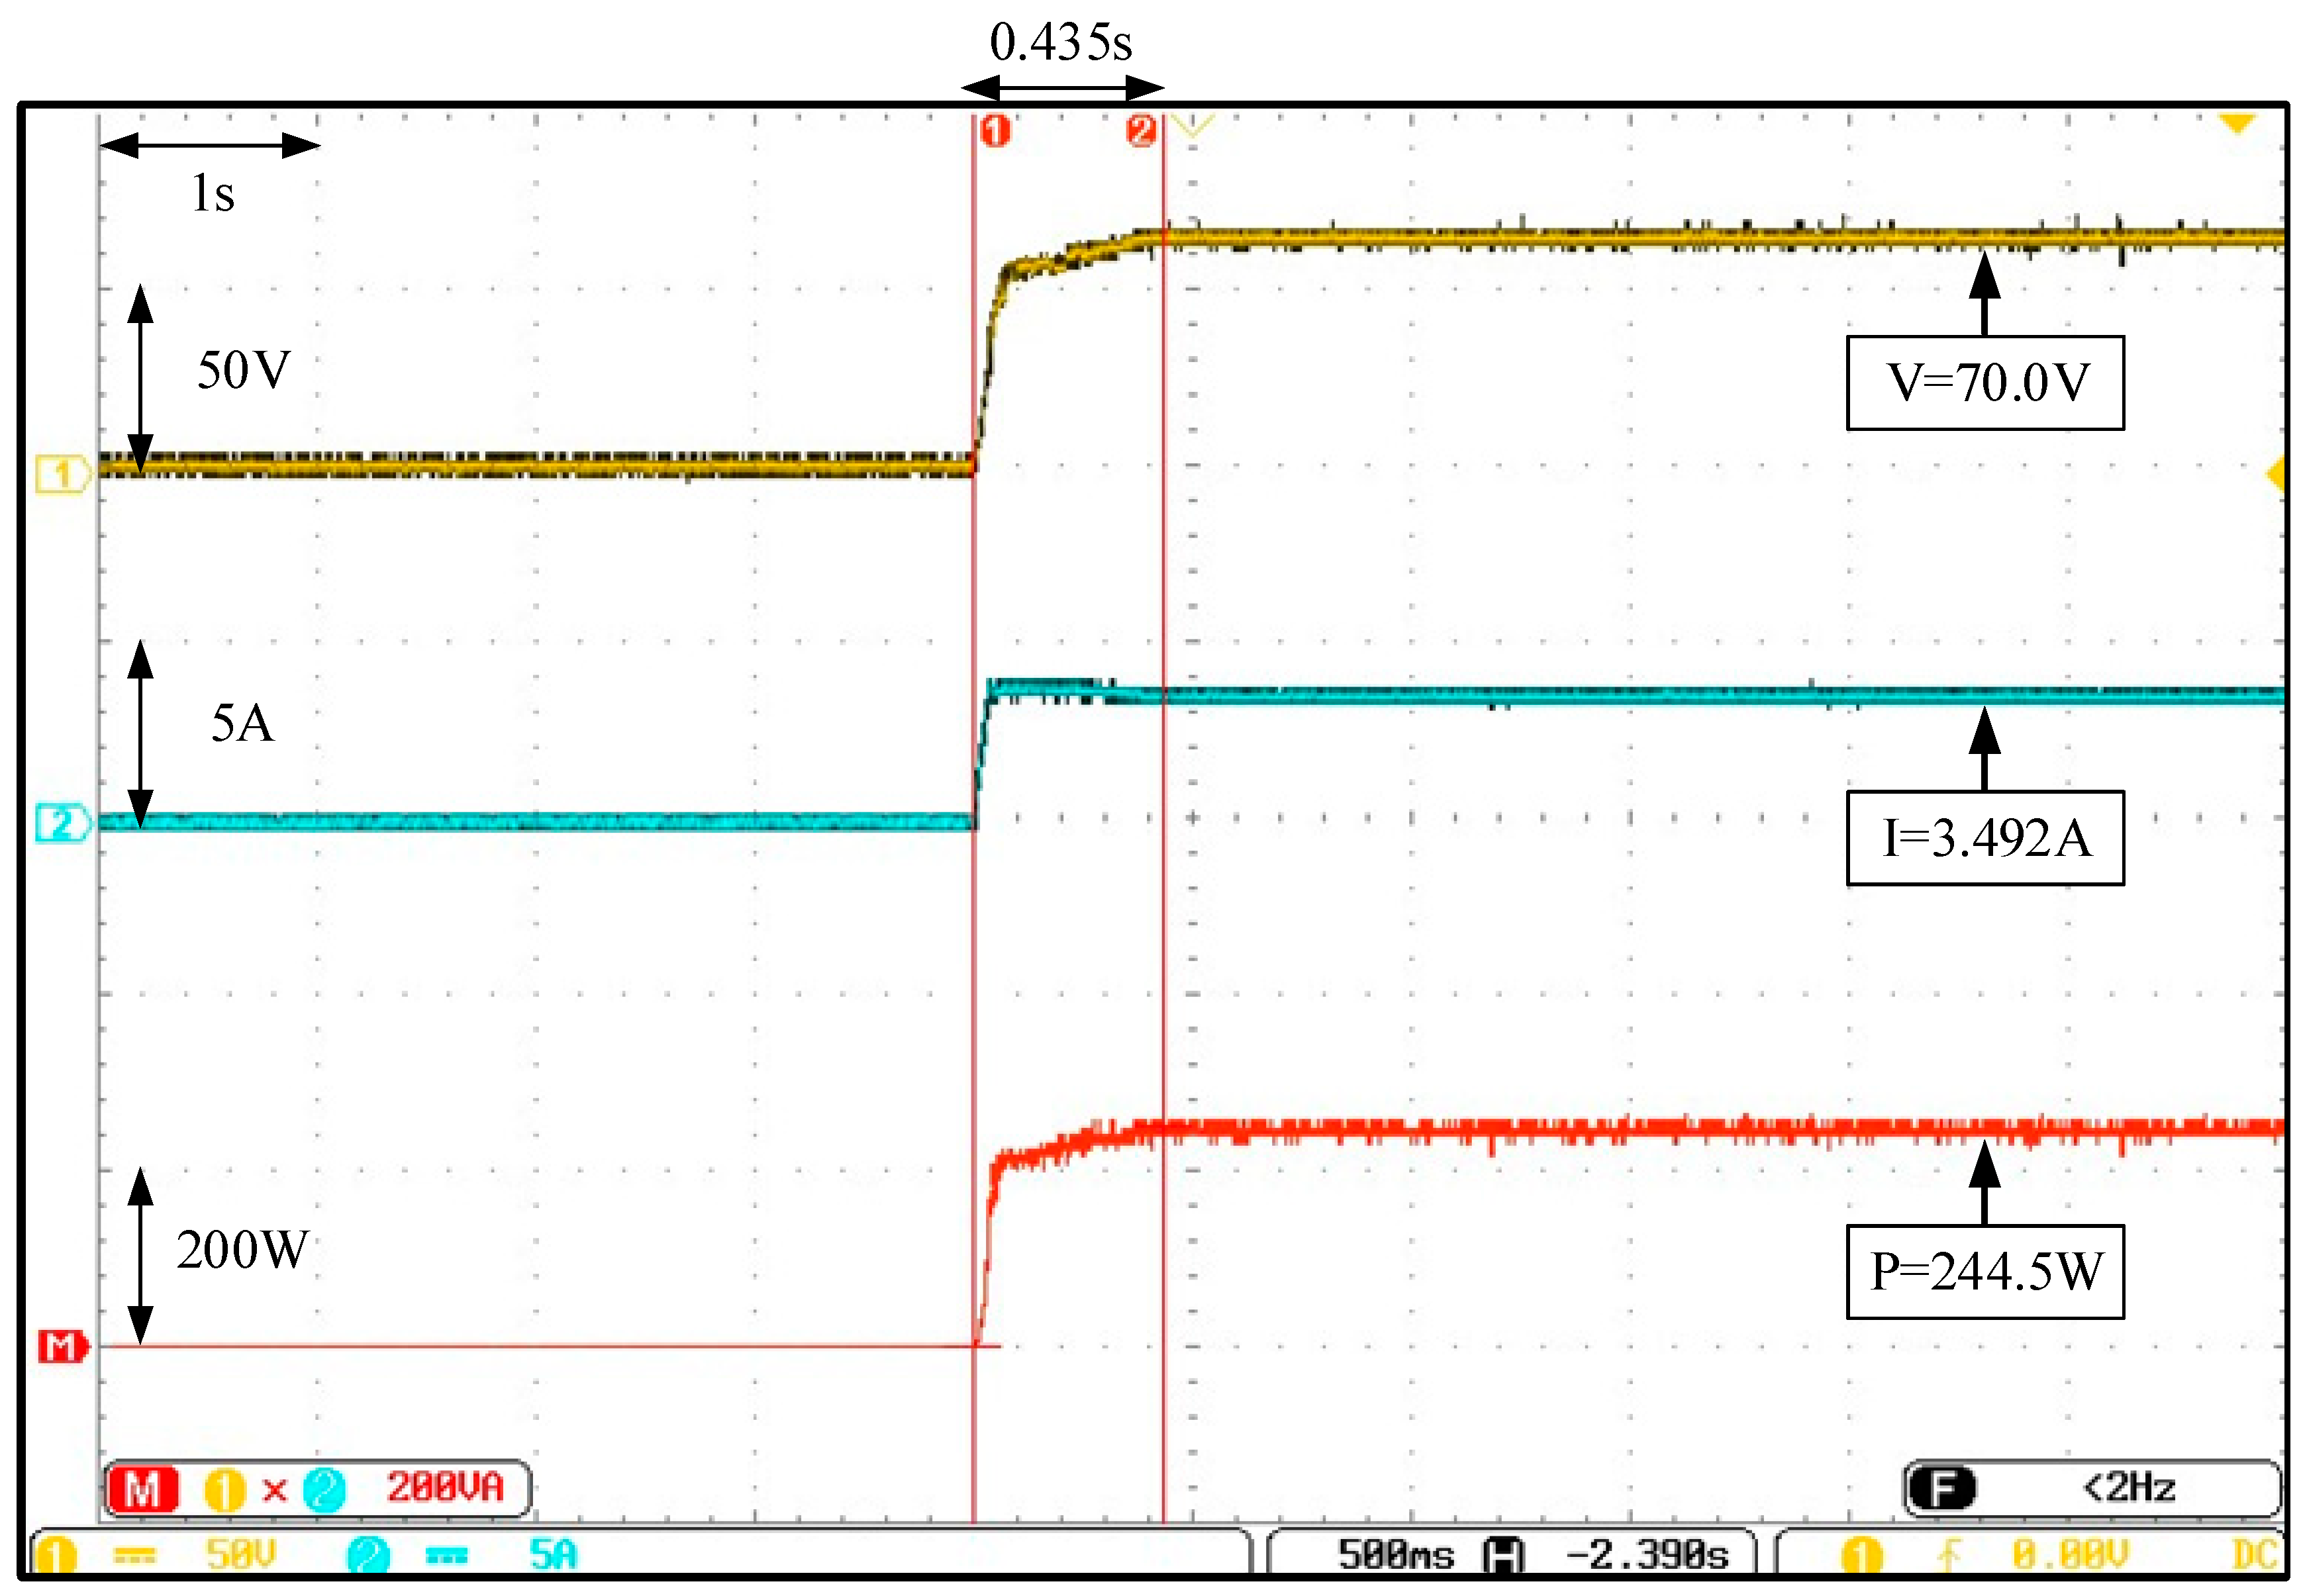
Figure 12 displays Case 1, where the actual test for the I-V and P-V characteristic curves of the PVMAs, under an STC with zero shading, was conducted and the MPP was 244.5 W. Figure 13, Figure 14 and Figure 15 display the actual test results for the MPPT conducted by adopting the conventional and two types of improved FAs. From the figures, it can be observed that the tracking speed of the proposed FA, with both the changed iteration parameters and initial tracking voltage, was distinctively better than the conventional FA and improved FA with only the changed iteration parameters.
- (2)
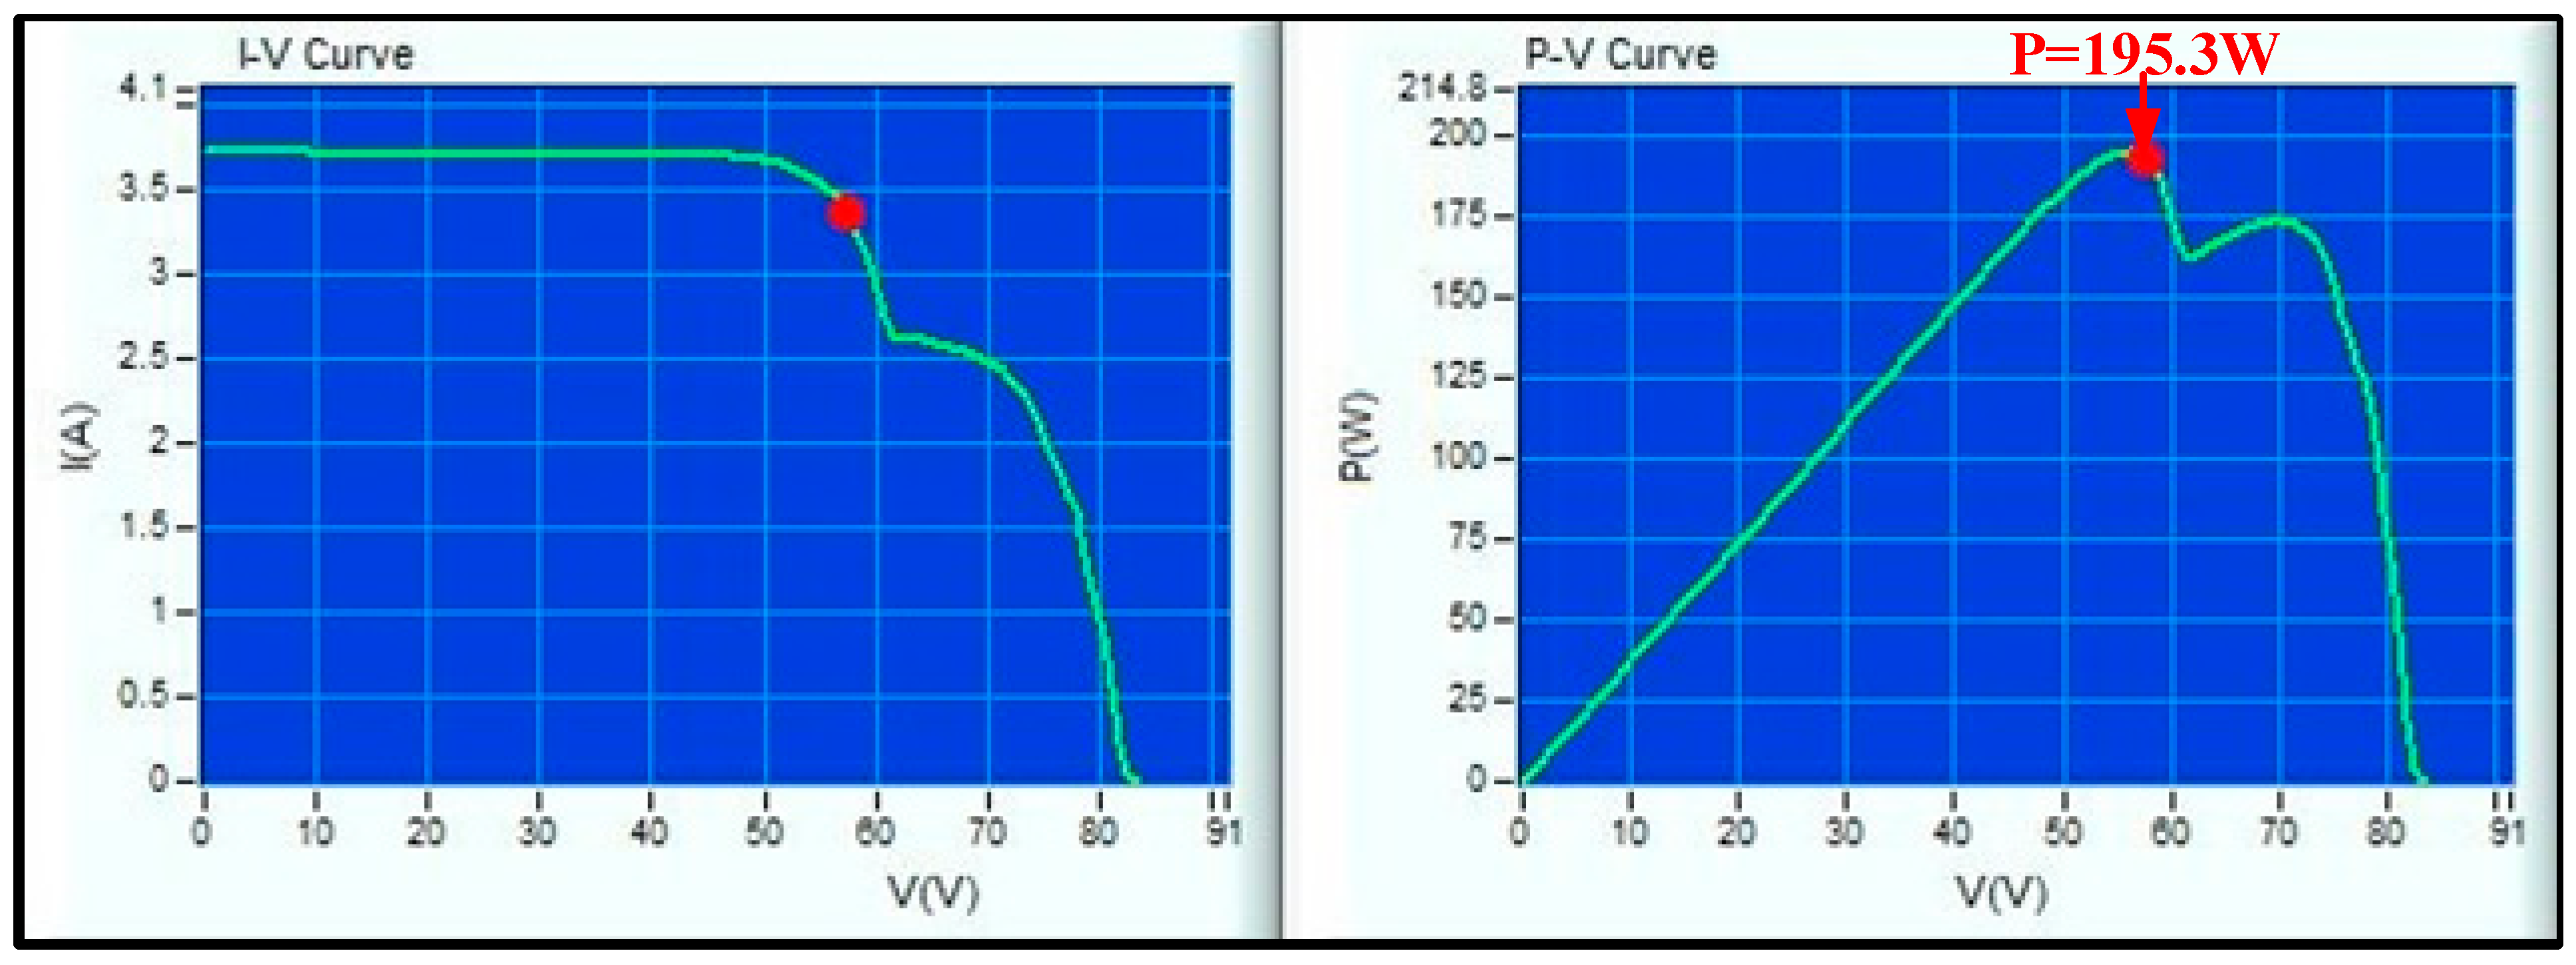
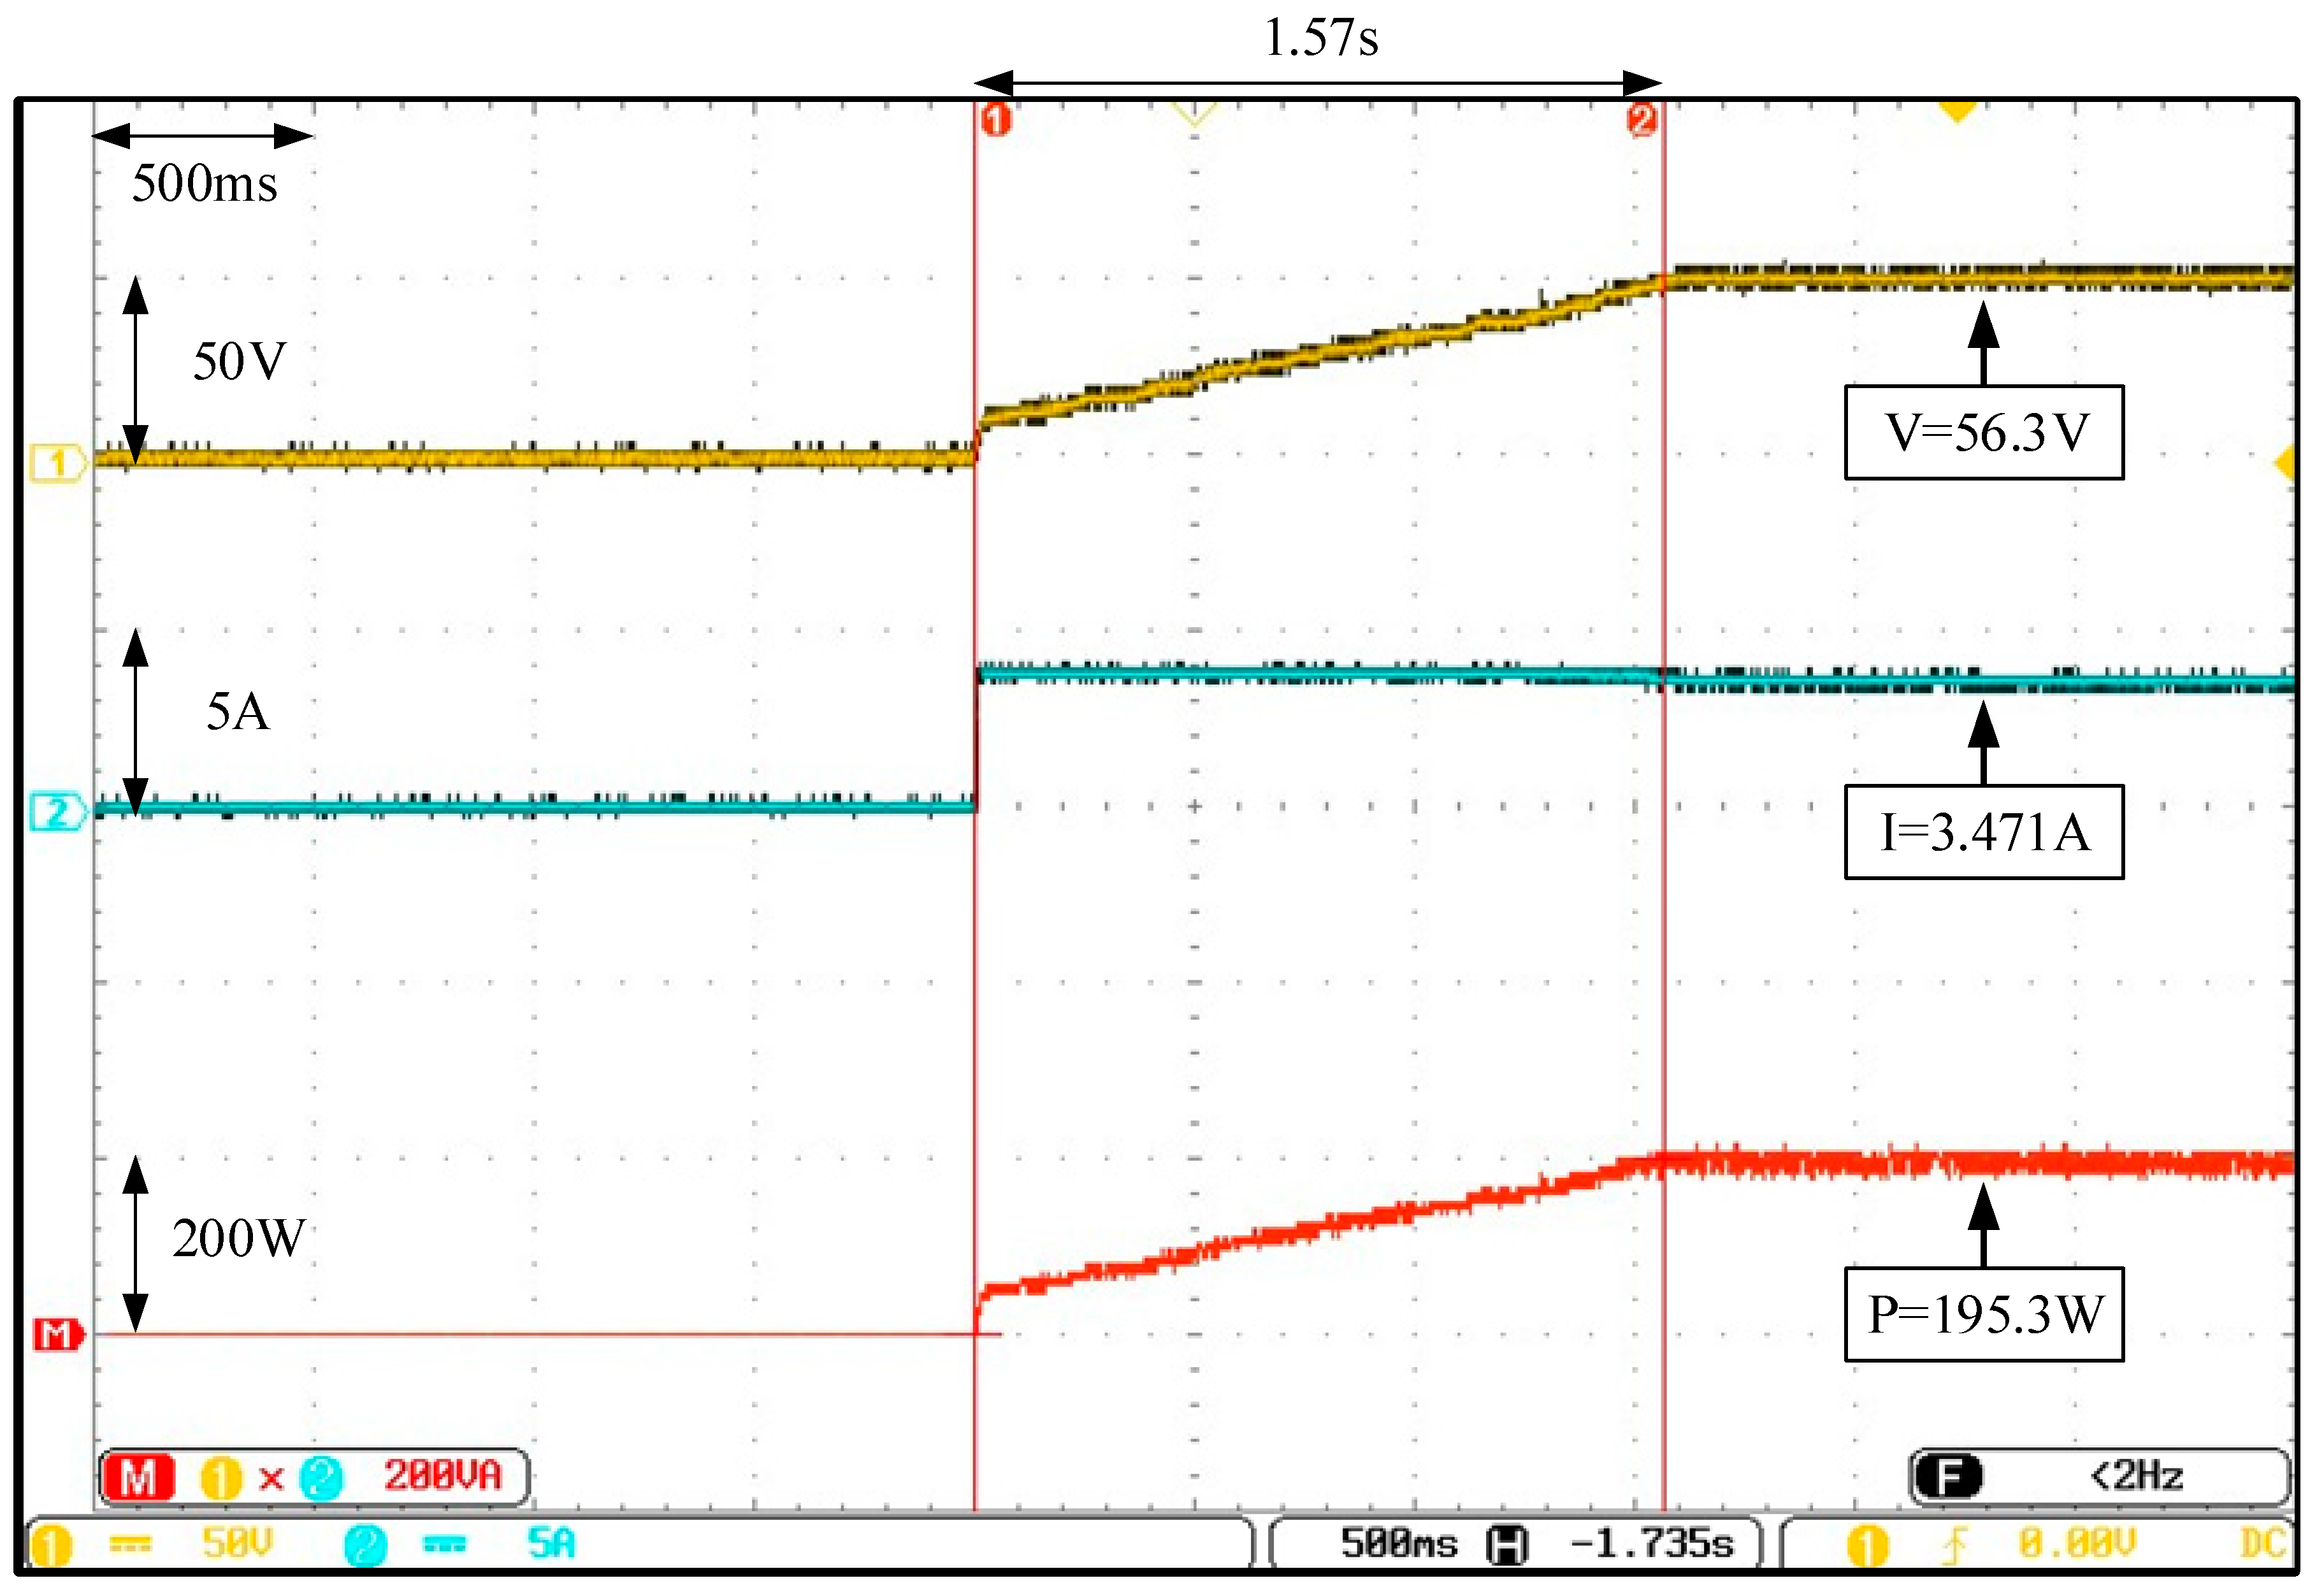
- Actual Test in Case 2
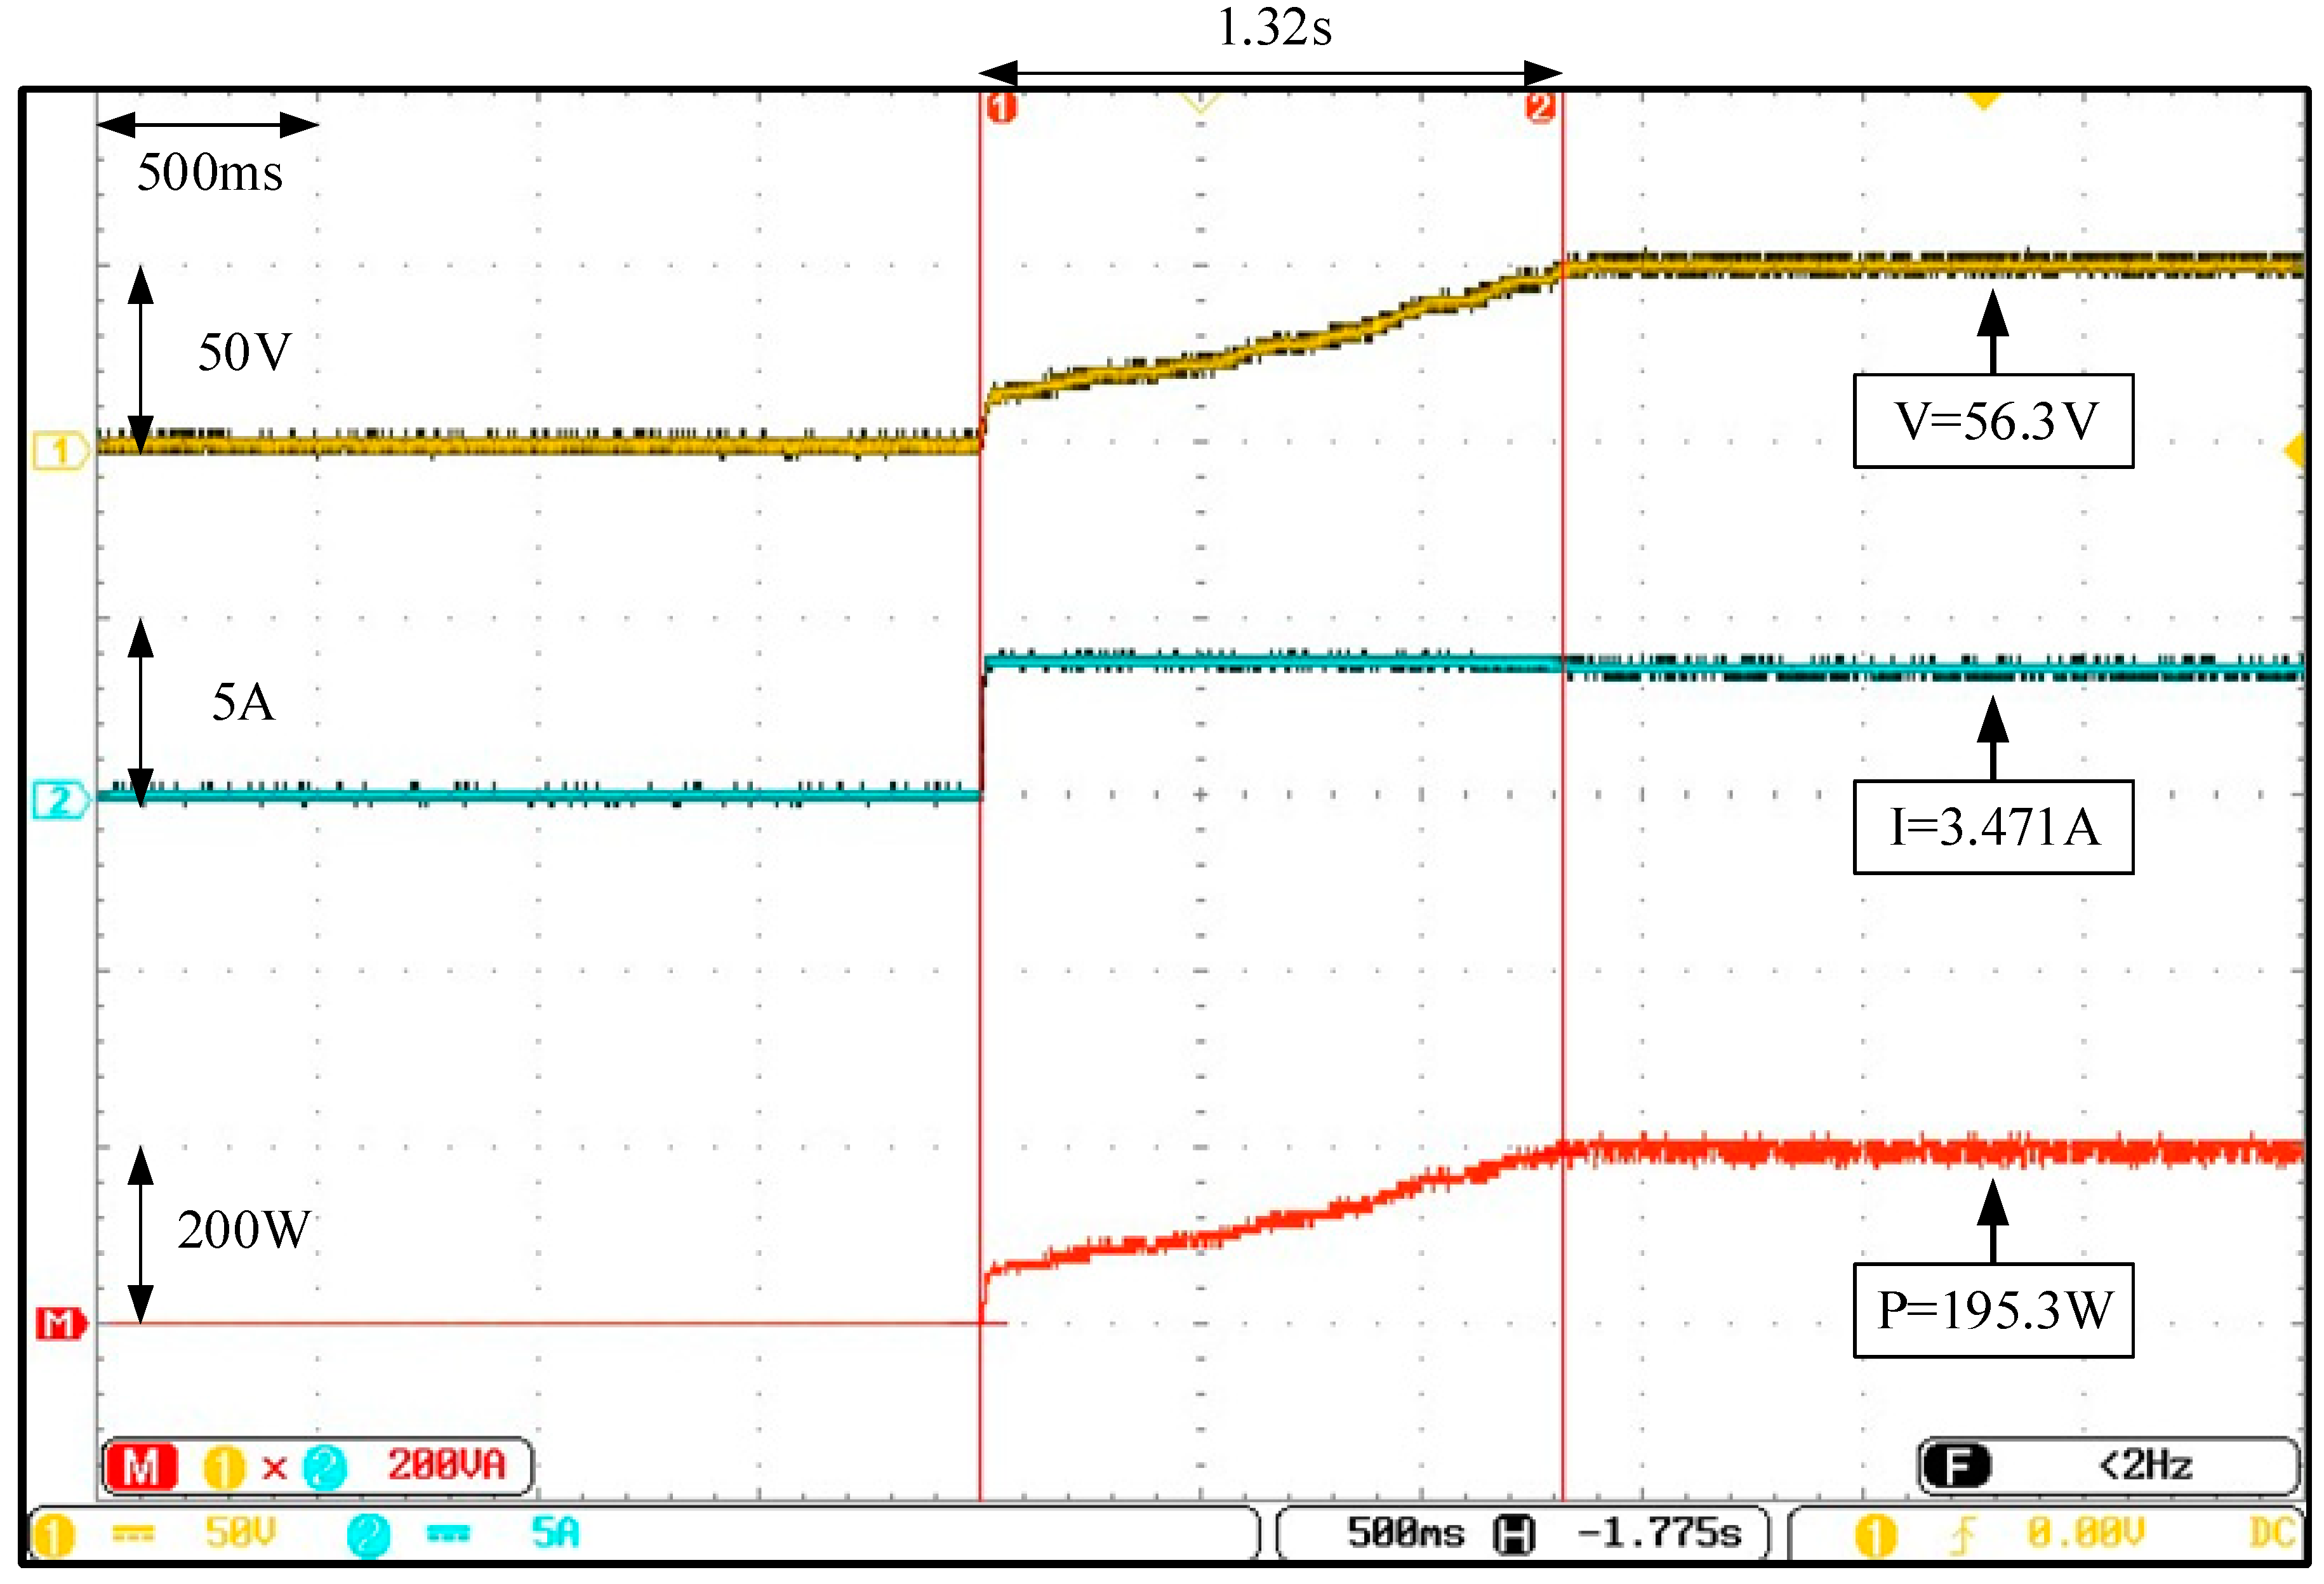
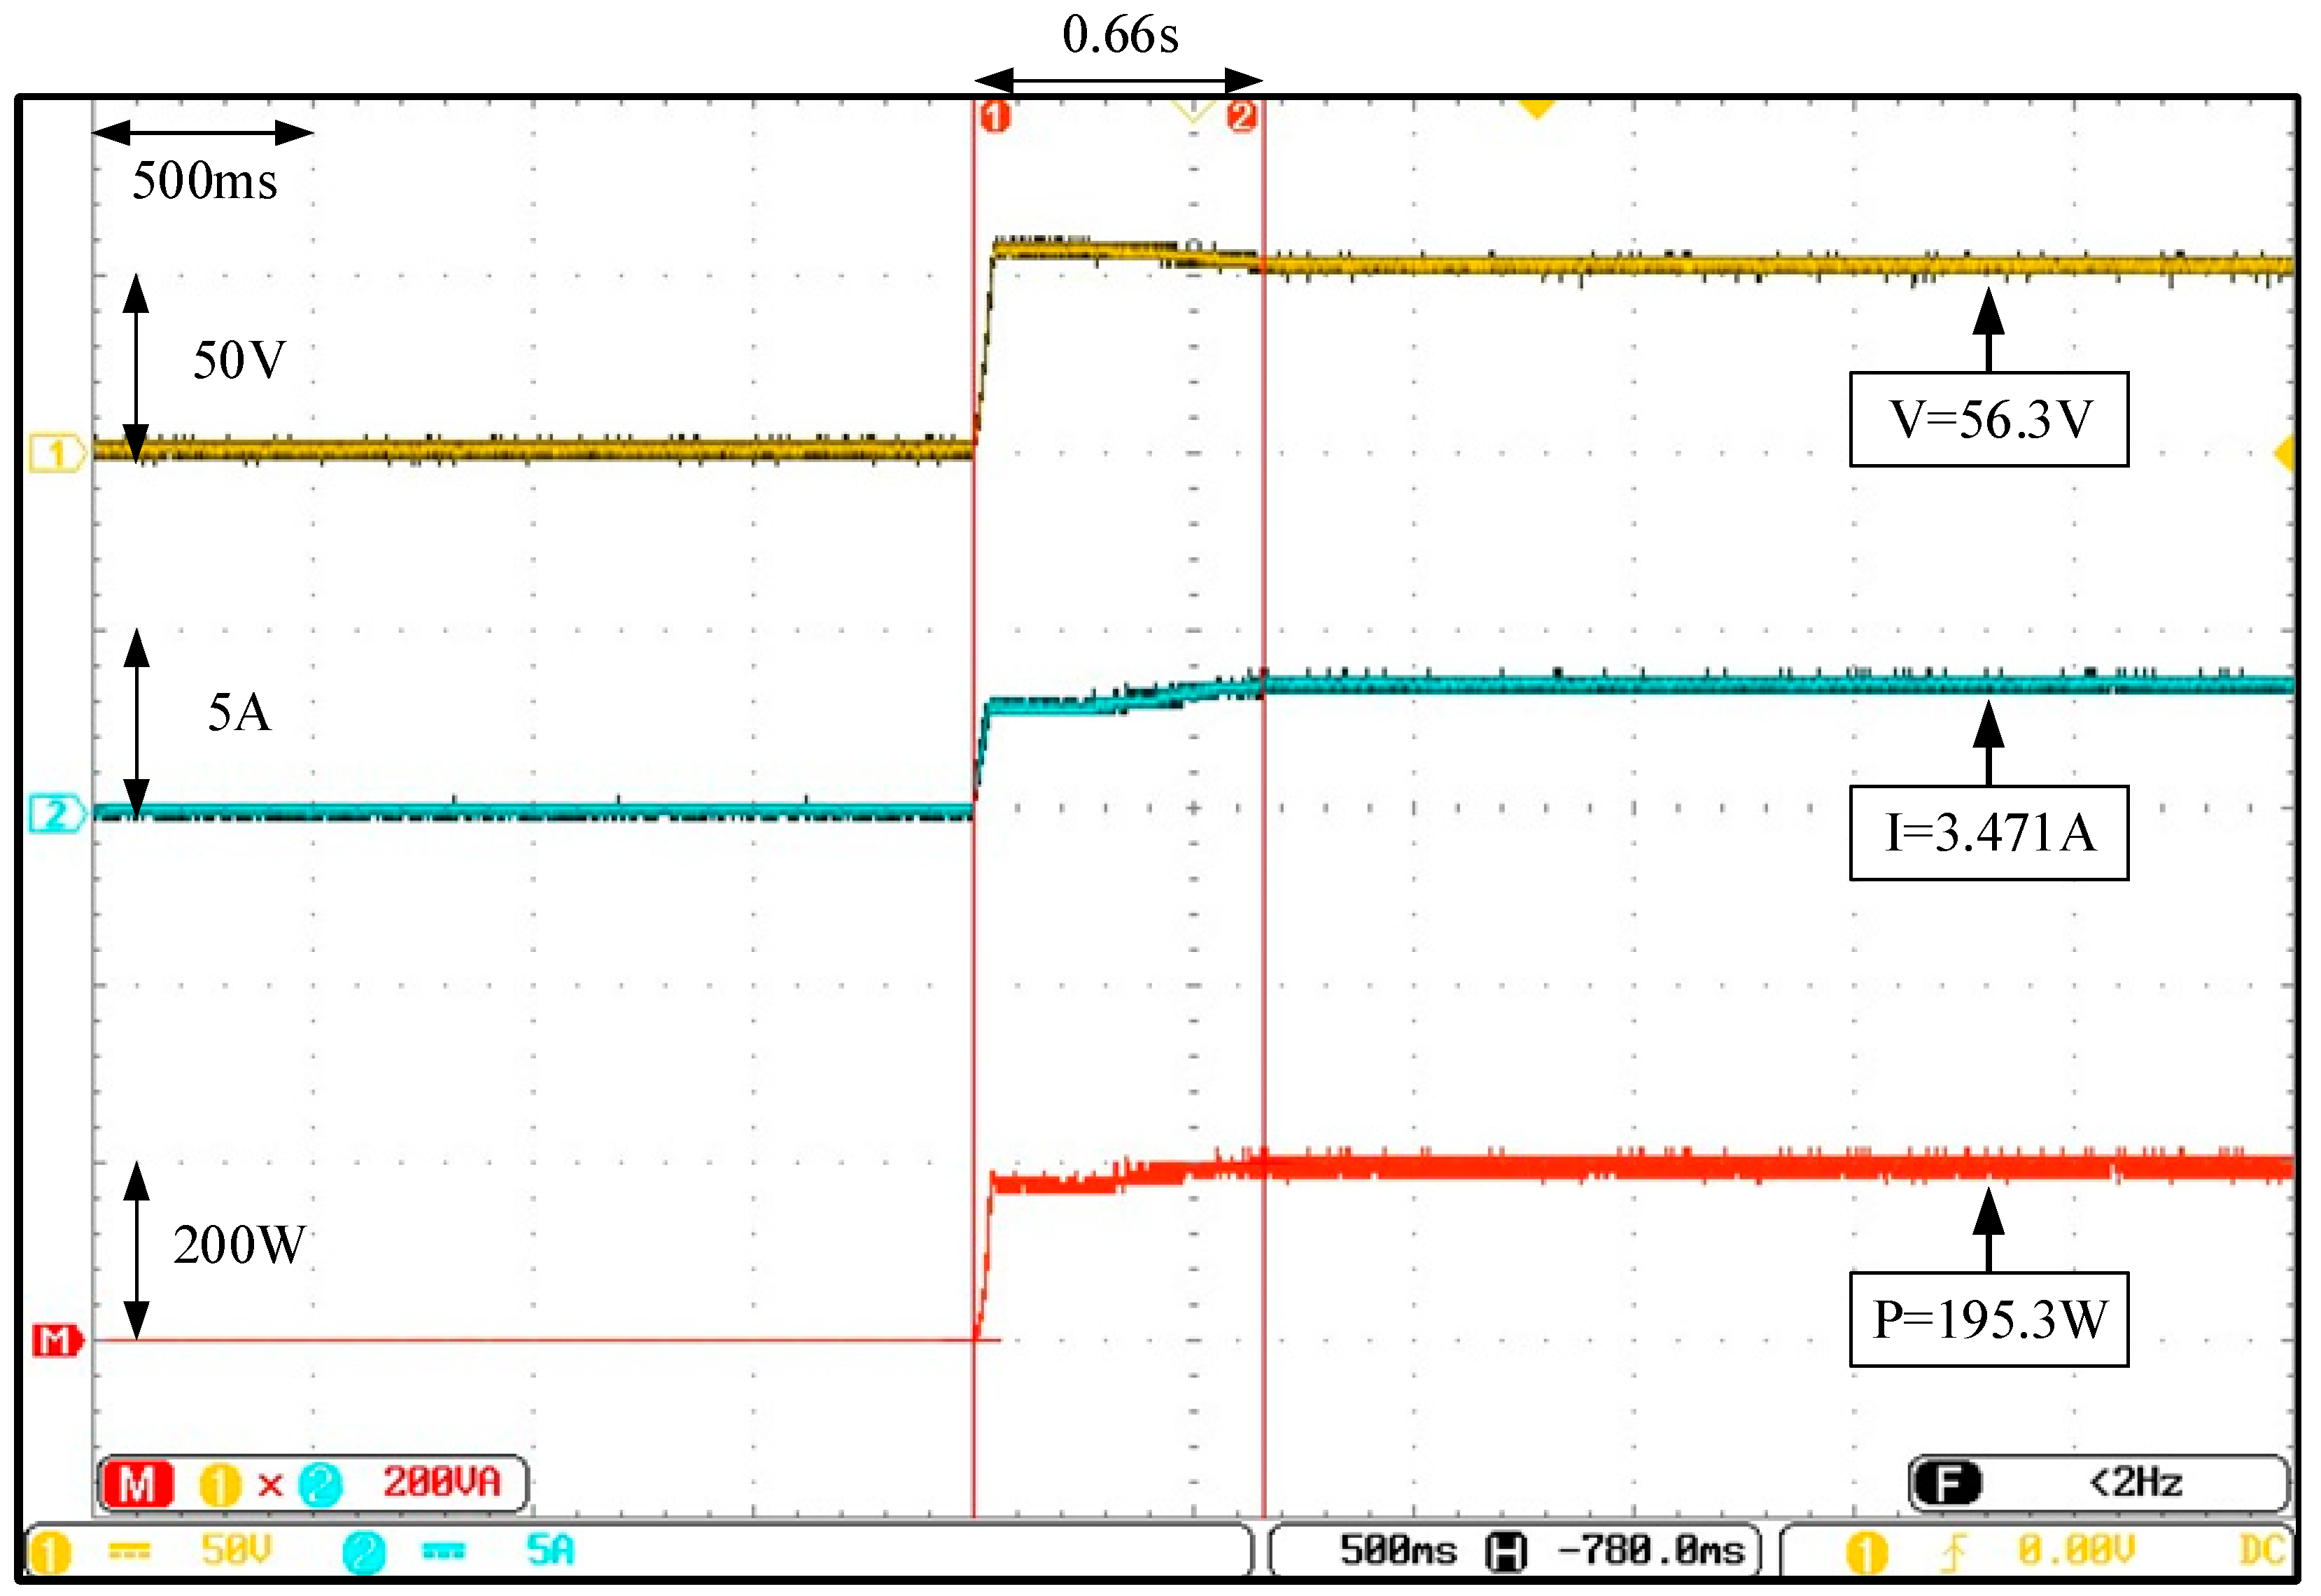
Figure 16 displays Case 2, where the actual test for the I-V and P-V characteristic curves of the PVMAs, under an STC with 90% shading on a single module, was conducted. Double peaks were presented and the true MPP was on the left with a value of 195.3 W. Figure 17, Figure 18 and Figure 19 display the actual test results for the MPPT conducted by adopting the conventional and two types of improved FAs. Since the improved FA with, both the changed iteration parameters and initial tracking voltage, was set to 0.8 times of the MPP voltage (Vmp), it can be observed, from the figures, that the initial tracking voltage was extremely close to the true MPP voltage, thus the tracking speed was better than the conventional FA and improved FA with only the changed iteration parameters.
- (3)
- Actual Test in Case 3
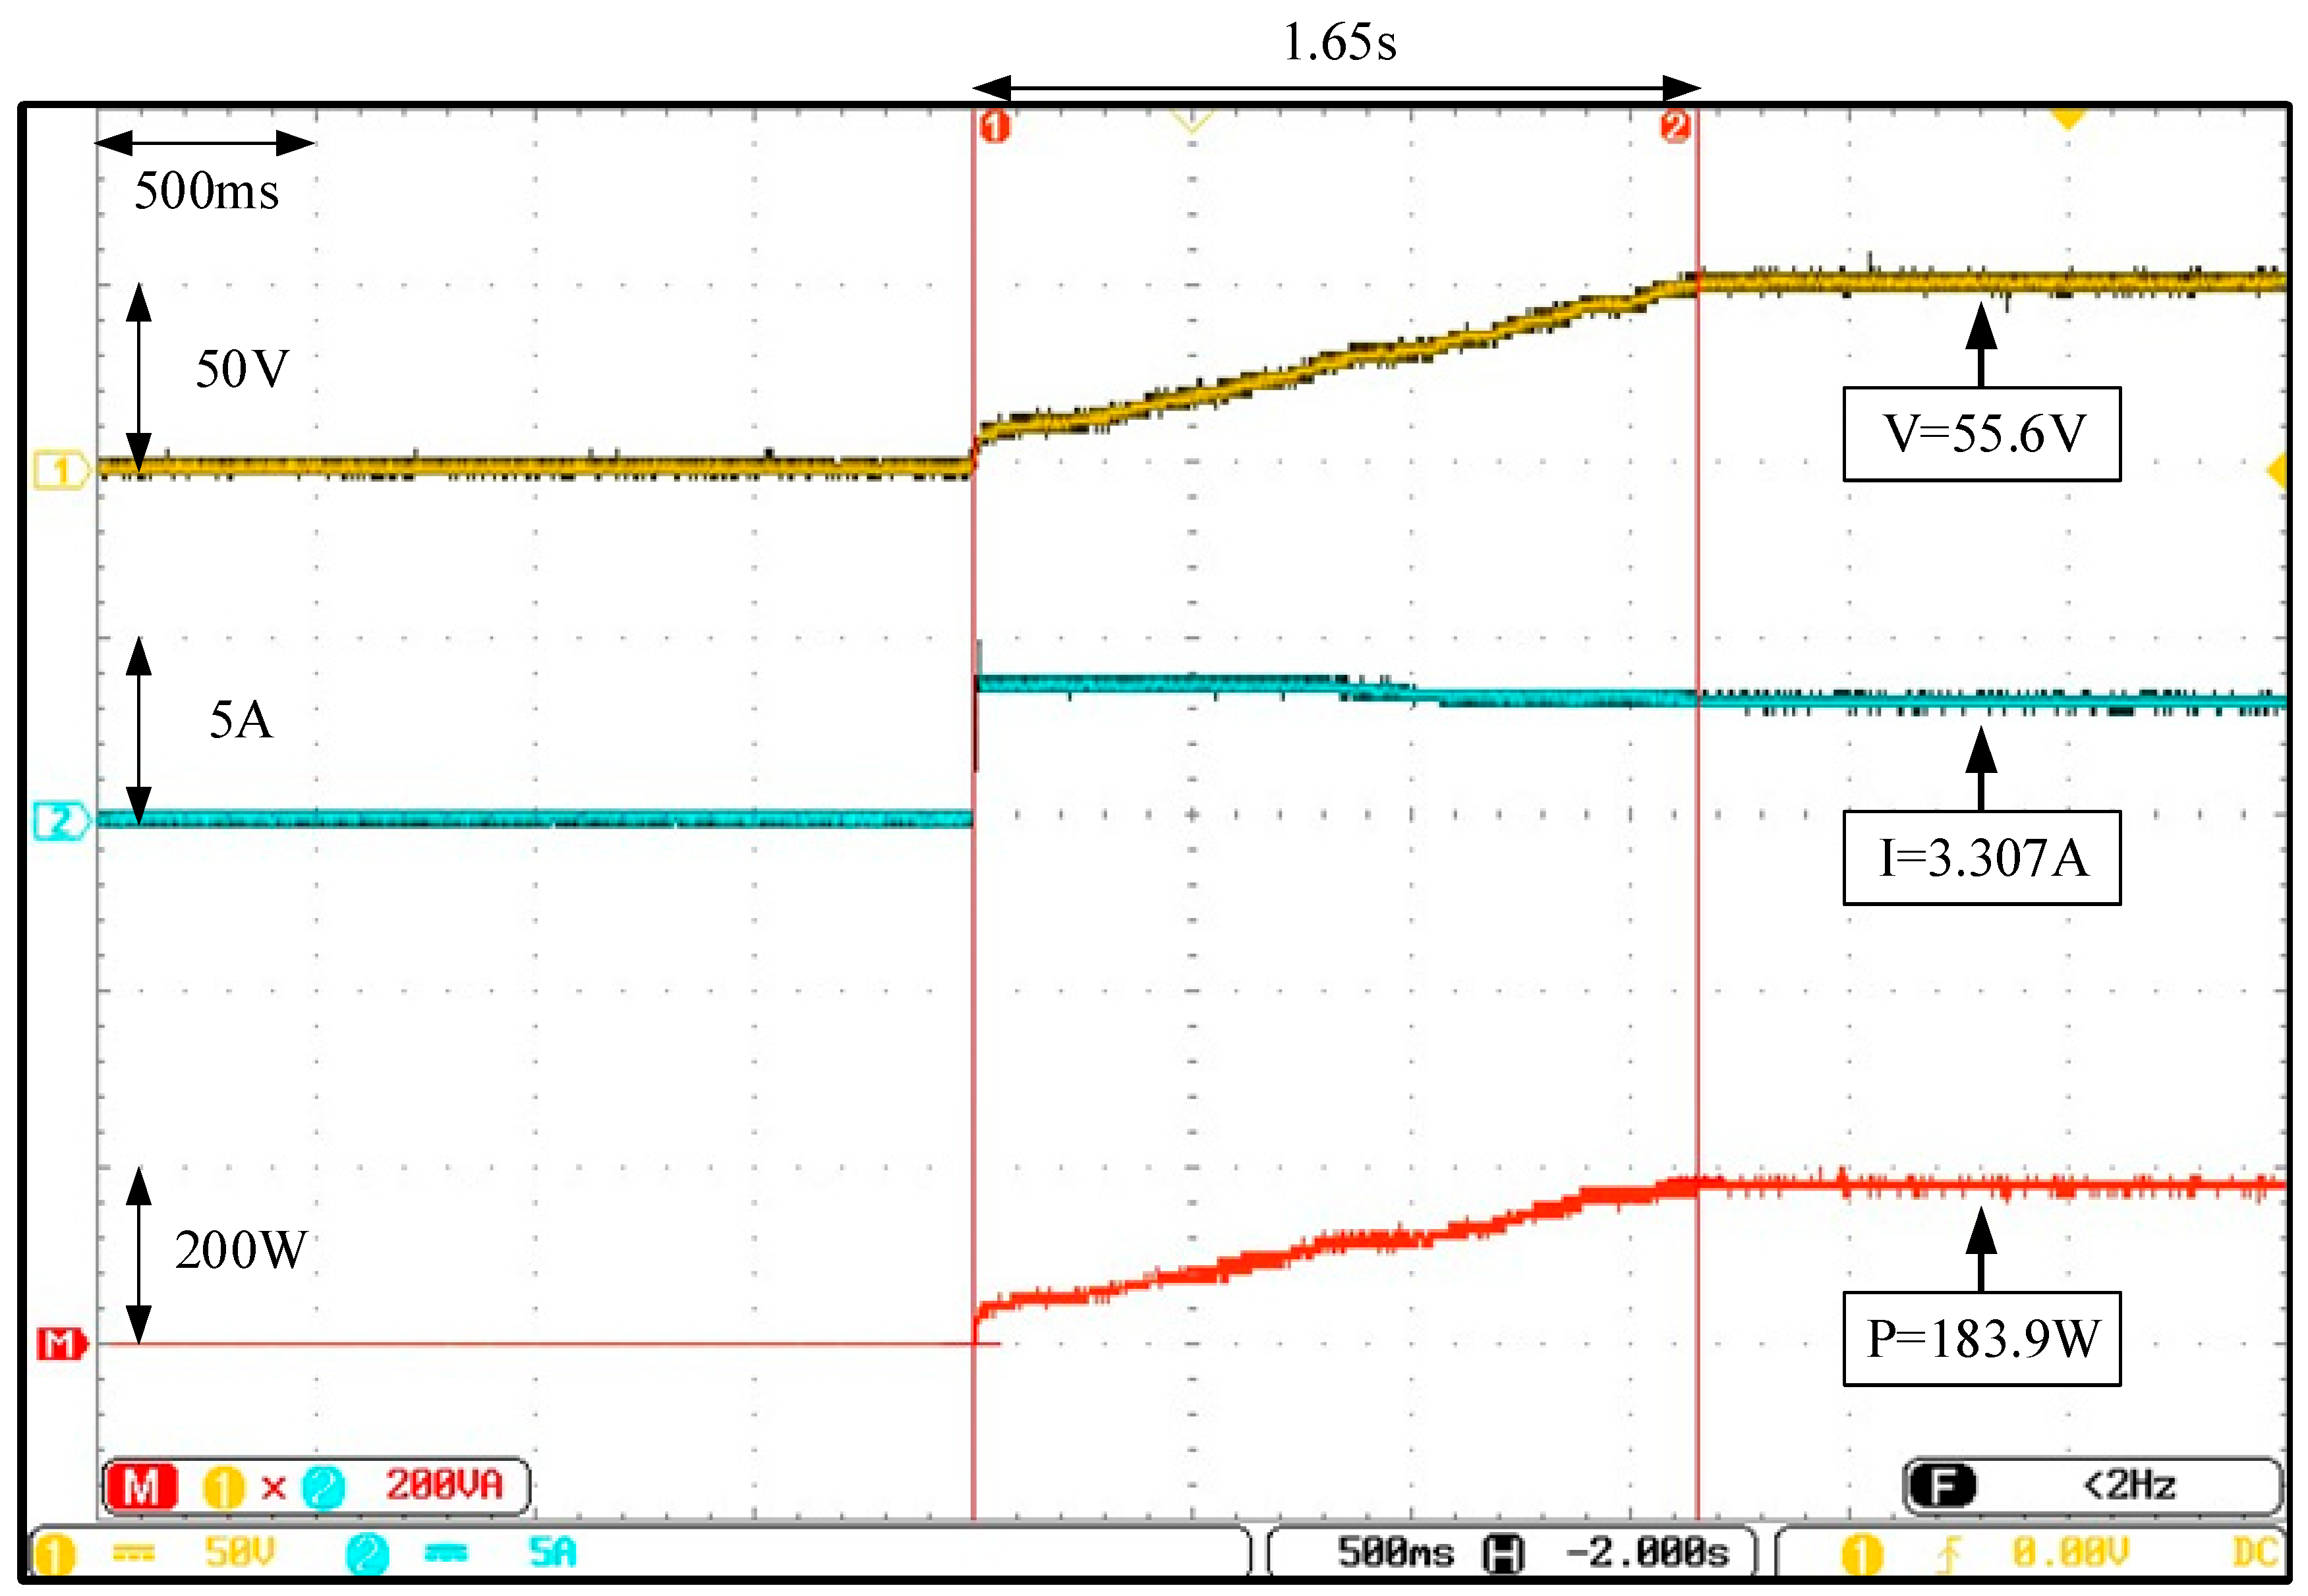
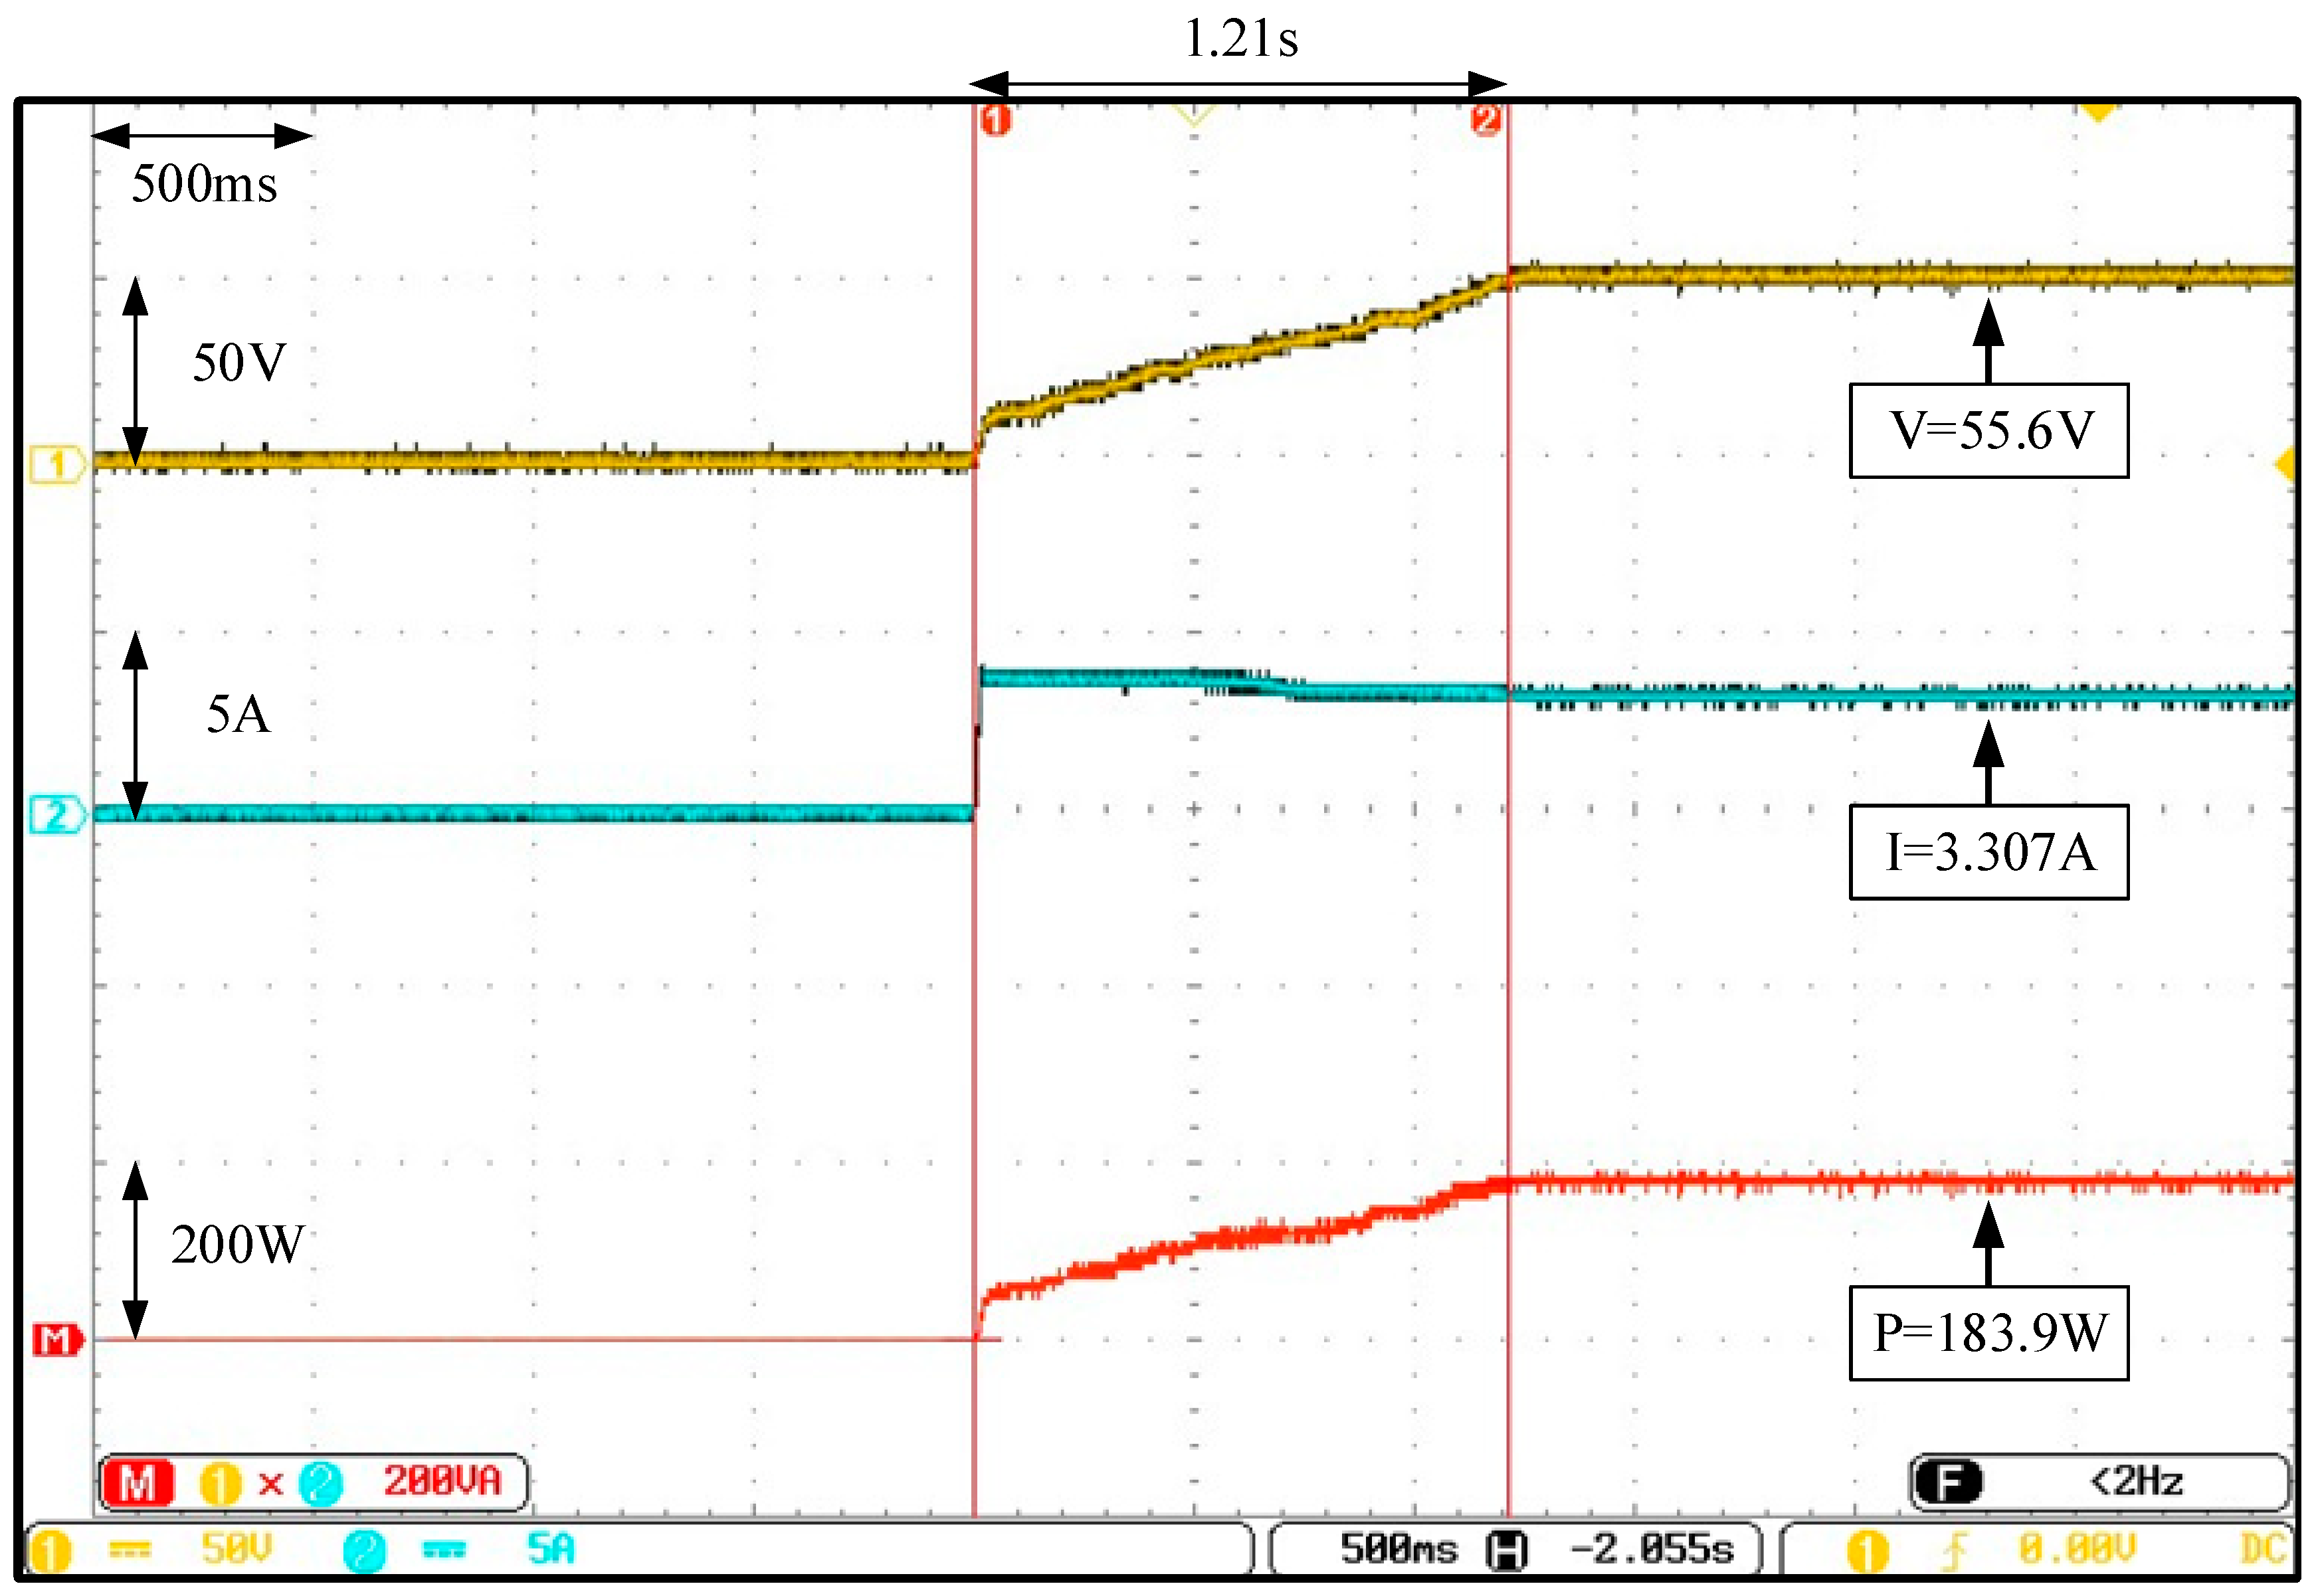
Figure 20 displays Case 3, where the actual test for the I-V and P-V characteristic curves of the PVMAs, under STCs with 30% and 90% shading on two modules, was conducted. Triple peaks were presented and the true MPP was in the middle with a value of 183.9 W. Figure 21, Figure 22 and Figure 23 display the actual test results for the MPPT conducted by adopting the conventional and two types of improved FAs. Since the improved FA, with both the changed iteration parameters and initial tracking voltage, was set to 0.8 times of the MPP voltage (Vmp), the speed of the tracking response from the proposed FA, with both the changed iteration parameters and initial tracking voltage, was significantly better than the conventional FA and improved FA with only the changed iteration parameters.
- (4)
- Actual Test in Case 4
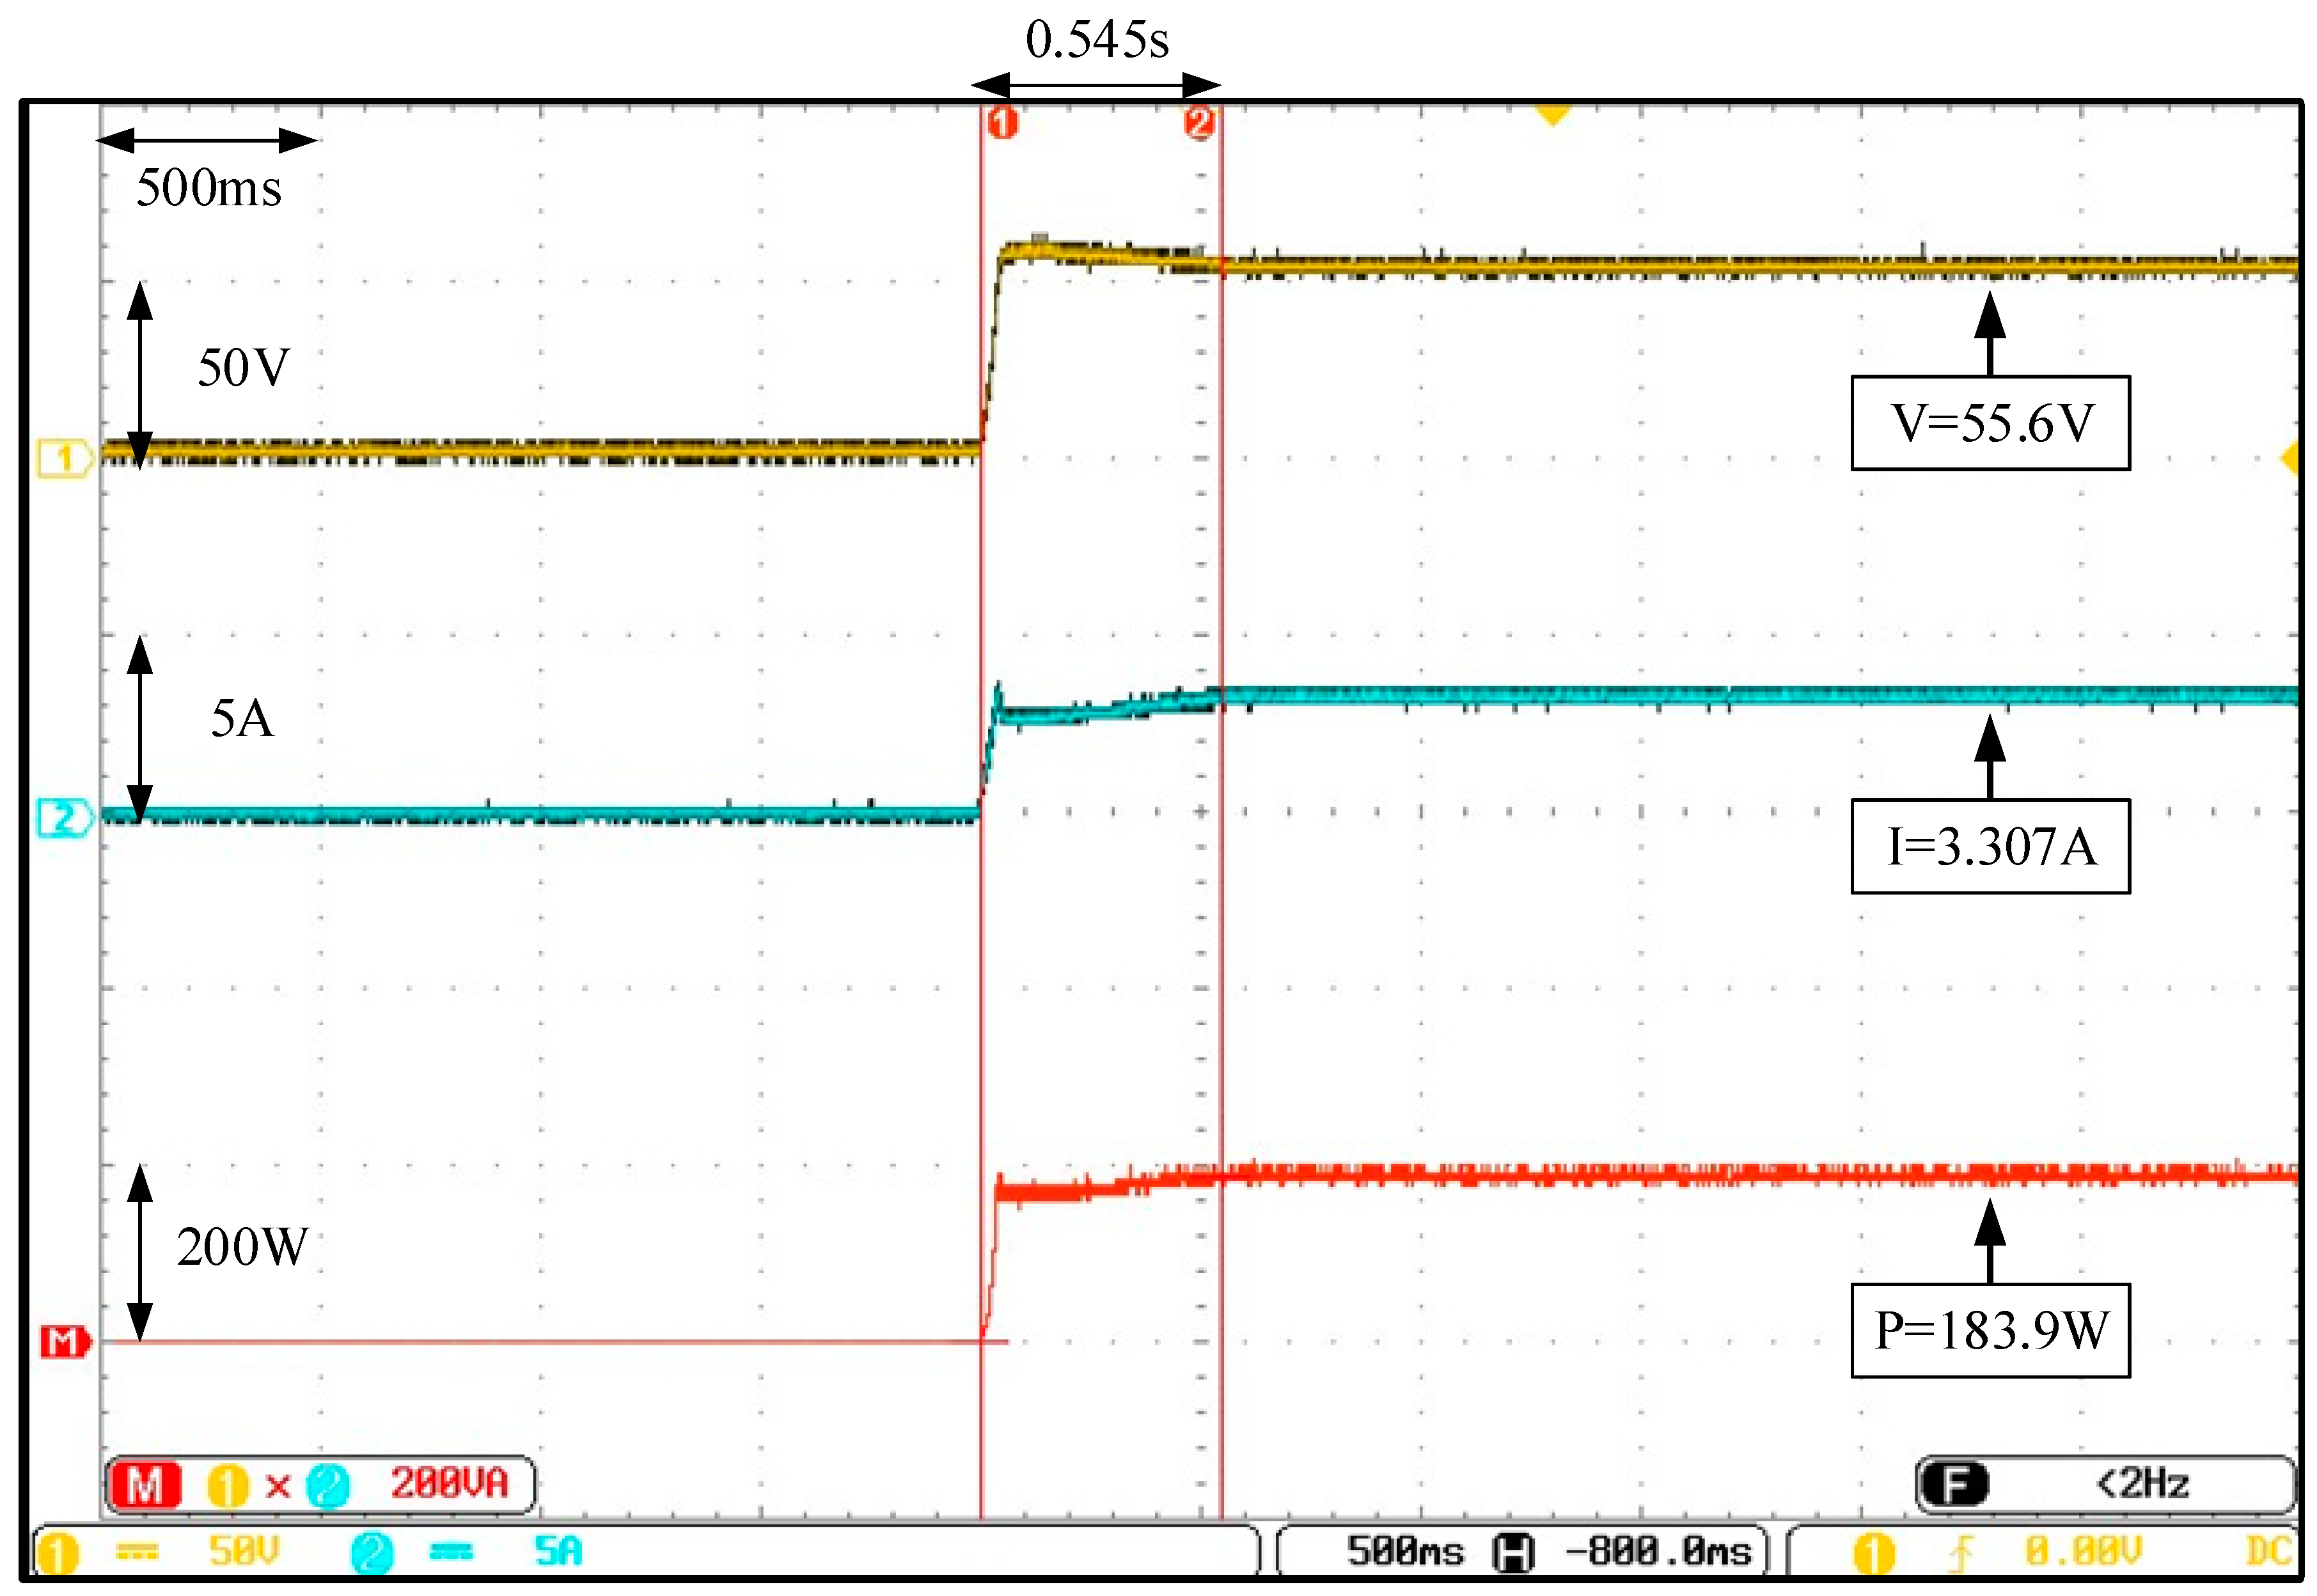
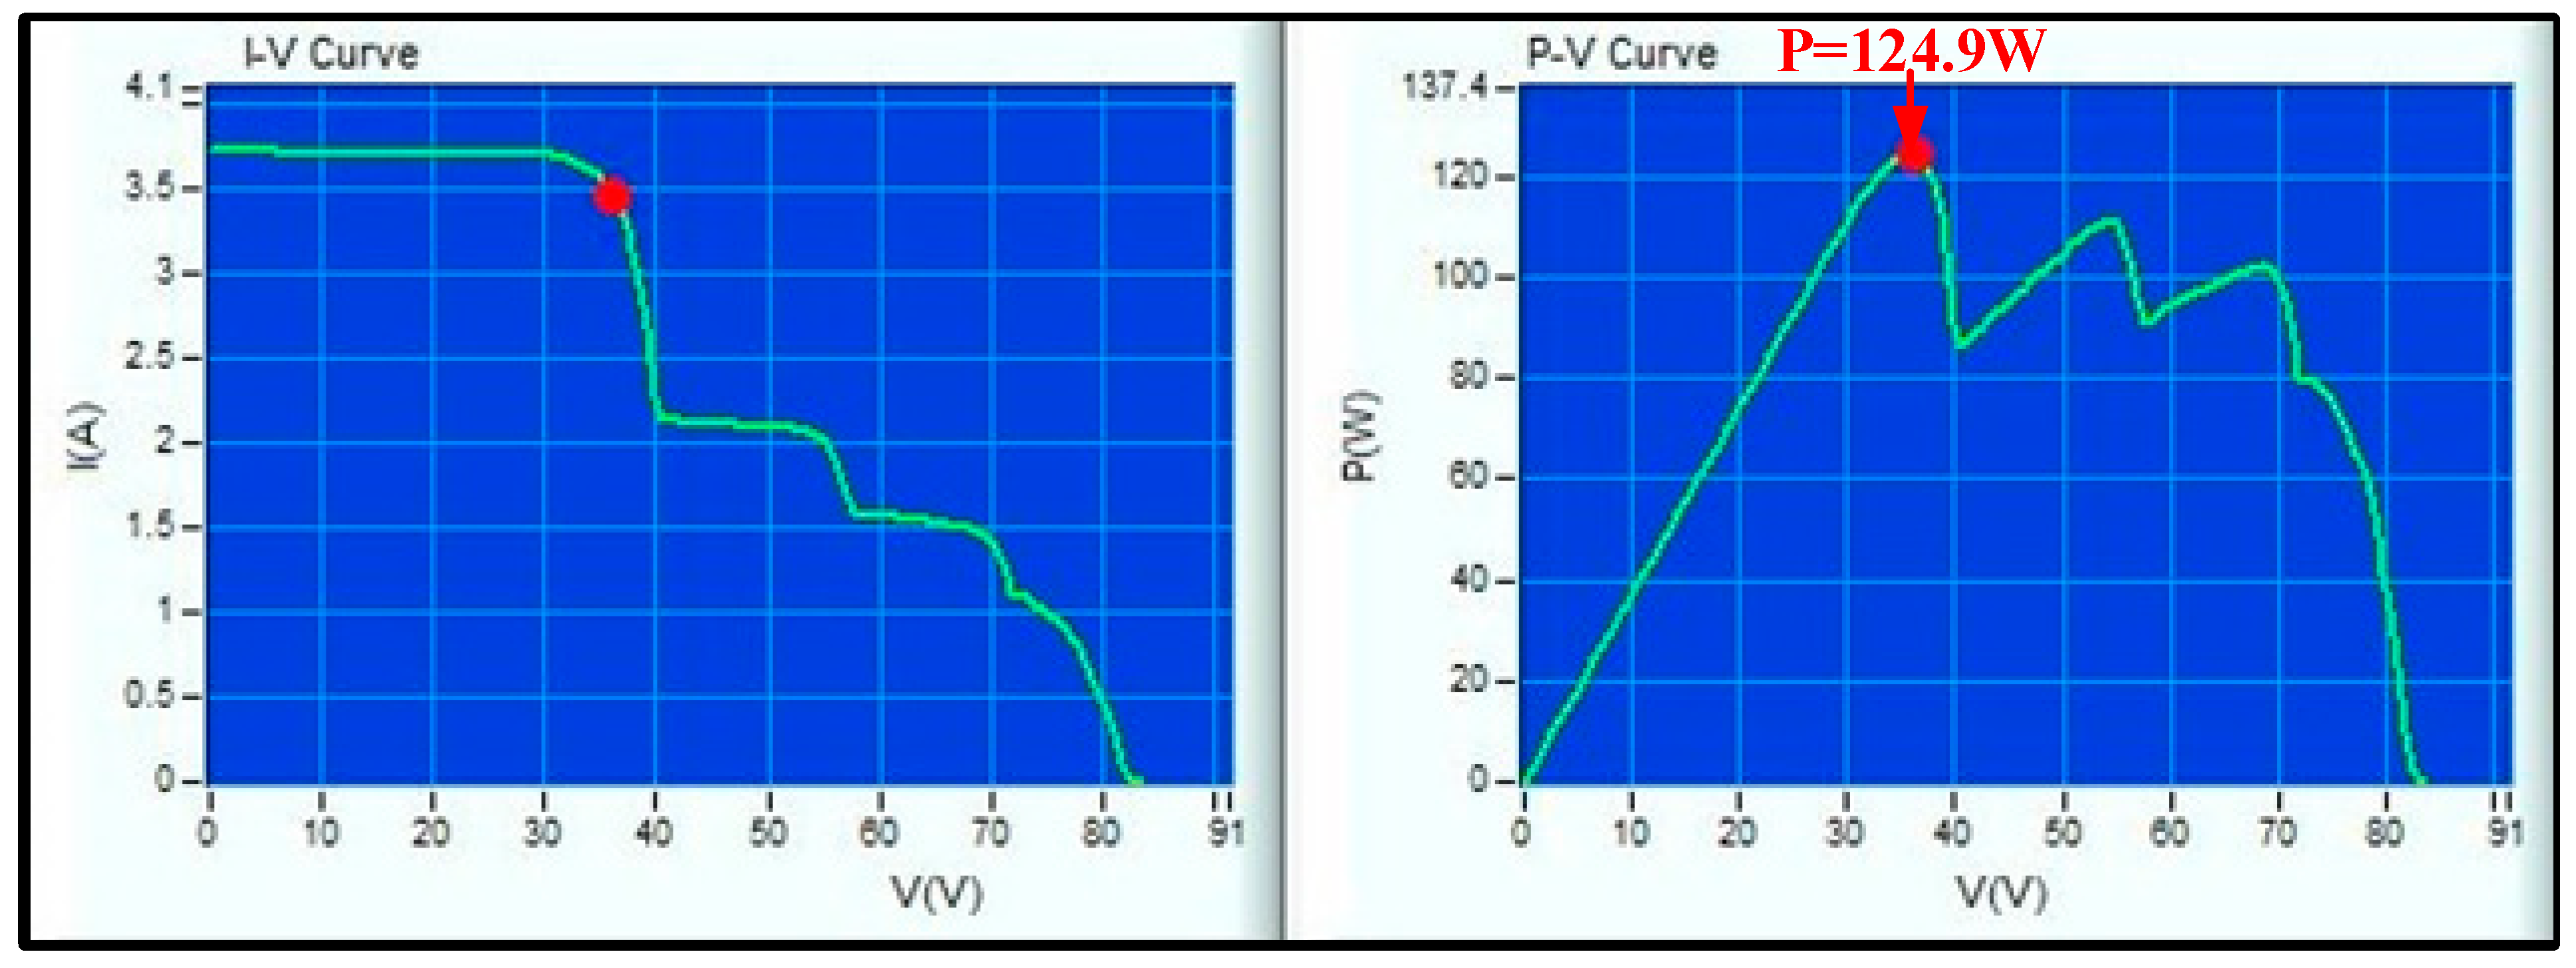
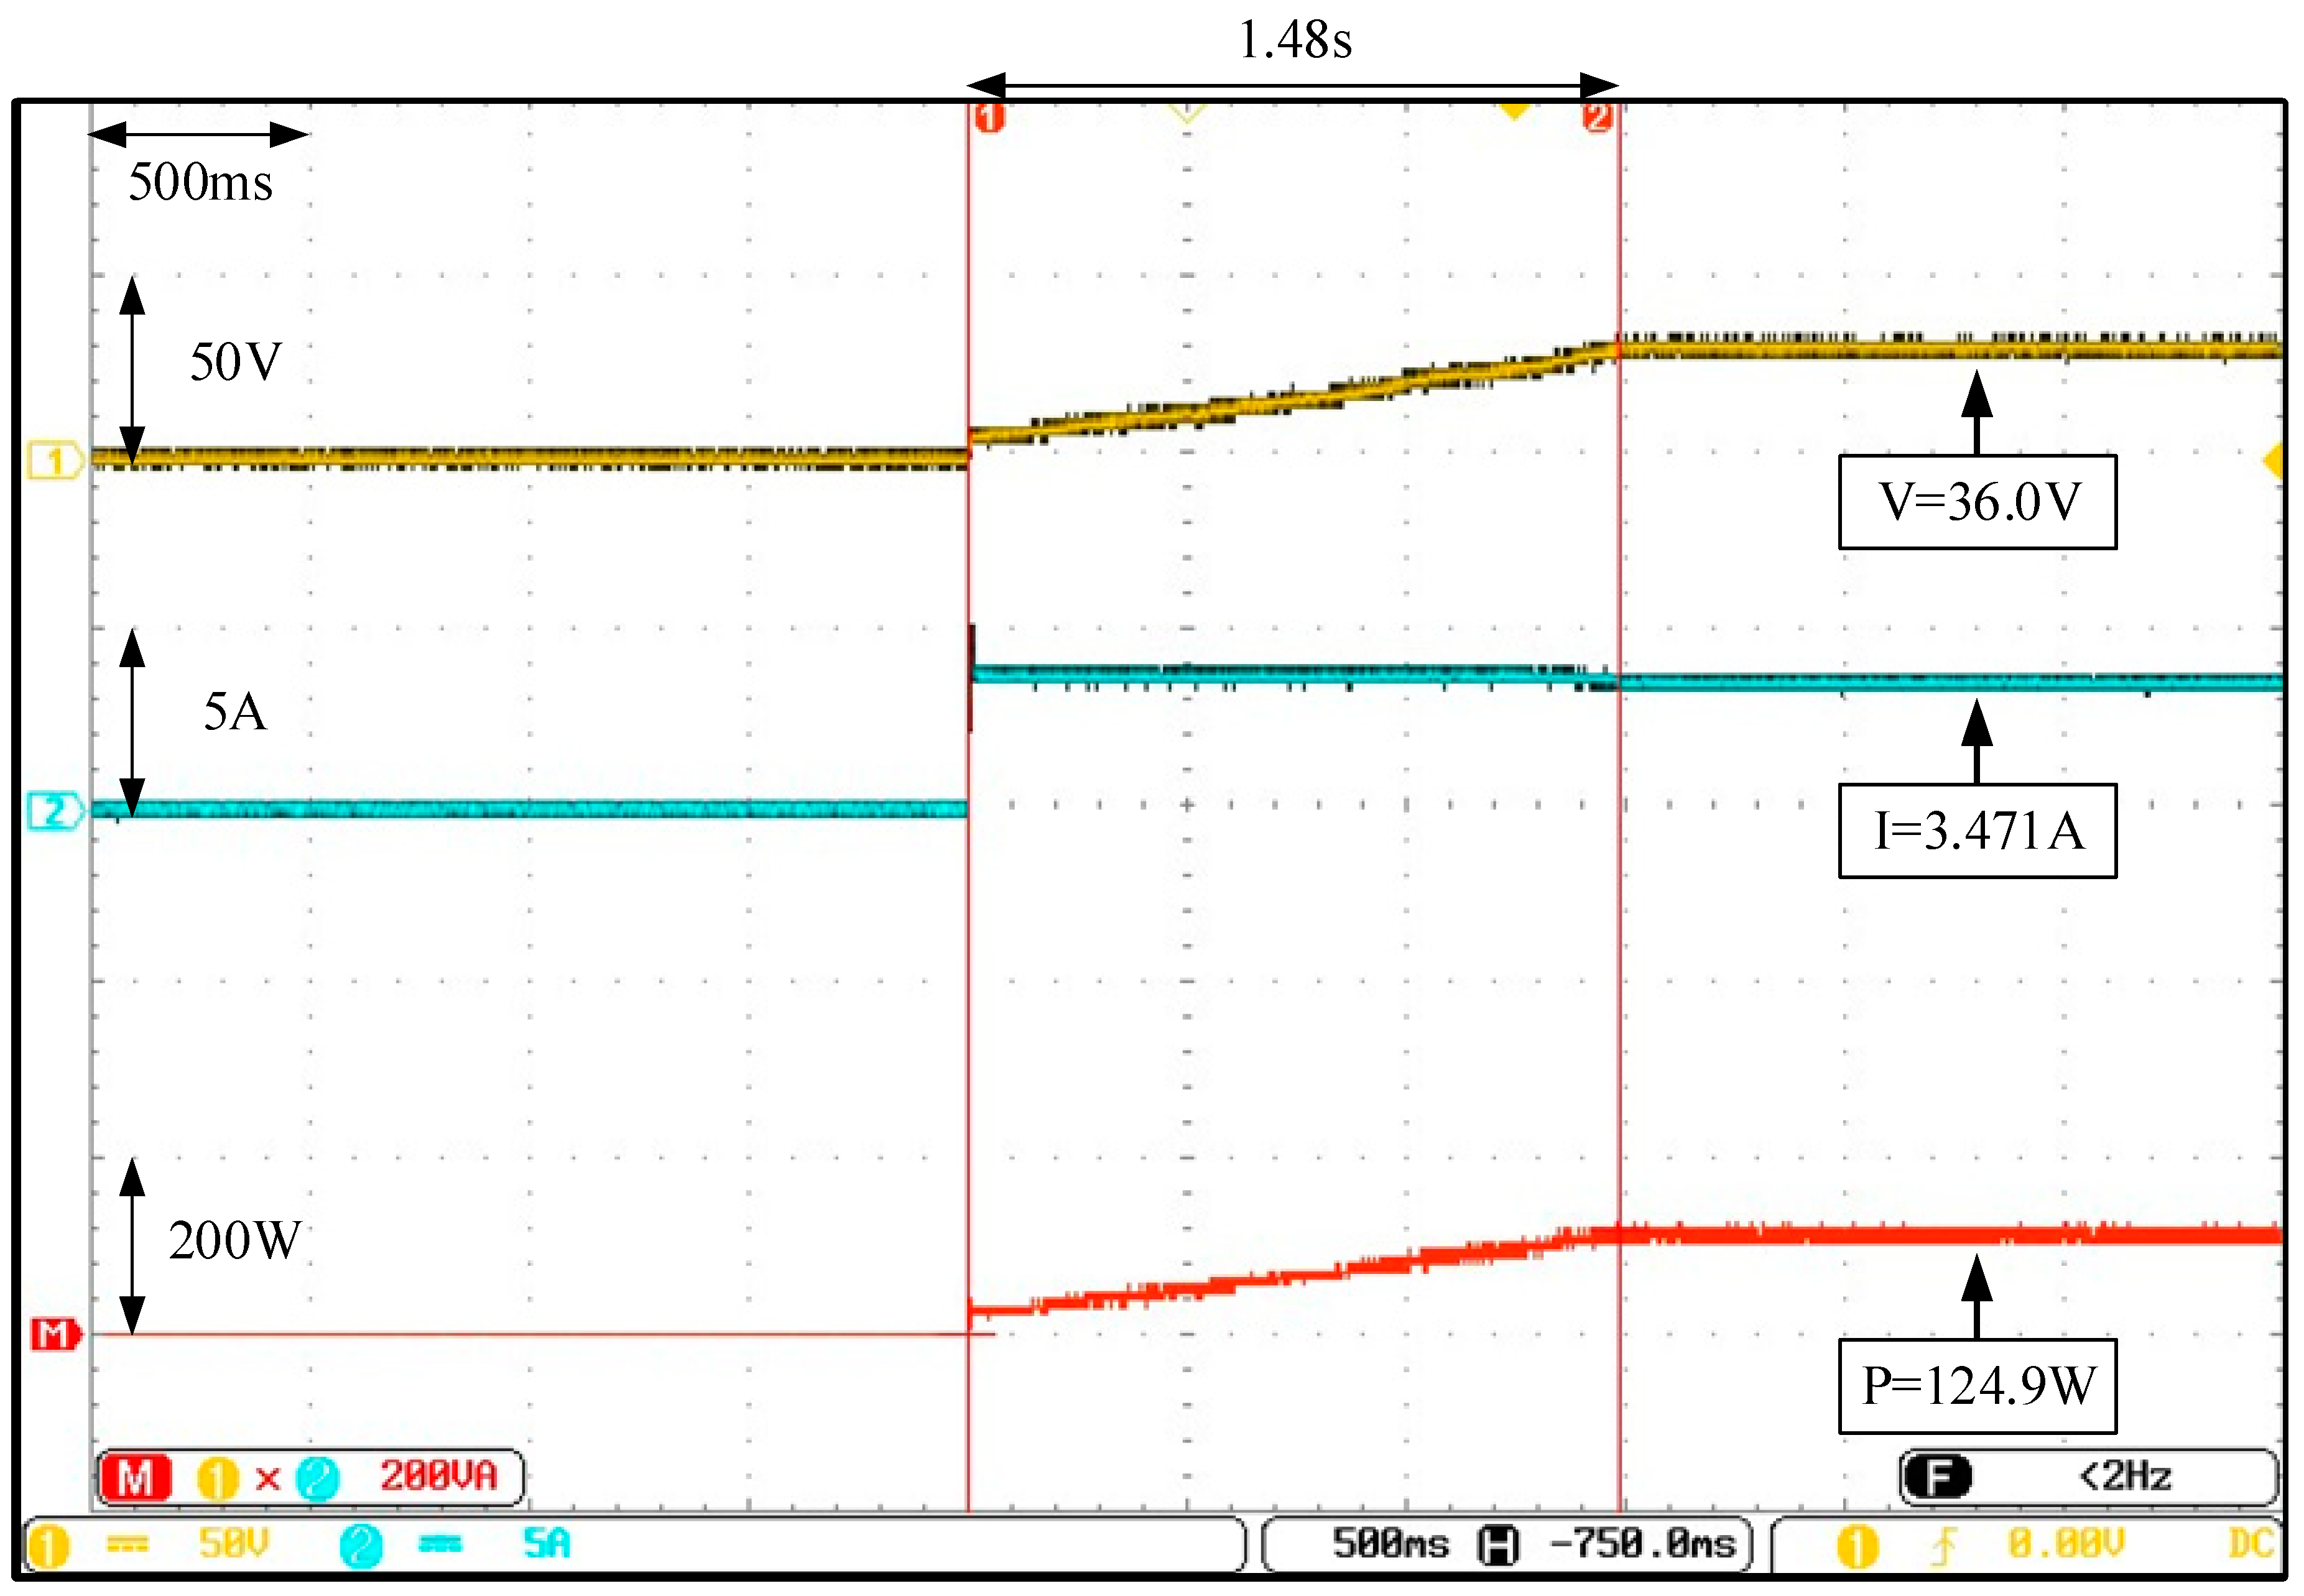
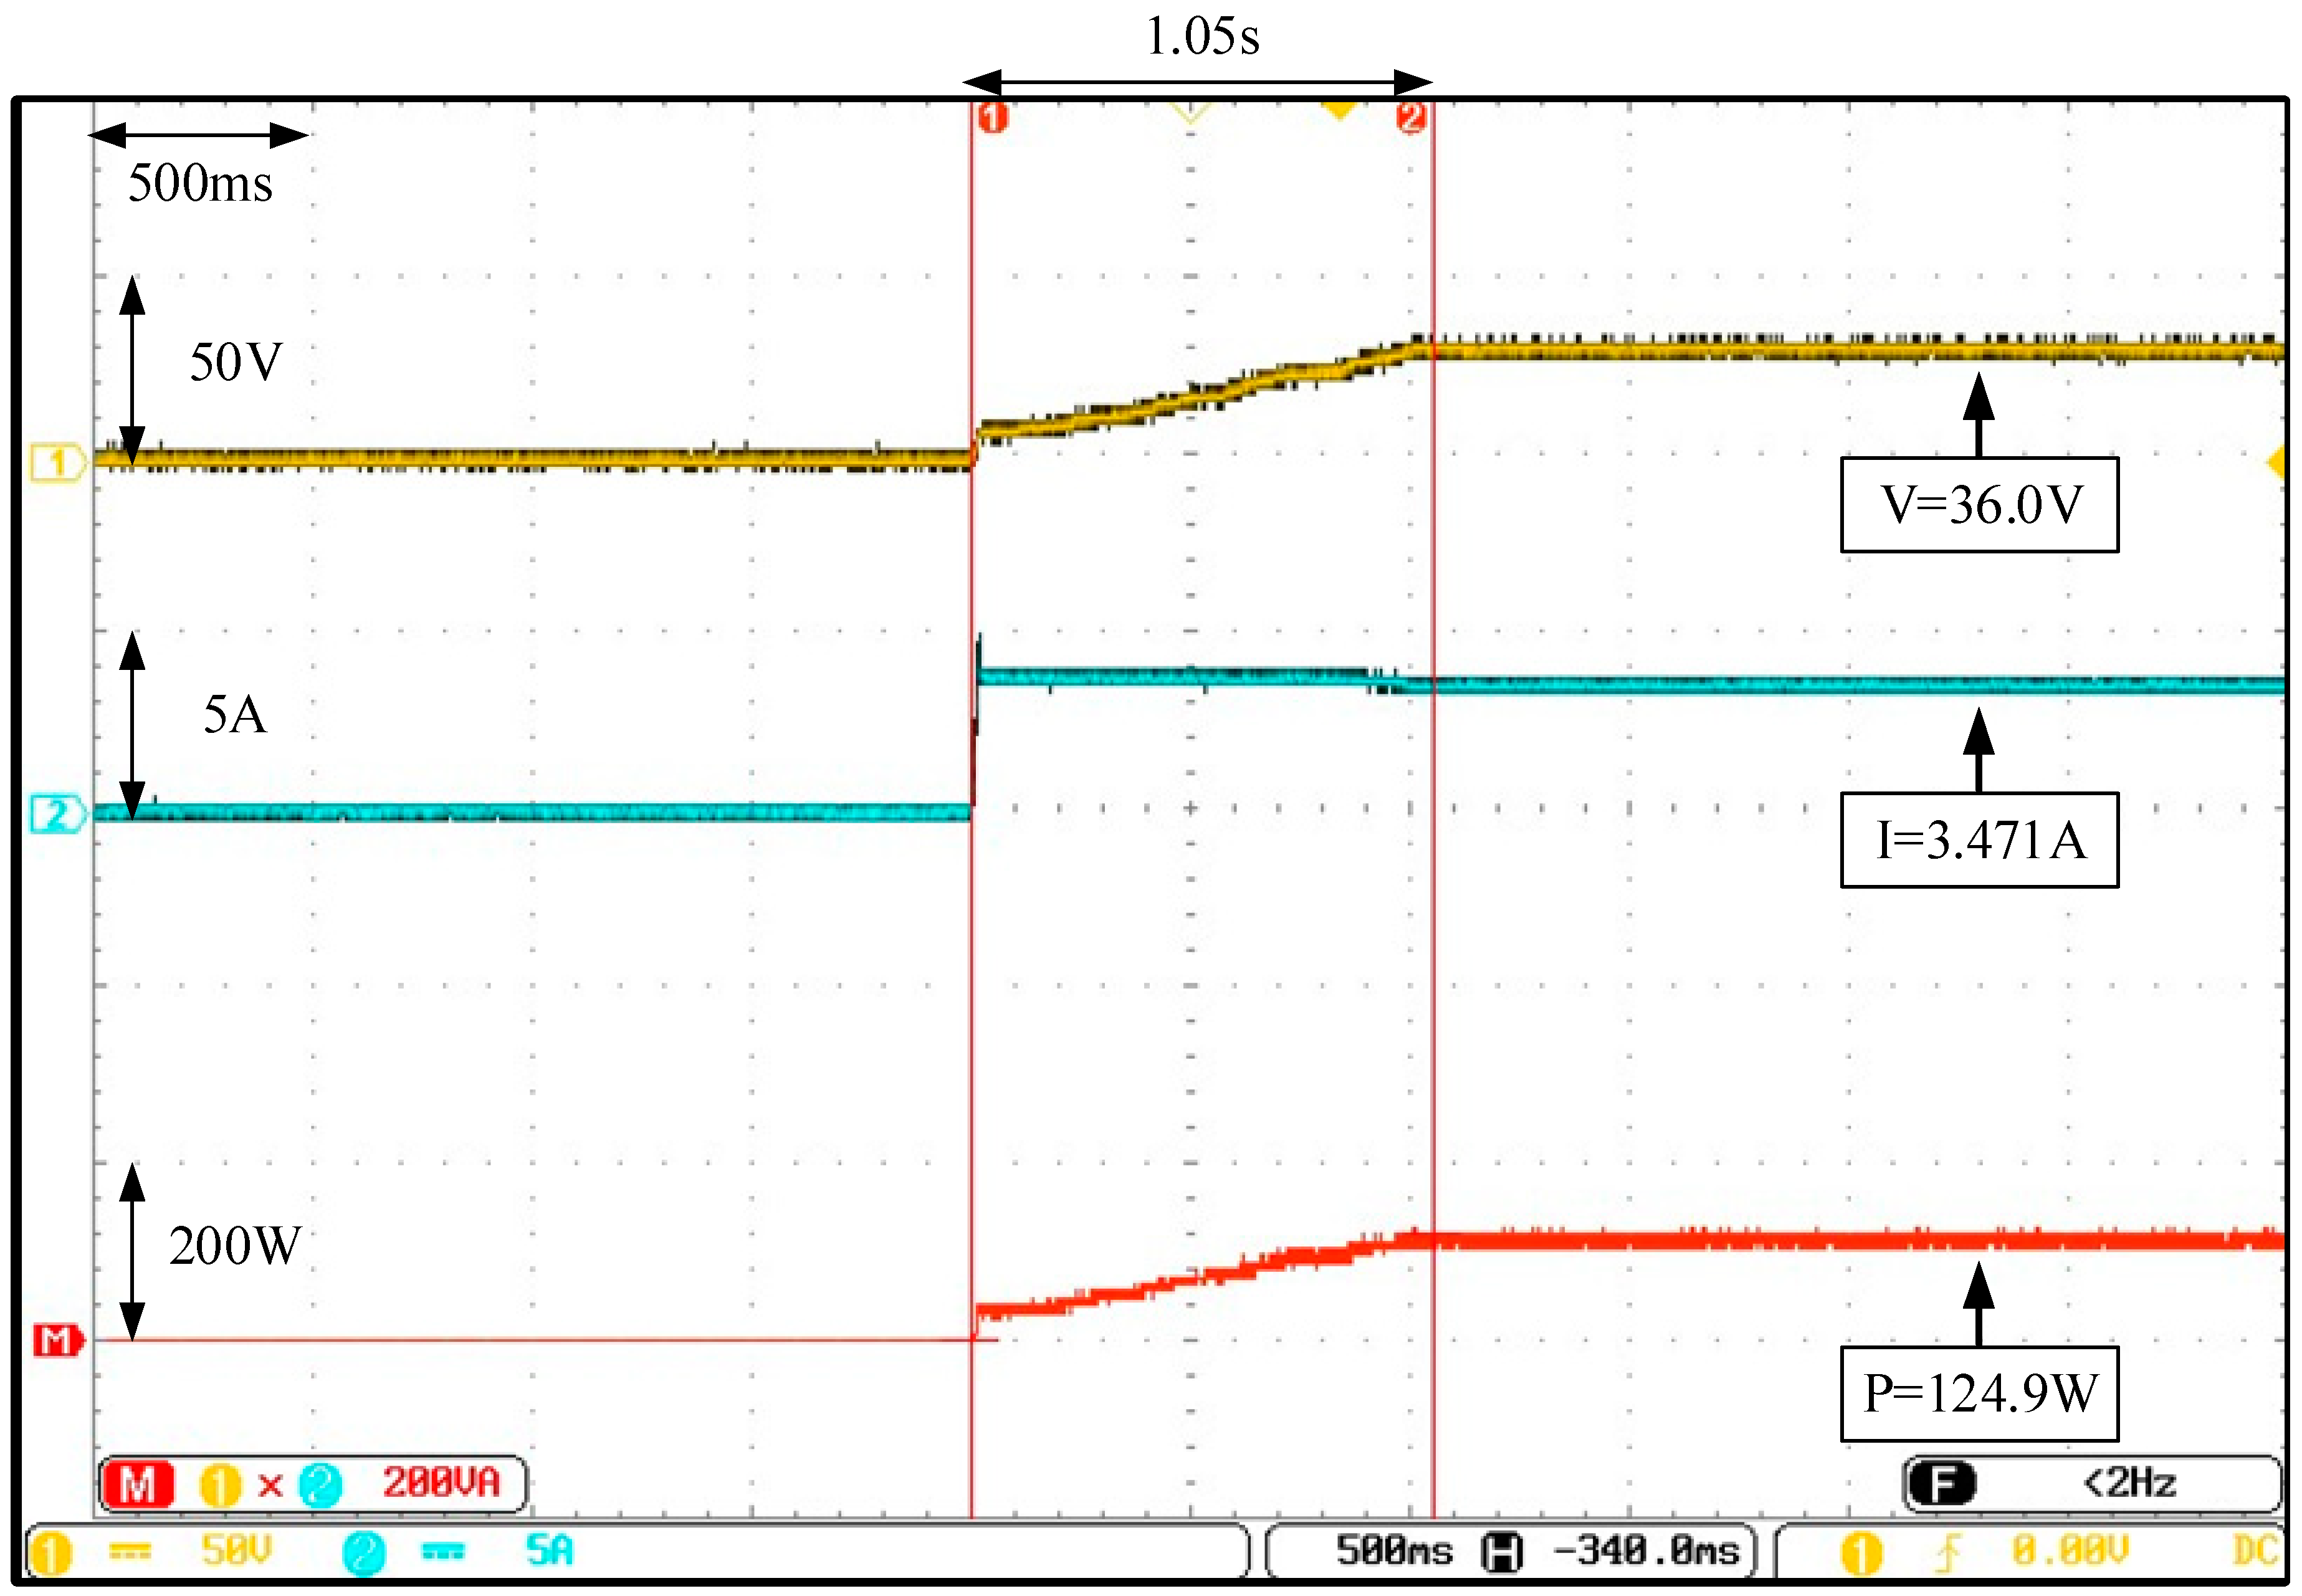
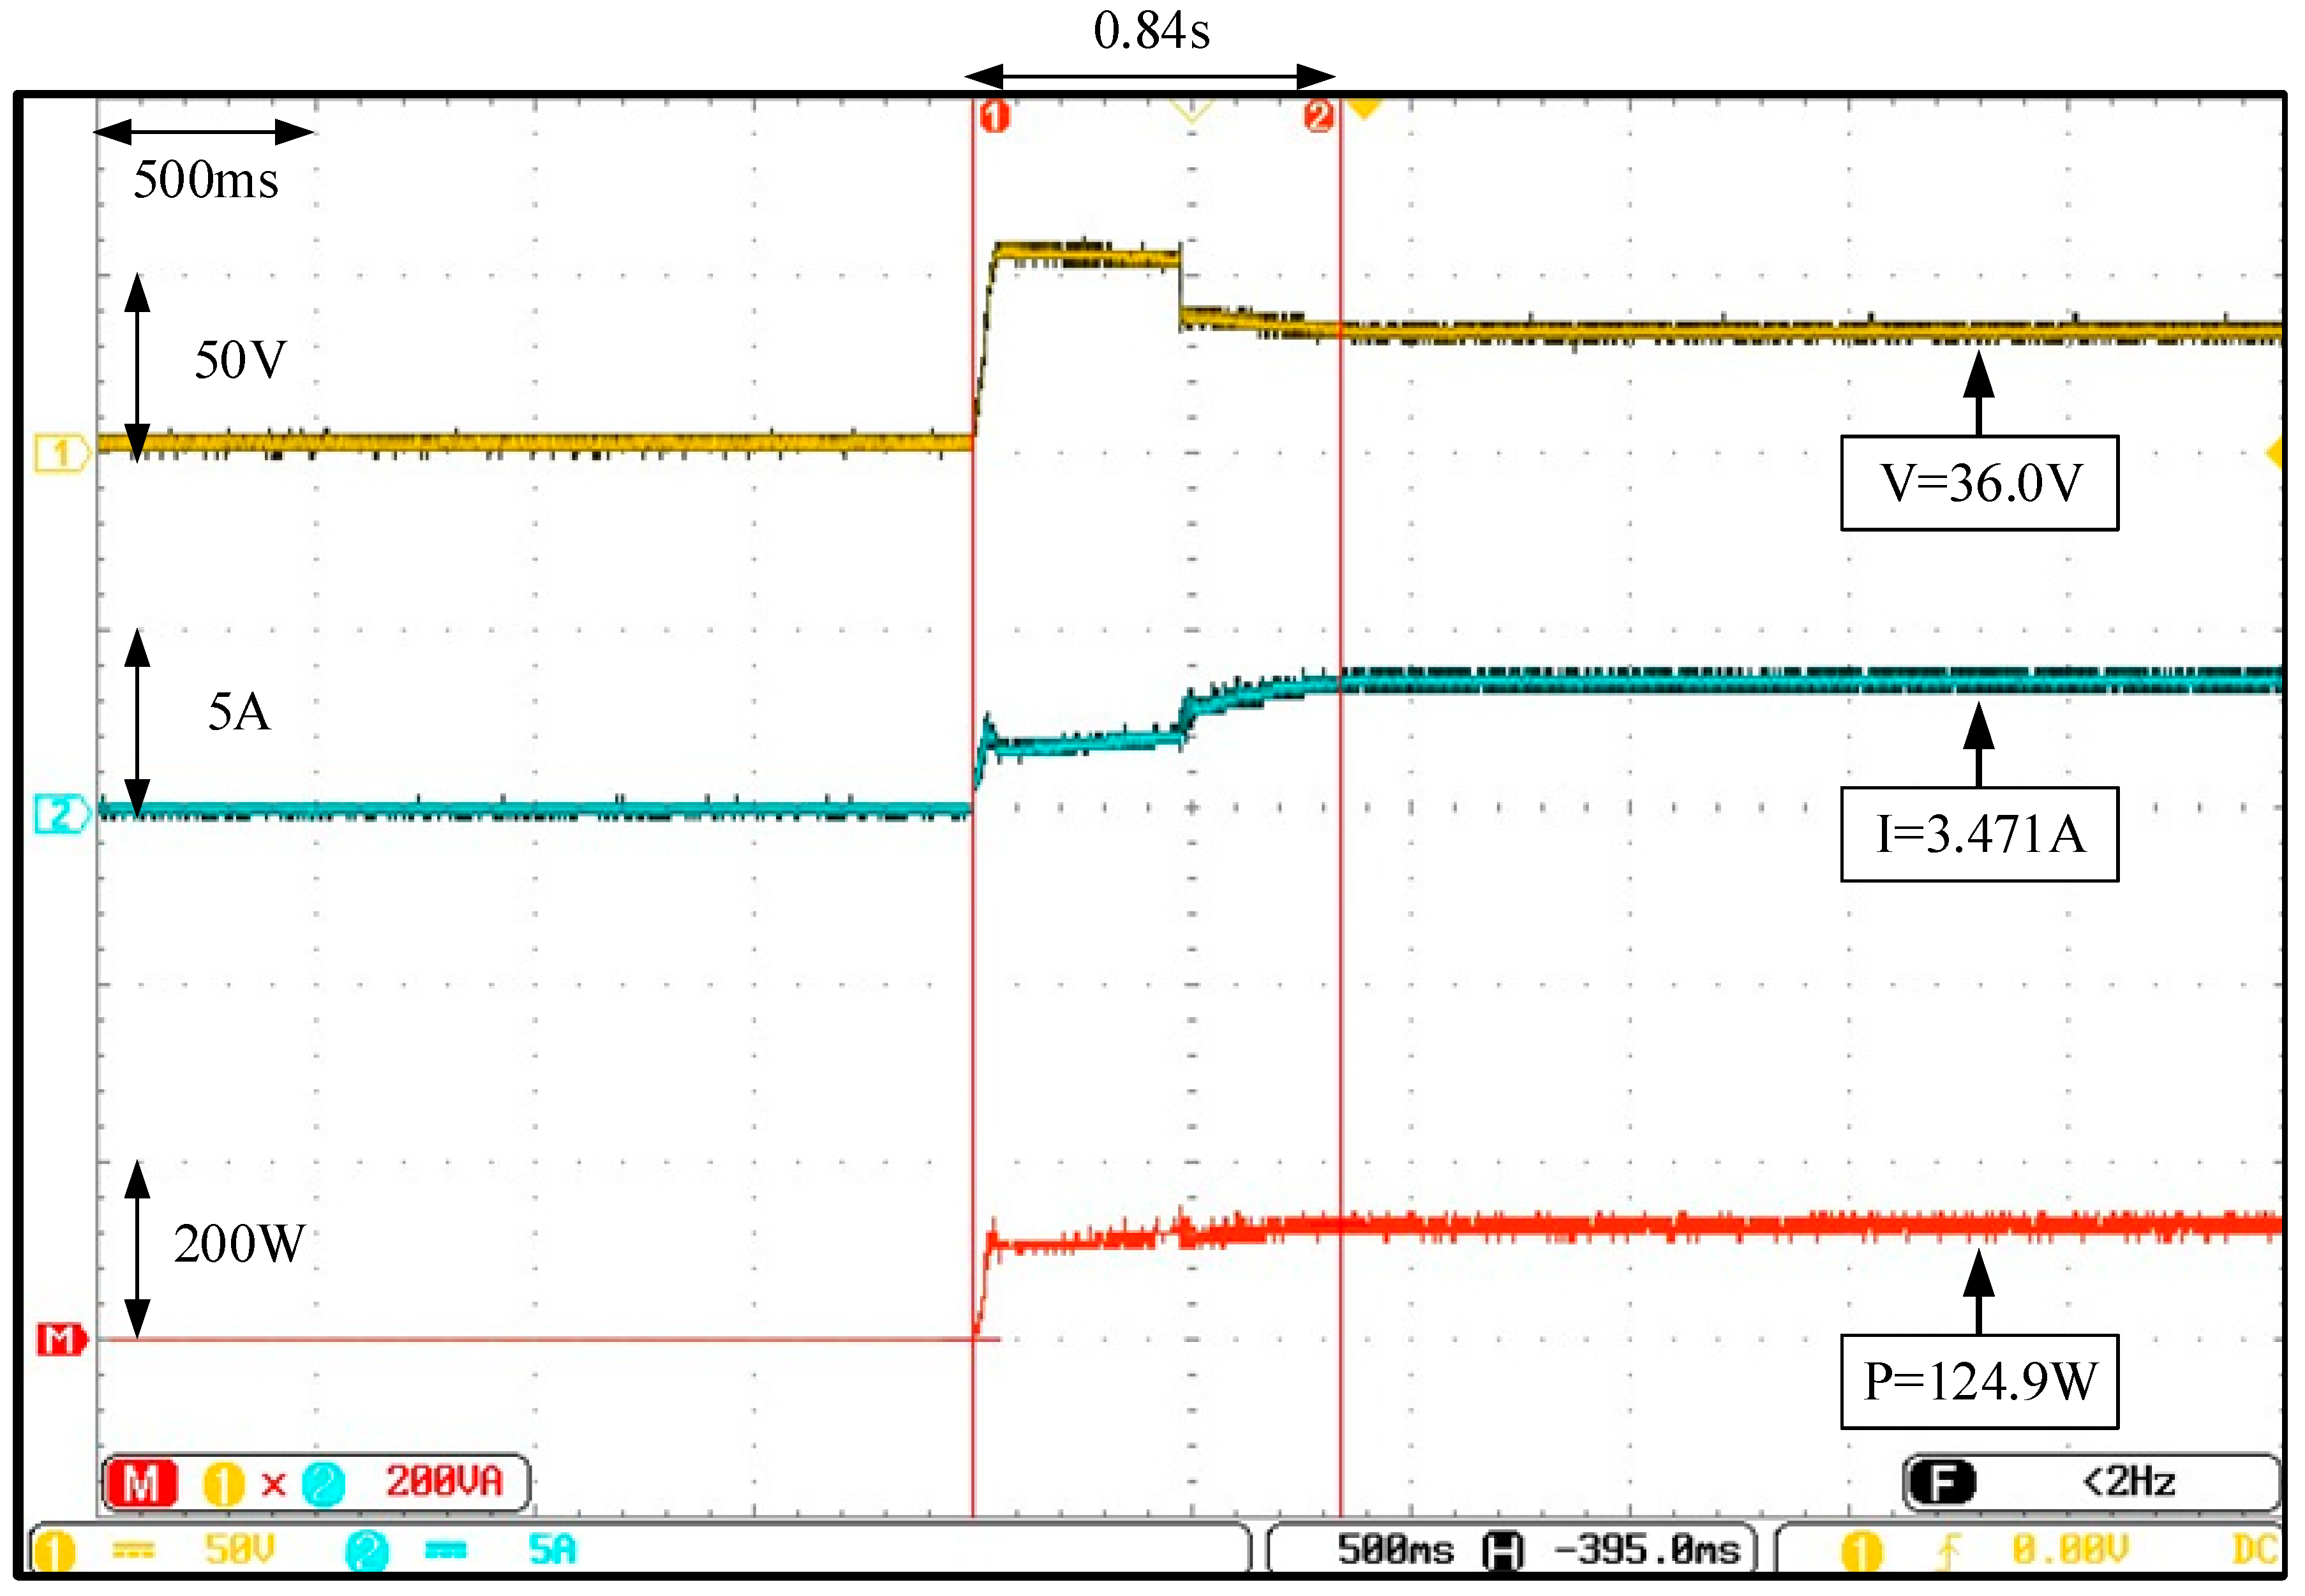
Figure 24 displays Case 4, where the actual test for the I-V and P-V characteristic curves of the PVMAs, under STCs with 70% and 90% shading on two modules, was conducted. Triple peaks were still presented and the true MPP was on the left end with a value of 124.9 W. Figure 25, Figure 26 and Figure 27 display the actual test results of the MPPT, where the conventional FA and two types of improved FAs were adopted, respectively. Although the proposed FA, with both the changed iteration parameters and initial tracking voltage, would still track the LMPP, it could quickly escape the LMPP and track the GMPP, the tracking speed was relatively faster than the conventional FA and improved FA with only the changed iteration parameters.
- (5)
- Actual Test in Case 5
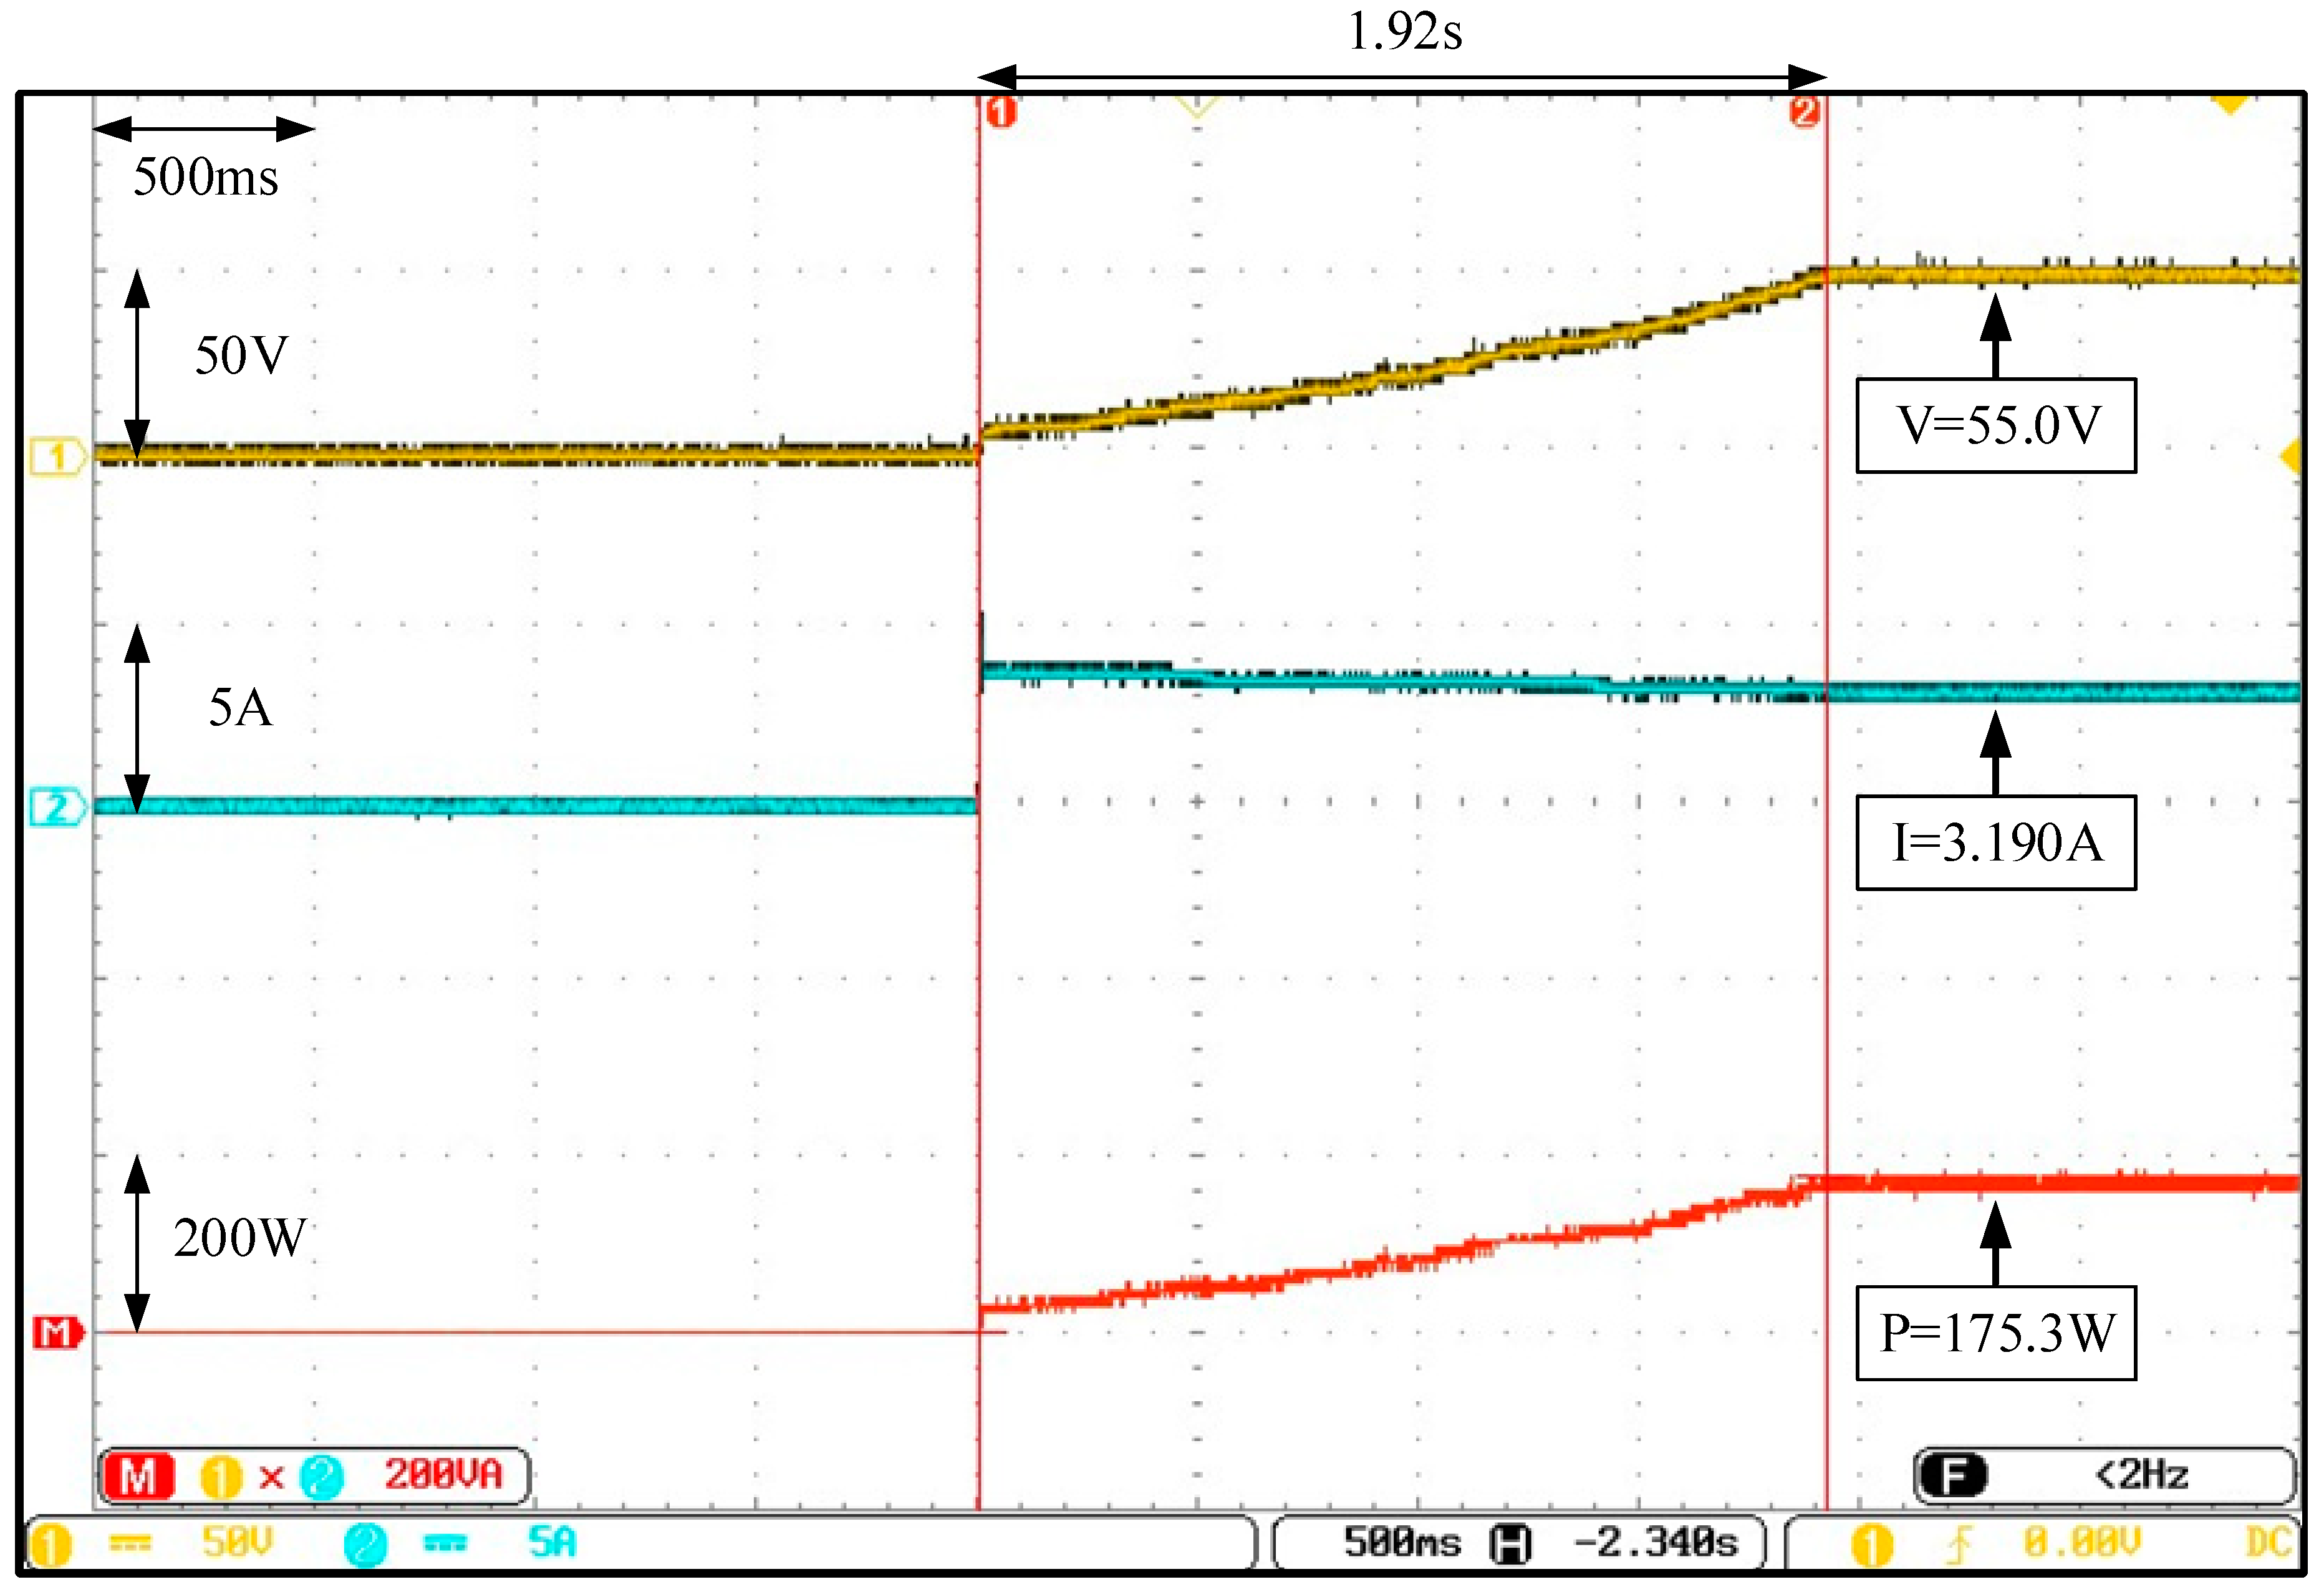
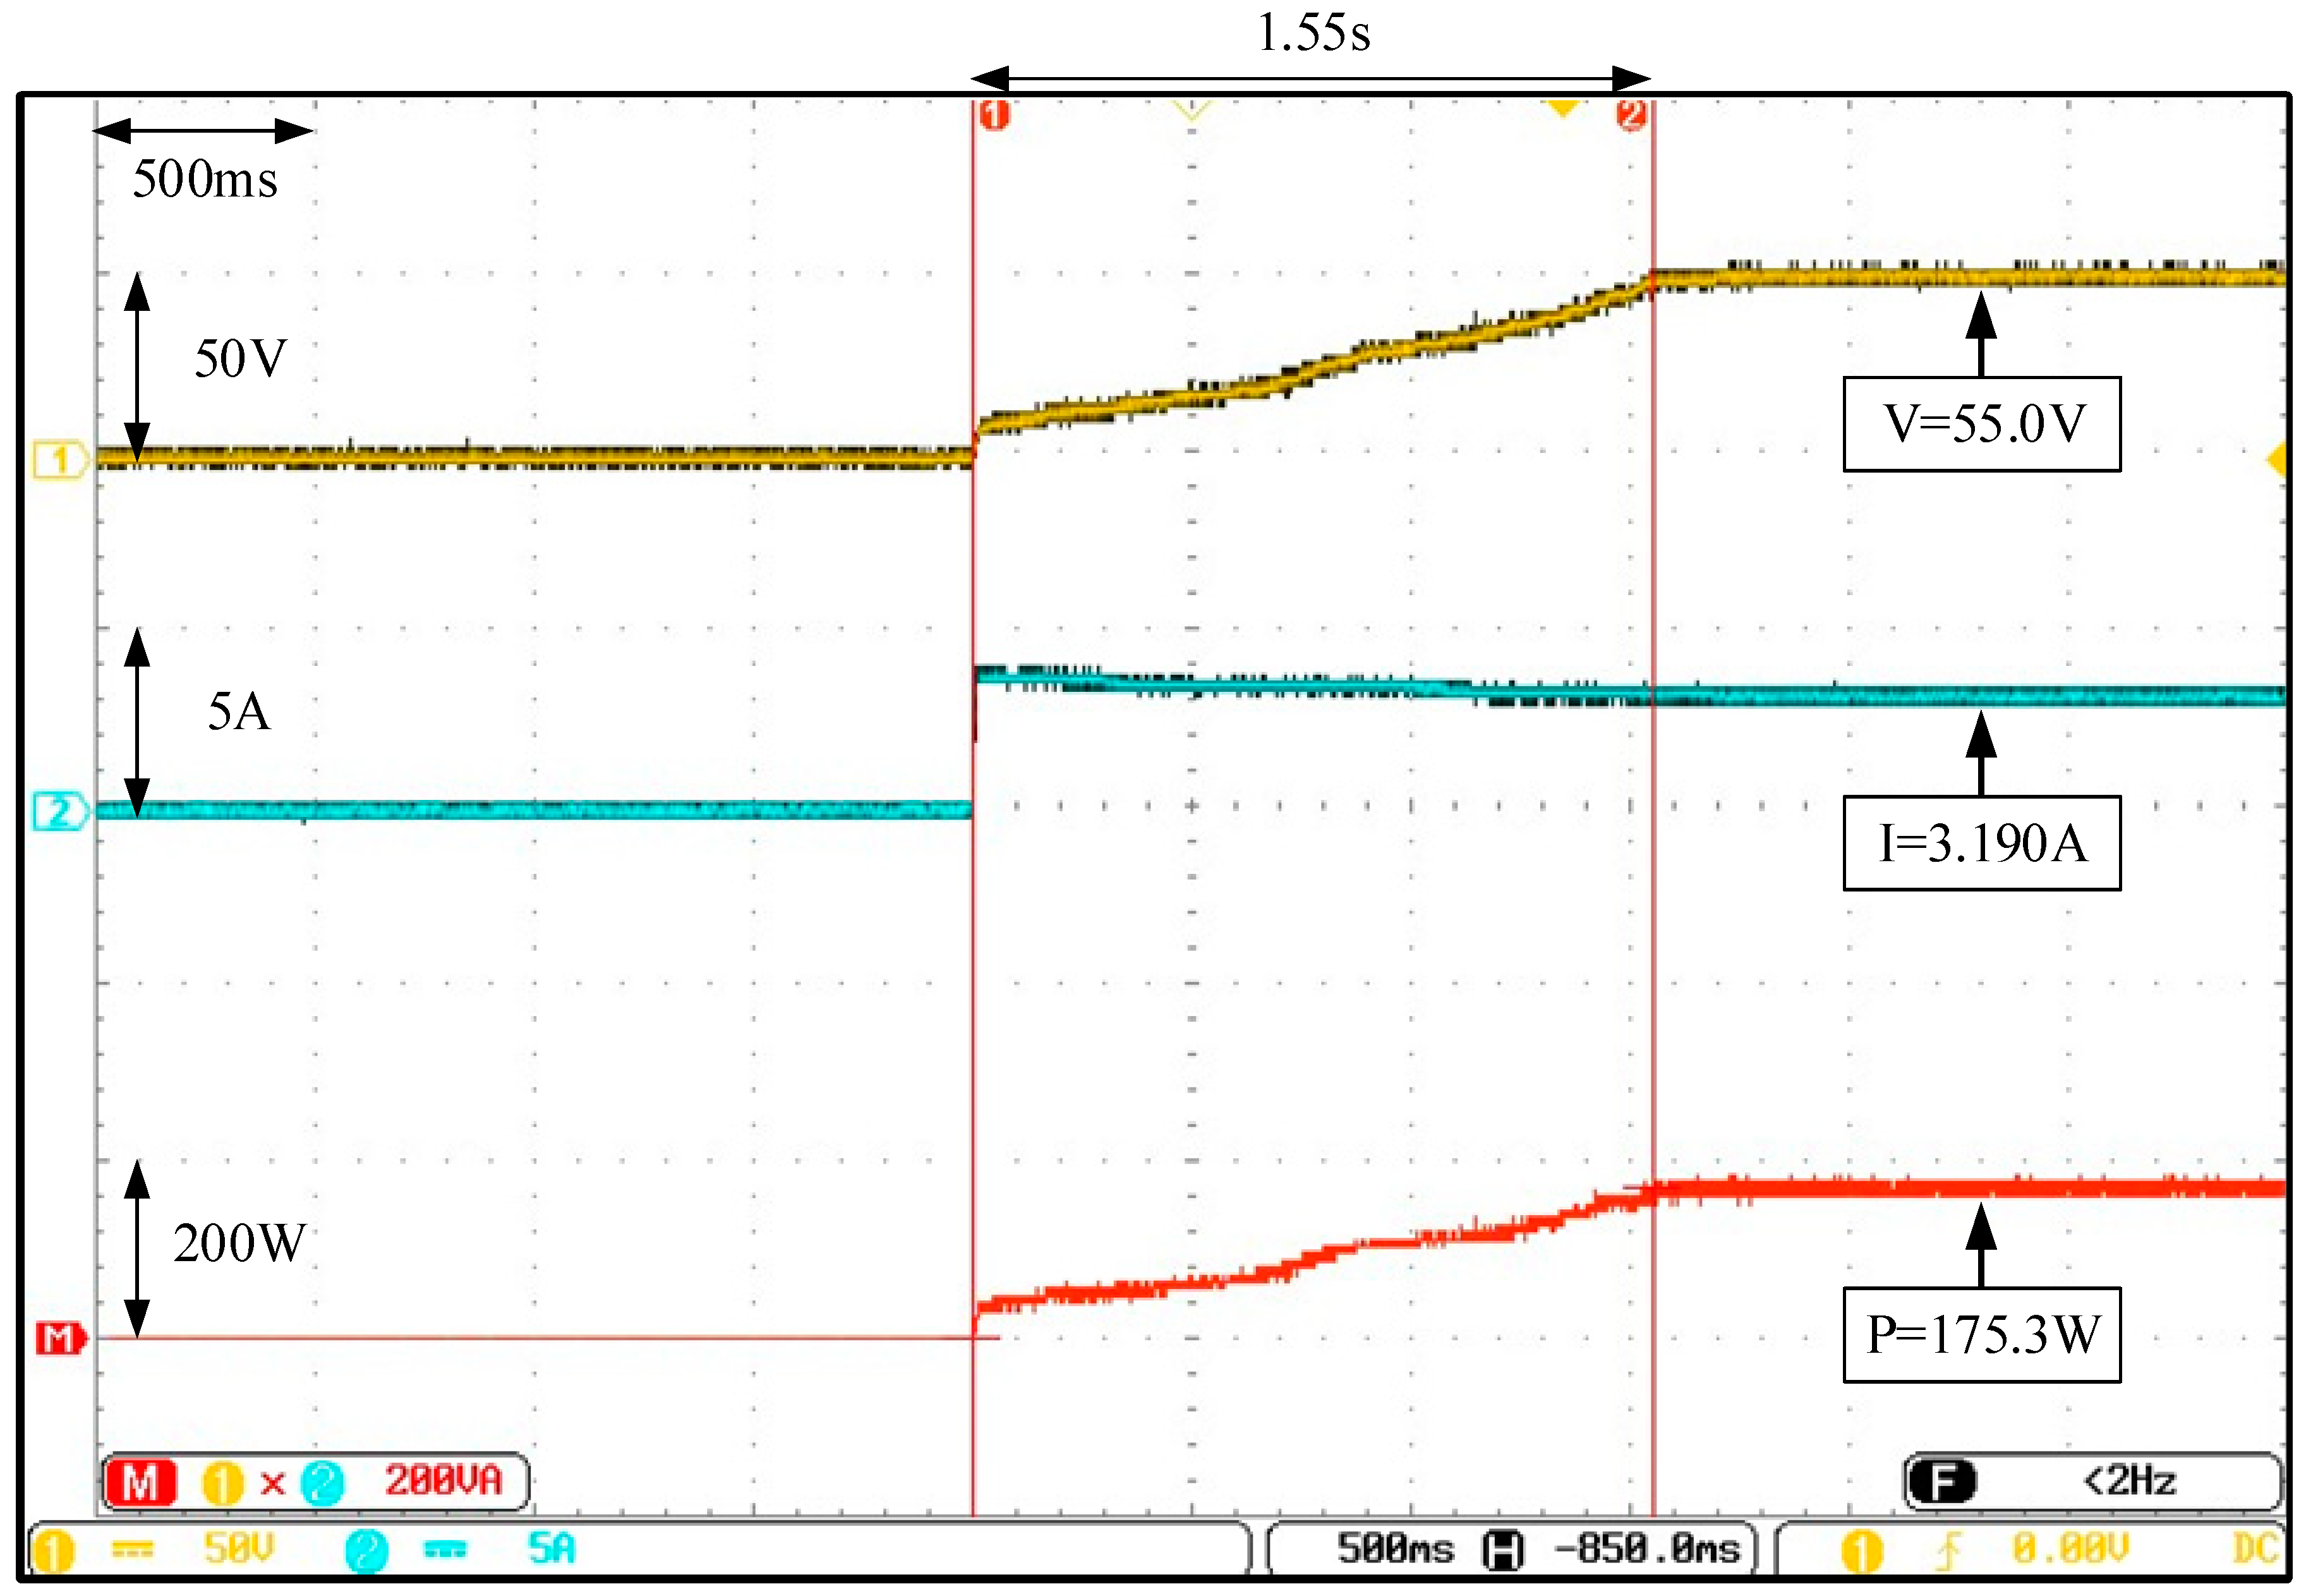
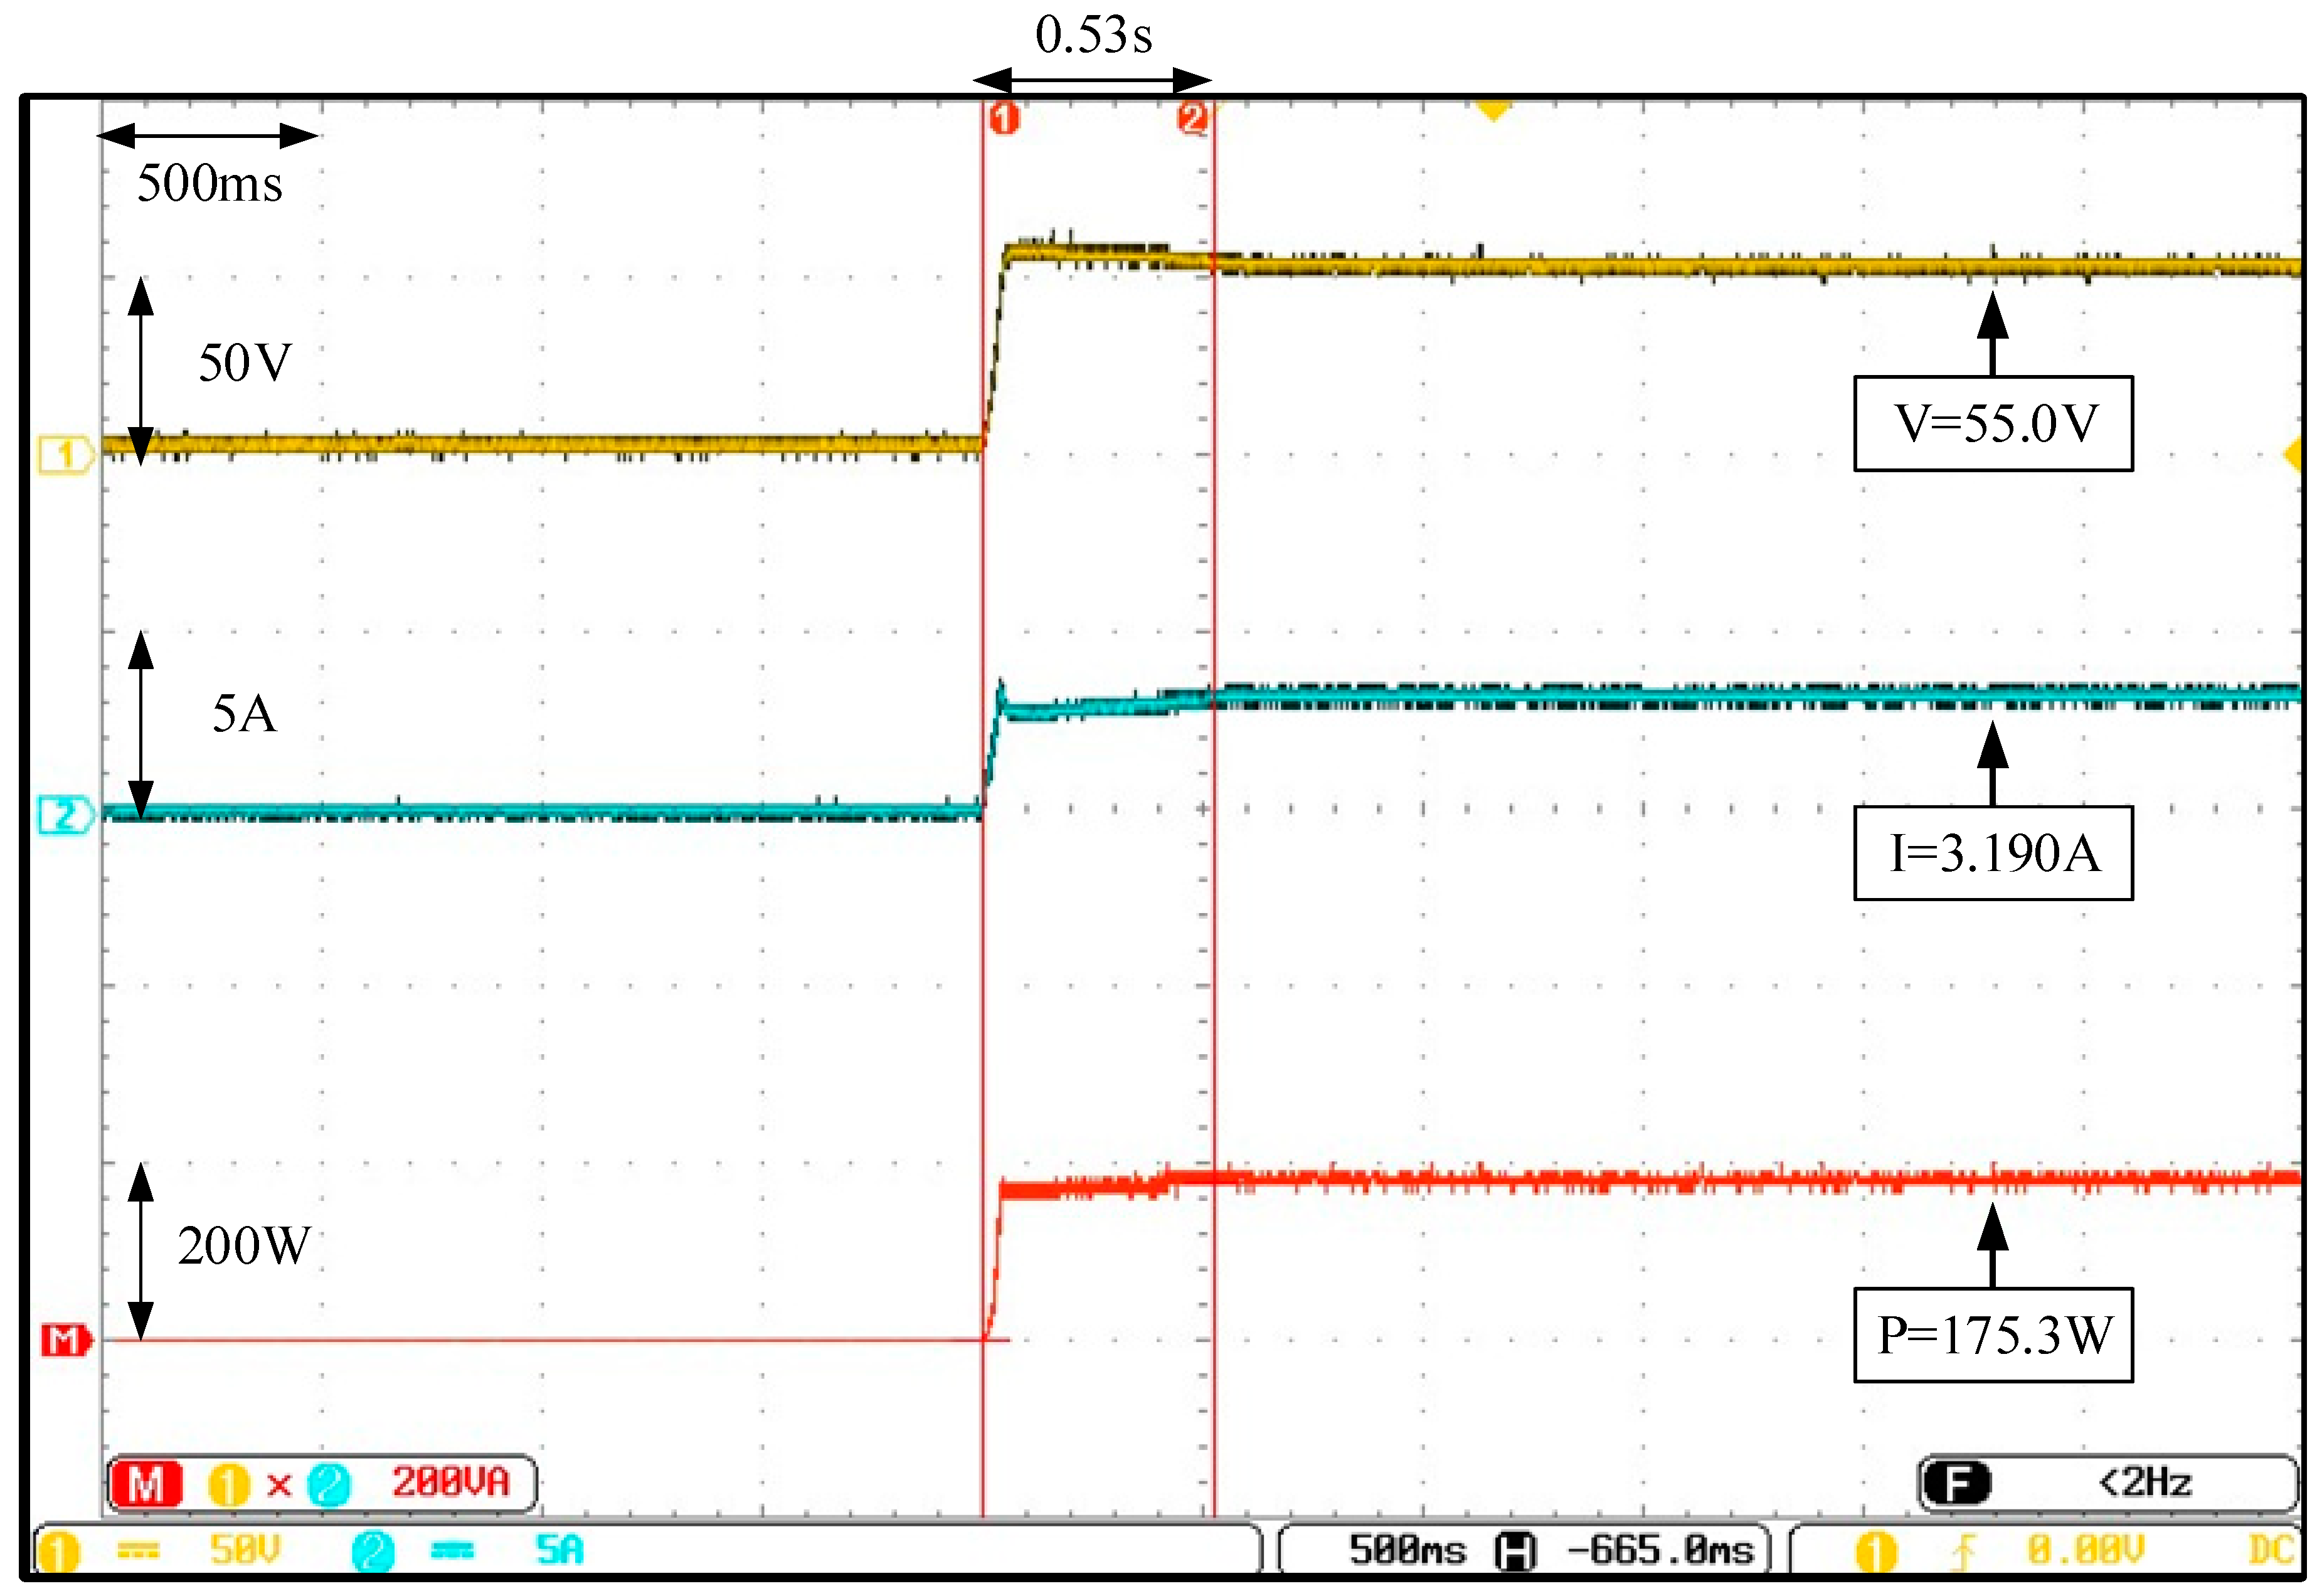
Figure 28 displays Case 5, where the actual test for the I-V and P-V characteristic curves of the PVMAs, under STCs with 20%, 40%, and 90% shading on three modules, was conducted. Quadruple peaks were presented and the true MPP was on the third peak with a value of 175.3 W. Figure 29, Figure 30 and Figure 31 display the actual test results of the MPPT, where the conventional FA and two types of improved FAs were adopted, respectively. Since the improved FA, with both the changed iteration parameters and initial tracking voltage, was set to 0.8 times of the MPP voltage (Vmp), the tracking speed was distinctively better than the conventional FA and improved FA with only the changed iteration parameters.
- (6)
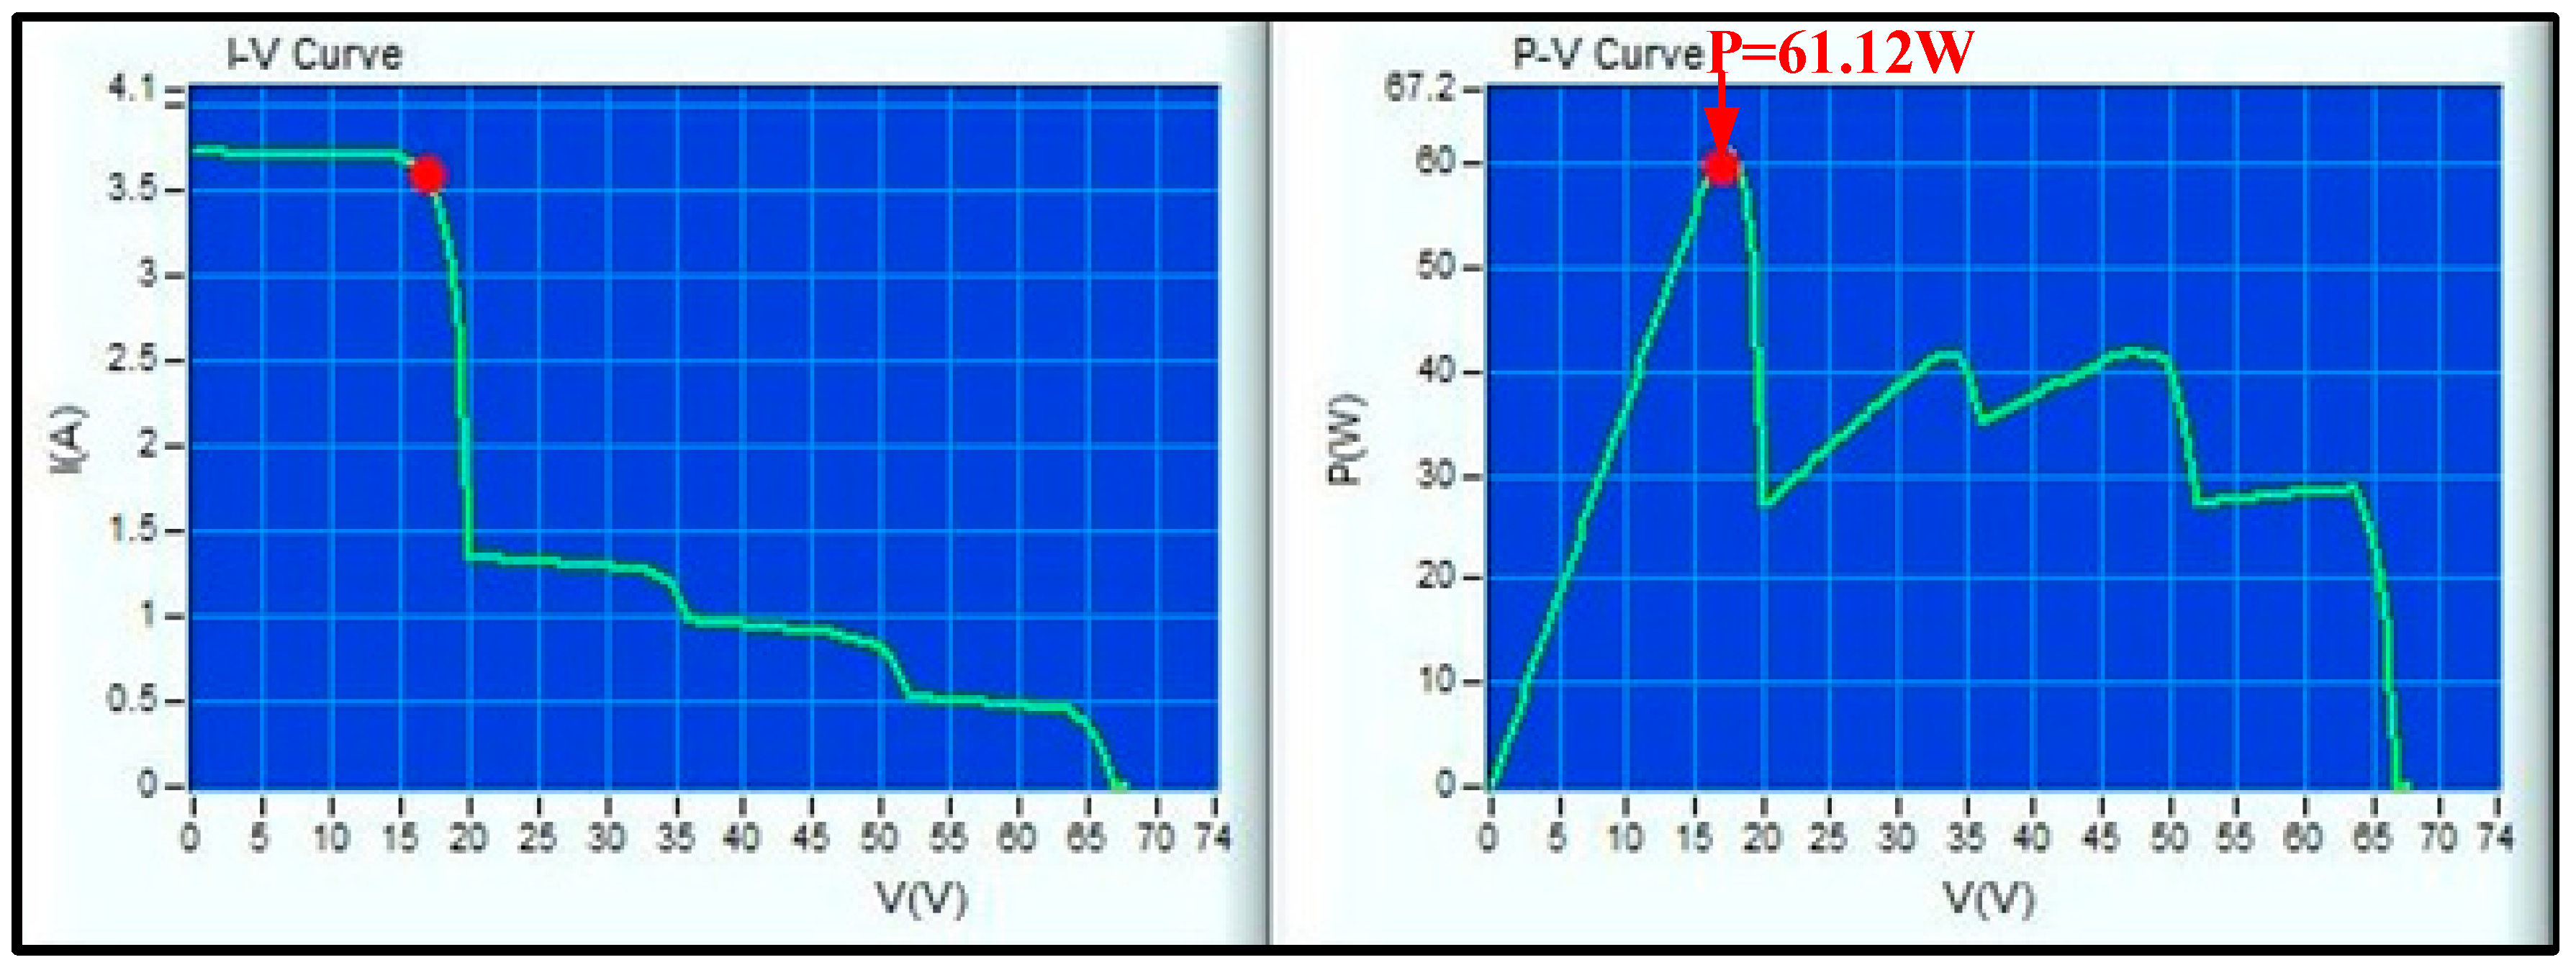
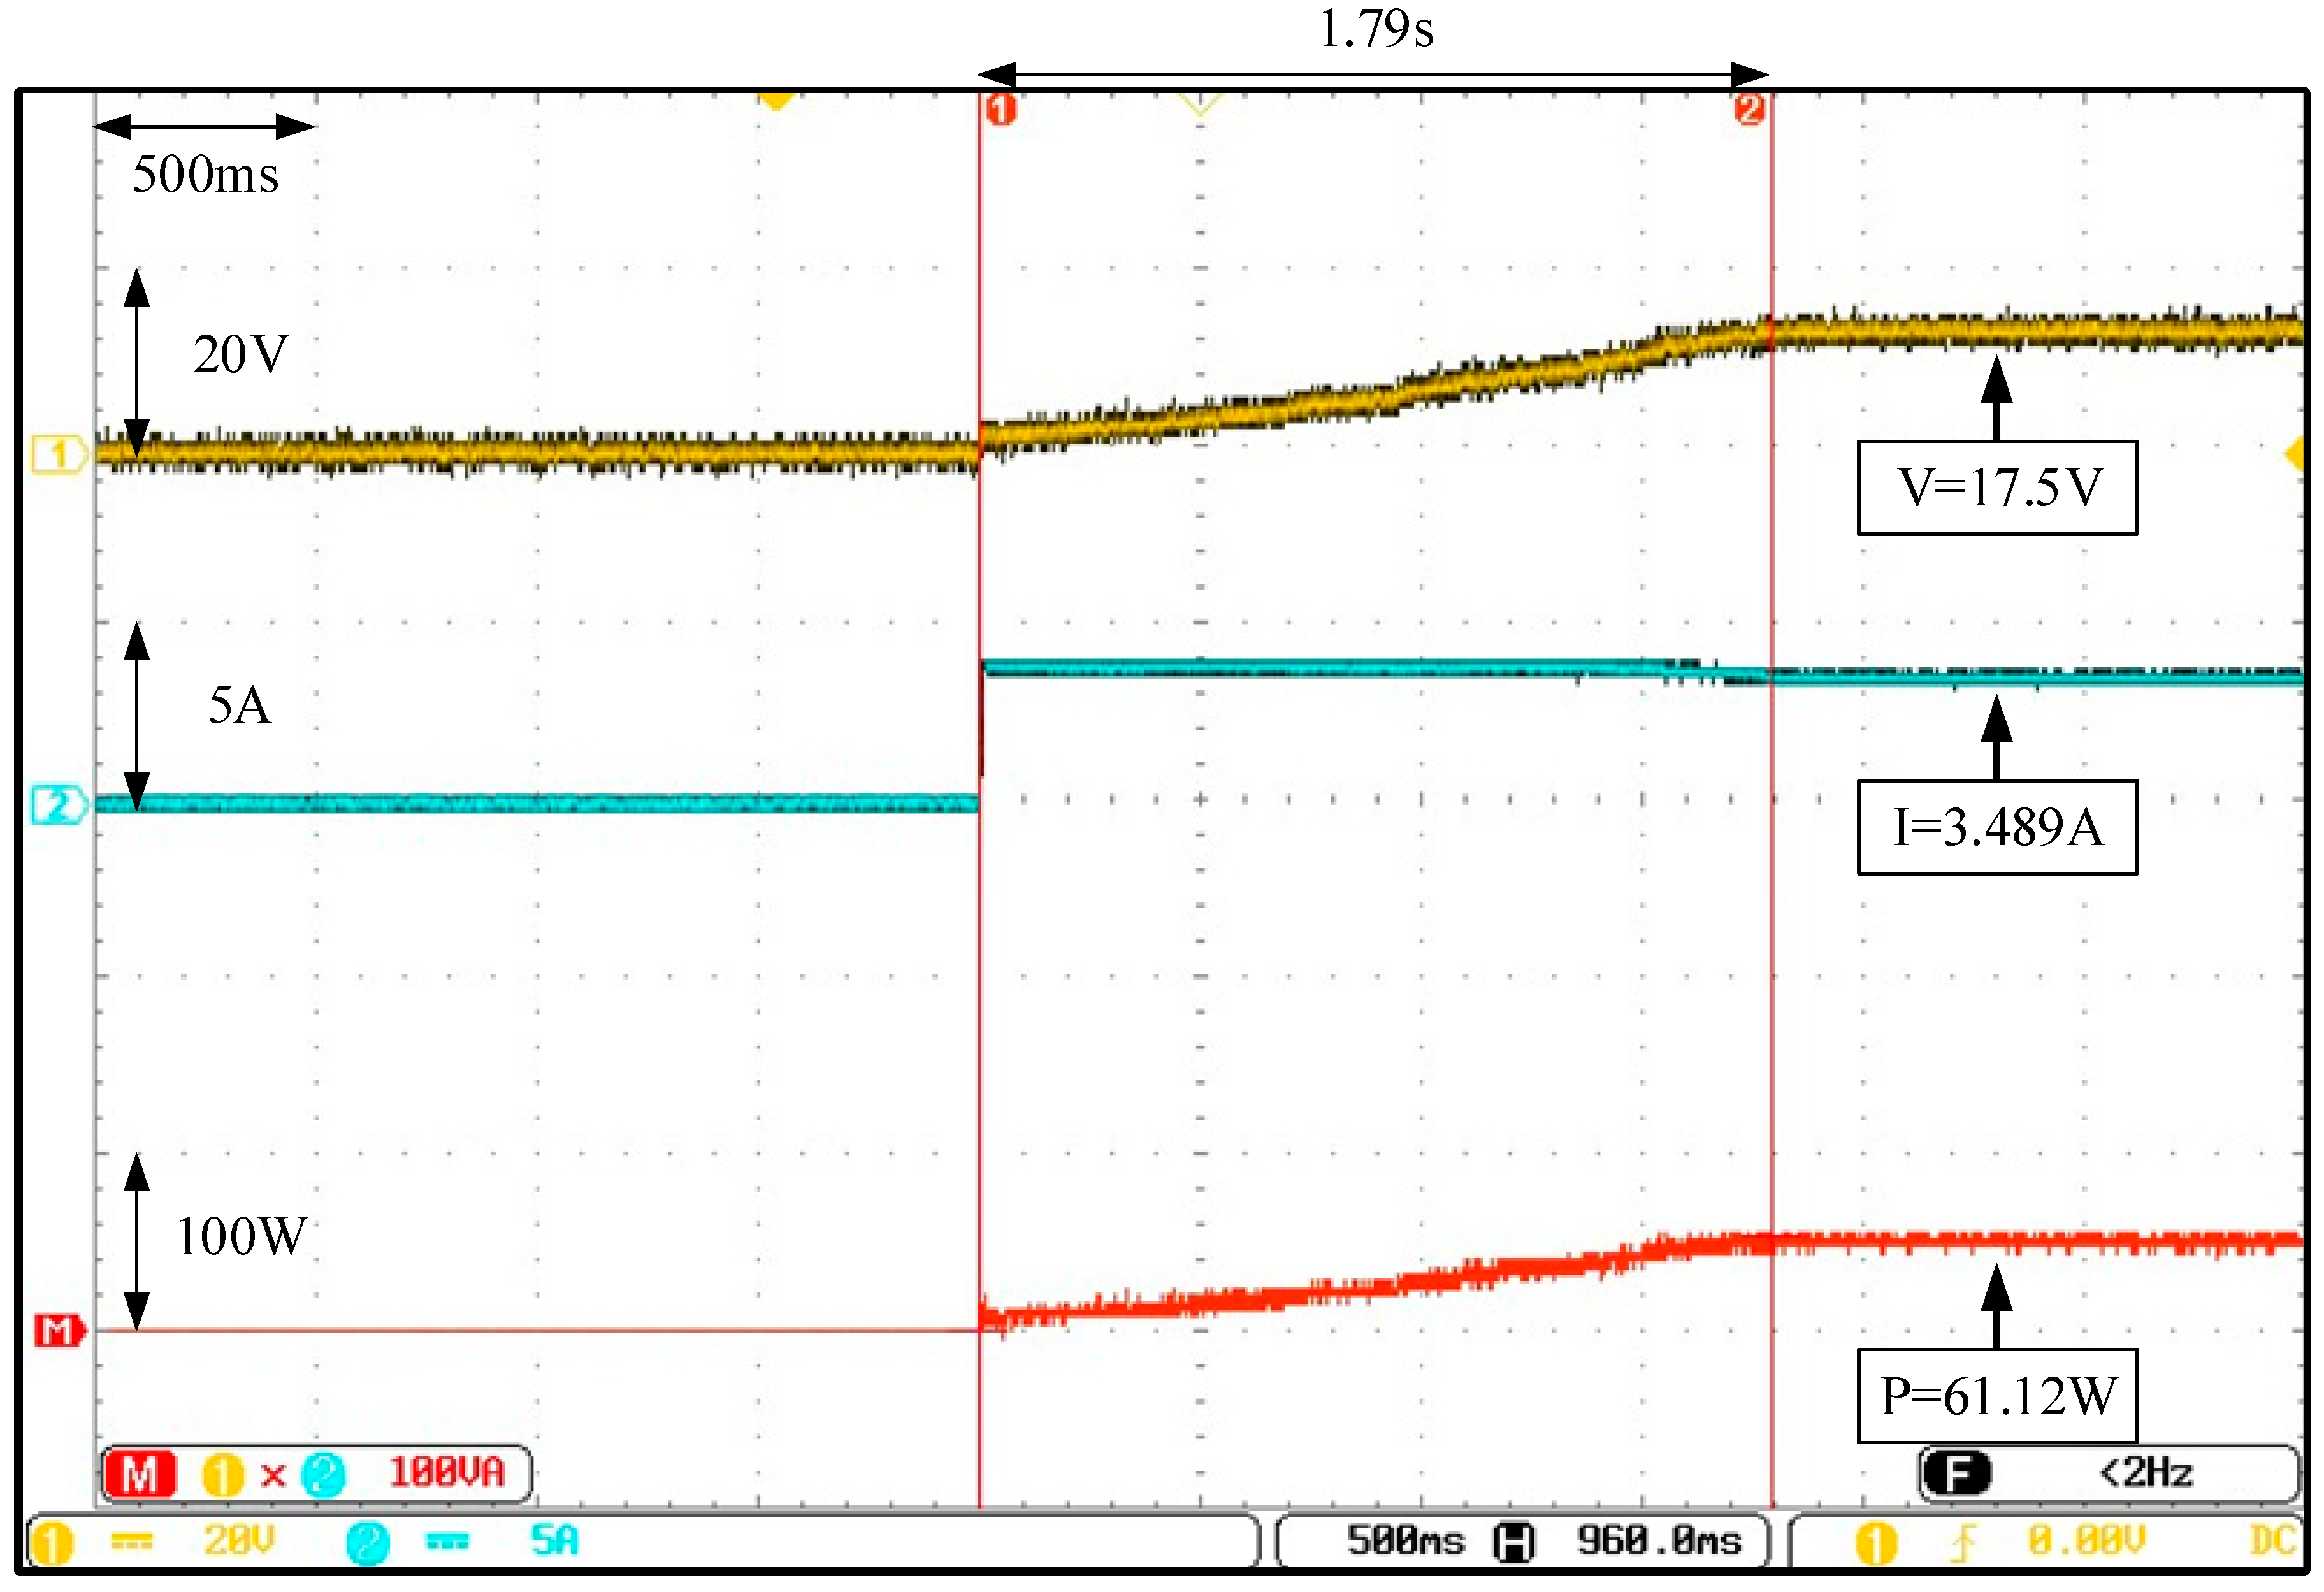
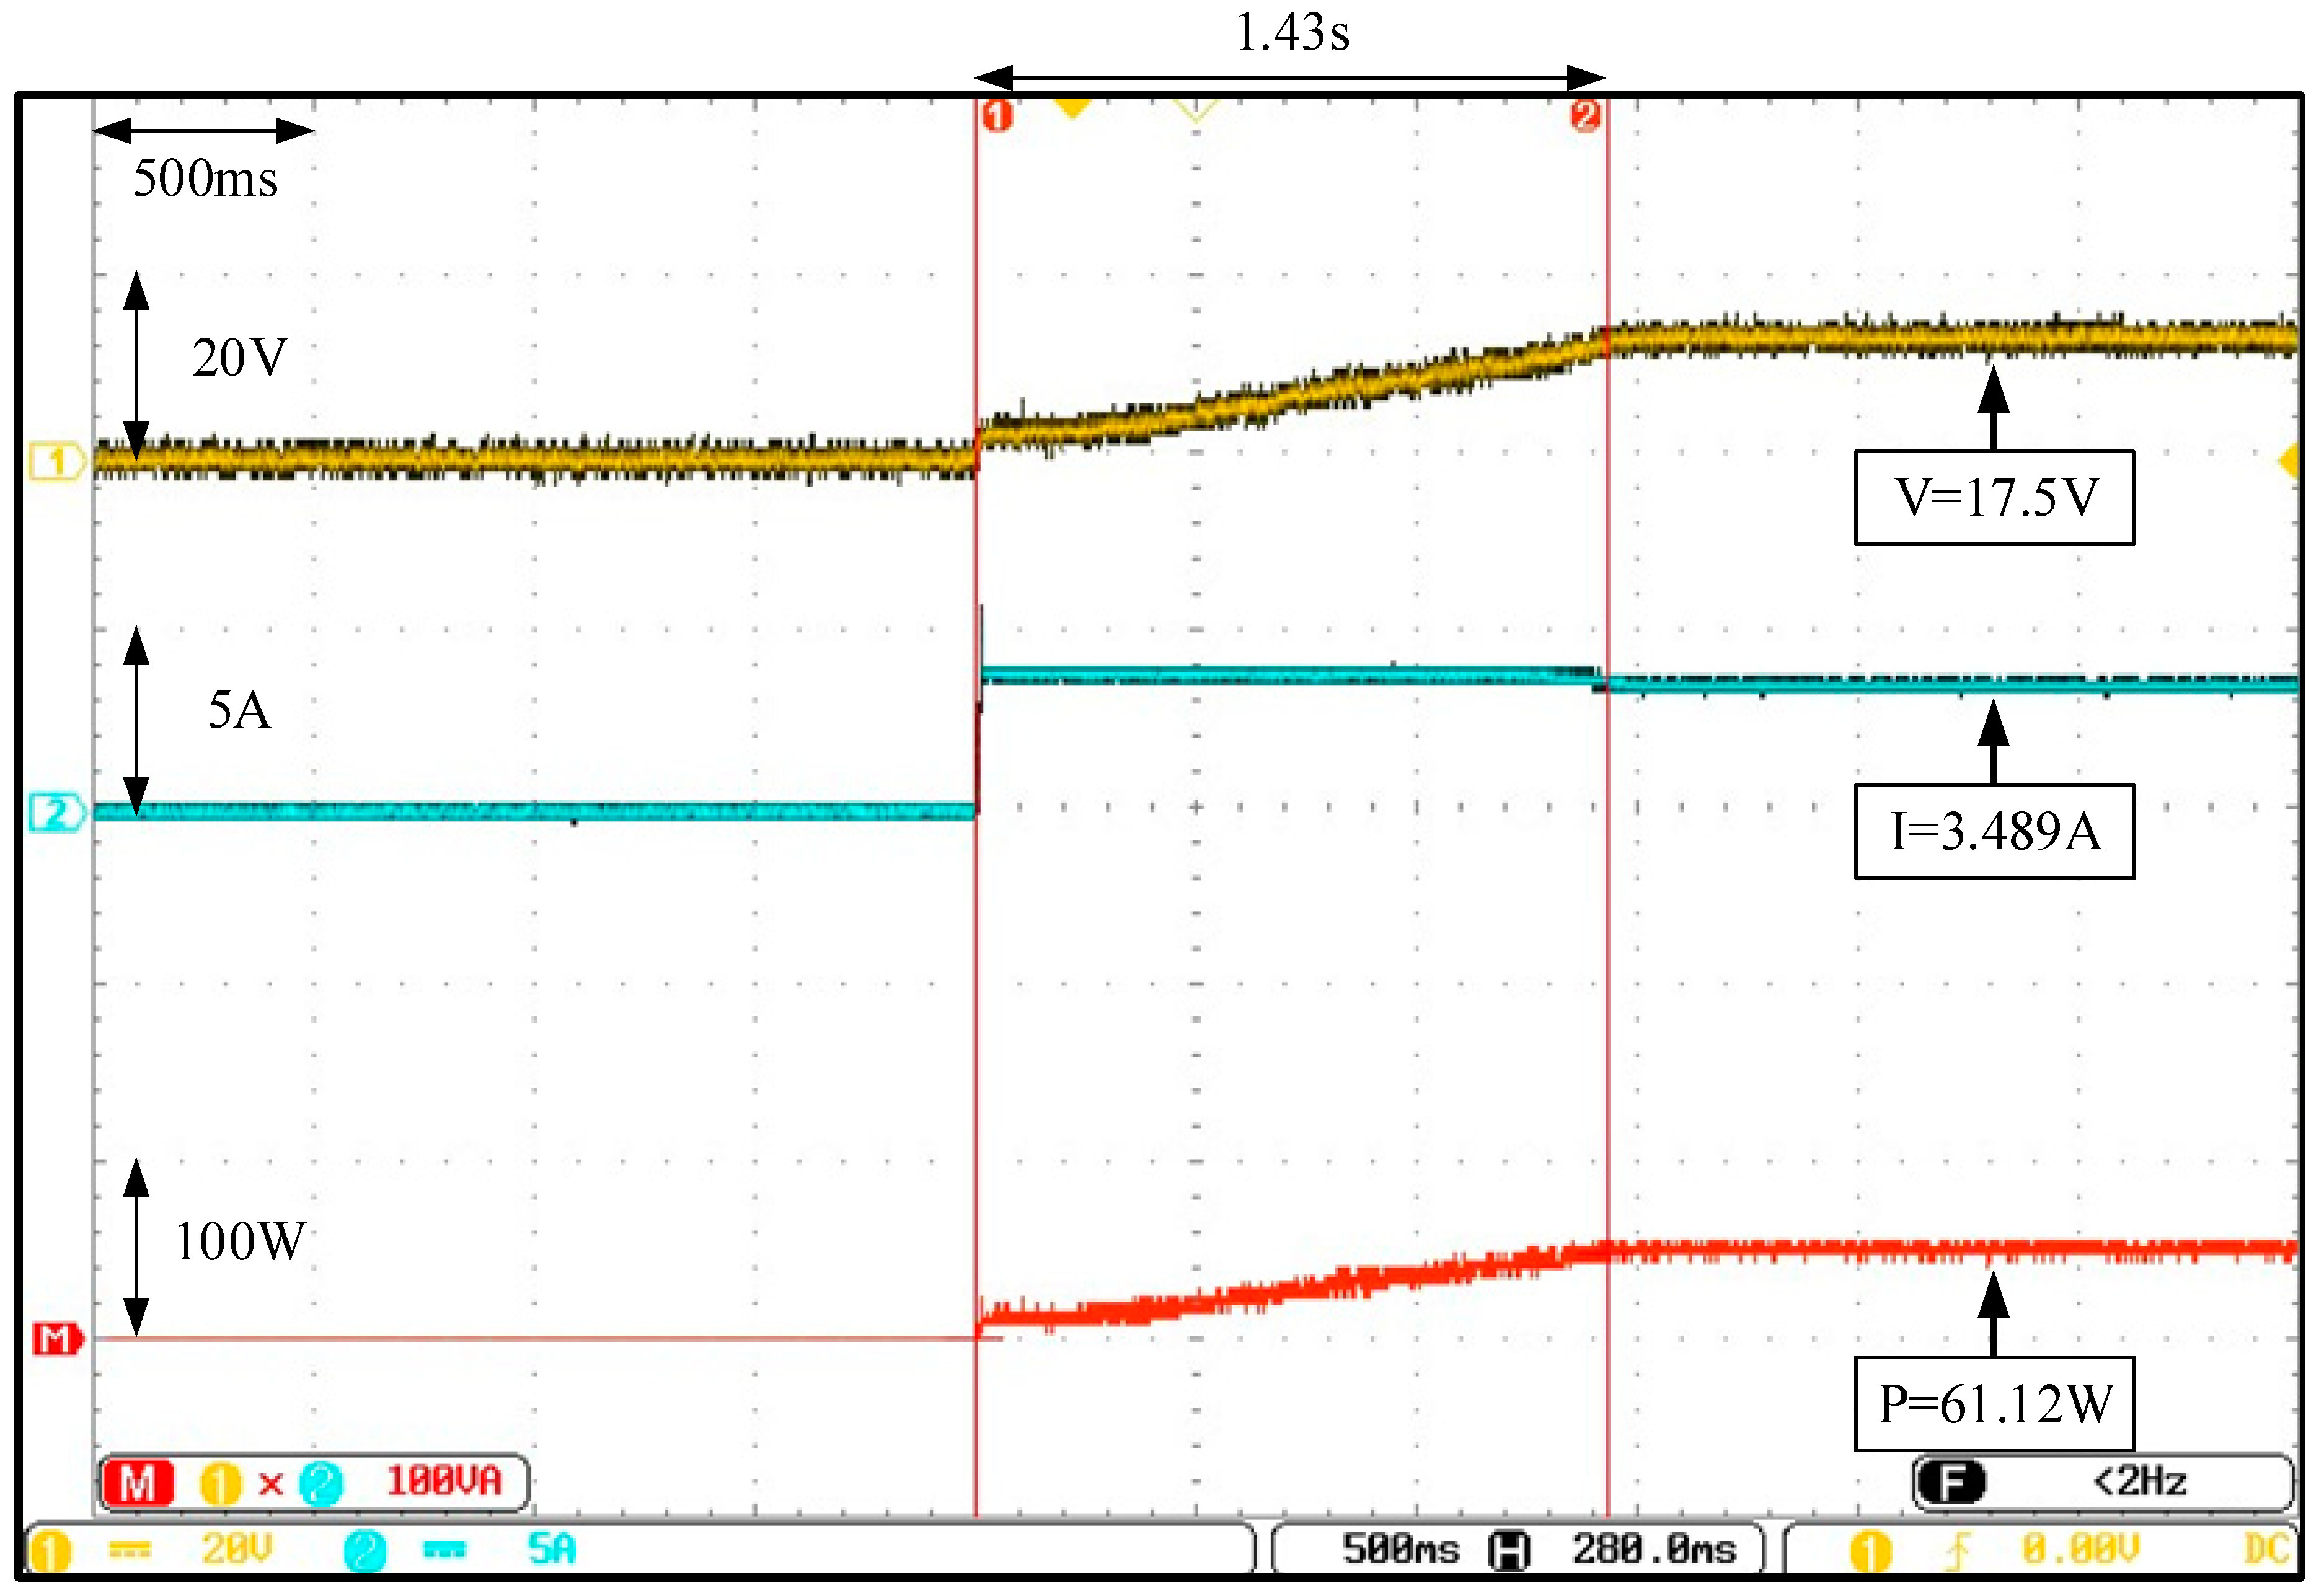
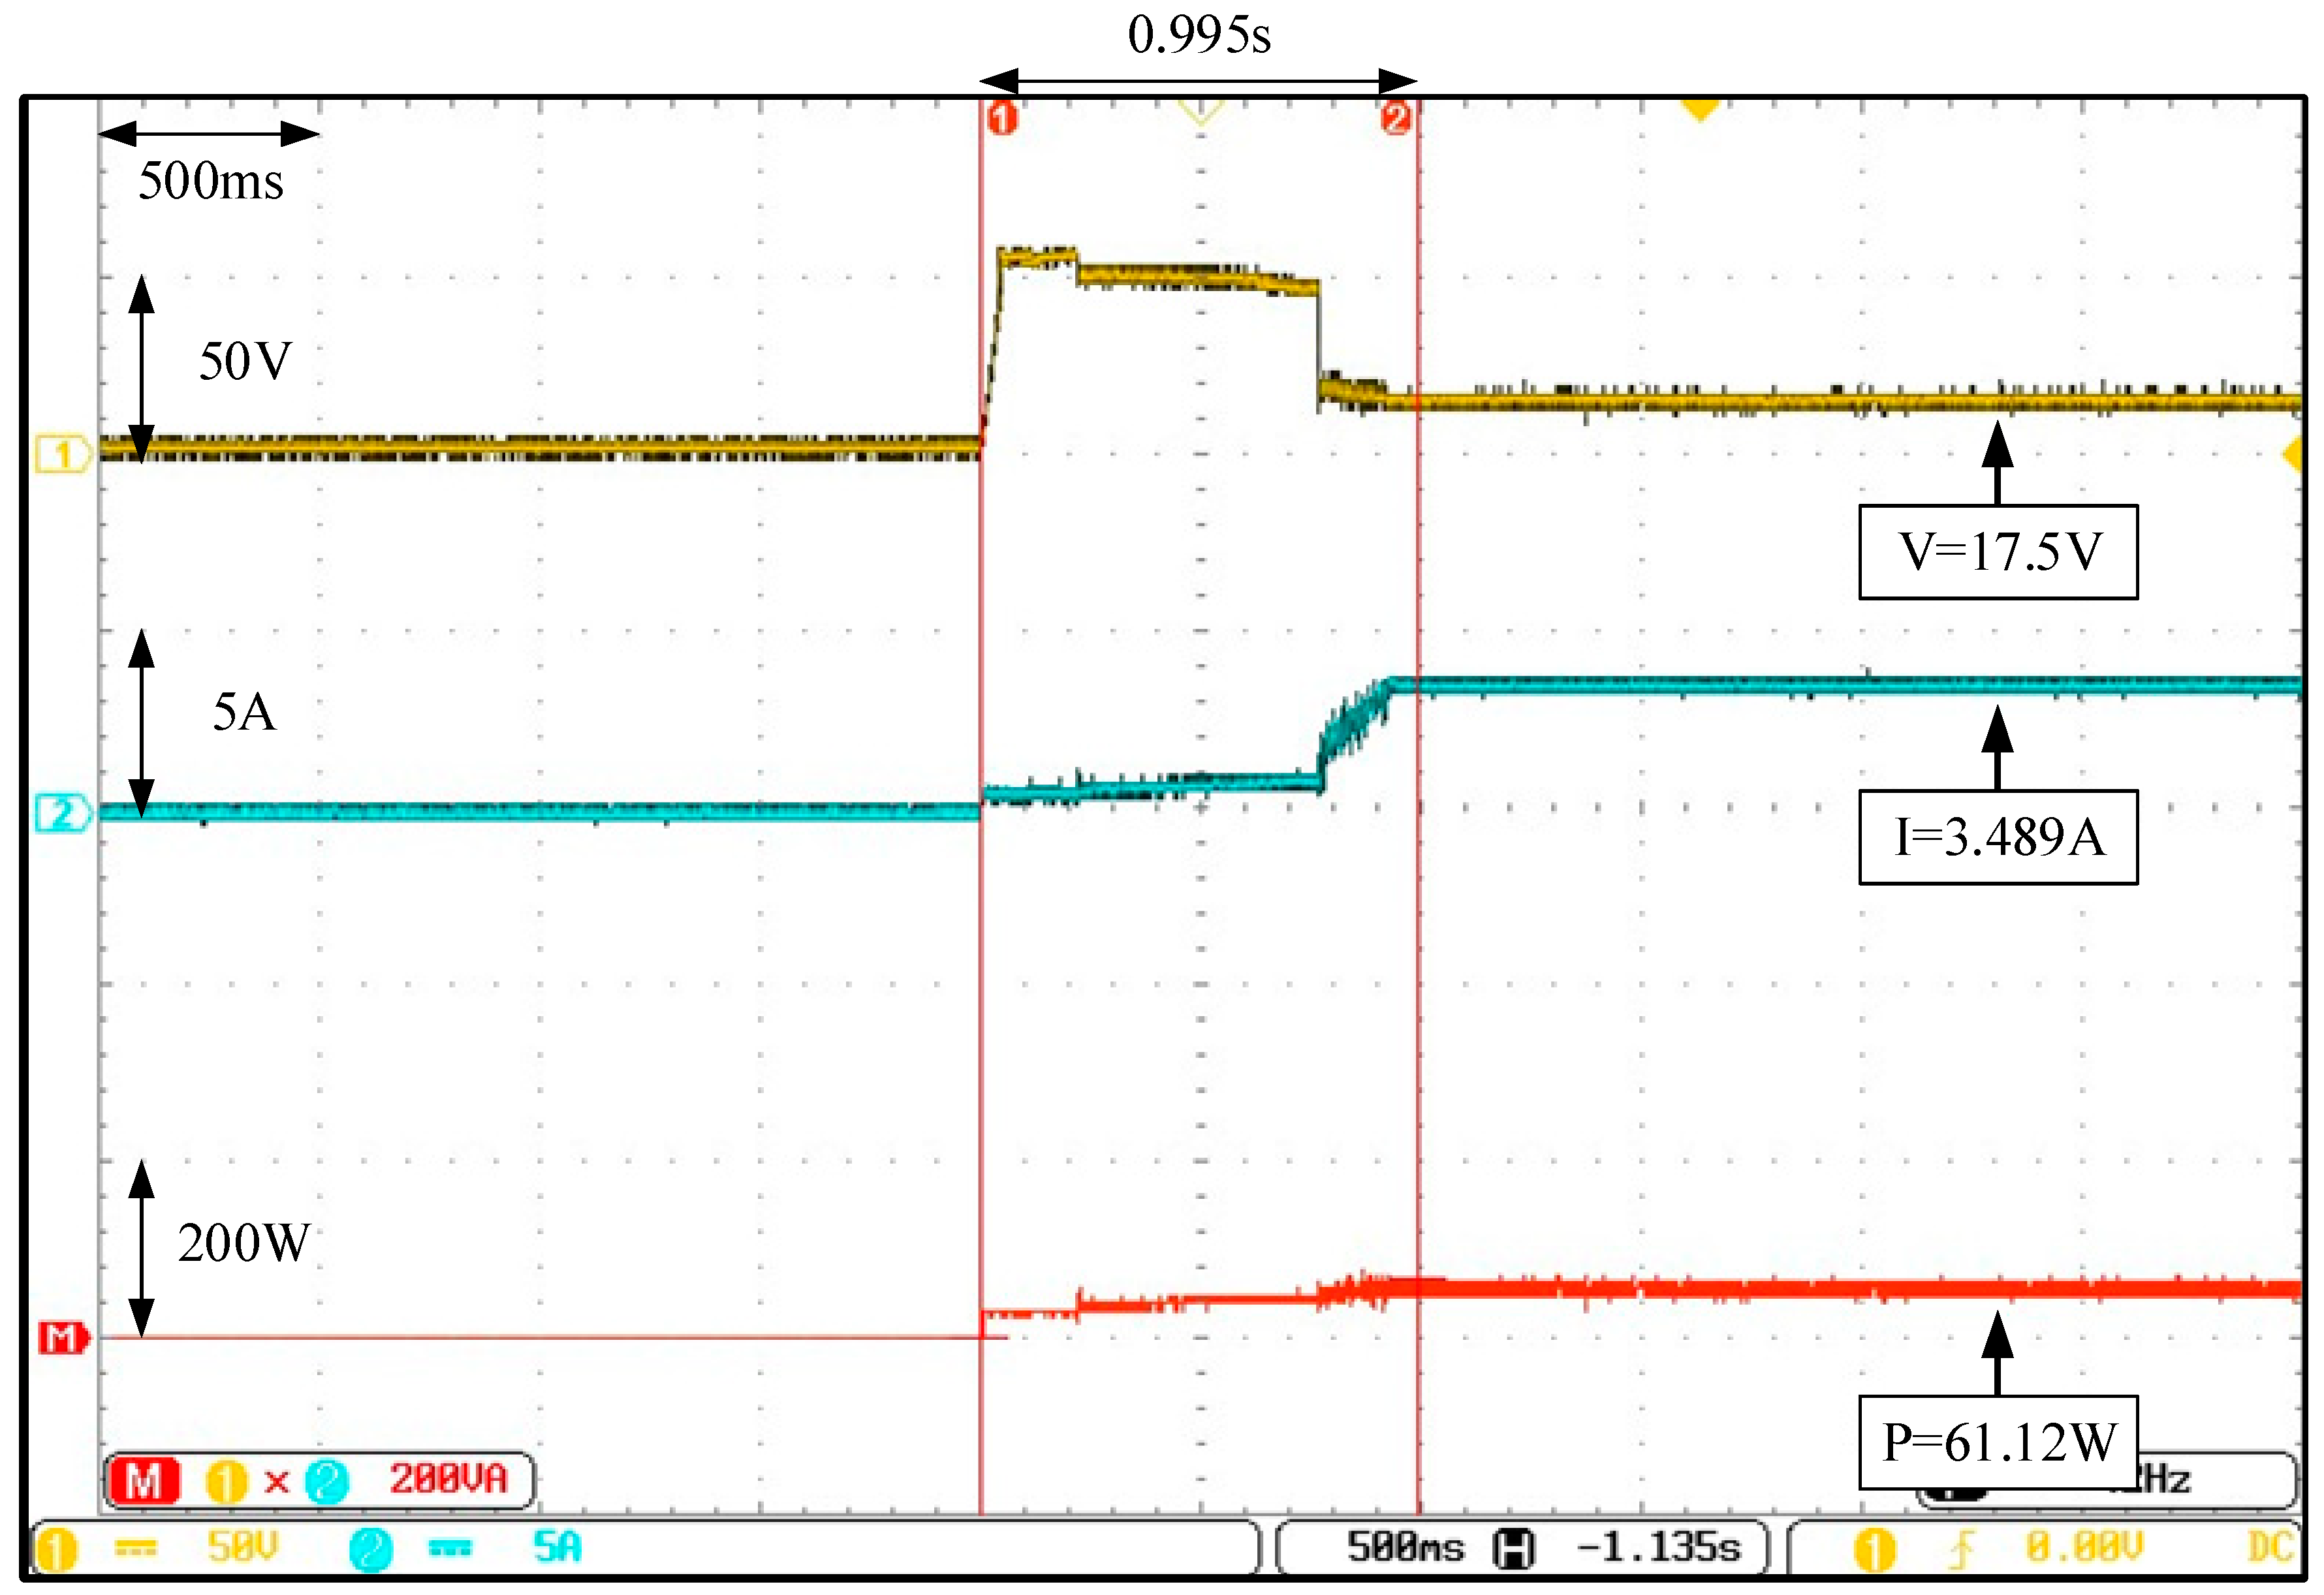
- Actual Test in Case 6
Figure 32 displays Case 6, where the actual test for the I-V and P-V characteristic curves of the PVMAs, under STCs with 70%, 80%, and 90% shading on nine modules, was conducted. Quadruple peaks were still presented and the true MPP was on the left end with a value of 61.12 W. Figure 33, Figure 34 and Figure 35 display the actual test results of the MPPT, where the conventional FA and two types of improved FAs were adopted, respectively. From the figures, it can be observed that all three methods could successfully track to the GMPP. However, even under quadruple peaks, the tracking speed of the improved method, with both the changed iteration parameters and initial tracking voltage, was still better than the conventional FA and improved FA with only the changed iteration parameters.
For the conventional FA, the improved FA with only the changed iteration parameter, and the improved FA with both the changed iteration parameters and initial tracking voltage in this paper, 10 actual tests were conducted on six cases of different shading ratios (listed in Table 7), where the average tracking time was calculated and then compiled in Table 8. From Table 8, it can be known that the response of the average tracking speed on the GMPP, with the improved method with both the changed iteration parameters and initial tracking voltage, was distinctively better than the other two methods. This was sufficient to prove the feasibility and robustness of the improved FA with both the changed iteration parameters and initial tracking voltage.
5.3. Actual Test Discussion
In this paper, six test cases under different shading ratios were selected. The conventional firefly algorithm and two improved firefly algorithms were chosen and subjected to ten tests of maximum power point tracking in different time frames. The results of the tests are shown in Table 8. The table shows that the two improved firefly algorithms exhibit superior tracking performances compared to the conventional firefly algorithm, this demonstrates the stability and robustness of the proposed method in long-term tracking. The test results confirmed that the developed converter has a high step-up ratio and can reduce output voltage ripples. Furthermore, the effectiveness and robustness of the proposed improved firefly algorithm can be demonstrated using test results of the maximum power point tracking of the photovoltaic module arrays under six different shading conditions. The advantages and disadvantages of the existing commonly used smart algorithms are elaborated in Section 1. Despite the fact that these algorithms demonstrate the ability to search for global optimums, the tracking response speed is insufficient.
The main contribution of this paper is to use the firefly algorithm to improve the speed and efficiency of maximum power point tracking. It entails improving the traditional firefly algorithm so that the step factor can be automatically adjusted online based on the number of iterations and the slope of the photovoltaic module array’s P-V characteristic curve. When multiple peak values are generated from the P-V characteristic curve, as a result of shading and the malfunction of certain modules, in the photovoltaic module array, this can lead to the capability of a fast escape from the LMPP, as well as accurately and quickly tracking the global GMPP. In order to improve the maximum power point tracking speed response, the initial tracking voltage is set to 0.8 times the maximum power point voltage of the photovoltaic module arrays under standard test conditions. The six test cases were tested for global maximum power point tracking performance when different P-V characteristic curve peak values were tested under different shading conditions, and the global maximum power point appeared in different positions. It should be representative and sufficient in terms of producing the contribution. Additionally, to confirm that the tracking performance is superior to the existing smart algorithms [26,27,28], the P-V characteristic curves will produce different peak values under four different shading conditions. Furthermore, when the global maximum power points appear in different positions, the average tracking time obtained from ten tests is compiled for comparison in Table 9. Table 9 shows that the tracking response of the proposed improved firefly algorithm MPPT should be faster than the other smart MPPT methods [15,22,28].
6. Conclusions
In this paper, the improved FA was proposed to conduct the MPPT of the PVMAs under different shading conditions, and the proposed high-voltage step-up converter was utilized for such an MPPT. The converter provided the advantage of the high-voltage step-up, which raised the input voltage of 80 V to 400 V at a smaller duty cycle but is capable of reducing the circuit cost and enhancing the conversion efficiency further. In addition, to boost the tracking speed and efficiency with an FA on MPP, the conventional FA was improved, so the online automatic adjustment for the step factor in the iteration formula, along with the slope of the P-V characteristic curve and iteration number of the PVMAs, could be implemented. With multiple peaks appearing on the P-V characteristic curves, where shading occurred on partial modules in the PVMAs, this can lead to the capability of a fast escape from the LMPP, followed by precise and fast-tracking to the GMPP. Moreover, to improve the speed response on the MPPT further, the initial tracking voltage was set to 0.8 times of MPP voltage (Vmp) for the PVMAs under STCs. From the actual test results, it was verified that the developed converter indeed provided a high-voltage step-up and could reduce the ripple from the output voltage. In addition, through the actual test results from the MPPT of the PVMA under six different shading conditions, the effectiveness and robustness of the proposed improved FA for the MPPT were proved.
Author Contributions
K.-H.C. plans the project and writes, edits and reviews it. S.-W.Z. is responsible for the design of high step-up converter for maximum power point tracking in photovoltaic moudle arrays. K.-H.C. manages the project. All authors have read and agreed to the published version of the manuscript.
Funding
The authors gratefully acknowledge the support and funding of this project by Ministry of Science and Technology, Taiwan, under the Grant Number MOST 110-2221-E-167-067-MY2.
Institutional Review Board Statement
Not applicable.
Informed Consent Statement
Not applicable.
Data Availability Statement
This study did not report any data.
Conflicts of Interest
The authors of the manuscript declare no conflict of interest.
References
- Jones, D.C.; Erickson, R.W. Probabilistic Analysis of a Generalized Perturb and Observe Algorithm Featuring Robust Operation in the Presence of Power Curve Traps. IEEE Trans. Power Electron. 2013, 28, 2912–2926. [Google Scholar] [CrossRef]
- Killi, M.; Samanta, S. Modified Perturb and Observe MPPT Algorithm for Drift Avoidance in Photovoltaic Systems. IEEE Trans. Ind. Electron. 2015, 62, 5549–5559. [Google Scholar] [CrossRef]
- Sher, H.A.; Murtaza, A.F.; Noman, A.; Addoweesh, K.E.; Al-Haddad, K.; Chiaberge, M. A New Sensorless Hybrid MPPT Algorithm Based on Fractional Short-circuit Current Measurement and P&O MPPT. IEEE Trans. Sust. Energy 2015, 6, 1426–1434. [Google Scholar]
- Sahu, R.K.; Ghosh, A. Maximum Power Generation from Solar Panel by Using P&O MPPT. In Proceedings of the International Conference on Intelligent Controller and Computing for Smart Power (ICICCSP), Hyderabad, India, 21–23 July 2022; pp. 1–4. [Google Scholar]
- Utaikaifa, K. Reduction of Power Ripple in P&O MPPT System Using Output Feedback. In Proceedings of the 4th International Conference on Power Engineering, Energy and Electrical Drives, Istanbul, Turkey, 13–17 May 2013; pp. 427–432. [Google Scholar]
- Liu, F.; Duan, S.; Liu, F.; Liu, B.; Kang, Y. A Variable Step Size INC MPPT Method for PV Systems. IEEE Trans. Ind. Electron. 2008, 55, 2622–2628. [Google Scholar]
- Bhattacharyya, S.; Kumar, D.S.; Samanta, S.; Mishra, S. Steady Output and Fast Tracking MPPT (SOFT-MPPT) for P&O and INC Algorithms. IEEE Trans. Sust. Energy 2021, 12, 293–302. [Google Scholar]
- Alsumiri, M. Residual Incremental Conductance Based Nonparametric MPPT Control for Solar Photovoltaic Energy Conversion System. IEEE Access 2019, 7, 87901–87906. [Google Scholar] [CrossRef]
- Zhang, H.; Li, S.Z.; Zhang, X.N.; Xia, Y.L. MPPT Control Strategy for Photovoltaic Cells Based on Fuzzy Control. In Proceedings of the 12th International Conference on Natural Computation, Fuzzy Systems and Knowledge Discovery (ICNC-FSKD), Changsha, China, 13–15 August 2016; pp. 450–454. [Google Scholar]
- Subasic, P.; Nakatsuyama, M. A New Representational Framework for Fuzzy Sets. In Proceedings of the 6th International Fuzzy Systems Conference, Barcelona, Spain, 1–5 July 1997; pp. 1601–1606. [Google Scholar]
- Sutikno, T.; Subrata, A.C.; Elkhateb, A. Evaluation of Fuzzy Membership Function Effects for Maximum Power Point Tracking Technique of Photovoltaic System. IEEE Access 2021, 9, 109157–109165. [Google Scholar] [CrossRef]
- Prokhorov, D. Echo State Networks: Appeal and Challenges. In Proceedings of the 2005 IEEE International Joint Conference on Neural Networks, Montreal, QC, Canada, 31 July–4 August 2005; pp. 1463–1466. [Google Scholar]
- Dahidi, S.A.; Ayadi, O.; Alrbai, M.; Adeeb, J. Ensemble Approach of Optimized Artificial Neural Networks for Solar Photovoltaic Power Prediction. IEEE Access 2019, 7, 81741–81758. [Google Scholar] [CrossRef]
- Roy, R.B.; Rokonuzzaman, M.; Amin, N.; Mishu, M.K.; Alahakoon, S.; Rahman, S.; Mithulananthan, N. A Comparative Performance Analysis of ANN Algorithms for MPPT Energy Harvesting in Solar PV System. IEEE Access 2021, 9, 102137–102152. [Google Scholar] [CrossRef]
- Mohanty, S.; Subudhi, B.; Ray, P.K. A Grey Wolf Optimization Based MPPT for PV System under Changing Insolation Level. In Proceedings of the 2016 IEEE Students’ Technology Symposium (TechSym), Kharagpur, India, 30 September–2 October 2016; pp. 175–179. [Google Scholar]
- Atici, K.; Sefa, I.; Altin, N. Grey Wolf Optimization Based MPPT Algorithm for Solar PV System with SEPIC Converter. In Proceedings of the 4th International Conference on Power Electronics and their Applications (ICPEA), Elazig, Turkey, 25–27 September 2019; pp. 1–6. [Google Scholar]
- Guo, K.; Cui, L.; Mao, M.; Zhou, L.; Zhang, Q. An Improved Gray Wolf Optimizer MPPT Algorithm for PV System with BFBIC Converter under Partial Shading. IEEE Access 2020, 8, 103476–103490. [Google Scholar] [CrossRef]
- Firmanza, A.P.; Habibi, M.N.; Windarko, N.A.; Yanaratri, D.S. Differential Evolution-based MPPT with Dual Mutation for PV Array under Partial Shading Condition. In Proceedings of the 10th Electrical Power, Electronics, Communications, Controls and Informatics Seminar (EECCIS), Malang, Indonesia, 26–28 August 2020; pp. 198–203. [Google Scholar]
- Tajuddin, M.F.N.; Ayob, S.M.; Salam, Z. Tracking of Maximum Power Point in Partial Shading Condition Using Differential Evolution (DE). In Proceedings of the IEEE International Conference on Power and Energy (PECon), Kota Kinabalu, Malaysia, 2–5 December 2012; pp. 384–389. [Google Scholar]
- Taheri, H.; Salam, Z.; Ishaque, K. Syafaruddin A Novel Maximum Power Point Tracking Control of Photovoltaic System under Partial and Rapidly Fluctuating Shadow Conditions Using Differential Evolution. In Proceedings of the IEEE Symposium on Industrial Electronics and Applications (ISIEA), Penang, Malaysia, 3–5 October 2010; pp. 82–87. [Google Scholar]
- Tey, K.S.; Mekhilef, S.; Seyedmahmoudian, M.; Horan, B.; Oo, A.T.; Stojcevski, A. Improved Differential Evolution-based MPPT Algorithm Using SEPIC for PV Systems under Partial Shading Conditions and Load Variation. IEEE Trans. Ind. Informat. 2018, 14, 4322–4333. [Google Scholar] [CrossRef]
- Castano, C.G.; Restrepo, C.; Kouro, S.; Rodriguez, J. MPPT Algorithm Based on Artificial Bee Colony for PV System. IEEE Access 2021, 9, 43121–43133. [Google Scholar] [CrossRef]
- Li, N.; Mingxuan, M.; Yihao, W.; Lichuang, C.; Lin, Z.; Qianjin, Z. Maximum Power Point Tracking Control Based on Modified ABC Algorithm for Shaded PV System. In Proceedings of the International Conference of Electrical and Electronic Technologies for Automotive (AEIT AUTOMOTIVE), Turin, Italy, 2–4 July 2019; pp. 1–5. [Google Scholar]
- Pilakkat, D.; Kanthalakshmi, S. Artificial Bee Colony Algorithm for Peak Power Point Tracking of a Photovoltaic System under Partial Shading Condition. In Proceedings of the International Conference on Current Trends towards Converging Technologies (ICCTCT), Coimbatore, India, 1–3 March 2018; pp. 1–7. [Google Scholar]
- Huang, Y.P.; Huang, M.Y.; Ye, C.E. A Fusion Firefly Algorithm with Simplified Propagation for Photovoltaic MPPT under Partial Shading Conditions. IEEE Trans. Sust. Energy 2020, 11, 2641–2652. [Google Scholar] [CrossRef]
- Teshome, D.F.; Lee, C.H.; Lin, Y.W.; Lian, K.L. A Modified Firefly Algorithm for Photovoltaic Maximum Power Point Tracking Control under Partial Shading. IEEE J. Emerg. Sel. Topics Power Electron. 2016, 5, 661–671. [Google Scholar] [CrossRef]
- Windarko, N.A.; Tjahjono, A.; Anggriawan, D.O.; Purnomo, M.H. Maximum Power Point Tracking of Photovoltaic System Using Adaptive Modified Firefly Algorithm. In Proceedings of the International Electronics Symposium (IES), Surabaya, Indonesia, 29–30 September 2015; pp. 31–35. [Google Scholar]
- Tehrani, V.M.; Rajaei, A.; Loghavi, M.A. MPPT Controller Design Using TLBO Algorithm for Photovoltaic Systems Under Partial Shading Conditions. In Proceedings of the 12th Power Electronics, Drive Systems, and Technologies Conference (PEDSTC), Tabriz, Iran, 2–4 February 2021; pp. 1–5. [Google Scholar]
- Tian, H.; Bai, Q.; Li, X.; Han, H.; Maoa, S.; Yang, H.; Wang, H. Comparative Study on Fill Factor of PERC Silicon Solar Cells and Al-BSF Silicon Solar Cells under Non-standard Test Conditions. In Proceedings of the IEEE 48th Photovoltaic Specialists Conference (PVSC)s, Fort Lauderdale, FL, USA, 20–25 June 2021; pp. 256–259. [Google Scholar]
- Forouzesh, M.; Siwakoti, Y.P.; Gorji, S.A.; Blaabjerg, F.; Lehman, B. Step-up DC–DC Converters: A Comprehensive Review of Voltage-boosting Techniques, Topologies, and Applications. IEEE Trans. Power Electron. 2017, 32, 9143–9178. [Google Scholar] [CrossRef]
- Park, D.; Lee, H. Improvements in Light-load Efficiency and Operation Frequency for Low-voltage Current-mode Integrated Boost Converters. IEEE Trans. Circuits Syst. II Express Briefs 2014, 61, 599–603. [Google Scholar] [CrossRef]
- Park, K.B.; Moon, G.W.; Youn, M.J. Overview of High-step-up Coupled-inductor Boost Converters. IEEE J. Emerg. Sel. Topics Power Electron. 2016, 4, 689–704. [Google Scholar]
- Park, K.B.; Moon, G.W.; Youn, M.J. Nonisolated High Step-up Stacked Converter Based on Boost-integrated Isolated Converter. IEEE Trans. Power Electron. 2011, 26, 577–587. [Google Scholar] [CrossRef]
- Schmitz, L.; Martins, D.C.; Coelho, R.F. Generalized High Step-up DC-DC Boost-based Converter with Gain Cell. IEEE Trans. Circuits Syst. I Regular Papers 2017, 64, 480–493. [Google Scholar] [CrossRef]
- Park, K.B.; Moon, G.W.; Youn, M.J. Nonisolated High Step-up Boost Converter Integrated with Sepic Converter. IEEE Trans. Power Electron. 2010, 25, 2266–2275. [Google Scholar] [CrossRef]
- Park, K.B.; Moon, G.W.; Youn, M.J. High Step-up Boost Converter Integrated with a Transformer-assisted Auxiliary Circuit Employing Quasi-resonant Operation. IEEE Trans. Power Electron. 2012, 27, 1974–1984. [Google Scholar] [CrossRef]
- Singh, K.A.; Prajapati, A.; Chaudhary, K. High-gain Compact Interleaved Boost Converter with Reduced Voltage Stress for PV Application. IEEE J. Emerg. Sel. Topics Power Electron. 2022, 10, 4763–4770. [Google Scholar] [CrossRef]
- 62050H-600S Programmable DC Power Aupply, Chroma ATE Inc. Available online: https://www.chromaate.com/downloads/catalogue/Power/62000H-TC.pdf (accessed on 21 February 2023).
Figure 1.
Circuit architecture of the high voltage step-up developed converter.

Figure 2.
Switch waves for each component of the developed converter under various operating modes.

Figure 3.
Status of circuit conduction upon operating Mode 1.

Figure 4.
Status of circuit conduction upon operating Mode 2.

Figure 5.
Status of circuit conduction upon operating Mode 3.

Figure 6.
Relationship between voltage gain and duty cycle.

Figure 7.
The (a) I-V and (b) P-V characteristic curves of the monolithic photovoltaic modules under different shading ratios.
Figure 7.
The (a) I-V and (b) P-V characteristic curves of the monolithic photovoltaic modules under different shading ratios.

Figure 8.
The structure of the MPPT controller based on the proposed improved FA.

Figure 9.
Slope variance on the P-V characteristic curve.

Figure 10.
Flow chart of the proposed improved FA.

Figure 11.
Waves of the input voltage (), input current (), and output voltage () under an actual test at a load power of 300 W.
Figure 11.
Waves of the input voltage (), input current (), and output voltage () under an actual test at a load power of 300 W.

Figure 12.
Actual test results for the I-V and P-V characteristic curves in Case 1.

Figure 13.
Actual test results for the MPPT of the conventional FA adopted in Case 1.

Figure 14.
Actual test results for the MPPT of the improved FA adopted in Case 1 (only the iteration parameters were changed).
Figure 14.
Actual test results for the MPPT of the improved FA adopted in Case 1 (only the iteration parameters were changed).

Figure 15.
Actual test results for the MPPT of the improved FA adopted in Case 1 (both the iteration parameters and initial tracking voltage were changed).
Figure 15.
Actual test results for the MPPT of the improved FA adopted in Case 1 (both the iteration parameters and initial tracking voltage were changed).

Figure 16.
Actual test results for the I-V and P-V characteristic curves in Case 2.

Figure 17.
Actual test results for MPPT of the conventional FA adopted in Case 2.

Figure 18.
Actual test results for the MPPT of the improved FA adopted in Case 2 (only the iteration parameters were changed).
Figure 18.
Actual test results for the MPPT of the improved FA adopted in Case 2 (only the iteration parameters were changed).

Figure 19.
Actual test results for the MPPT of the improved FA adopted in Case 2 (both the iteration parameters and initial tracking voltage were changed).
Figure 19.
Actual test results for the MPPT of the improved FA adopted in Case 2 (both the iteration parameters and initial tracking voltage were changed).

Figure 20.
Actual test results for the I-V and P-V characteristic curves in Case 3.

Figure 21.
Actual test results for the MPPT of the conventional FA adopted in Case 3.

Figure 22.
Actual test results for the MPPT of the improved FA adopted in Case 3 (only the iteration parameters were changed).
Figure 22.
Actual test results for the MPPT of the improved FA adopted in Case 3 (only the iteration parameters were changed).

Figure 23.
Actual test results for the MPPT of the improved FA adopted in Case 3 (both the iteration parameters and initial tracking voltage were changed).
Figure 23.
Actual test results for the MPPT of the improved FA adopted in Case 3 (both the iteration parameters and initial tracking voltage were changed).

Figure 24.
Actual test results for the I-V and P-V characteristic curves in Case 4.

Figure 25.
Actual test results for the MPPT of the conventional FA adopted in Case 4.

Figure 26.
Actual test results for the MPPT of the improved FA adopted in Case 4 (only the iteration parameters were changed).
Figure 26.
Actual test results for the MPPT of the improved FA adopted in Case 4 (only the iteration parameters were changed).

Figure 27.
Actual test results for the MPPT of the improved FA adopted in Case 4 (both the iteration parameters and initial tracking voltage were changed).
Figure 27.
Actual test results for the MPPT of the improved FA adopted in Case 4 (both the iteration parameters and initial tracking voltage were changed).

Figure 28.
Actual test results for the I-V and P-V characteristic curves in Case 5.

Figure 29.
Actual test results for the MPPT of the conventional FA adopted in Case 5.

Figure 30.
Actual test results for the MPPT of the improved FA adopted in Case 5 (only the iteration parameters were changed).
Figure 30.
Actual test results for the MPPT of the improved FA adopted in Case 5 (only the iteration parameters were changed).

Figure 31.
Actual test results for the MPPT of the improved FA adopted in Case 5 (both the iteration parameters and initial tracking voltage were changed).
Figure 31.
Actual test results for the MPPT of the improved FA adopted in Case 5 (both the iteration parameters and initial tracking voltage were changed).

Figure 32.
Actual test results for the I-V and P-V characteristic curves in Case 6.

Figure 33.
Actual test results for the MPPT of the conventional FA adopted in Case 6.

Figure 34.
Actual test results for the MPPT of the improved FA adopted in Case 6 (only the iteration parameters were changed).
Figure 34.
Actual test results for the MPPT of the improved FA adopted in Case 6 (only the iteration parameters were changed).

Figure 35.
Actual test results for the MPPT of the improved FA adopted in Case 6 (both the iteration parameters and initial tracking voltage were changed).
Figure 35.
Actual test results for the MPPT of the improved FA adopted in Case 6 (both the iteration parameters and initial tracking voltage were changed).


Table 1.
Parameter specifications of the proposed converter.
| Parameter | Specification |
|---|---|
| Input voltage (Vin) | 80 V |
| Output voltage (Vo) | 400 V |
| Output power (Po) | 300 W |
| Switching frequency (f) | 25 kHz |
| Turns ratio (N = N2/N1) | 2 |
Table 2.
Parameter specifications for each component of the proposed converter.
| Parameter | Specification |
|---|---|
| Coupled inductor (Lm1) | 284 μH |
| Film capacitor (C1) | 2 μF/250 V |
| Film capacitor (C2) | 5 μF/630 V |
| Input capacitor (Cin) | 470 μF/400 V |
| Output capacitor (Co) | 470 μF/500 V |
| Switch (S1) | MOSFET-TK49N65W (650 V/49 A) |
| Fast diode (D1, D2, D3, D4) | IQBD30E60A1 (600V/30A) |
Table 3.
Parameter specifications for electrical performance of photovoltaic modules SWM-20W produced by MPPTSUN.
Table 3.
Parameter specifications for electrical performance of photovoltaic modules SWM-20W produced by MPPTSUN.
| Parameter | Value |
|---|---|
| Maximum output power () | 20 W |
| Current of maximum power point () | 1.10 A |
| Voltage of maximum power point () | 18.18 V |
| Short-circuit current () | 1.15 A |
| Open circuit voltage () | 22.32 V |
| Overall module dimensions | 395 mm × 345 mm × 17 mm |
Table 4.
Status of adjusting step factor between the P-V characteristic curve and iteration parameter.
Table 4.
Status of adjusting step factor between the P-V characteristic curve and iteration parameter.
| α + 0.02 | |
| α + 0.015 | |
| α − 0.01 | |
| α − 0.015 | |
| α − 0.02 | |
| α | |
| α − 0.02 | |
| α − 0.015 | |
| α − 0.01 | |
| α + 0.015 | |
| α + 0.02 |
Table 5.
Parameters of the conventional FA.
| Parameter Name | Parameter Value |
|---|---|
| Firefly number (it) | 4 |
| Total iteration number (MaxIt) | 50 |
| Step factor (α) | 2 |
Table 6.
Parameters of the proposed improved FA.
| Parameter Name | Parameter Value |
|---|---|
| Firefly number (it) | 4 |
| Total iteration number (MaxIt) | 50 |
| Upper limit of step factor (αmax) | 2.5 |
| Lower limit of step factor (αmin) | 1.5 |
Table 7.
Number of peaks in the P-V characteristic curves for the PVMAs with four modules in series and three modules in parallel under six different shading statuses.
Table 7.
Number of peaks in the P-V characteristic curves for the PVMAs with four modules in series and three modules in parallel under six different shading statuses.
| Case | Shading Status with 4 Modules in Series and 3 Modules in Parallel | Number of Peaks in the P-V Characteristic Curves |
|---|---|---|
| 1 | (0% shading + 0% shading + 0% shading + 0% shading)// (0% shading + 0% shading + 0% shading + 0% shading)// (0% shading + 0% shading + 0% shading + 0% shading) | Single-peak |
| 2 | (0% shading + 0% shading + 0% shading + 90% shading)// (0% shading + 0% shading + 0% shading + 0% shading)// (0% shading + 0% shading + 0% shading + 0% shading) | Double-peak (MPP at left) |
| 3 | (0% shading + 0% shading + 30% shading + 90% shading)// (0% shading + 0% shading + 0% shading + 0% shading)// (0% shading + 0% shading + 0% shading + 0% shading) | Triple-peak (MPP at middle) |
| 4 | (0% shading + 0% shading + 70% shading + 90% shading)// (0% shading + 0% shading + 70% shading + 90% shading)// (0% shading + 0% shading + 0% shading + 0% shading) | Triple-peak (MPP at left end) |
| 5 | (0% shading + 20% shading + 40% shading + 90% shading)// (0% shading + 0% shading + 0% shading + 0% shading)// (0% shading + 0% shading + 0% shading + 0% shading) | Quadruple-peak (MPP at the third peak) |
| 6 | (0% shading + 10% shading + 80% shading + 90% shading)// (0% shading + 10% shading + 80% shading + 90% shading)// (0% shading + 10% shading + 80% shading + 90% shading) | Quadruple-peak (MPP at the second peak) |
Note: The symbol “+” stands for series connection, while the symbol “//” stands for parallel connection.
Table 8.
Comparison of the average tracking time between six cases under 10 actual tests.
| Case | The Number of Peaks in the P-V Curve | Average Tracking Time | ||
|---|---|---|---|---|
| Conventional FA | Improved FA (Iteration Parameter Changed) | Improved FA (Iteration Parameter and Initial Tracking Voltage Changed) | ||
| 1 | Single-peak | 2.8 s | 1.5 s | 0.7 s |
| 2 | Double-peak (MPP at left) | 3.4 s | 1.7 s | 0.9 s |
| 3 | Triple-peak (MPP at middle) | 3.8 s | 2.1 s | 1.3 s |
| 4 | Triple-peak (MPP at left end) | 4.0 s | 2.5 s | 1.4 s |
| 5 | Quadruple-peak (MPP at the third peak) | 4.2 s | 2.7 s | 1.6 s |
| 6 | Quadruple-peak (MPP at the second peak) | 4.7 s | 3.2 s | 2.0 s |
Table 9.
Comparison of actual test results for four cases.
| Case | Number of Peak(s) of the P-V Curve | Method Proposed in Reference [15] | Method Proposed in Reference [22] | Method Proposed in Reference [28] | Proposed in this Study |
|---|---|---|---|---|---|
| Average Tracking Time | Average Tracking Time | Average Tracking Time | Average Tracking Time | ||
| 1 | Single-peak | 2.3 s | 0.8 s | 4.5 s | 0.7 s |
| 2 | Double-peak | 2.4 s | 1.22 s | 4.5 s | 0.9 s |
| 3 | Triple-peak | 3.5 s | 1.89 s | 5 s | 1.3 s |
| 4 | Quadruple-peak | 4.2 s | None * | 6.5 s | 1.6 s |
Note: The symbol “None *” indicates that this reference does not provide the test results of this case.
Disclaimer/Publisher’s Note: The statements, opinions and data contained in all publications are solely those of the individual author(s) and contributor(s) and not of MDPI and/or the editor(s). MDPI and/or the editor(s) disclaim responsibility for any injury to people or property resulting from any ideas, methods, instructions or products referred to in the content. |
© 2023 by the authors. Licensee MDPI, Basel, Switzerland. This article is an open access article distributed under the terms and conditions of the Creative Commons Attribution (CC BY) license (https://creativecommons.org/licenses/by/4.0/).
Share and Cite
MDPI and ACS Style
Chao, K.-H.; Zhang, S.-W. An Maximum Power Point Tracker of Photovoltaic Module Arrays Based on Improved Firefly Algorithm. Sustainability 2023, 15, 8550. https://doi.org/10.3390/su15118550
AMA Style
Chao K-H, Zhang S-W. An Maximum Power Point Tracker of Photovoltaic Module Arrays Based on Improved Firefly Algorithm. Sustainability. 2023; 15(11):8550. https://doi.org/10.3390/su15118550
Chicago/Turabian StyleChao, Kuei-Hsiang, and Shu-Wei Zhang. 2023. "An Maximum Power Point Tracker of Photovoltaic Module Arrays Based on Improved Firefly Algorithm" Sustainability 15, no. 11: 8550. https://doi.org/10.3390/su15118550
Note that from the first issue of 2016, this journal uses article numbers instead of page numbers. See further details here.