Article

Projection of Meteorological Dryness/Wetness Evolution Based on Multi-Model Scenarios in Poyang Lake Basin, China

1
Poyang Lake Water Resources Monitoring Center, Nanchang 330038, China
2
College of Hydrology and Water Resources, Hohai University, Nanjing 210098, China
3
China Meteorological Administration Economic Transformation of Climate Resources Key Laboratory, Chongqing Climate Center, Chongqing 401147, China
4
Jiangxi Hydrology Monitoring Center, Nanchang 330002, China
*
Author to whom correspondence should be addressed.
Sustainability 2023, 15(10), 8194; https://doi.org/10.3390/su15108194
Submission received: 28 February 2023 / Revised: 9 May 2023 / Accepted: 13 May 2023 / Published: 18 May 2023
(This article belongs to the Section Air, Climate Change and Sustainability)

Abstract

:
Based on the projections of three shared socioeconomic pathways (SSPs) scenarios of three climate models of CMIP6, this study analyzed the standardized precipitation evapotranspiration index (SPEI) to understand the future meteorological dryness/wetness changes in the Poyang Lake basin (PLB) from 2021 to 2100. The effect of temperature change on the dryness and wetness variation was explored by comparing the trends of SPEI and standardized precipitation index (SPI) at multiple-time scales and different SSPs scenarios. The results indicate that the frequency of drought events may increase by 1.1~3.8% than the historical period in the three scenarios, and they may be higher than that of wetness events in the future of this century. Cumulative months of drought events are higher in most decades than the wetness events, and especially in the 2090s. A total of 43 months may suffer drought events in the 2090s under the SSP585 scenario, which is more than twice the wetness events. With the enhanced concentration of greenhouse gas (GHG) emissions, both the frequency of droughts and the proportion of extreme droughts show a significant increasing trend at 99% confidence in PLB. The spatial distribution of net precipitation is generally in the southwest–northeast pattern, yet it is still in different values in most scenarios; thus, the uncertainty of dryness/wetness spatial conditions should be considered. The SPI detects more wetness events and a more intensive wetting trend, while the SPEI shows the opposite. The difference between SPI and SPEI gradually increases with GHG emission concentration, and may even lead to contrary conclusion in the last two decades at a 48-month scale under the SSP245 and 585 scenarios, indicating the unneglectable impact of increasing temperature and evapotranspiration on the dryness/wetness conditions in the future. The research results can help to predict the evolution pattern of dry and wet occurrence in the PLB in the future and promote flood/drought control and disaster mitigation.

1. Introduction

The IPCC AR6 states that climate warming is an undeniable fact. Compared to the Industrial Revolution (1850–1900), the global surface temperature increased by 0.99 °C from 2001 to 2020, and by 1.09 °C from 2010 to 2020, making the last 50 years the warmest in the last 2000 years [1]. Climate change will have a significant impact on the natural ecosystem and production systems, and increase the probability of hydrological extreme events, making flood and drought mitigation more challenging [2,3,4]. The occurrence of these extreme hydrological events has the potential to cause food loss, and harm the environment [5]. The climate has been warming since the 1950s in China, with surface temperatures rising faster than the global average [6]. The interannual and interdecadal variability of drought and flood disasters in China has become more apparent, and the frequency of drought and flood disasters tends to increase [7,8]. In the Yangtze River basin (YRB), the rainy season duration is shortening but precipitation intensity is rising, especially showing a powerful growing trend of precipitation intensity in the middle and lower YRB [9].
Consequently, the impact of climate change on water supplies and hydrological processes has become a focus of intense study worldwide. Precipitation and temperature significantly impact the variability of the watershed hydrological regime [10]. Temperature and precipitation interactions change the difference between precipitation and potential evapotranspiration, increasing the uncertainty of wet and dry trends [11]. Climate change causes the wet season to be wetter and the dry season to be drier [12]. Quantifying wet and dry trends is an essential method for identifying extreme weather events, understanding regional hydrological conditions, and informing flood control [13]. Recently, the Palmer drought severity index (PDSI), the SPI, and the SPEI methodologies have been frequently used in dry and wet variation research. SPEI combines the sensitivity of PDSI to changes in evaporative demand (caused by temperature fluctuations and trends) with the simplicity of calculations and the multi-temporal nature of SPI, making it appropriate for detecting, monitoring, and exploring the effects of global warming on drought conditions [14].
Poyang Lake, the largest riverine freshwater lake in China, is crucial for water storage and conservation, and its alluvial plain serves as a significant base for agricultural production. In addition, as one of the most important wetlands in the world, Poyang Lake provides water purification, climate regulation, and ecological diversity protection. In recent years, advanced and extended dry periods and a decline in the water level of Poyang Lake has occurred regularly due to the influence of climate change and human activities, causing significant harm to the ecological environment and agricultural output. Severe hydrological drought has led the lake water storage to drop below 1% of its capacity, posing a major threat to the ecology of wetlands [15,16]. Meanwhile, Poyang Lake floods frequently, which seriously threatens the life and property safety of people in the lake area. Statistics show that from 1950–2010, there were seventeen times of severe flooding events (water level over 20 m) and six times of extreme flooding (1954, 1983, 1995, 1996, 1998, and 1999) in Poyang Lake (water level over 21 m) [17]. To improve flood forecasting and mitigation in the area, it is crucial to have a better understanding of future dryness/wetness changes in the PLB in relation to climate change.
Due to the substantial influence of global warming and the East Asian monsoon, extreme hydrological events in the Poyang Lake region are more frequent and intense [18]. In recent years, numerous research has investigated the characteristics and causes of severe floods and droughts in the Poyang Lake watershed in terms of climate change and human activities [19]. By comparing the hydrological and energy differences between dry and wet years, the drought and flood patterns of PLB are revealed. Zhang suggested that the spatial and temporal distribution of extreme drought in PLB is influenced by regional precipitation anomalies, extreme drought in the upper Yangtze River, and river–lake interactions due to water storage at the Three Gorges Dam [20]. Wang investigated the response of the variation of lake level in Poyang Lake to the meteorological drought index SPEI [21]. Liu analyzed the spatial and temporal variability of drought, revealing a possible link between basin drought variability and large-scale climate index [22]. The annual precipitation and temperature of the Poyang Lake basin may continue to increase in the future against the backdrop of global climate change characterized by considerable warming, posing a greater challenge for flood and drought mitigation in the future.
Although there are some studies on the changing characteristics and impacts of PLB meteorological dry/wet conditions, there is little attention paid to the future dry/wet evolution patterns of PLB. Therefore, it is necessary to extend the previous studies to investigate the spatial and temporal distribution of dryness and wetness in the Poyang Lake basin under the trend of precipitation and temperature changes in the future decades, which is important for the development of regional drought resistance, disaster prevention, and mitigation strategies. To achieve the above objectives, this study needs to evaluate the following items: (1) climate change in historical and future periods; (2) comparison of dryness/wetness changes under different scenarios in historical and future periods; (3) the effects of temperature changes on dry/wet conditions in the context of global warming. The results of this study are expected to provide useful references and valuable information for future flood and drought control and water resources management in the Poyang Lake catchment. The study is arranged as follows: the second chapter introduces the study area, data, and methods; the third chapter analyzes the characteristics and influencing factors of dryness/wetness changes in historical and future periods; the fourth chapter discusses the results; the final section concludes the major findings.

2. Data and Methodology
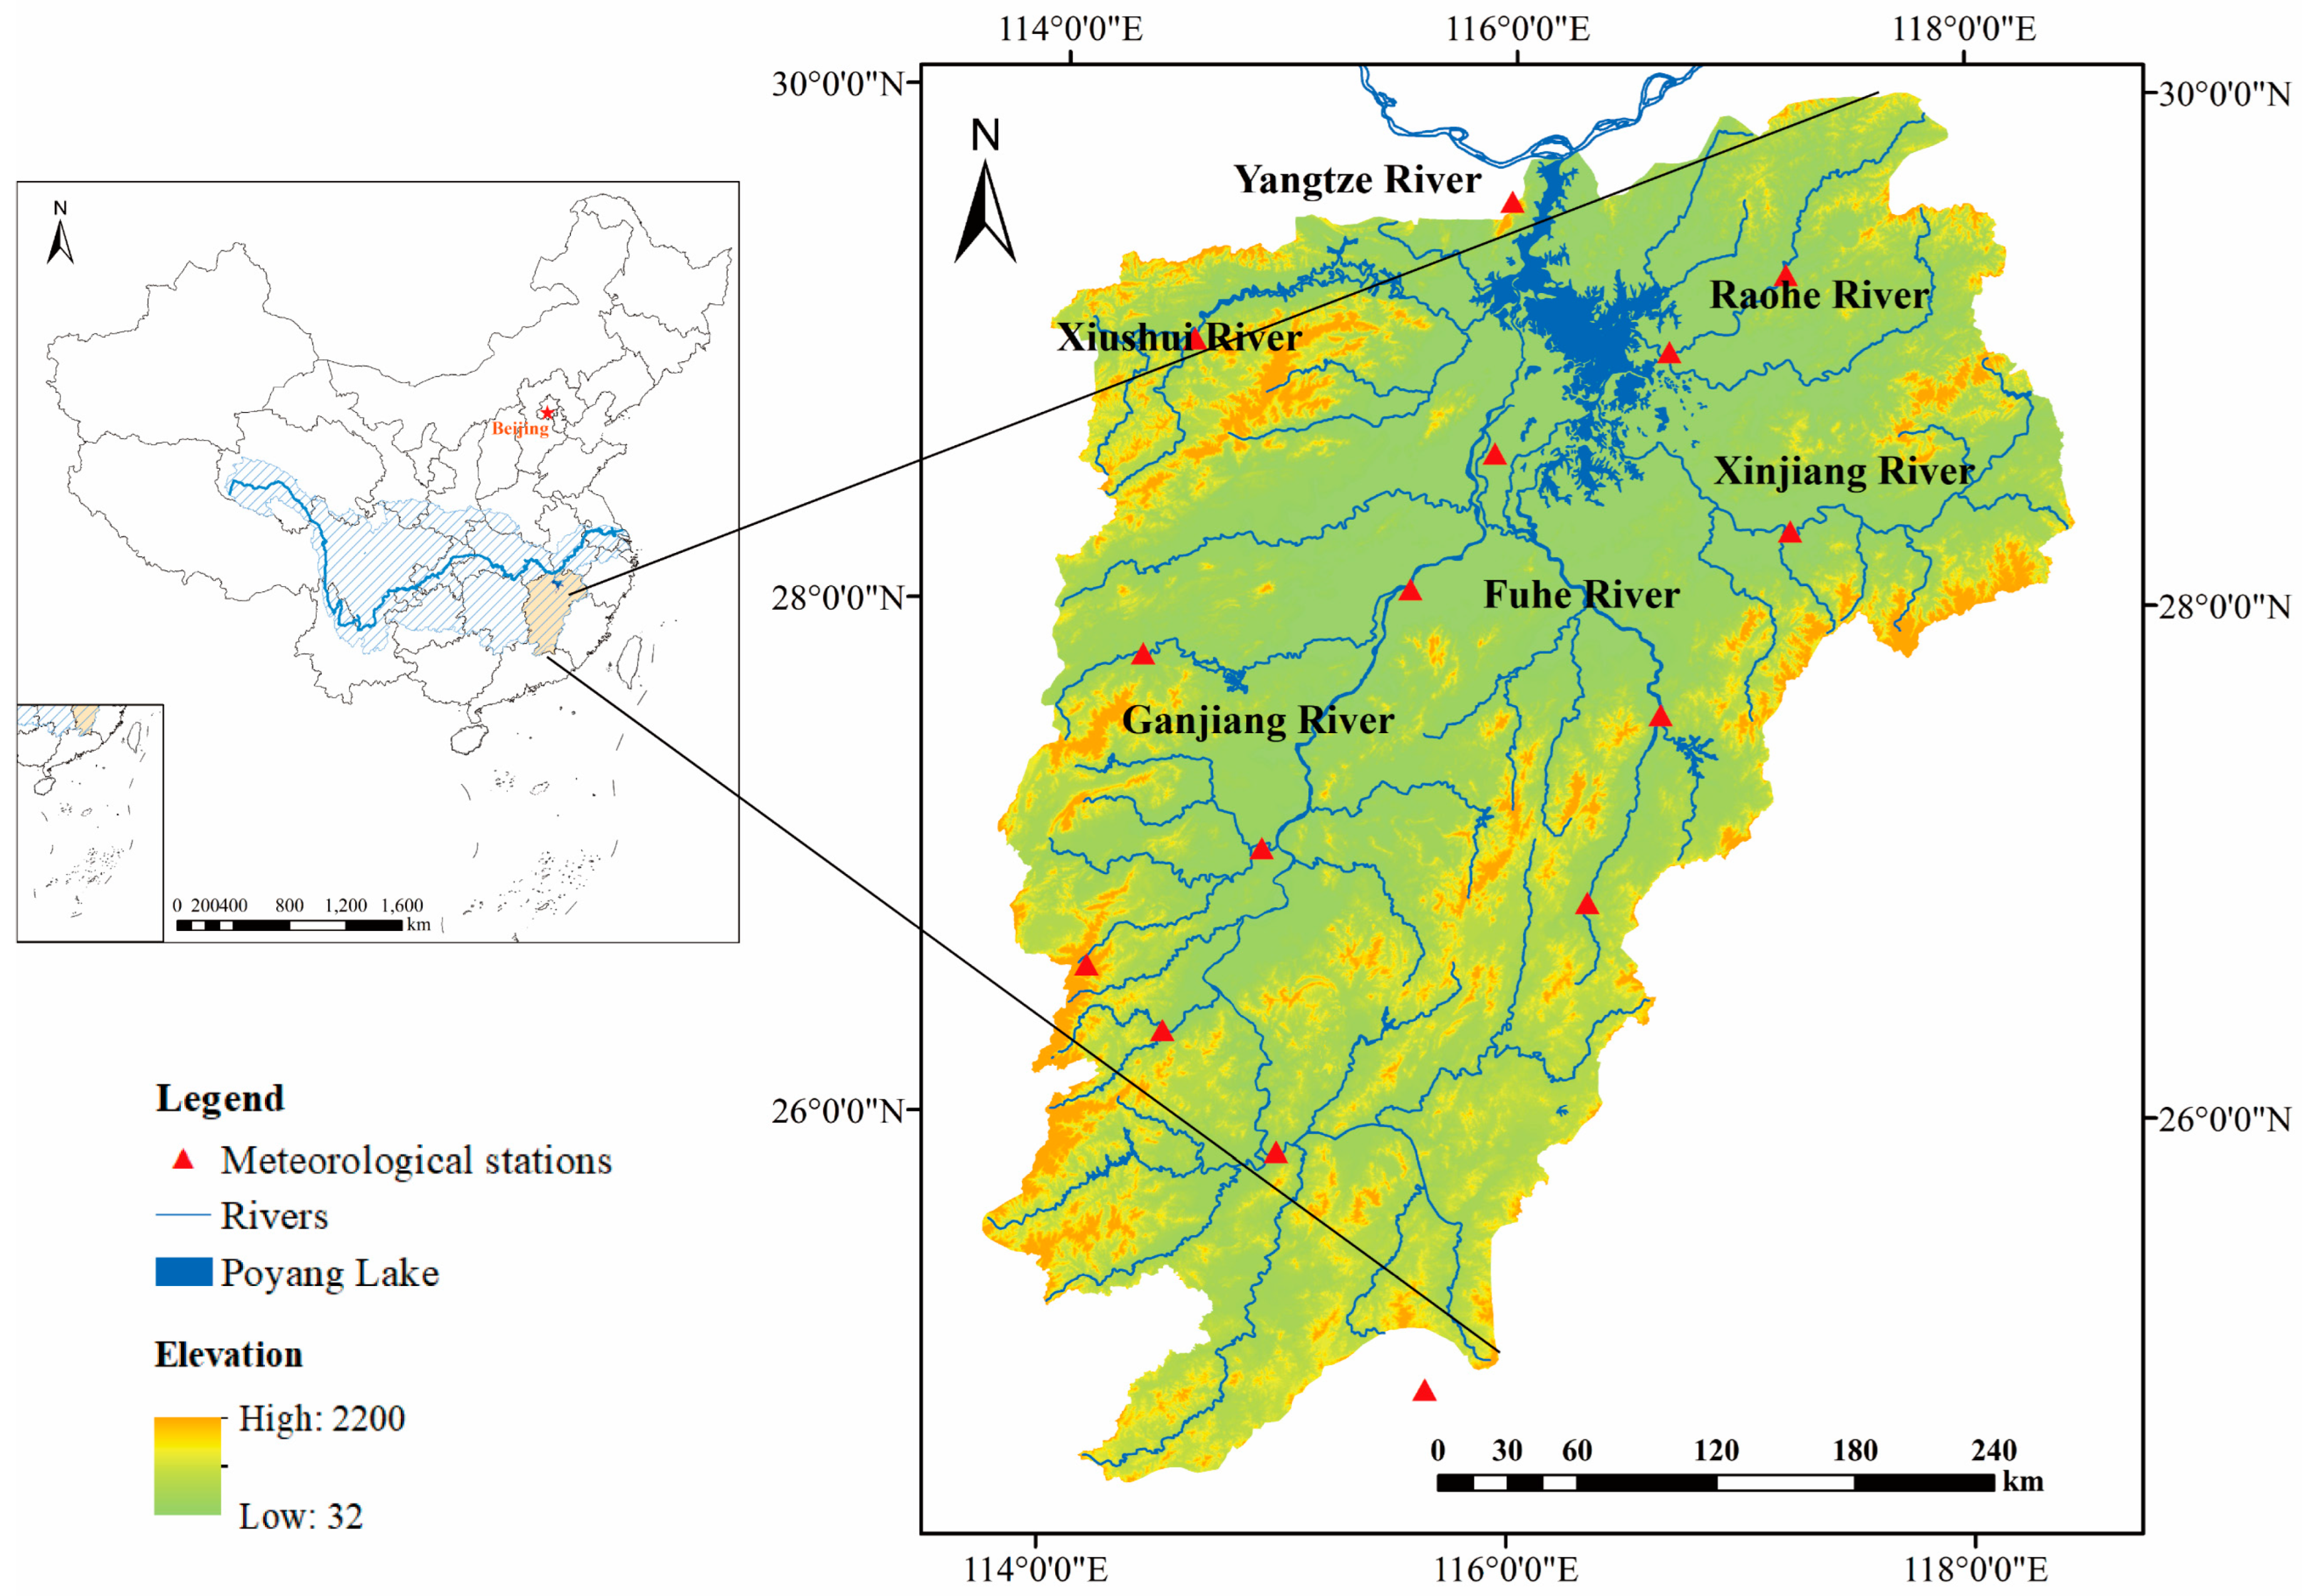
2.1. Study Area

PLB located in the middle reaches of the Yangtze River, comprises 1,620,000 km2 and accounts for 9% of the YRB’s area [23], and is an important water resource and ecological function area in China. Poyang Lake is the largest freshwater lake with a river connection in China and one of the most significant wetlands and bird wintering sites worldwide [24,25]. The watershed consists of the Poyang Lake plain and the broad alluvial valley formed by the five tributaries of the Xiushui River, Ganjiang River, Fuhe River, Raohe River, and Xinjiang River (hereinafter referred to as the five rivers). PLB mainly consists of mountainous and hilly red soil areas, and the topography of the area varies from mountainous areas in the upper reaches at an altitude of 2100 m to plain areas in the lower reaches at an altitude of about 35 m [26]. The basin consists of 36% mountainous areas, 42% hilly areas, 14.7% flat and upland areas, and 7.3% surface water [27].
PLB is located in the East Asian monsoon zone, with a warm and humid subtropical climate. The average annual temperature is about 16.3–19.5 °C and the average precipitation is 1341–1943 mm [28]. Precipitation is unevenly distributed within the year, mainly concentrated from April to June, accounting for 44.5–49.3% of the total annual rainfall [29]. In addition, the temperature exhibits seasonal characteristics, averaging 27.3 °C from June to August, 7.1 °C from December to February, and 17.6 °C annually [30]. The total water amount entering the lake from the five rivers is about 148 × 109 m3/y, and the monthly average water amount entering the lake varies from 5.1 × 10⁹ m3 to 28.9 × 10⁹ m3 [31], with a gradual increase from January to June and a gradual decrease from July to December [32]. The hydrological regime of Poyang Lake is simultaneously governed by the basin rivers and the Yangtze River, resulting in seasonal variations in lake level ranging from 8 to 22 m [33], and the lake area changes from less than 1000 km2 to more than 3000 km2 [34].

2.2. Datasets

The Coupled Mode Intercomparison Project (CMIP), facilitated by the World Climate Research Program (WCRP), is currently the most influential international data source for global climate change detection and projection. The experimental design of CMIP6 consists of three levels: firstly, the core experiment is DECK (diagnostic, evaluation, and characterization of klima; klima is Greek for climate); the second level experiment is a historical climate simulation experiment; thirdly, surrounding the two core tests mentioned above, the outermost layer is CMIP6-approved MIPs (model intercomparison projects) [35]. The projection experiment in CMIP6 includes a new set of emission and land use scenarios that combine shared socioeconomic pathways (SSPs) and representative concentration pathways (RCPs) [36]. Compared with the CMIP 5 model, CMIP6 has improved the ability to simulate climate indices in China [37]. Based on their own research needs and considering the structural variability between models and the reliability of climate projections consistent with this study area, monthly precipitation (P) and temperature (T) data extracted from the CMIP6 model (https://esgf-node.llnl.gov/projects/cmip6/, accessed on 15 January 2023) output included two phases for the historical period (1961–2014) and the future projection period (2021–2100). Among all the climate models selected above, BCC-CAM2-MR, MRI-ESM2-0, and NESM3 were chosen (Table 1) due to better simulation performance in the YRB [38,39,40]. Three future SSPs were selected for the study: SSP126, SSP245, and SSP585. These three different carbon emission scenarios represent low, medium, and high-emission forcing scenarios in turn, and represent the sustainable development pathway, the moderate development pathway, and fossil-fueled development pathways, respectively [36,41]. For the measured data, the monthly average P and T data set of 15 meteorological stations (Figure 1) in the PLB from 1961 to 2014 provided by the National Meteorological Information Center of the China Meteorological Administration (http://data.cma.cn/, accessed on 15 January 2023) was selected as the reference standard for simulating future P and T characteristics. CMIP6 data were bias-corrected using the simple delta-change (SDC) method [42]. This study uses the bilinear interpolation method for downscaling and constructs a spatial resolution of a 0.25° × 0.25° dataset.

2.3. Methods

SPEI proposed by Vicente-Serrano, takes into account the effect of evapotranspiration on the degree of drought, using as an input the difference between precipitation and evapotranspiration, which is more applicable to the analysis of drought under global warming [14,43]. The meteorological variables used in the SPEI calculation process are P and T. Potential evapotranspiration (PET) was calculated using the Thornthwaite method [44]. The specific calculation process of SPEI referred to previous studies [14,45,46].
SPI is a meteorological drought index with multiple time scales proposed by McKee [47] based on precipitation data. SPI compared with SPEI only considers the effect of precipitation on the degree of drought, and the calculation process of both indexes was similar. The method assumes that the precipitation time series obeys a two-parameter Γ distribution and fits it, then normalizes the probability distribution to obtain the SPI, and finally classifies the drought categories according to the cumulative frequency distribution. Therefore, the calculation of SPI only used P from the dataset. The specific calculation process is described in the literature [48].
According to the threshold values suggested by [49], the seven classes of meteorological dry and wet conditions based on SPEI and SPI values are presented in Table 2.

3. Results

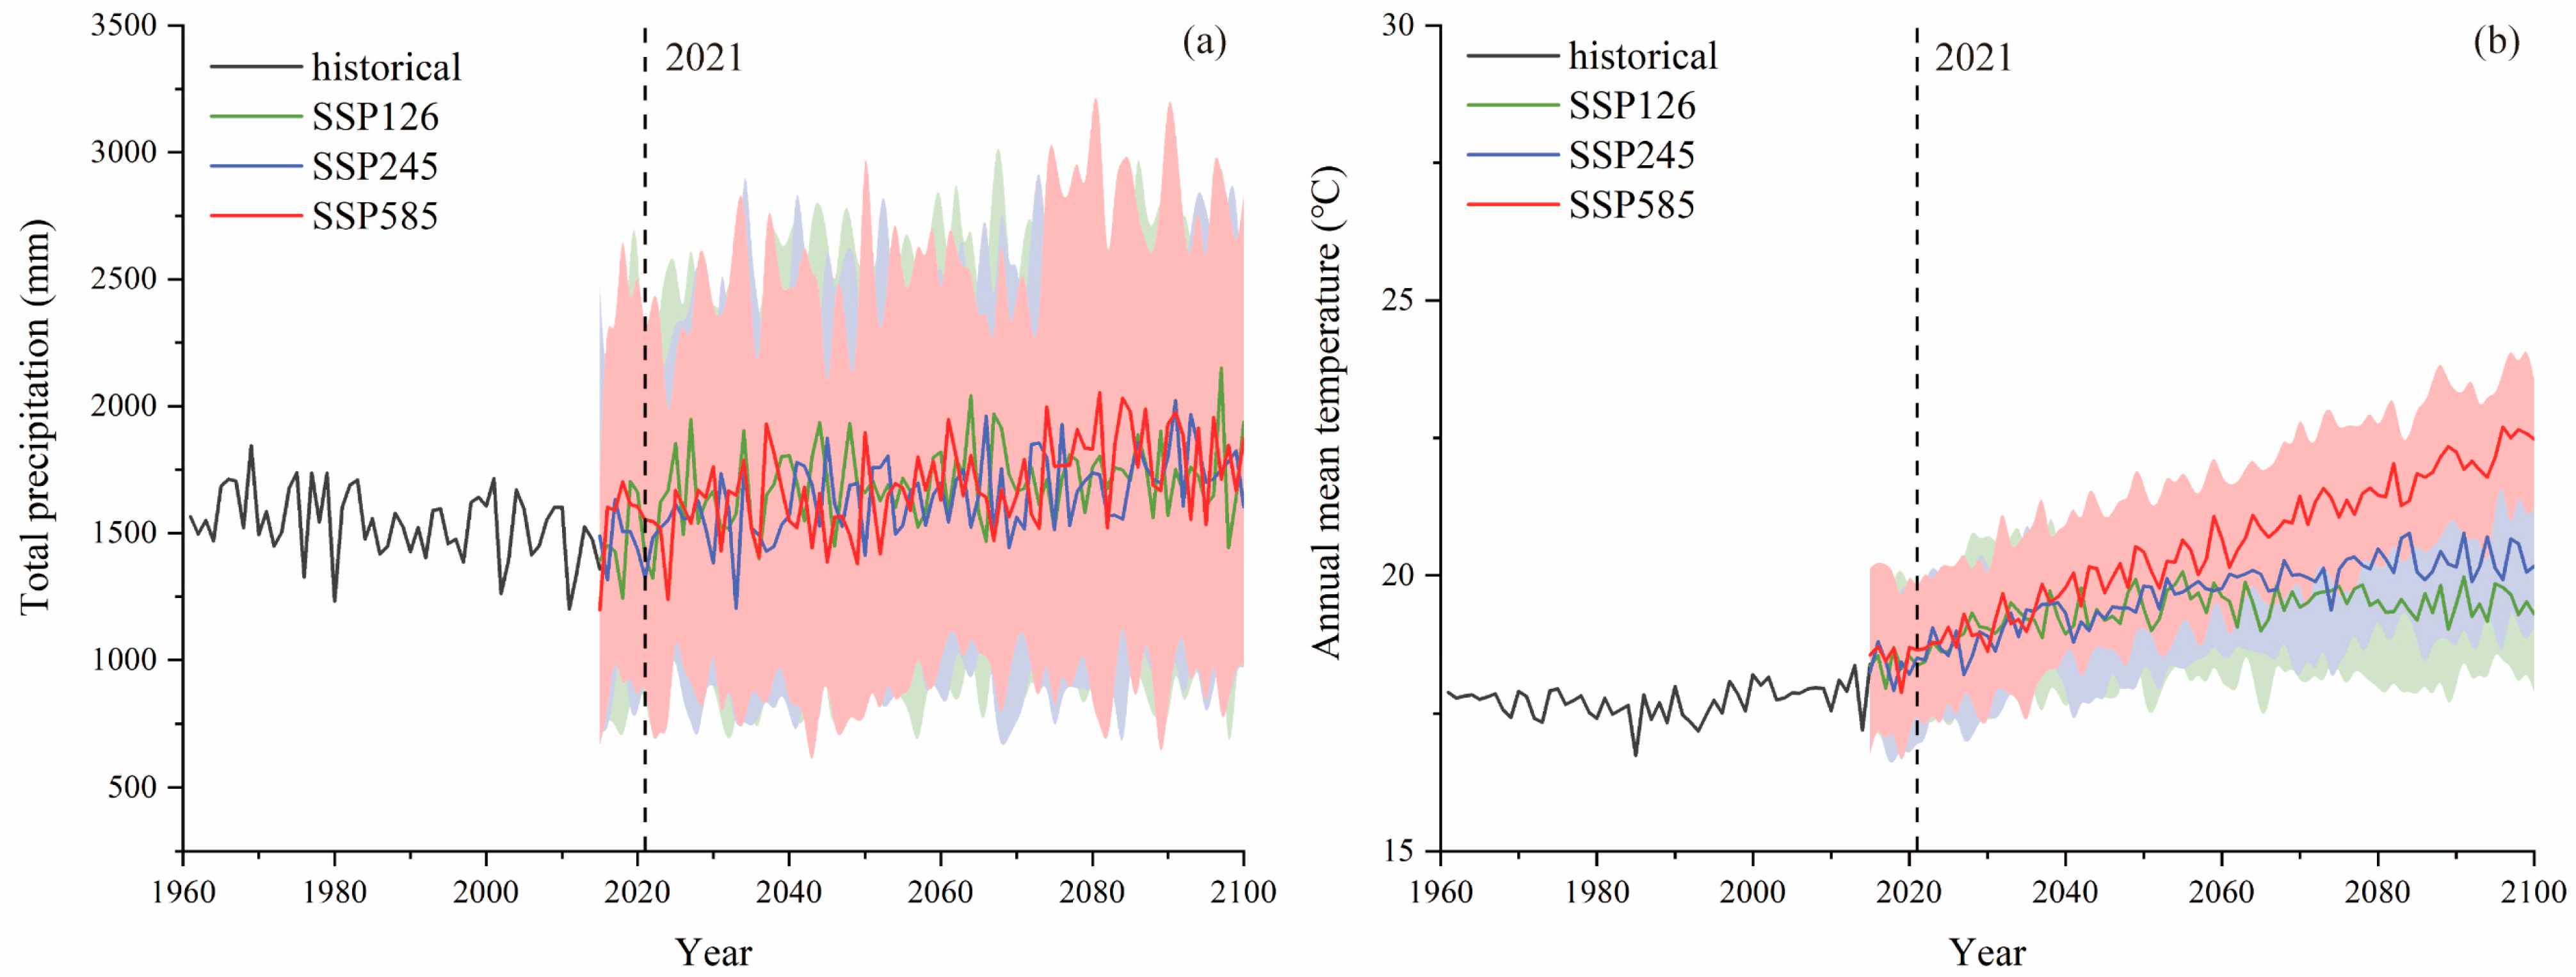
3.1. Historical and Future Climate Changes

Based on the ensemble mean of three CMIP6 simulations, Figure 2 illustrates the interannual trends in precipitation and mean temperature in the PLB under several scenarios for the historical period (1961–2014) and the future period (2021–2100). The historical annual precipitation had an overall decreasing trend, with the maximum annual precipitation of 1842.71 mm (1969) and the minimum annual precipitation of 1200.51 (2011) during this period. Meanwhile, the historical average temperature increased from 17.87 °C (1961) to 18.67 °C (2014), with a minimum average temperature of 16.74 °C (1985) and a maximum temperature of 18.26 °C (2013) during this period. In the future period, the annual average precipitation is expected to increase at the rate of 66.43 mm, 34.92 mm, and 40.11 mm per decade under SSP 126, SSP 245, and SSP 585, respectively. In the three scenarios, the annual mean temperature increased at the rates of 0.12 °C, 0.21 °C, and 0.48 °C/10a, respectively. The warming rate of SSP585 far exceeded that of SSP126, SSP245, and the historical period. Overall, there is a general trend of increasing precipitation and temperature in the future, with large differences in the magnitude of increase and change characteristics under different scenarios.

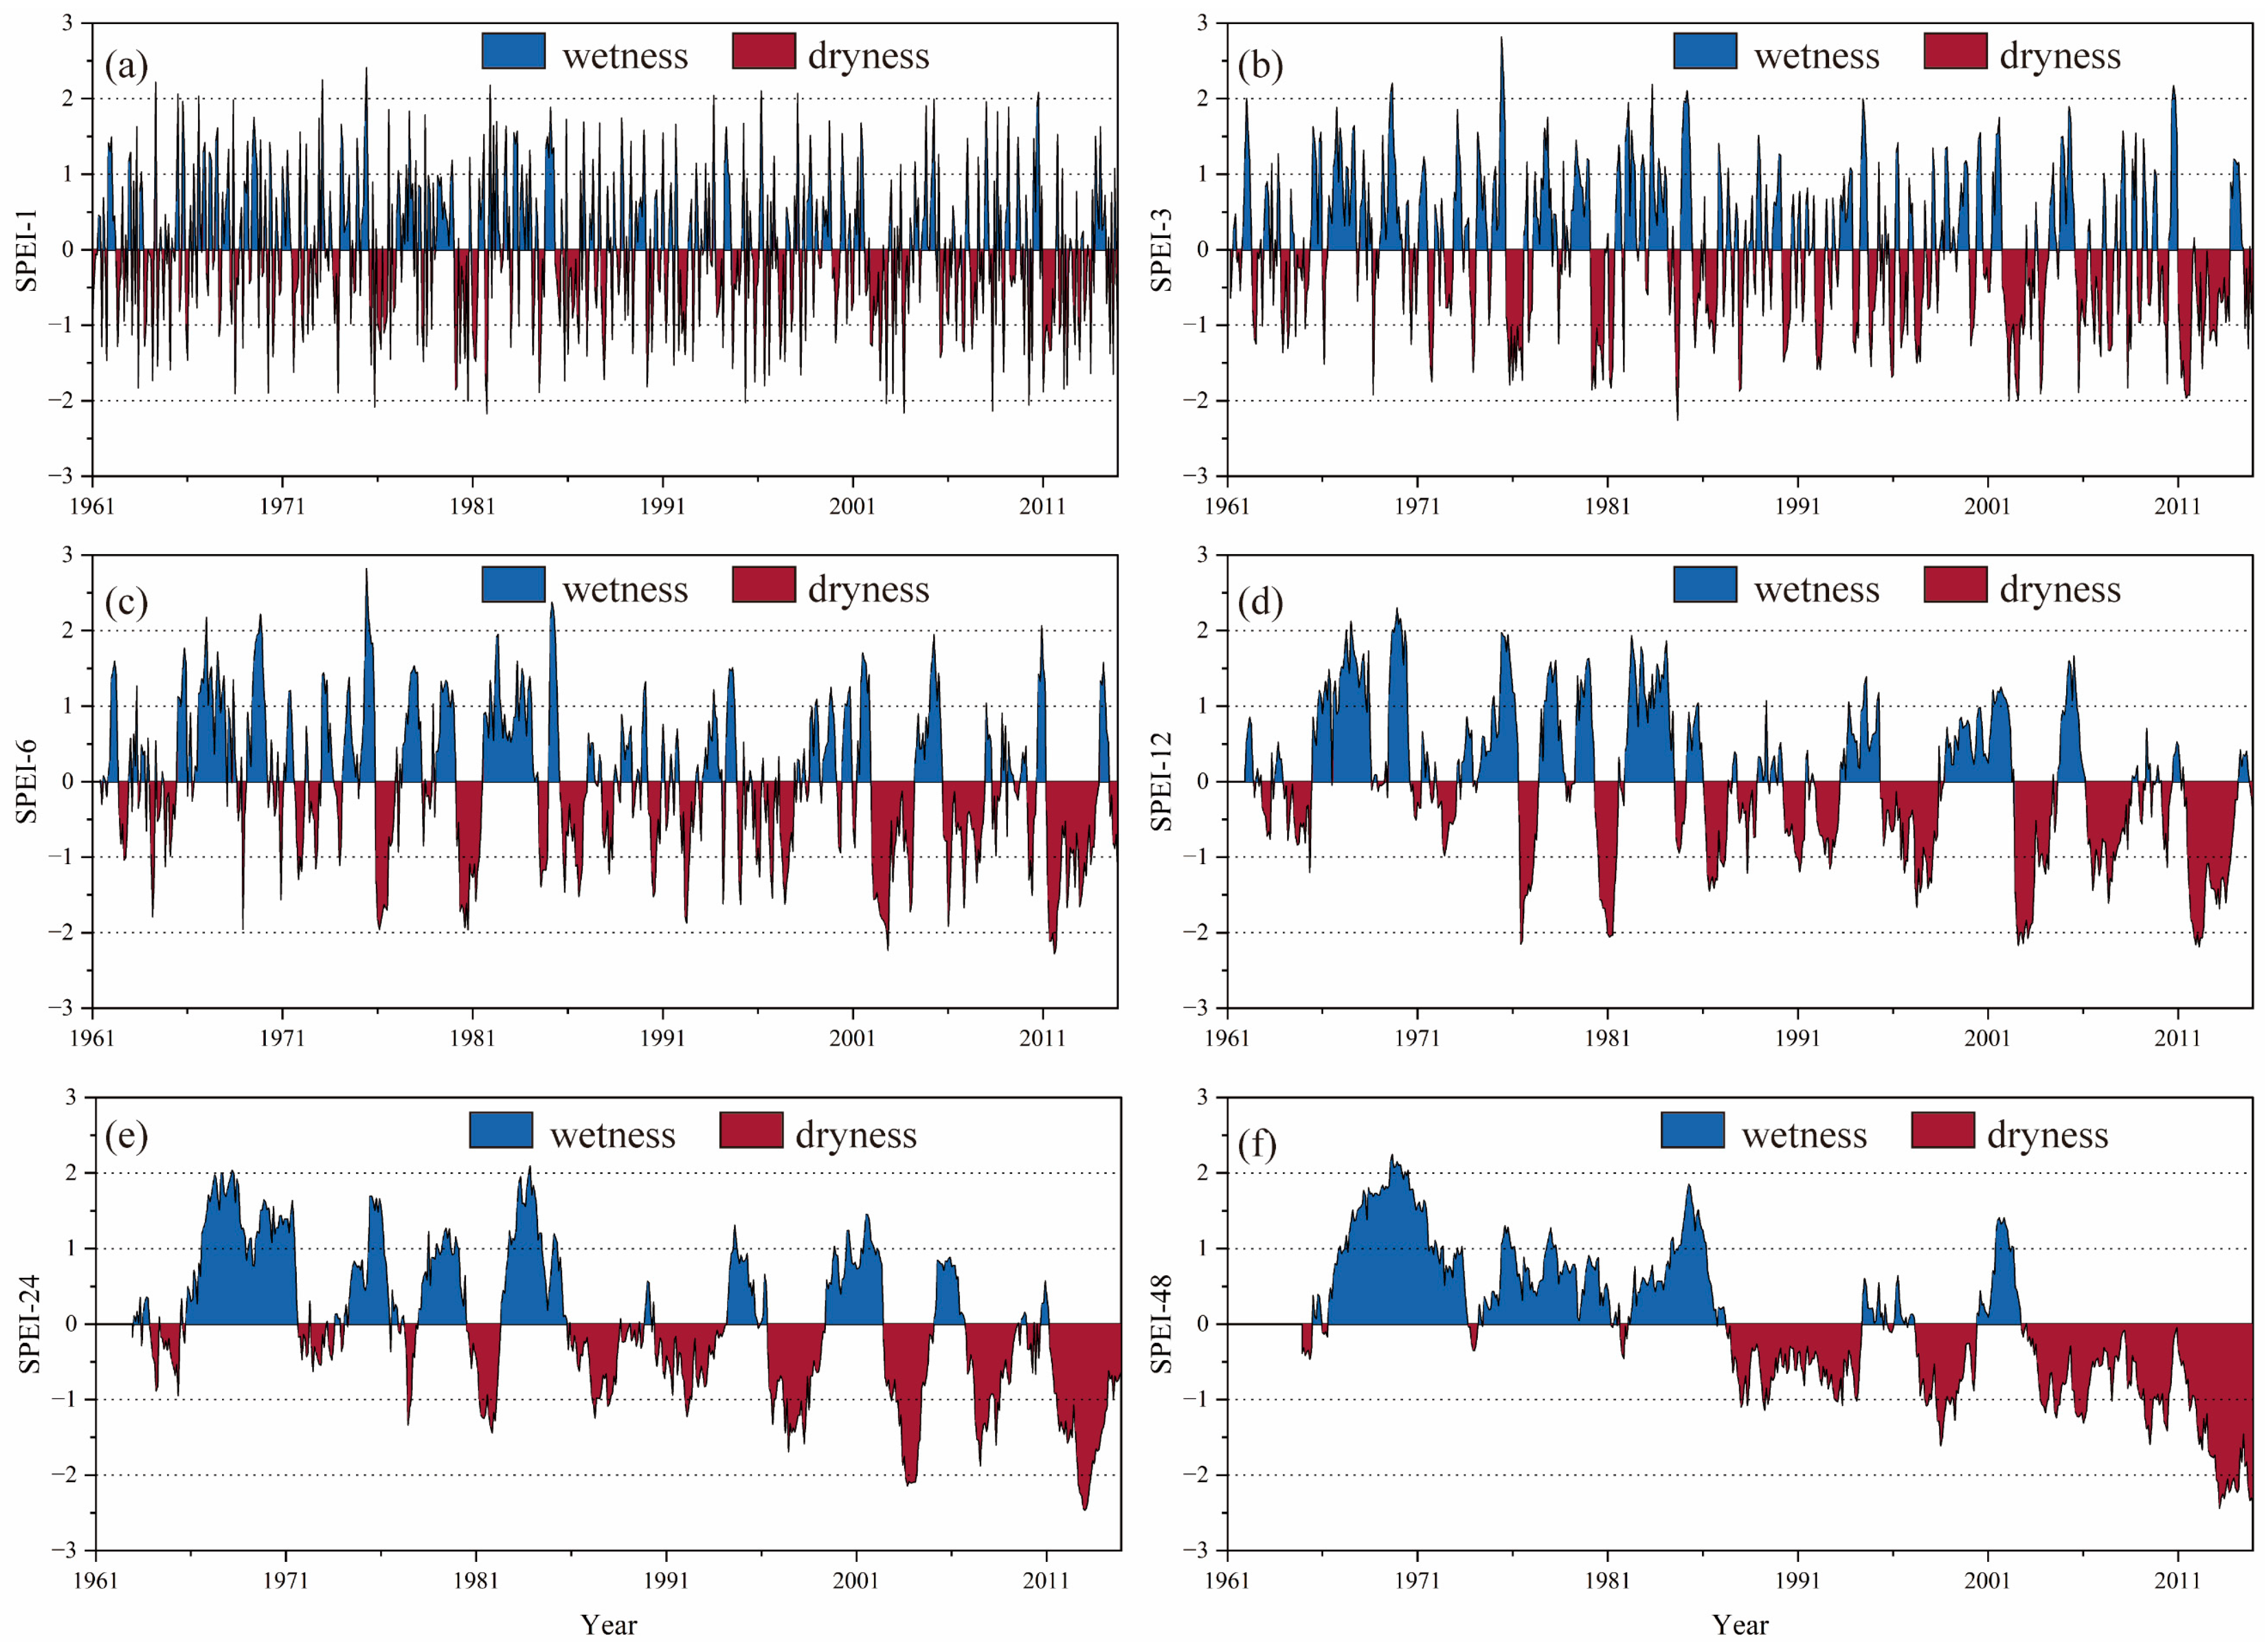
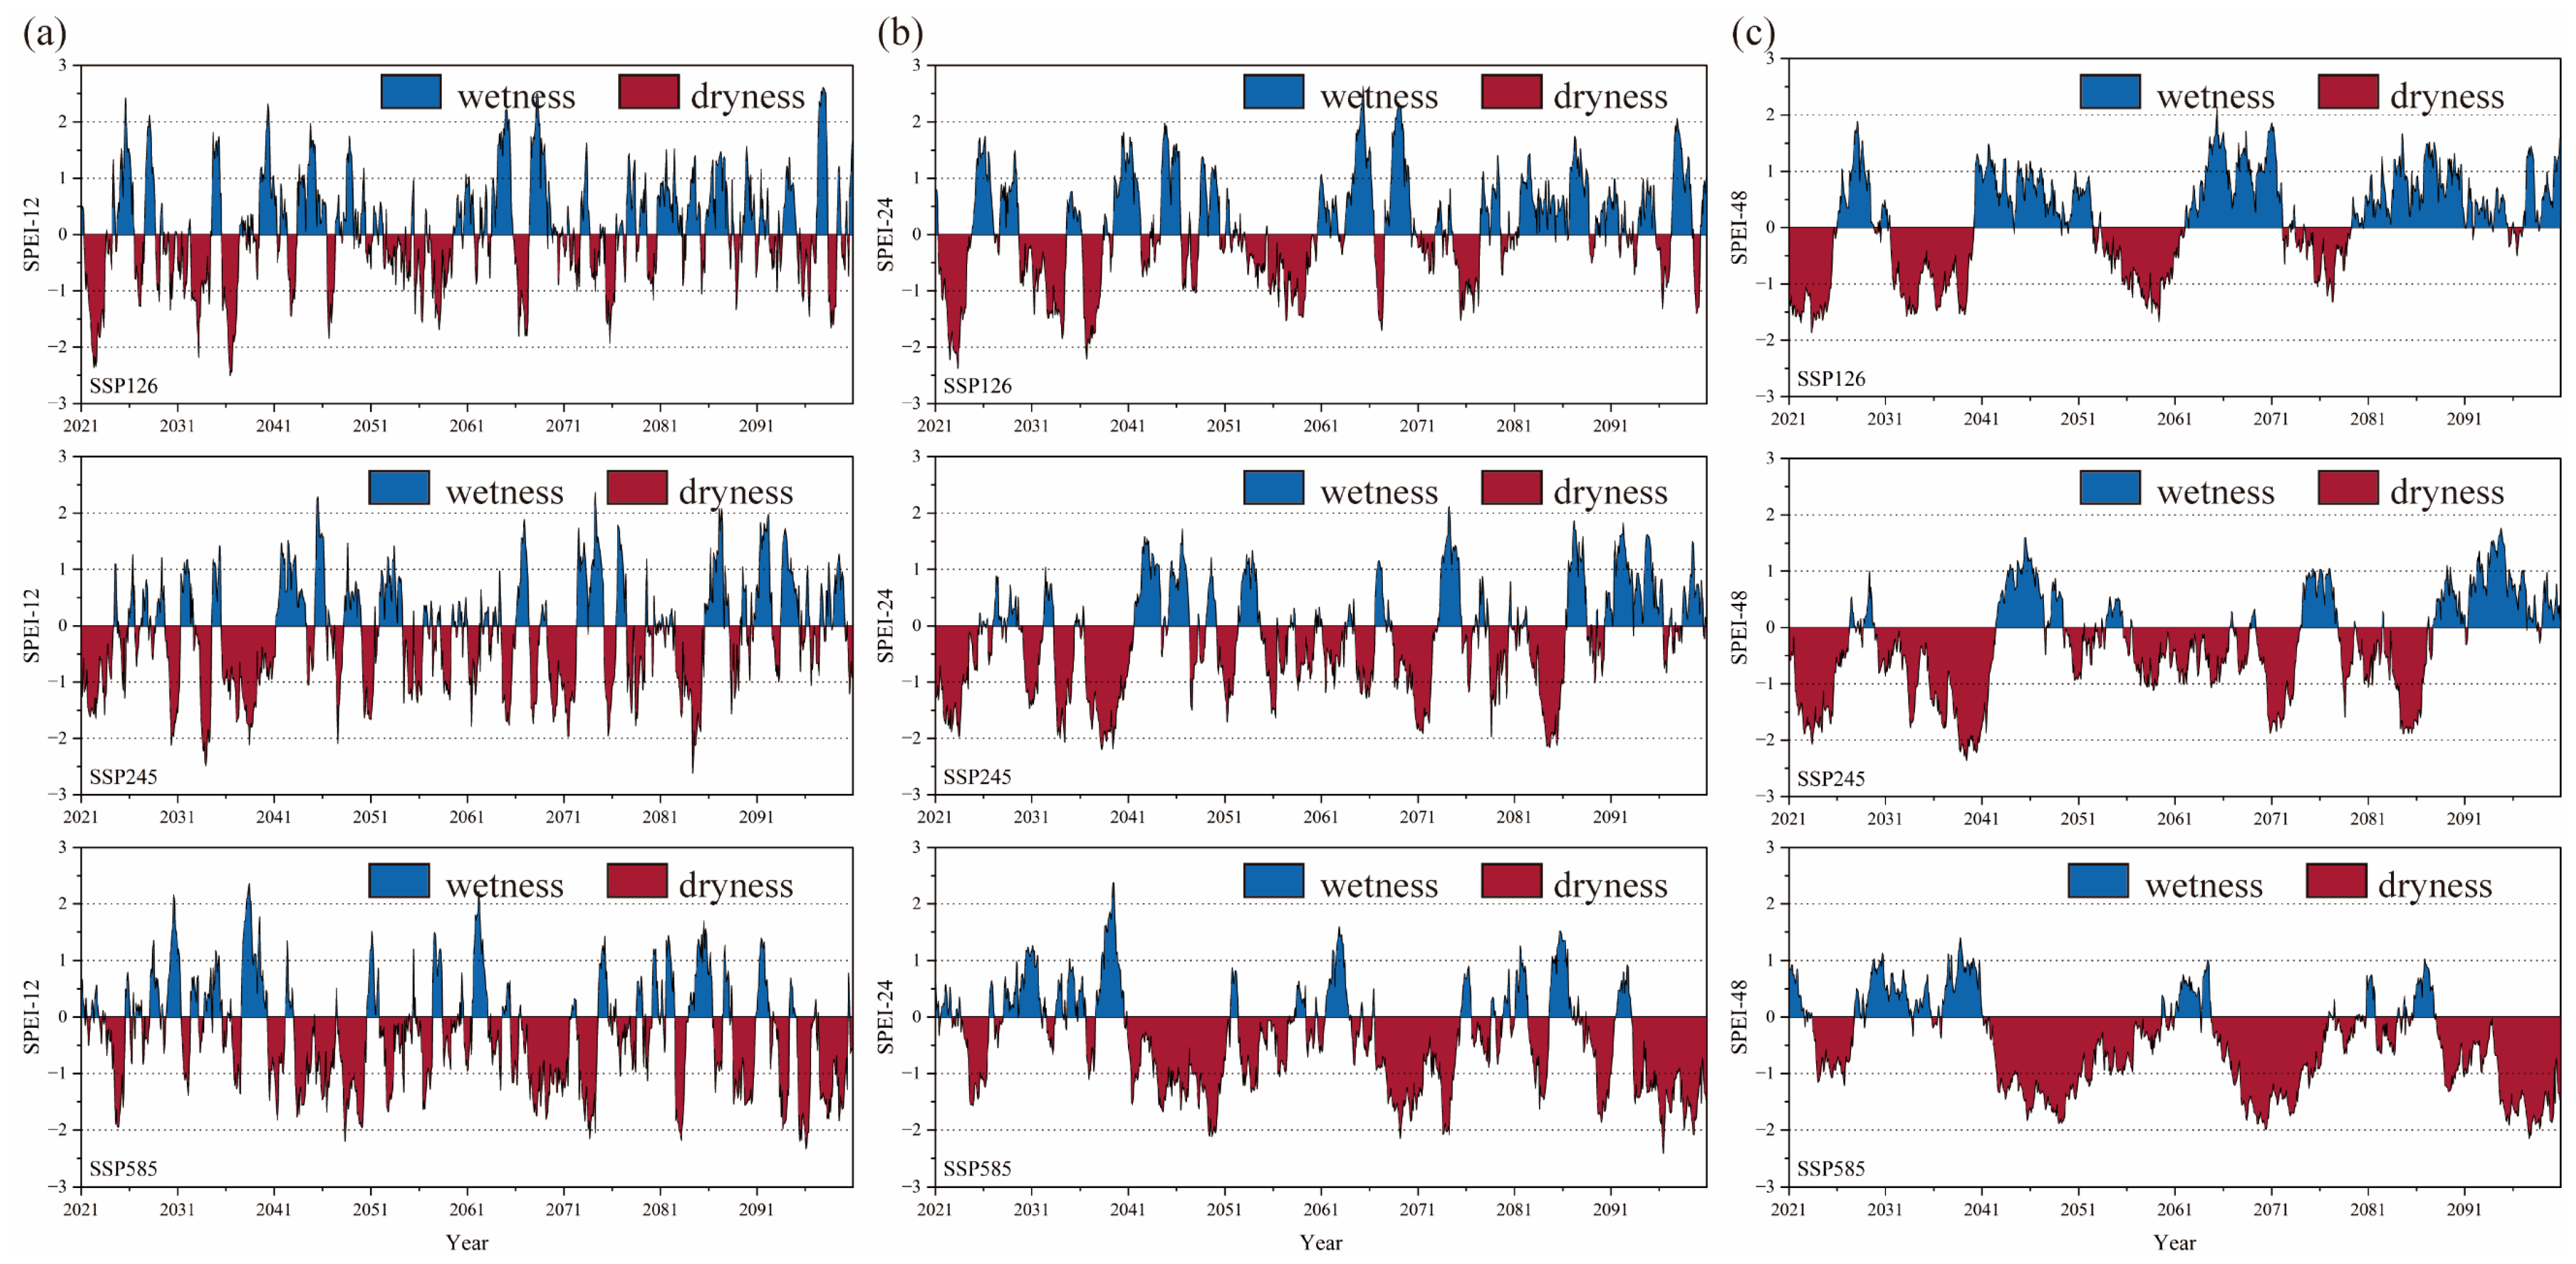
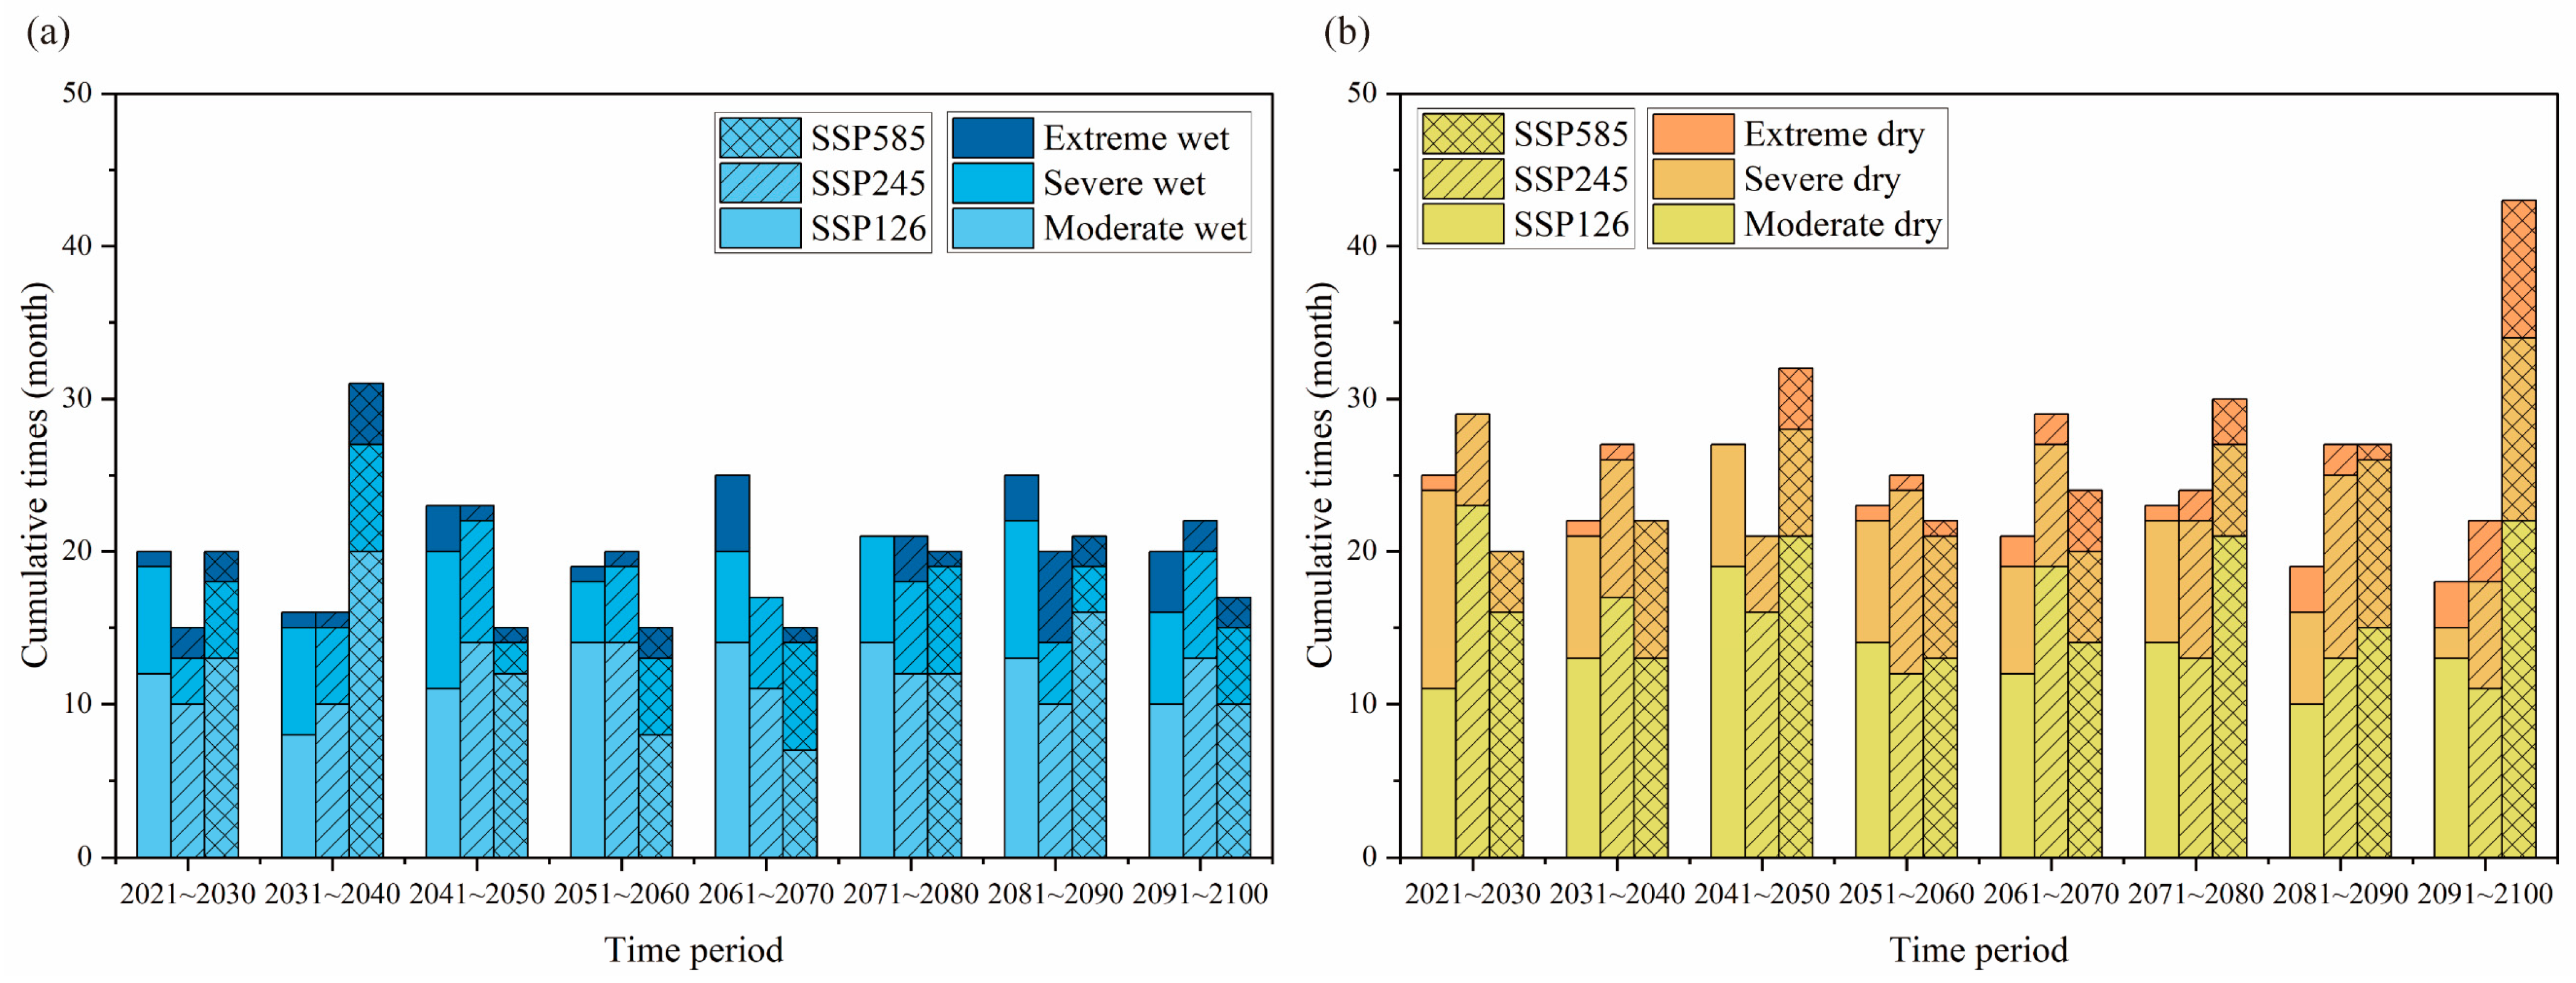
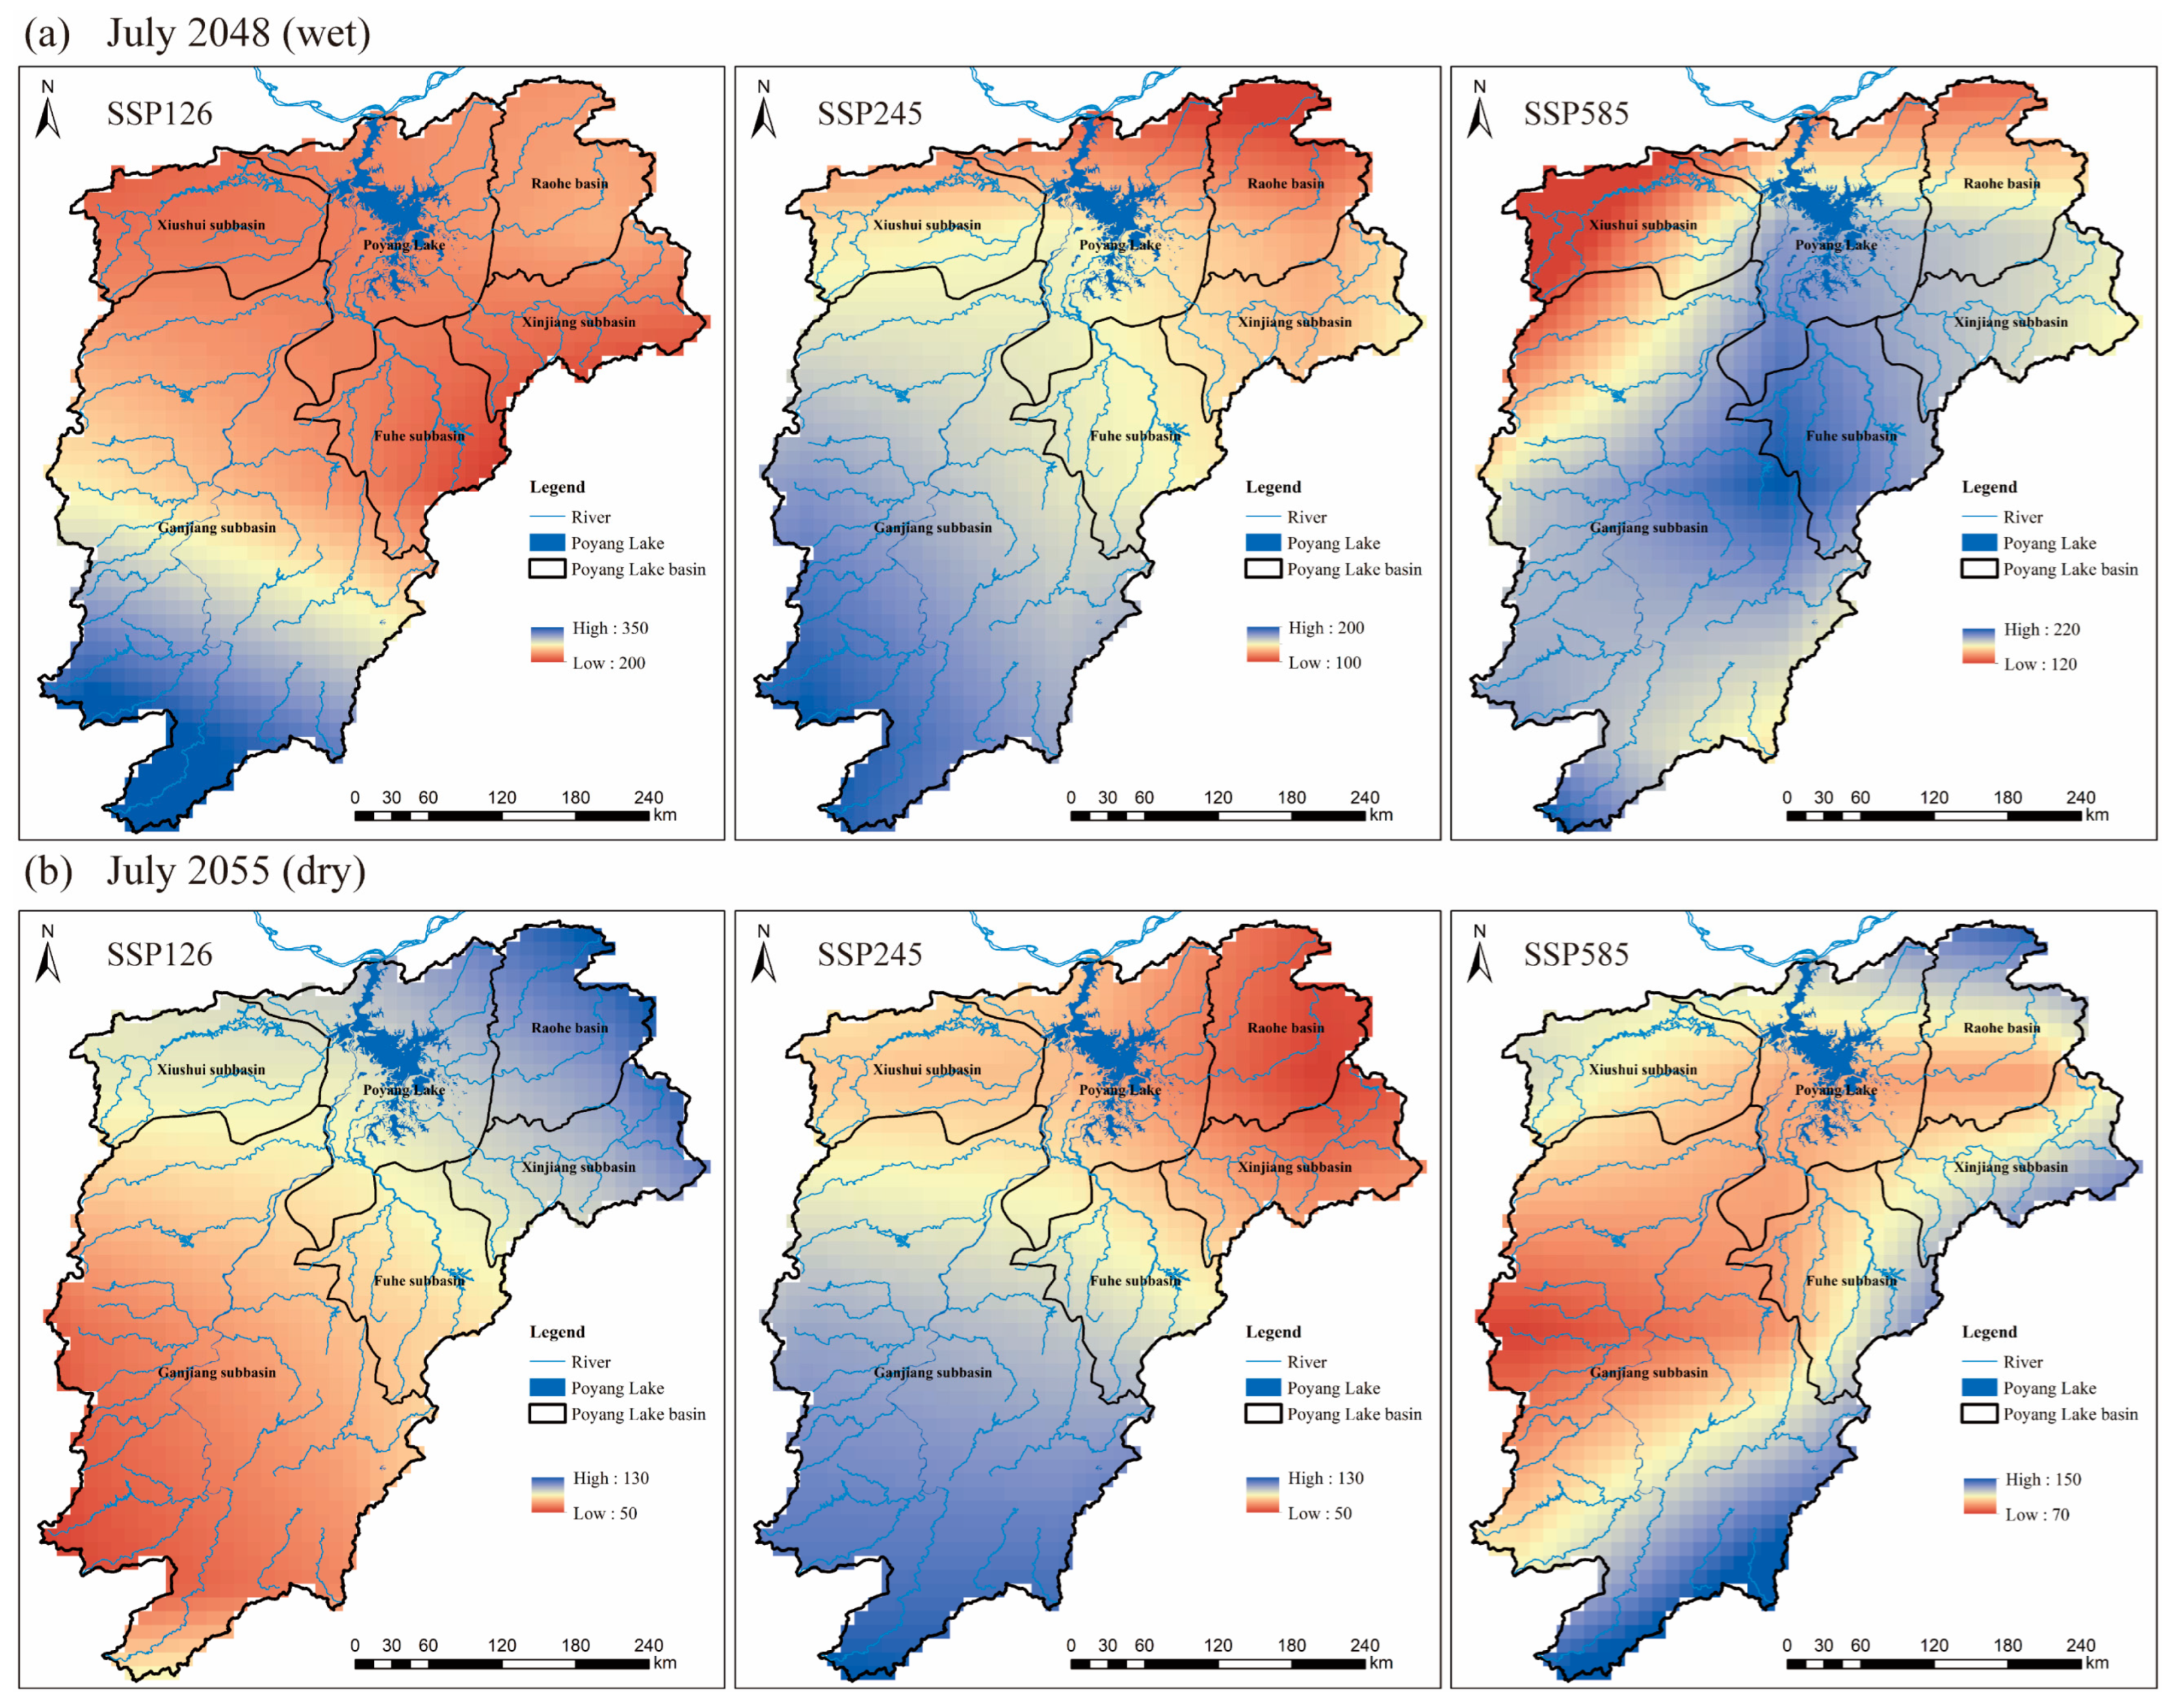
3.2. Historical and Future Dryness/Wetness Conditions

Figure 3 shows the multi-timescale evolution of SPEI values in PLB from 1961–2014. The 1-month SPEI (SPEI-1) and the 3-month SPEI (SPEI-3) have more pronounced seasonal fluctuations because the short time scale SPEI is more sensitive to precipitation and temperature. The results of the Mann–Kendall (M–K) trend test showed that the drought trend of SPEI-1 passed the 95% significance test and the drought trend of SPEI-3 passed the 99% significance test. According to the SPEI-1 result, in these past 54 years, there were 110 months of wetness in the PLB, including 59 months of moderate wetness, 41 months of severe wetness, and 10 months of extreme wetness. There were 113 months of drought, including 74 months of moderate drought, 31 months of severe drought, and 8 months of extreme drought. The frequency of occurrence of wet and dry events was similar, with an average of nine wetness and dryness events per month. The 6-month (SPEI-6), 12-month (SPEI-12), 24-month (SPEI-24), and 48-month (SPEI-48) values exhibit interannual oscillation characteristics. Moreover, as the time scale increases, it is clear that the frequency and duration of drought events both gradually increase in the PLB. SPEI-24 and SPEI-48 show that the SPEI value in the PLB gradually changes from positive to negative, indicating that the study area gradually becomes drier than before.
Figure 4 shows the time series of SPEI-12, SPEI-24, and SPEI-48 in the PLB under the SSP126, SSP245, and SSP585 scenarios, respectively. With the increase of GHG emissions, the drought trend in the PLB is becoming more and more obvious, and the duration of drought is significantly longer. The wetting trends of SPEI-12, SPEI-24, and SPEI-48 pass the 99% significance test under the SSP126 scenario. The calculation results show that the frequency of wet and drought events was similar from 2021 to 2080, and the PLB is mainly wet after 2081. In the SSP245 scenario, the wetting trends of SPEI-12, SPEI-24, and SPEI-48 all pass the 99% significance test, and the drought events are dominated from 2021 to 2090, and the wetting events are dominated from 2091 to 2100. In the SSP585 scenario, the drought trends of SPEI-12, SPEI-24, and SPEI-48 all passed the 99% significance test. Only 2031~2040 were dominated by wet events, and the rest of the periods were mainly dominated by droughts.
Figure 5 illustrates the frequency of different degrees of wetness and drought events in different periods under the three simulated scenarios. Under the SSP126 scenario, the proportion of future severe drought events significantly decreased (passing the 99% significance test) and the proportion of extreme drought events significantly increased (significance over 95%). The proportion of occurrence of wet events tends to increase, but does not pass the significance test. The frequencies of wetting and drought events in the historical and future period of the PLB are shown in Table 3. Compared with the historical period, the frequency of wetting events in the SSP126 scenario increased by 0.62% and the frequency of extreme wetting events increased by 0.34%; the frequency of drought events increased by 1.1% and the frequency of extreme drought increased by 0.02%. Figure 5 shows that under the SSP245 scenario, there is an increasing trend in the frequency of wet events (not passing the significance test) and a significant increase in the proportion of extreme droughts (significance over 99%). Compared to the historical period, the frequency of wet events decreased by 0.94% and the frequency of extreme wet events increased by 0.13% under the SSP245 scenario; the frequency of drought events increased by 3.81% and the frequency of extreme drought increased by 0.02% (Table 3). In the SSP585 scenario, the percentage of occurrence of both extreme wetness and extreme dryness showed an increasing trend (did not pass the significance test). Compared to the historical period, the frequency of wet events decreased by 0.94% and the frequency of extreme wet events occurred by 0.02% under the SSP585 scenario; the frequency of extreme drought events and severe drought events increased by 1.06% and 1.78% (Table 3).
The above results indicate that the frequency of drought events will increase and the frequency of wet events will decrease in the future period as the GHG emissions increase. Moreover, the frequency of drought events is consistently higher than that of wet events under either scenario. Although the wetting trend is significant in the PLB under the SSP126 and SSP245 scenarios, the proportion of extreme drought events increases. As shown in Figure 5, the frequency of drought and wetting events in each period is basically the same in the SSP126 scenario. Extreme wet events mainly occur in the 2060s and 2090s, and extreme droughts mainly occur in the 2080s. From 2021 to 2100, the occurrence of wet events has a significant volatility, while the occurrence of drought events shows a significant decreasing trend. For the SSP245 scenario, extreme wet events mainly occur in the 2080s, and extreme drought events mainly occur in the 2090s. For the SSP585 scenario, extreme wet events mainly occur in the 2030s, and extreme drought events mainly occur in the 2090s. In this scenario, the frequency of wet events peaks in the 2030s and then decreases sharply, after which the frequency of wet events remains roughly constant, while the frequency of drought events generally shows an increase.
A typical wet month (July 2048) and a dry month (July 2055) were selected for spatial analysis. Figure 6 shows the spatial distribution of the net precipitation (difference between precipitation and evaporation) under the three scenarios. In July 2048, the wetness of PLB under the SSP126 scenario far exceeds that of the SSP245 and SSP585 scenarios. In the SSP126 scenario, the net precipitation is higher in the PLB than the other two scenarios, and the upper sub-basin of the Ganjiang river is wetter than the others. In the SSP245 scenario, the wetness intensity of the PLB increases from northeast to southwest, with wetness events mainly occurring in the upper reaches of the Ganjiang sub-basin. In the SSP585 scenario, the wet intensity of the basin decreases from southeast to northwest, indicating a different spatial pattern from the SSP245 scenario. In July 2055, PLB had the highest drought intensity under the SSP126 scenario, and the drought level increased from northeast to southwest. The occurrence of drought was mainly concentrated in the Ganjiang sub-basin. For the SSP245 scenario, drought was mainly concentrated in the Xinjiang and Raohe sub-basins and the Poyang Lake region, and the drought level decreased from northeast to southwest. Under the SSP585 scenario, more than 70% of the area in the basin has a high degree of drought, and only some areas in the upstream are not prone to drought. In the future period, the occurrences of dry and wet events have no prominent spatial distribution characteristics, and extremely wet and extreme drought events may occur in the same month of different years.
In summary, the drought trend of the climate gradually increases with the increase in GHG emissions in different scenarios in the future period. Although the wet trend in the future PLB is significant in the SSP126 and SSP245 scenarios, the proportion of occurrences of extreme drought events increases significantly. For the SSP585 scenario, the drought trend in the basin is significantly enhanced, and the frequency of extreme events shows an increasing trend. Compared with the historical period, the frequency of drought events increases in the three scenarios, the frequency of wet events increases in the SSP126 scenario, and the frequency of wet events decreases in the SSP245 and SSP585 scenarios.

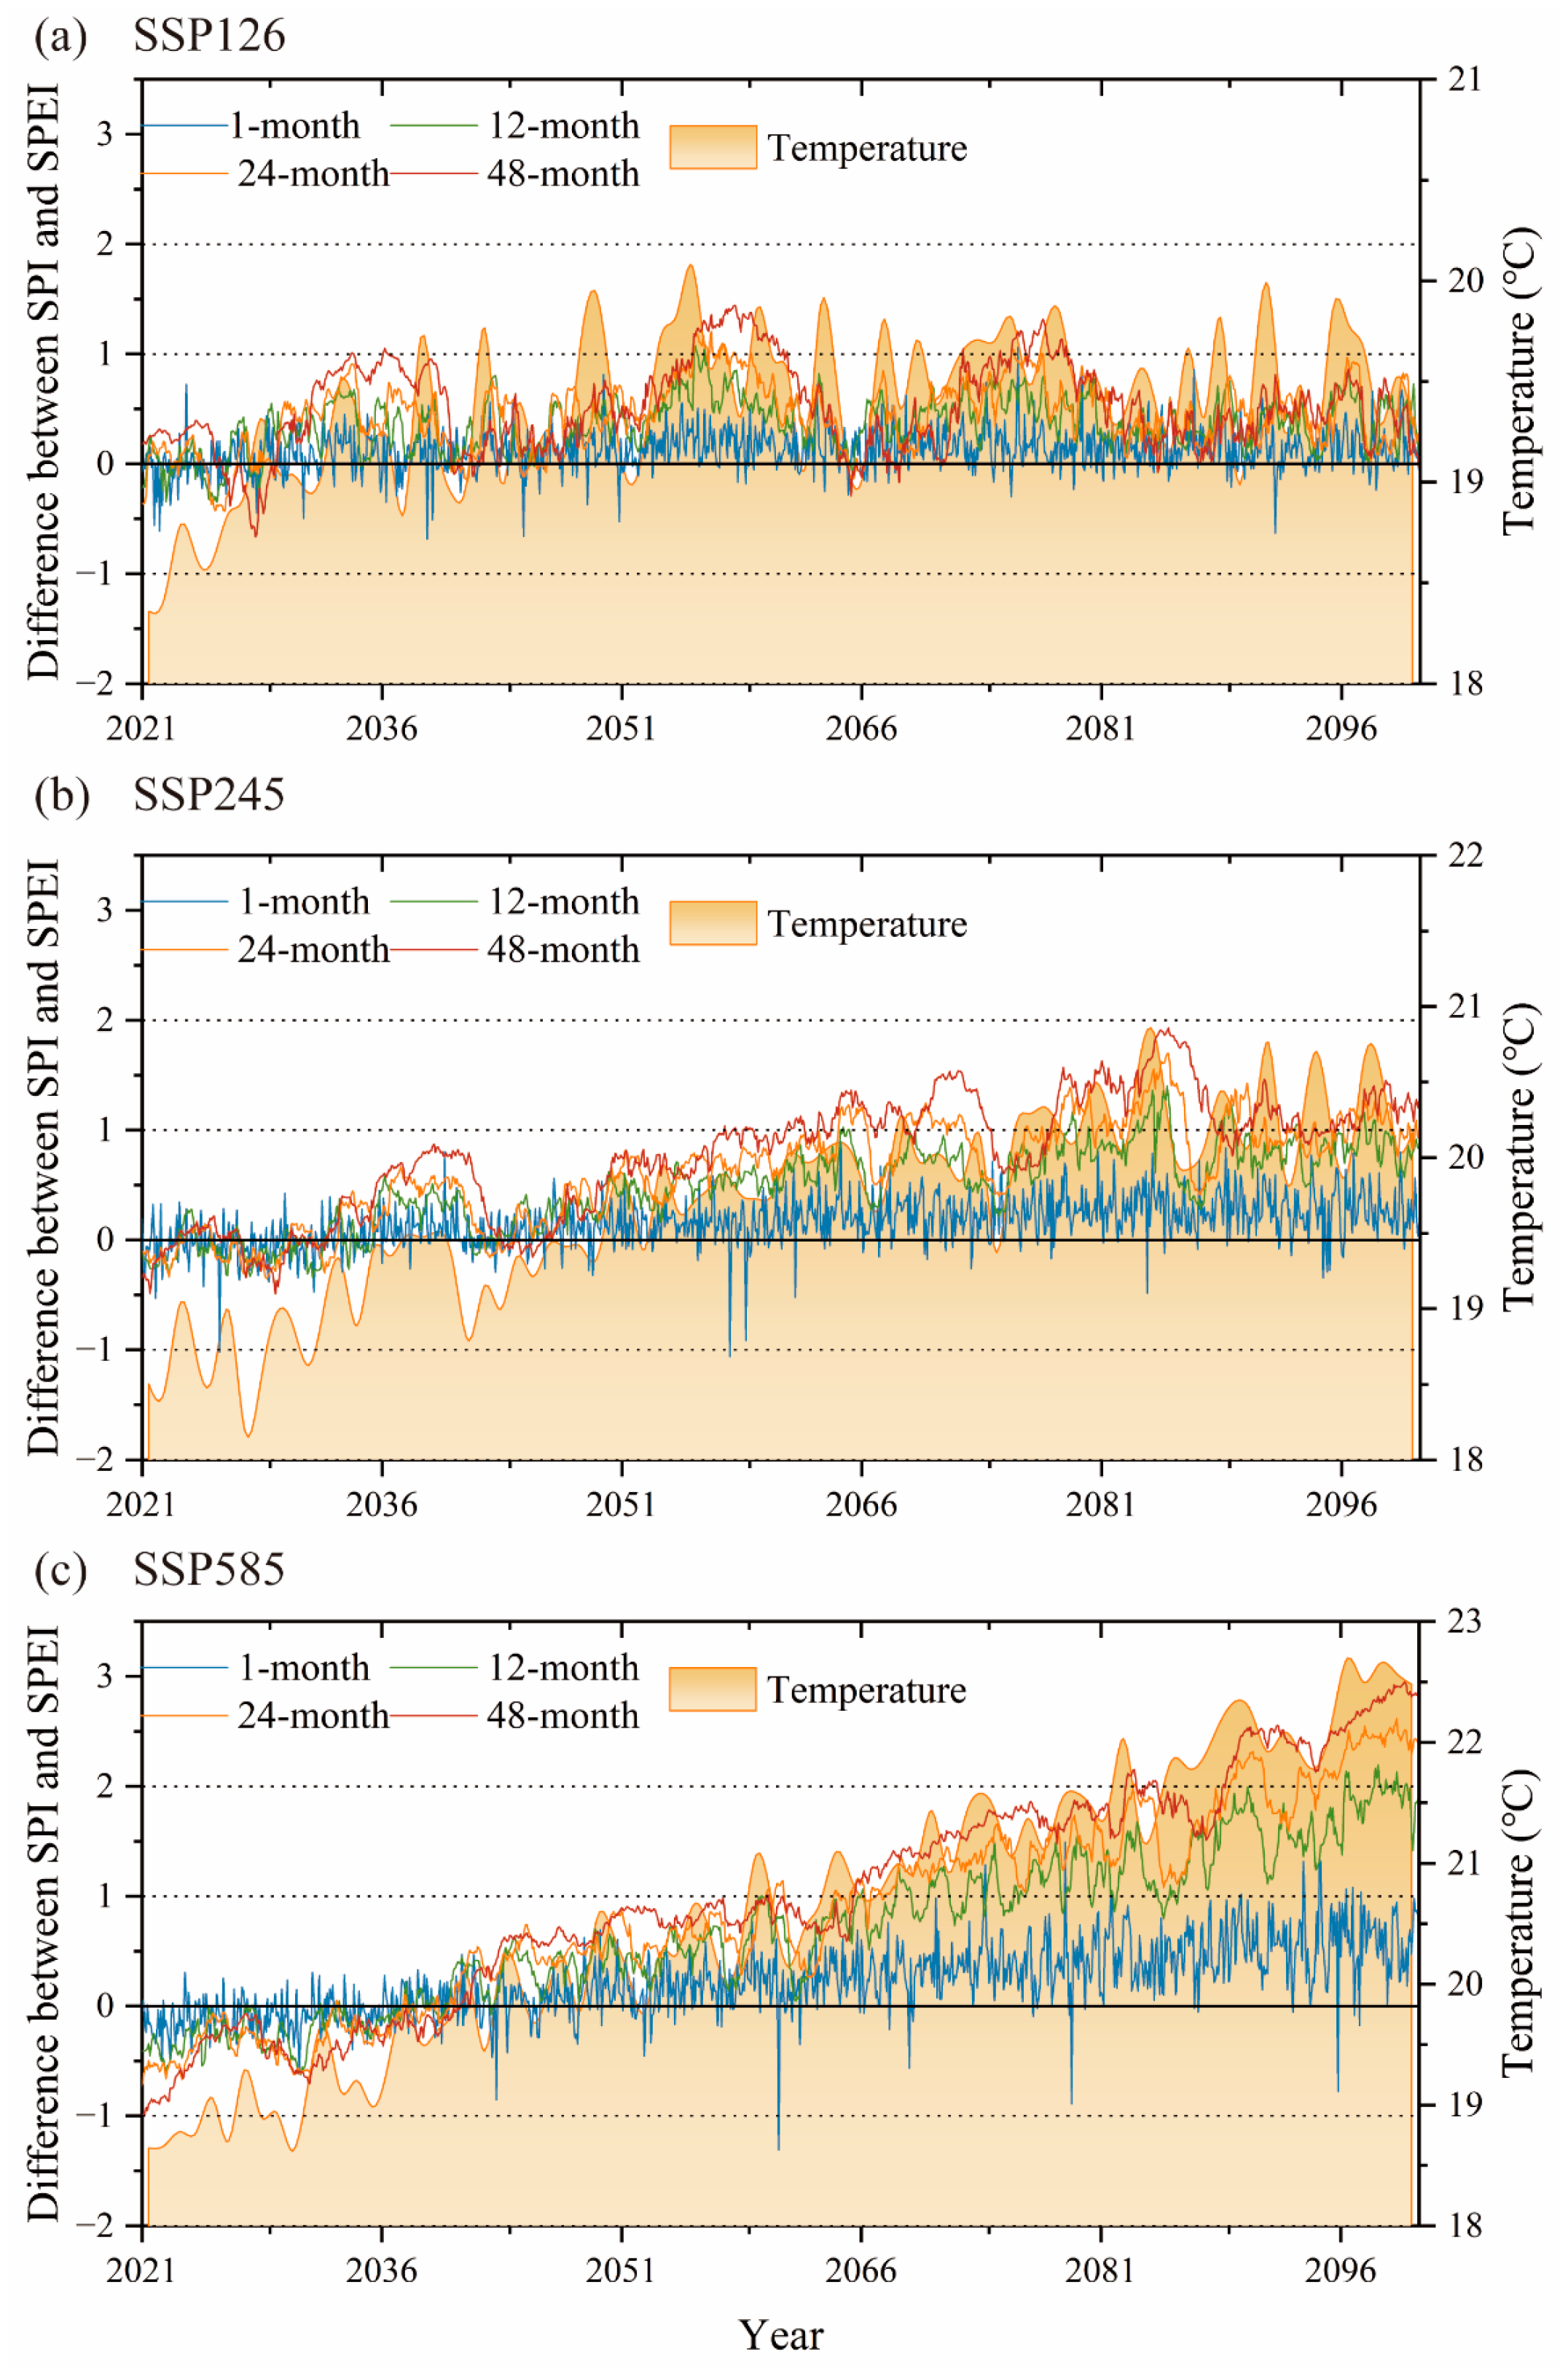
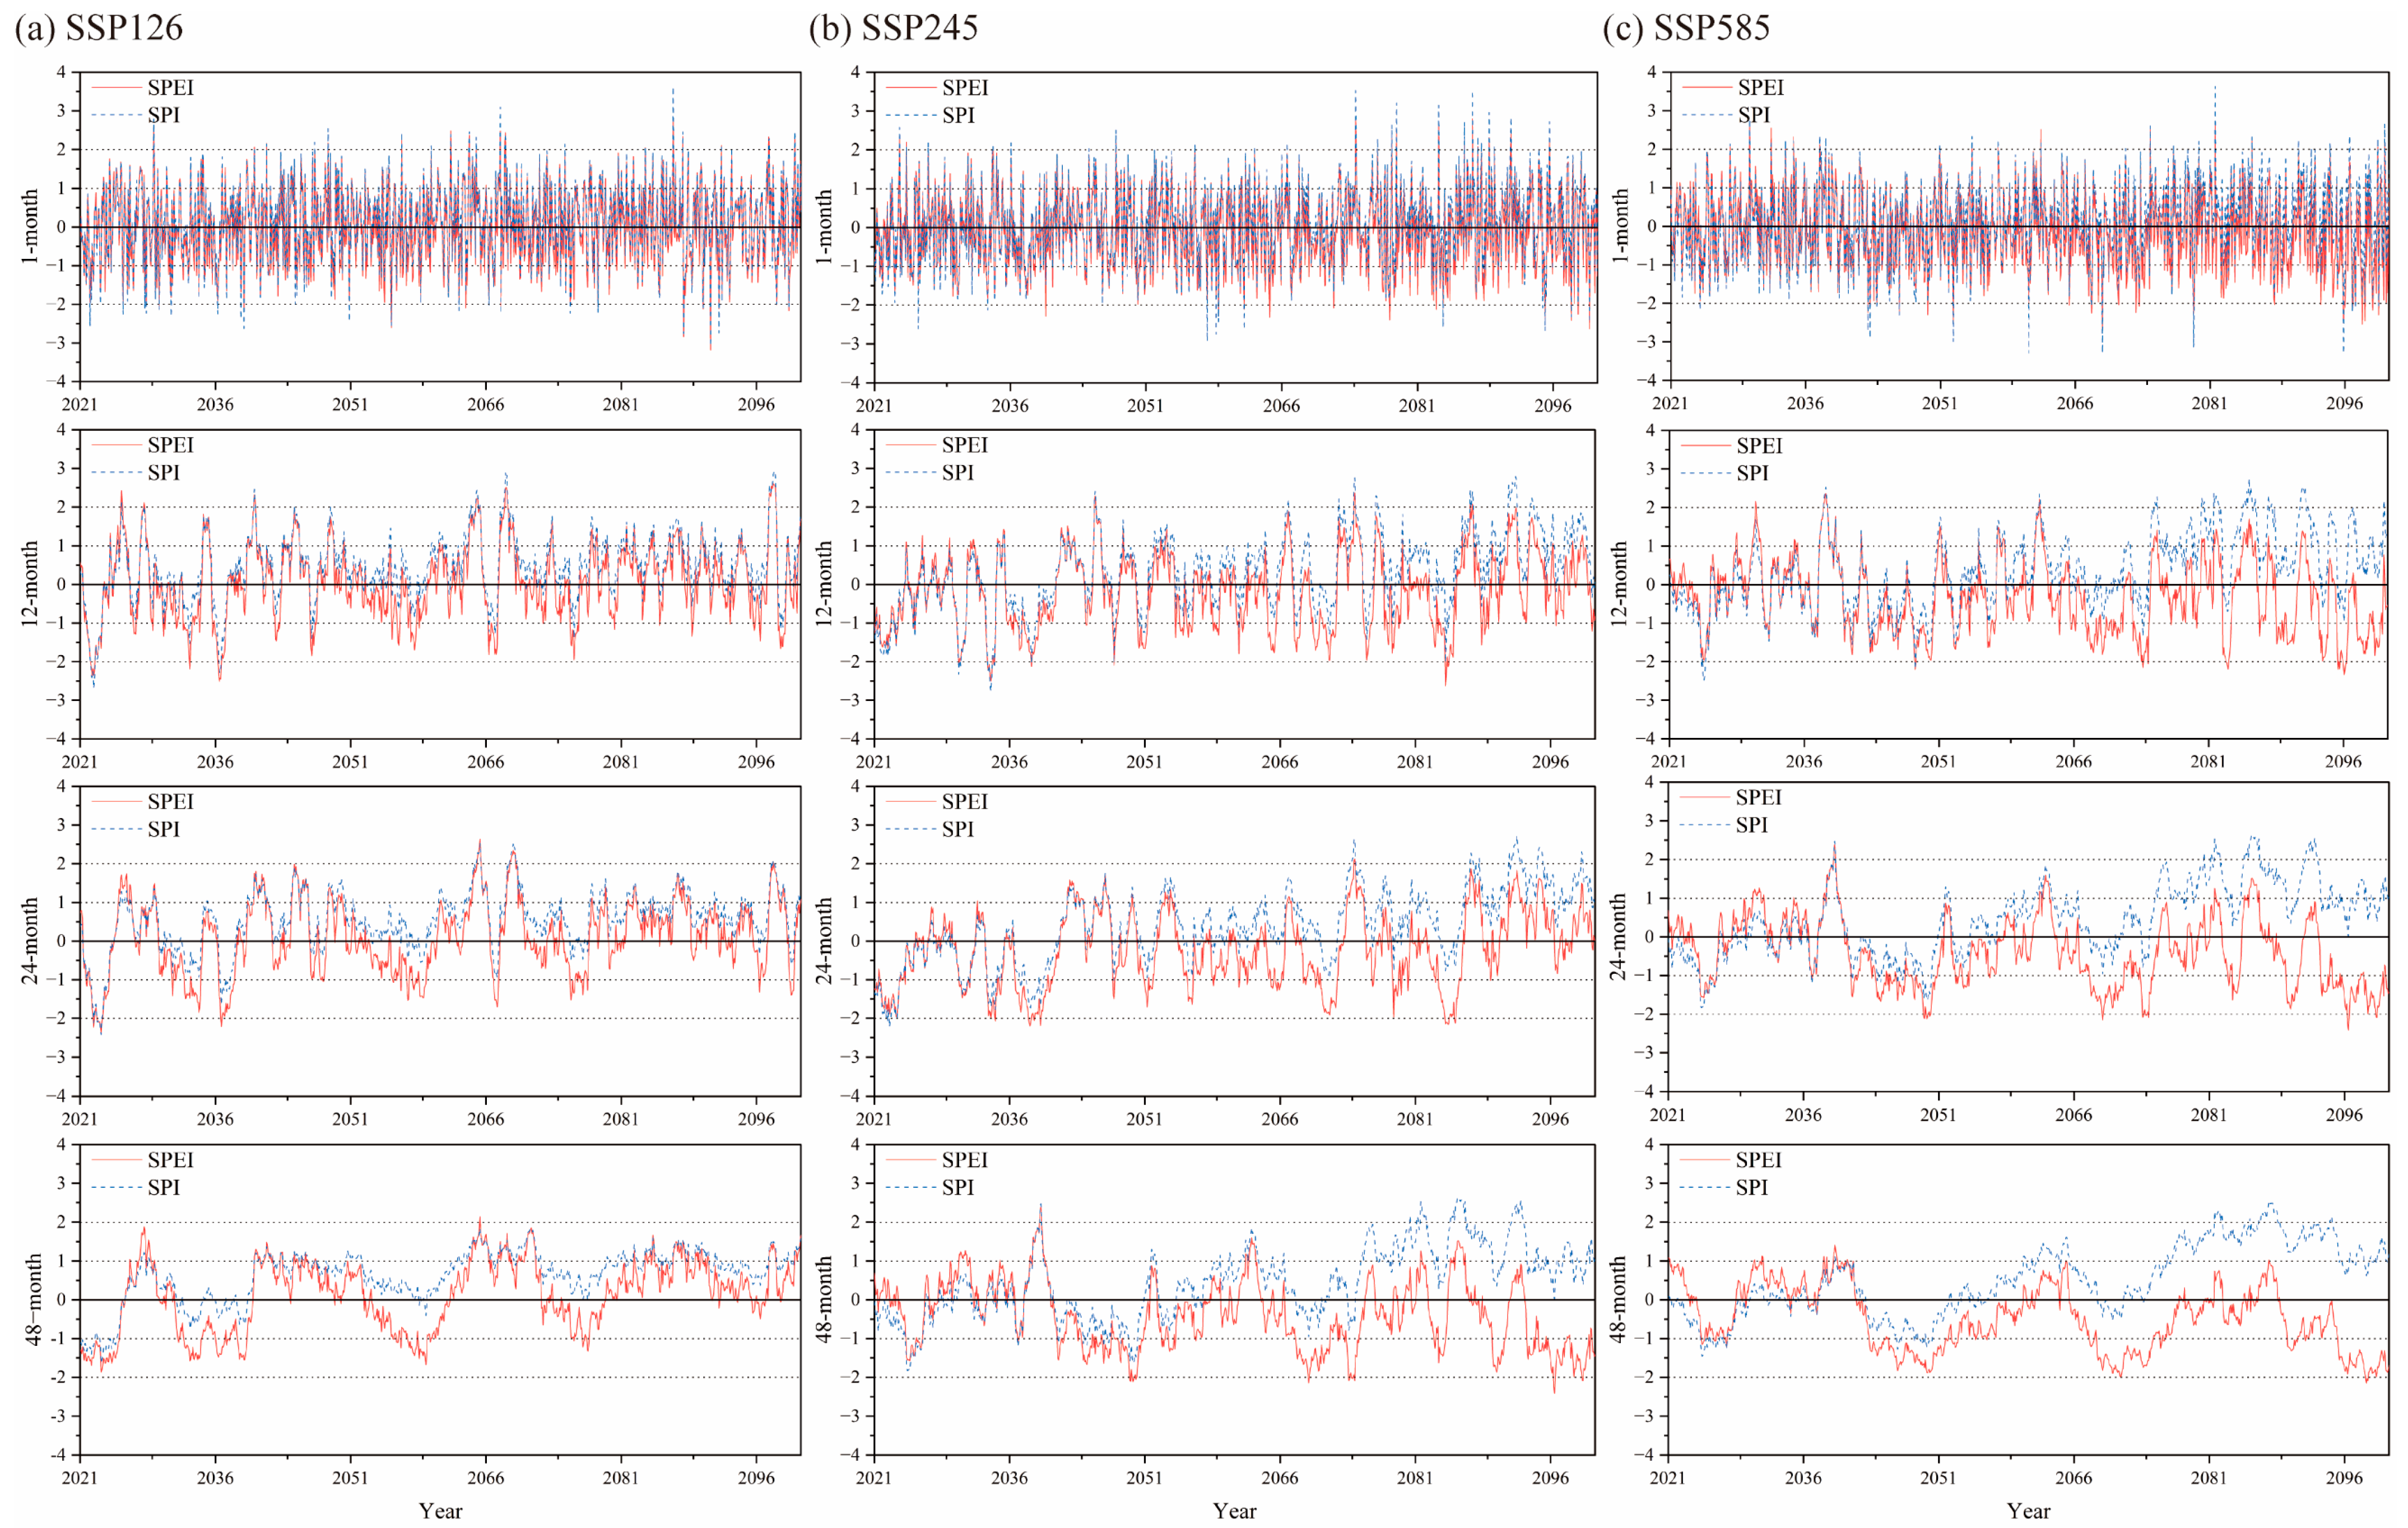
3.3. Impact of Temperature Changes on Dry/Wet Variability in the Future

To investigate the influence of future temperature changes on the trend of dry and wet changes in the PLB, the trends of SPI and SPEI were compared and analyzed at a 1-month scale, 12-month scale, 24-month scale, and 48-month scale under the SSP126, SSP245, and SSP585 scenarios. Since the SPEI estimation process is identical to SPI, but with the addition of the effect of potential evapotranspiration, the difference between SPEI and SPI reflects the contribution of temperature variation to the intensity of dry/wet conditions [49]. Figure 7 shows the relationship between the trend of the SPI and SPEI difference with the average temperature and the temperature anomaly at a 1-month scale, 12-month scale, 24-month scale, and 48-month scale. A difference greater than 0 indicates that the SPI value is greater than the SPEI value. As can be seen from Figure 8, the predicted results of future wet and dry trends vary for different scenarios and different scales. The fluctuations of SPI and SPEI at the 1-month scale show a good consistency, with Spearman correlation coefficients of 0.98704, 0.97817, and 0.95163 for the SSP126, SSP245, and SSP585 scenarios, respectively. As the time scale increases, the difference between SPI and SPEI becomes more and more obvious. Additionally, the difference between SPI and SPEI increases as the concentration of GHG emissions increases (Figure 8). For scenarios SSP126, SSP245, and SSP585, the difference between SPI-1 and SPEI-1 increases by 0.311, 0.352, and 0.423 for each Celsius degree increase in temperature relative to that of the historical period average, respectively. Especially for the SSP585 scenario, the SPI results at the 24-month and 48-month scales show a significant wet trend in the PLB, while the SPEI results show a drought trend. Figure 7 shows that positive temperature anomaly exacerbates the dryness of the SPEI assessment, while negative temperature anomaly may make the SPEI value larger than the SPI value. According to the results of the SPI calculation, the frequency and intensity of future wetting in the PLB under the SSP245 and SSP585 scenarios are greater than that of the SSP126 scenario, which is contrary to the conclusion reached above. It shows that temperature has an important effect on the intensity of dry/wet conditions, with higher temperatures increasing the rate of evaporation and thus the degree of drought. Under the SSP245 scenario, the SPI-48 and SPEI-48 results are largely consistent in 2021–2060; under the SSP585 scenario, the SPI-48 and SPEI-48 results are largely consistent in 2021–2040. This indicates that the effect of temperature is minimal under this period of this scenario.

4. Discussion

Based on the SPI and SPEI, this study predicts drought and flood events in the PLB under different emission scenarios. The results indicate that under the SSP126, SSP245, and SSP585 scenarios, the frequency of future drought events may increase by 1.1–3.8% compared to historical periods and be higher than future wet events in this century. There are few projections of future drought and flood events in the PLB, and most studies focus on the entire YRB. The middle and lower reaches of the Yangtze River will face severe drought risks in the future, especially from 2030 to 2040 [50]. As the time scale increases, the number of drought events in the YRB first increases and then decreases, increasing the average duration and intensity [51]. Generally, the number of monthly scale events is the lowest, the number of seasonal scale events is the highest, and the harm of annual scale events is the greatest. The lower reaches of the YRB will be strongly affected by sudden changes in drought and flood events in the future [52]. Due to climate change, there will always be differences between SPI and SPEI. Therefore, more and more studies are paying attention to the applicability of SPI and SPEI in drought detection [49,53]. The results show that the SPI of the PLB will increase and the SPEI will decrease in the future, which is supported by Deng [54]. Additionally, differences in climate conditions in various regions can also lead to differences in SPI and SPEI. Ye found that with the increase in time scale, the difference between SPEI and SPI in the PLB became more and more obvious [49], which is the same as this study. However, in the Inner Mongolia Autonomous Region, on a short time scale, the two indices fluctuate the most frequently and have the greatest differences between them; on a long-term scale, the fluctuations of SPI and SPEI tend to flatten out, and the difference between the two decreases [53]. Therefore, the selection of SPI and SPEI in drought identification is still worth exploring. In addition, the selection of GCMs can also impact the results. Li found that most models overestimate the precipitation (wet bias) in the YRB, and the model with the best simulation effect is BCC-CSM2-MR [38]. Some studies have shown that MRI-ESM2-0 has a good simulation effect on average temperature and precipitation in the YRB [40]. The Random Forest method is used to evaluate the simulation performance of GCMs and results show that NESM3 has good simulation performance for precipitation and temperature in the YRB [39]. Some studies have also shown that GCMs have significant differences in their simulation performance of precipitation, while their simulation differences in temperature are relatively small [55].

5. Conclusions

In this study, we analyzed the trend of meteorological dry and wet variability in the PLB during the future period based on SPEI and SPI indicators using meteorological data from three models of the CMIP6 program under three combined SSPs (SSP126, SSP245, and SSP585), and analyzed and compared the similarities and differences between the two indicators for predicting dry and wet changes in the PLB. The main conclusions are as follows:
(1) Combining the data of the three models, the precipitation in the PLB shows a slight fluctuating increasing trend and the temperature shows a significant increasing trend from 2021 to 2100. Among them, the temperature increases and then levels off in the SSP126 and SSP245 scenarios, and continues to increase in the SSP585 scenario. The temperature increase extends with the increase of GHG emission concentration. Under the SSP126, SSP245, and SSP585 scenarios, annual precipitation is expected to increase at rates of 66.43 mm, 34.92 mm, and 40.11 mm per decade, respectively; and average annual temperature is expected to increase at rates of 0.12 °C, 0.21 °C, and 0.48 °C/10a, respectively;
(2) Based on the analysis of multi-timescale SPEI series, the frequency of drought events is likely to increase by 1.1 to 3.8% over the historical period under the three scenarios compared to the historical period and to be higher than wet events in the future of this century. As the concentration of GHG emissions increases, the magnitude and duration of future drought events gradually increase. Although the wet trend in the PLB is significant in the SSP126 and SSP245 scenarios, the proportion of extreme drought events increases significantly. For the SSP585 scenario, the future drought trend in the basin is significantly increased, and the frequency of extreme events shows an increasing trend;
(3) The influence of temperature on the future dry and wet changes in the PLB is analyzed based on the differences between SPEI and SPI indicators. The results show that the difference between SPEI and SPI becomes more obvious as the time scale increases. Additionally, the difference between SPEI and SPI results increases with the increase in GHG emission concentration. The results showed that the difference between SPI and SPEI increased by 0.311, 0.352, and 0.423 for each degree Celsius increase in temperature relative to the historical period for the SSP126, SSP245, and SSP585 scenarios, respectively. There is an overall increasing trend of SPI and an overall decreasing trend of SPI for different scenarios in the PLB in the future period. Among them, the increasing trend of SPI and the decreasing trend of SPEI are most obvious under the SSP245 and SSP585 scenarios.
In general, precipitation and temperature in the PLB show an increasing trend in the future. No matter low or high-emission scenarios, the proportion of extreme events occurring shows a significant increasing trend. Relevant departments should pay close attention to the occurrence trend of extreme drought and flood events in the basin in the future, and make early preparation for flood and drought prevention. In addition, the increase in temperature leads to an increase in evapotranspiration, especially for the high-emission scenario, and the influence of temperature cannot be ignored in the assessment of drought and flood events.

Author Contributions

Y.D.: conceptualization, funding, validation. W.J.: methodology, writing—original draft. T.Z.: data analysis and supervision. J.C. and Z.W.: data analysis and validation. Y.L. and X.T.: investigation. B.L.: conceptualization, methodology, writing—review and editing. All authors have read and agreed to the published version of the manuscript.

Funding

This work was jointly supported by the Water Conservancy Science and Technology Project of Jiangxi Province (202223YBKT31 & 202324YBKT13) and the Fundamental Research Funds for the Central Universities (B220201028).

Institutional Review Board Statement

Not applicable.

Informed Consent Statement

Not applicable.

Data Availability Statement

Not applicable.

Conflicts of Interest

The authors declare no conflict of interest.

References

  1. IPCC. Climate Change 2022: The Physical Science Basis; Cambridge University Press: Cambridge, UK, 2022. [Google Scholar]
  2. Elahi, E.; Khalid, Z.; Tauni, M.Z.; Zhang, H.; Lirong, X. Extreme Weather Events Risk to Crop-Production and the Adaptation of Innovative Management Strategies to Mitigate the Risk: A Retrospective Survey of Rural Punjab, Pakistan. Technovation 2022, 117, 102255. [Google Scholar] [CrossRef]
  3. Abbas, A.; Bhatti, A.S.; Ullah, S.; Ullah, W.; Waseem, M.; Zhao, C.; Dou, X.; Ali, G. Projection of Precipitation Extremes over South Asia from CMIP6 GCMs. J. Arid. Land 2023, 15, 274–296. [Google Scholar] [CrossRef]
  4. Abbas, A.; Waseem, M.; Ullah, W.; Zhao, C.; Zhu, J. Spatiotemporal Analysis of Meteorological and Hydrological Droughts and Their Propagations. Water 2021, 13, 2237. [Google Scholar] [CrossRef]
  5. Shi, W.; Huang, S.; Liu, D.; Huang, Q.; Han, Z.; Leng, G.; Wang, H.; Liang, H.; Li, P.; Wei, X. Drought-Flood Abrupt Alternation Dynamics and Their Potential Driving Forces in a Changing Environment. J. Hydrol. 2021, 597, 126179. [Google Scholar] [CrossRef]
  6. Sun, Y.; Zhang, X.; Ding, Y.; Chen, D.; Qin, D.; Zhai, P. Understanding human influence on climate change in China. Natl. Sci. Rev. 2022, 9, 128–143. [Google Scholar] [CrossRef] [PubMed]
  7. Li, W.; Zuo, J.; Song, Y.; Liu, J.; Li, Y.; Shen, Y.; Li, J. Changes in Spatio-Temporal Distribution of Drought/Flood Disaster in Southern China Under Global Climate Warming. Meteorol. Mon. 2015, 41, 261–271. [Google Scholar]
  8. Huang, R.; Du, Z. Evolution Characteristics and Trend of Droughts and Floods in China Under the Background of Global Warming. Chin. J. Nat. 2010, 32, 187–195+184. [Google Scholar] [CrossRef]
  9. Zhang, Q.; Xu, C.-Y.; Zhang, Z.; Chen, Y.D.; Liu, C.; Lin, H. Spatial and Temporal Variability of Precipitation Maxima during 1960–2005 in the Yangtze River Basin and Possible Association with Large-Scale Circulation. J. Hydrol. 2008, 353, 215–227. [Google Scholar] [CrossRef]
  10. Guo, H.; Hu, Q.; Jiang, T. Annual and Seasonal Streamflow Responses to Climate and Land-Cover Changes in the Poyang Lake Basin, China. J. Hydrol. 2008, 355, 106–122. [Google Scholar] [CrossRef]
  11. Wang, R.; Chen, J.; Chen, X.; Wang, Y. Variability of Precipitation Extremes and Dryness/Wetness over the Southeast Coastal Region of China, 1960–2014. Int. J. Climatol. 2017, 37, 4656–4669. [Google Scholar] [CrossRef]
  12. Chou, C.; Chiang, J.C.H.; Lan, C.-W.; Chung, C.-H.; Liao, Y.-C.; Lee, C.-J. Increase in the Range between Wet and Dry Season Precipitation. Nat. Geosci. 2013, 6, 263–267. [Google Scholar] [CrossRef]
  13. Ma, T.; Liang, Y.; Sunde, M.G.; Lau, M.K.; Liu, B.; Wu, M.M.; He, H.S. Assessing the Effects of Climate Variable and Timescale Selection on Uncertainties in Dryness/Wetness Trends in Conterminous China. Int J Clim. 2021, 41, 3058–3070. [Google Scholar] [CrossRef]
  14. Vicente-Serrano, S.M.; Begueria, S.; Lopez-Moreno, J.I. A Multiscalar Drought Index Sensitive to Global Warming: The Standardized Precipitation Evapotranspiration Index. J. Clim. 2010, 23, 1696–1718. [Google Scholar] [CrossRef]
  15. Zhang, L.; Yin, J.; Jiang, Y.; Wang, H. Relationship between the Hydrological Conditions and the Distribution of Vegetation Communities within the Poyang Lake National Nature Reserve, China. Ecol. Inform. 2012, 11, 65–75. [Google Scholar] [CrossRef]
  16. Zhang, D.; Chen, P.; Zhang, Q.; Li, X. Copula-Based Probability of Concurrent Hydrological Drought in the Poyang Lake-Catchment-River System (China) from 1960 to 2013. J. Hydrol. 2017, 553, 773–784. [Google Scholar] [CrossRef]
  17. Li, X.; Zhang, Q.; Xu, C.-Y.; Ye, X. The Changing Patterns of Floods in Poyang Lake, China: Characteristics and Explanations. Nat. Hazards 2015, 76, 651–666. [Google Scholar] [CrossRef]
  18. Li, X.; Hu, Q.; Wang, R.; Zhang, D.; Zhang, Q. Influences of the Timing of Extreme Precipitation on Floods in Poyang Lake, China. Hydrol. Res. 2021, 52, 26–42. [Google Scholar] [CrossRef]
  19. Guo, H.; Zhang, Q.; Wang, Y. Annual Variations in Climatic and Hydrological Processes and Related Flood and Drought Occurrences in the Poyang Lake Basin. Acta Geogr. Sin. 2012, 67, 699–709. [Google Scholar]
  20. Zhang, Z.; Chen, X.; Xu, C.-Y.; Hong, Y.; Hardy, J.; Sun, Z. Examining the Influence of River-Lake Interaction on the Drought and Water Resources in the Poyang Lake Basin. J. Hydrol. 2015, 522, 510–521. [Google Scholar] [CrossRef]
  21. Wang, R.; Peng, W.; Liu, X.; Wu, W.; Chen, X.; Zhang, S. Responses of Water Level in China’s Largest Freshwater Lake to the Meteorological Drought Index (SPEI) in the Past Five Decades. Water 2018, 10, 137. [Google Scholar] [CrossRef]
  22. Liu, W.; Zhu, S.; Huang, Y.; Wan, Y.; Wu, B.; Liu, L. Spatiotemporal Variations of Drought and Their Teleconnections with Large-Scale Climate Indices over the Poyang Lake Basin, China. Sustainability 2020, 12, 3526. [Google Scholar] [CrossRef]
  23. Li, X.; Zhang, Q.; Zhang, D.; Ye, X. Investigation of the Drought-Flood Abrupt Alternation of Streamflow in Poyang Lake Catchment during the Last 50 Years. Hydrol. Res. 2017, 48, 1402–1417. [Google Scholar] [CrossRef]
  24. Kanai, Y.; Ueta, M.; Germogenov, N.; Nagendran, M.; Mita, N.; Higuchi, H. Migration Routes and Important Resting Areas of Siberian Cranes (Grus Leucogeranus) between Northeastern Siberia and China as Revealed by Satellite Tracking. Biol. Conserv. 2002, 106, 339–346. [Google Scholar] [CrossRef]
  25. Wang, Y.; Jia, Y.; Guan, L.; Lu, C.; Lei, G.; Wen, L.; Liu, G. Optimising Hydrological Conditions to Sustain Wintering Waterbird Populations in Poyang Lake National Natural Reserve: Implications for Dam Operations. Freshw. Biol. 2013, 58, 2366–2379. [Google Scholar] [CrossRef]
  26. Li, Y.; Zhang, Q.; Yao, J.; Werner, A.D.; Li, X. Hydrodynamic and Hydrological Modeling of the Poyang Lake Catchment System in China. J. Hydrol. Eng. 2014, 19, 607–616. [Google Scholar] [CrossRef]
  27. Chen, X.; Bao, S.; Li, H.; Cai, X.; Guo, P.; Wu, Z.; Fu, W.; Zhao, H. LUCC Impact on Sediment Loads in Subtropical Rainy Areas. Photogramm. Eng. Remote Sens. 2007, 73, 319–327. [Google Scholar] [CrossRef]
  28. Song, Z.; Lu, C.; Zhang, Y.; Chen, J.; Liu, W.; Liu, B.; Shu, L. Spatiotemporal Distribution and Statistical Analysis of Abnormal Groundwater Level Rising in Poyang Lake Basin. Water 2022, 14, 1906. [Google Scholar] [CrossRef]
  29. Huang, A.; Liu, X.; Peng, W.; Dong, F.; Ma, B.; Li, J.; Wang, W. Spatiotemporal Characteristics, Influencing Factors and Evolution Laws of Water Exchange Capacity of Poyang Lake. J. Hydrol. 2022, 609, 127717. [Google Scholar] [CrossRef]
  30. Li, Y.L.; Tao, H.; Yao, J.; Zhang, Q. Application of a Distributed Catchment Model to Investigate Hydrological Impacts of Climate Change within Poyang Lake Catchment (China). Hydrol. Res. 2016, 47, 120–135. [Google Scholar] [CrossRef]
  31. Wang, Z.; Yang, Y.; Chen, G.; Wu, J.; Wu, J. Variation of Lake-River-Aquifer Interactions Induced by Human Activity and Climatic Condition in Poyang Lake Basin, China. J. Hydrol. 2021, 595, 126058. [Google Scholar] [CrossRef]
  32. Liu, J.; Zhang, Q.; Xu, C.; Zhang, Z. Characteristics of Runoff Variation of Poyang Lake Watershed in the Past 50 Years. Trop. Geogr. 2009, 29, 213–218, 224. [Google Scholar] [CrossRef]
  33. Yao, J.; Zhang, Q.; Li, Y.; Li, M. Hydrological Evidence and Causes of Seasonal Low Water Levels in a Large River-Lake System: Poyang Lake, China. Hydrol. Res. 2016, 47, 24–39. [Google Scholar] [CrossRef]
  34. Feng, L.; Hu, C.; Chen, X.; Cai, X.; Tian, L.; Gan, W. Assessment of Inundation Changes of Poyang Lake Using MODIS Observations between 2000 and 2010. Remote Sens. Environ. 2012, 121, 80–92. [Google Scholar] [CrossRef]
  35. Zhou, T.; Zou, L.; Chen, X. Commentary on the Coupled Model Intercomparison Project Phase 6 (CMIP6). Clim. Chang. Res. 2019, 15, 445–456. [Google Scholar]
  36. O’Neill, B.C.; Tebaldi, C.; van Vuuren, D.P.; Eyring, V.; Friedlingstein, P.; Hurtt, G.; Knutti, R.; Kriegler, E.; Lamarque, J.-F.; Lowe, J.; et al. The Scenario Model Intercomparison Project (ScenarioMIP) for CMIP6. Geosci. Model Dev. 2016, 9, 3461–3482. [Google Scholar] [CrossRef]
  37. Zhu, H.; Jiang, Z.; Li, J.; Li, W.; Sun, C.; Li, L. Does CMIP6 Inspire More Confidence in Simulating Climate Extremes over China? Adv. Atmos. Sci. 2020, 37, 1119–1132. [Google Scholar] [CrossRef]
  38. Li, Y.; Yan, D.; Peng, H.; Xiao, S. Evaluation of Precipitation in CMIP6 over the Yangtze River Basin. Atmos. Res. 2021, 253, 105406. [Google Scholar] [CrossRef]
  39. Lei, Y.; Gu, L. Selection of ensembles for the simulation results of GCMs for the Yangtze River basin based on spatial metrics. Eng. J. Wuhan Univ. 2020, 1–14. [Google Scholar]
  40. He, X.; Miu, Z.; Tian, J.; Yang, L.; Zhang, Z.; Zhu, B. Temperature, precipitation and runoff prediction in the Yangtze River Basin based on CMIP 6 multi-model. J. Nanjing For. Univ. Nat. Sci. Ed. 2021, 1–10. [Google Scholar]
  41. O’Neill, B.C.; Kriegler, E.; Ebi, K.L.; Kemp-Benedict, E.; Riahi, K.; Rothman, D.S.; van Ruijven, B.J.; van Vuuren, D.P.; Birkmann, J.; Kok, K.; et al. The Roads Ahead: Narratives for Shared Socioeconomic Pathways Describing World Futures in the 21st Century. Glob. Environ. Chang. 2017, 42, 169–180. [Google Scholar] [CrossRef]
  42. Yuan, F.; Tung, Y.-K.; Ren, L. Projection of Future Streamflow Changes of the Pearl River Basin in China Using Two Delta-Change Methods. Hydrol. Res. 2016, 47, 217–238. [Google Scholar] [CrossRef]
  43. Begueria, S.; Vicente-Serrano, S.M.; Reig, F.; Latorre, B. Standardized Precipitation Evapotranspiration Index (SPEI) Revisited: Parameter Fitting, Evapotranspiration Models, Tools, Datasets and Drought Monitoring. Int. J. Climatol. 2014, 34, 3001–3023. [Google Scholar] [CrossRef]
  44. Thornthwaite, C.W. An Approach toward a Rational Classification of Climate. Geogr. Rev. 1948, 38, 55–94. [Google Scholar] [CrossRef]
  45. Li, X.; Ju, H.; Sarah, G.; Yan, C.; Batchelor, W.D.; Liu, Q. Spatiotemporal Variation of Drought Characteristics in the Huang-Huai-Hai Plain, China under the Climate Change Scenario. J. Integr. Agric. 2017, 16, 2308–2322. [Google Scholar] [CrossRef]
  46. Isia, I.; Hadibarata, T.; Jusoh, M.N.H.; Bhattacharjya, R.K.; Shahedan, N.F.; Bouaissi, A.; Fitriyani, N.L.; Syafrudin, M. Drought Analysis Based on Standardized Precipitation Evapotranspiration Index and Standardized Precipitation Index in Sarawak, Malaysia. Sustainability 2023, 15, 734. [Google Scholar] [CrossRef]
  47. McKee, T.B.; Doesken, N.J.; Kleist, J. The Relationship of Drought Frequency and Duration to Time Scales. In Proceedings of the 8th Conference on Applied Climatology, Boston, MA, USA, 17–22 January 1993; Volume 17, pp. 179–183. [Google Scholar]
  48. Zhou, H.; Liu, Y. SPI Based Meteorological Drought Assessment over a Humid Basin: Effects of Processing Schemes. Water 2016, 8, 373. [Google Scholar] [CrossRef]
  49. Ye, X.; Li, Y.; Li, X.; Xu, C.; Zhang, Q. Investigation of the Variability and Implications of Meteorological Dry/Wet Conditions in the Poyang Lake Catchment, China, during the Period 1960–2010. Adv. Meteorol. 2015, 2015, 928534. [Google Scholar] [CrossRef]
  50. Zhang, Y.; Hu, X.; Zhang, Z.; Kong, R.; Peng, Z.; Zhang, Q.; Chen, X. The Increasing Risk of Future Simultaneous Droughts over the Yangtze River Basin Based on CMIP6 Models. Stoch. Environ. Res. Risk Assess. 2023. [Google Scholar] [CrossRef]
  51. Yu, J.; Zhou, H.; Huang, J.; Yuan, Y. Prediction of Multi-Scale Meteorological Drought Characteristics over the Yangtze River Basin Based on CMIP6. Water 2022, 14, 2996. [Google Scholar] [CrossRef]
  52. Ren, J.; Wang, W.; Wei, J.; Li, H.; Li, X.; Liu, G.; Chen, Y.; Ye, S. Evolution and Prediction of Drought-Flood Abrupt Alternation Events in Huang-Huai-Hai River Basin, China. Sci. Total Environ. 2023, 869, 161707. [Google Scholar] [CrossRef]
  53. Pei, Z.; Fang, S.; Wang, L.; Yang, W. Comparative Analysis of Drought Indicated by the SPI and SPEI at Various Timescales in Inner Mongolia, China. Water 2020, 12, 1925. [Google Scholar] [CrossRef]
  54. Deng, C.; She, D.; Deng, Y.; Chen, J.; Zhang, L.; Hong, S. Multi-model Projections of Meteorological Drought Characteristics under Different Scenarios in the Middle and Lower Reaches of Yangtze River Basin. J. Yangtze River Sci. Res. Inst. 2021, 38, 9–17. [Google Scholar]
  55. Ma, Z.; Sun, P.; Zhang, Q.; Zou, Y.; Lv, Y.; Li, H.; Chen, D. The Characteristics and Evaluation of Future Droughts across China through the CMIP6 Multi-Model Ensemble. Remote Sens. 2022, 14, 1097. [Google Scholar] [CrossRef]
Figure 1. The location of the study area.
Sustainability 15 08194 g001
Figure 2. Interannual change trends of (a) precipitation and (b) temperature during 1961–2100.
Sustainability 15 08194 g002
Figure 3. Multi -timescale evolution of SPEI values in the PLB during 1961–2014 (a) SPEI-1, (b) SPEI-3, (c) SPEI-6, (d) SPEI-12, (e) SPEI-24, (f) SPEI-48.
Sustainability 15 08194 g003
Figure 4. (a) SPEI-12, (b) SPEI-24, (c) SPEI-48 series in the PLB under SSP126, SSP245, and SSP585, respectively.
Sustainability 15 08194 g004
Figure 5. Cumulative times of (a) wet and (b) dry occurrence on 1-month scale of different classification in the PLB under different periods.
Sustainability 15 08194 g005
Figure 6. The spatial distribution of net precipitation in (a) July 2048 and (b) July 2055 under SSP126, SSP245, and SSP585.
Sustainability 15 08194 g006
Figure 7. Difference of multi-timescales between SPI and SPEI, and the temperature variations in 2021–2100 under (a) SSP126, (b) SSP245, and (c) SSP585.
Sustainability 15 08194 g007
Figure 8. Comparison of multi-timescales of SPI and SPEI in 2021–2100 under SSP126, SSP245, and SSP585.
Sustainability 15 08194 g008
Table 1. Detailed information on the three CMIP6 climate models.
ModelSourceSpatial Resolution (Lat × Lon)
BCC-CSM2-MRBeijing Climate Center, China1.125° × 1.125°
MRI-ESM2-0Meteorological Research Institute, Japan1.125° × 1.125°
NESM3Nanjing University of Information Science and Technology, China1.875° × 1.875°
Table 2. SPEI and SPI classification.
CategorySPEI or SPI Value
Extreme wetSPEI or SPI ≥ 2.0
Severe wet1.5 ≤ SPEI or SPI < 2.0
Moderate wet1.0 ≤ SPEI or SPI < 1.5
Normal−1.0 < SPEI or SPI < 1.0
Moderate dry−1.5 < SPEI or SPI ≤−1.0
Severe dry−2.0 < SPEI or SPI ≤−1.5
Extreme drySPEI or SPI ≤−2.0
Table 3. The comparison of wet and dry frequencies between historical and future periods.
PeriodWet and Dry Frequencies
Moderate WetSevere WetExtreme WetTotal WetModerate DrySevere DryExtreme DryTotal Dry
Historical9.10%6.33%1.54%16.98%11.42%4.78%1.23%17.44%
SSP12610.00%5.73%1.88%17.60%11.04%6.25%1.25%18.54%
SSP2459.79%4.58%1.67%16.04%12.92%7.08%1.25%21.25%
SSP58510.21%4.27%1.56%16.04%14.06%6.56%2.29%22.92%
Disclaimer/Publisher’s Note: The statements, opinions and data contained in all publications are solely those of the individual author(s) and contributor(s) and not of MDPI and/or the editor(s). MDPI and/or the editor(s) disclaim responsibility for any injury to people or property resulting from any ideas, methods, instructions or products referred to in the content.

