

Assessing the Effects of Modalities of Takeover Request, Lead Time of Takeover Request, and Traffic Conditions on Takeover Performance in Conditionally Automated Driving

Abstract
:1. Introduction
2. Materials and Methods
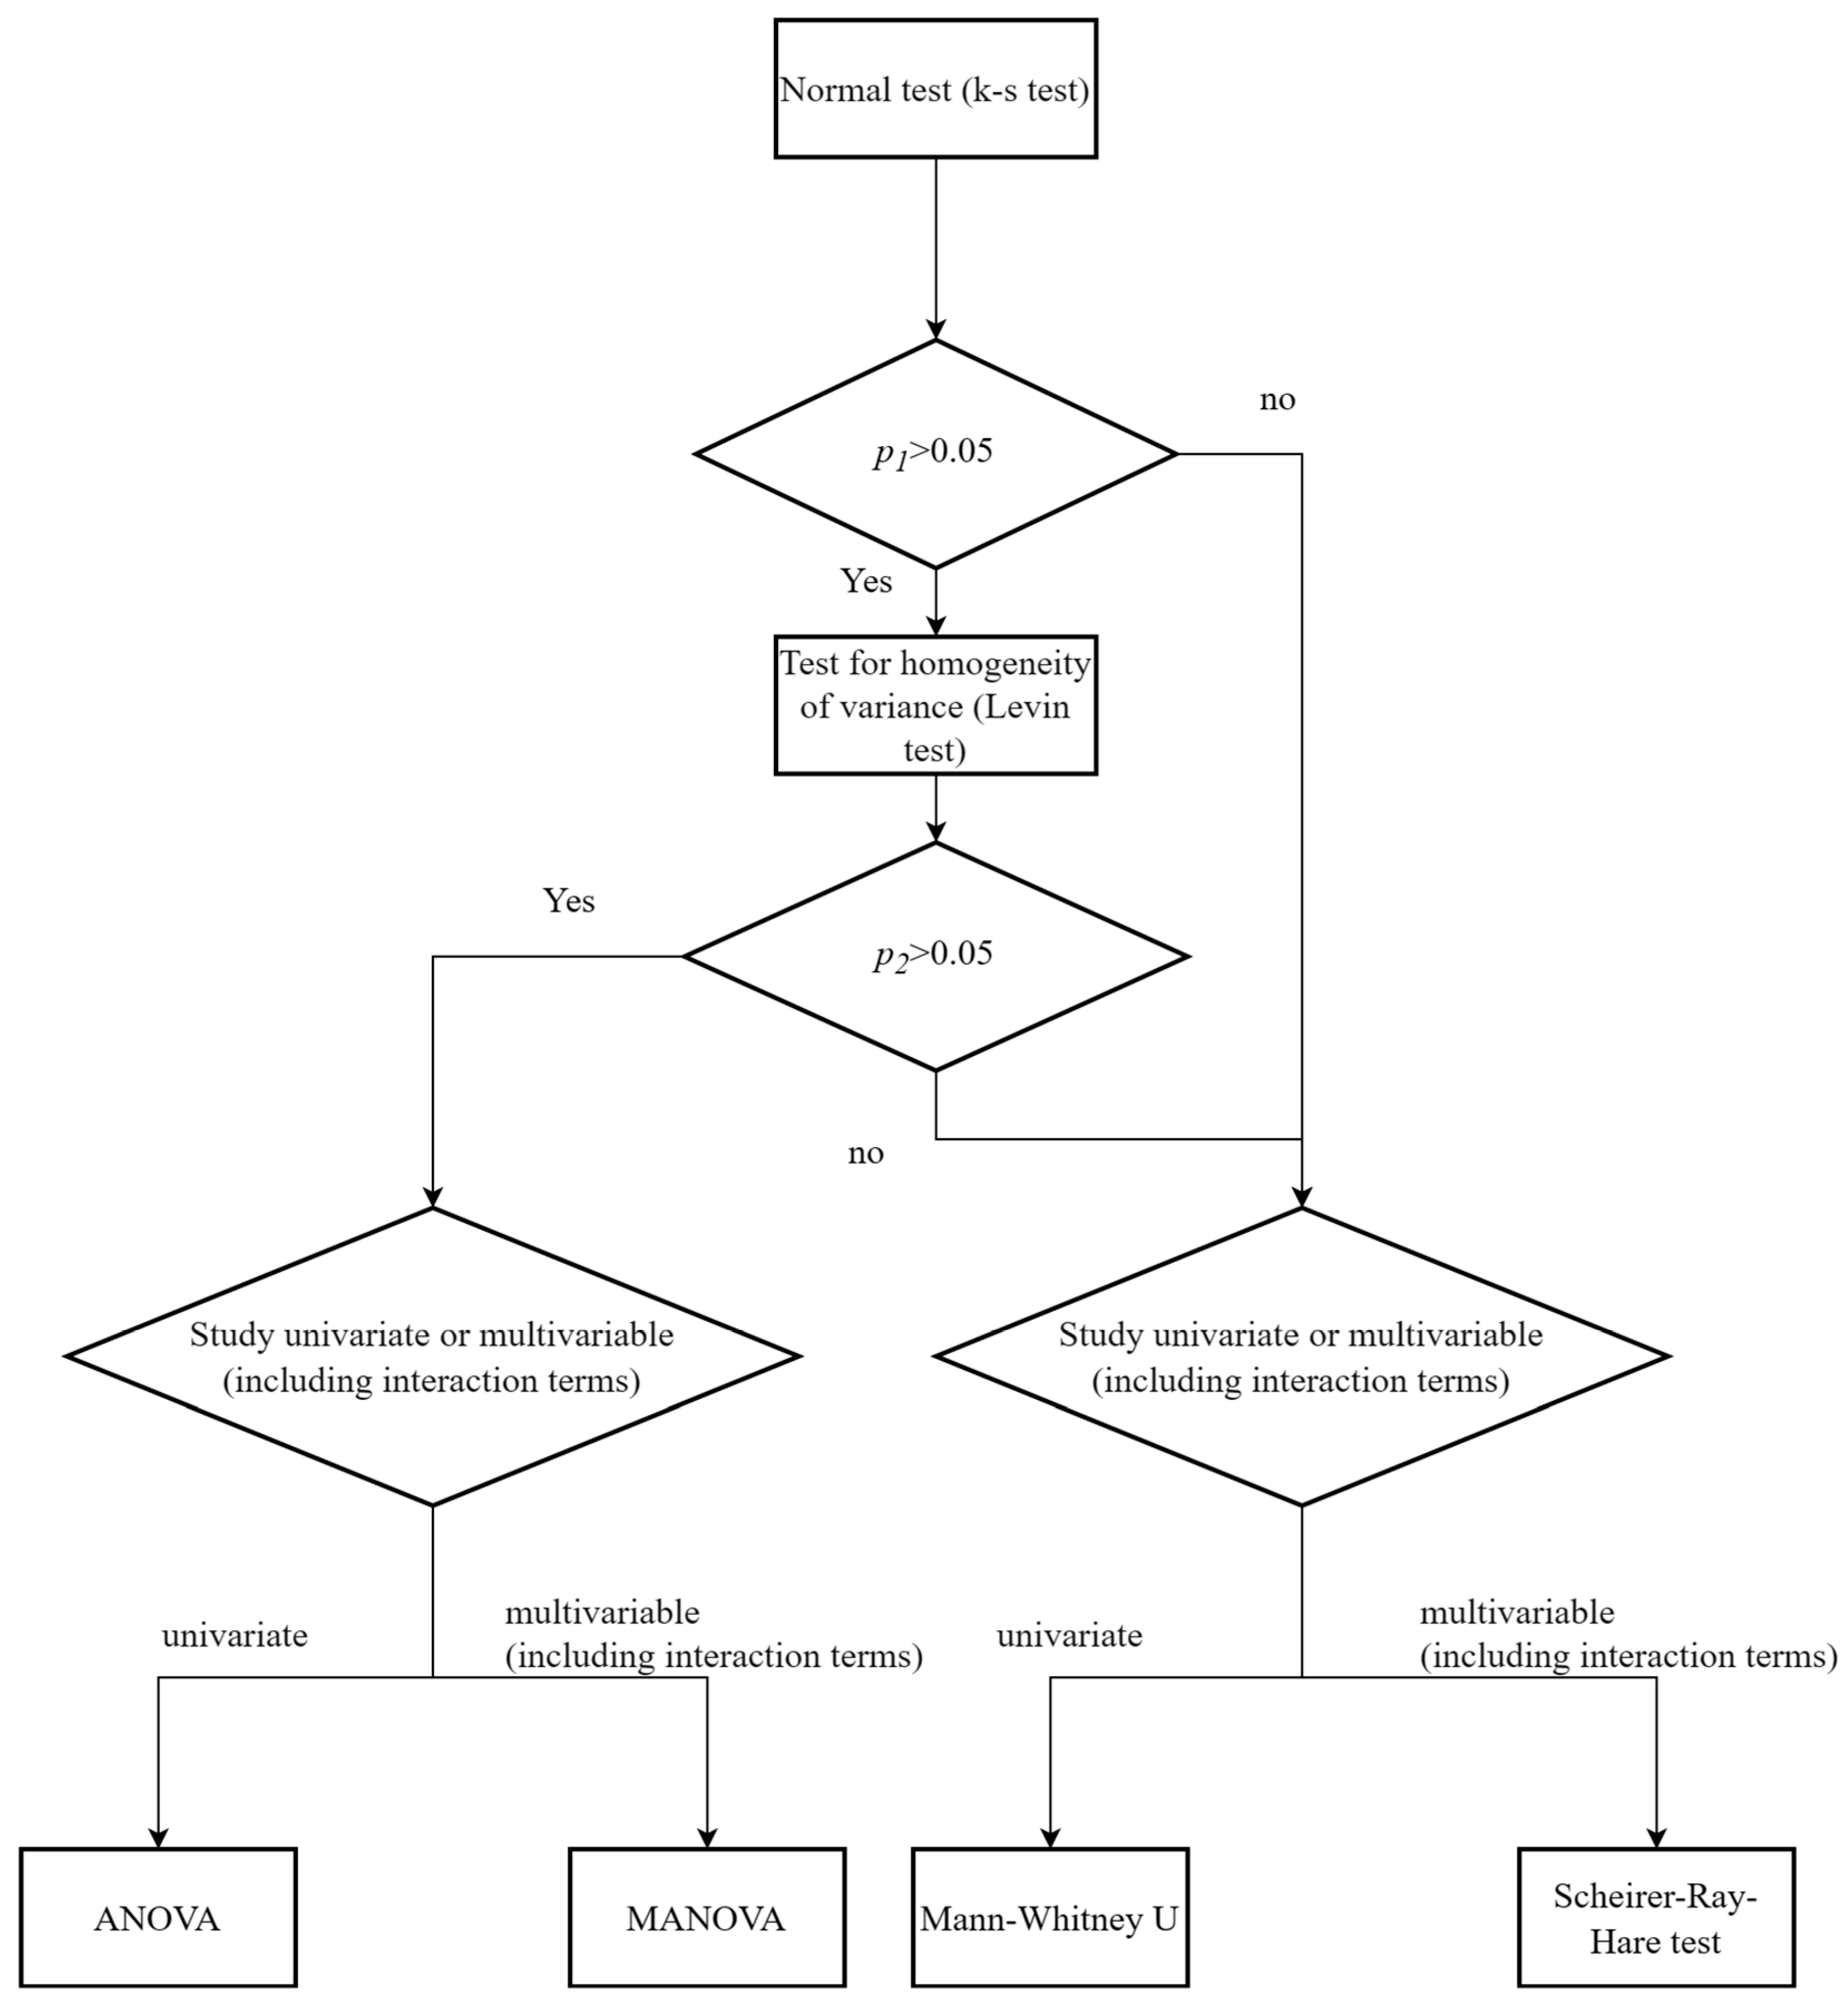
2.1. Multiple Factor Analysis
2.2. Indicators
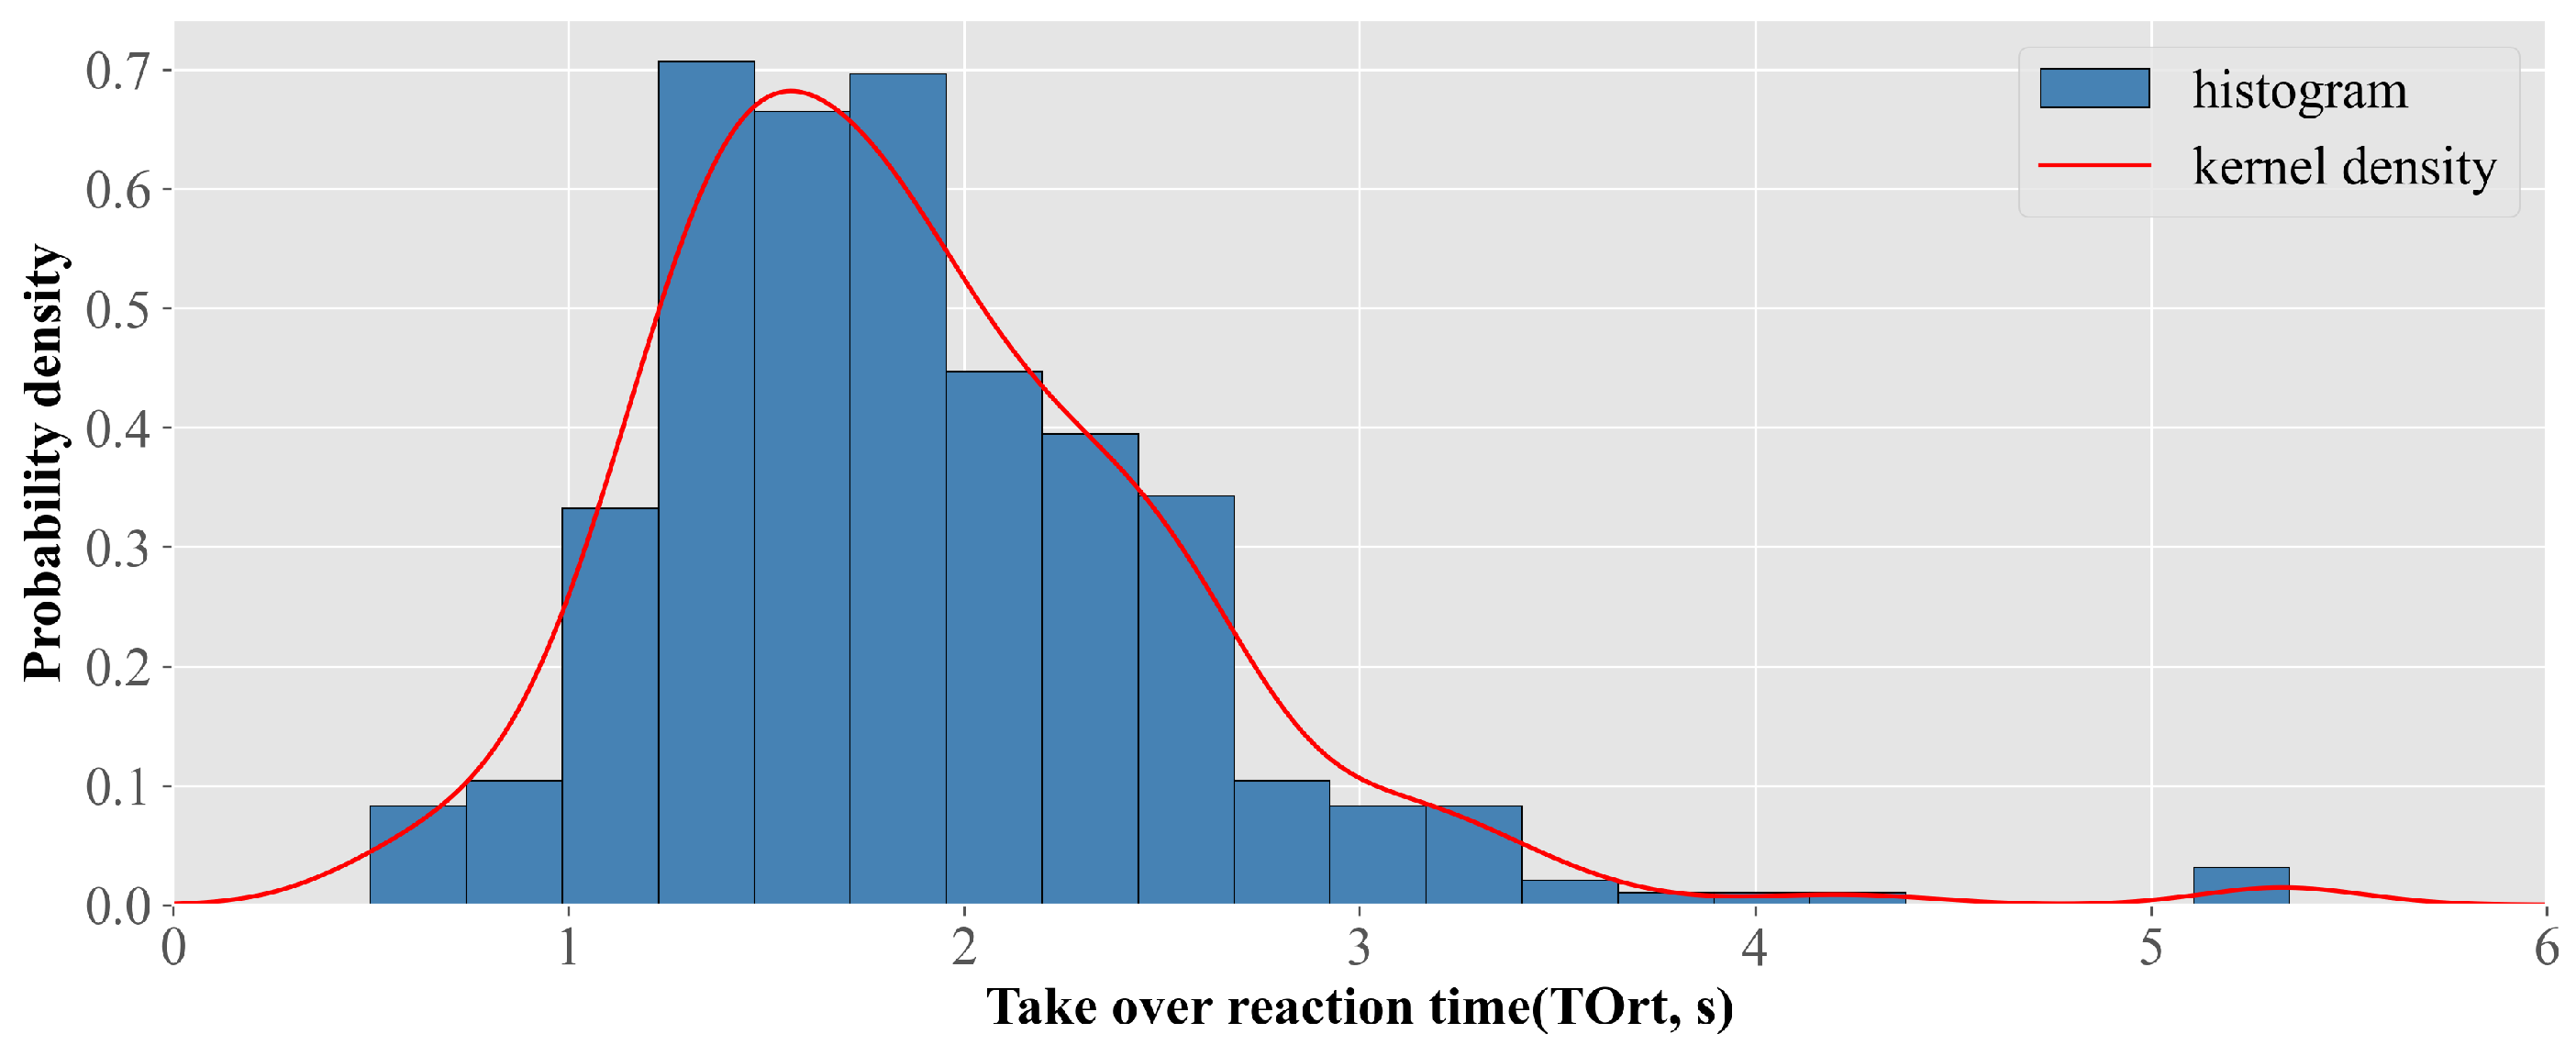
2.2.1. Take Over Reaction Time (TOrt)
2.2.2. ApEn and Operating Order of Steering Wheel Angle and Pedal Torque
- Sequence to form m as vector .
- 2.
- For each , calculate the distance between the vector and the remainder:
- 3.
- Calculate the ratio of the number less than r in each calculated by (2) to the total number, i.e.,
- 4.
- Take the logarithm of and average it.
- 5.
- Repeat calculation of (1)~(4) for , get
- 6.
- Calculate ApEn, where is not equal to ∞
2.2.3. Mean and Standard Deviation of Velocity and Acceleration
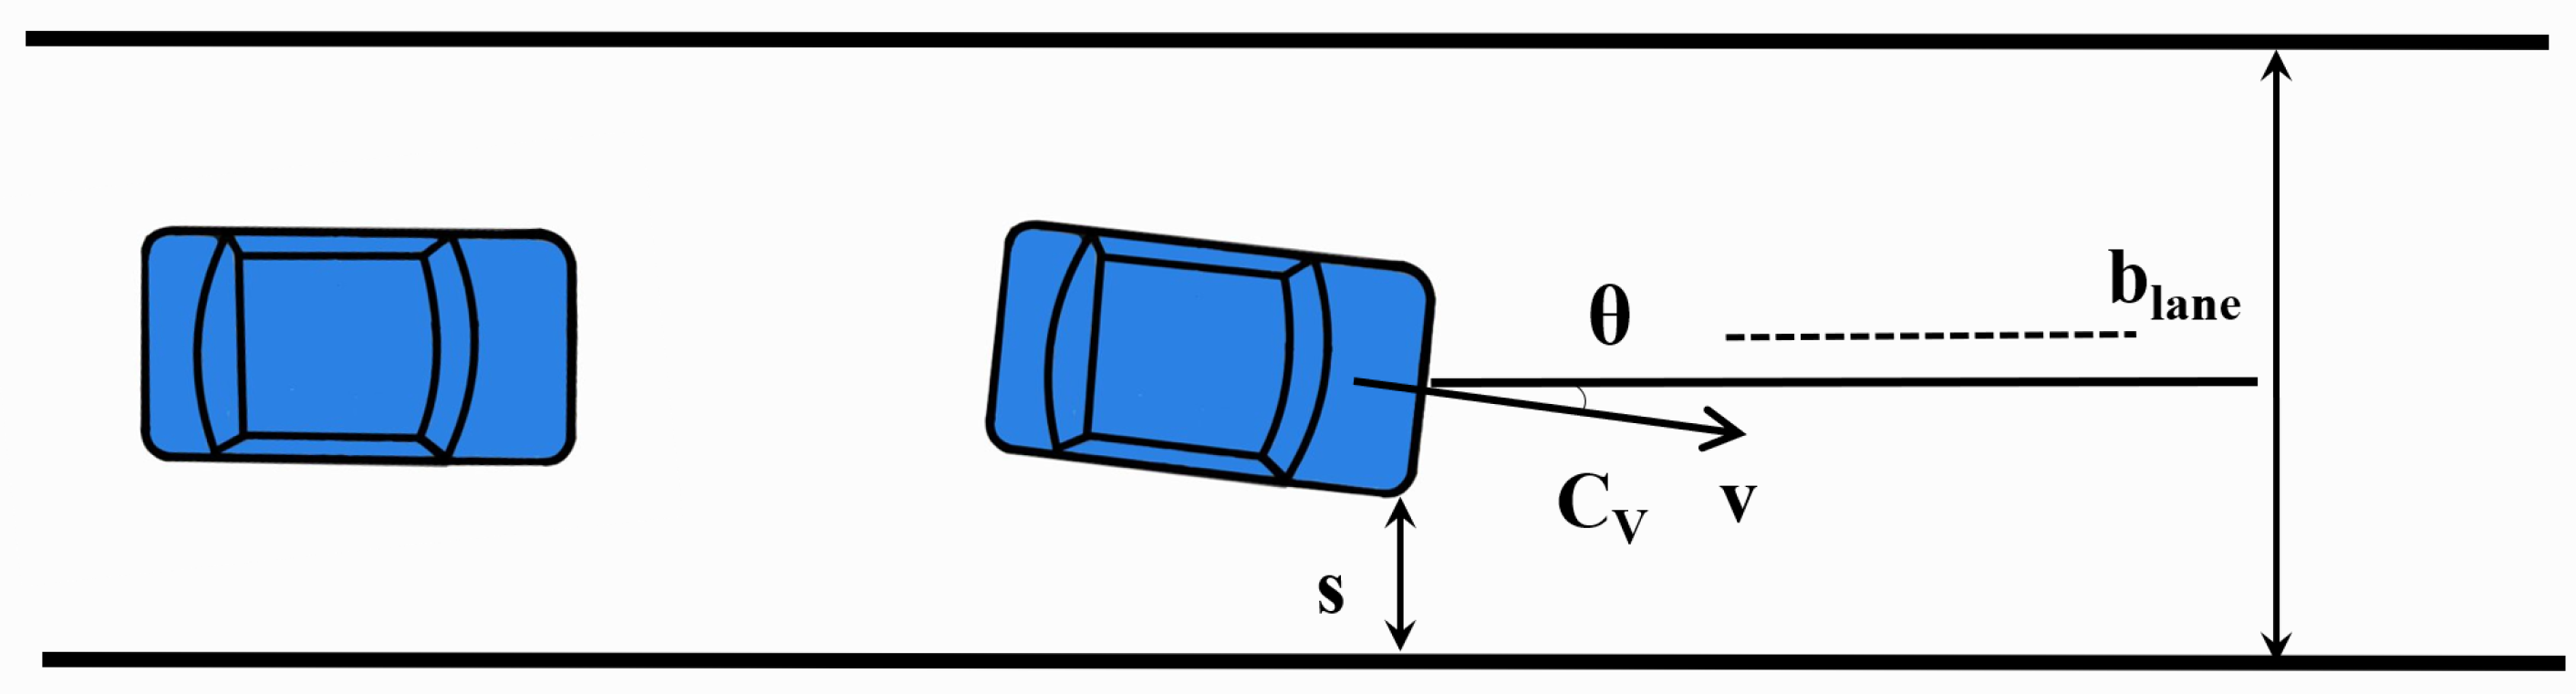
2.2.4. Lane-Changing Behavior
2.2.5. Lateral Cross-Border Risk and Longitudinal Collision Risk
2.3. Driving Simulation Experiment
2.3.1. Participants
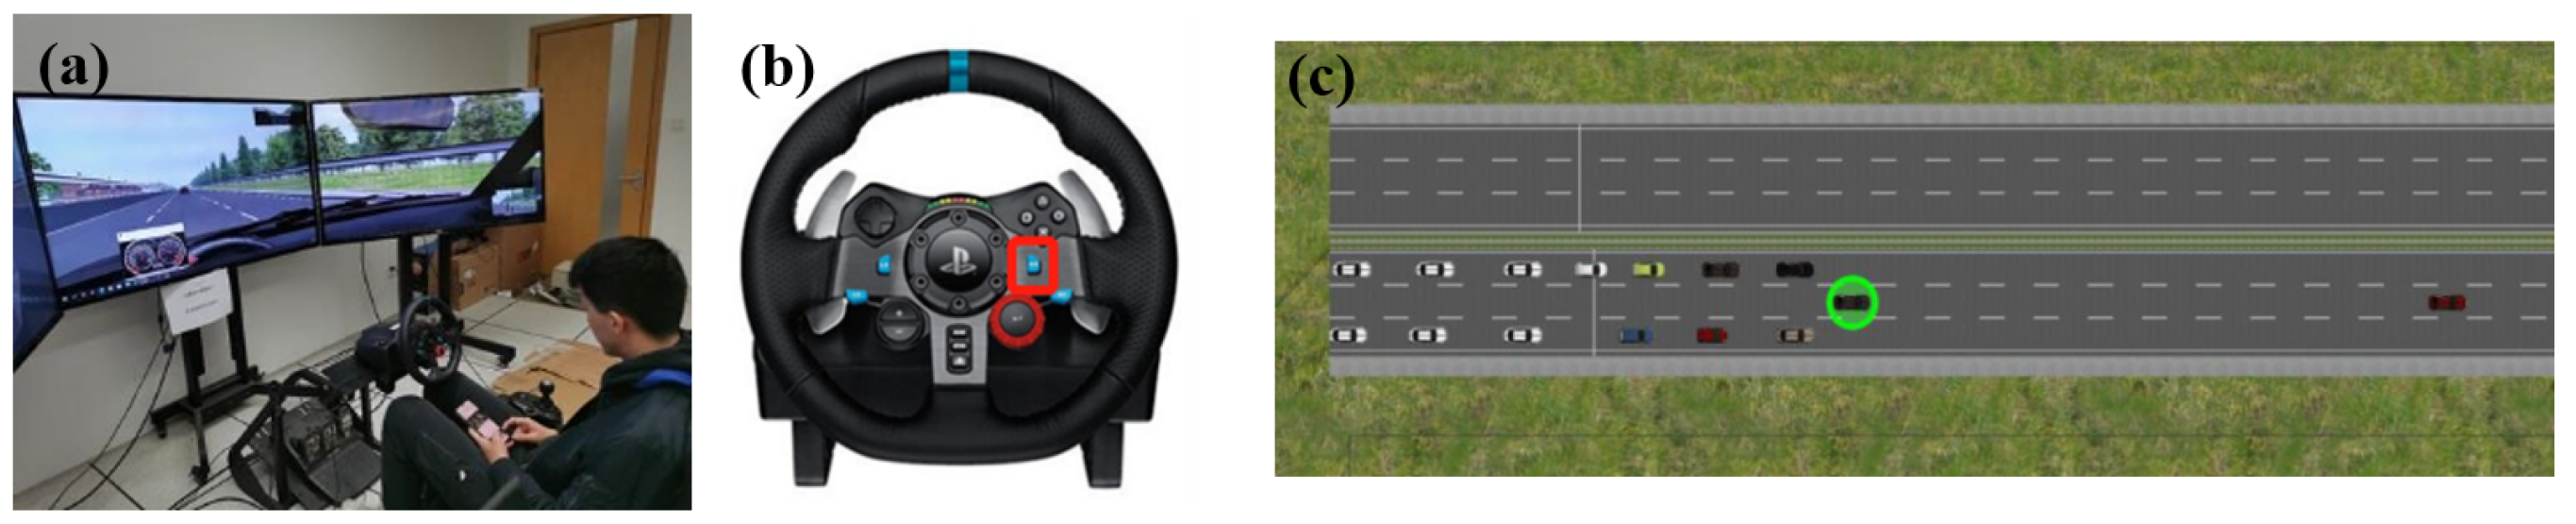
2.3.2. Apparatus
2.3.3. Experiment Design and Procedure
3. Results
3.1. Take Over Reaction Time (TOrt)
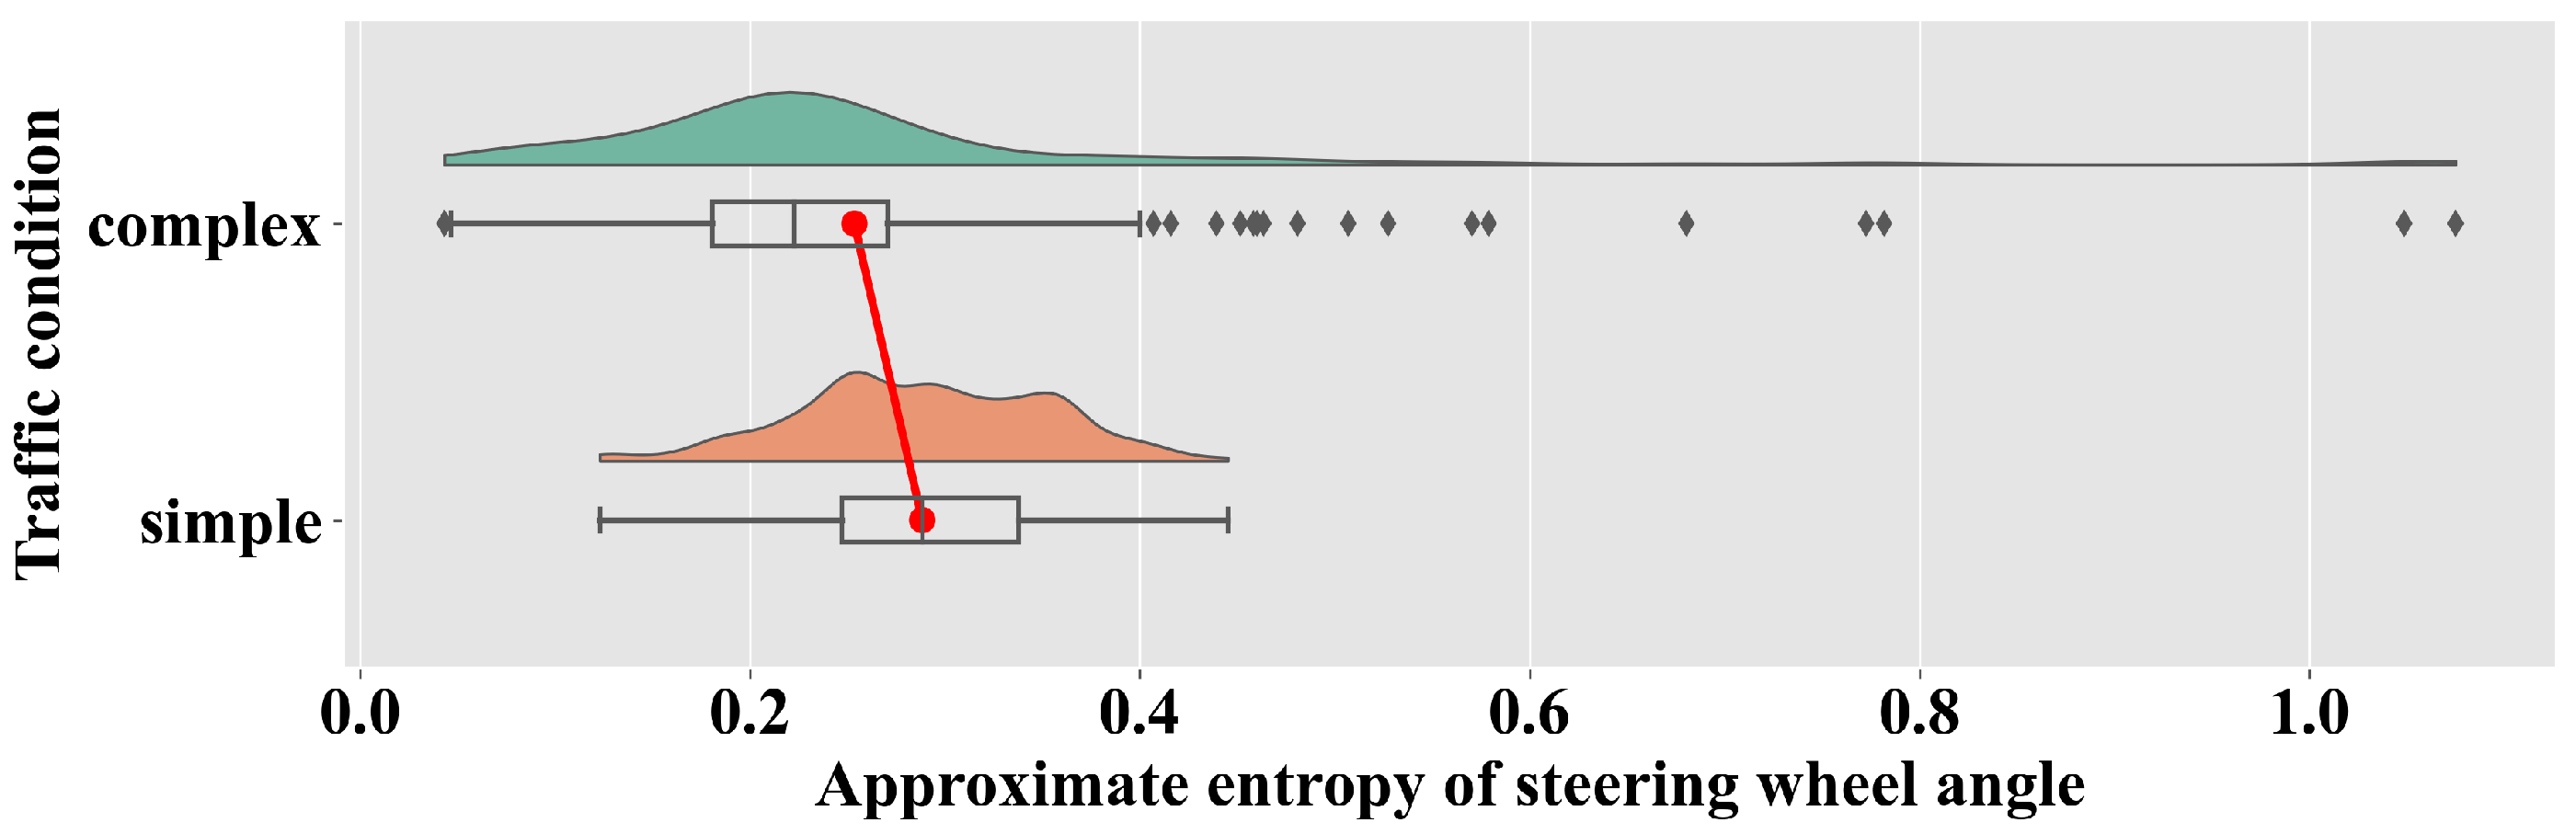
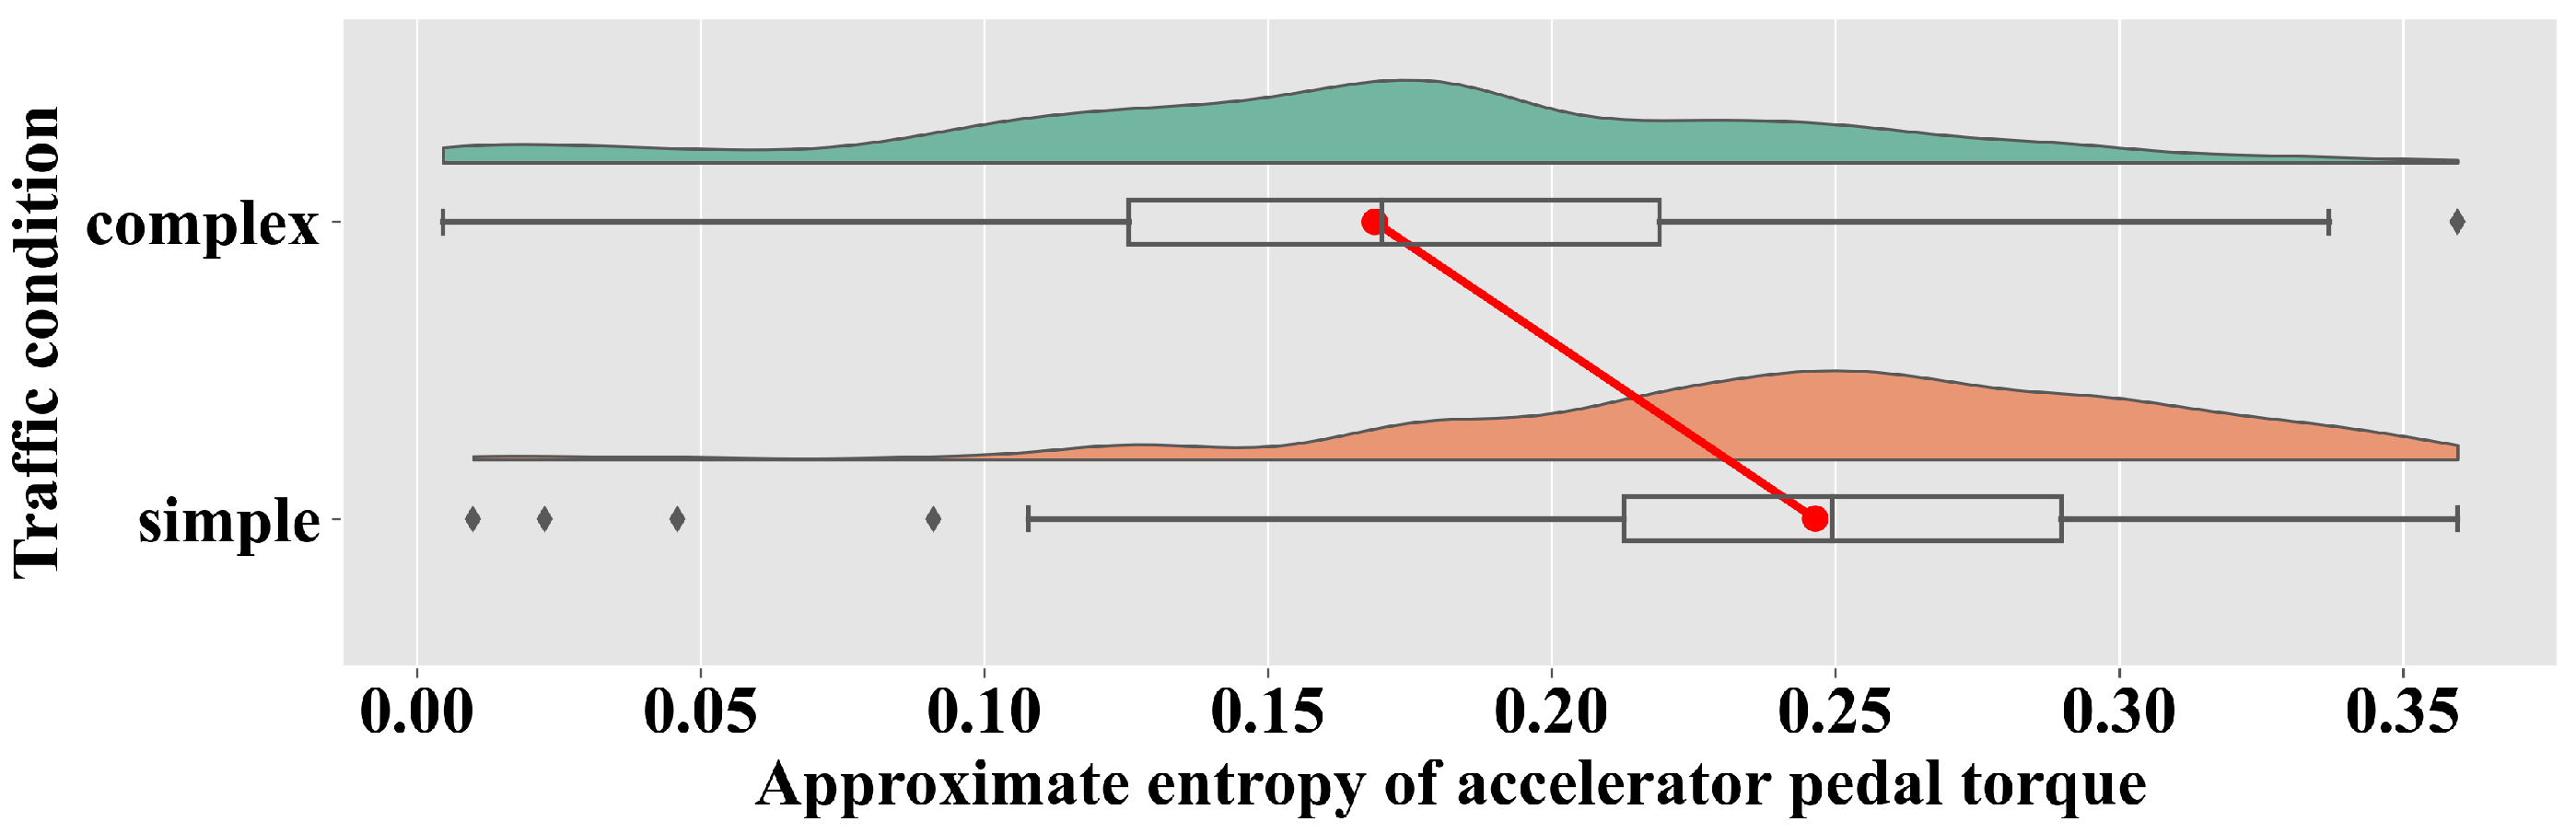
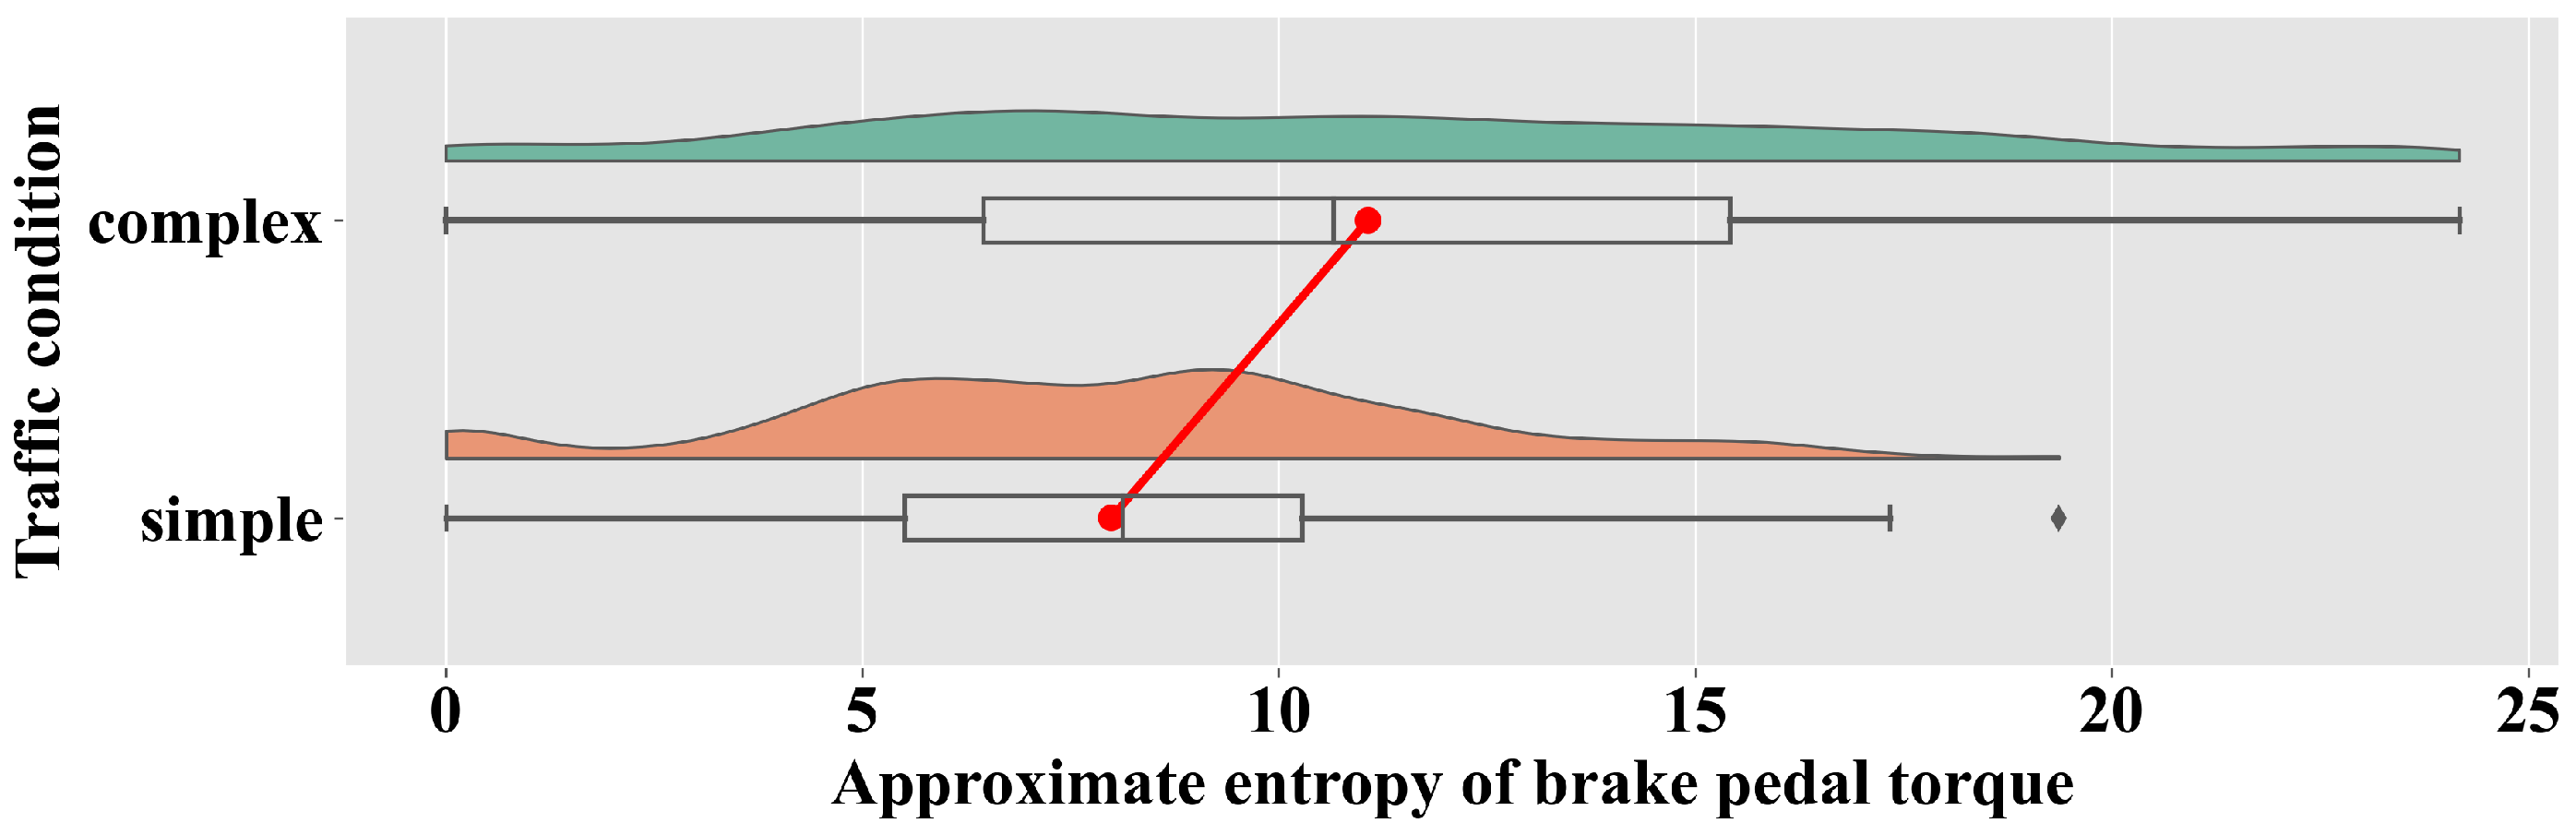
3.2. ApEn and Operating Order of Steering Wheel Angle and Pedal Torque
3.3. Mean and Standard Deviation of Velocity and Acceleration
3.4. Lane-Changing Behavior
3.5. Lateral Cross-Border Risk and Longitudinal Collision Risk
4. Discussion
4.1. Operation Order of Steering Wheel and Pedals
4.2. Effects of the Single Factor
4.2.1. TORlt
4.2.2. Modalities of TOR
4.2.3. Traffic Conditions
4.3. Interaction Effects of TORlt, Modalities of TOR, and Traffic Conditions
5. Conclusions
- (1)
- The experimental scenario to take over the order of operation is similar: Step on the brake pedal, adjust the steering wheel, accelerate, and change lanes.
- (2)
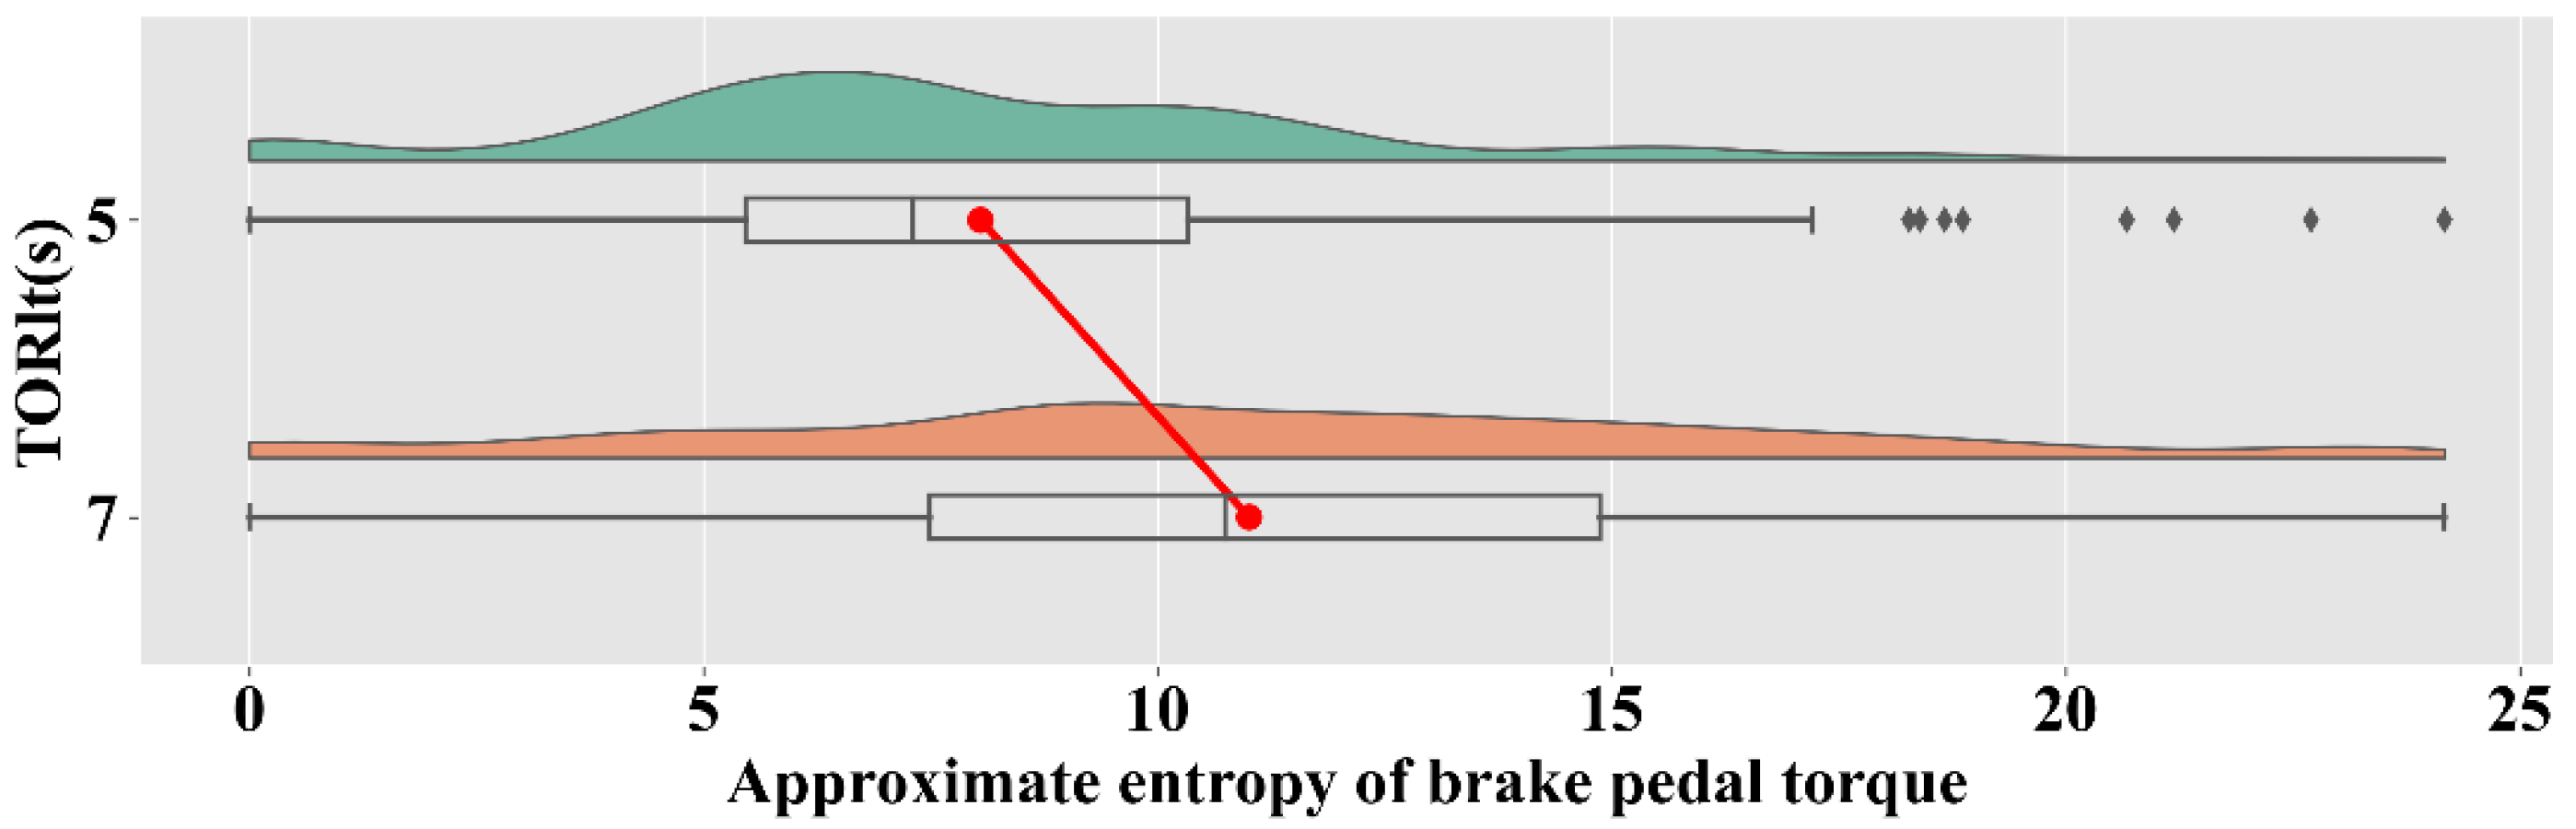
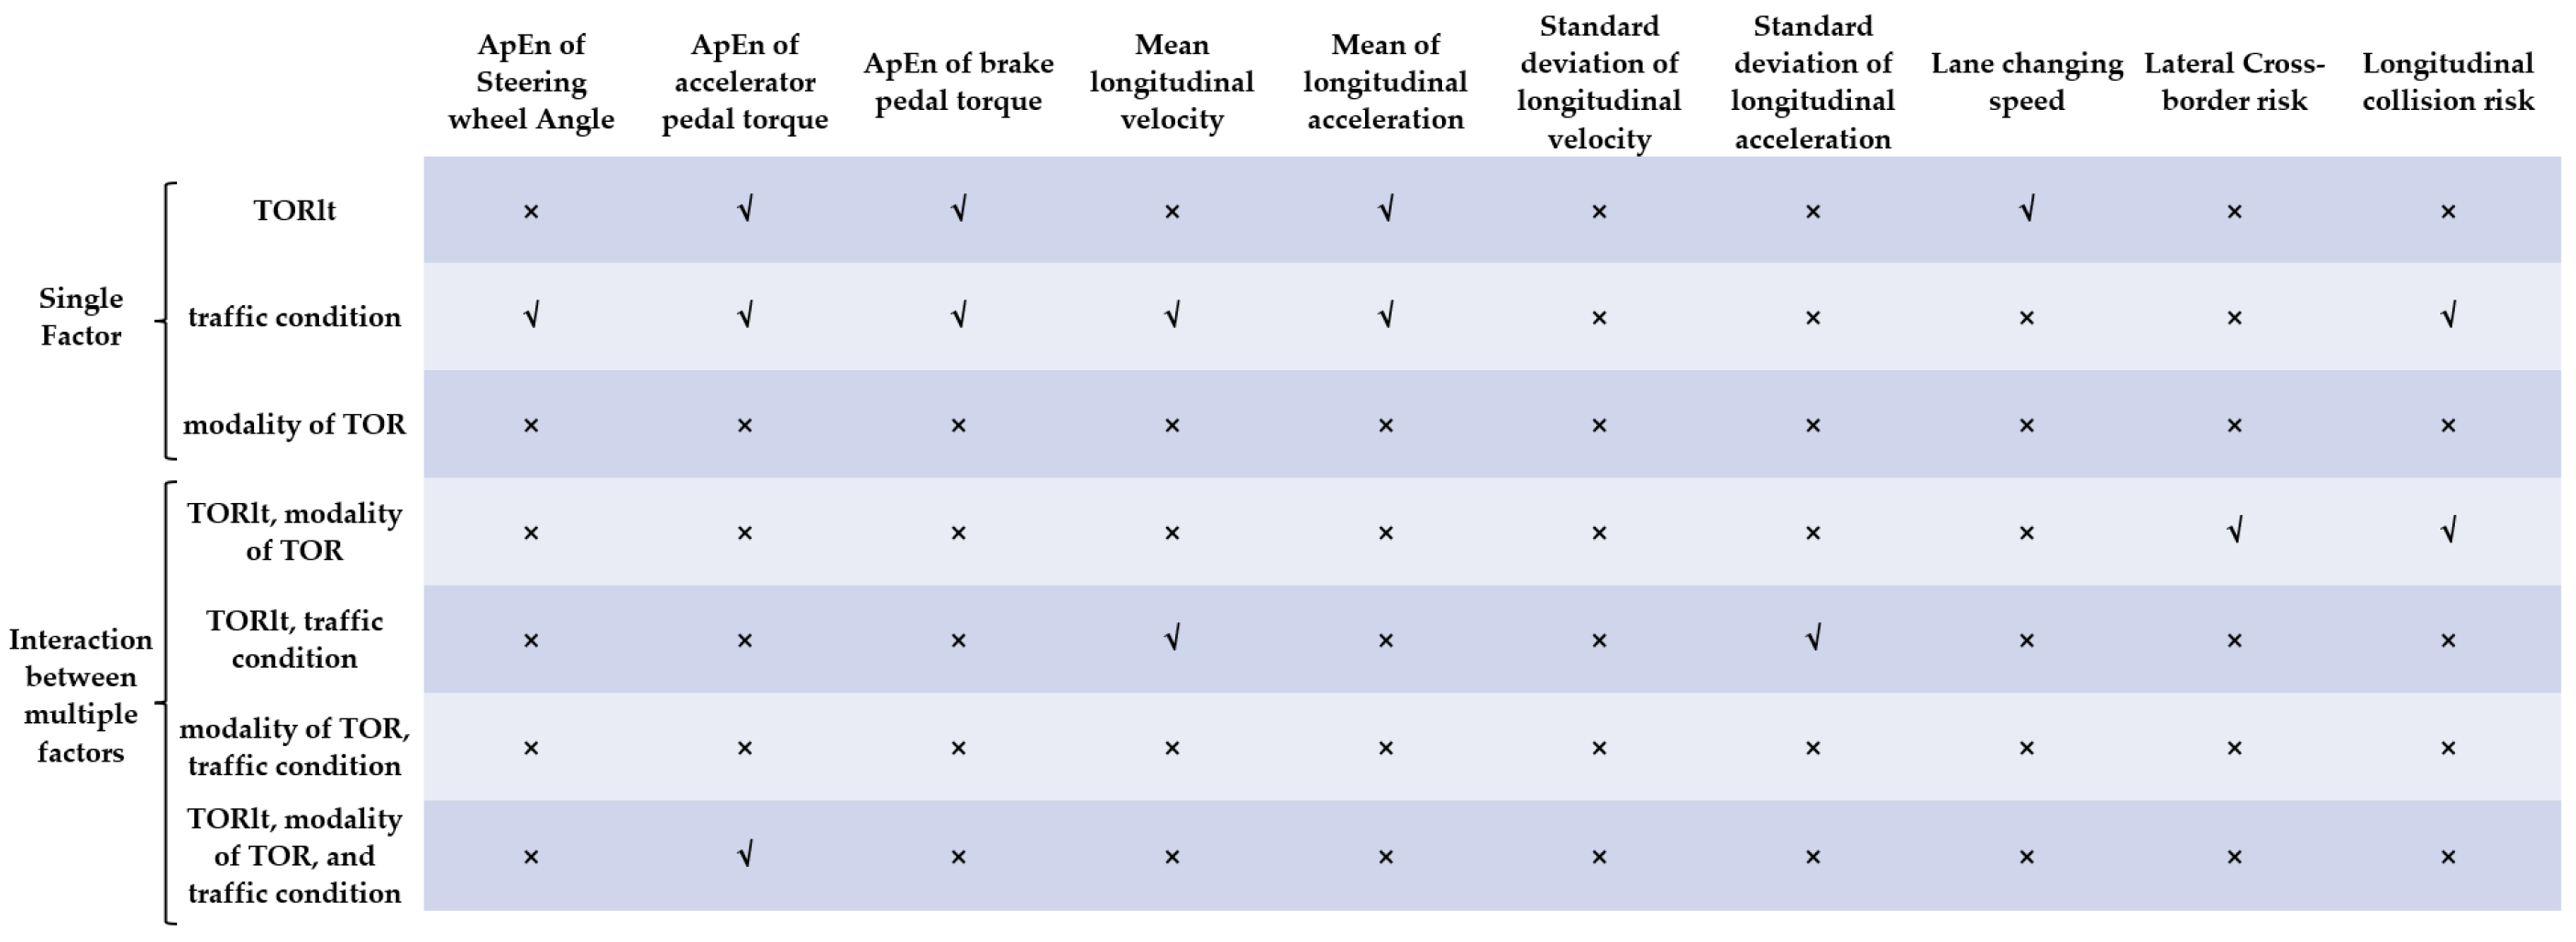
- When the traffic conditions are complex, drivers have a larger ApEn of steering wheel Angle and brake pedal torque, and a smaller ApEn of acceleration pedal torque. In the 5 s TORlt case, drivers have a smaller ApEn of brake pedal torque.
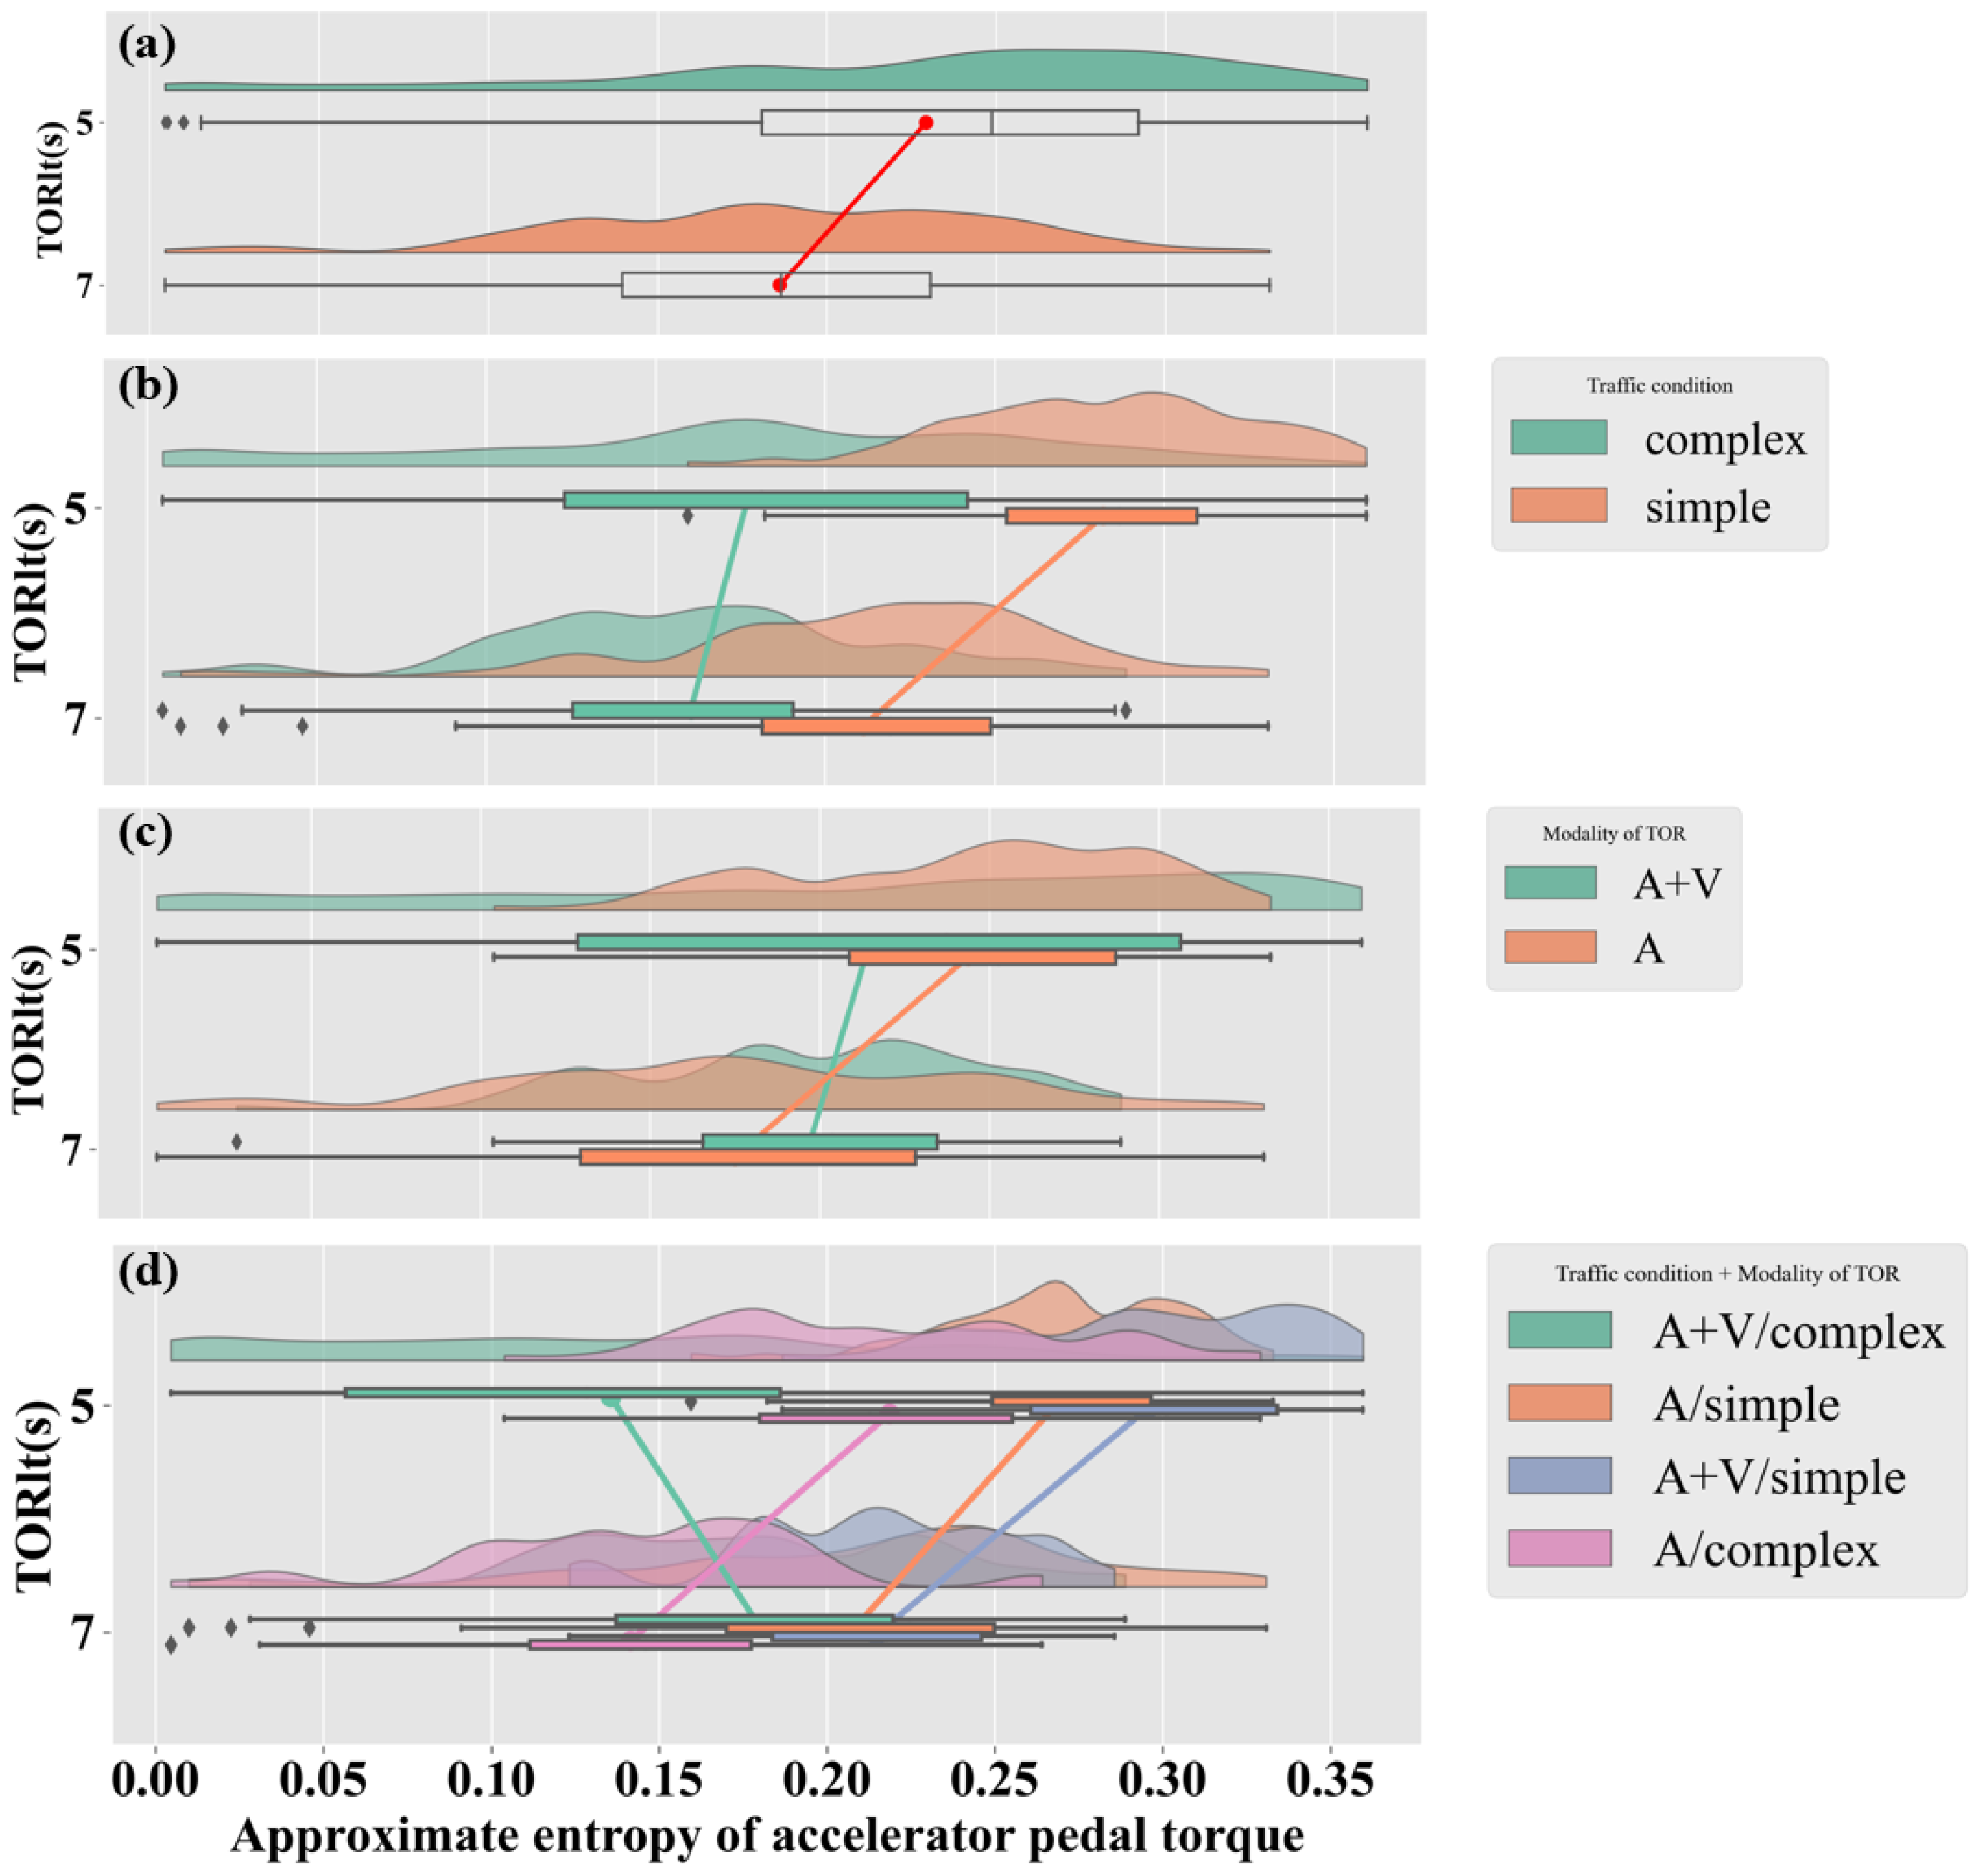
- (3)
- The interaction between TORlt, traffic conditions and modality of TOR affects ApEn of accelerator pedal torque, generally speaking, the ApEn of accelerator pedal torque under 5 s TORltis higher affected by just one or just two factors including TORlt. but if the warning modality is A+V, the traffic conditions are more complex, the ApEn of accelerator pedal torque under 5 s TORlt is lower than that under 7 s TORlt
- (4)
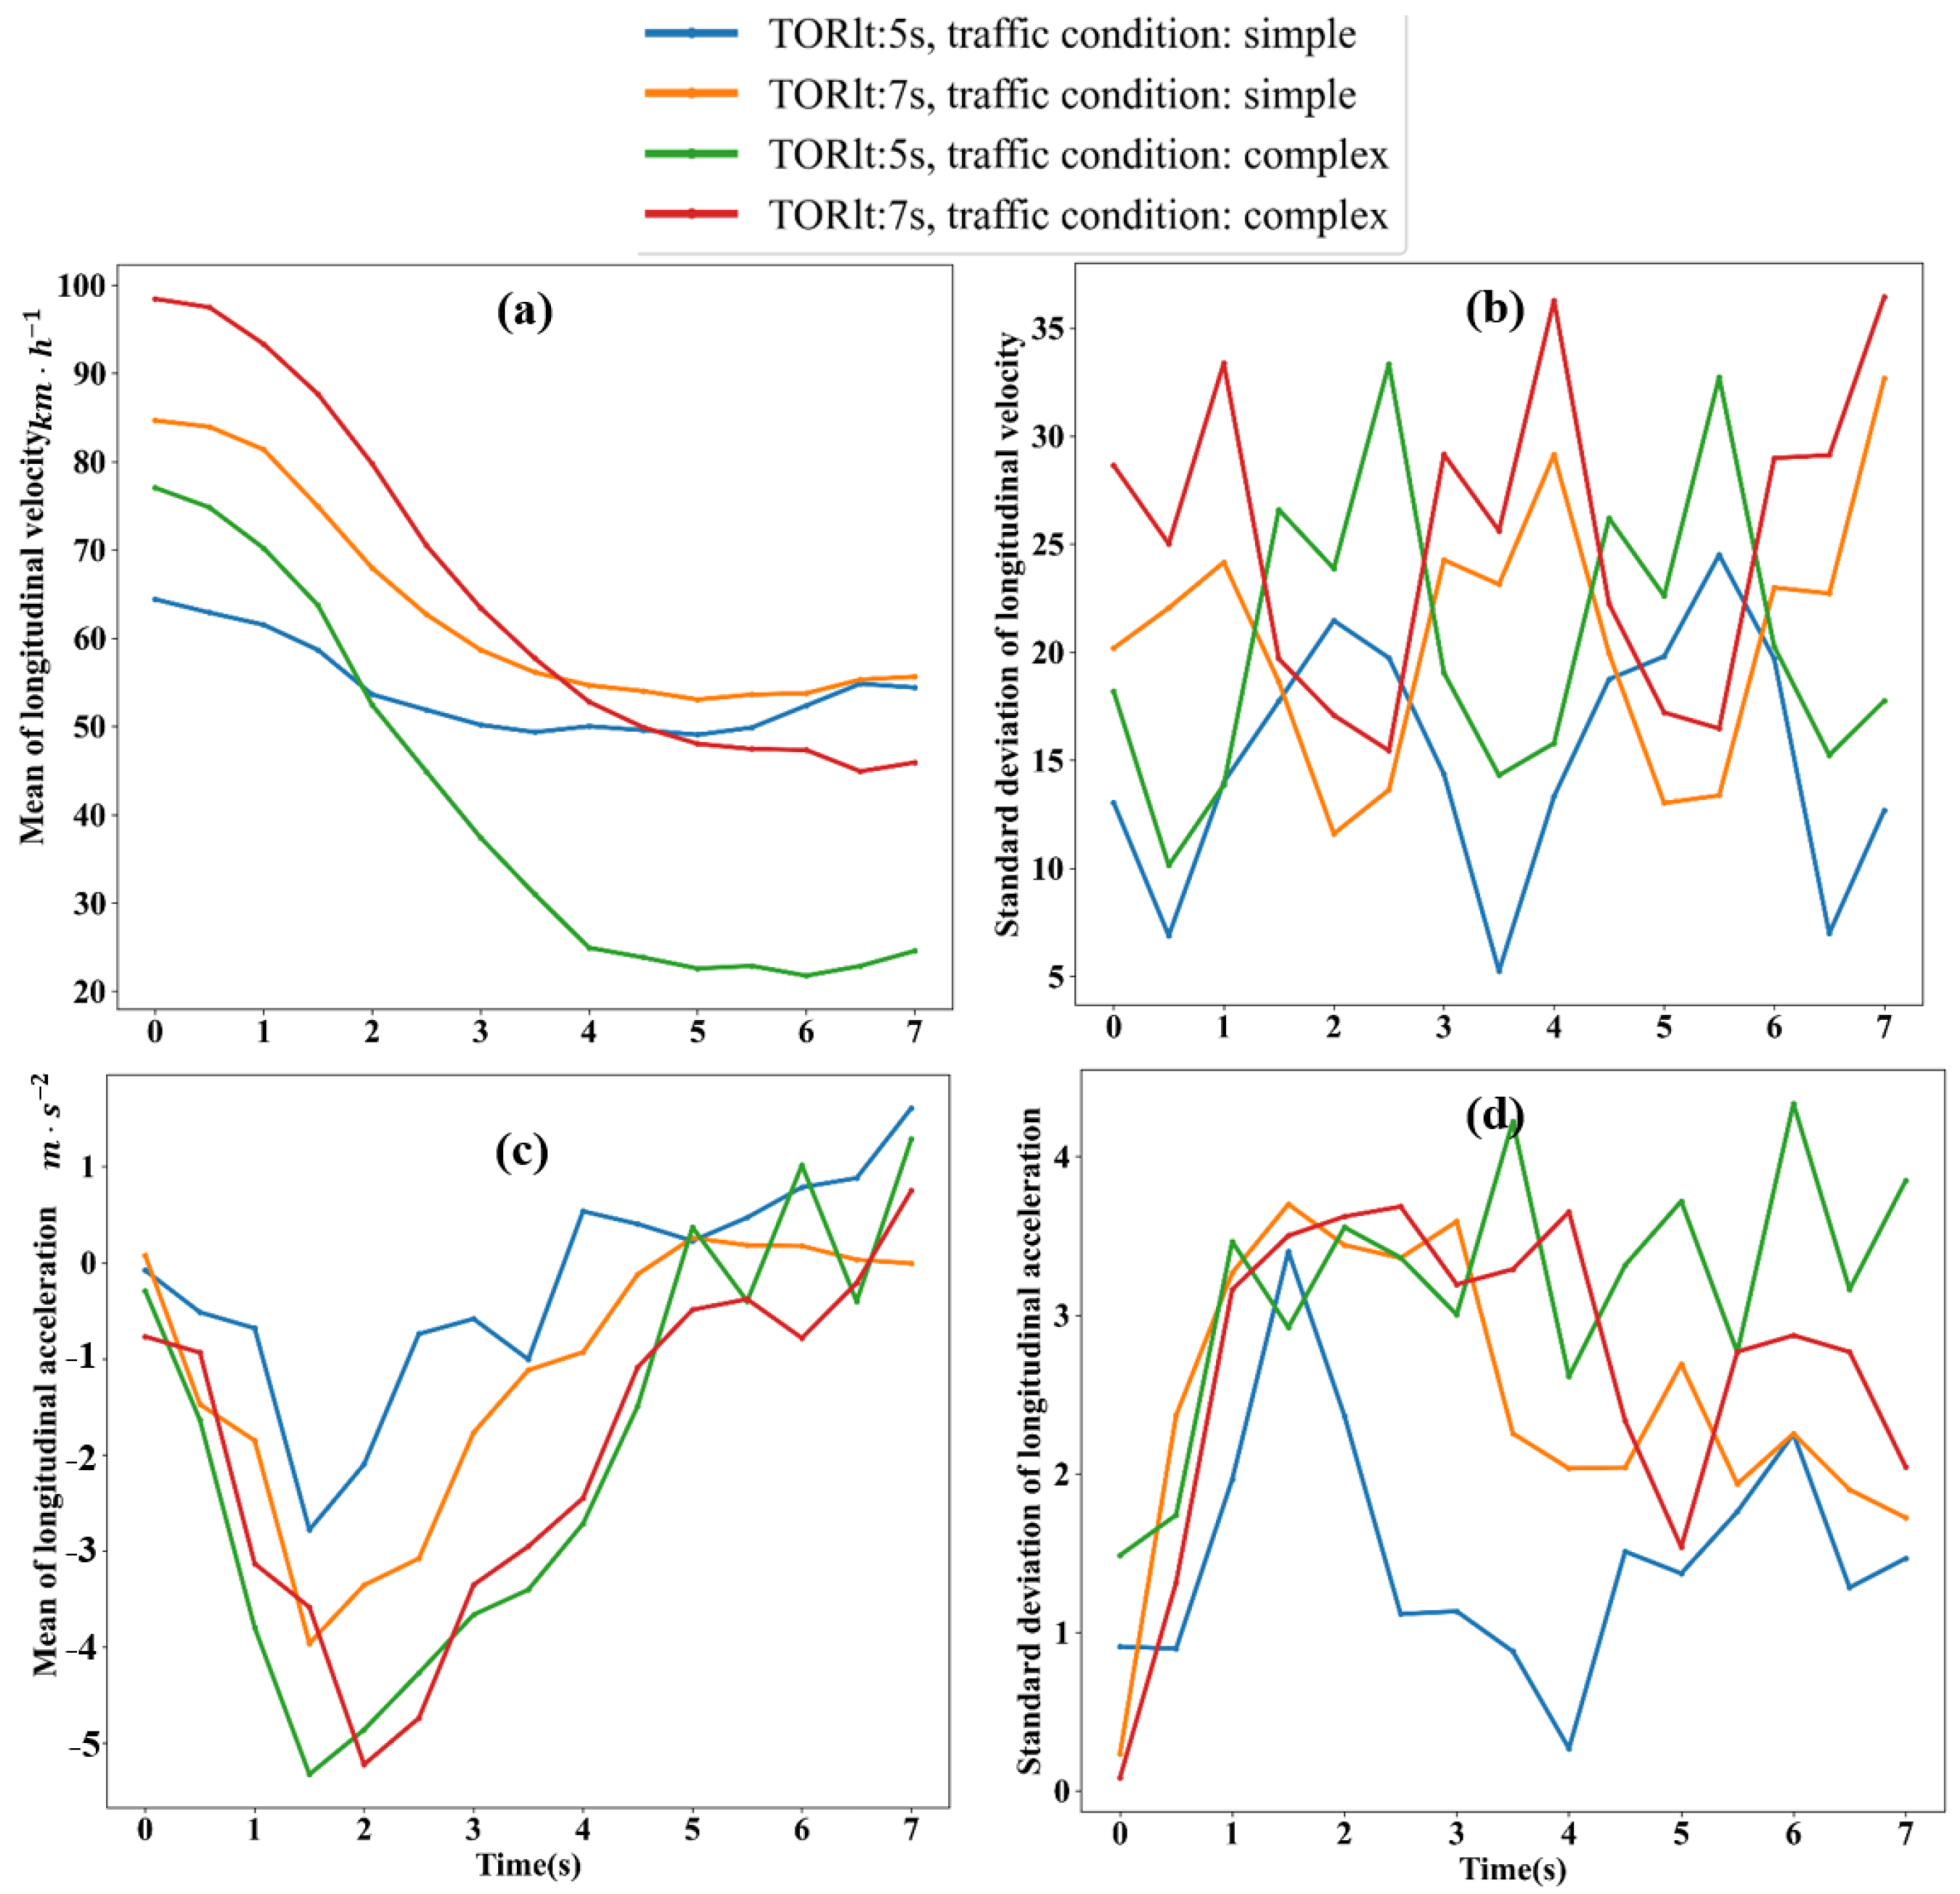
- In 5 s TORlt/ difficult traffic conditions, the situation gets more urgent, which is likely to raise the level of risk compared to other groups. The driver slows down more, which makes dangerous turning and braking actions simple to perform. When there is a straightforward traffic situation or a considerable TORlt (7 s), the motorist slows down less.
- (5)
- Auditory and auditory + visual combinations did not singly affect the behavioral characteristics of experimental scenarios.
- (6)
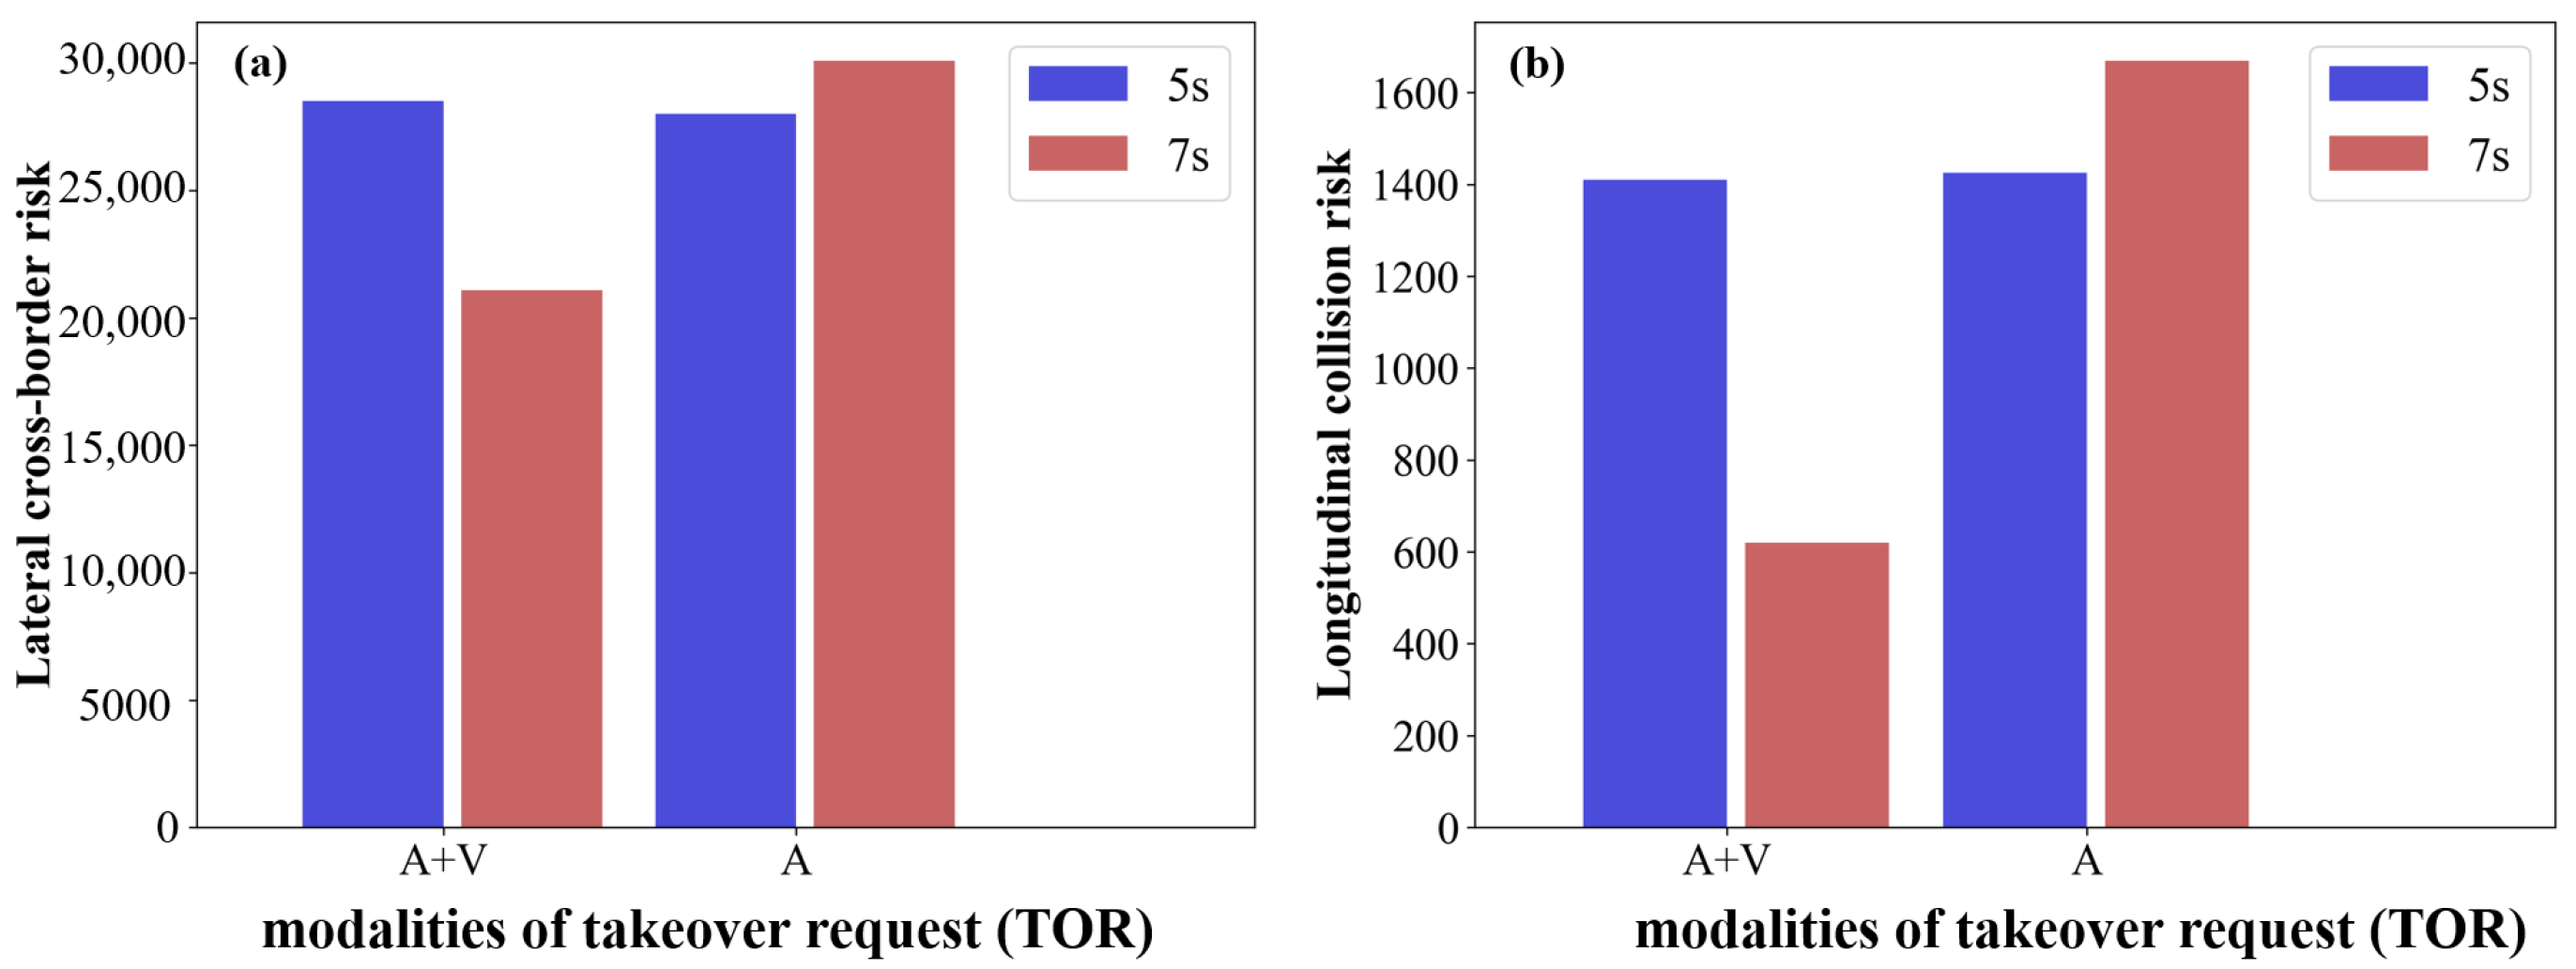
- In this study, only under the interaction effect of 7 s TORlt and the “visual + auditory” modality, the lateral cross-border risk and longitudinal collision risk are significantly reduced.
- (1)
- Due to equipment limitations, this study only assesses the driver’s takeover behavior based on how smoothly the vehicle operates after the takeover, how smoothly the driver operates, and how likely it is that the driver will collide transversely or longitudinally while driving. The physical and psychological responses of the driver may also be considered as one of the evaluation criteria. The addition of an eye tracker and a heart rate monitor will be helpful for the upcoming study.
- (2)
- The experimental setting in this study attempts to mimic the actual driving environment as closely as possible. There are differences between the real car and the driving simulation equipment even if all drivers utilize the same equipment. Additional comparative testing is necessary to determine whether the experimental results are applicable to other road conditions or real-world driving situations.
Author Contributions
Funding
Institutional Review Board Statement
Informed Consent Statement
Data Availability Statement
Acknowledgments
Conflicts of Interest
References
- SAE. Taxonomy and Definitions for Terms Related to Driving Automation Systems for On-Road Motor Vehicles. 2018. Available online: https://www.sae.org/standards/content/j3016_201806/ (accessed on 18 January 2021).
- NHTSA (National Highway Traffic Safety Administration). Summary Report: Standing General Order on Crash Reporting for Level 2 Advanced Driver Assistance Systems. 2022. Available online: https://www.nhtsa.gov/sites/nhtsa.gov/files/2022-06/ADAS-L2-SGO-Report-June-2022.pdf (accessed on 15 June 2022).
- NHTSA (National Highway Traffic Safety Administration). Summary Report: Standing General Order on Crash Reporting for Automated Driving Systems. 2022. Available online: https://www.nhtsa.gov/sites/nhtsa.gov/files/2022-06/ADS-SGO-Report-June-2022.pdf (accessed on 15 June 2022).
- Lee, J.; Yun, H.; Kim, J.; Baek, S.; Han, H.; Fakhr Hosseini, S.M.; Vasey, E.; Lee, O.; Jeon, M.; Yang, J.H. Design of single-modal take-over request in SAE level 2 & 3 automated vehicle. Trans. Korean Soc. Automot. Eng. 2019, 27, 171. [Google Scholar]
- Yang, Y.; Karakaya, B.; Dominioni, G.C.; Kawabe, K.; Bengler, K. An hmi concept to improve driver’s visual behavior and situation awareness in automated vehicle. In Proceedings of the 2018 21st International Conference on Intelligent Transportation Systems (ITSC), Maui, HI, USA, 4–7 November 2018; IEEE: New York, NY, USA, 2018; pp. 650–655. [Google Scholar]
- Politis, I.; Brewster, S.; Pollick, F. Language-based multimodal displays for the handover of control in autonomous cars. In Proceedings of the 7th International Conference on Automotive User Interfaces and Interactive Vehicular Applications, Nottingham, UK, 1–3 September 2015; pp. 3–10. [Google Scholar]
- Bazilinskyy, P.; de Winter, J.C. Analyzing crowdsourced ratings of speech-based take-over requests for automated driving. Appl. Ergon. 2017, 64, 56–64. [Google Scholar] [CrossRef]
- Ljungberg, J.K.; Parmentier, F.B.; Hughes, R.W.; Macken, W.J.; Jones, D.M. Listen out! Behavioural and subjective responses to verbal warnings. Appl. Cogn. Psychol. 2012, 26, 451–461. [Google Scholar] [CrossRef]
- Borojeni, S.S.; Wallbaum, T.; Heuten, W.; Boll, S. Comparing shape changing and vibro-tactile steering wheels for take-over requests in highly automated driving. In Proceedings of the 9th International Conference on Automotive User Interfaces and Interactive Vehicular Applications, Oldenburg, Germany, 24–27 September 2017; pp. 221–225. [Google Scholar]
- Petermeijer, S.; Bazilinskyy, P.; Bengler, K.; De Winter, J. Take-over again: Investigating multimodal and directional TORs to get the driver back into the loop. Appl. Ergon. 2017, 62, 204–215. [Google Scholar] [CrossRef]
- Diederich, A.; Colonius, H. Bimodal and trimodal multisensory enhancement: Effects of stimulus onset and intensity on reaction time. Percept. Psychophys. 2004, 66, 1388–1404. [Google Scholar] [CrossRef] [PubMed]
- Bazilinskyy, P.; Petermeijer, S.M.; Petrovych, V.; Dodou, D.; de Winter, J.C. Take-over requests in highly automated driving: A crowdsourcing survey on auditory, vibrotactile, and visual displays. Transp. Res. Part F Traffic Psychol. Behav. 2018, 56, 82–98. [Google Scholar] [CrossRef]
- van Erp, J.B.; Toet, A.; Janssen, J.B. Uni-, bi-and tri-modal warning signals: Effects of temporal parameters and sensory modality on perceived urgency. Saf. Sci. 2015, 72, 1–8. [Google Scholar] [CrossRef]
- Young, M.S.; Stanton, N.A. Back to the future: Brake reaction times for manual and automated vehicles. Ergonomics 2007, 50, 46–58. [Google Scholar] [CrossRef]
- Rezvani, T.; Driggs-Campbell, K.; Sadigh, D.; Sastry, S.S.; Seshia, S.A.; Bajcsy, R. Towards trustworthy automation: User interfaces that convey internal and external awareness. In Proceedings of the 2016 IEEE 19th International Conference on Intelligent Transportation Systems (ITSC), Rio de Janeiro, Brazil, 1–4 November 2016; IEEE: New York, NY, USA, 2016; pp. 682–688. [Google Scholar]
- Petersen, L.; Robert, L.; Yang, X.J.; Tilbury, D.M. Situational awareness, drivers trust in automated driving systems and secondary task performance. arXiv 2019, arXiv:1903.05251. [Google Scholar]
- Gold, C.; Lorenz, L.; Bengler, K. Influence of automated brake application on take-over situations in highly automated driving scenarios. In Proceedings of the FISITA 2014 World Automotive Congress, Maastricht, The Netherlands, 2–6 June 2014. [Google Scholar]
- Gold, C.; Damböck, D.; Lorenz, L.; Bengler, K. “Take over!” How long does it take to get the driver back into the loop? In Human Factors and Ergonomics Society Annual Meeting; Sage Publications: Los Angeles, CA, USA, 2013; Volume 57, pp. 1938–1942. [Google Scholar]
- Radlmayr, J.; Gold, C.; Lorenz, L.; Farid, M.; Bengler, K. How traffic situations and non-driving related tasks affect the take-over quality in highly automated driving. In Human Factors and Ergonomics Society Annual Meeting; Sage Publications: Los Angeles, CA, USA, 2014; Volume 58, pp. 2063–2067. [Google Scholar]
- Kerschbaum, P.; Lorenz, L.; Bengler, K. A transforming steering wheel for highly automated cars. In Proceedings of the 2015 IEEE Intelligent Vehicles Symposium (iv), Seoul, Republic of Korea, 28 June–1 July 2015; IEEE: New York, NY, USA, 2015; pp. 1287–1292. [Google Scholar]
- Gold, C.; Körber, M.; Lechner, D.; Bengler, K. Taking over control from highly automated vehicles in complex traffic situations: The role of traffic density. Hum. Factors 2016, 58, 642–652. [Google Scholar] [CrossRef]
- Eriksson, A.; Stanton, N.A. Takeover time in highly automated vehicles: Noncritical transitions to and from manual control. Hum. Factors 2017, 59, 689–705. [Google Scholar] [CrossRef]
- Wan, J.; Wu, C. The effects of lead time of take-over request and nondriving tasks on taking-over control of automated vehicles. IEEE Trans. Hum. Mach. Syst. 2018, 48, 582–591. [Google Scholar] [CrossRef]
- Doubek, F.; Loosveld, E.; Happee, R.; de Winter, J. Takeover Quality: Assessing the Effects of Time Budget and Traffic Density with the Help of a Trajectory-Planning Method. J. Adv. Transp. 2020, 2020, 1–12. [Google Scholar] [CrossRef]
- Du, N.; Kim, J.; Zhou, F.; Pulver, E.; Tilbury, D.M.; Robert, L.P.; Pradhan, A.K.; Yang, X.J. Evaluating effects of cognitive load, takeover request lead time, and traffic density on drivers’ takeover performance in conditionally automated driving. In Proceedings of the 12th International Conference on Automotive User Interfaces and Interactive Vehicular Applications, Washington, DC, USA, 21–22 September 2020; pp. 66–73. [Google Scholar]
- Du, N.; Yang, X.J.; Zhou, F. Psychophysiological responses to takeover requests in conditionally automated driving. Accid. Anal. Prev. 2020, 148, 105804. [Google Scholar] [CrossRef]
- Scharfe-Scherf, M.S.L. How Are Eye Tracking Patterns in Takeover Situations Related to Complexity, Takeover Quality and Cognitive Model Predictions? In Intelligent System Solutions for Auto Mobility and Beyond: Advanced Microsystems for Automotive Applications 2020; Springer: Berlin/Heidelberg, Germany, 2021; pp. 161–176. [Google Scholar]
- Baldwin, C.L.; Coyne, M.T. Mental workload as a function of traffic density: Comparison of physiological, behavioral, and subjective indices. In Proceedings of the Driving Assesment Conference, Manchester, UK, 26–29 June 2003; University of Iowa: Iowa City, IA, USA, 2003; Volume 2. [Google Scholar]
- Körber, M.; Gold, C.; Lechner, D.; Bengler, K. The influence of age on the take-over of vehicle control in highly automated driving. Transp. Res. Part F Traffic Psychol. Behav. 2016, 39, 19–32. [Google Scholar] [CrossRef]
- Feldhütter, A.; Gold, C.; Schneider, S.; Bengler, K. How the duration of automated driving influences take-over performance and gaze behavior. In Advances in Ergonomic Design of Systems, Products and Processes; Springer: Berlin/Heidelberg, Germany, 2017; pp. 309–318. [Google Scholar]
- Wu, Y.; Kihara, K.; Takeda, Y.; Sato, T.; Akamatsu, M.; Kitazaki, S. Effects of scheduled manual driving on drowsiness and response to take over request: A simulator study towards understanding drivers in automated driving. Accid. Anal. Prev. 2019, 124, 202–209. [Google Scholar] [CrossRef]
- Zhang, B.; De Winter, J.; Varotto, S.; Happee, R.; Martens, M. Determinants of take-over time from automated driving: A meta-analysis of 129 studies. Transp. Res. Part F Traffic Psychol. Behav. 2019, 64, 285–307. [Google Scholar] [CrossRef]
- Minderhoud, M.M.; Bovy, P.H. Extended time-to-collision measures for road traffic safety assessment. Accid. Anal. Prev. 2001, 33, 89–97. [Google Scholar] [CrossRef]
- Yan, Z.; Yang, K.; Wang, Z.; Yang, B.; Kaizuka, T.; Nakano, K. Time to lane change and completion prediction based on gated recurrent unit network. In Proceedings of the 2019 IEEE Intelligent Vehicles Symposium (IV), Paris, France, 9–12 June 2019; IEEE: New York, NY, USA, 2019; pp. 102–107. [Google Scholar]
- Van der Horst, A.R.A. A Time-Based Analysis of Road User Behaviour in Normal and Critical Encounters; Delft University of Technology: Delft, The Netherlands, 1991. [Google Scholar]
- Hogema, J.; Janssen, W. Effects of intelligent cruise control on driving behaviour: A simulator study. In Proceedings of the Intelligent Transportation: Realizing the Future Abstracts of the 3rd World Congress on Intelligent Transport Systems, Orlando, FL, USA, 14–18 October 1996. [Google Scholar]
- Qu, X.; Kuang, Y.; Oh, E.; Jin, S. Safety evaluation for expressways: A comparative study for macroscopic and microscopic indicators. Traffic Inj. Prev. 2014, 15, 89–93. [Google Scholar] [CrossRef]
- Meng, Q.; Qu, X. Estimation of rear-end vehicle crash frequencies in urban road tunnels. Accid. Anal. Prev. 2012, 48, 254–263. [Google Scholar] [CrossRef]
- Jin, S.; Qu, X.; Wang, D. Assessment of expressway traffic safety using Gaussian mixture model based on time to collision. Int. J. Comput. Intell. Syst. 2011, 4, 1122–1130. [Google Scholar]
- Harbluk, J.L.; Noy, Y.I.; Trbovich, P.L.; Eizenman, M. An on-road assessment of cognitive distraction: Impacts on drivers’ visual behavior and braking performance. Accid. Anal. Prev. 2007, 39, 372–373. [Google Scholar] [CrossRef] [PubMed]
- Lee, J.; Yang, J.H. Analysis of driver’s EEG given take-over alarm in SAE level 3 automated driving in a simulated environment. Int. J. Automot. Technol. 2020, 21, 719–728. [Google Scholar] [CrossRef]


| Number | Modality of Takeover Request (TOR) | Lead Time of Takeover Request (TORlt) | Traffic Conditions | Number | Modality of TOR | TORlt | Traffic Conditions |
|---|---|---|---|---|---|---|---|
| 1 | A (auditory waring) | 5 s | complex | 5 | A+V (auditory and visual waring) | 5 s | complex |
| 2 | A | 5 s | simple | 6 | A+V | 5 s | simple |
| 3 | A | 7 s | complex | 7 | A+V | 7 s | complex |
| 4 | A | 7 s | simple | 8 | A+V | 7 s | simple |
| The Dependent Variable | Factors | Test 1 | Test 2 | Statistics |
|---|---|---|---|---|
| TOrt | TORlt | () = 0.054, = 0.004, = 0.246, | Mann-Whitney U | U = 17,506, = 0.031 |
| traffic condition | () = 0.078, = 0.005, = 0.246, | Mann-Whitney U | U = 17,475, = 0.029 |
| The Dependent Variable | Factors | Test 1 | Test 2 | Statistics |
|---|---|---|---|---|
| ApEn of Steering wheel Angle | traffic condition | = 0.0002 = 0.2000 = 0.008 | Mann-Whitney U | U = 17,562, = 0.035 |
| ApEn of accelerator pedal torque | TORlt | () = 0.089, = 0.102, = 0.124 | ANOVA | F = 13.509, = 0.00027 |
| traffic condition | = 0.015 = 0.291 = 0.241 | Mann-Whitney U | U = 14,722, = 0.000005 | |
| TORlt * 1 modality of TOR * traffic condition | = 0.081 = 0.097 = 0.241 = 0.031 = 0.081 = 0.097 = 0.241 = 0.041 = 0.001 | Scheirer-Ray-Hare test | H = 6.311, = 0.012 | |
| ApEn of brake pedal torque | TORlt | () = 0.120, = 0.079, = 0.251 | ANOVA | F = 4.20, = 0.041 |
| traffic condition | = 0.078 = 0.200 = 0.089 | ANOVA | F = 6.70, = 0.010 |
| Action | Turn Steering Wheel (s) | Brake (s) | Accelerate (s) | Change Lane (s) |
|---|---|---|---|---|
| The timing | 1.672 | 0.430 | 4.005 | 8.034 |
| The Dependent Variable | Factors | Test 1 | Test 2 | Statistics |
|---|---|---|---|---|
| Mean longitudinal velocity | traffic condition | = 0.029 = 0.251 = 0.058 | Mann-Whitney U | U = 17,240, = 0.017 |
| TORlt * traffic condition | = 0.232 = 0.094 = 0.067 = 0.121 = 0.076 | MANOVA | F = 4.380, = 0.037 | |
| Mean of longitudinal acceleration | TORlt | = 0.102, = 0.059, = 450 | ANOVA | F = 6.890, = 0.009 |
| traffic condition | = 0.130 = 0.045 = 0.063 | Mann-Whitney U | U = 15,907, = 0.0004 | |
| Standard deviation of longitudinal acceleration | TORlt * traffic condition | = 0.104 = 0.097 = 0.065 = 0.060 = 0.102 | MANOVA | F = 5.060, = 0.025 |
| The Dependent Variable | Factors | Test 1 | Test 2 | Statistics |
|---|---|---|---|---|
| Lane changing speed | TORlt | = 0.047 = 0.089 = 0.024 | Mann-Whitney U | U = 16,934, = 0.008 |
| The Dependent Variable | Factors | Test 1 | Test 2 | Statistics |
|---|---|---|---|---|
| Lateral Cross-border risk | TORlt * modality of TOR | = 0.320 = 0.102 = 0.132 = 0.200 = 0.117 | MANOVA | F = 4.686, = 0.031 |
| Longitudinal collision risk | traffic condition | = 0.042 = 0.070 = 0.025 | Mann-Whitney U | U = 17,096, = 0.012 |
| TORlt * modality of TOR | = 0.081 = 0.097 = 0.241 = 0.191 = 0.078 | MANOVA | F = 6.530, = 0.011 |
Disclaimer/Publisher’s Note: The statements, opinions and data contained in all publications are solely those of the individual author(s) and contributor(s) and not of MDPI and/or the editor(s). MDPI and/or the editor(s) disclaim responsibility for any injury to people or property resulting from any ideas, methods, instructions or products referred to in the content. |
© 2023 by the authors. Licensee MDPI, Basel, Switzerland. This article is an open access article distributed under the terms and conditions of the Creative Commons Attribution (CC BY) license (https://creativecommons.org/licenses/by/4.0/).
Share and Cite
Yang, W.; Wu, Z.; Tang, J.; Liang, Y. Assessing the Effects of Modalities of Takeover Request, Lead Time of Takeover Request, and Traffic Conditions on Takeover Performance in Conditionally Automated Driving. Sustainability 2023, 15, 7270. https://doi.org/10.3390/su15097270
Yang W, Wu Z, Tang J, Liang Y. Assessing the Effects of Modalities of Takeover Request, Lead Time of Takeover Request, and Traffic Conditions on Takeover Performance in Conditionally Automated Driving. Sustainability. 2023; 15(9):7270. https://doi.org/10.3390/su15097270
Chicago/Turabian StyleYang, Weida, Zhizhou Wu, Jinjun Tang, and Yunyi Liang. 2023. "Assessing the Effects of Modalities of Takeover Request, Lead Time of Takeover Request, and Traffic Conditions on Takeover Performance in Conditionally Automated Driving" Sustainability 15, no. 9: 7270. https://doi.org/10.3390/su15097270