1. Introduction
In general, tourism has an economic, social, and ecological impact over territorial dimensions, contributing to local development, where tourist service providers play a determining role in the success [
1,
2] worldwide, contributing to economic growth, employment, further investments, diminution of inequality, and protection of the environment [
3]. The sector of hospitality and tourism is one of the most prosperous sectors globally [
4,
5,
6]. Developed countries often support sustainable tourism investments in order to diversify, revitalize, or modernize the structure of their local economies [
1,
7,
8,
9]. Moreover, some consider domestic tourism a strategic tool against economic vulnerability in low- and lower-middle-income countries [
3]. However, several risk factors jeopardized the resilience of this industry in the first few decades of the 21st century [
10], such as the financial crisis of 2008 and the COVID-19 pandemic in the present day, inducing loss of revenues, dismissals, short-term suspension of business activities, and even permanent closure of entities [
11,
12], changing the territorial structure of local economies. Nevertheless, economic recessions and pandemics often generate longer-term downturns in multiple area of economies [
13,
14], the former often showing extended recovery processes in contrast to the latter, which usually is followed by a V-shaped growth pattern [
13], as is best perceived for Europe and the Middle East but also for others regions, with more moderate tendencies, according to the UNWTO (2023) for the case of COVID-19. However, the question arises whether the impact of the pandemic will contribute to further improvement of strategical planning in the field of the resilience of tourism, as this was not the case after several crises [
11,
15,
16].
The determining role of tourism is undoubtable for Europe, which has been shown by statistical data on tourism by the UNWTO [
17,
18], with dynamically growing tendencies of international tourism indexes for 1990–2007 and 2009–2019. The region of Central/Eastern Europe has the lowest share of international-tourism receipts and the second lowest number of international-tourist arrivals, although it showed remarkable improvement in the last three decades before the pandemic. Romanian tourism, as part of the beforementioned region, faced a 4% decrease in the case of international-tourist arrivals in 2019, with 2,684,000 persons, in comparison to the previous year, but a 5.18% increase in the case of international-tourism receipts, with USD 3.576 billion. Nevertheless, the country had 1.76% share of arrivals and 5.21% share of receipts within the region [
18].
Romanian tourism has already faced several challenges in the last 30 years, although it has shown major improvement, especially in the last decade, which has also affected the sector of hospitality. After the transition from a centralized economy to a market economy with the change of political regime in 1989, the prolonged legislation and implementation of reforms regarding privatization contributed to a protracted systematic crisis. Despite the increase in number and quality of the tourism supply, in regard to the structure of accommodation, the demand drastically fell [
2]. The main demand of tourism consisted of domestic tourists, with 88.4% in 1990, i.e., 10,864,891 tourist arrivals [
19]; furthermore, the economic regression and instability increased unemployment and reduced purchasing power. Therefore, besides a reduction in international arrivals, domestic tourism faced a major decline [
2], with a 41.97% decrease in 1995 and a 62.69% decrease in 2000 compared to the number of domestic tourists in 1990. The total number of tourist arrivals within the same period showed a decrease of 42.5% in 1995 and 59.99% in 2000 compared to 1990. In addition, those values did not recover until 2018, with a period of drawback in 2009–2011 after the financial crisis [
19], although overnight stays still remained below the values of 1990, at 35.7% in 2018 [
20]. In the case of classic destinations of the country, for instance, the seaside, which possessed the outdated superstructure of the 1990s with poor quality and uncompetitive prices of services, the demand reduced. Nevertheless, at the same time other types of domestic destinations positioned themselves, including in the field of rural tourism and in the case of mountain areas, with an expansion of the number of boarding houses, mainly tourist and agrotourism pensions, which also contributed to the sustainable development of tourism in general.
Within this unfavorable complex national framework [
1,
2], the tourist trends of Bihor County more or less followed the national trends, with the domination of domestic tourists at over 80% during the last three decades. Tourist arrivals suffered fluctuating trends and only in 2018 achieved and exceeded the values of 1990 with 9.65% and in 2019 with 7.95% in comparison to 1990 [
19]. Regarding overnight stays, the total stays also remained below the values of 1990 in 2019 for Bihor, in worse degree than in case of the country, which summed up to 36.44% decrease [
20]. According to evaluation of statistical data on the accommodation structure of Bihor, similarly, the tourist and agrotourism pensions faced an intentional increase in number after 2010 [
21], although these types have the least capacity per entity in general [
22].
As far as the recent pandemic is concerned, COVID-19 caused a loss of approximately EUR 3.945 trillion, which was a 49.06% decrease in total contribution of travel and tourism to the global GDP and a loss of 62 million jobs worldwide in 2020 compared to 2019 [
23]. Moreover, businesses in the hospitality industry were some of the most affected economic actors not only in China and throughout Asia but also in the United States and throughout North and Latin America and Europe given the fast-paced expansion and evolution of the pandemic [
12,
14,
24,
25,
26] and the restrictions that were widely applied [
16]. In the case of Romania, COVID-19 caused a drop of 55.48% in the contribution of tourism to GDP and 16,200 redundancies [
23] that affected the examined hospitality sector of Bihor County [
27]. In comparison to 2019, Bihor County faced a 51.04% decrease, with 264,726 tourist arrivals, and a 52.88% decrease in overnights stays, with 729,449 nights in 2020, which was the lowest number within 2005–2021. The year 2021 showed an increase compared to the previous year of 58.79% and 420,351 tourist arrivals and of 57.36% and 1,147,854 overnight stays, although it still did not reach pre-pandemic values [
28,
29]. Regarding the turnover of hotel and restaurant enterprises, the latest statistics were for 2020. At the level of Bihor County there was a constant improvement in turnover in 2014–2019 and the sector faced a 34.72% decrease with a RON 534 million total turnover in comparison to 2019, when it reached RON 818 million [
29]. As far as the average annual number of employees is concerned in the sector of hotels and restaurants, Bihor County had a higher decrease in 2020, with 16.07%, than at the national and regional levels, which were between 9 and 10%, in comparison to 2019 [
30].
In order to explore the territorial characteristics of the developing sector of tourism within Bihor County, the structure of functioning accommodation and food-and-beverage service suppliers has to be analyzed on the level of localities. Herman et al. studied the characteristics of entities within the superstructure in Bihor but not on the level of activity type of superstructure, and they examined firms in other territories [
1]. On the one hand, the location of the above-mentioned tourism businesses defines the possibilities of exploitation of tourism resources, providing basic criteria for territories to become destinations [
27] and enabling consumption and overnight stays. On the other hand, these types of service providers traditionally are SMEs [
12,
31] that are usually financed and coordinated by the local population, so their job and further income-creation ability is more highlighted for areas where other kind of economic activities are limited or do not exist [
27]. Moreover, the importance of tourism development is highlighted by several strategies both in developed and in developing countries with emerging economies [
4], as well as in the case of Romania, and in Bihor County within it, promoting the sustainable development of areas with high tourist potential [
15,
32].
In this regard, following the literature review of the basic conceptual framework of dependence of territorial tourism development on the network of infra- and superstructure, the present paper firstly discusses the territorial aspects of Bihor County alongside the presentation of the main research methods according to the key research questions, which were the following: What are the main territorial characteristics of the primary superstructure of tourism service providers within the target area and to what extent were their turnover and efficiency affected by the financial crisis and COVID-19? Therefore, the following parts of the study contain the principal characteristics of accommodation and food-and-beverage service providers by a territorial division of turnover and the average annual number of employees on the level of the LAU between the years of 2005 and 2020. Afterwards, with the use of the method of the Hoover index, the territorial inequalities of the turnover of firms were investigated in terms of the population of the LAU, then aggregated on the level of Bihor. Moreover, to measure the efficiency of the studied service providers by their turnover on the average annual number of employees, the method of the Hoover index was used.
2. Literature Review—Links between Territorial Development and the Network of Infra- and Superstructure on Touristic Destinations
As far as the interpretation of infrastructure is concerned, in the case of territorial and, more specifically, tourism development, different angles of research exists. Basic infrastructural conditions are necessary for a qualitative standard of living, containing the technical supply of physical structures and assets that also enable the proper operation of the production sector and service providers, supporting the whole society at the same time. Public infrastructure traditionally refers to the wide range of transport infrastructure, information-communication technology infrastructure, energy and power generation and distribution facilities, water supply, and other kinds of public utilities. Some also list basic social services under the term of “infrastructure”, whereas others define it as concerning only the abovementioned physical structures [
33].
Furthermore, the concept of tourism infrastructure is also controversial in the literature. Although some include hospitality and recreational assets within the concept of tourism infrastructure [
33,
34,
35,
36,
37,
38,
39,
40], others distinguish the concepts of tourism infrastructure and tourism superstructure [
31,
41,
42,
43,
44]. Following the latter division, tourism infrastructure consists of all physical conditions and structures that enable access to tourism resources and their exploitation and marketability, such as transportation and utilities [
41]. Other services such as healthcare and security also belong here. Although its use is traditionally shared by both tourists and inhabitants and is unlikely to generate income, its development tends to be treated as an investment in the public sector [
31]. The term “tourism superstructure” was created by the Swiss researcher Claude Kaspar [
45], and the phrase concerns any profit-generating activity within a destination that belongs to the private sector in general [
31]. It is divided in two main categories: primary and secondary tourism superstructure. The former consists of accommodation and food-and-beverage service suppliers, which are considered a basic factor because they enable the consumption and overnight stays of tourists. The latter contains retailers, built attractions, and other related services [
45].
Outstanding gross investments in the North-West region were implemented that concerned tourism development receiving non-refundable aid from the European Regional Development Fund (ERDF), which were focused mostly on supporting the improvement of primary superstructure and accommodation and food-and-beverage service providers. At the regional level, Bihor County was the first in the case of gross investments in hotels and restaurants from ERDF aid within the 2007–2013 programming period [
34] and was in competition for first place with Cluj County in terms of overall net investments in the sector for 2005–2020 [
46]. Although investing only in the capacity expansion of primary superstructure within a destination does not exclusively mean an indubitable increase in the number of tourists [
33], the quality of services is also not negligible in terms of competitiveness.
The territorial development of tourism is highly dependent on national and international increases in competition based on valuable attractions and tourism resources, on sustainable strategic planning and integrated marketing activities [
38,
47], and on the quality of tourism-related services. Moreover, the tourism industry is facing several challenges due to the effects of the global economic crisis, the negative impact generated by climate change, the phenomenon of seasonality [
39], and the pandemic crisis, which has become one of the most pressing socioeconomic issues of today, with mobility restrictions and unexpected regulations over the tourism business environment [
12].
Although several studies have examined different angles of the impact of COVID-19 on the primary superstructure of tourism [
11,
12,
14,
16,
24,
25,
26], the present study aims to provide a detailed overview of the characteristics of a specified local level regarding territorial dimensions of accommodation and food-and-beverage service providers within the framework of two determining periods for Romania: the financial crisis and COVID-19. Furthermore, the alternative use of the broadly applicable Hoover index [
48,
49,
50,
51], not only for measuring territorial inequalities of turnover of examined firms on the proportion of population but also as an indicator of efficiency, presented below, could also be perceived as a contribution to the existing literature.
3. Method and Analysis
The studied area is Bihor County, which is situated in the North-West Development Region of Romania, bordering Hungary on its western side [
1,
15,
32], and in the international geographical context it is located in the central part of the Carpathian Basin [
52] in the contact zone of the morphological units of the Apuseni Mountains [
4] and of the Western Plain [
1], which extends westward towards the Pannonian Plain [
15,
32]. This administrative territory includes 3.2% of the total area of the country with 7539 km
2; thus, in terms of extent, it is fifth in the national ranking of countries [
15]. Bihor consists of 91 communes, six towns, and four municipalities, with Oradea as the county seat. In this matter there are 101 local governments in total. The population of the county is 616,264 inhabitants, according to data from 2020, and the density of the population is 81.7 inhabitants/km
2 [
53].
Bihor County has diversified and valuable tourism resources [
7,
27,
34,
40,
54,
55] within the region and at the national level, with a potential supply for tourists for all seasons of the year, although these are poorly exploited [
55]. Moreover, the central interest area of tourists is focused on Oradea and Sânmartin [
28,
56] as the county’s traditional supply of tourism services. Therefore, the focus area of the present research is Bihor County and the level of its local governments, which corresponds to the LAU level of the NUTS classification [
57]. The territories of the local governments were categorized into four main potential destination types based on their geographical location, tourism resources, and already-existing tourism activities, although these categories do not necessarily form a geographically coherent area, especially in the case of the urban-tourism type, but even Government Emergency Order No 142/2008 contains tourism resources for the level of local governments (OUG 142/2008, 2021), which also justifies the evaluation at the level of local administrative units. These categories are the following [
27] (the main data on the settlements can be found in
Appendix A):
Urban-tourism destination type—the county seat, municipalities, and local governments with urban status, with 10 local governments in total: Oradea, Beiuş, Marghita, Salonta, Aleşd, Nucet, Săcuieni, Ştei, Valea lui Mihai, and Vaşcău;
Health- and spa-tourism destination type—with thermal medical-water resources, spas, and other related services and specialized accommodation establishments, with five local governments in total: Chişlaz, Mădăras, Sânmartin, Sârbi, and Tinca;
Mountain-tourism destination type—based on altitude and proximity to mountain-tourism attractions, with 31 local governments in total: Aştileu, Auşeu, Borod, Bratca, Brusturi, Budureasa, Bulz, Bunteşti, Căbeşti, Cărpinet, Câmpani, Criştioru de Jos, Curăţele, Derna, Dobreşti, Finiş, Lunca, Măgeşti, Pietroasa, Pomezeu, Popeşti, Răbăgani, Remetea, Rieni, Roşia, Şinteu, Şoimi, Şuncuiuş, Tărcaia, Vadu Crişului, and Vârciorog;
Rural-tourism destination type—settlements located in the lowlands or hills, which are not the departure point of mountain-tourism routs, with 55 local governments in total: Abram, Abrămuţ, Avram Iancu, Balc, Batăr, Biharia, Boianu Mare, Borş, Buduslău, Căpâlna, Cefa, Ceica, Cetariu, Cherechiu, Ciumeghiu, Cociuba Mare, Copăcel, Curtuişeni, Diosig, Drăgăneşti, Drăgeşti, Gepiu, Girişu de Criş, Hidişelu de Sus, Holod, Husasău de Tinca, Ineu, Lăzăreni, Lazuri de Beiuş, Lugaşu de Jos, Nojorid, Olcea, Oşorhei, Paleu, Pocola, Roșiori, Săcădat, Sălacea, Sălard, Sâmbăta, Sâniob, Sânnicolau Roman, Sântandrei, Şimian, Spinuş, Suplacu de Barcău, Tămăşeu, Tarcea, Tăuteu, Ţeţchea, Tileagd, Toboliu, Tulca, Uileacu de Beiuş, and Viişoara.
Based on the main research question, the following hypotheses were formulated regarding the target area:
H1: The primary superstructure of Bihor County is aligned with the traditionally known tourist destinations; therefore, it is concentrated within Oradea and Sânmartin.
H2: Indicators of territorial inequalities of the primary superstructure of Bihor County showed increasing trends within the examined periods of the financial crisis and COVID-19.
H3: The examined periods of crisis mainly affected the primary superstructure of rural areas, causing a decline in the main indexes.
In order to answer the research question presented in the introduction and to investigate the abovementioned hypotheses, the following methods of data collection and analysis were used. The collection and evaluation of data relied on desk research, firstly, based on the statistics of the Romanian National Institute of Statistics (RNIS) to examine the trends of the main indicators, and secondly, based on data from the Ministry of Public Finance and Lista Firmelor din România (Listafirme.ro), which contain financial and other detailed information about existing enterprises on the level of Bihor County and the LAU of the county for the period of 2005–2020 that were established and active in Romania until 30 June 2021. Two of our own datasets were created with the inventory of businesses within Bihor County in accordance to NACE codes and the location of the enterprises, one for businesses with NACE code 55—Accommodation and the other with the NACE code 56—Food-and-Beverage Service Activities, both of which were divided into subcategories within their classes. The collected information contained the name, location, date of establishment, NACE code, turnover, and average annual number of employees of the enterprises. The dataset was integrated with four additional online databases in the case of incomplete details: Lista-Firme-Romania (ListaFirmeRomania, 2021), Risco (Risco, 2021), Termene (Termene, 2021), and Totalfirme (Totalfirme, 2021). The period of data collection was from 20 September 2020 to 30 June 2021. As a result, 385 accommodation service providers and 1066 food-and-beverage service providers were found to be active businesses. The examined entities were established in the period of 1989–2020.
Furthermore, the multidimensional territorial distribution of the examined type of enterprises was analyzed, evaluated, and visualized on the level of local governments within Bihor County using cartographical methods in ArcGIS 10.4.1 mapping software. Subsequently, the widely used method of the Hoover index [
43,
44,
45,
46] was used firstly for the measurement of the territorial concentration of both types of enterprises, which enabled the evaluation of territorial inequalities based on the turnovers and populations of the local governments projected to Bihor County. Secondly, the Hoover-index method was used as an efficiency indicator of the businesses considering their turnover and the average annual number of employees at the county level. The use of the abovementioned, uniquely determined, alternative variants of the widely used Hoover index over other methods of analysis regarding territorial concentration is justified by the simplicity and comprehensibility of the methodology that easily enabled the replacement of factors, thus providing the opportunity for alternative interpretations, as well as the ability to collate the results within the examined timeframe. Furthermore, in the case of the examination of territorial concentration by the Hoover index, the use of the population number on the level of the LAU as a parameter of dimension contributed to the comparability of localities, eliminating the effects of distortion caused by differences in extents of localities.
4. Results and Discussion
4.1. A Brief Analysis of the General Statistics of Accommodation Establishments within Bihor County Considering the Trends of the Financial Crisis and COVID-19 Pandemic
Regarding the development of tourist-accommodation structures based on the database of the RNIS (2022), 278 registered lodging entities were present in 45 local governments of Bihor County in 2021, which showed a 1.77% decrease in the total number of businesses in comparison to 2020 and an 8.59% increase in comparison to 2019. The territorial distribution of lodging service providers improved in the last two years owing to the fact that 39 local governments were represented in 2019 but 45 appeared in the statistics in 2020 and 2021. In this regard, the dispersion of establishments covered 44.55% of the total number of local governments in comparison to 38.61% in 2019.
Table 1 contains the summary of the main indicators of the tourist-accommodation supply of the county for the period of 2005–2021.
A significant increase was registered in the number of tourist establishments in official statistics in the examined period of 2005–2021, with 227.06% growth, although the number of bed places showed only 36.81% growth due to the fact that a significant improvement in number was measured in the case of agro-tourist boarding houses, a type that had the lowest capacity per entity. Two periods can be highlighted with an exponential rise in number of establishments, between 2008–2012 and 2014–2018. Consequently, the impact of the financial crisis of 2008 manifested in a reduction in capacity of existing enterprises and in the appearance of new entities with moderate capacity. In the case of the impact of COVID-19, a higher number of enterprises was present than before the pandemic, with a constant increase in capacity.
The tourist-accommodation capacity in function was characterized by strong seasonality that mainly highlighted the interval of May–October, with August as the outstanding month; moreover, there was an exponential increase in multi-annual perspective in 2014–2017 and a stagnation of capacity in function in 2018–2019. In the case of this indicator, the lowest number was measured after the financial crisis, in 2009, which showed a 10.67% decrease in comparison to 2008, although in 2020, this indicator was the third lowest within the examined period, generating a retrogression of 31.58% due to epidemiological restrictions in comparison to 2019. Furthermore, 2021 showed a 36.2% improvement in comparison to 2020, although this value was still below that of the annual capacity in function of 2016.
The highest value of the index of net usage of tourist-accommodation capacity in function was measured in the period of 2006–2008. The post-crisis years were characterized by a fluctuation of the trends, but 2019 was an outstanding year in this regard. The COVID-19 pandemic brought intense effects, generating the lowest values of net usage despite the decrease in capacity in function.
4.2. Territorial Division and Financial Characteristics of Tourist-Accommodation and Food-and-Beverage Service Suppliers
4.2.1. Tourist-Accommodation Service Providers
The total number of functioning tourist-accommodation service providers enumerated 385 entities in June 2021 in the territory of 71 local governments of Bihor County. The share of enterprises by NACE code was the following at the county level [
23]:
5510—hotels and similar accommodation, with 28.83%;
5520—holiday and other short-stay accommodation, with 43.12%;
5530—camping grounds, recreational-vehicle parks, and trailer parks, with 2.86%, although this category was not represented in national statistics in 2021;
5590—other accommodation, with 25.19%.
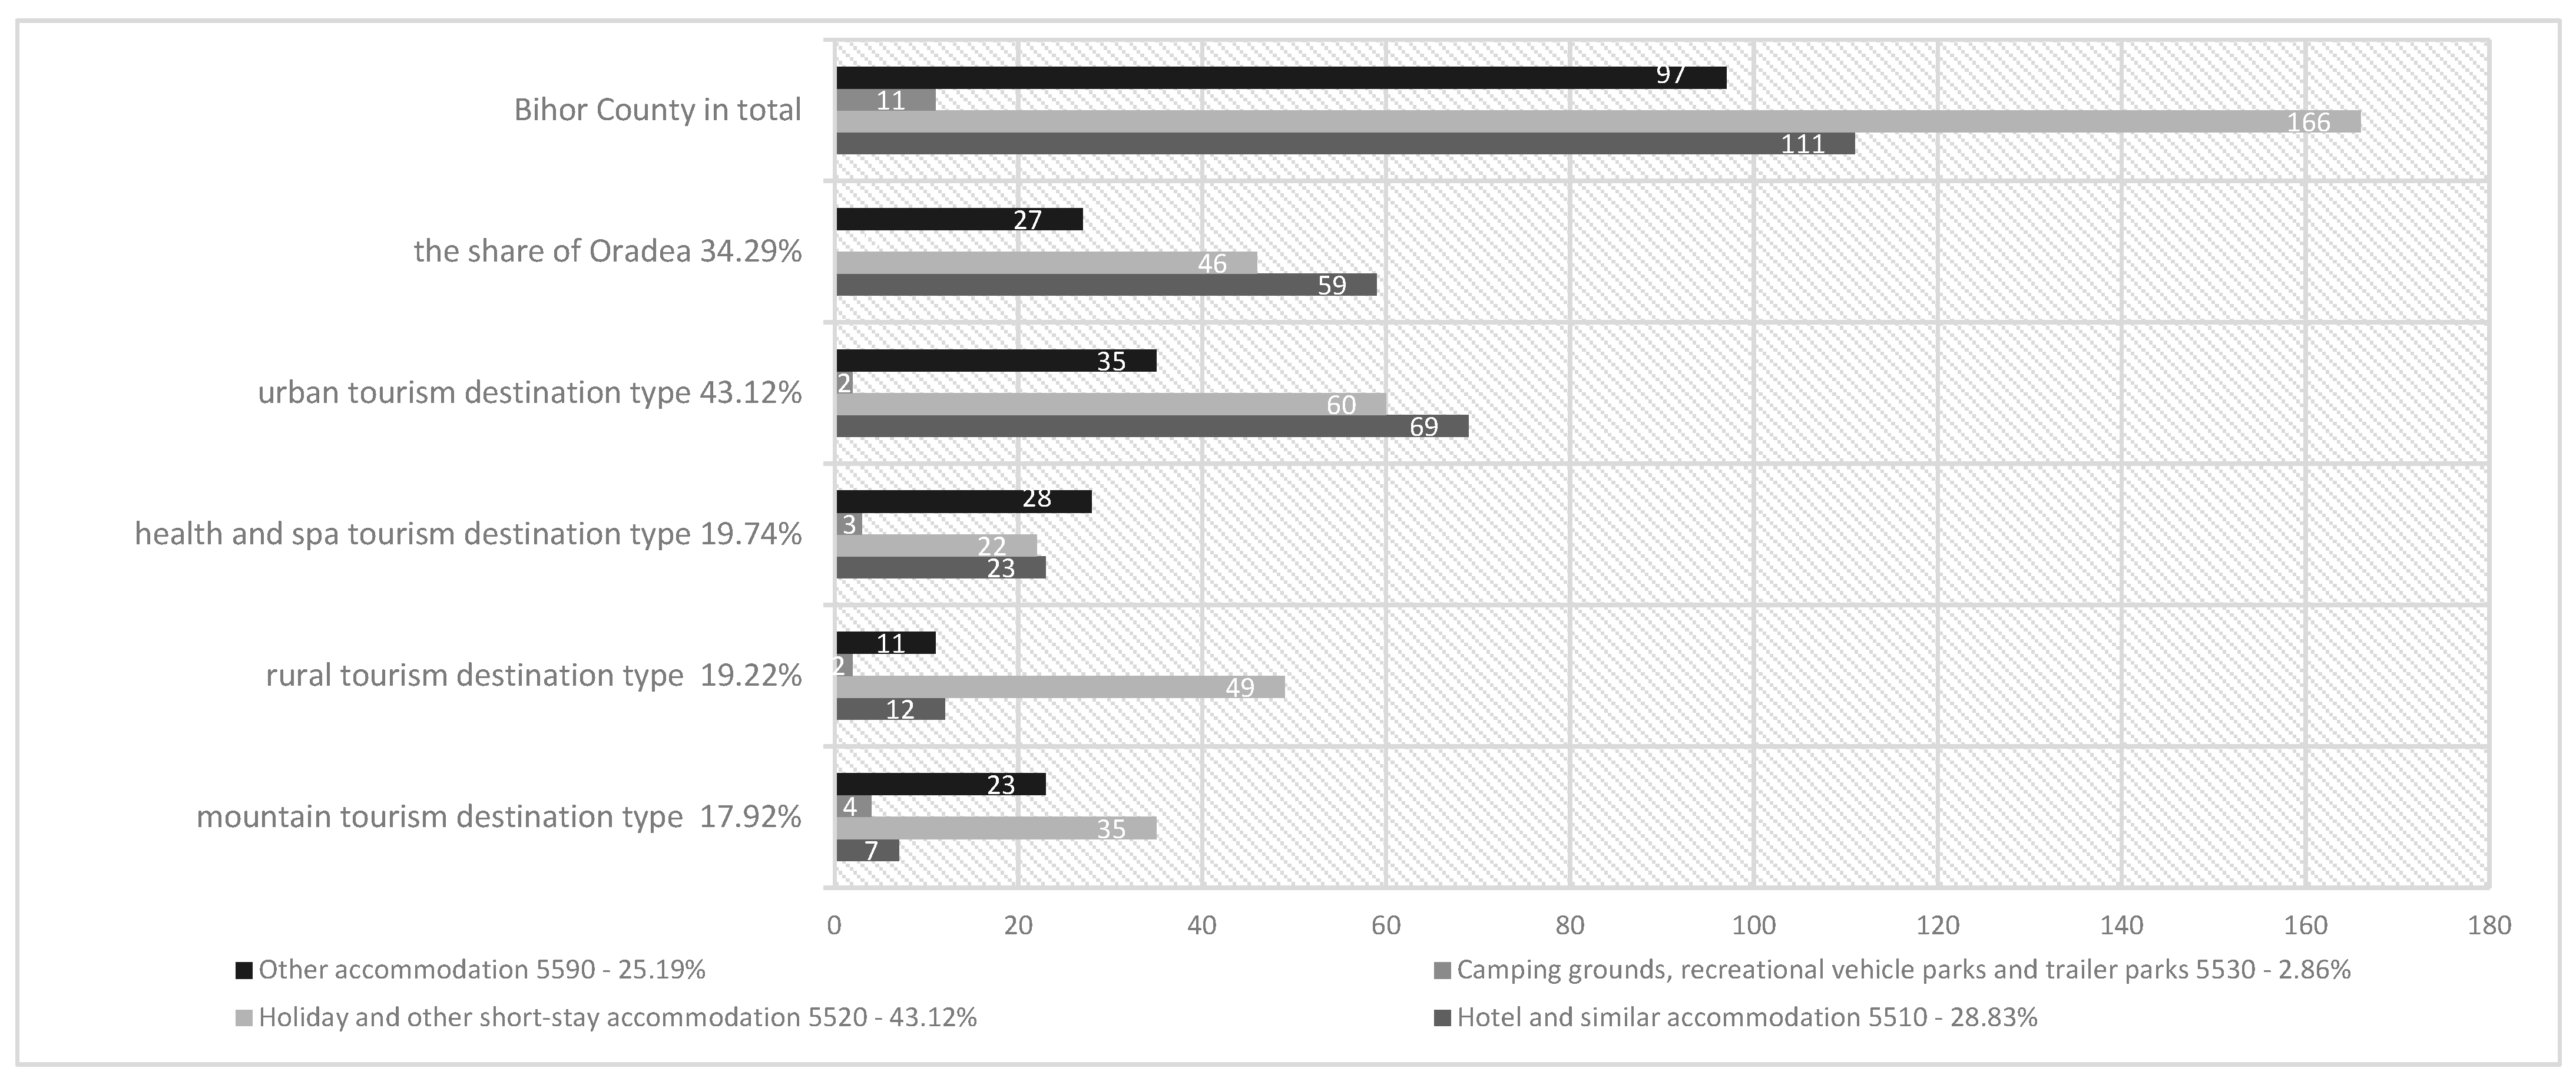
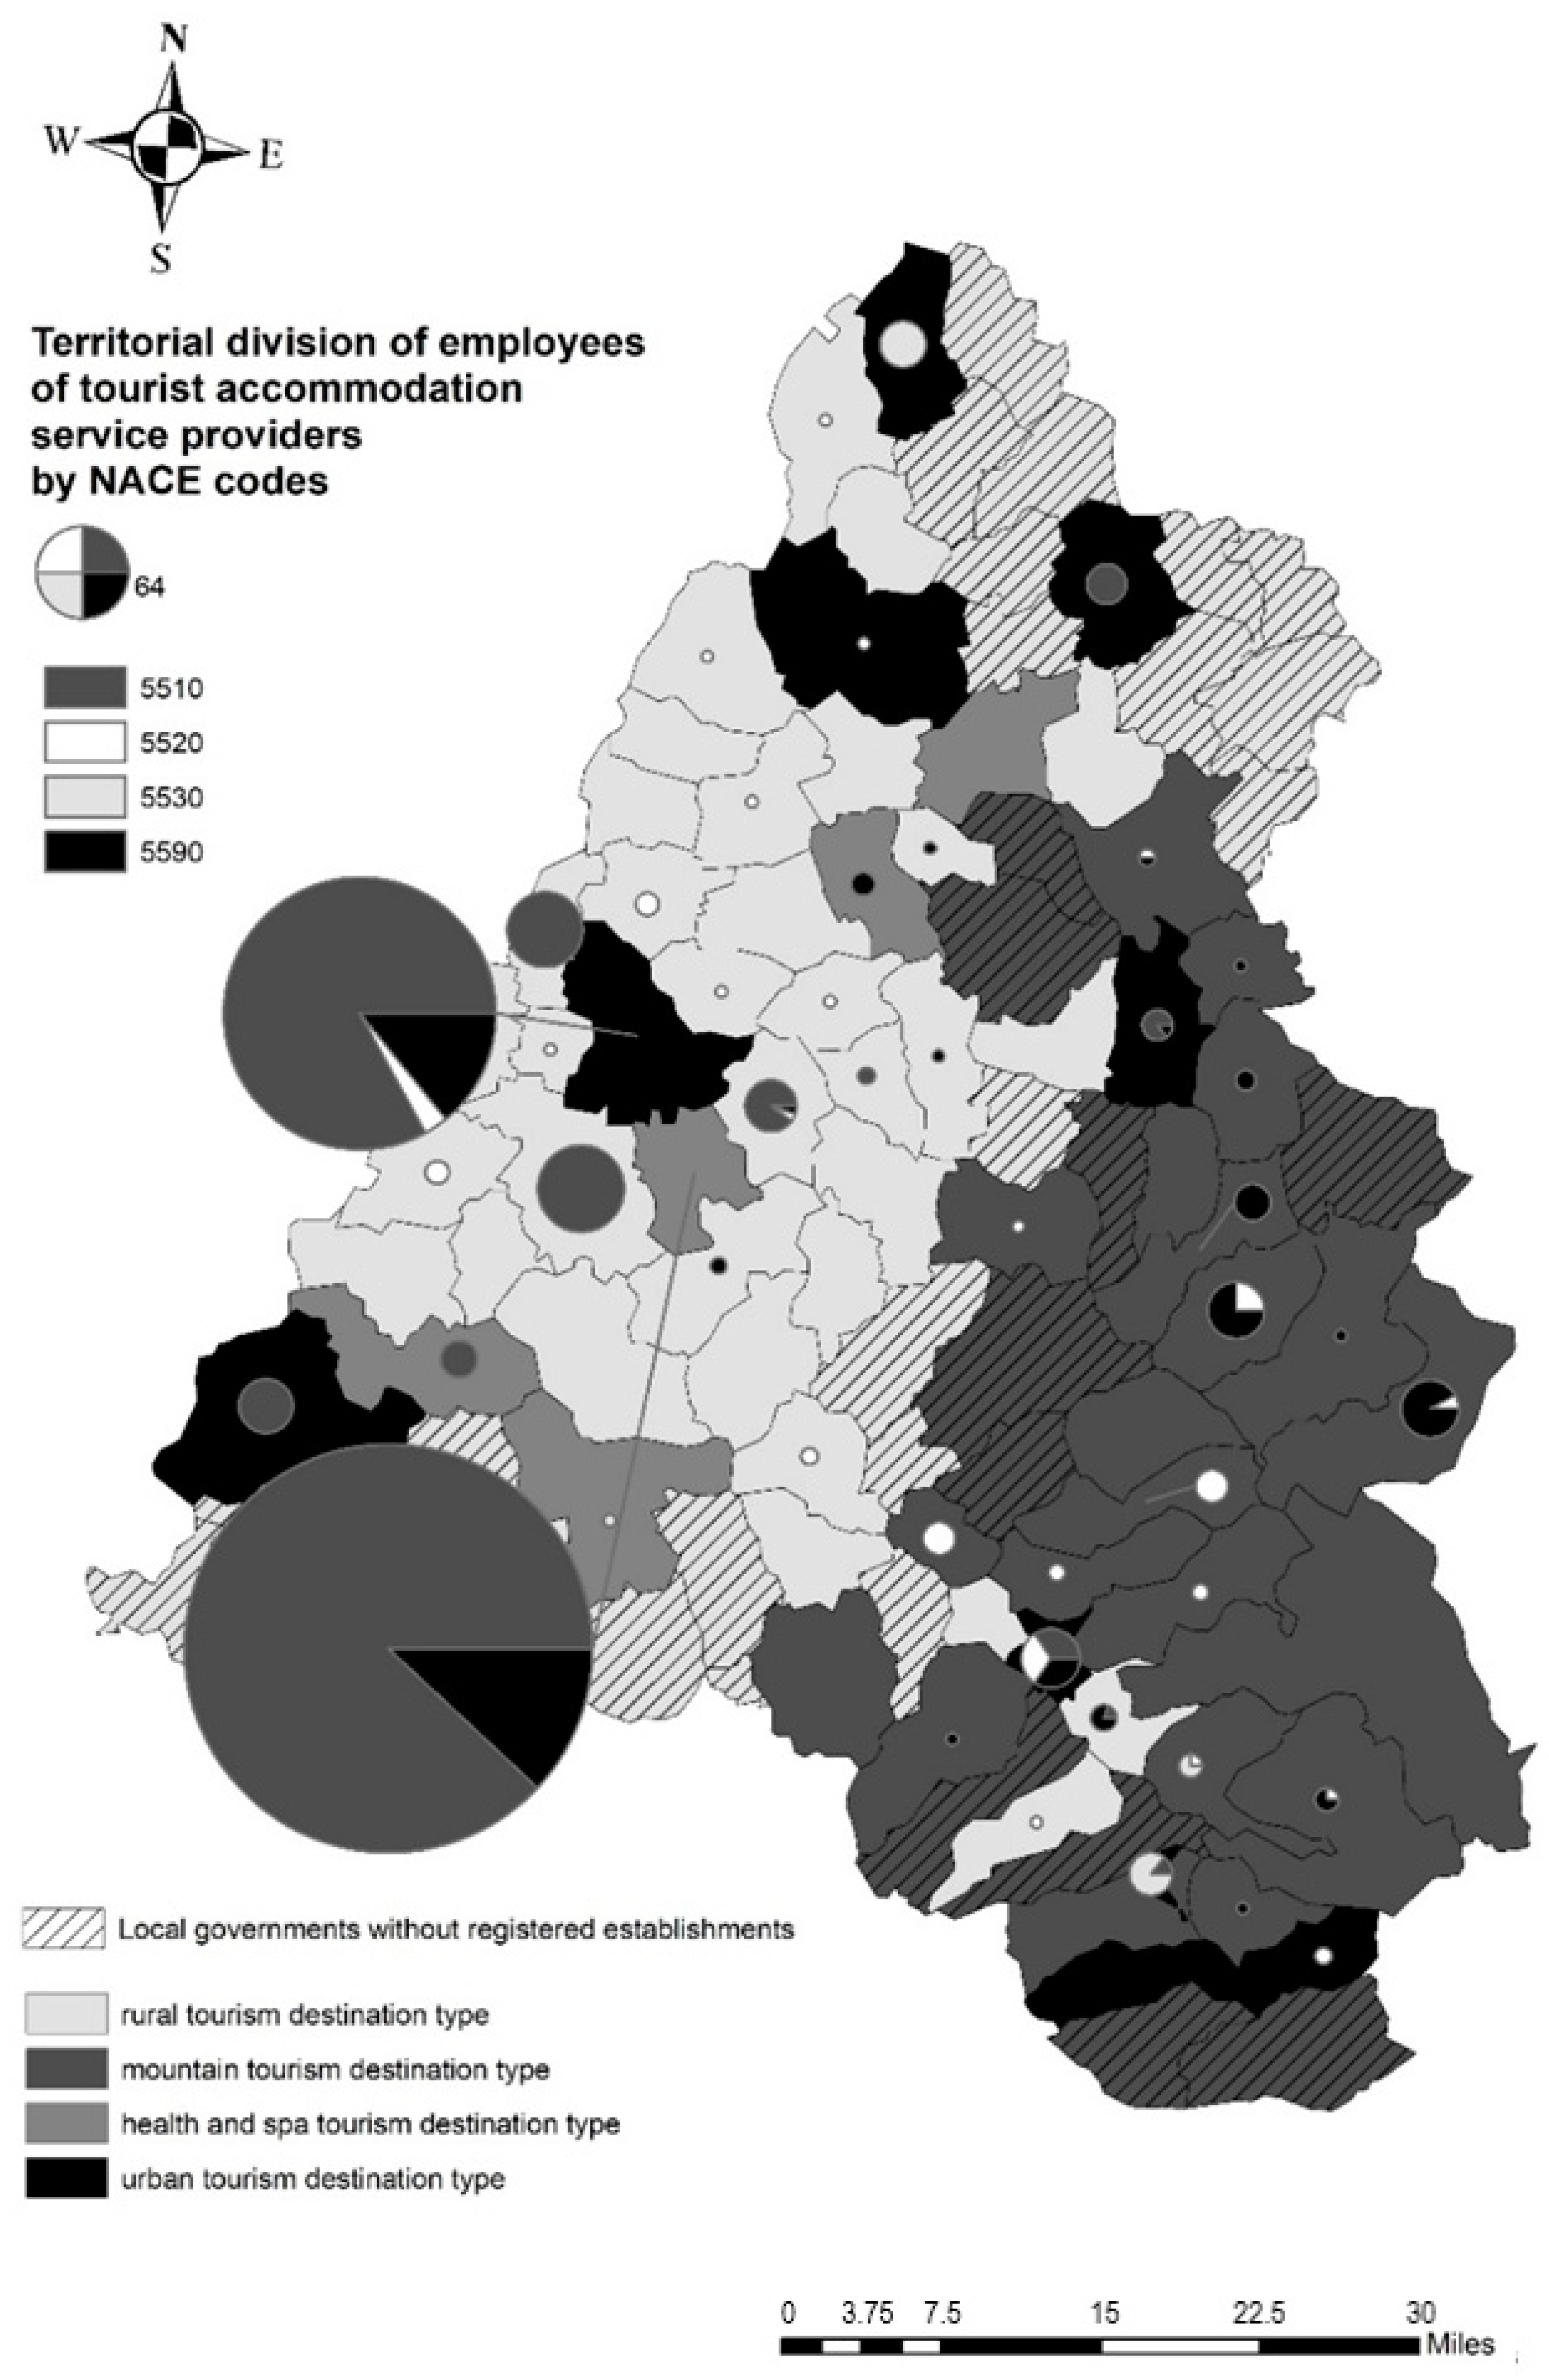
Figure 1 shows the division of types of lodging service providers at the level of potential destination categories, highlighting Oradea as the county seat and Bihor County in total.
The urban-tourism destination type comprised 43.12% of enterprises, with 166 entities, dominated by hotels and similar accommodations with NACE code 5510, and Oradea became an outlier, with 132 enterprises and 34.29% of entities at the county level and 79.52% at the destination category level. The following destination types had a more proportional division [
27]:
Health- and spa-tourism destination type—76 establishments, with a share of 19.74%, dominated by enterprises with NACE code 5510, although, except for category 5530, each lodging service type was almost equally represented, and Sânmartin, which encompassed two important and already-functioning tourist destinations—Băile Felix and Băile 1 Mai—owned 67 enterprises, which was 17.40% of the accommodation establishments at the level of Bihor County and 88.16% of entities within this tourism-destination type;
Rural-tourism destination type—74 enterprises, with a share of 19.22%, dominated by the 5520 type, a category that also contains tourist and agro-tourist boarding houses;
Mountain-tourism destination type—69 establishments, with a share of 17.92%, dominated by the 5520 and 5590 types due to their rural nature.
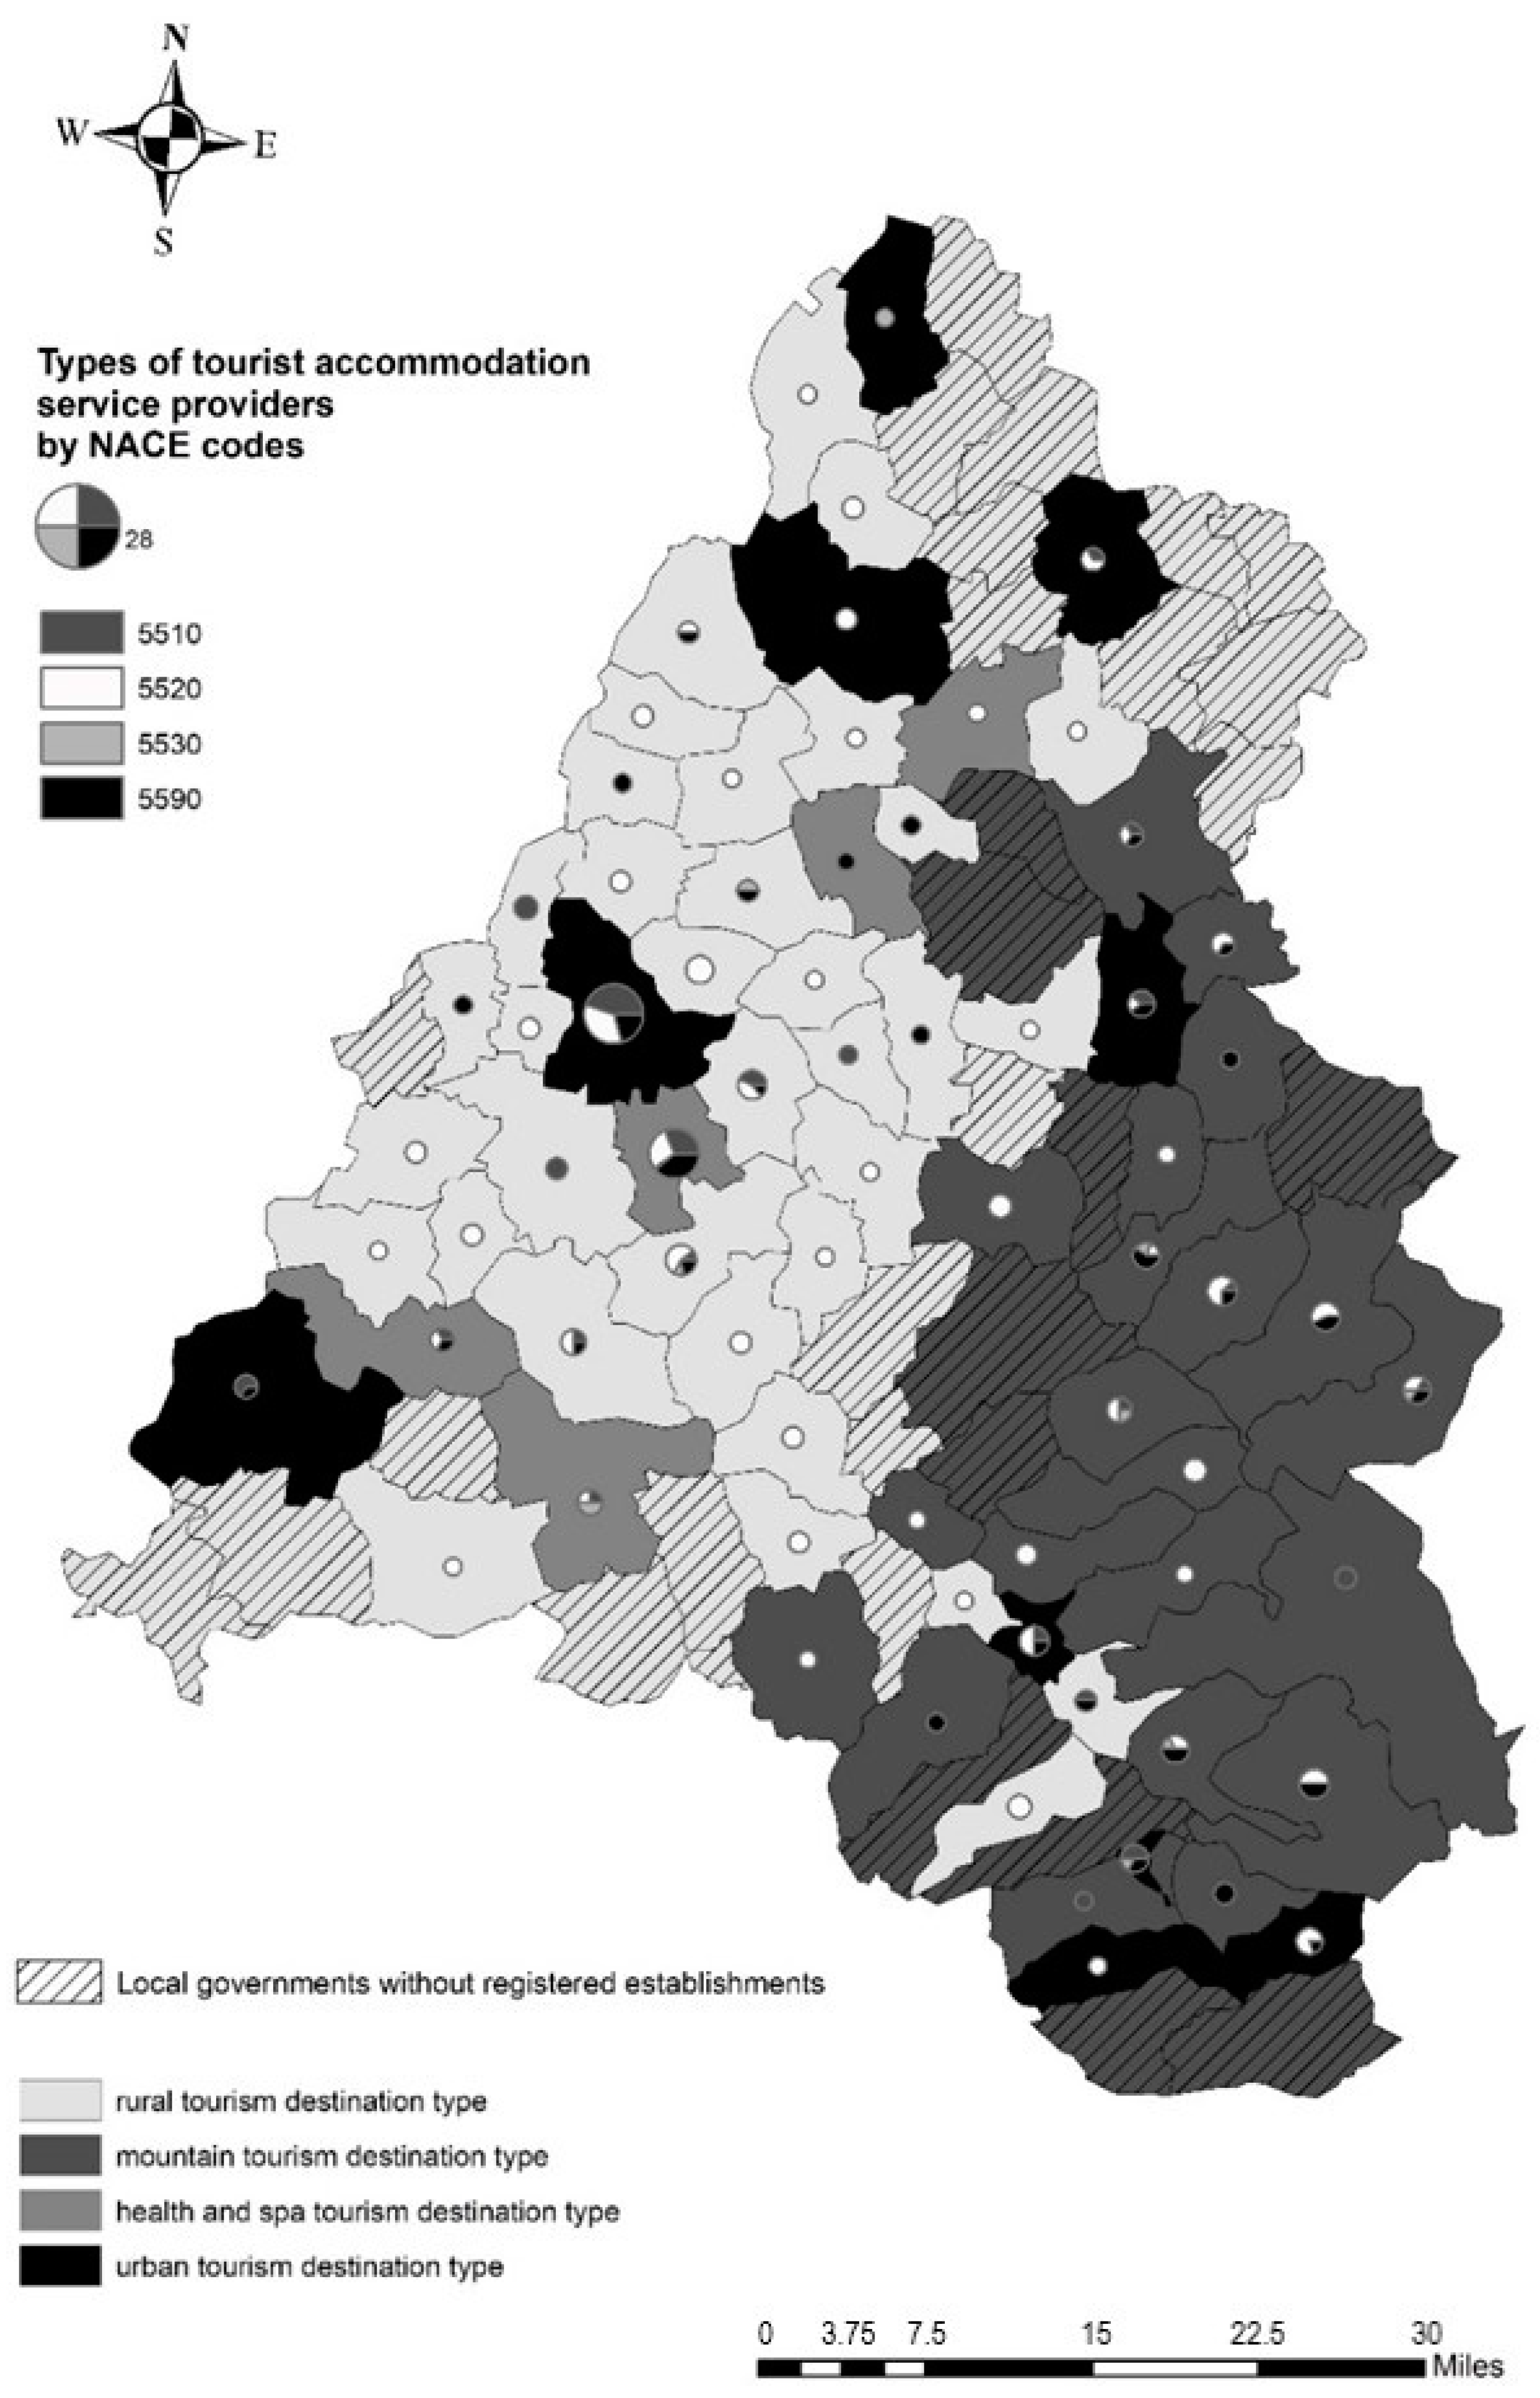
Figure 2 presents the territorial division of enterprises by NACE code, with pie charts in proportion to the number of entities, illustrating data on the level of both potential destination types and local governments. The dominance of Oradea and Sânmartin is represented by the size of the charts. In this regard, in the case of the provision of tourist-accommodation services, Oradea and its metropolitan area became a center area, but peripherical areas appeared along the northeastern and southern borderline of the county and the inner periphery alongside the transition area between the mountains and lowlands.
In the case of the urban-tourism destination type the ranking was as follows: Beiuș with eight, Ștei with six entities, Aleșd and Nucet with five, Marghita and Salonta with three, Săcuieni with two, and Valea lui Mihai and Vașcău with one entity. In the rural-tourism destination category only three local governments had more than five establishments: Hidișelu de Jos, Oșorhei, and Paleu. In the case of the mountain-tourism destination type Suncuiuș, Pietroasa, Bratca, Bunteșt, Bulz, and Vadu Crișului had from five to eight service providers.
As far as turnover of enterprises is concerned, at the level of Bihor it was RON 191,037,282 in 2020, which showed a 36.23% decrease in comparison to 2019, when it achieved RON 299,606,927 RON, although the number of enterprises increased by 8.15%. Before the financial crisis a growing trend in turnover was observed in 2006–2008 of 37.36%, achieving the threshold of RON 100 million, i.e., RON 102,589,525, for the first time, which was followed by a lighter decrease in 2008–2010, with 3.53% in 2009 and 0.84% in 2010, in contrast to the year of the crisis. After 2010, a slower growth was perceived that was intensified by an exponential increase in turnover of 123.53% in 2014–2019 that is justified by the fact that it had the highest number of establishments in that period. The pandemic had a more significant impact on the turnover of enterprises in comparison to the financial crisis.
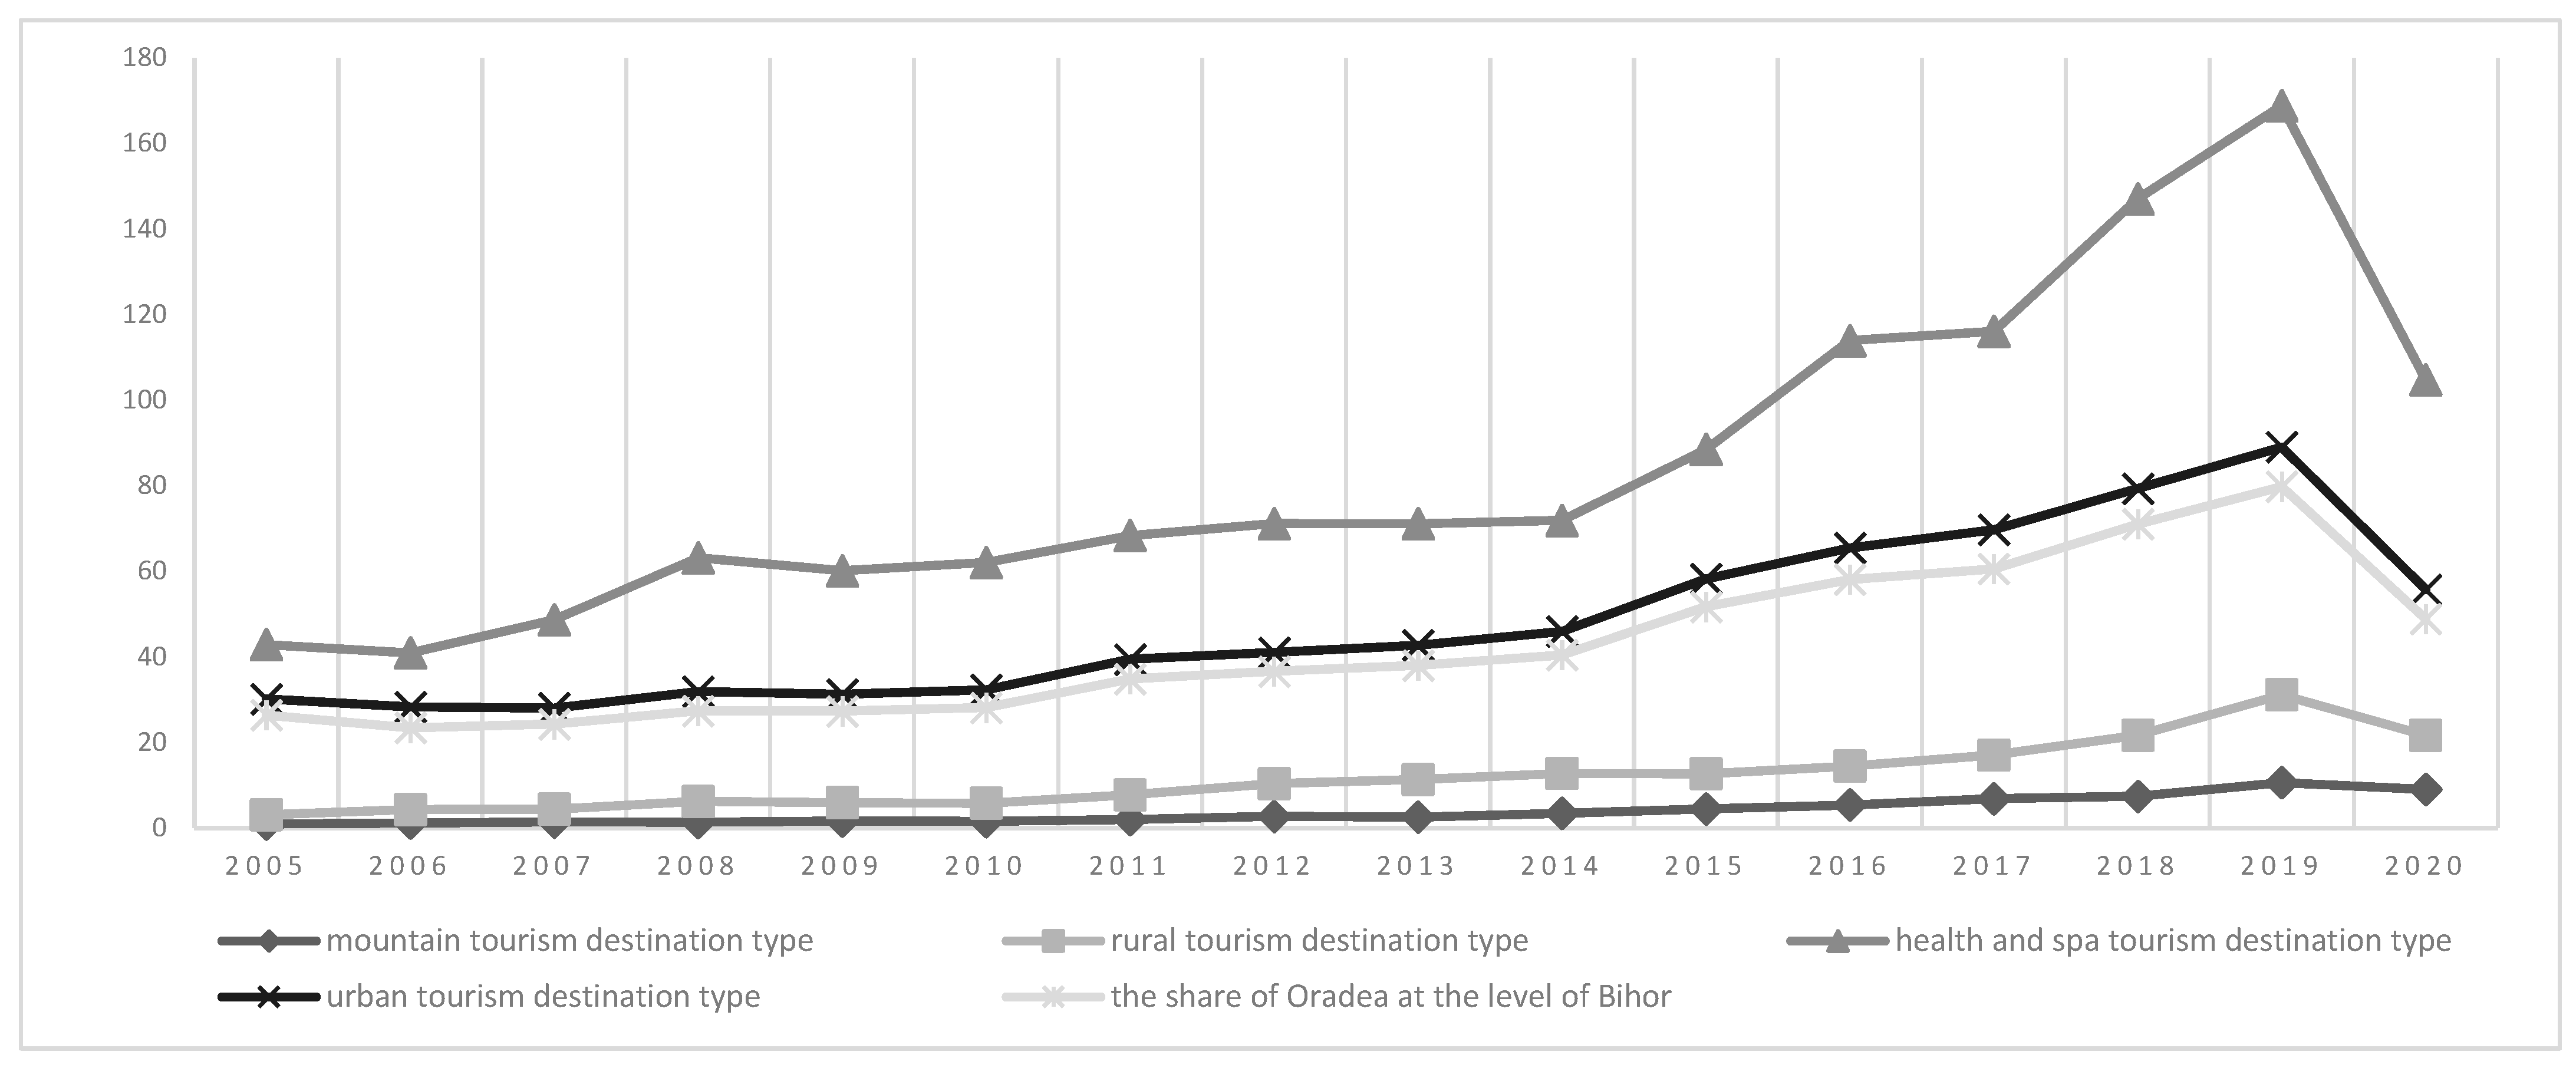
Figure 3 illustrates the trends of the examined accommodation service providers in 2005–2020 concerning the financial crisis and the first year of the COVID-19 pandemic on the level of potential tourism-destination types and Oradea.
The health- and spa-tourism destination type was the most successful, with RON 104,718,596, which constituted 54.82% of total turnover, containing the lowest number of local governments and following the tendencies of the county in exponential increase in 2014–2019 at 134.84% but a 37.96% decrease in 2020 compared to the previous year. The weight of Sânmartin was again remarkable: It comprised 99.15% of turnover within the destination type and 54.35% at the level of the county. The second highest turnover rate was generated within local governments of the urban-tourist destination type, with RON 55,691,588 in total and a 37.45% decrease in comparison to 2019. The growth in turnover was beneath the level of the county in 2014–2019, at 93.71%. Oradea formed the trends within this destination category; it owned 87.73% of the share of within this type and 25.57% at the level of Bihor. The rural-tourism destination type owned 11.32% of total turnover, with RON 21,618,260, and had a 30.64% decrease in 2020 in comparison to 2019. The mountain-tourism destination type had the lowest share in the case of Bihor, with 4.72% and a turnover of RON 9,008,838, which was 15.06% lower than in 2019.
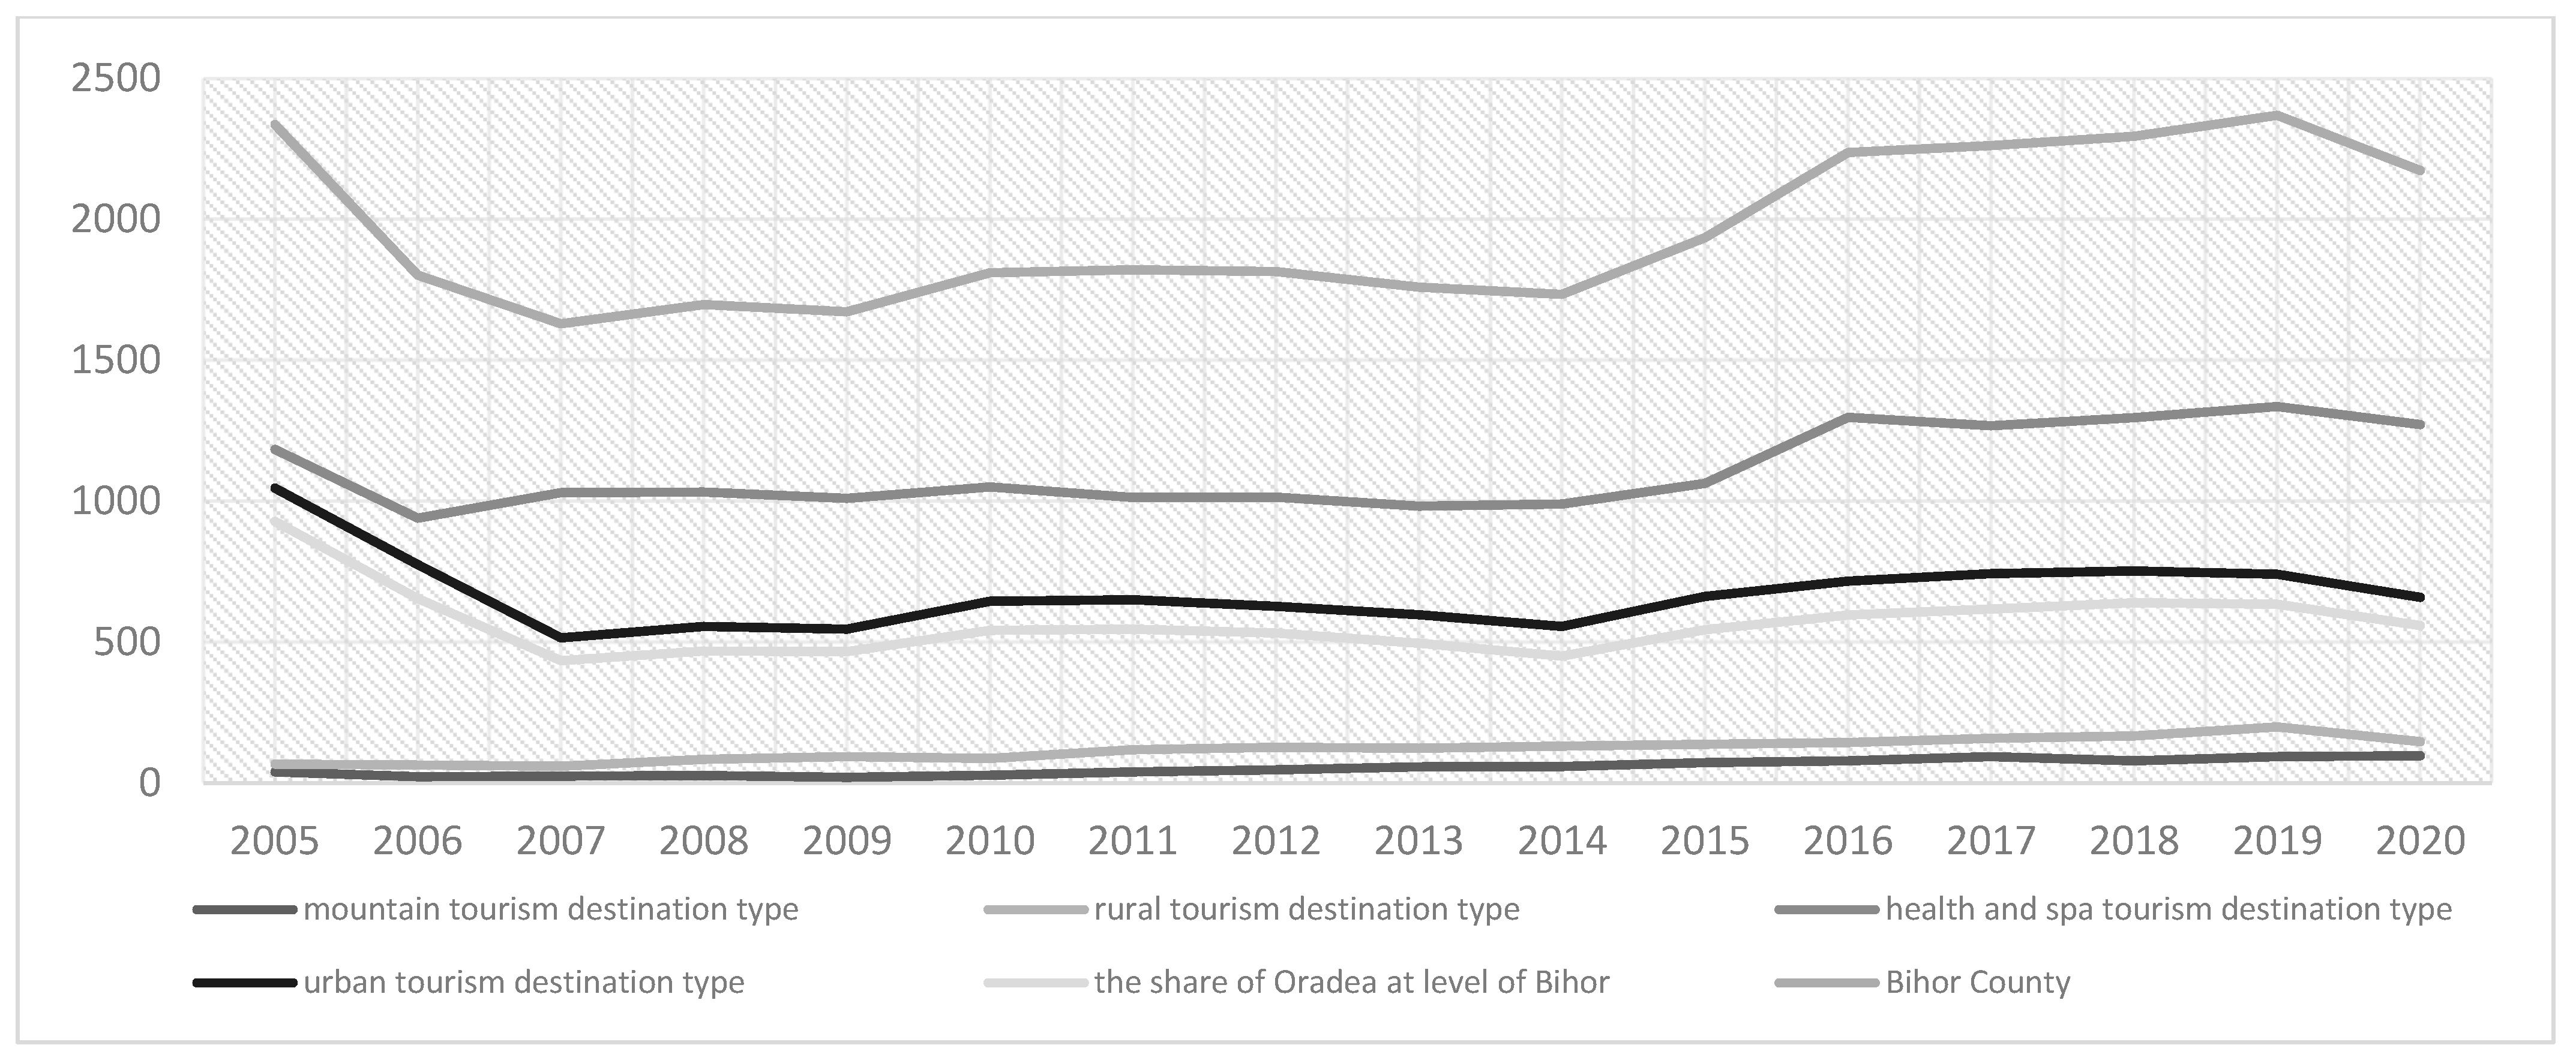
The changes in the average annual number of employees of the enterprises are illustrated by
Figure 4. At the county level, the first significant change was before the financial crisis, in 2005–2007, with a 30.24% decrease, from 2335 employees to 1629.
After 2008, there was a moderate increase that represented 2.12%, but it was complemented by the exponential growth of the period of 2014–2016, with 29.02%. In addition, it was followed by a 5.95% increase in 2016–2019. The increased number of newly established enterprises also brought growth in the number of employees after 2014.
COVID-19 interrupted these favorable trends, with an 8.27% decrease in the average annual number of employees from 2369 to 2173 persons despite the increase in the number of lodging entities. In the case of destination types, the trends were the following:
Urban-tourism destination type—Oradea became an outlier, with 84.80% of employees within the destination category and 25.68% within Bihor, enumerating 558 persons in 2020;
Health- and spa-tourism destination type—Sânmartin was the most significant, with 99.48% of the total average annual number of employees in the category and 57.80% within Bihor in 2020, which represented 1256 persons;
Rural-tourism destination type—this comprised 6.76% of total employees at the county level in 2020;
Mountain-tourism destination type—this comprised 4.46% of employees in 2020 at the level of Bihor and showed moderate growth at 3.19% in comparison to 2019, which was exceptional in the period of the COVID-19 pandemic.
Due to the high average annual number of employees in the case of the urban- and the health- and spa-tourism destination types, the most significant decreases were measured within these categories, the former with 11.08% and the latter with 4.87%, both affecting mainly the two outliers, Oradea and Sânmartin, the significance of which is highlighted by the pie charts in
Figure 5, showing the territorial division of the average annual number of employees at the level of local governments.
In addition, in 2020, Nojorid was the only local government with enterprises with over 50 employees, and the following local governments had between 20–49 employees: Borș, Beiuș, Bulz, Șuncuiuș, Salonta, and Oșorhei. Five additional local administrative units stood out, with 10–16 employees: Valea lui Mihai, Ștei, Marghita, Vadu Crișului, and Mădăras. An additional 33 local governments had accommodation service providers with less than 10 employees on average and an additional 24 local administrative unites did not register the average annual number of employees, but these enterprises also had one or two administrators or had not yet started any business activity, having recently been registered.
4.2.2. Food-and-Beverage Service Providers
The food-and-beverage service providers of Bihor County comprised in total 1066 enterprises that were active on 30 June 2021 within 92 local governments. The type of entities by NACE code had the following division, based on data from 2020:
5610—restaurants and mobile food-service activities, with 54.32% and 579 entities;
5621—event-catering activities, with 4.96% and 35 entities;
5629—other food-service activities, with 1.88% and 20 entities;
5630—beverage-serving activities, with 38.84% and 414 entities.
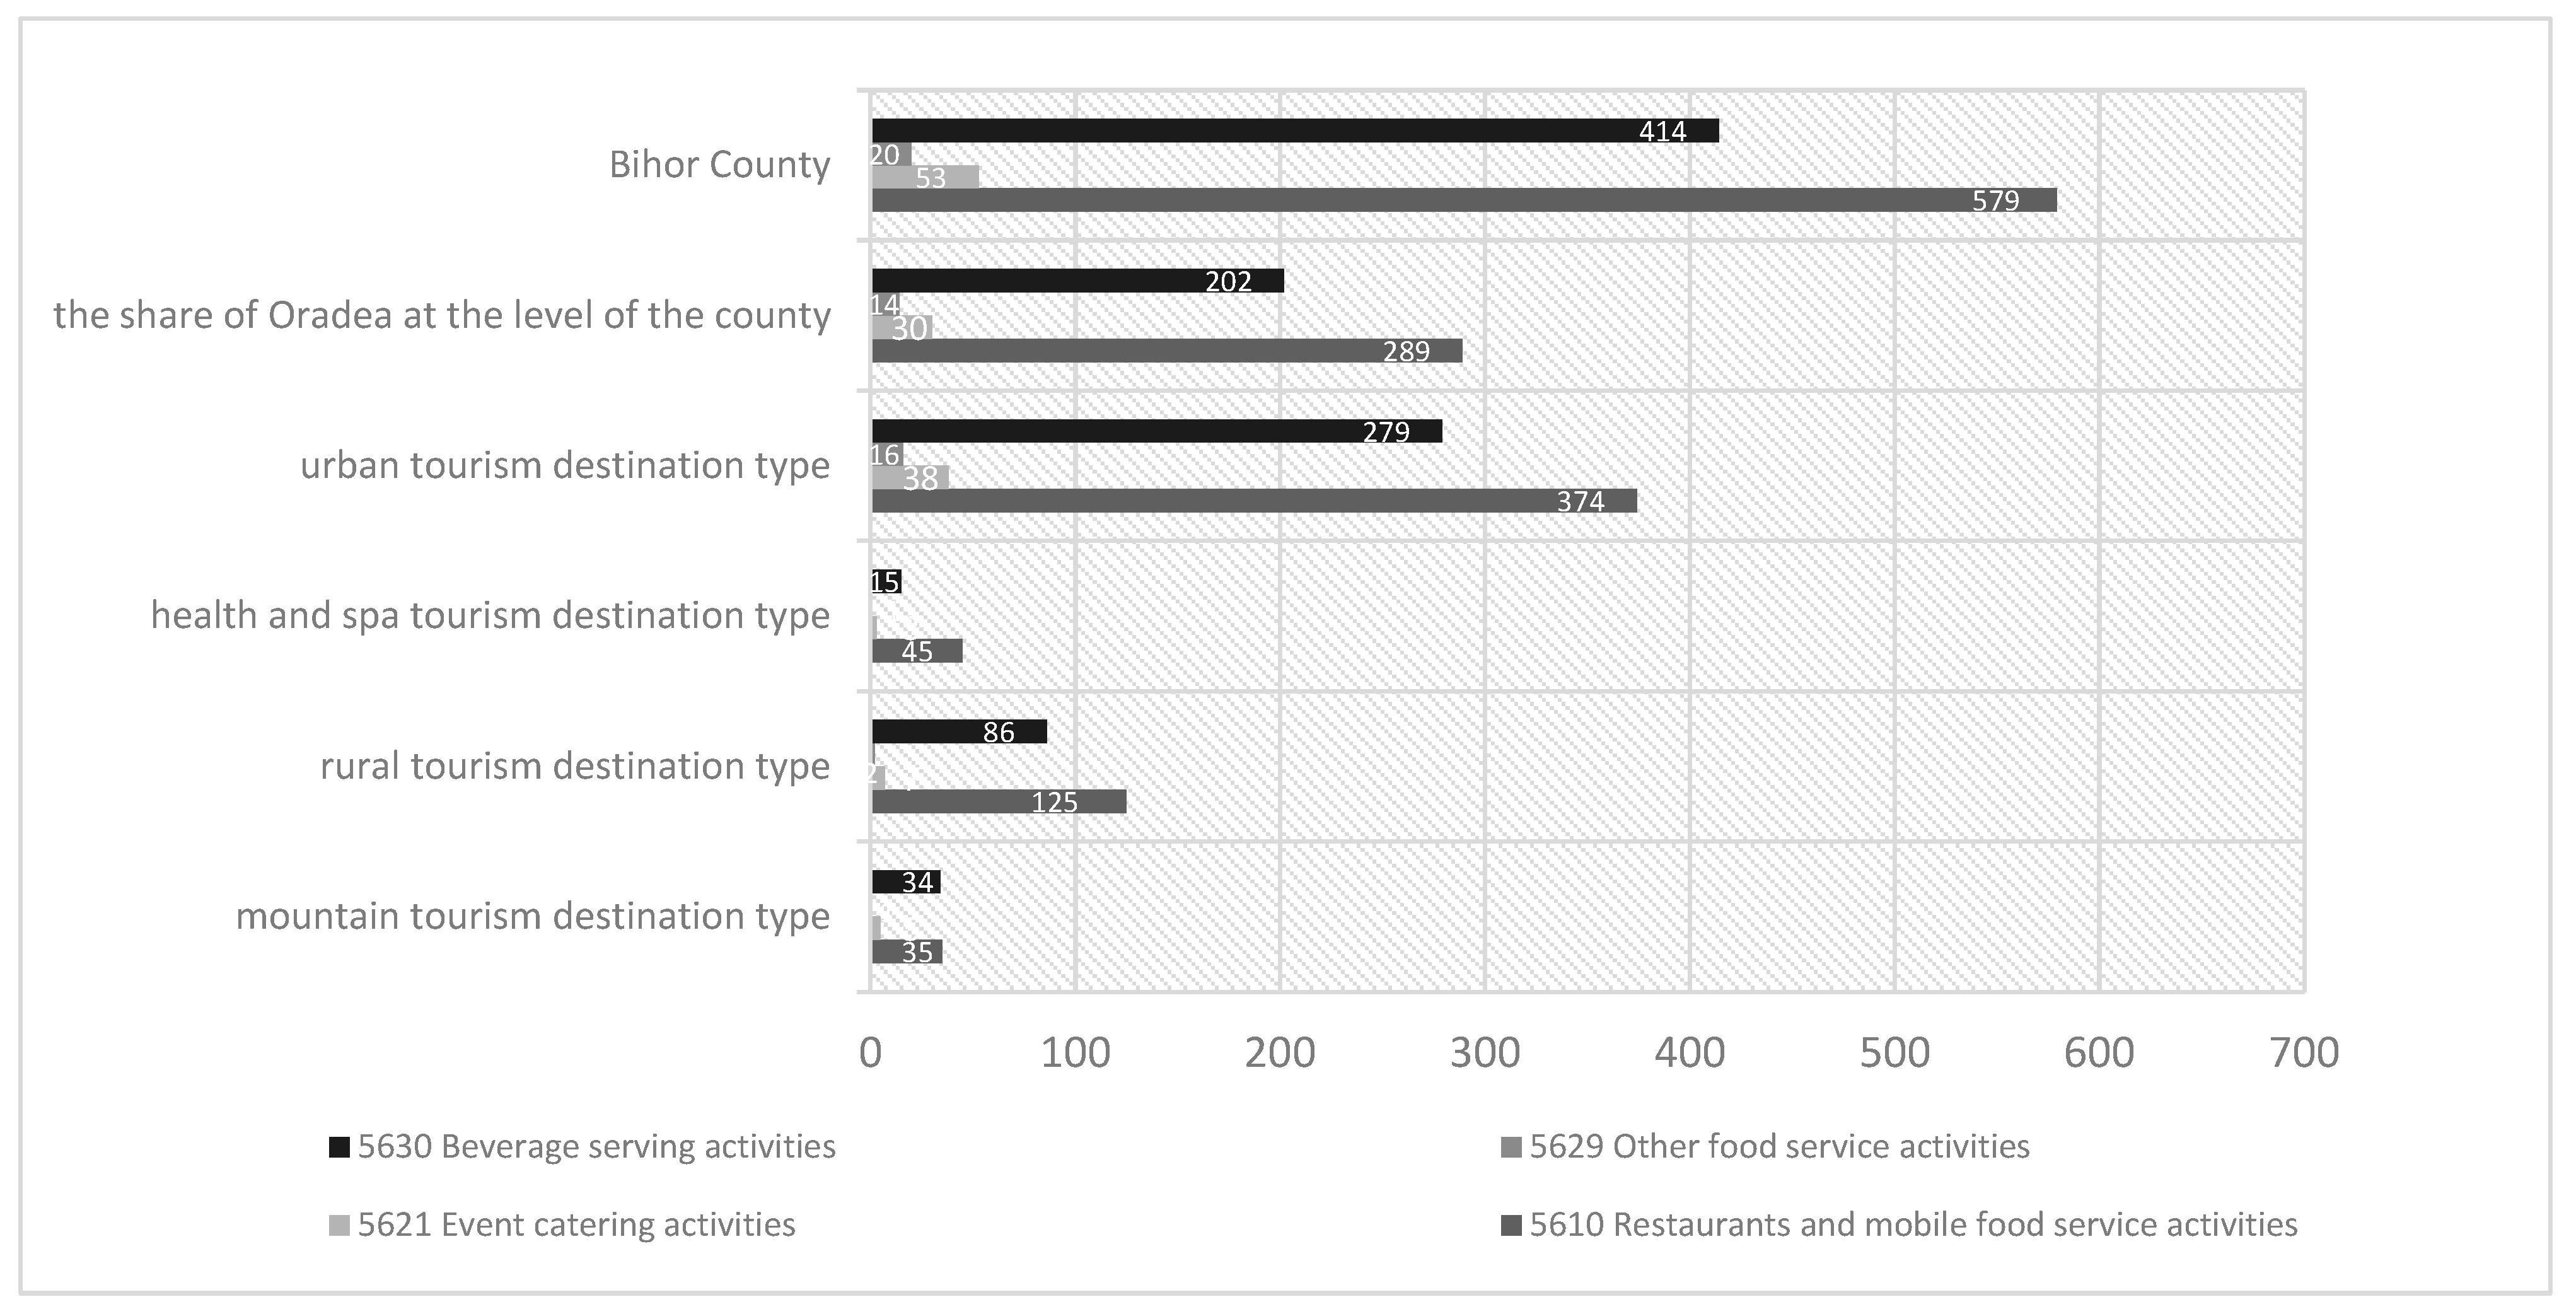
The division of food-and-beverage service providers at the level of Bihor County and potential destination types is illustrated by
Figure 6, highlighting Oradea as the county seat.
In the case of Bihor County and the division of destination categories, the structures of service providers were alike, with the domination of two types of activities: 5610 and 5630. The latter is justified by the fact that most localities had at least one pub. The following attributes characterized the potential tourism-destination types in 2020:
Urban-tourism destination type—comprised 66.32%, with 707 establishments. Oradea was an outlier, with 535 registered businesses within the category that accounted for up to 75.67% within the destination type and 50.19% at the level of Bihor;
Health- and spa-tourism destination type—had the least proportion within these business activities, with 6% of enterprises, i.e., 64 entities, which is justified by the presence of a large number of tourist-accommodation service providers that offer restaurant and catering services as well, although Sânmartin could be highlighted again as owning a 71.88% share, with 46 enterprises, at the level of the destination type and 4.32% at the level of Bihor;
Rural-tourism destination type—had 220 enterprises, comprising the second highest proportion of businesses, with 20.64%, at the county level;
Mountain-tourism destination type—accounted for 7.04% of establishments, with 75 entities, and the dominant types were 5610, with 46.67%, and 5630, with 45.33%.
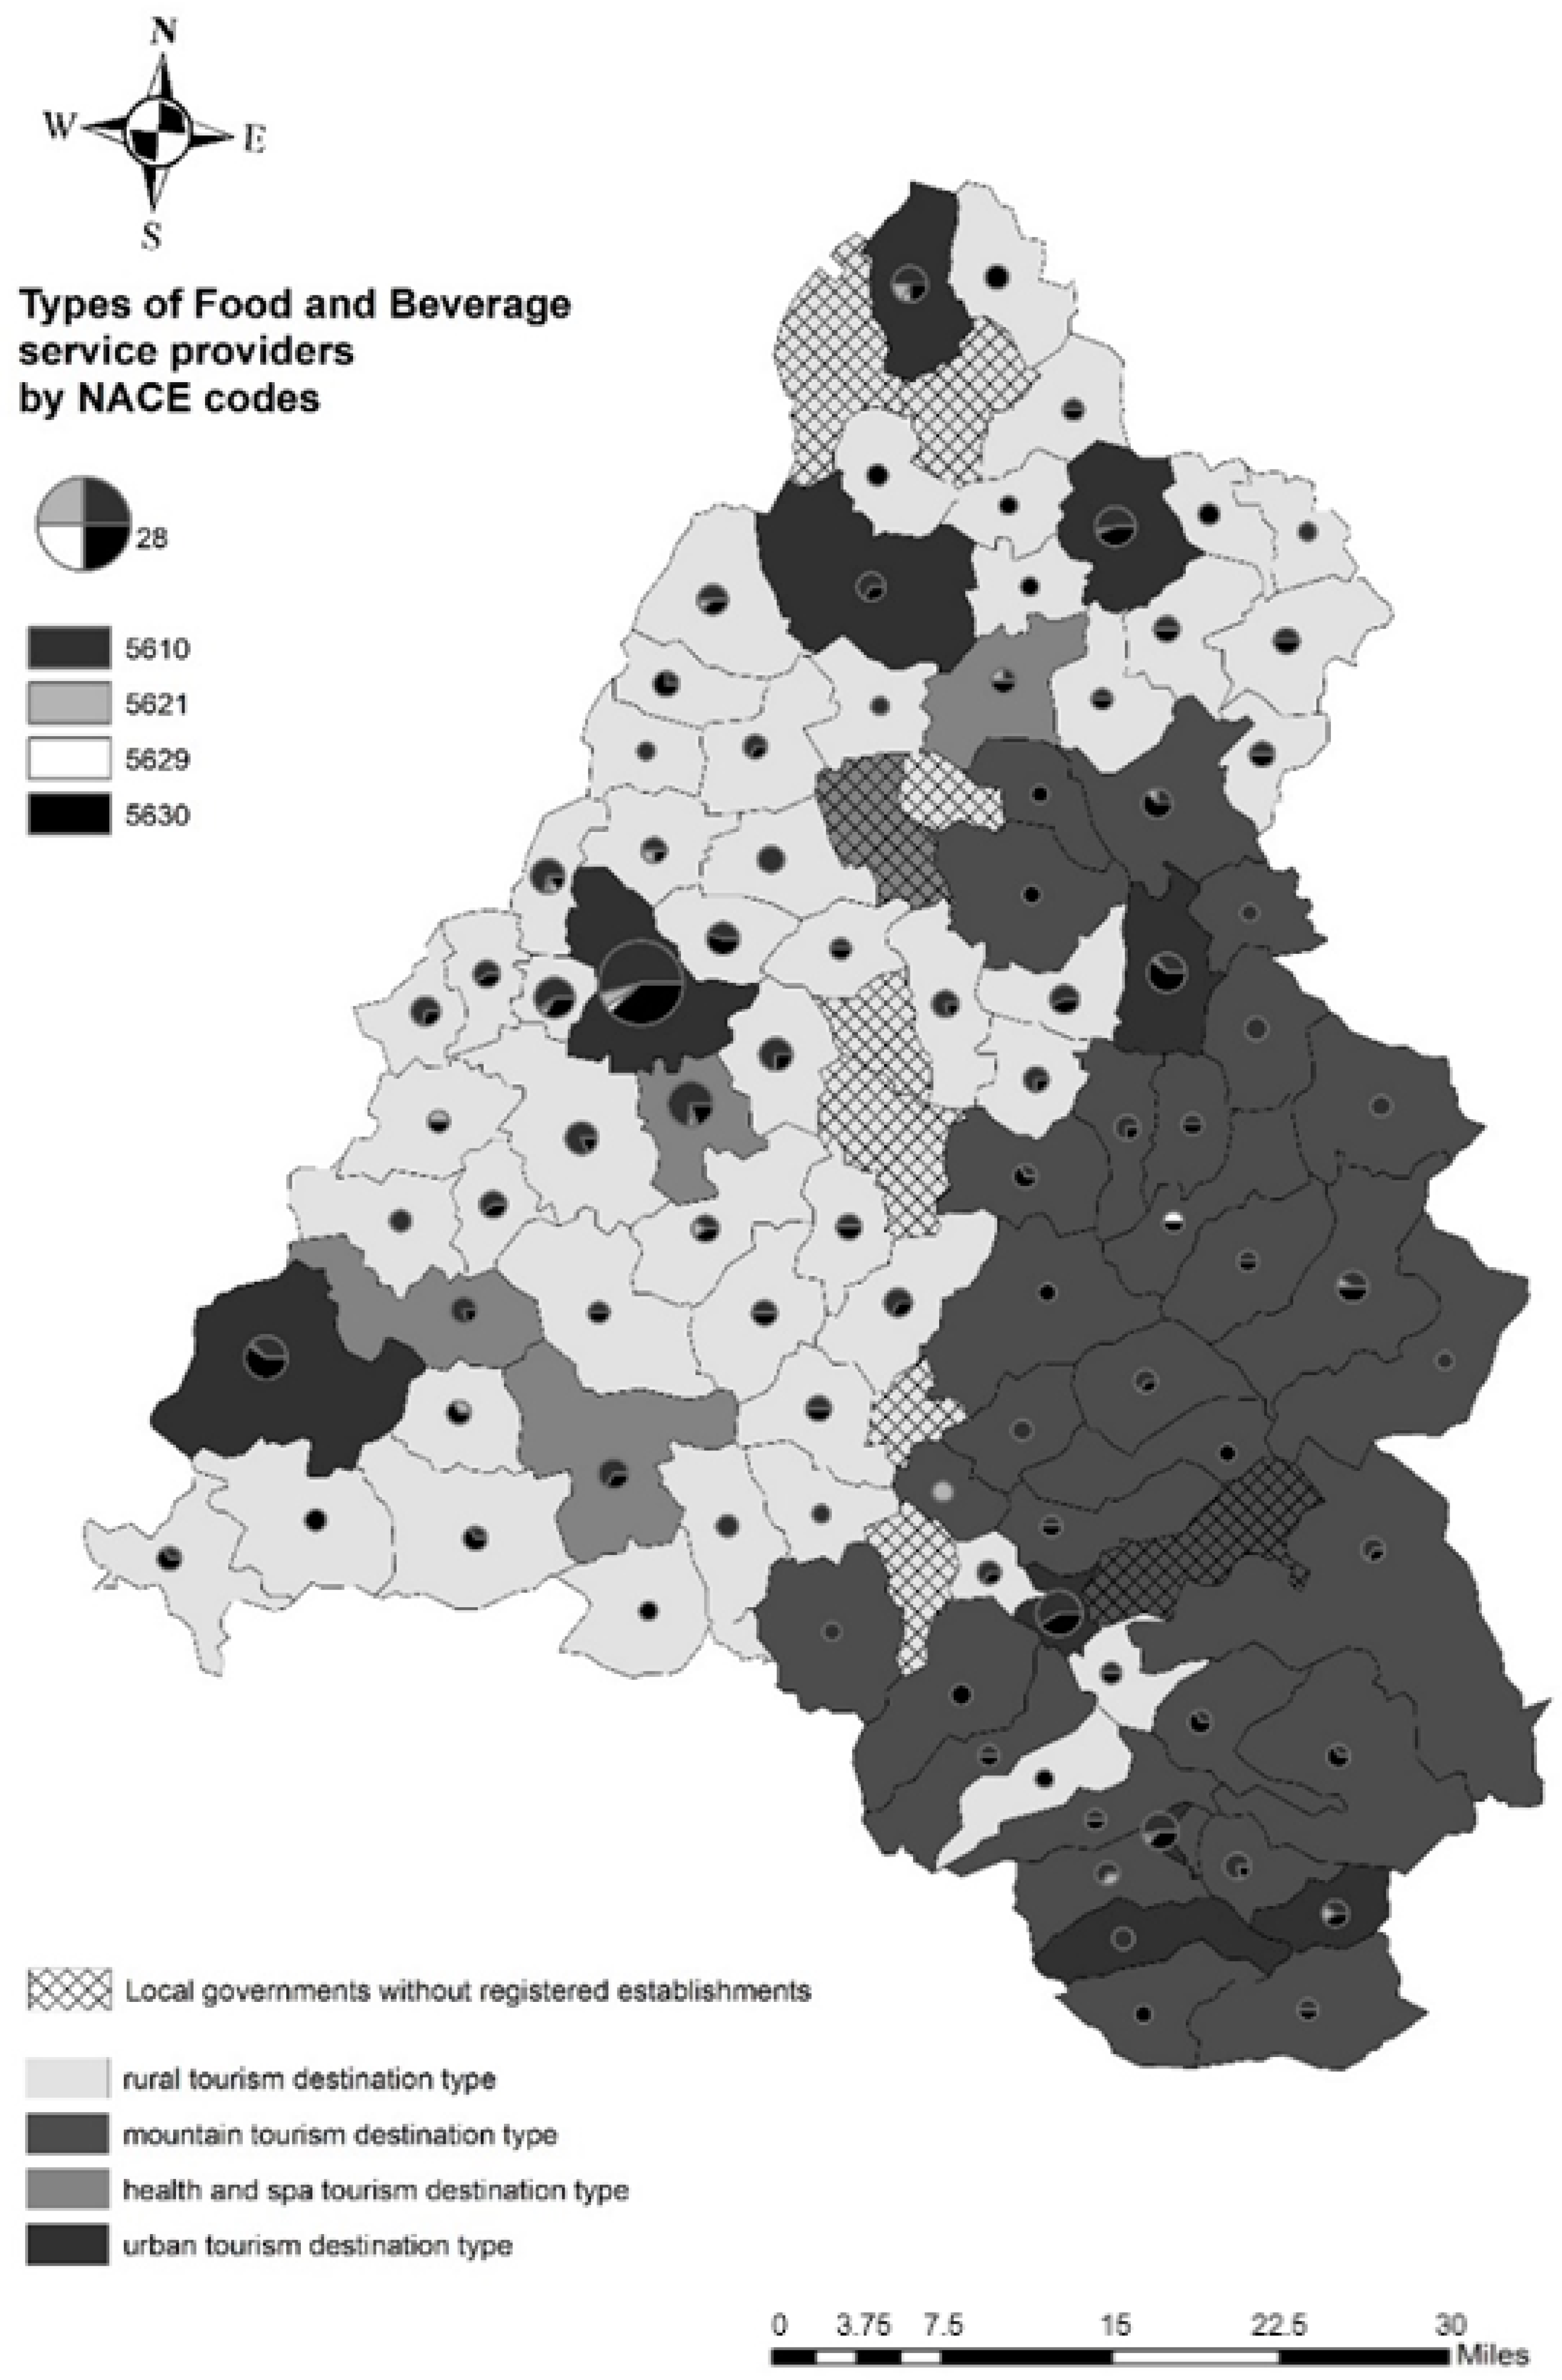
The territorial division and structure of enterprises are illustrated in
Figure 7 based on NACE code and are represented by pie charts in proportion to the number of establishments at the level of local governments in 2020. The local administrative units that did not own registered food-and-beverage service providers were mainly from the rural-tourism destination type, forming a line in the north–south direction in the middle of the county.
Besides the dominance of Oradea, Sânmartin had the second highest number of entities in Bihor. The following local governments had 25–44 establishments: Beiuș (44), Salonta (32), Sântandrei (27), and Marghita (25). There were local governments with 15–24 entities: Aleșd (23), Ștei (19), Valea lui Mihai (16), Borș (14), Oșorhei (12), Nojorid (11), Paleu (11), and Bratca (10). The other local administrative units had fewer than 10 establishments. In this regard, the dominance of urban areas is justified by the examination of territorial division, although the fact that these service providers usually target the local population should be mentioned.
Regarding the turnover of enterprises at the level of Bihor, it added up to RON 296,497,570 in 2020, which showed 33.22% decrease in comparison to the RON 443,960,273 of 2019, although there was a 7.32% increase in the number of enterprises. In the period of 2005–2008 the total turnover increased from RON 48,266,519 to RON 85,562,825, generating 77.27% growth. After the financial crisis, the turnover decreased by 2.5% and was 1.22% lower even in 2010 compared to 2008. Subsequently, there was an uninterrupted period of growth in 2011–2019. Although the turnover was improved by 44.33% in 2011–2014, the enterprises generated an exponential growth in the second half of the timeframe, in 2014–2019, with a 131.25% increase in total turnover [
18]. COVID-19 also generated a higher impact on turnover in the case of food-and-beverage service providers than the financial crisis.
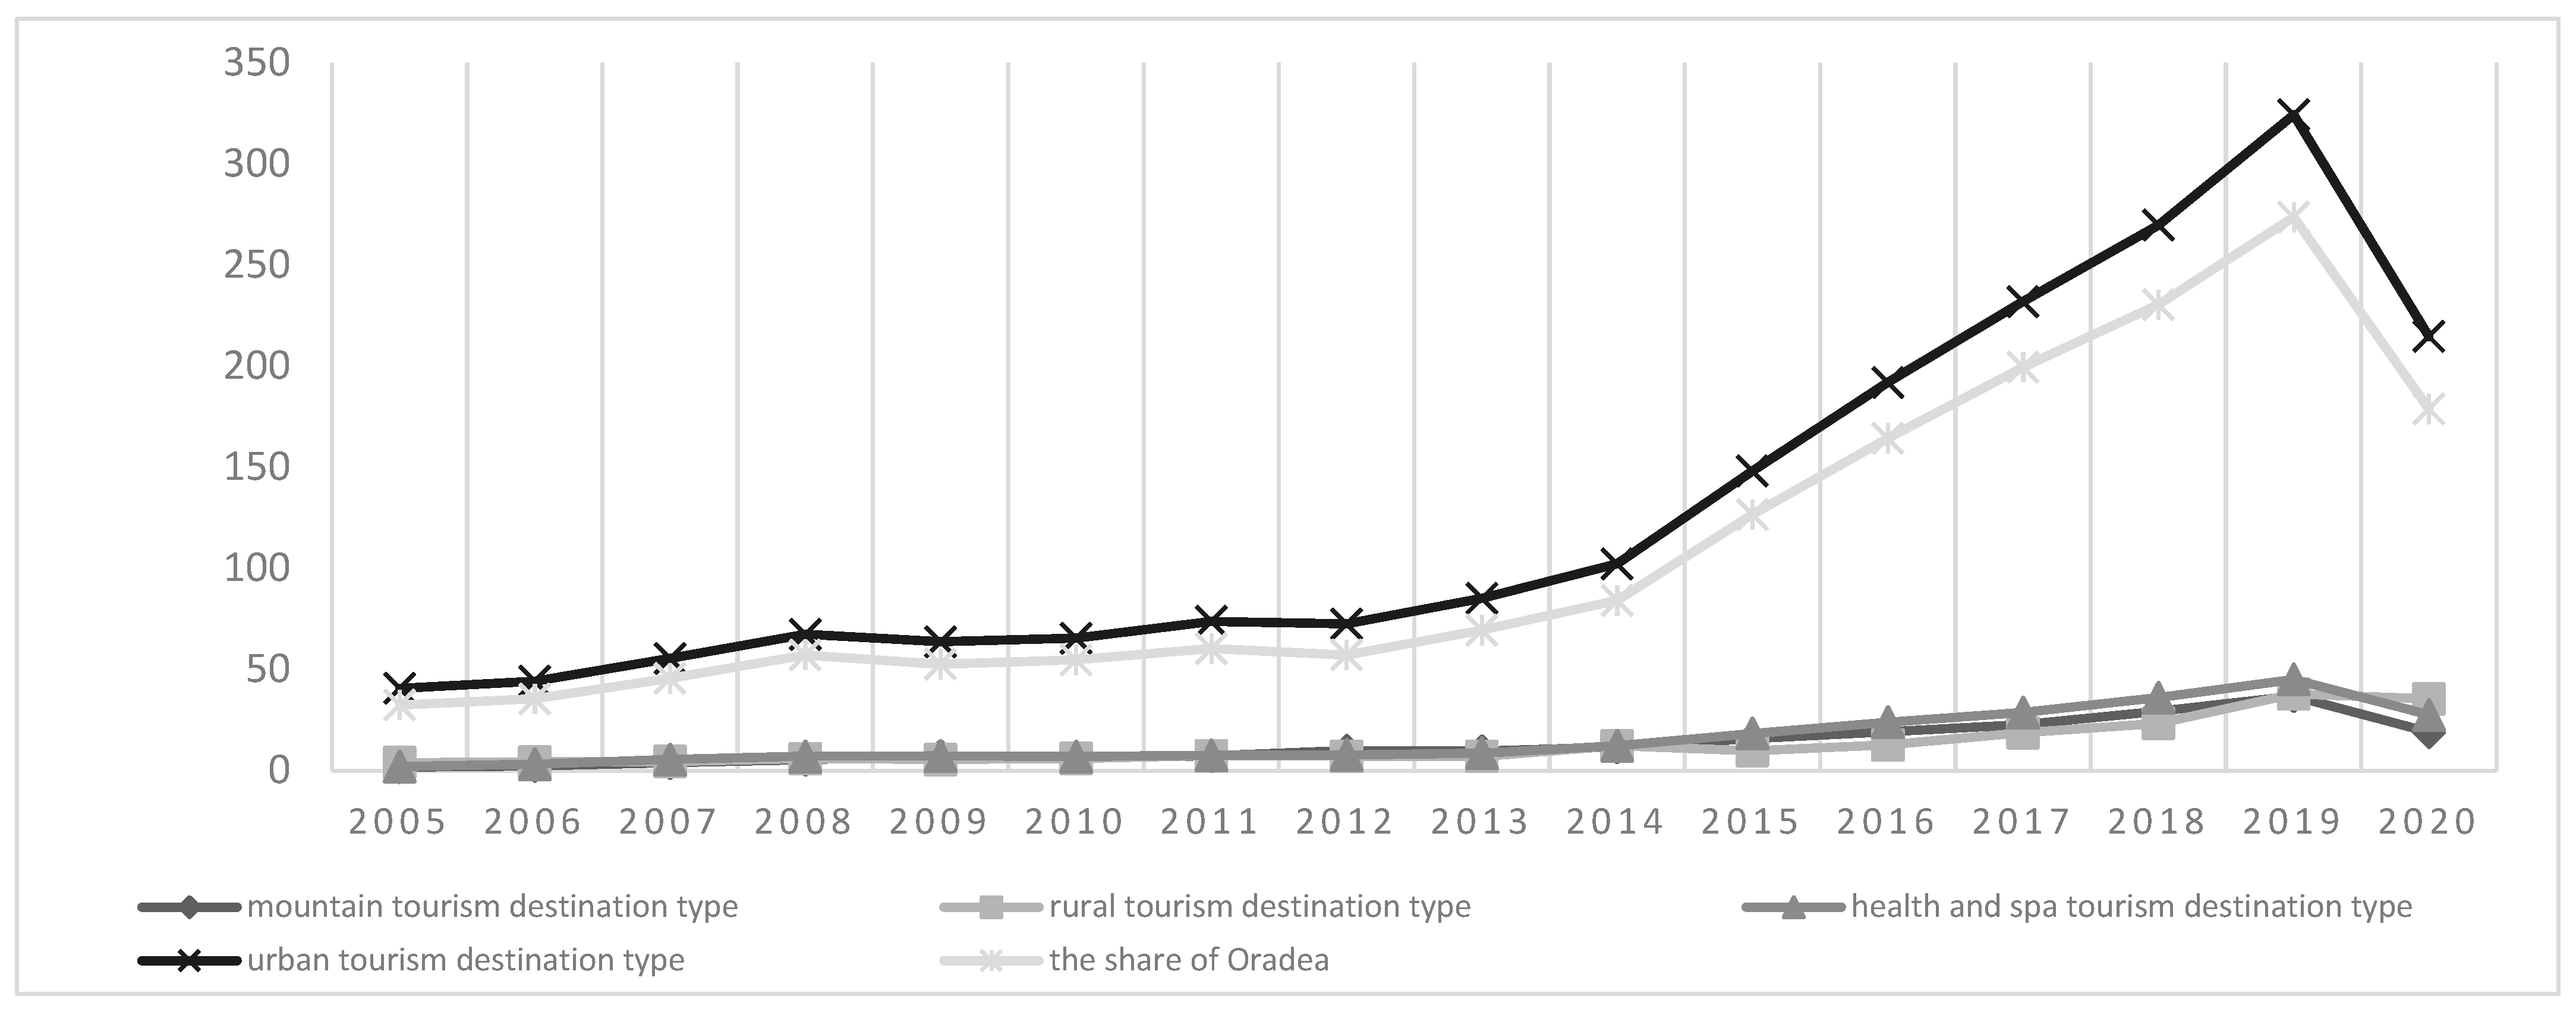
The turnover trends of the examined service providers are shown on
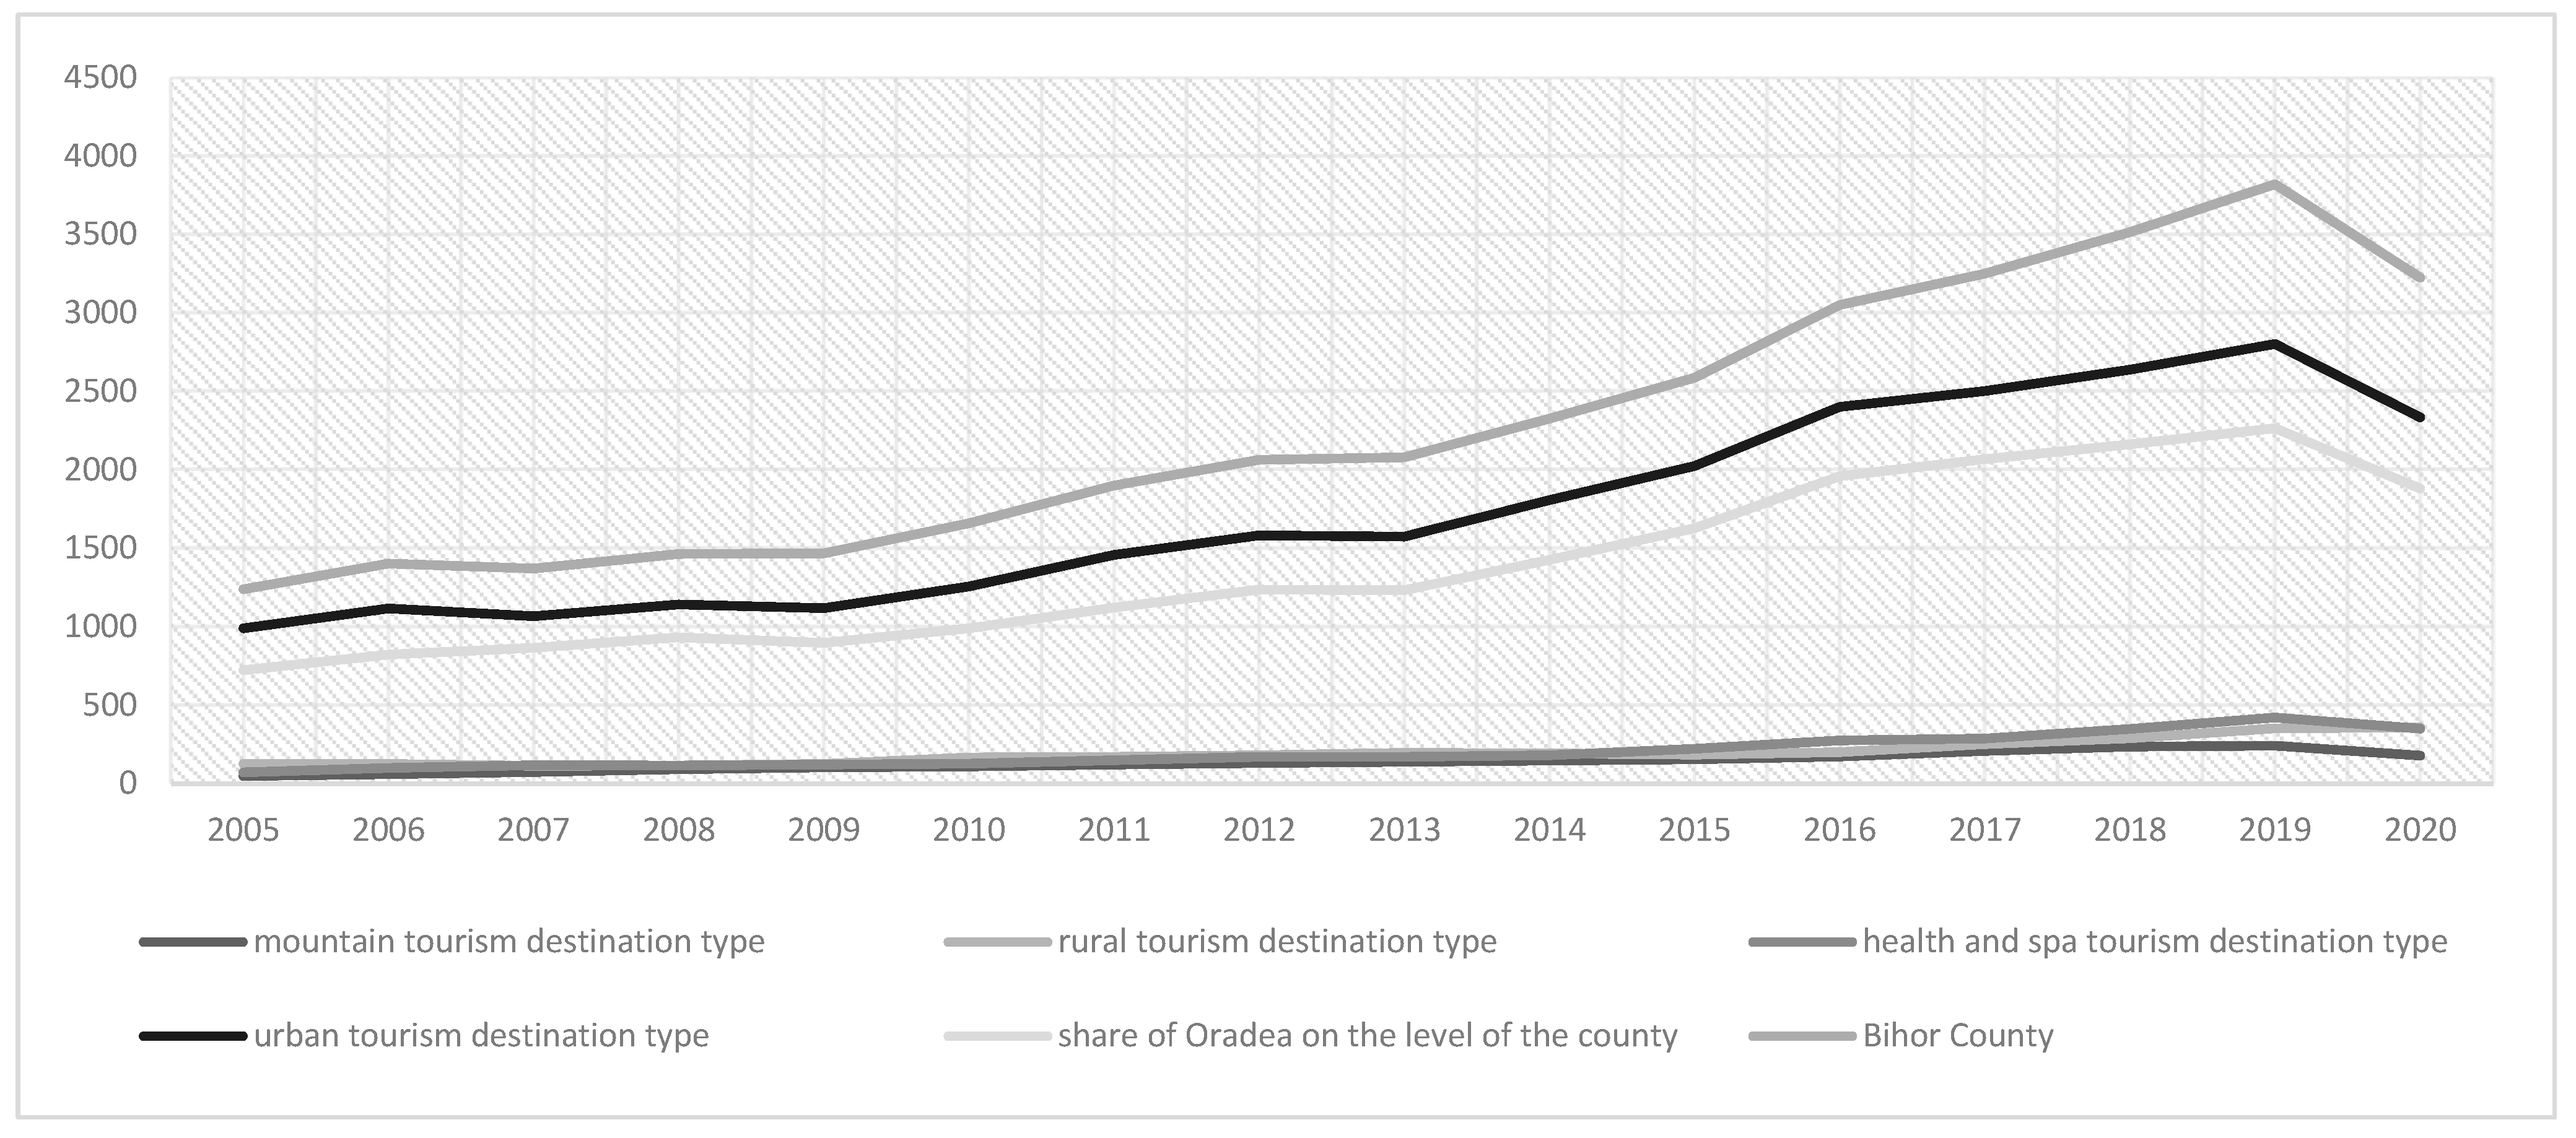
Figure 8, which concerns the data of enterprises for the period of 2005–2020, highlighting Oradea.
The urban-tourism destination was dominant due to the high number of enterprises, with 72.38% of the total turnover of the county generated within this category, adding up to RON 214,599,704. Oradea appeared as an outlier, with 60.27% of turnover at the level of Bihor and 83.27% within the destination type, was adding up to RON 178,704,679. Oradea, with this destination type, had the highest impact on forming the trends of turnover in the examined period. In this regard, it faced an exponential growth of 217.38% in 2014–2019 and a 33.81% decrease in 2020. After 2015, a lighter growth in turnover appeared for the rest of the destination types, which was interrupted in 2020. The next destination category, regarding turnover, was the rural type based on the number of entities, which had the lowest decrease, at 6.32%, accounting for RON 35,438,588 in 2020 and representing 11.95% in the case of the total amount of turnover in Bihor. Local governments of the health- and spa-tourism destination type accounted for 9.26% of the total turnover in Bihor, which was RON 27,464,197 in 2020, with a decrease of 38.99% in comparison to 2019. In the case of the mountain-tourism destination type the turnover in 2020 was RON 18,995,081, constituting 6.41% of the total turnover within the county. Regarding the latter two destination types, after the financial crisis a modest growth in turnover in 2009 was observed in contrast to the other two categories, where decreases were generated.
The changes in the average annual number of employees of food-and-beverage service providers are shown in
Figure 9, which presents a constant growing trend in the period of 2007–2019 at the level of the county.
The average annual number of employees had a 42.08% growth in 2008–2013 and then showed a 83.75% increase in 2013–2019. The year of the pandemic brought a 15.65% decrease, from 3822 employees to 3224, despite the growing number of enterprises. The trends for potential tourism-destination types were as follows:
Urban-tourism destination type—72.43% of employees were registered within this type, accounting for 2335 persons and representing a 16.73% decrease in comparison to 2019. Oradea became an outlier again, with 80.56% within the category and 58.34% at the level of Bihor, totaling 1881 employees, with a 17.03% decrease compared to 2019;
Health- and spa-tourism destination type—with 351 employees, it represented 10.89% at the level of Bihor, with a 17.02% decrease in comparison to 2019. Sânmartin was also dominant, with 282 employees and 80.34% at the level of potential destination type and 8.75% at the level of the county;
Rural-tourism destination type—11.17% of employees were registered within this category, which represented 360 persons, and it was the only category in which modest growth could be perceived, with 2.27%;
Mountain-tourism destination type—with 178 employees, this category had the lowest proportion, with 5.52%, and the highest decrease, with 26.44%, in comparison to 2019.
The dominance in the number of employees of urban-tourism destination types and Sânmartin is illustrated by
Figure 10, and the pie charts illustrate the data in proportion to the number of average annual employees at the level of local governments.
Except for Oradea and Sânmartin, the following five local governments registered more than 50 average annual employees in 2020: Beiuș (121), Salonta (108), Bratca (77), Marghita (72), and Ștei (51). Eleven local governments had an average annual number of employees of 20–49 (Valea lui Mihai (48), Aleșd (43), Sântandrei (41), Mădăras (39), Toboliu (36), Tinca (30), Biharia (29), Șinteu (25), Borș (23), Nojorid (20), Suplacu de Barcău (20)) and 11 had 10–19 persons (Lugașu de Jos (18), Aștileu (16), Ineu (16), Hidișelu de Sus (14), Oșorhei (14), Gepiu (12), Tămășeu (12), Borod (11), Diosig (11), Paleu (11), Popești (10)). An additional 49 local governments had 1–9 employees. There was no registered average annual number of employees in the case of 17 local administrative units, although most of these enterprises were registered recently.
4.3. Hoover Index on Territorial Concentration and Efficiency of Tourist-Accommodation and Food-and-Beverage Service Providers
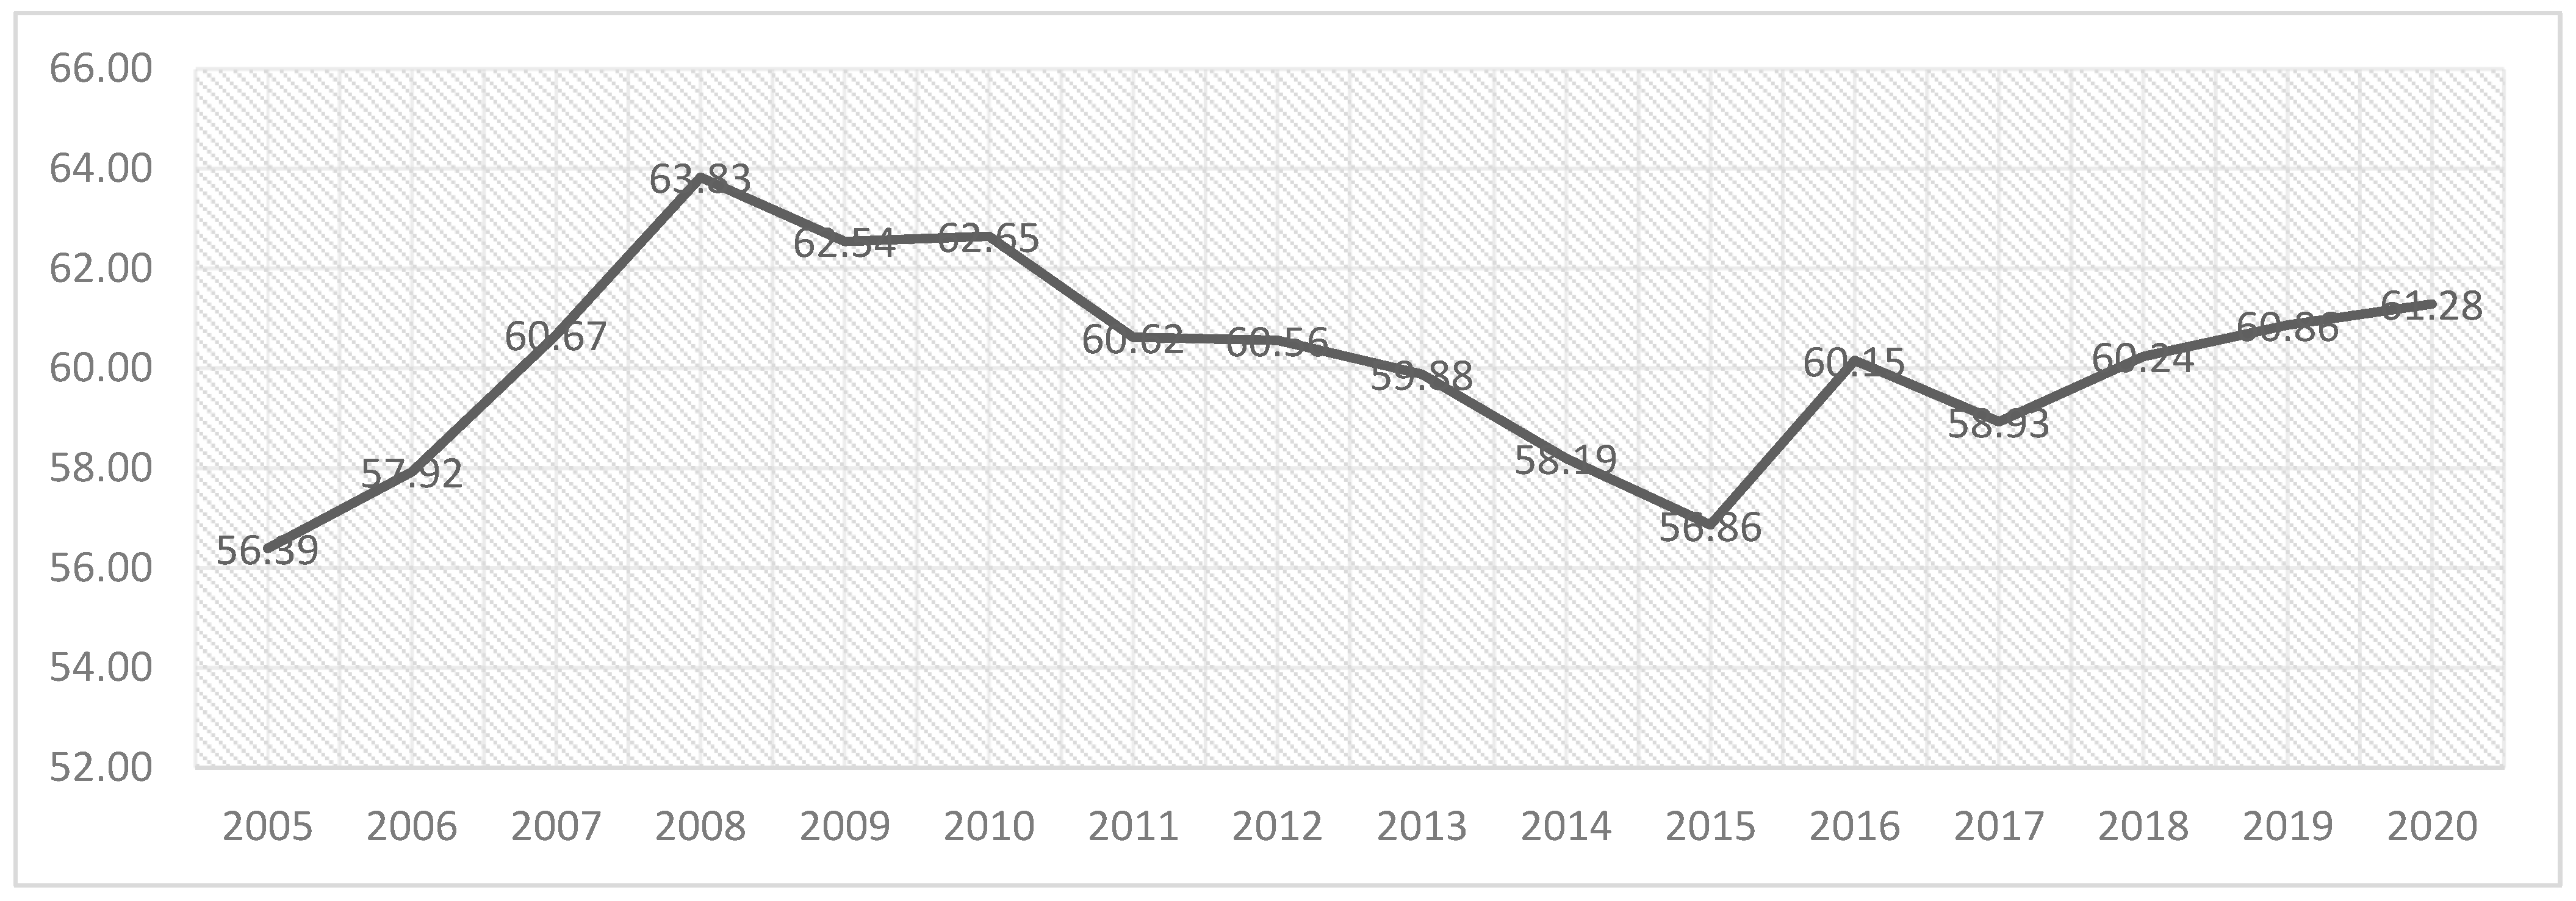
Regarding the present research, the territorial concentration of turnover of tourist-accommodation service providers was measured using the Hoover index, which is visualized in
Figure 11. The result of this examination showed a fluctuation within the period of 2005–2020, although the concentration index was especially high due to the territorial differences of the examined registered enterprises in local governments, also counting the 30 local administrative units with a population that did not have even one entity. In this regard, summing up Bihor County, the concentration increased in 2005–2008, with 13.19% having the highest and the lowest values in the year of the financial crisis, with 63.83 points.
The decreasing values showed an improvement with the reduction in concentration in the period of 2008–2015. After 2015, the concentration intensified, with a slight fluctuation in 2017. The first year of COVID-19 did not change the tendencies, generating 0.69% growth in the values.
The highest number of registrations of accommodation service providers before 2016 was in 2006, with 21 entities, and from 2016 to 2020 the number of registrations was 29–34 entities per year. Dividing the evaluation of the number of establishments after 2015 by the potential tourism-destination types, mountain-tourism destinations had a 44.93% increase, urban-tourism destinations had a 39.16% growth, health- and spa-tourism destinations had a 38.16% increase, and rural-tourism destinations reached the highest percentage of increase, with 59.46%. The overall growth was 64.81% within Bihor County. Moreover, in 2015–2019, the increase in turnover of companies reached 123.53% growth within the county. Despite the increase in the number of establishments, territorial inequalities in the division of service providers still remained significant, concentrating on entities in Oradea and Sânmartin.
In this regard, the territorial inequalities of the location of establishments contributed significantly to the concentration of turnover from the provision of tourist accommodation services in proportion to the population for Bihor. However, the change in the number of inhabitants also impacted the calculation to some extent during the studied 16 years.
The efficiency of establishments in Bihor was measured using the Hoover index considering sales revenue in proportion to the average annual number of employees of tourist-accommodation service providers, which is illustrated in
Figure 12. As a result, 2009 was the most successful year, although the financial crisis brought redundancies in 1.53% of the total average annual number of employees and a 3.53% decrease in annual turnover.
The year 2014 showed the least efficient index within the examined period due to the higher increase in the average annual number of employees in comparison to the turnover. Although the trends and the number of newly established entities improved in 2014–2019, the total turnover and the average annual number of employees faced exponential growth. In the case of 2020, the efficiency was reduced by 66.58%, which was the fifth worst value. In this regard, the pandemic had a higher impact on the efficiency of entities in comparison to the financial crisis due to multilateral restrictions.
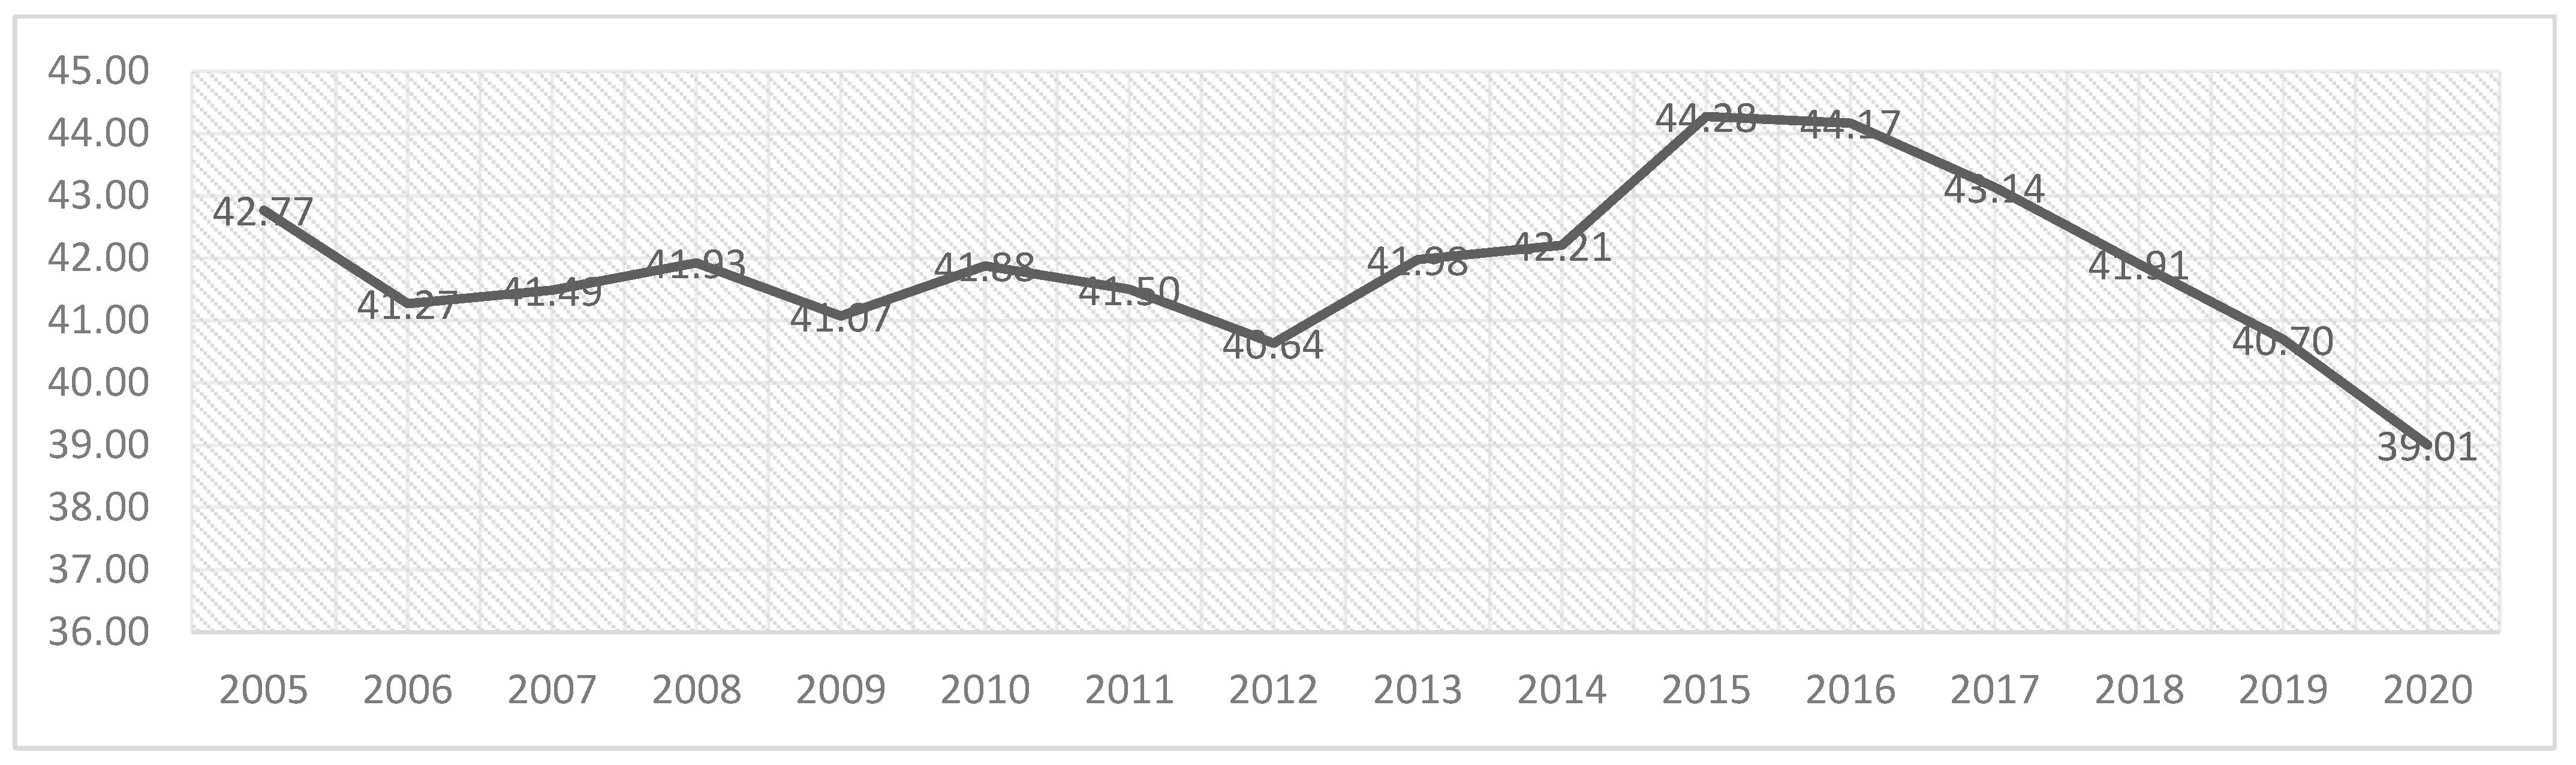
In comparison to tourist-accommodation service providers, food-and-beverage service providers showed better results in the case of territorial concentration based on the turnover of entities in proportion to the population of local governments aggregated to the level of Bihor, which is illustrated in
Figure 13.
The territorial concentration was also relatively high but showed better values than in the case of tourist-accommodation service providers due to the fact that only nine local governments had no registered food-and-beverage service providers. Fluctuation was observed in the examined period, although the year 2015 was represented by the highest Hoover value, with 44.28 points, which was followed by a decrease in the index, generating better results. In the framework of 2015–2020, the valued decreased by 11.9%, and the year of COVID-19 showed significant improvement, with the most favorable index of 39.01 points, which represented a 4.15% decrease in the value.
Most of the entities were registered after 2014, which represented 57.41% at the level of the county, of which the highest number of registrations was in 2018–2019, when 27.2% of food-and-beverage service providers were established, with 290 entities in total. In 2020, the growing in number continued, with 78 new service providers established, which represented 7.32% of the total number of entities. Moreover, the constant increase in turnover in 2015–2019 showed a 131.25% improvement, which was followed by a 33.22% decrease in the first year of COVID-19 yet generating the most favorable Hoover-index value. In this regard, due to Oradea owning 50.19% of total businesses, which contributed to the high concentration of turnover in proportion to the local populations, enhancing territorial inequalities, it faced a 34.69% decrease in total turnover of entities, which was the highest rate in comparison to other local governments; thus, territorial concentration declined in 2020.
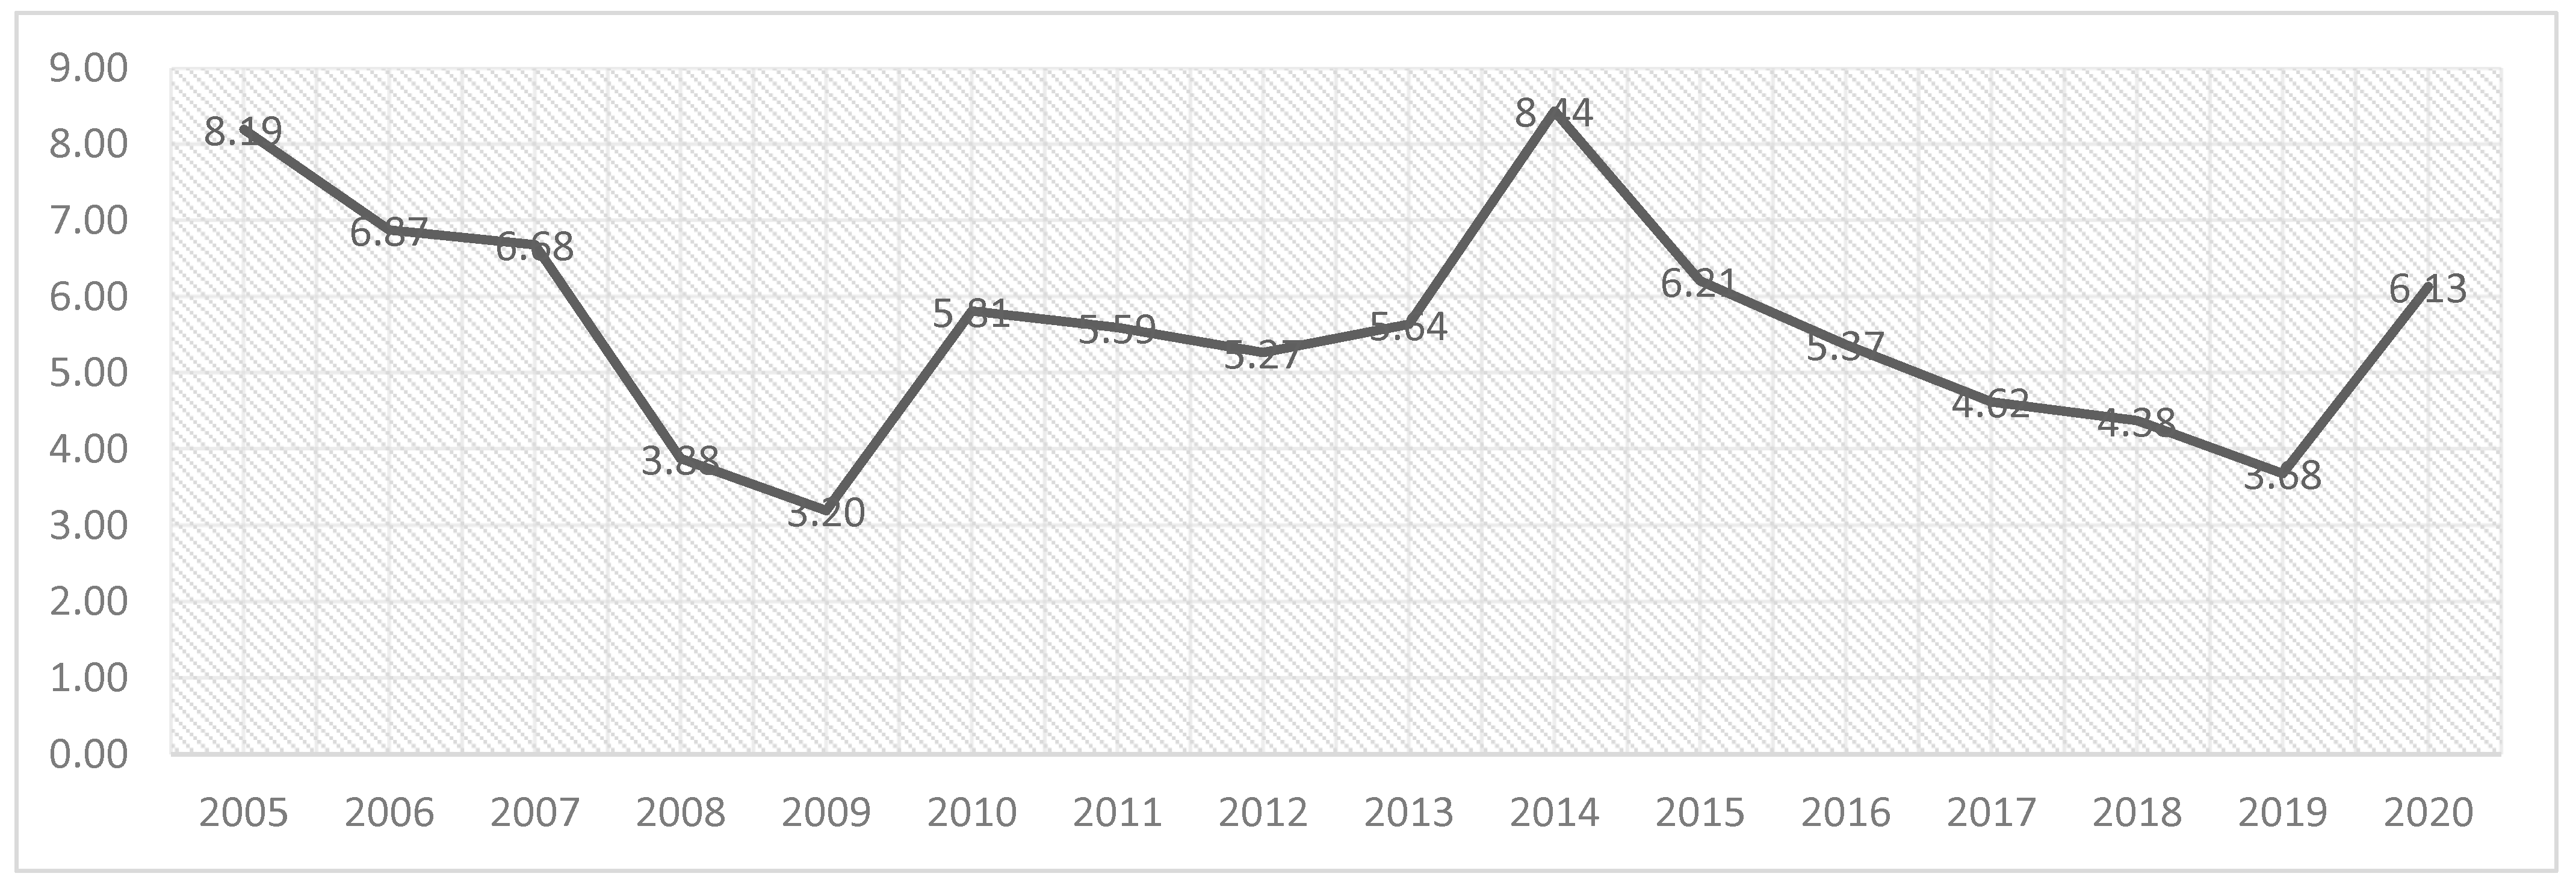
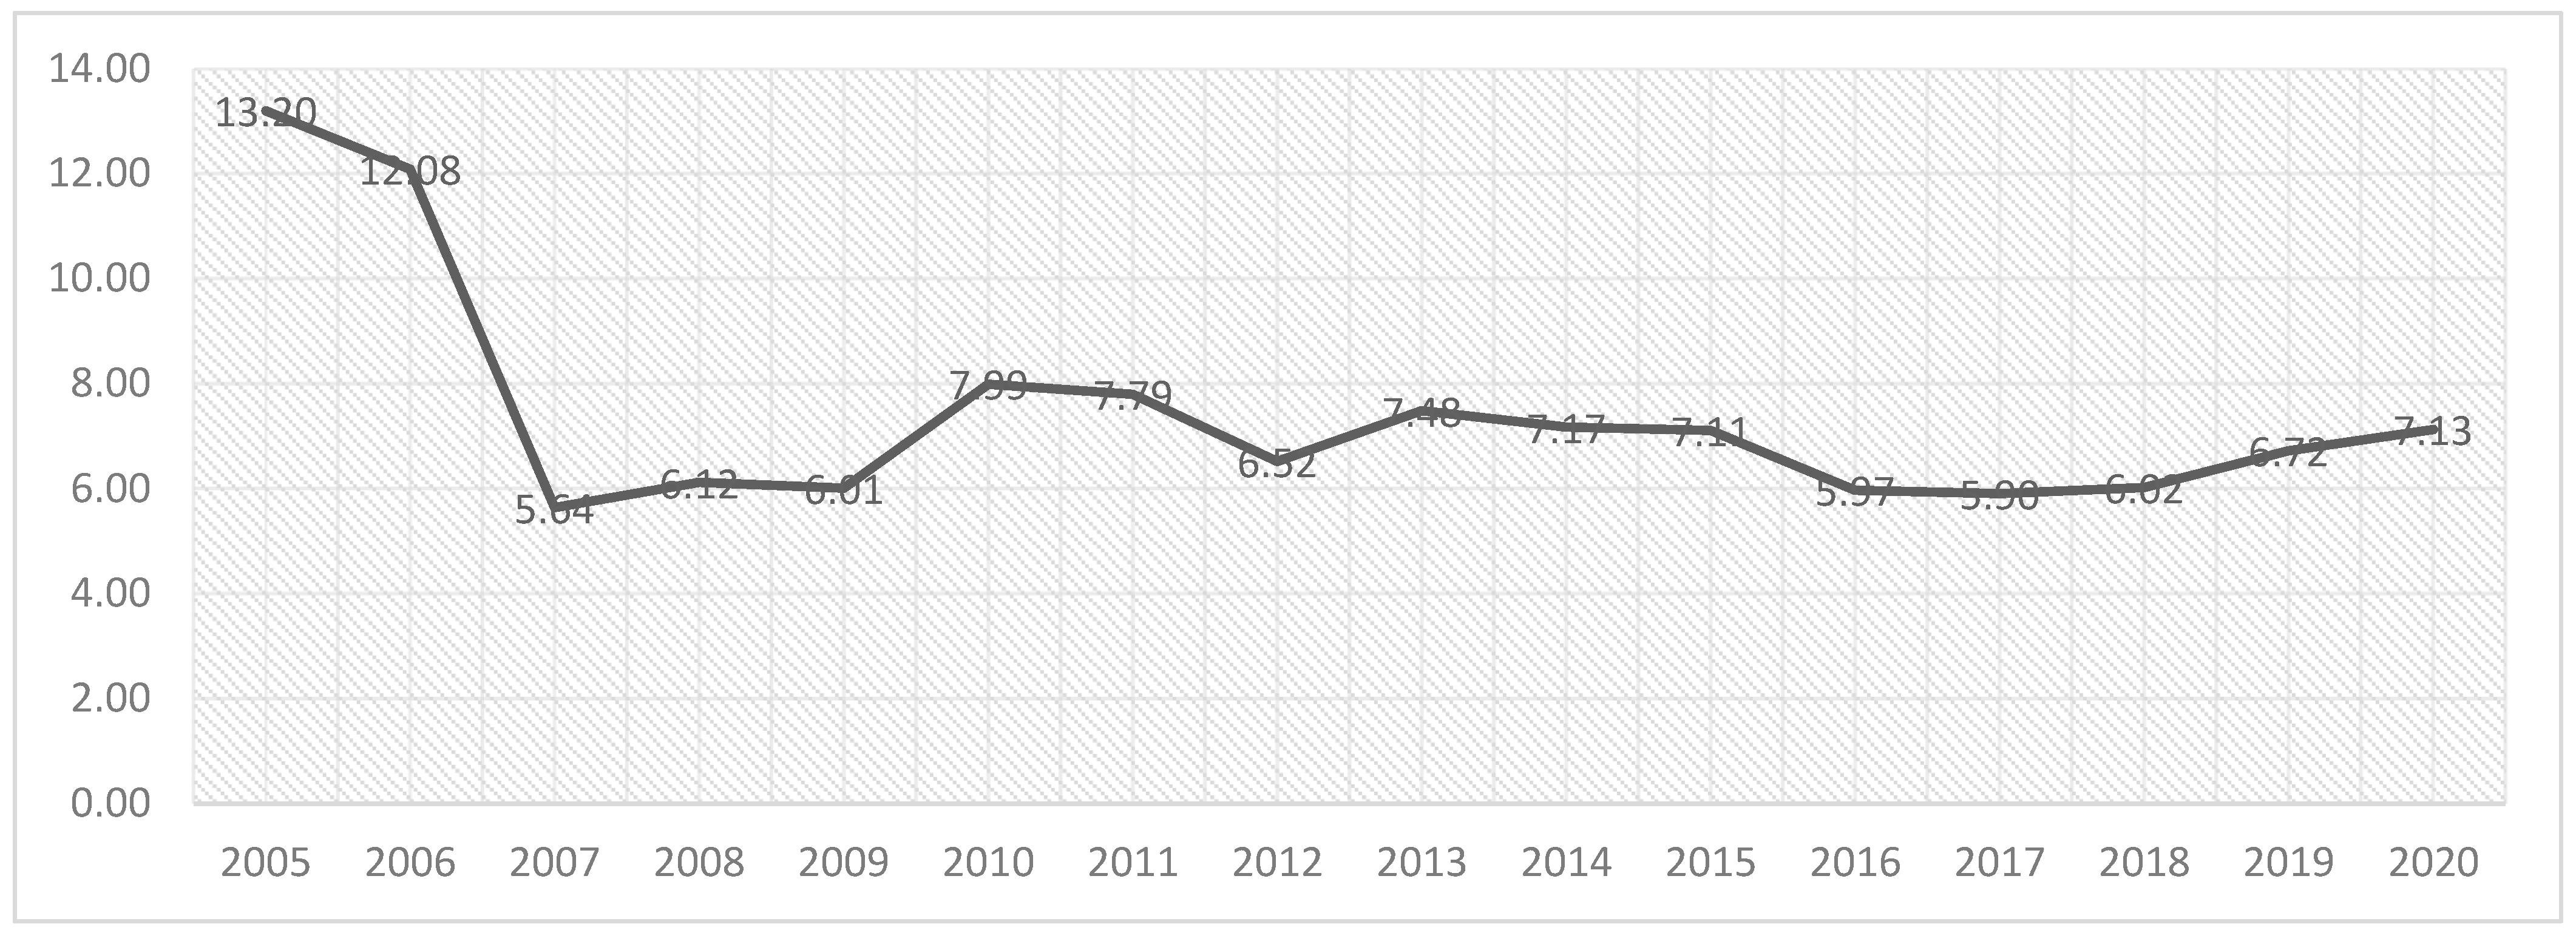
The analysis of efficiency is illustrated in
Figure 14, considering turnover in proportion to the average annual number of employees of food-and-beverage service providers.
Significant improvement was observed in 2005–2007: The value decreased by 57.27%, and thus 2007 showed the most favorable index, with 5.64 points. The period of 2007–2020 showed fluctuation, although constant and moderate annual setbacks followed from 2017 until 2020, with 20.80% in total. In this regard, the impact of the pandemic did not change the trends of efficiency significantly, as in case of tourist-accommodation service providers, generating a 6.1% change in value, which was the sixth highest index ranking.
4.4. The Evalutaion of Hypotheses Based on the Main Results
Regarding the main research question of the present study, the statistical data and the author-built database of the primary superstructure within the LAU level of Bihor County enabled the investigation of territorial differences of the examined service providers and their financial characteristics for the period of 2005–2020. As far as the concentration of firms is concerned, hypothesis H1 was validated primarily based on the cartographical methods used within the ArcGIS 10.4.1 mapping software, which showed the central role of Oradea and Sânmartin having a high proportion of supply in the case of both accommodation and food-and-beverage service providers in Bihor County, regarding the number of entities, and in terms of the turnover and average annual numbers of employees. Thus, the trends of firms at the county level were determined by aggregated values of service providers within Oradea and Sânmartin. Secondly, the Hoover indexes of turnover in proportion to the population of the LAU, aggregated at the county level for both groups of examined firms, were represented by raised values, indicating the great territorial concentration of service providers, causing significant territorial differences. Hypothesis H2 could not be validated nor convincingly refuted due to fluctuation of the values of the Hoover index for the territorial inequalities for both types of service providers during the period of the financial crisis and COVID-19. Therefore, definite trends of changes in territorial inequalities could not be identified.
As far as the validation of hypothesis H3 is concerned, the evaluation of service providers for potential destination types at the local level provided a clear vision of changes to the primary superstructure for rural areas, too. Since the county seat and main health- and spa- tourism destination, Sânmartin, had leading values within Bihor, these territories faced the highest decrease in turnover and average annual number of employees, whereas the rural destination type showed the lowest proportion of relapse in terms of turnover of firms within this type. However, distinct tendencies were present in the case of the number of employees among the two types of firms. In this regard, hypothesis H3 was refuted owing to the statistical analyses of the performance of firms on level of the LAU.
4.5. Key Aspects, Limitations, and Future Prospects of the Research
As the primary superstructure of Bihor was examined, we focused on the active firms in the field of hospitality within the studied area. The mapping of the territorial distribution of entities enabled us to highlight the most concentrated local governments, which concurs in some aspects with the findings of Herman et al., placing Oradea and Sânmartin as central areas in the case of both accommodation and food-and-beverage providers, and regarding the number of entities, turnover, and average annual number of employees [
58]. However, the significance of new results was present in the case of tracking the evolution of still-active entities of the field at the level of the LAU and the potential destination types of these local governments amongst the two main periods of crises that concerned Bihor since 2005, a period of time that was also defined by Romania joining the European Union in 2007. Furthermore, by using the Hoover index, the high proportion of territorial concentration was confirmed, which showed us significant inequalities in the case of turnover by the population at the LAU county level. A new aspect could be the measurement of the efficiency of the examined service providers by reinterpretation of the Hoover index regarding the proportion of turnover on the average annual number of employees.
Despite the detailed insight provided by this research, the present study is not free from limitations. Although this paper provides important outcomes, the generalizability of the results to a wider context needs to be carefully and consciously considered. In addition, since the database of entities contained details of turnover and average annual number of employees for only the firms that were registered in Bihor County and enabled public access to financial data, the dataset suffered deficiency in the extent of some of its coherence. In this regard, lodging enterprises with centralized management with other entities in their chain or those with limited access to their data were counted only in the number of entities without additional financial details. For instance, this difficulty arose in the case of Continental Forum Oradea as part of Continental Hotels JSC and Ceres Hotel of T.B.R.C.M. JSC, Muncel Hotel of Sind Tour Trading LLC, Padis Hotel of Sind Romania LLC, and CSDR Sind Tourism LLC in Sânmartin. Furthermore, six entities had not reported any financial activities that were registered before 2016 within the territories of Oradea, Aleșd, Cherechiu, Bratca, Diosig, and Câmpani. In the case of food-and-beverage service providers, 21 of 1066 had not provided any financial data, of which 10 were in Oradea, and one–one entities in the case of Aușeu, Biharia, Bratca, Ciumeghiu, Pocola, Nojorid, Roșiori, Salonta, Sântandr, and Toboliu. In these terms, the actual values of turnover and average number of employees could deepen the perceived territorial concentration and influence the results of the Hoover index.
Another limitation of this study consists of the examined timeframe for the investigation of the long-term effects of COVID-19 on the hospitality sector of Bihor, which could be addressed in future studies extending and updating the databases of firms. Subsequently, several other methods of analysis could be applied to the dataset and the statistics in order to reveal interrelations. A widely used method of qualitative analysis, namely, the semi-structured interview, was originally designed for exploratory research of the efficiency of the examined firms, although the pandemic limited the potential for face-to-face interactions during the period of data collection. Nevertheless, the present paper could provide significant background for further exploratory research.
5. Conclusions
Regarding the development of superstructure in Bihor County, the tourist-accommodation supply faced significant improvement both in number and in territorial distribution, although the outstanding central areas were Oradea and Sânmartin, despite the fact that development strategies of Bihor highlighted the diversification and improvement in quality of the tourism supply in rural territories in 2007–2013 and then in rural and mountainous areas in the period of 2014–2020. In the case of food-and-beverage service providers, the improvement was also remarkable, and Oradea was the most important central area, with Sânmartin in second place again. Therefore, the urban- and health- and spa-tourism destination categories defined the trends of Bihor with the abovementioned leading local governments. Based on the territorial distribution of service providers, peripherical areas appeared exclusively in the case of mountain- and rural-tourism destination types.
On the one hand, both the financial crisis and COVID-19 had a negative impact on the efficiency and improvement of tourist-accommodation and food-and-beverage service providers. On the other hand, the latter affected businesses more intensely, causing redundancies and a decrease in turnover and reducing the values of the statistics to a level before the year of 2017 in the case of food-and-beverage service providers and to a level before the year of 2016 for tourist-accommodation service providers, interrupting the constant growth after 2014. The strategies emphasize the quantitative and qualitative improvement of primary superstructure, mainly in the case of accommodation-related service providers, although the improvement of the net-use rate of already-functioning lodging services, the resilience, and the financial sustainability of the sector were not highlighted, not even after the financial crisis. Moreover, despite the intentions of more efficient exploitation of resources, the creation of joint offers, and the promotion of destinations, the beforementioned factors should also be included in development plans in order to increase the long-term contribution of tourism to local economies. However, the basic criteria of the business environment of tourism were targeted and the informal, unofficial activities of lodging services, mainly in rural and mountainous areas, imply a significant distortion of the statistics.
Furthermore, in contrast to the congruent trends of the examined group of service providers, based on turnover and the average annual number of employees, the trends of the results differed based on the Hoover index for territorial inequalities and for efficiency analyses. Although fluctuating values were present in each case, different trend lines were identified. The territorial concentration gradually increased for tourist-accommodation service providers from 2017 to 2020, and neither the pandemic nor the financial crisis in 2008 changed the trends. However, in the case of food-and-beverage service providers the results showed decreasing values after 2015, and the Hoover-index points achieved the most favorable figure in 2020 due to COVID-19, causing a significant loss in turnover in the case of Oradea, which was the outlier in terms of the number of entities and the value of the turnover, decreasing the level of concentration. The financial crisis and the following period showed fluctuation, as was the case before 2008.
The results of the efficiency analyses also differed in the case of trends. In the case of lodging services, improvement was observed in 2014–2019, which was interrupted by the pandemic, causing a significant change in trends in contrast to the financial crisis. For food-and-beverage service providers, there was a gradual decrease in efficiency after 2017, and COVID-19 did not change the trends, although after 2009 the values increased, reducing efficiency. In conclusion, the pandemic affected the tourist-accommodation service providers more significantly, although the indicator of efficiency still showed better values than for food-and-beverage service providers.


