
Prediction of Gender-Biased Perceptions of Learners and Teachers Using Machine Learning
by
 , , ,
, , ,
Ghazala Kausar
1,
Sajid Saleem
2,
Fazli Subhan
3,4,
Mazliham Mohd Suud
4,*,
Mansoor Alam
4 and
M. Irfan Uddin
5
1
Department of English, National University of Modern Languages, Islamabad 44000, Pakistan
2
Department of Computer Science, National University of Modern Languages, Lalazar, Rawalpindi 46000, Pakistan
3
Department of Computer Science, National University of Modern Languages, Islamabad 44000, Pakistan
4
Faculty of Computer and Information, Multimedia University, Cyberjaya 63100, Malaysia
5
Institute of Computing, Kohat University of Science and Technology, Kohat 26000, Pakistan
*
Author to whom correspondence should be addressed.
Sustainability 2023, 15(7), 6241; https://doi.org/10.3390/su15076241
Submission received: 21 January 2023
/
Revised: 10 March 2023
/
Accepted: 15 March 2023
/
Published: 5 April 2023
(This article belongs to the Special Issue Artificial Intelligence and Smart Technologies for Achieving Sustainable Goals)
Abstract
:Computers have enabled diverse and precise data processing and analysis for decades. Researchers of humanities and social sciences are increasingly adopting computational tools such as artificial intelligence (AI) and machine learning (ML) to analyse human behaviour in society by identifying patterns within data. In this regard, this paper presents the modelling of teachers and students’ perceptions regarding gender bias in text books through AI. The data was collected from 470 respondents through a questionnaire using five different themes. The data was analysed with support vector machines (SVM), decision trees (DT), random forest (RF) and artificial neural networks (ANN). The experimental results show that the prediction of perceptions regarding gender varies according to the theme and leads to the different performances of the AI techniques. However, it is observed that when data from all the themes are combined, the best results are obtained. The experimental results show that ANN, on average, demonstrates the best performance by achieving an accuracy of 87.2%, followed by RF and SVM, which demonstrate an accuracy of 84% and 80%, respectively. This paper is significant in modelling human behaviour in society through AI, which is a significant contribution to the field.
1. Introduction
The advent of new computational tools such as artificial intelligence (AI) has made it possible to analyse diverse and big data belonging to different disciplines of applied sciences. The same trend is now emerging in many areas of social and behavioural sciences [1,2]. AI has made it possible to replicate human intelligence in machines and to provide accurate prediction and decision-making [3,4]. The interdisciplinary crossroads of AI are now increasingly transforming the way the data is analyzed and solutions to different critical problems and investigations are sought. According to Bostrom [5], a machine trained with AI could supplant academicians, physicians, lawyers and social workers in the future.
A report by UNESCO 2019 [6] highlighted the bridging of gender discrimination and digital assistance, featuring recommendations on overcoming gender gaps in digital skills focusing coding on numerous AI applications. According to the critical findings of UNESCO 2019, global dialogue on the nexus of AI and gender bias is required and AI approaches skew significantly towards gender impartiality, which can lead to constructive changes in society. For example, an instance of this would be AI-powered recruitment software, which can be deployed to eliminate gender biases against women and, at the same time, should benefit employers in incorporating gender-sensitive language for writing more inclusive job postings.
Research on highlighting gender discrimination can play a crucial role in eliminating gender biases in society. Different attempts have been made at the government level in Pakistan to deal with this issue, especially in the education sector. The government of Pakistan is reinforcing international commitments to include gender justice in Pakistan’s Education Sector Reforms (2001–2005) and also in the National Plan of Action (2001–2015). The focus is to make the curriculum align with the needs of learners and remove gender discrimination from the text books and curricula [7].
Researchers have analysed different text books in Pakistan at various levels and have established that gender partiality prevails in these text books [7,8,9]. Primarily, the studies cited above have examined the depiction of gender in the text books. According to Sunderland [10], the analysis of gender representation in text books only cannot provide a practical solution to the issue of gender discrimination. She points out that what is inside the minds of learners and teachers need to be taken into consideration to understand the phenomenon comprehensively. Keeping this aspect in focus, this paper examines the gender perceptions of teachers and learners in addition to the analysis of text books taught at undergraduate level in the Khyber Pakhtunkhwa (KPK) province of Pakistan. The gender perceptions of the teachers and learners are modelled with AI, which can be used to predict the gender bias in the text books, which has not been studied before. The paper addresses the following research questions:
- How is gender portrayed in the text books, and what are the perceptions of teachers and learners regarding gender depiction?
- To what extent does AI-assisted gender-portrayal prediction vary according to different themes?
The main contributions of this paper are as follows:
- An analysis of the two text books taught at intermediate level to discern gender portrayal in these text books.
- An investigation of the perceptions of teachers and learners regarding gender portrayal in the English text books.
- A comprehension and discussion of the AI-assisted gender-portrayal predictions as perceived by the teachers and learners.
- A reflection on the implications of the integration of human–AI analytical disparities around gender inequality.
The paper is significant to bridging the gap between the nexus of AI and gender-bias prediction which has yet to be explored, to the best of our knowledge. The remaining of the paper is organized as follows. Section 2 presents an overview of related work. Section 3 presents the material and proposed methodology. Section 4 presents experimental results. Finally, the paper is concluded in Section 5.
2. Literature Review
AI takes advantage of human experience to design intelligent machines [11,12,13]. There is a global policy program to endorse the attainment of United Nations Sustainable Development Goals by 2030 and to improve quality of life [14]. AI has been used to supplement human intelligence through natural language processing, image analysis, sensors, internet of things and many other applications which are impactful in considering the synthesis of humans and AI and the effects of this nexus on society [15,16].
AI, for several years, has been applied successfully in the applied sciences domain but now it is finding its path in diverse fields such as social and behavioral sciences [17]. This significant upsurge is due to the availability of data for AI training and the improvements in computational tools for data analysis. Social and behavioral sciences are employing research methodologies driven by AI [18,19]. Many examinations of AI usage have been employed in the recent times, for instance, in the field of health sciences [20]. AI is seen as a way to provide countless opportunities for the betterment of society. It is considered a fundamental area for attaining the UN Sustainable Development Goals and has the potential of providing cost-effective, user-friendly and precisely targeted services [21].
When different social groups interact, stereotyping is evident and one manifestation of this is gender stereotyping [22]. It associates conventionally and socially perceived attributes and qualities with specific genders [23,24]. On one hand, this stereotyping substantiates overgeneralized social categorizations [25] and on the other hand, it increases influence on the social behavior and attitudes leading to discrimination, prejudice and other social conflicts [24]. As asserted by Raudman et al. [26], gender stereotyping can be seen in mass media as well as in the general public. For instance, gender differences are accentuated, whereas in fact the different genders have more similarities than differences [27]. Moreover, there is varying intensity of gender stereotyping across different cultures [28].
Gender bias has been identified in academia [29,30]. Nevertheless, the implementation of gender-equality policies in society and academia is hardly visible, even in this modern world [31]. Women are persistently underrepresented in higher ranks of academic institutions (European Commission [29,32]), as well as in editorial bodies [33]. Men are relatively better paid than women [34], and the research funding of women is less likely to be granted than that of men [35]. In addition, while analyzing the comparison of promotion patterns, men are seen to be promoted to higher positions more often than women [36].
Gender discrimination denotes that the treatment of genders is unequal and disproportionate, specifically, the unequal treatment of women by men based on the belief that men are superior to women. Roussel [37] asserts, regarding gender discrimination, that gender discriminators regard men as privileged and superior to women. In addition, it is based on the physiological dissimilarities among women and men that their economic and social ranks are established [38].
Language is employed to share, express and establish the thoughts and beliefs of the people of a society [39], and if the society is patriarchal, gender discrimination is rooted in the language. This needs to be studied not only to understand the phenomenon but also to eliminate it [39]. Gender discrimination and bias has been researched in educational materials, especially in text books, of schools around the world. Studies showed that gender bias is a prevailing aspect of these text books [40,41,42,43,44,45].
Zakka [40] examined text books of Mathematics taught at a primary level in Nigeria, employing content analysis, and concluded that women are underrepresented by approximately one to seven. Stockdale [45], after analyzing English as a Foreign Language text books, reported that even text books taught for complete oral communication courses are biased towards males. A recent work conducted in Afghanistan [42] investigating English text books concluded that males are over-represented, which promotes gender inequality and which was also shown in the study conducted in Iran [44]. Hamdan [43] also reported culturally prevalent gender bias in English text books taught at public schools in Jordan.
Investigations on various facets of gender portrayal in text books refer to visibility, which is the presence of female and male characters in the books [46]. It is considered one of the vital aspects of gender research, according to Stockdale [45]. Porreca [47] employed the term ’omission,’ referring to less representation of one gender in comparison to other. Moreover, the unequal gender representation in text books reinforces that the females are shown weaker than men [7]
In this paper, teachers and learners’ perceptions regarding gender bias in the text books of Khyber Pakhtunkwa (KPK), Pakistan, are investigated and modelled with AI and, also, an analysis of text books taught at intermediate level is carried out to identify the gender portrayal in these text books.
The culture of KPK is relatively more conventional and conservative in comparison to other regions of Pakistan. It is considered, in KPK, that the male members of the society are trendsetters and decision-makers due to the culture and the ideology of the Pakhtunwali. It is interesting to examine the extent to which such practices are reflected in the text books and perceived by teachers and learners and then modelling these with AI so that predictions regarding gender perceptions of teachers and students can be made.
3. Materials and Methods
This section presents methodology used to use AI to model the gender-biased perceptions of the respondents (teachers and learners) as perceived by them for the English text books.
3.1. Methodology
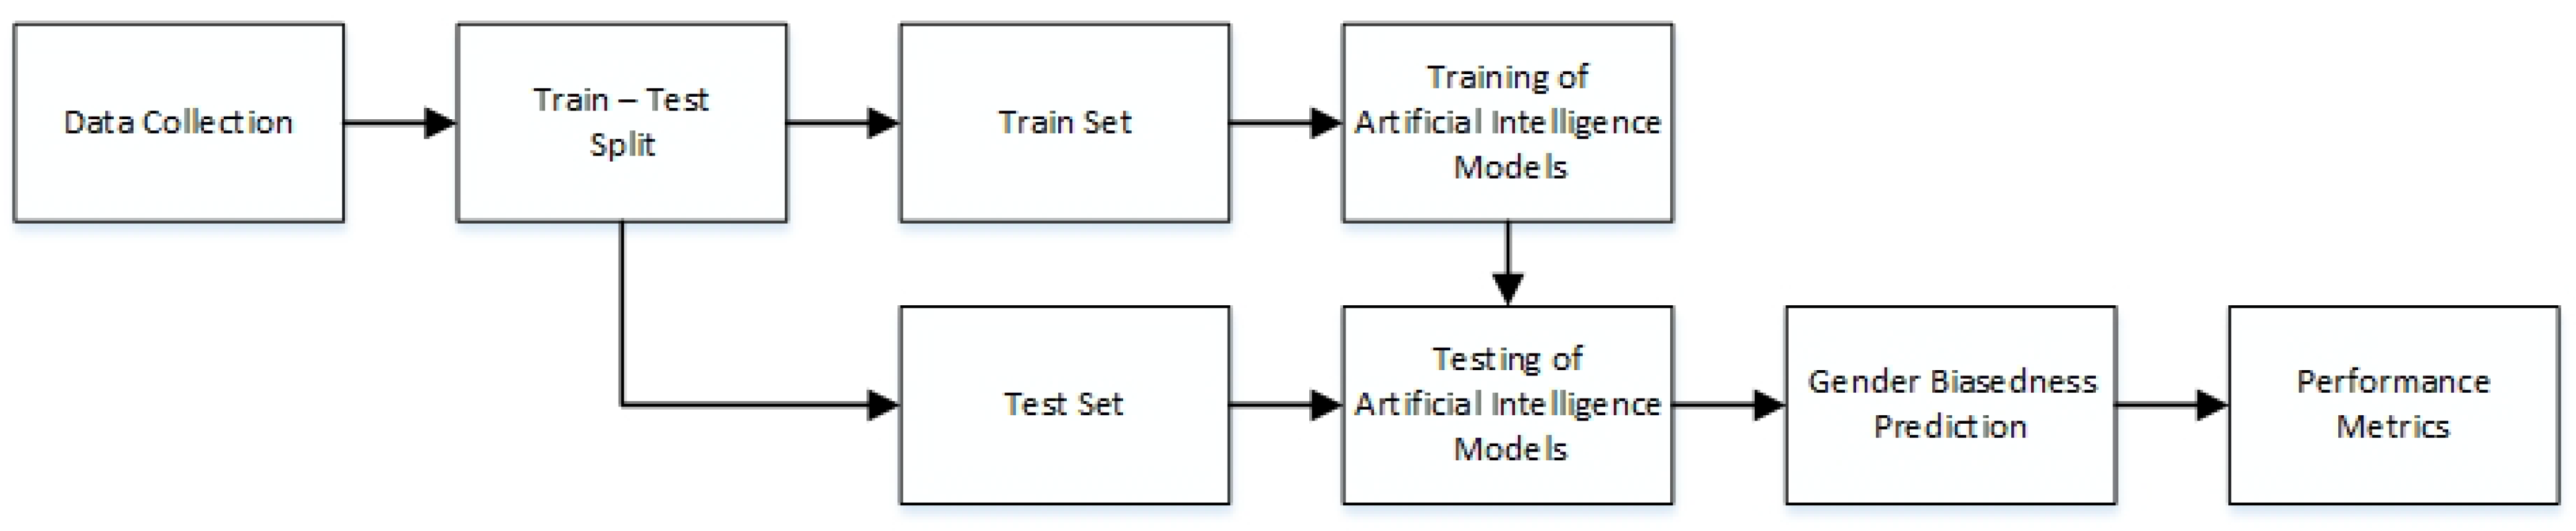
Figure 1 presents the block diagram used to implement AI for the prediction of gender bias.
3.2. Data Collection
The data for the present study includes two English text books taught at intermediate level. For the perception of teachers and learners, responses from 470 teachers and learners from twenty randomly selected colleges were collected. First of all, gender portrayal was investigated in English text books taught at the intermediate level, and then the perceptions of students and teachers were analysed.
3.3. Data Description
A Likert-scale questionnaire was adapted from Refs. [7,48] to collect data from the students and teachers. Permission was taken from college authorities and informed consent was taken from the participants. The researcher herself distributed 1000 questionnaires to twenty randomly selected colleges. Out of 1000, 680 were returned. The questionnaires were analysed and questionnaires with missing information or partially completed were discarded. Out of 750, 470 filled questionnaires representing an equal number of male and female students and teachers were taken and analysed for the present study.
Table 1 provides the themes upon which the questions are focused in the questionnaire. All questions focused on the respondents perceptions of gender-bias embedding in the text books. Table 2 provides the statistics about the respondents, i.e., number of teachers, learners, gender and the age group.
In total, 19 different questions were asked to each respondent. The respondents were asked to register their answers to each question in the discrete scale from 1 to 5. After each respondent had responded to all 19 questions, the data of the each respondent was labeled by experts as agreeing or disagreeing with the existence of the gender biases in the text books through interviews and discussions with each respondent.
3.4. Data Labeling and Train–Test Split
The dataset was collected from 470 respondents, each answered 19 different questions. The responses of each respondent were analysed by three experts in order to classify the respondents, based on their responses, into two classes, i.e, gender bias—True or False.
The data set was randomly split into two disjoint sets: train set and test set. The train set was used for the training of AI/machine-learning (ML) techniques whereas the test set was used for the testing of the AI/ML techniques. The test set is helpful in analysing the generalization error of the ML techniques, i.e., how the machine responds to data that is not seen/learnt during the training phase. In this paper, 20% of the data was used for testing purpose and remaining 80% to train the ML techniques.
Additionally, K-fold validation with K = 10 was used for parameter tuning as well as for the regularization of the ML techniques. The K-fold validation was applied on the train set only. All the techniques were implemented in Python, and the hyperparameter tuning for these techniques was performed by a random search process using the RandomizedSearchCV function of the scikit-learn library of Python. To obtain the results for different themes listed in Table 1, only the labels along with the responses collected against the themes’ questions were used for the training, validation and testing.
3.5. AI/ML Training and Evaluation
AI/ML techniques used in this paper are support vector machine (SVM), logistic regression (LR), decision trees (DT), random forest (RF) and artificial neural networks (ANN). Each technique was trained on train set only and then evaluated on test set. The performance of each technique was compared with the others using evaluation metrics such as accuracy, precision, recall and f1 scores. All these techniques were implemented using AI/ML libraries of the Python. For SVM, LR, DT and RF, the scikit-learn Python library was used. Hyperparameter tuning for these techniques was performed by a random search process using RandomizedSearchCV function of the scikit-learn. In case of ANN, tensorflow library was used. A brief description of each of the AI/ML techniques is given below:
3.5.1. Support Vector Machine
SVM is a supervised learning technique and a binary classifier [49]. SVM maps training instances to higher dimensions in a manner to maximize margin or the width of the gap between the classes. It constructs a hyperplane(s) in a high-dimensional space which maximizes the margin. A large margin means a lower generalization error and better performance. SVM fits well on a complex and non-linear, but medium-size, dataset. In this paper, SVM was trained using two different kernels, ie., linear and radial basis function (RBF). The parameter tuning for these kernels as well as regularization for controlling overfitting was implemented. The hyperparameter tuning for SVM-Linear was carried out on penalty (L1 or L2), loss function (hinge or squared_hinge) and soft margin (C: 0.1 to 5) with the help of RandomizedSearchCV. In case of SVM-RBF, the parameters such as soft margin (C: 0.1 to 5) and RBF Gamma (auot or scale) were also tuned with the help of RandomizedSearchCV.
3.5.2. Logistic Regression
Logistic regression is a supervised learning technique capable of classifying two or more classes [50]. It uses a logistic function to model the output-dependent variable. The logistic model has a dependent variable with two or more possible values and combines one or more independent variables to predict the value of the dependent output variable. For hyperparameter tuning, the parameters such as penalty (L1 or L2) and inverse of regularization strength (C: 0.1 to 5) were tuned with the help of RandomizedSearchCV.
3.5.3. Decision Trees
Decision tree (DT) is a versatile machine-learning technique used for binary and multi-label classification tasks [51]. It is based on applying thresholds to the feature values for decision making. The feature and its threshold for the split is calculated with the help of gini, entropy, or log_loss impurity scores. DT performs a series of decisions on the observations starting from the root node to the leaf nodes in order to identify the target class for the observation. DT is known for its intelligibility and simplicity and easy understanding. The hyperparameters’ tuning for DT is performed on parameters such as split criterion (gini, entropy, or log_loss), the minimum number of samples (2 to 5) required to split an internal node and the minimum number of samples (2 to 5) required to be at a leaf node with the help of RandomizedSearchCV.
3.5.4. Random Forest
Random forest (RF) is an extension of decision trees. It is a powerful machine-learning technique based on the ensemble learning technique [52]. Compared to DT, RF deploys multiple decision trees for reaching a prediction decision. It can be used for binary as well multi-label classification tasks. It generalizes well on complex and nonlinear data sets and is easy to train. DT and RF are considered less complex than SVM. In this paper, the number of decision trees denoted as estimators used for RF training varies from 3 to 15. Additionally, the hyperparameters, such as the function to measure the quality of a split (gini, entropy or log_loss), the minimum number of samples (2 to 5) required to split an internal node, the minimum number of samples (2 to 5) required to be at a leaf node and the percentage of samples drawn randomly (40% to 80%) for each estimator, were identified through RandomizedSearchCV. RF combines the output of multiple decision trees to reach a single decision, which means that the aggregation of decision of the multiple estimators, in an ensemble way, tends to give better results compared to a single decision tree.
3.5.5. Artificial Neural Network
Artificial neural network is a supervised learning technique inspired by the working of biological neural networks [53]. It consists of connected units or nodes called artificial neurons, which receive inputs and multiply them with certain weights to produce output. The output is then fed into another neuron. This forms a network of neurons through connections. The training of the ANN is carried out by specifying the learning rate, number of hidden layers, number of neurons per layer and the batch size. ANN normally fits well on different types of linear/non-linear and complex datasets compared to the other above techniques. ANN is considered to be a data-hungry algorithm and produces low generalization errors in big data. In this paper, the number of layers varies from 1 to 4 with the number of neurons per layer varying from 1 to 128 neurons and Relu activation function was used for the neurons. The output layers contained single neuron due to binary classification with a Sigmoid activation function.
3.6. Performance Metrics
The performance of each AI/ML technique was compared with others using Accuracy, Precision, Recall and F1 scores. These scores were calculated as follows:
where and represent true positive, true negative, false positive and false negative, respectively.
4. Experimental Results
This section presents an analysis of the two text books used in this paper, along with the experimental results. The experimental results are presented theme-wise. In the end, all the themes are combined to compare the performance of ML for the prediction of gender bias, with that of individual themes.
4.1. Analysis of Text Books
An analysis of the two text books taught at college level was carried out to identify the portrayal of gender in these books. The two books are taught at first and second year in all the Government colleges of the province. Various aspects of gender portrayal in the text books were analysed by researchers. For the present study, an integrated model based on pioneering research by [47] and further enhanced by Hasan [54] was used to identify gender portrayal in the text books. The following categories were identified after content analysis of the two books based on the integrated model:
- Presence of male and female characters in the books. For this category, all the books were thoroughly read. The number of male and female characters were counted. Their frequencies and percentages are presented in a table.
- Allocation of different roles in the books. For this category, the frequency of main, supporting and minor characters was analyzed.
- Use of nouns for males and female characters. For this category, an analysis of nouns used for male and female characters was carried out.
The number of male and female characters is shown in Table 3. In the first book, three quarters of the characters are male as compared to one quarter being female characters. The number of female characters in the second book is even lower than the first book, which makes a total of eighty percent for males and merely fourteen percent for females. The character representation of the two genders in the designated books tends to endorse the fact that males preponderate in these settings. In Book 1, about three quarters and in Book 2 more than three quarters of the mentions include men and their male counterparts. This persistent occurrance is inclined towards the establishment of a dominant–recessive relationship, in which one gender (often male) is conveniently used to create an inconspicuous effect on the other gender (usually female).
In the second category, the distribution of characters is also biased towards females. Table 4 and Table 5 shows the distribution of different characters in Book 1 and Book 2, respectively.
The characters were also evaluated in light of the different parts played during their appearance, which still relates to the point that the reader is encouraged to develop a male-dominated image of whatever text put forward. According to the data collected from Book 1, the leads as well as the supporting persons are males 70% of the time while female depiction is scarce and usually undermined.
In Book 2, on the other hand, the gender bias further worsens, as about 90% of the leading and supporting characters are males while women contribute an insignificant 10%. In the minor roles, however, women have a 30 percent share and, hence, they often remain hidden from the eyes of the audience.
In the last category of nouns and adjectives, the number of males overshadows females. The data is shown in Table 6. An analysis of the occupational roles of the male and female figures rendered the difference in gender portrayals extensive. In Book 1, it was observed that women are less likely to be represented with no role associated with her. On the other hand, men are depicted in abundance in whatever role they are cast in, save for the role of a husband. They outweigh the women in numbers and appearances, confirming a blatant gender discrimination. Lastly, the gender representation in Book 2 describes men and women as individuals as well as suited to their filial occupations. Though husband and father are glorified as compared to the role of a wife and mother, it can be observed from the stated data that sisterly characterization outweighs the representation of brothers. In addition, the role of the daughter was also more acknowledged and exalted as compared to that of the son.
4.2. Emphasis on Male Characters
This theme pertains to the representation and emphasis on male characters in the text books along with considering male as a higher being than woman. There were a total of four questions which were asked to all the 470 respondents. These questions focus on the portrayal of more male characters in the text books and also their portrayal in better roles than women.
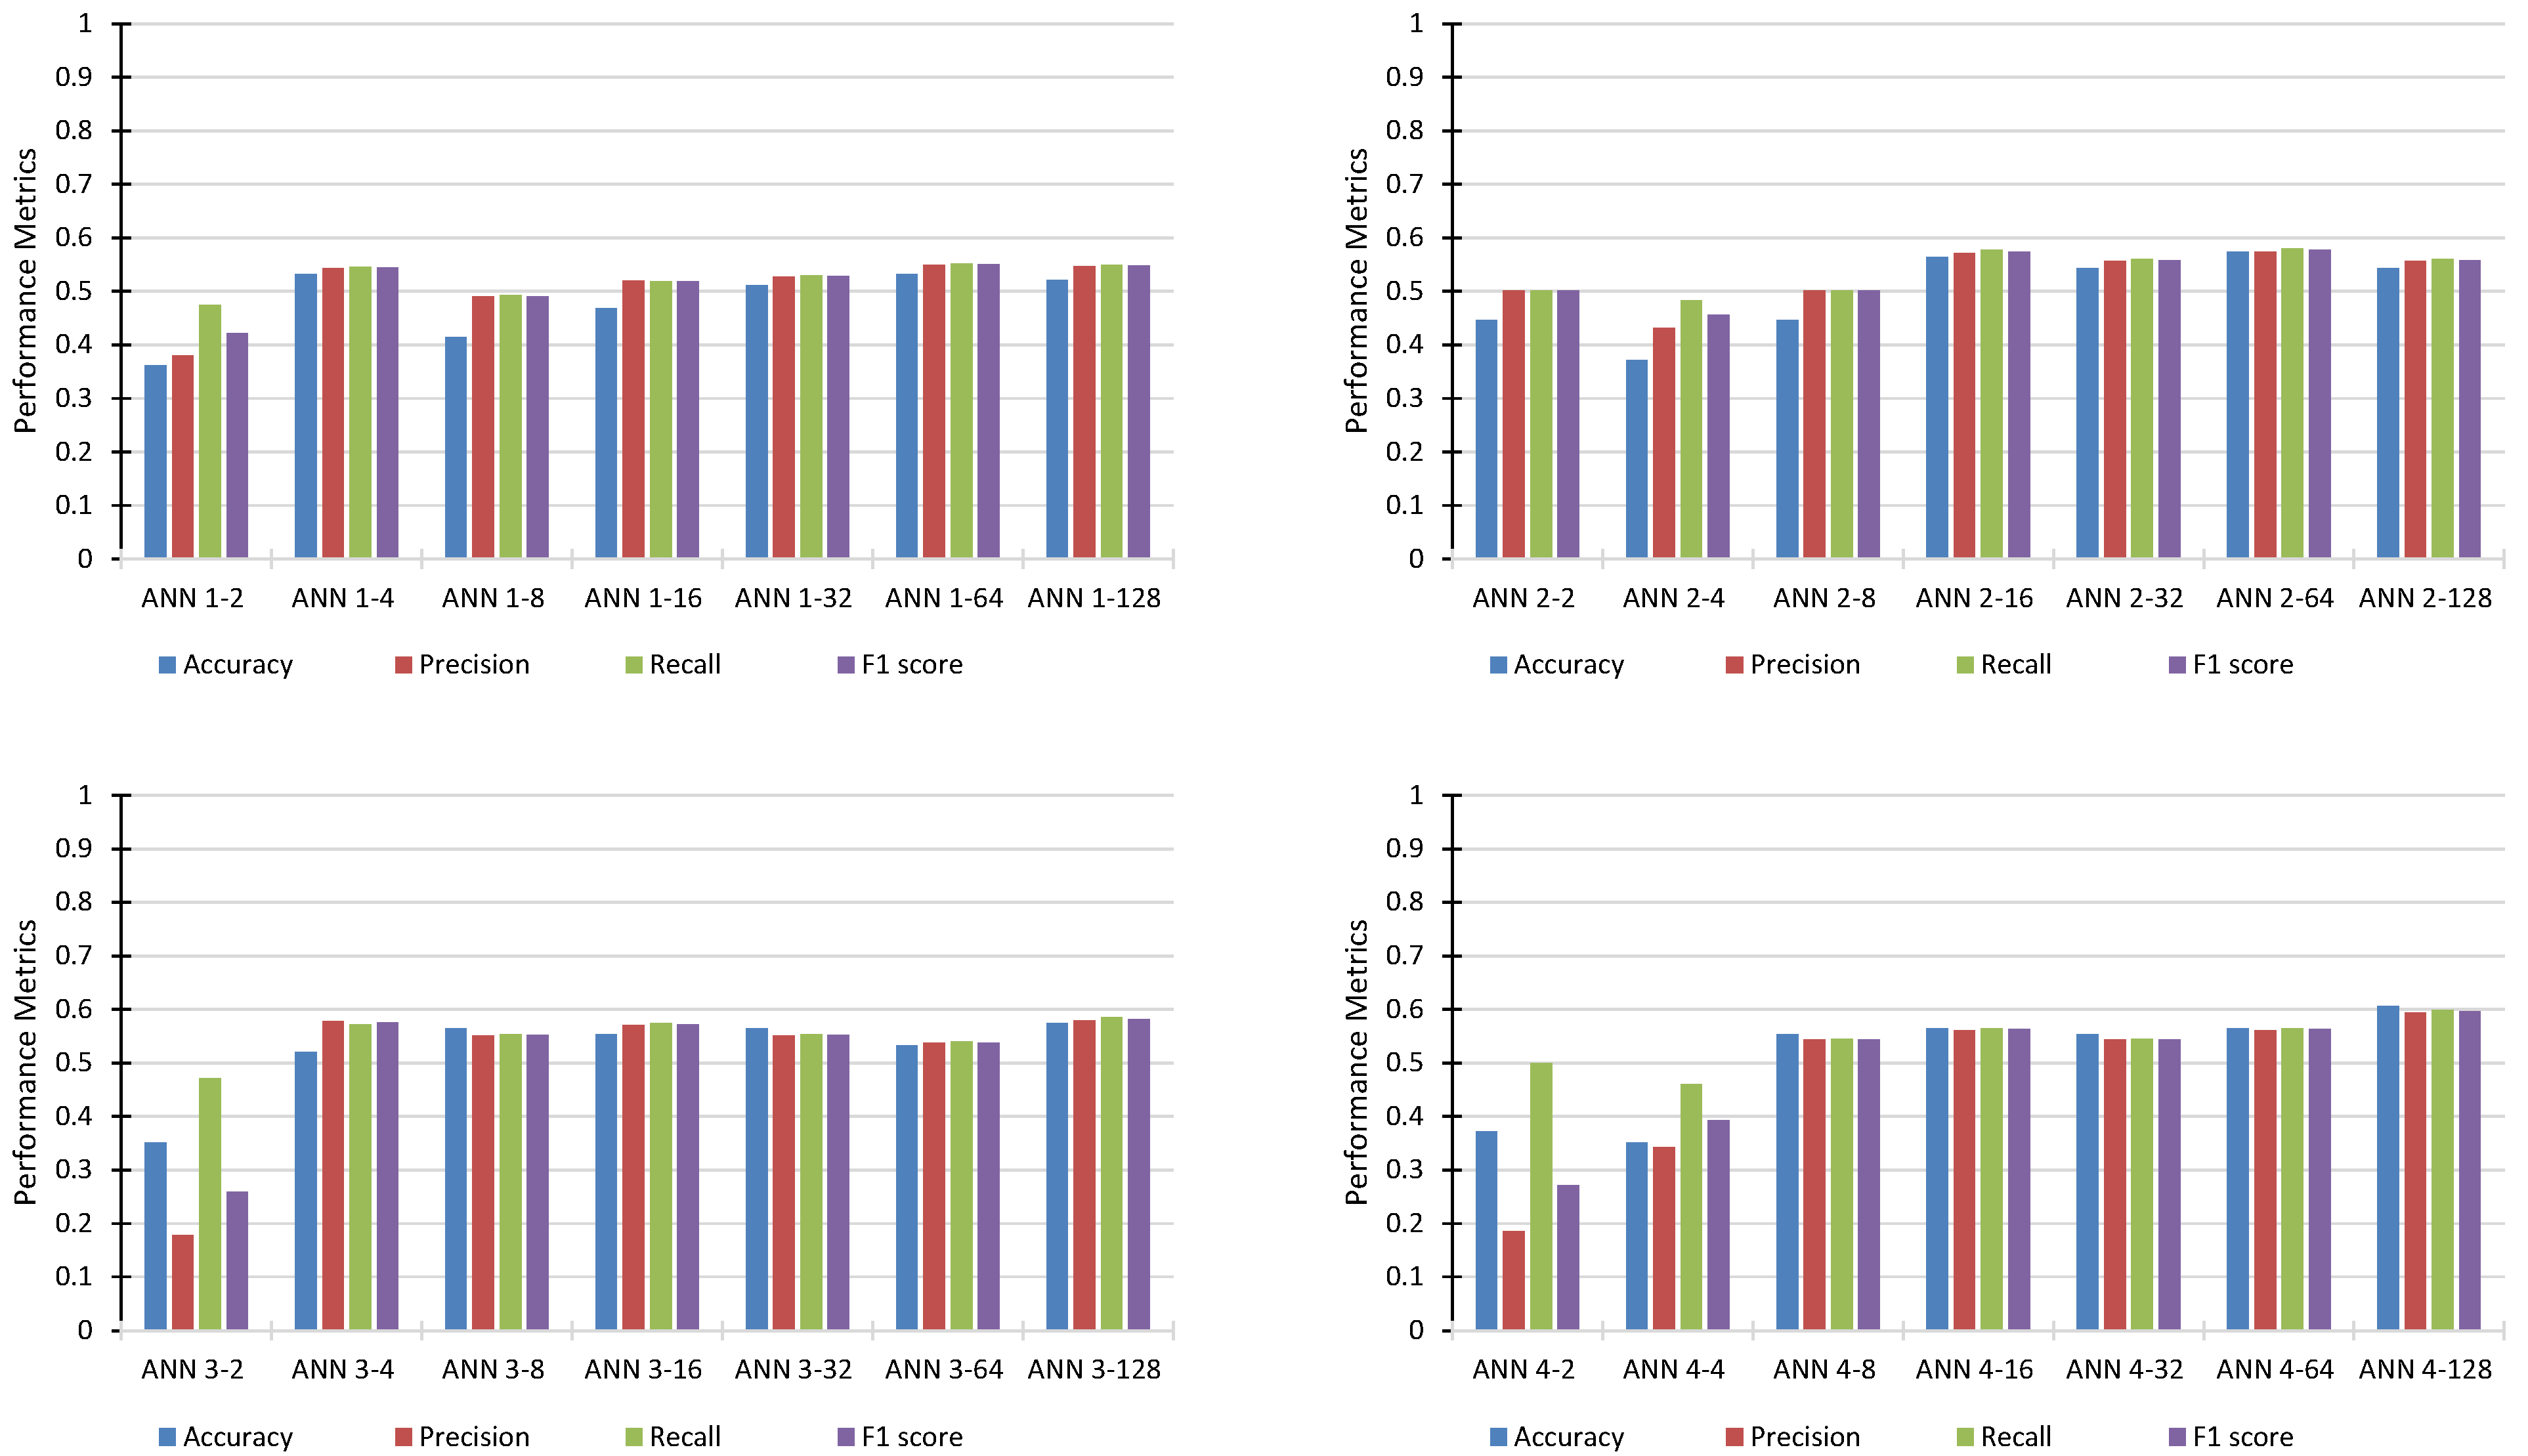
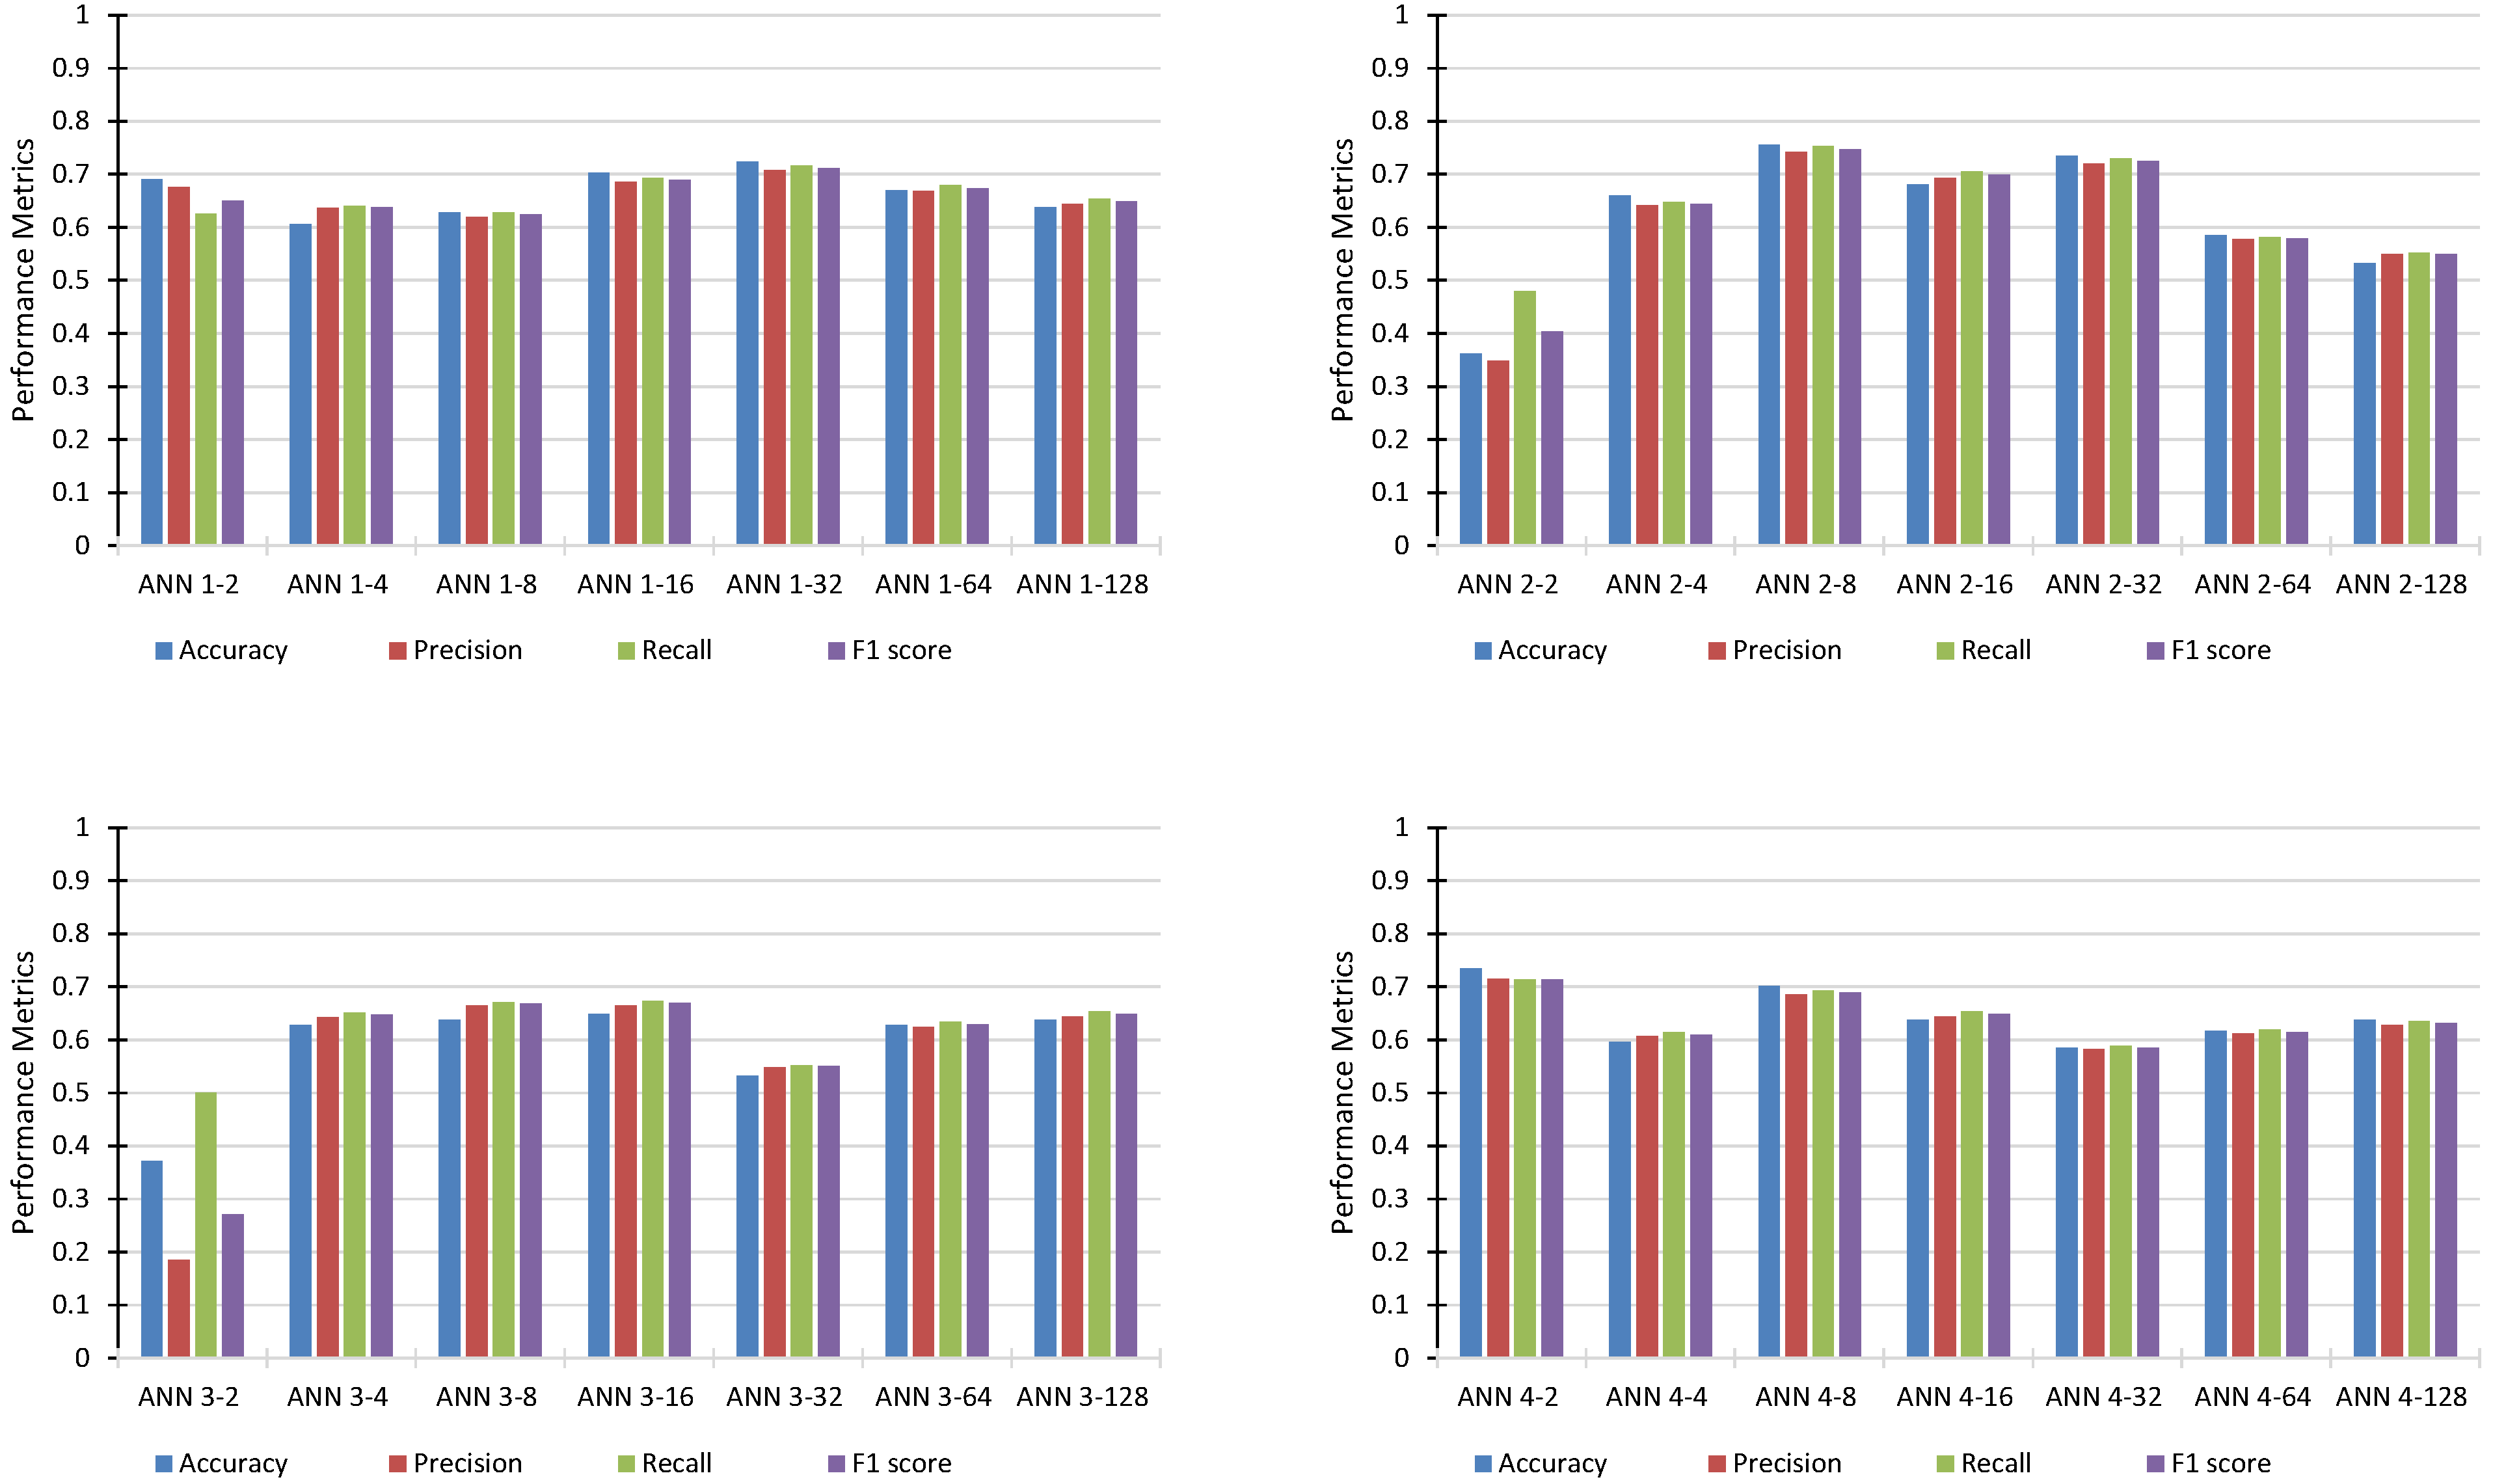
Table 7 shows the experimental results. The results presented are based on accuracy, precision, recall and F1 scores. The results show that respondents have mixed perception regarding whether the portrayal of male characters in the books leads to gender bias. Such mixed perceptions results in ML techniques having difficulty making correct predictions, as indicated by the low prediction accuracies in the range from 41% to 64% achieved by the ML techniques. It can be seen that SVM with linear kernel attains an accuracy of 41.5% whereas with RBF kernel it achieves an accuracy of 58.5%. In case of DT and LR, the accuracy is 42.6% and 63.8%, respectively. In case of RF, the number of estimators is important, as it can be seen that with estimators equal to 5, the RF achieves the highest accuracy of 64.9% compared to 3, 8, 10, and 15 estimators. The RF also achieves better results than ANN (layers = 4, neurons = 128), which demonstrates an accuracy of 60.8%. DT achieves better results than RF in this theme. RF combines the output of multiple decision trees to reach a single decision, which means that the aggregation of the results of multiple estimators tends to decrease the performance of RF.
The performance of ANN also varies with respect to the number of layers and number of neurons, as shown in Figure 2. The figure shows the performance of different ANN architectures (layers, L; neuron, N) to predict the gender-biased perceptions of the respondents. It can be observed that ANN 4-128 demonstrates the best results compared to all the other ANN architectures. The gender representation manifested in the text books is the most crucial facet of sexism, as is established in [7,47,55,56]. However, the modelling of the perceptions of respondents using ML when considering increased male representation is not established as a matter of concern for gender biases in the results.
4.3. Females in Traditional Roles
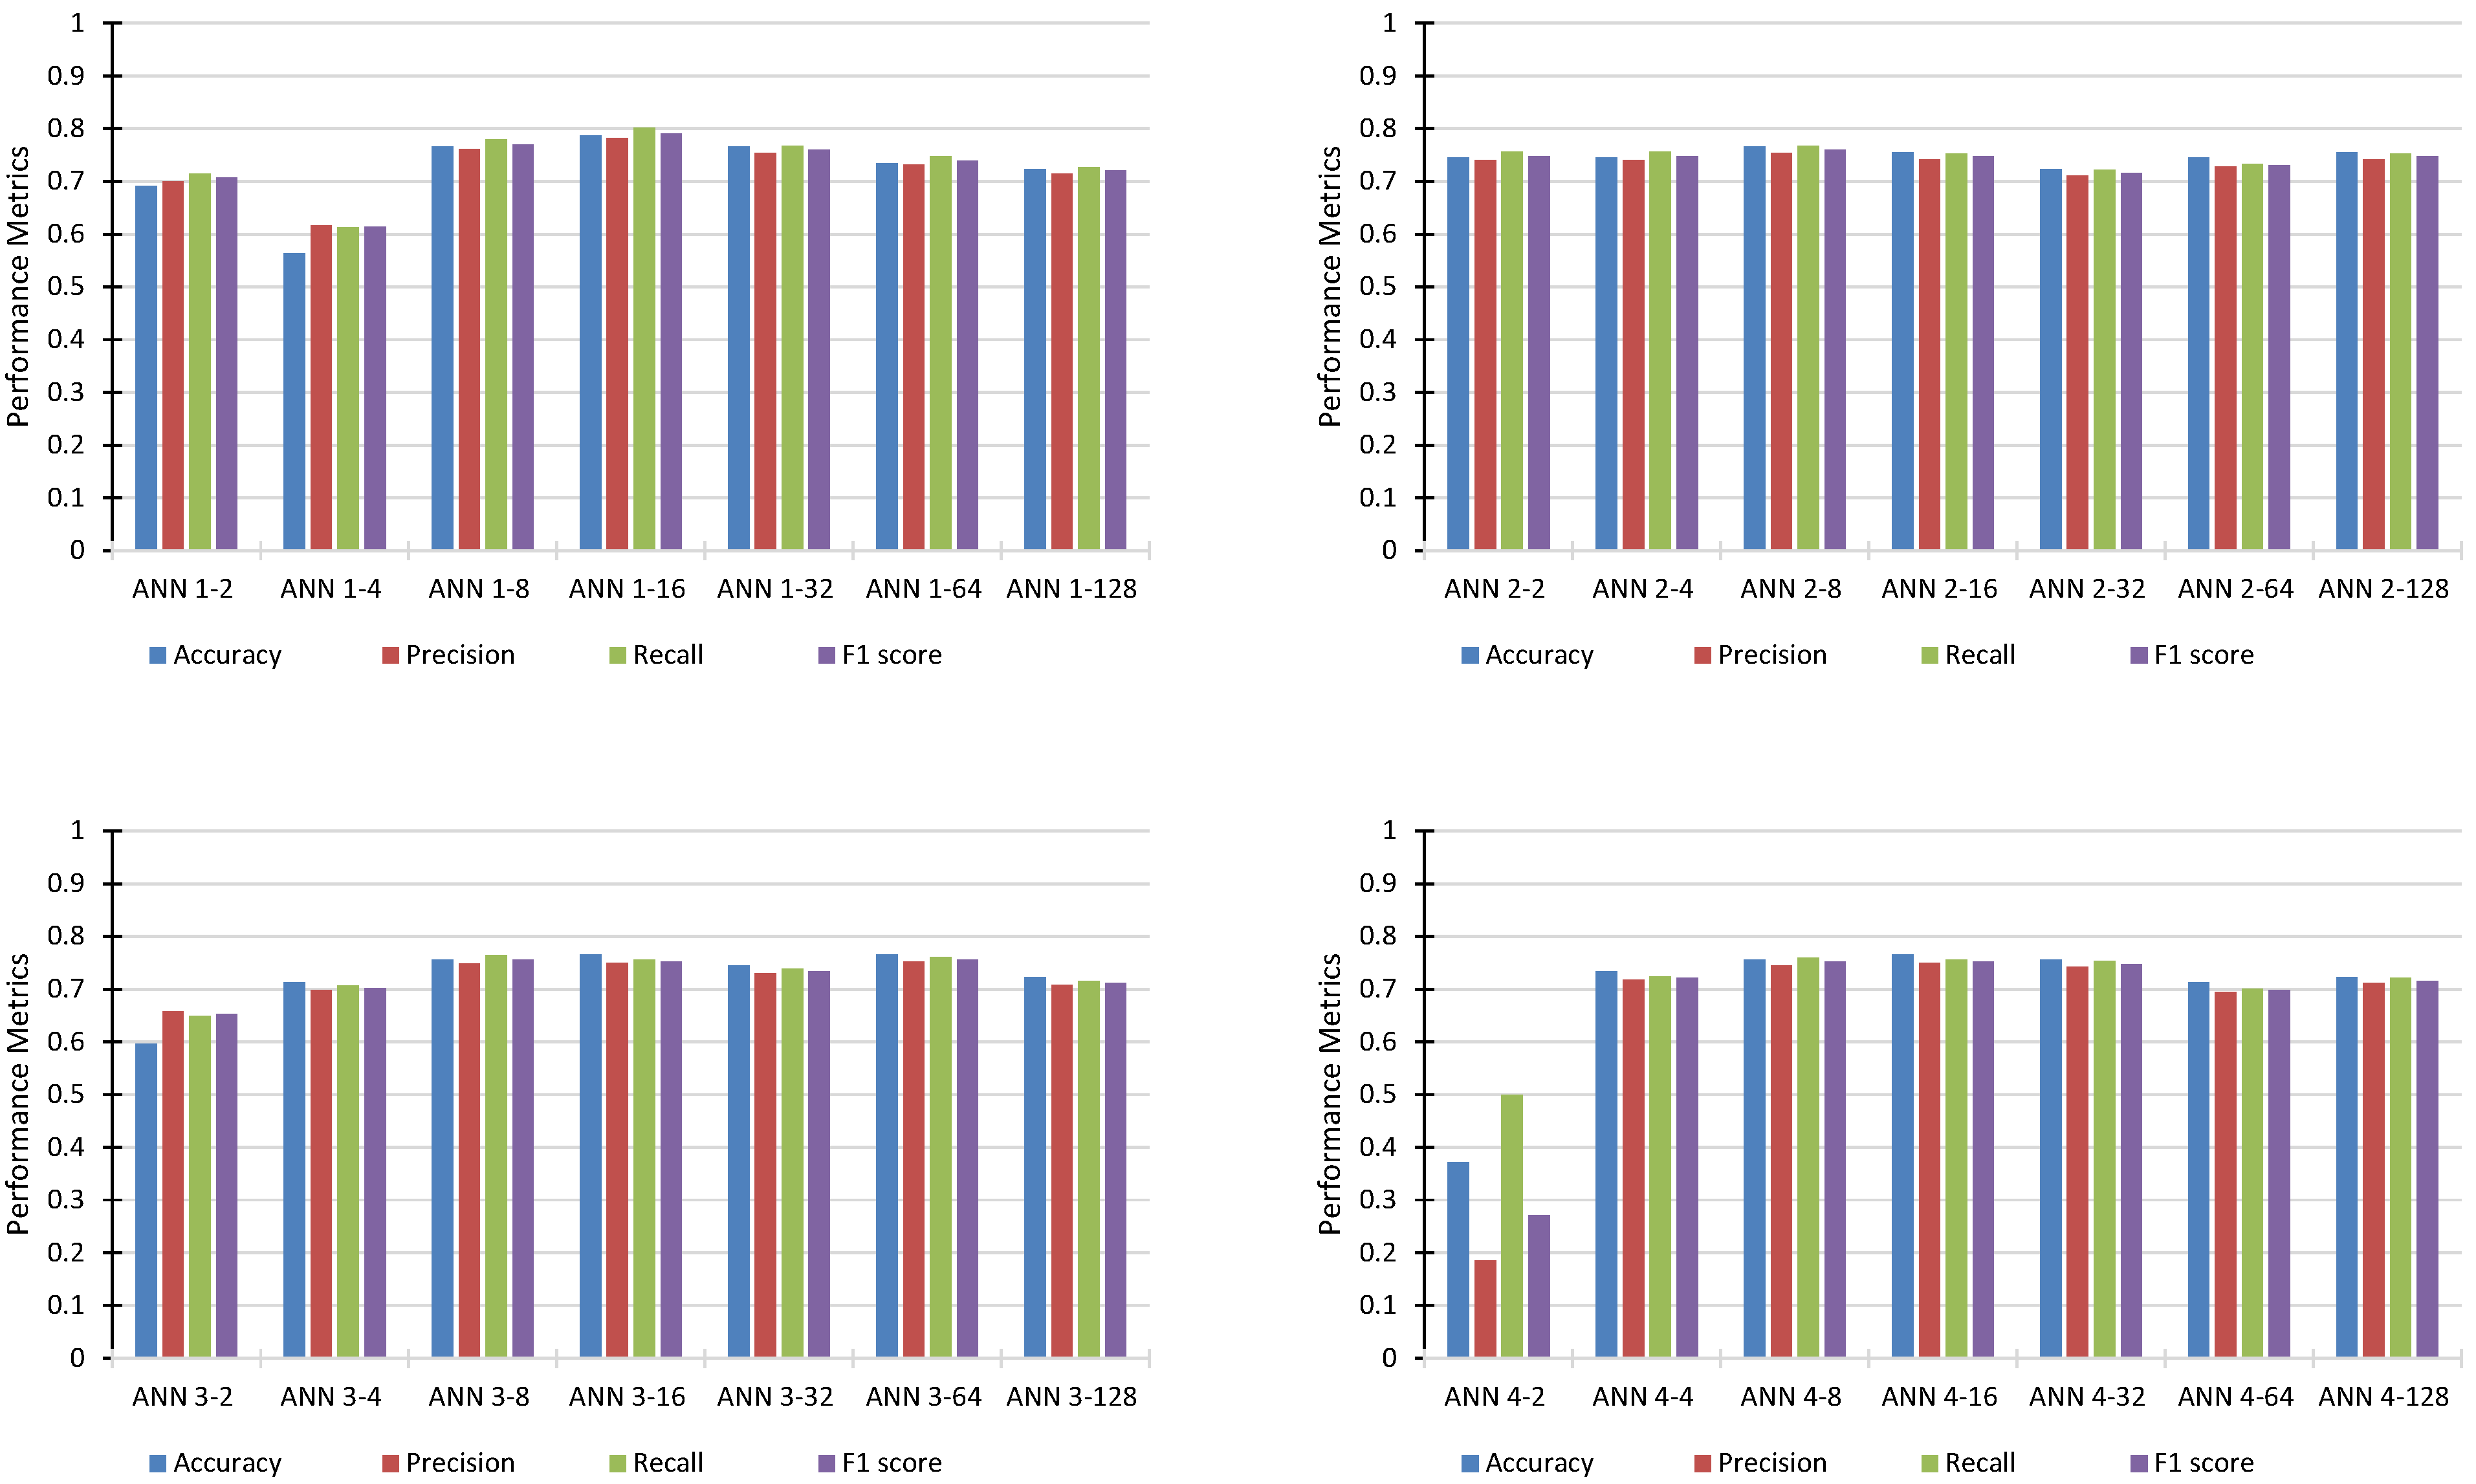
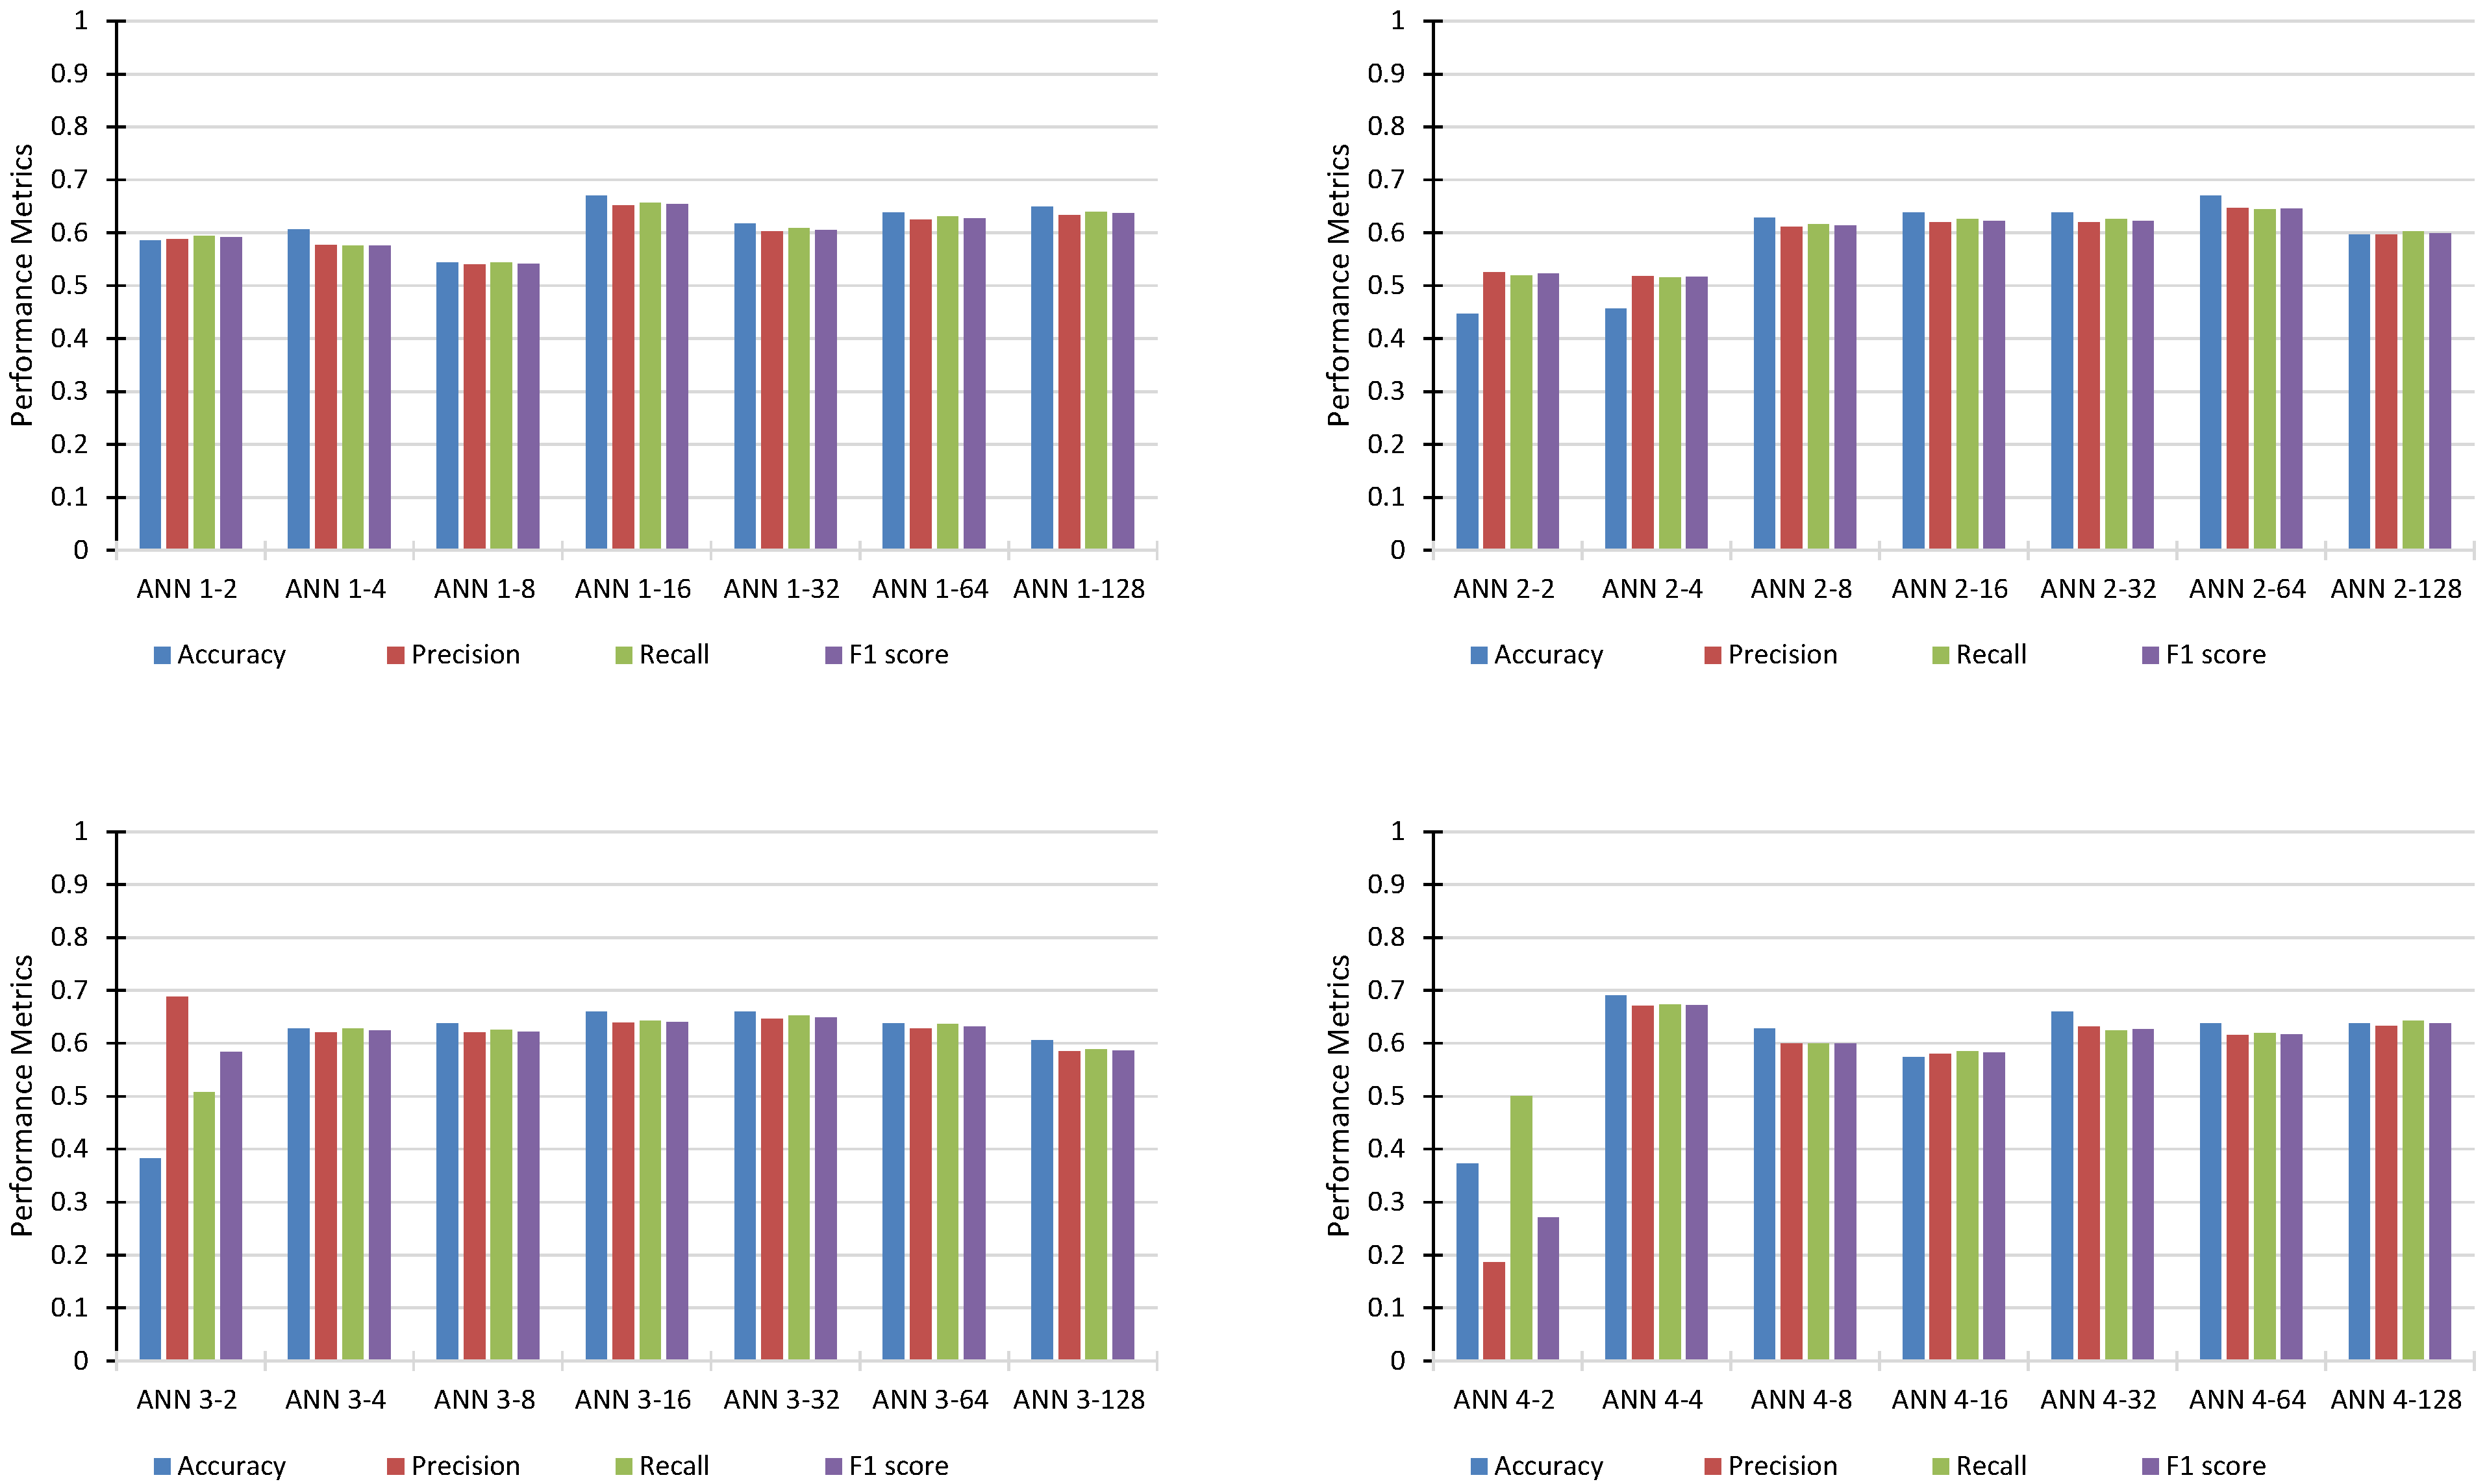
Under this theme, the respondents were asked about the portrayal of females in traditional roles in society, which may lead to gender bias, in the text books. The experimental results under this theme are shown in the Table 8. It can be seen that the accuracy of ML techniques vary from 71% to 78%. This is an indication that the respondents agree with the perception that females in traditional roles lead to gender bias and is depicted by the results of the ML techniques, which show good accuracy. ANN 1-16 obtains the best accuracy, i.e, 78.7%, compared to all the other techniques under this theme. In Figure 3, the performances of different ANN architectures are shown. It can be observed that ANN 1-16 provide the best results. RF performed slightly better than DT. As RF combines the output of multiple decision trees to reach a single decision, the aggregation of the results of multiple estimators tends to improve the performance of RF under this theme.
From Table 7 and Table 8, it can be established that there are no fixed architectures/configurations of ANN that will always perform well under different themes. For instance, ANN 1-16 obtains the best results under the females-in-traditional-roles theme but under the Men-emphasis theme, the best accuracy is demonstrated by ANN 4-128. The same argument is also true for RF, whose performance varies with respect to the number of estimators. The results show that the performance of RF decreases as the number of estimators either decrease or increase to around 10.
It is also established in the literature that male characters are not shown as involved in limited or domestic activities as frequently as females [57], who are assigned the more traditional roles. Similar findings were established in Ref. [56] with regards to the examination of Khyber Pakhtunkhwa’s English text books.
4.4. Male Preference
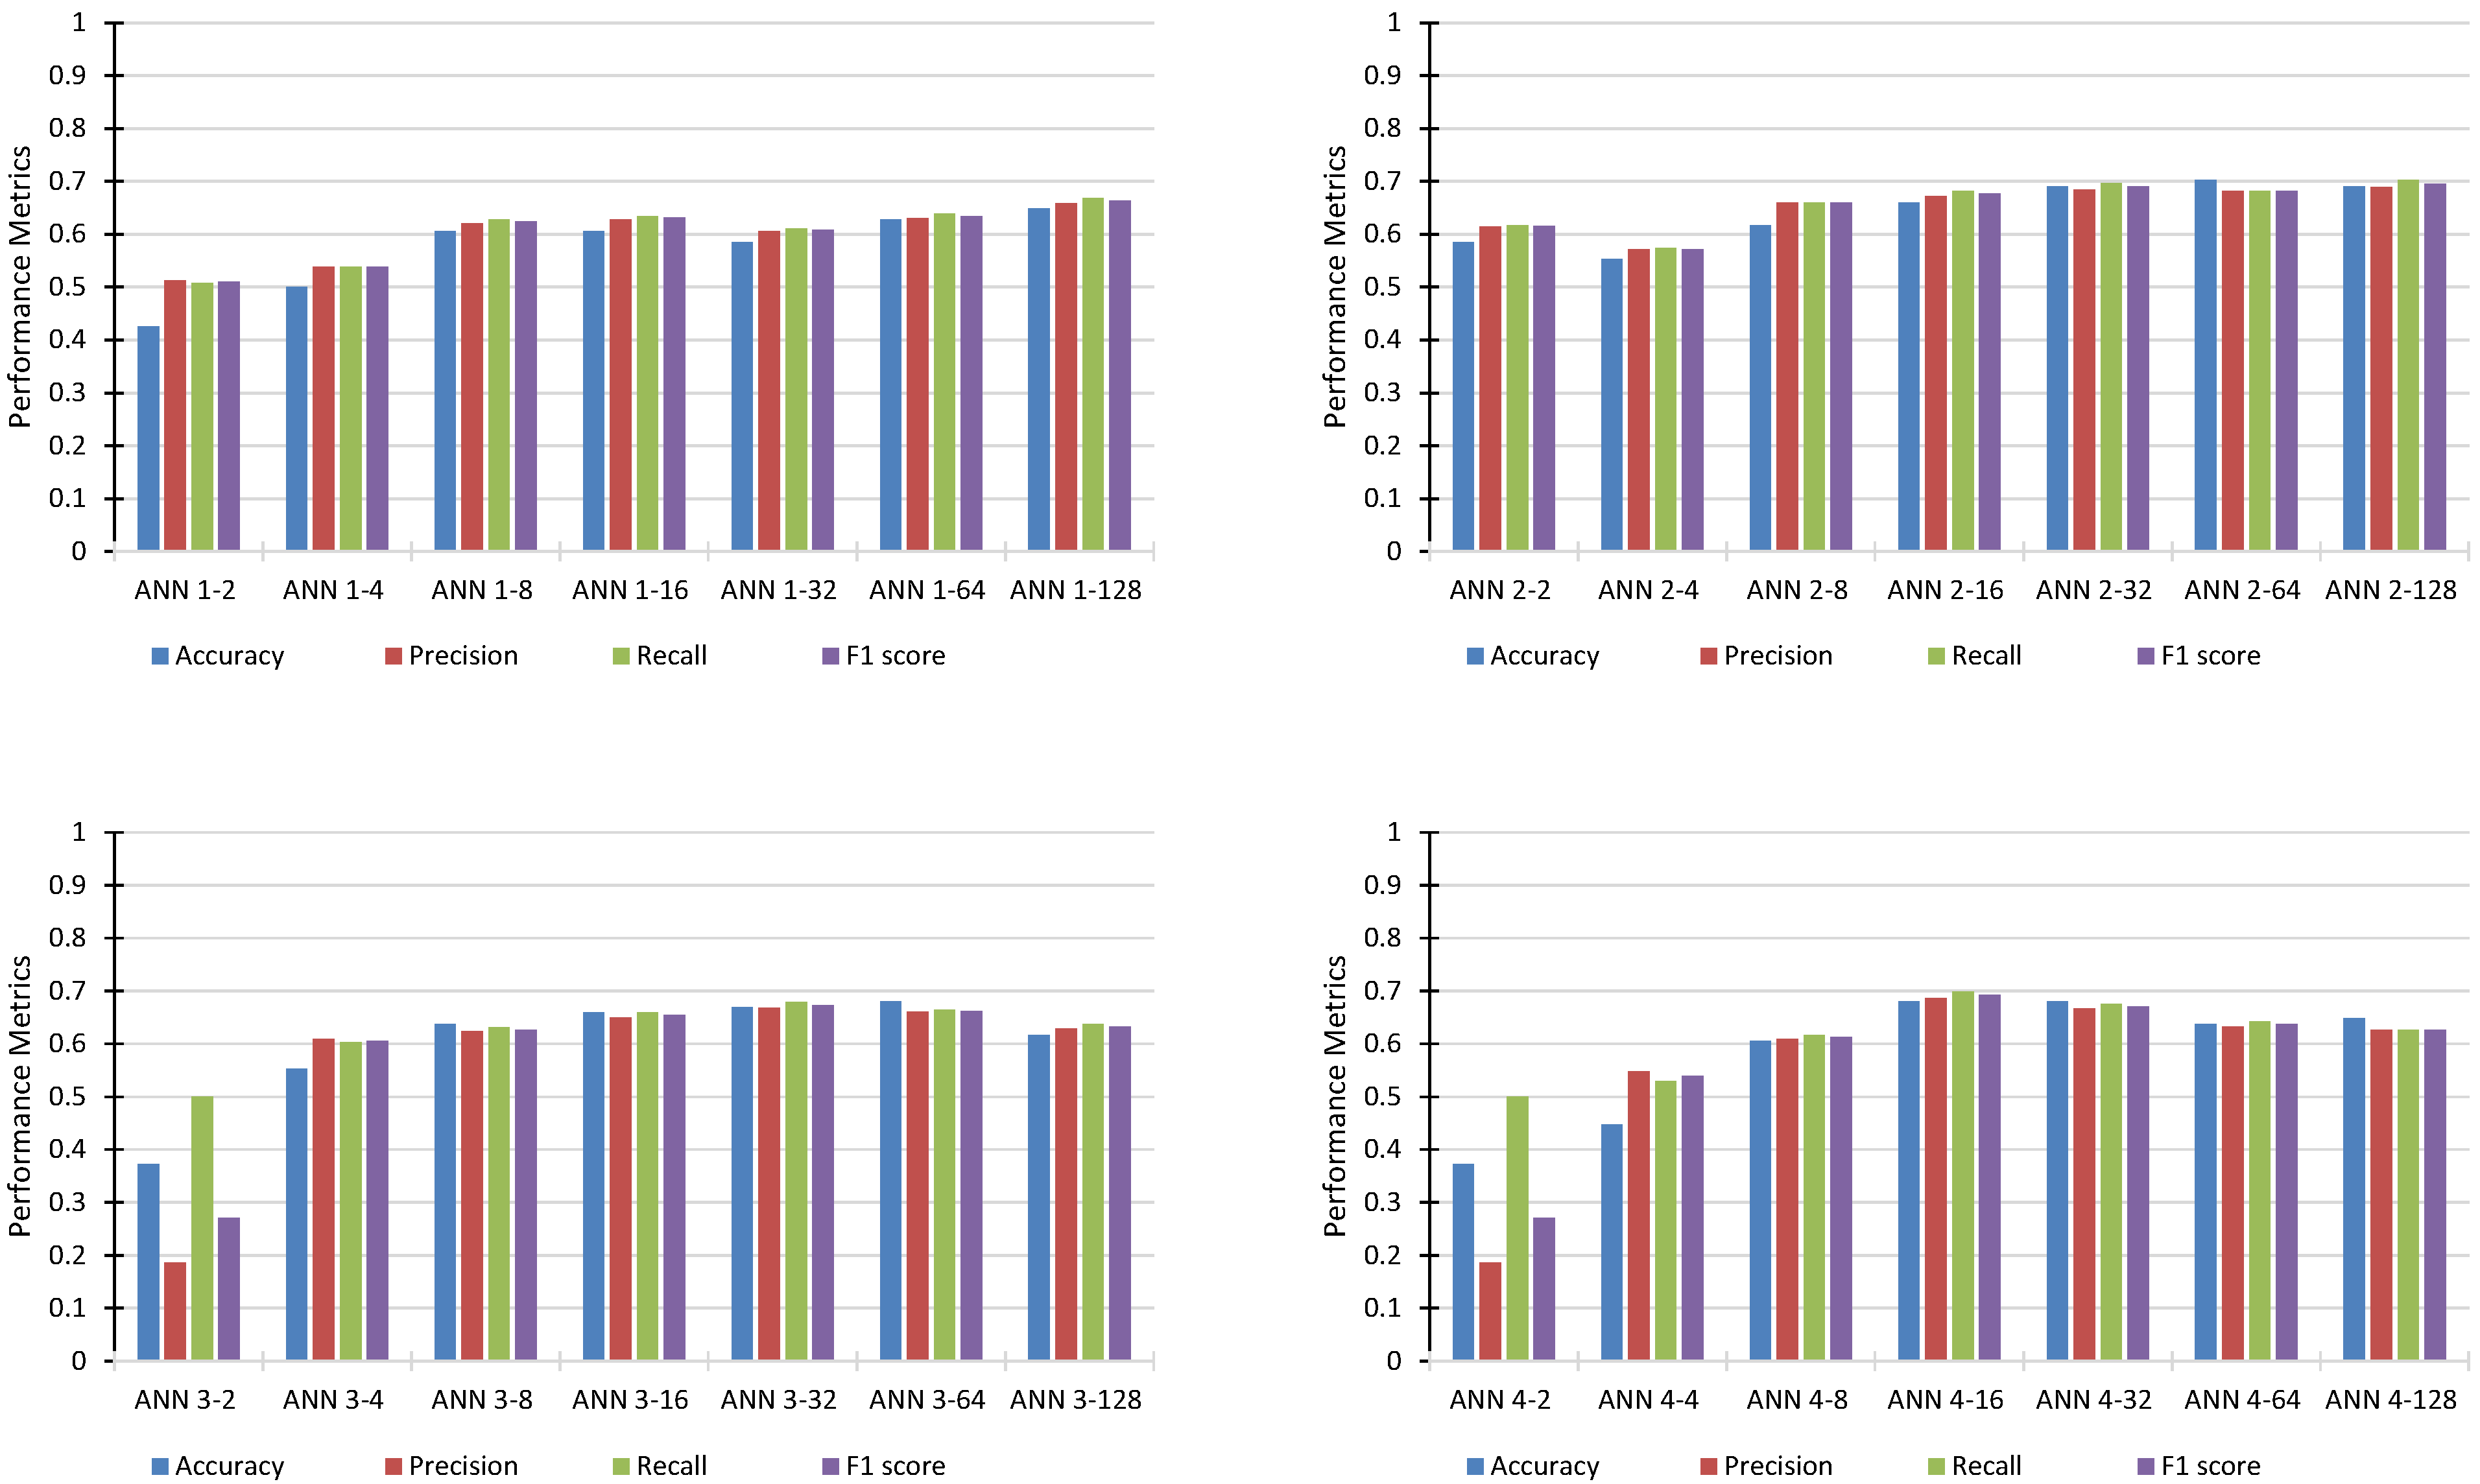
Under this theme, the preference of males in society was investigated using four different questions. The experimental results for gender-bias predictions are shown in the Table 9. It can be seen that random forest (Estimators = 8) achieves the best accuracy of 72.3%. From this, it can be concluded that respondents have a mixed view about male preference which leads to the existence of gender bias in the text book. ANN (layers = 2, neurons = 64) achieves accuracy of 70.2%, whereas the performance of other ANN architectures are shown in Figure 4 for performance comparison.
4.5. Societal Beliefs
Under this theme, four questions were asked pertaining to the reinforcement of the societal belief that women are not entitled to social privileges. The performance of the ML techniques under this theme is shown in the Table 10. It can be seen that the best accuracy score was achieved by SVM linear with an accuracy of 76.6%. From such results, it can be asserted that there exists a gender bias. The performance of different ANN architectures are shown in Figure 5. As reported in [47,56,57], the representation of women and men has not changed in the last thirty five years and, especially in the Pakistani context, the ones who suffer poor representation and preference are women, which is also depicted in the results.
4.6. Equal Participation
Under this theme, three questions were asked pertaining to equal participation of both genders in society. Women are generally presented in the text books as being busy in jobs such as child caring and nursing [58]. This is also affirmed in [59], that women are found in the roles of teachers and nurses while men are shown in situations needing problem-solving skills. The prediction results under this theme are shown in Table 11 and Figure 6.
4.7. All Items
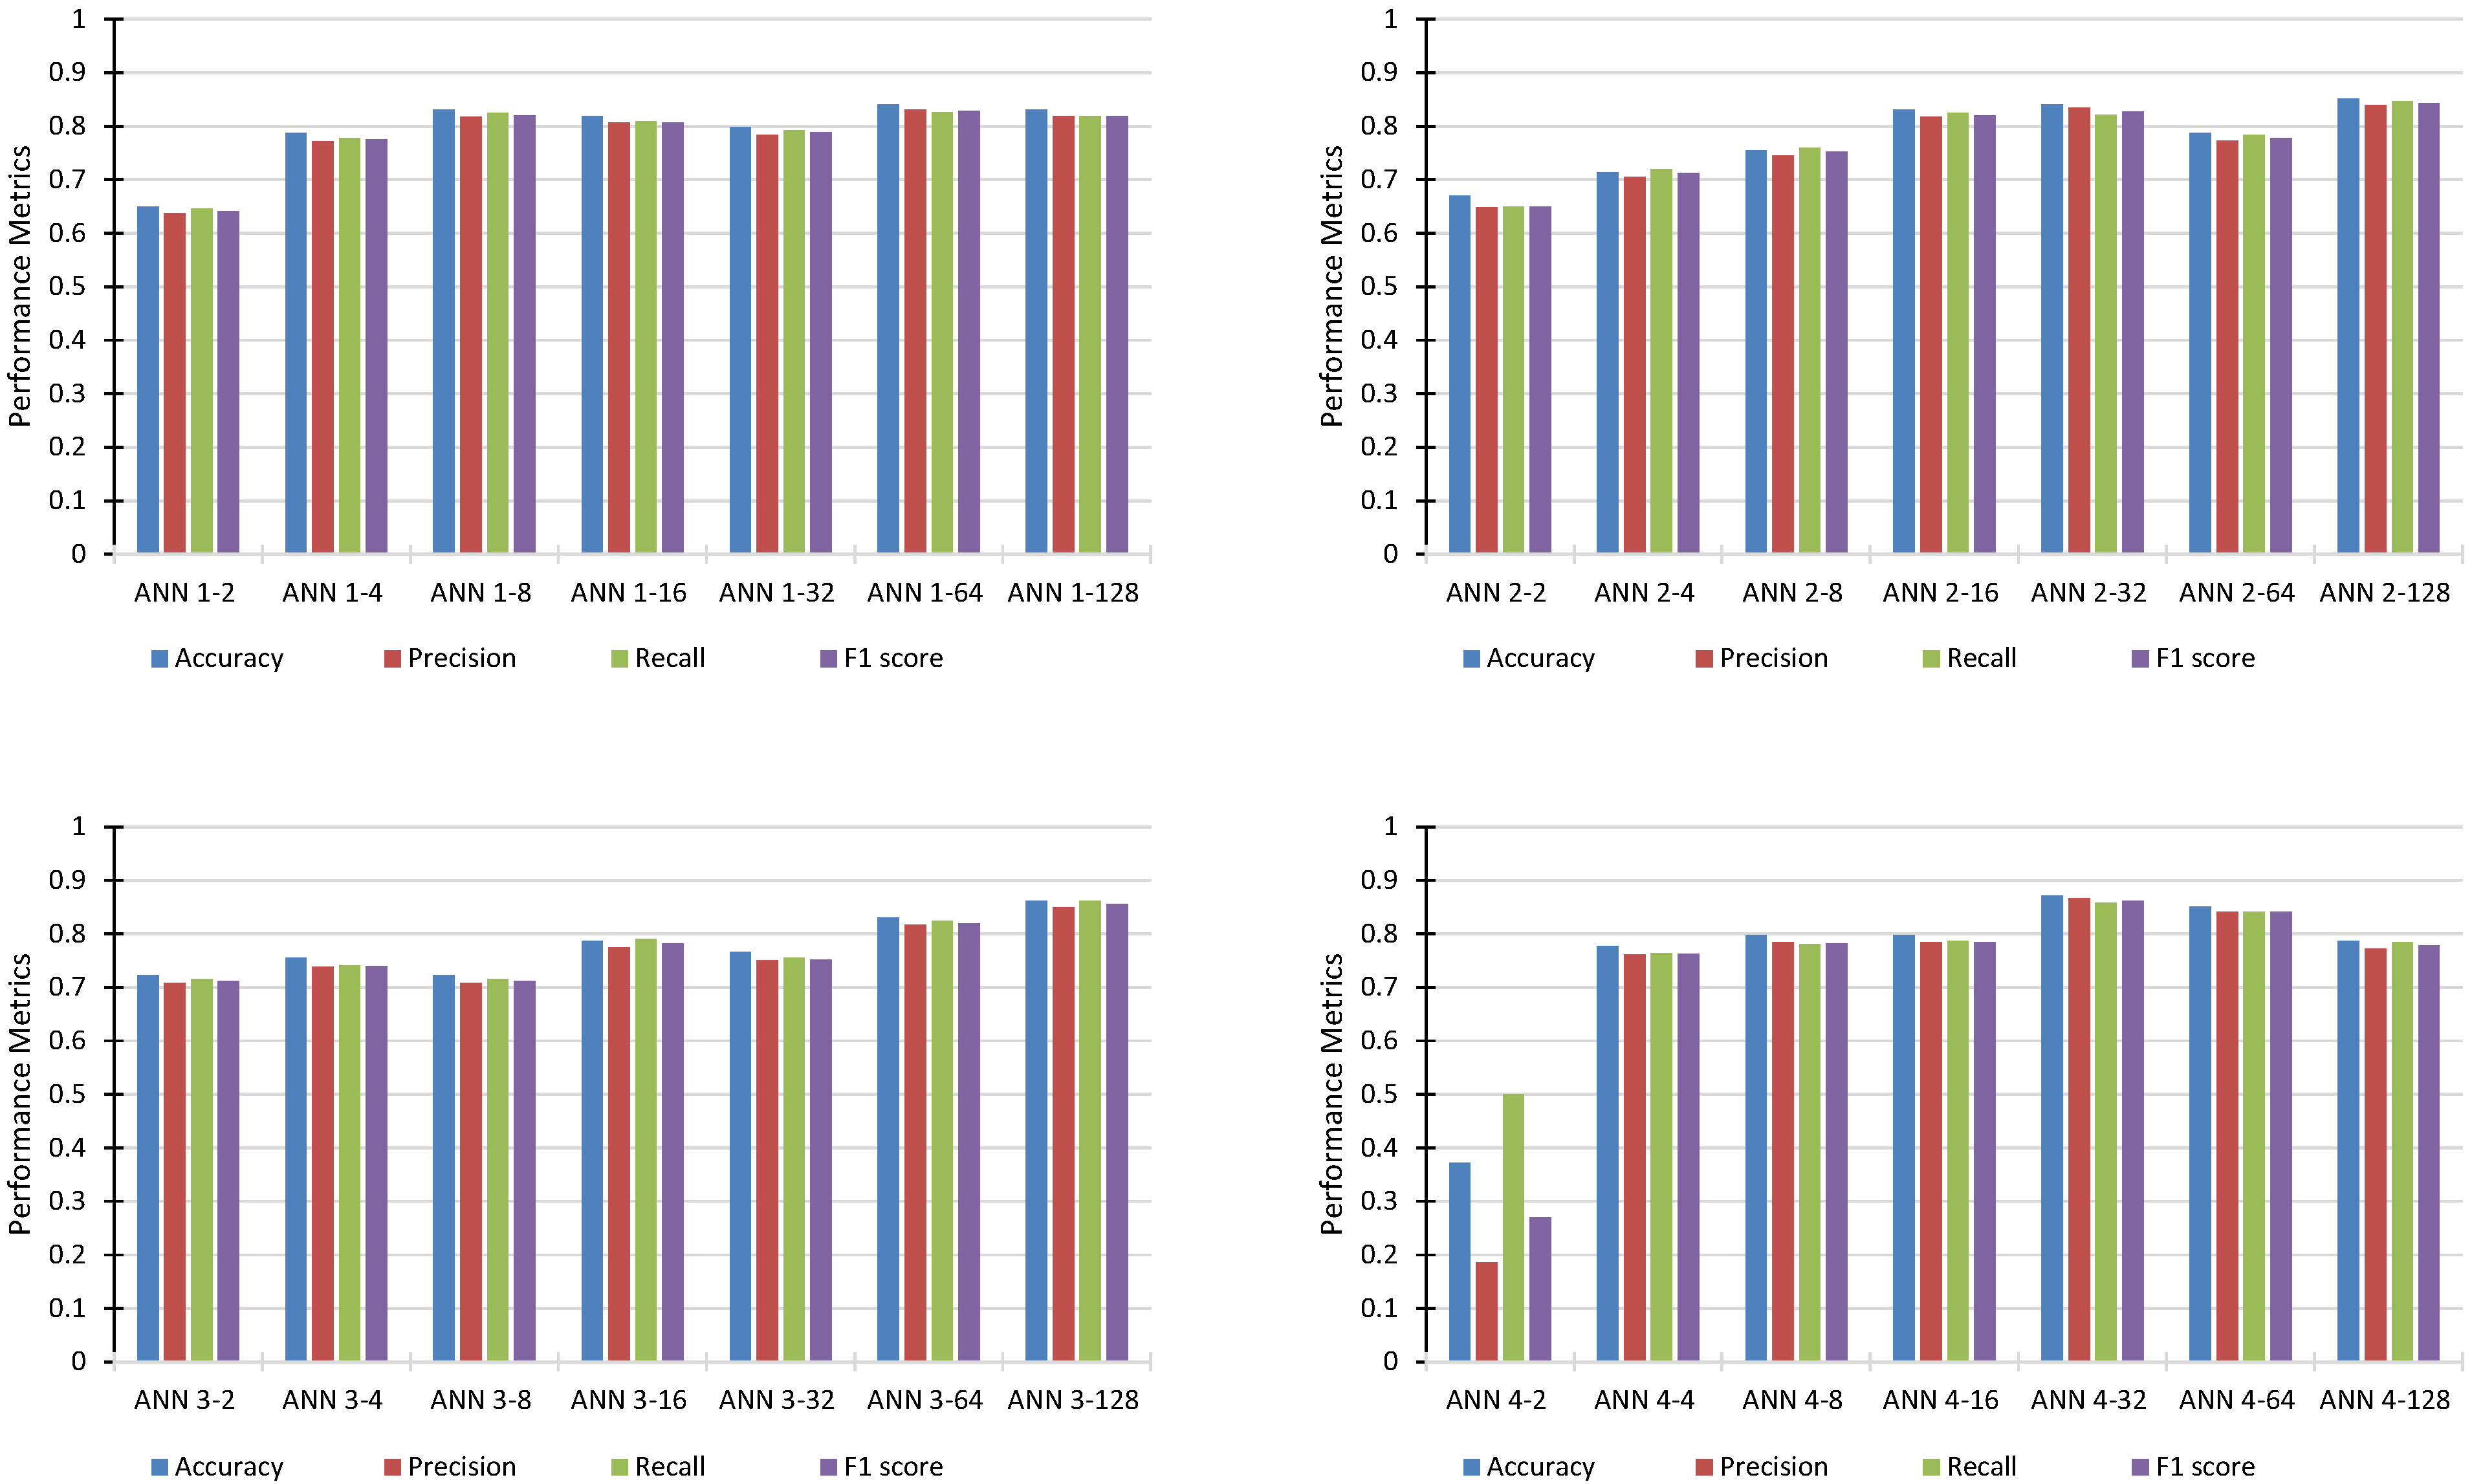
In this section, all the themes’ questions are used to check the performance of ML for predicting gender bias. The experimental results are shown in Table 12 and Figure 7. It can be seen that better prediction results are obtained compared to individual themes. The best accuracy is demonstrated by the ANN (Layers = 4, Neurons = 32), i.e, 87.2%, followed by RF based on 15 estimators. RF combines the output of multiple decision trees to reach a single decision, which means that the aggregation of the results of multiple estimators, i.e, 15, tends to improve the performance of RF.
From these results, it can be concluded that the gender bias as perceived by teachers and learners can be modeled with the help of ML techniques, which can be deployed to predict bias with high accuracy on future data.
5. Conclusions
This paper employed machine learning to model gender-biased perceptions of teachers and learners regarding English text books. The data used was gathered through a questionnaire based on five different themes. The respondents were teachers and intermediate-level learners. Five different machine-learning techniques were explored. Their performances were then compared with the help of accuracy, precision, recall and f1 scores. The experimental results show that machine-learning techniques achieve low accuracy under themes such as more representation of men and showing men in higher roles. This is due to the mixed perceptions of the respondents. However, in the case of the other themes, the responses of the respondents are well-divided, which leads to good performance. The best results achieved are under females in traditional roles, where ANN achieves 78% accuracy. In the societal-belief theme, SVM demonstrates the best accuracy, of 76.6%. The experimental results show that even better results are obtained when all themes are combined. In such a case, ANN demonstrates an accuracy of 87.2%, followed by random forest, which achieves an accuracy of 84%. This shows that artificial intelligence can be used efficiently to model gender-biased perceptions if data is collected from teachers and learners through questionnaires about text books. Additionally, the analysis of textbooks also confirmed gender discrimination which called for the opinions of learners and teachers regarding this issue.
Author Contributions
Conceptualization, G.K. and S.S.; methodology, G.K. and S.S.; software, S.S. and F.S.; validation, M.M.S., M.A. and M.I.U.; formal analysis, G.K. and S.S.; investigation, F.S. and M.M.S.; resources, M.M.S. and M.A.; data curation, G.K.; writing—original draft preparation, G.K. and S.S.; writing—review and editing, F.S. and M.M.S.; visualization, S.S.; supervision, M.M.S.; project administration, G.K. and S.S.; funding acquisition, M.M.S., M.A. and M.I.U. All authors have read and agreed to the published version of the manuscript.
Funding
This research received no external funding.
Informed Consent Statement
Informed consent was obtained from all subjects involved in the study.
Conflicts of Interest
The authors declare no conflict of interest.
References
- van Noordt, C.; Misuraca, G. Exploratory insights on artificial intelligence for government in Europe. Soc. Sci. Comput. Rev. 2022, 40, 426–444. [Google Scholar] [CrossRef]
- Huo, W.; Zheng, G.; Yan, J.; Sun, L.; Han, L. Interacting with medical artificial intelligence: Integrating self-responsibility attribution, human–computer trust, and personality. Comput. Hum. Behav. 2022, 132, 107253. [Google Scholar] [CrossRef]
- Langer, M.; Landers, R.N. The future of artificial intelligence at work: A review on effects of decision automation and augmentation on workers targeted by algorithms and third-party observers. Comput. Hum. Behav. 2021, 123, 106878. [Google Scholar] [CrossRef]
- Campion, A.; Gasco-Hernandez, M.; Jankin Mikhaylov, S.; Esteve, M. Overcoming the challenges of collaboratively adopting artificial intelligence in the public sector. Soc. Sci. Comput. Rev. 2022, 40, 462–477. [Google Scholar] [CrossRef]
- Bostrom, N. Superintelligence: Paths, Dangers, Strategies; Oxford University Press: Oxford, UK, 2014. [Google Scholar]
- West, M.; Kraut, R.; Ei Chew, H. EQUALS y Unesco—2019—I’d Blush If I Could: Closing Gender Divides in Digital Skills through Education; UNESCO: Paris, France, 2019; 144p. [Google Scholar]
- Mirza, M. Gender Analysis of School Curriculum and Text Books; UNESCO: Islamabad, Pakistan, 2004; p. 78. [Google Scholar]
- Hameed, A. A Gender-Based Study of English Textbooks Produced by Punjab Textbook Board and Oxford University Press for Elementary Level; Oxford University Press: Oxford, UK, 2012. [Google Scholar]
- Saira Farooq Shah, B. Gender Inclusion: A Neglected Aspect of the English Textbooks in Pakistan. Int. J. Soc. Sci. Educ. 2012, 3, 2223–4934. [Google Scholar]
- Sunderland, J. New understandings of gender and language classroom research: Texts, teacher talk and student talk. Lang. Teach. Res. 2000, 4, 149–173. [Google Scholar] [CrossRef]
- Straw, I.; Callison-Burch, C. Artificial Intelligence in mental health and the biases of language based models. PLoS ONE 2020, 15, e0240376. [Google Scholar] [CrossRef] [PubMed]
- Samothrakis, S. Artificial Intelligence inspired methods for the allocation of common goods and services. PLoS ONE 2021, 16, e0257399. [Google Scholar] [CrossRef]
- Cristina, O.P.; Jorge, P.B.; Eva, R.L.; Mario, A.O. From wearable to insideable: Is ethical judgment key to the acceptance of human capacity-enhancing intelligent technologies? Comput. Hum. Behav. 2021, 114, 106559. [Google Scholar] [CrossRef]
- United Nations. Sustainable Development Goals; United Nations: New York, NY, USA, 2015. [Google Scholar]
- van de Gevel, A.J.W.; Noussair, C.N. The Nexus between Artificial Intelligence and Economics; Springer: Berlin/Heidelberg, Germany, 2012; pp. 1–110. [Google Scholar] [CrossRef] [Green Version]
- Drydakis, N. Mobile applications aiming to facilitate immigrants’ societal integration and overall level of integration, health and mental health. Does artificial intelligence enhance outcomes? Comput. Hum. Behav. 2021, 117, 106661. [Google Scholar] [CrossRef]
- Dahlin, E. Mind the gap! On the future of AI research. Humanit. Soc. Sci. Commun. 2021, 8, 1–4. [Google Scholar] [CrossRef]
- Wall, D.P.; Dally, R.; Luyster, R.; Jung, J.Y.; DeLuca, T.F. Use of artificial intelligence to shorten the behavioral diagnosis of autism. PLoS ONE 2012, 7, e43855. [Google Scholar] [CrossRef] [Green Version]
- Chang, T.S.; Coen, M.H.; La Rue, A.; Jonaitis, E.; Koscik, R.L.; Hermann, B.; Sager, M.A. Machine learning amplifies the effect of parental family history of Alzheimer’s disease on list learning strategy. J. Int. Neuropsychol. Soc. 2012, 18, 428–439. [Google Scholar] [CrossRef] [PubMed] [Green Version]
- Miller, D.D.; Brown, E.W. Artificial Intelligence in Medical Practice: The Question to the Answer? Am. J. Med. 2018, 131, 129–133. [Google Scholar] [CrossRef]
- Efremova, N.; West, D.; Zausaev, D. AI-Based Evaluation of the SDGs: The Case of Crop Detection with Earth Observation Data. SSRN Electron. J. 2019. [Google Scholar] [CrossRef] [Green Version]
- Xiong, W.; Chen, S.; Okumus, B.; Fan, F. Gender stereotyping and its impact on perceived emotional leadership in the hospitality industry: A mixed-methods study. Tour. Manag. 2022, 90, 104476. [Google Scholar] [CrossRef]
- Greenwald, A.G.; Banaji, M.R. Implicit social cognition: Attitudes, self-esteem, and stereotypes. Psychol. Rev. 1995, 102, 4. [Google Scholar] [CrossRef]
- Amodio, D.M. The neuroscience of prejudice and stereotyping. Nat. Rev. Neurosci. 2014, 15, 670–682. [Google Scholar] [CrossRef] [PubMed]
- Abrams, D.; Hogg, M.A. Comments on the motivational status of self-esteem in social identity and intergroup discrimination. Eur. J. Soc. Psychol. 1988, 18, 317–334. [Google Scholar] [CrossRef]
- Rudman, L.A.; Greenwald, A.G.; McGhee, D.E. Implicit self-concept and evaluative implicit gender stereotypes: Self and ingroup share desirable traits. Pers. Soc. Psychol. Bull. 2001, 27, 1164–1178. [Google Scholar] [CrossRef]
- Hyde, J.S. The gender similarities hypothesis. Am. Psychol. 2005, 60, 581–592. [Google Scholar] [CrossRef] [PubMed] [Green Version]
- Guimond, S. Psychological Similarities and Differences between Women and Men across Cultures. Soc. Pers. Psychol. Compass 2008, 2, 494–510. [Google Scholar] [CrossRef]
- European Commission. She Figures 2015; Directorate-General for Research and Innovation, European Commission: Brussels, Belgium, 2015; p. 224. Available online: https://data.europa.eu/doi/10.2777/064694 (accessed on 1 December 2020).
- Ritz, S.A.; Antle, D.M.; Côté, J.; Deroy, K.; Fraleigh, N.; Messing, K.; Parent, L.; St-Pierre, J.; Vaillancourt, C.; Mergler, D. First steps for integrating sex and gender considerations into basic experimental biomedical research. FASEB J. 2014, 28, 4–13. [Google Scholar] [CrossRef]
- Danell, R.; Hjerm, M. Career prospects for female university researchers have not improved. Scientometrics 2013, 94, 999–1006. [Google Scholar] [CrossRef]
- European Commission. Promoting Gender Equality in Research and Innovation—European Commission; European Commission: Brussels, Belgium, 2014; pp. 1–2. [Google Scholar]
- Cho, A.H.; Johnson, S.A.; Schuman, C.E.; Adler, J.M.; Gonzalez, O.; Graves, S.J.; Huebner, J.R.; Blaine Marchant, D.; Rifai, S.W.; Skinner, I.; et al. Women are underrepresented on the editorial boards of journals in environmental biology and natural resource management. PeerJ 2014, 2014, e542. [Google Scholar] [CrossRef] [Green Version]
- Shen, H. Inequality quantified: Mind the gender gap. Nature 2013, 494, 22–24. [Google Scholar] [CrossRef] [Green Version]
- Ley, T.J.; Hamilton, B.H. Sociology: The gender gap in NIH grant applications. Science 2008, 322, 1472–1474. [Google Scholar] [CrossRef]
- Panisch, L.S.; Smith, T.E.; Carter, T.E.; Osteen, P.J. Gender comparisons of Israeli social work faculty using h-index scores. J. Appl. Res. High. Educ. 2017, 9, 439–447. [Google Scholar] [CrossRef]
- Roussel, S.; Boissy, A.; Montigny, D.; Hemsworth, P.H.; Duvaux-Ponter, C. Gender-specific effects of prenatal stress on emotional reactivity and stress physiology of goat kids. Horm. Behav. 2005, 47, 256–266. [Google Scholar] [CrossRef]
- Miller, C. Words and Women; Princeton University Press: Princeton, NJ, USA, 1997. [Google Scholar]
- Bai, J. Cultural and Pragmatic Studies of Gender Language; Hunan Education Press: Changsha, China, 2007. [Google Scholar]
- Zakka, Z.M.; Azlan, N.; Ahmad, B. Gender Bias in Primary School Mathematics Textbooks in Nigeria. Am. J. Educ. Sci. 2015, 1, 223–228. [Google Scholar]
- Bahman, M.; Rahimi, A. Gender representation in EFL materials: An analysis of English textbooks of Iranian high schools. Procedia Soc. Behav. Sci. 2010, 9, 273–277. [Google Scholar] [CrossRef] [Green Version]
- Orfan, S.N. High school English textbooks promote gender inequality in Afghanistan. Pedagog. Cult. Soc. 2021, 1–16. [Google Scholar] [CrossRef]
- Hamdan, S. English-language textbooks reflect gender bias: A case study in Jordan. Adv. Gend. Educ. 2010, 2, 22–26. [Google Scholar]
- Gharbavi, A.; Mousavi, S.A. A Content Analysis of Textbooks: Investigating Gender Bias as a Social Prominence in Iranian High School English Textbooks. Eng. Linguist. Res. 2012, 1, 42–49. [Google Scholar] [CrossRef]
- Stockdale, D.A. Gender representation in an EFL textbook. Bull. Niigata Inst. Technol. 2006, 13, 900–906. [Google Scholar]
- Nagatomo, D.H. Identity, Gender and Teaching English in Japan; Multilingual Matters: Bristol, UK, 2016; pp. 1–237. [Google Scholar] [CrossRef]
- Porreca, K.L. Sexism in Current ESL Textbooks. TESOL Q. 1984, 18, 705. [Google Scholar] [CrossRef]
- Vahdatinejad, S. A teacher’s survey on portrayal of sexism in the images of Iranian EFL school textbooks. People Int. J. Soc. Sci. 2018, 4, 268–287. [Google Scholar] [CrossRef]
- Cortes, C. Support-vector network. Mach. Learn. 1995, 20, 1–25. [Google Scholar] [CrossRef]
- Tolles, J.; Meurer, W.J. Logistic regression: Relating patient characteristics to outcomes. JAMA J. Am. Med. Assoc. 2016, 316, 533–534. [Google Scholar] [CrossRef]
- Ben-Gal, I.; Dana, A.; Shkolnik, N.; Singer, G. Efficient construction of decision trees by the dual information distance method. Qual. Technol. Quant. Manag. 2014, 11, 133–147. [Google Scholar] [CrossRef] [Green Version]
- Ho, T.K. The random subspace method for constructing decision forests. IEEE Trans. Pattern Anal. Mach. Intell. 1998, 20, 832–844. [Google Scholar] [CrossRef] [Green Version]
- Cireşan, D.C.; Meier, U.; Gambardella, L.M.; Schmidhuber, J. Deep, big, simple neural nets for handwritten digit recognition. Neural Comput. 2010, 22, 3207–3220. [Google Scholar] [CrossRef] [Green Version]
- Hasan, F. An Analysis of Gender Representation in English Textbooks Used in Jordanian Schools and an Exploration of Jordanian Teachers’ Beliefs about Gender Stereotypes. Ph.D. Thesis, Texas A&M University, College Station, TX, USA, 2015. [Google Scholar]
- Lee, J.F.K.; Collins, P. Gender Representation in Hong Kong English Textbooks. In Proceedings of the 2nd International Conference on Gender Equity Education in the Asian-Pacific Region: Challenges and Possibilities in Gender Equity Education, Hong Kong, China, 22–24 June 2006; Volume 1, pp. 1–40. [Google Scholar]
- Mahmood, T.; Kausar, G. Female Teachers’ Perceptions of Gender Bias in Pakistani English Textbooks. Asian Women 2019, 35, 109–126. [Google Scholar] [CrossRef]
- Md Mukitul Islam, K.; Niaz Asadullah, M. Gender stereotypes and education: A comparative content analysis of Malaysian, Indonesian, Pakistani and Bangladeshi school textbooks. PLoS ONE 2019, 13, e0190807. [Google Scholar] [CrossRef] [Green Version]
- Anwar, M. Images of Male and Female Roles in School and College Textbooks; Women’s Division: Tokyo, Japan, 1982. [Google Scholar]
- Qaiser, S.A.; Jabeen, F. Portrayal of Women’s Issues in PTV Drama Serials: An Overview. Bodhi Interdiscip. J. 1970, 2, 211–218. [Google Scholar] [CrossRef] [Green Version]
Figure 1.
Block diagram for the prediction of gender-biased perceptions using AI.

Figure 2.
Comparison of different architectures of ANN for the prediction of gender bias under gender-portrayal theme. Each architecture is denoted as ANN L-N where L and N represents number of layers and neurons, respectively.
Figure 2.
Comparison of different architectures of ANN for the prediction of gender bias under gender-portrayal theme. Each architecture is denoted as ANN L-N where L and N represents number of layers and neurons, respectively.

Figure 3.
Comparison of different architectures of ANN for the prediction of gender bias under females-in-traditional-roles theme.
Figure 3.
Comparison of different architectures of ANN for the prediction of gender bias under females-in-traditional-roles theme.

Figure 4.
Comparison of different architectures of ANN for the prediction of gender bias under male-preference theme.
Figure 4.
Comparison of different architectures of ANN for the prediction of gender bias under male-preference theme.

Figure 5.
Comparison of different architectures of ANN for the prediction of gender bias under societal-belief theme.
Figure 5.
Comparison of different architectures of ANN for the prediction of gender bias under societal-belief theme.

Figure 6.
Comparison of different architectures of ANN for the prediction of gender bias under equal-participation theme.
Figure 6.
Comparison of different architectures of ANN for the prediction of gender bias under equal-participation theme.

Figure 7.
Comparison of different architectures of ANN for the prediction of gender bias using all items.
Figure 7.
Comparison of different architectures of ANN for the prediction of gender bias using all items.


Table 1.
Themes and topics concerning in the study’s questionnaire for AI-based predictions.
| Sr. | Themes of Inquiry | Description |
|---|---|---|
| 1. | Emphasis on male character | Representation of more male characters and as higher being in the text books |
| 2. | Females in traditional roles | Presentation of females in traditional roles in society |
| 3. | Male preference | Preference of males over females in society |
| 4. | Societal beliefs | Reinforcement of the societal belief that women are not entitled to social privileges |
| 5. | Equal participation | Men participating equally to females in society |
Table 2.
Respondents statistics.
| Respondent Group | Number of Respondents | Gender | Age | |
|---|---|---|---|---|
| Male | Female | (In Years) | ||
| Teachers | 10 | 5 | 5 | 25–60 |
| Students | 460 | 230 | 230 | 16–19 |
Table 3.
Number of male and female characters in two text books.
| Books | No. of Female Characters | Percentage of Female Characters | No. of Male Characters | Percentage of Male Characters |
|---|---|---|---|---|
| Book 1 | 16 | 25 | 47 | 75 |
| Book 2 | 10 | 14 | 61 | 86 |
| Total | 26 | 20 | 108 | 80 |
Table 4.
Distribution of characters in Book 1.
| Roles | Number of Females in Book 1 | Percentage of Females in Book 1 | No. of Males in Book 1 | Percentage of Male in Book 1 |
|---|---|---|---|---|
| Main | 9 | 29 | 22 | 71 |
| Supporting | 2 | 25 | 6 | 75 |
| Minor | 7 | 29 | 17 | 71 |
| Total | 18 | 29 | 45 | 71 |
Table 5.
Distribution of characters in Book 2.
| Roles | Number of Females in Book 2 | Percentage of Females in Book 2 | No. of Males in Book 2 | Percentage of Male in Book 2 |
|---|---|---|---|---|
| Main | 4 | 20 | 16 | 80 |
| Supporting | 0 | 0 | 3 | 100 |
| Minor | 5 | 31 | 11 | 69 |
| Total | 9 | 23 | 30 | 77 |
Table 6.
Use of nouns and adjectives in the books.
| Nouns | Nouns for Females | Frequency of the Nouns for Females | Nouns for Males | Frequency of the Noun for Males |
|---|---|---|---|---|
| Book 1 | Woman | 00 | Man | 37 |
| Wife | 04 | Husband | 00 | |
| Mother | 14 | Father | 50 | |
| Grandmother | 06 | Grandfather | 27 | |
| Sister | 11 | Brother | 16 | |
| Daughter | 01 | Son | 02 | |
| Book 2 | Woman | 34 | Man | 45 |
| Wife | 22 | Husband | 28 | |
| Mother | 05 | Father | 36 | |
| Grandmother | 00 | Grandfather | 00 | |
| Sister | 31 | Brother | 04 | |
| Daughter | 42 | Son | 03 |
Table 7.
Results for gender-bias prediction under male characters theme.
| Method | Accuracy | Precision | Recall | F1 Score |
|---|---|---|---|---|
| SVM (Linear) | 0.415 | 0.498 | 0.499 | 0.498 |
| SVM (RBF) | 0.585 | 0.568 | 0.571 | 0.569 |
| Logistic regression | 0.426 | 0.47 | 0.473 | 0.471 |
| Decision tree | 0.638 | 0.624 | 0.631 | 0.627 |
| Random forest (estimators = 3) | 0.585 | 0.558 | 0.559 | 0.558 |
| Random forest (estimators = 5) | 0.649 | 0.626 | 0.627 | 0.626 |
| Random forest (estimators = 8) | 0.574 | 0.569 | 0.574 | 0.571 |
| Random forest (estimators = 10) | 0.628 | 0.62 | 0.628 | 0.624 |
| Random forest (estimators = 15) | 0.606 | 0.594 | 0.599 | 0.596 |
| ANN (layers = 4, neurons = 128) | 0.606 | 0.594 | 0.599 | 0.596 |
Table 8.
Results for gender-bias prediction under females-in-traditional-roles theme.
| Method | Accuracy | Precision | Recall | F1 Score |
|---|---|---|---|---|
| SVM (Linear) | 0.723 | 0.723 | 0.739 | 0.731 |
| SVM (RBF) | 0.745 | 0.728 | 0.733 | 0.73 |
| Logestic regression | 0.755 | 0.748 | 0.764 | 0.756 |
| Decision tree | 0.777 | 0.765 | 0.746 | 0.755 |
| Random forest (estimators = 3) | 0.745 | 0.727 | 0.721 | 0.724 |
| Random forest (estimators = 5) | 0.734 | 0.72 | 0.73 | 0.725 |
| Random forest (estimators = 8) | 0.745 | 0.728 | 0.733 | 0.73 |
| Random forest (estimators = 10) | 0.777 | 0.762 | 0.77 | 0.766 |
| Random forest (estimators = 15) | 0.766 | 0.754 | 0.767 | 0.76 |
| ANN (layers = 1, neurons = 16) | 0.787 | 0.782 | 0.801 | 0.791 |
Table 9.
Results for gender-biased prediction under male-preference theme.
| Method | Accuracy | Precision | Recall | F1 Score |
|---|---|---|---|---|
| SVM (Linear) | 0.457 | 0.526 | 0.521 | 0.523 |
| SVM (RBF) | 0.628 | 0.62 | 0.628 | 0.624 |
| Logestic regression | 0.606 | 0.615 | 0.623 | 0.619 |
| Decision tree | 0.681 | 0.667 | 0.676 | 0.671 |
| Random forest (estimators = 3) | 0.66 | 0.646 | 0.653 | 0.649 |
| Random forest (estimators = 5) | 0.681 | 0.657 | 0.653 | 0.655 |
| Random forest (estimators = 8) | 0.723 | 0.71 | 0.675 | 0.692 |
| Random forest (estimators = 10) | 0.649 | 0.626 | 0.627 | 0.626 |
| Random forest (estimators = 15) | 0.691 | 0.671 | 0.673 | 0.672 |
| ANN (layers = 2, neurons = 64) | 0.702 | 0.681 | 0.681 | 0.681 |
Table 10.
Results for gender-bias prediction under societal-belief theme.
| Method | Accuracy | Precision | Recall | F1 Score |
|---|---|---|---|---|
| SVM (Linear) | 0.766 | 0.764 | 0.721 | 0.742 |
| SVM (RBF) | 0.713 | 0.698 | 0.707 | 0.702 |
| Logestic regression | 0.723 | 0.703 | 0.698 | 0.7 |
| Decision tree | 0.638 | 0.628 | 0.636 | 0.632 |
| Random forest (estimators = 3) | 0.67 | 0.668 | 0.679 | 0.673 |
| Random forest (estimators = 5) | 0.617 | 0.623 | 0.631 | 0.627 |
| Random forest (estimators = 8) | 0.681 | 0.676 | 0.688 | 0.682 |
| Random forest (estimators = 10) | 0.67 | 0.668 | 0.679 | 0.673 |
| Random forest (estimators = 15) | 0.649 | 0.646 | 0.656 | 0.651 |
| ANN (layers = 2, neurons = 8) | 0.755 | 0.742 | 0.753 | 0.747 |
Table 11.
Results for Gender prediction under Equal Participation theme.
| Method | Accuracy | Precision | Recall | F1 Score |
|---|---|---|---|---|
| SVM (Linear) | 0.574 | 0.592 | 0.597 | 0.594 |
| SVM (RBF) | 0.67 | 0.651 | 0.656 | 0.653 |
| Logistic regression | 0.649 | 0.633 | 0.639 | 0.636 |
| Decision tree | 0.638 | 0.607 | 0.601 | 0.604 |
| Random forest (estimators = 3) | 0.638 | 0.624 | 0.631 | 0.627 |
| Random forest (estimators = 5) | 0.638 | 0.613 | 0.613 | 0.613 |
| Random forest (estimators = 8) | 0.628 | 0.607 | 0.61 | 0.608 |
| Random forest (estimators = 10) | 0.67 | 0.648 | 0.65 | 0.649 |
| Random forest (estimators = 15) | 0.66 | 0.646 | 0.653 | 0.649 |
| ANN (layers = 2, neurons = 64) | 0.67 | 0.646 | 0.644 | 0.645 |
Table 12.
Results for gender prediction using all items.
| Method | Accuracy | Precision | Recall | F1 Score |
|---|---|---|---|---|
| SVM (Linear) | 0.777 | 0.761 | 0.758 | 0.759 |
| SVM (RBF) | 0.809 | 0.795 | 0.807 | 0.801 |
| Logestic regression | 0.745 | 0.728 | 0.733 | 0.73 |
| Decision tree | 0.787 | 0.773 | 0.767 | 0.77 |
| Random forest (estimators = 3) | 0.766 | 0.75 | 0.744 | 0.747 |
| Random forest (estimators = 5) | 0.798 | 0.784 | 0.787 | 0.785 |
| Random forest (estimators = 8) | 0.83 | 0.829 | 0.8 | 0.814 |
| Random forest (estimators = 10) | 0.787 | 0.779 | 0.755 | 0.767 |
| Random forest (estimators = 15) | 0.84 | 0.83 | 0.826 | 0.828 |
| ANN (layers = 4, neurons = 32) | 0.872 | 0.867 | 0.858 | 0.862 |
Disclaimer/Publisher’s Note: The statements, opinions and data contained in all publications are solely those of the individual author(s) and contributor(s) and not of MDPI and/or the editor(s). MDPI and/or the editor(s) disclaim responsibility for any injury to people or property resulting from any ideas, methods, instructions or products referred to in the content. |
© 2023 by the authors. Licensee MDPI, Basel, Switzerland. This article is an open access article distributed under the terms and conditions of the Creative Commons Attribution (CC BY) license (https://creativecommons.org/licenses/by/4.0/).
Share and Cite
MDPI and ACS Style
Kausar, G.; Saleem, S.; Subhan, F.; Suud, M.M.; Alam, M.; Uddin, M.I. Prediction of Gender-Biased Perceptions of Learners and Teachers Using Machine Learning. Sustainability 2023, 15, 6241. https://doi.org/10.3390/su15076241
AMA Style
Kausar G, Saleem S, Subhan F, Suud MM, Alam M, Uddin MI. Prediction of Gender-Biased Perceptions of Learners and Teachers Using Machine Learning. Sustainability. 2023; 15(7):6241. https://doi.org/10.3390/su15076241
Chicago/Turabian StyleKausar, Ghazala, Sajid Saleem, Fazli Subhan, Mazliham Mohd Suud, Mansoor Alam, and M. Irfan Uddin. 2023. "Prediction of Gender-Biased Perceptions of Learners and Teachers Using Machine Learning" Sustainability 15, no. 7: 6241. https://doi.org/10.3390/su15076241
Note that from the first issue of 2016, this journal uses article numbers instead of page numbers. See further details here.