
Optimization of Operating Parameters for Two-Phase Anaerobic Digestion Treating Slaughterhouse Wastewater for Biogas Production: Focus on Hydrolytic–Acidogenic Phase


Abstract
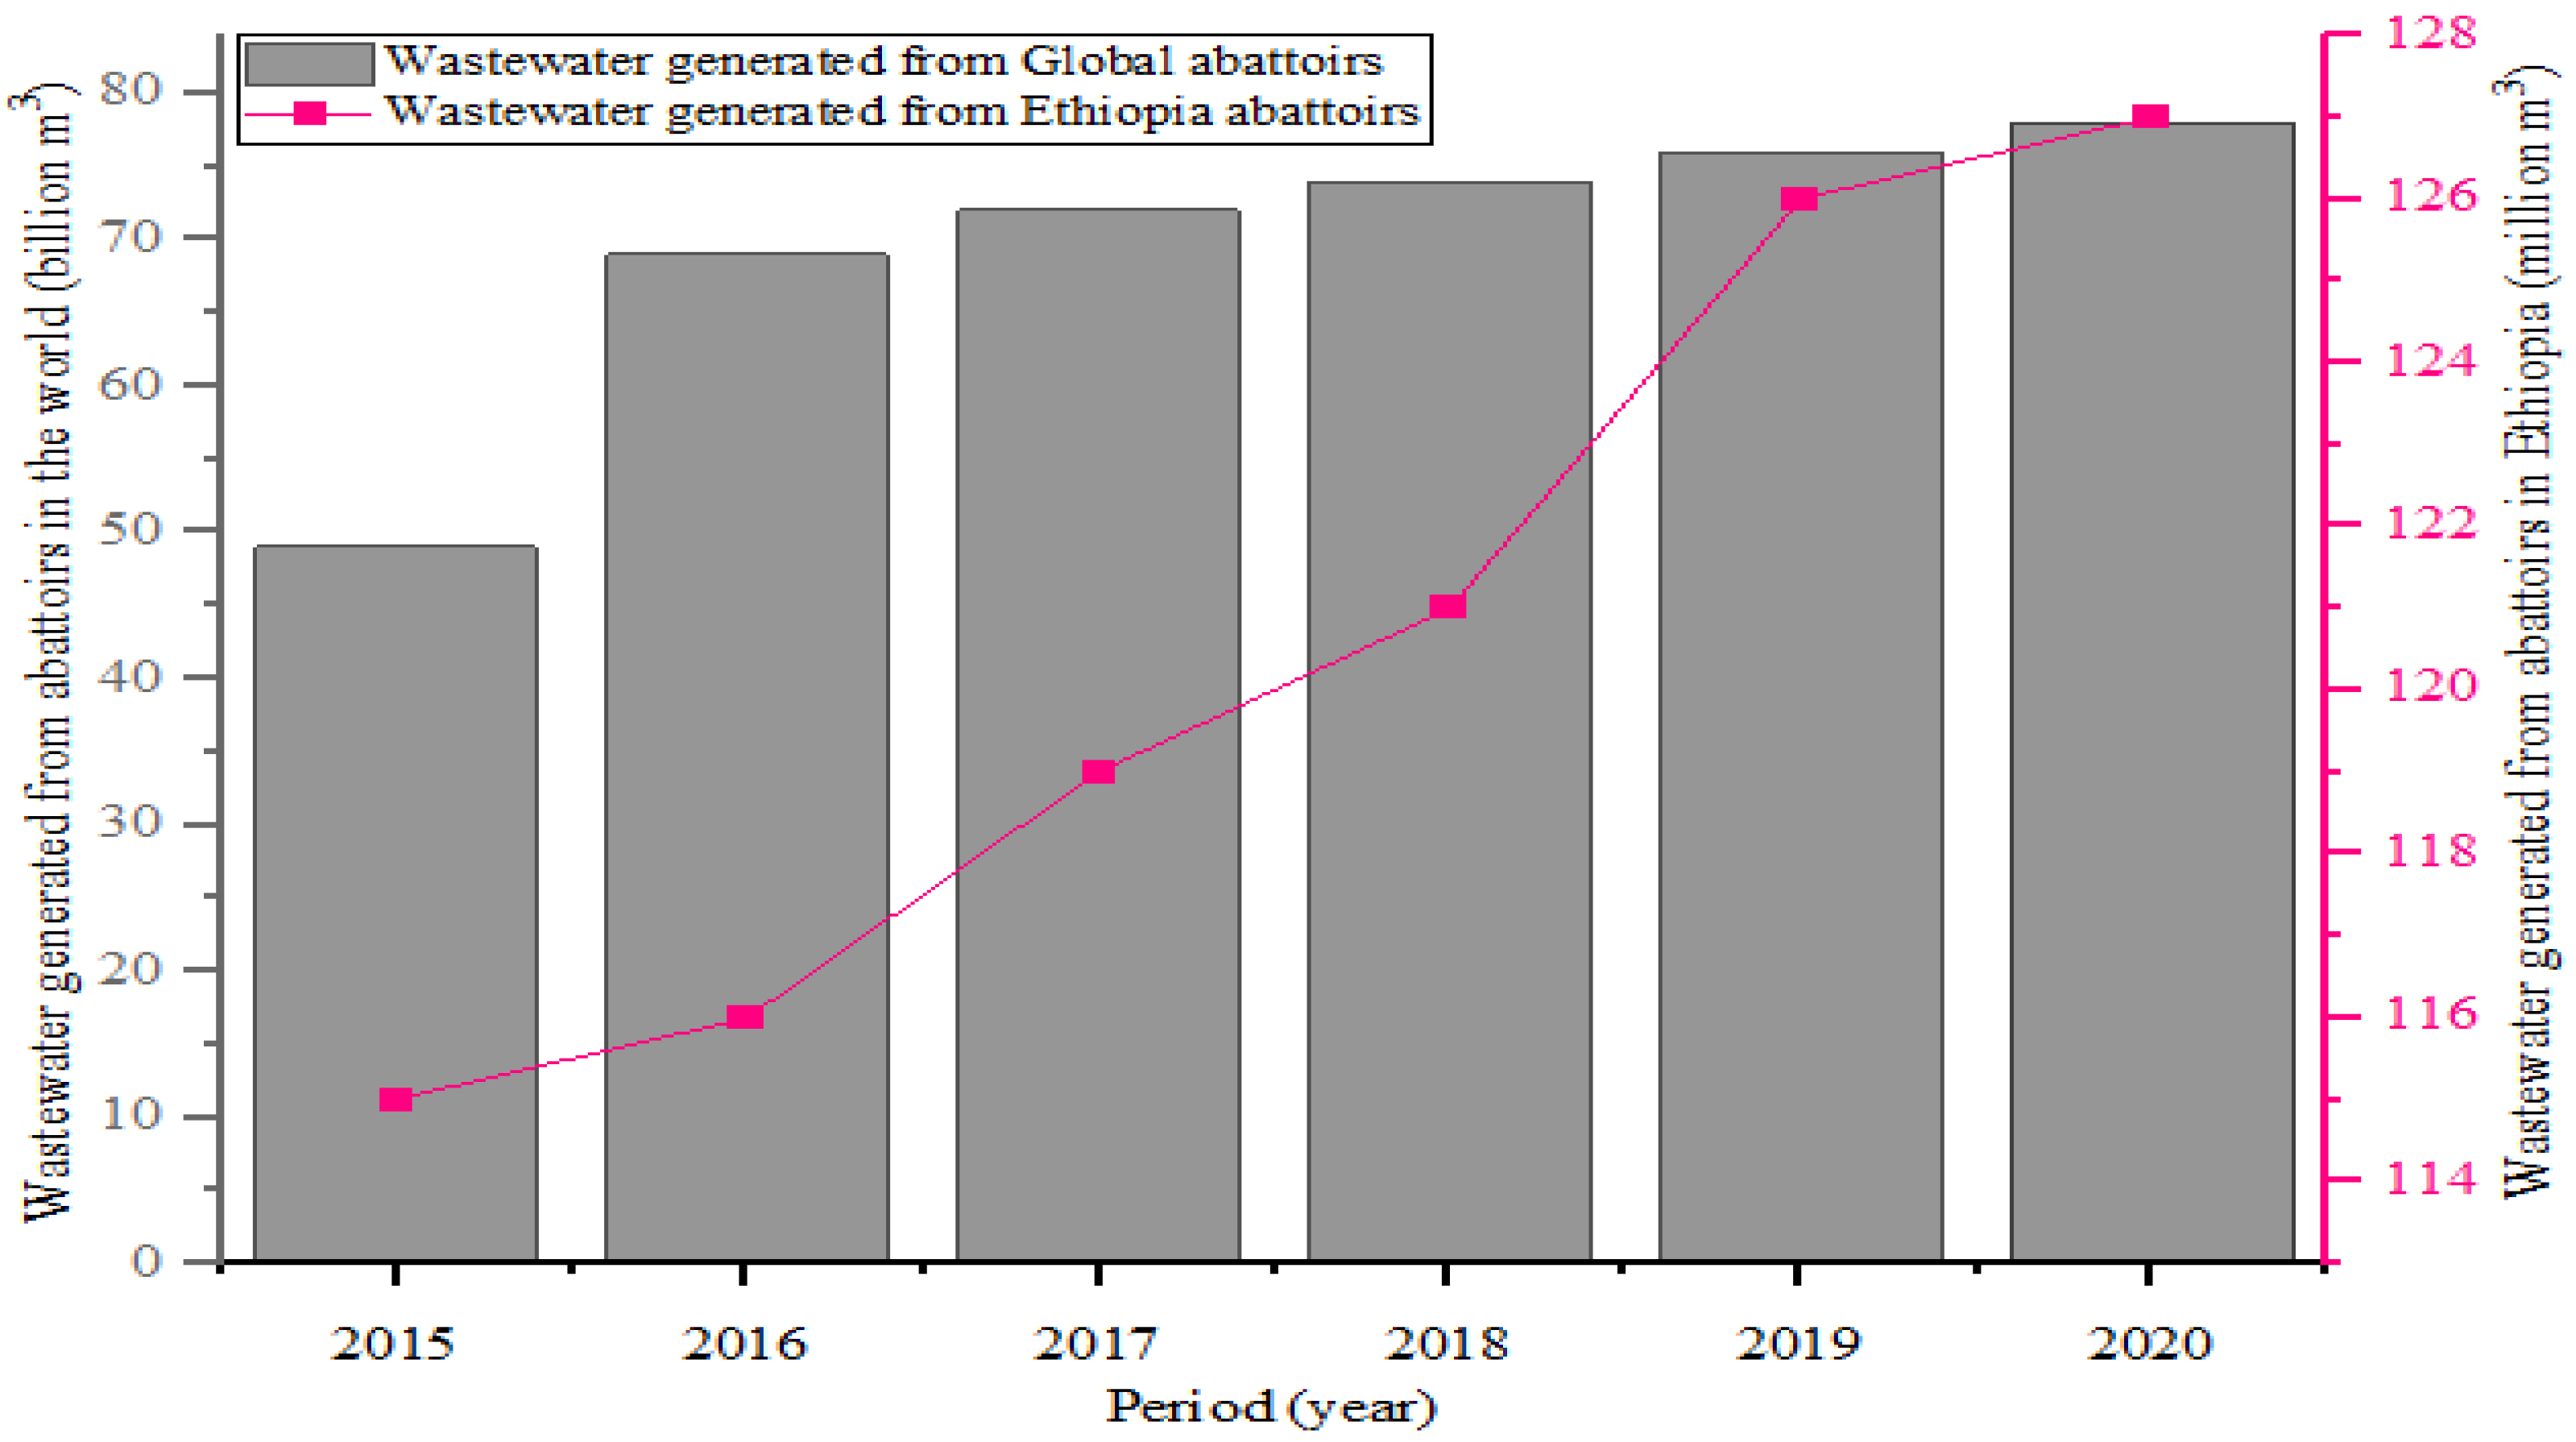
:1. Introduction
2. Materials and Methods
2.1. Source of Feedstock
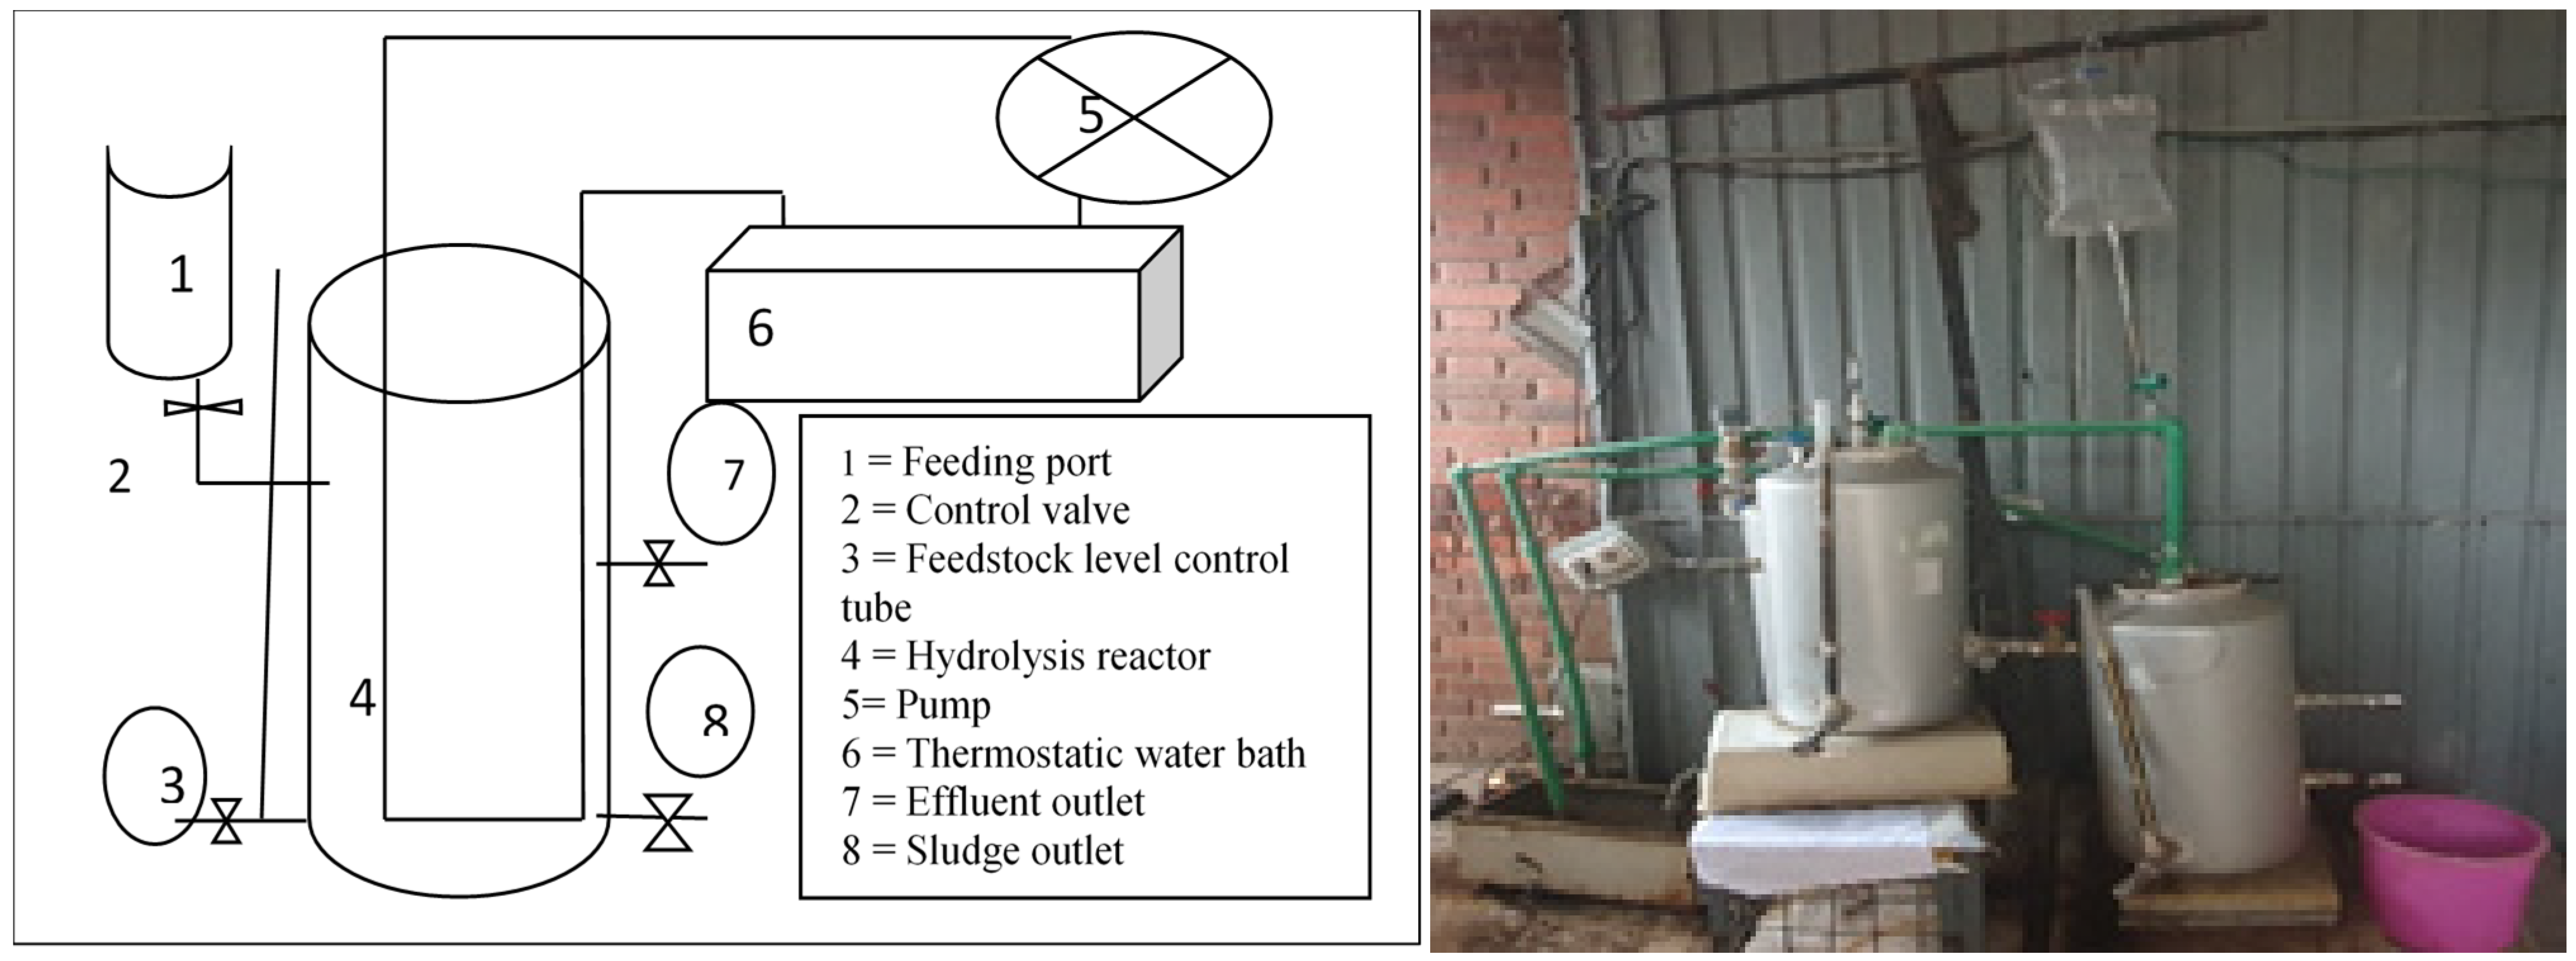
2.2. Experimental Setup (Digester Design) of the Laboratory Scale Digester
2.3. Operating Conditions
2.4. Degree of Acidification
2.5. Analytical Methods
2.6. Data Analyses
3. Results and Discussions
3.1. Characteristics of Feedstock (Organic Export Abattoir Wastewater)
3.2. Effect of HRT/OLR on Reactor Stability and Performance Indicator Parameters
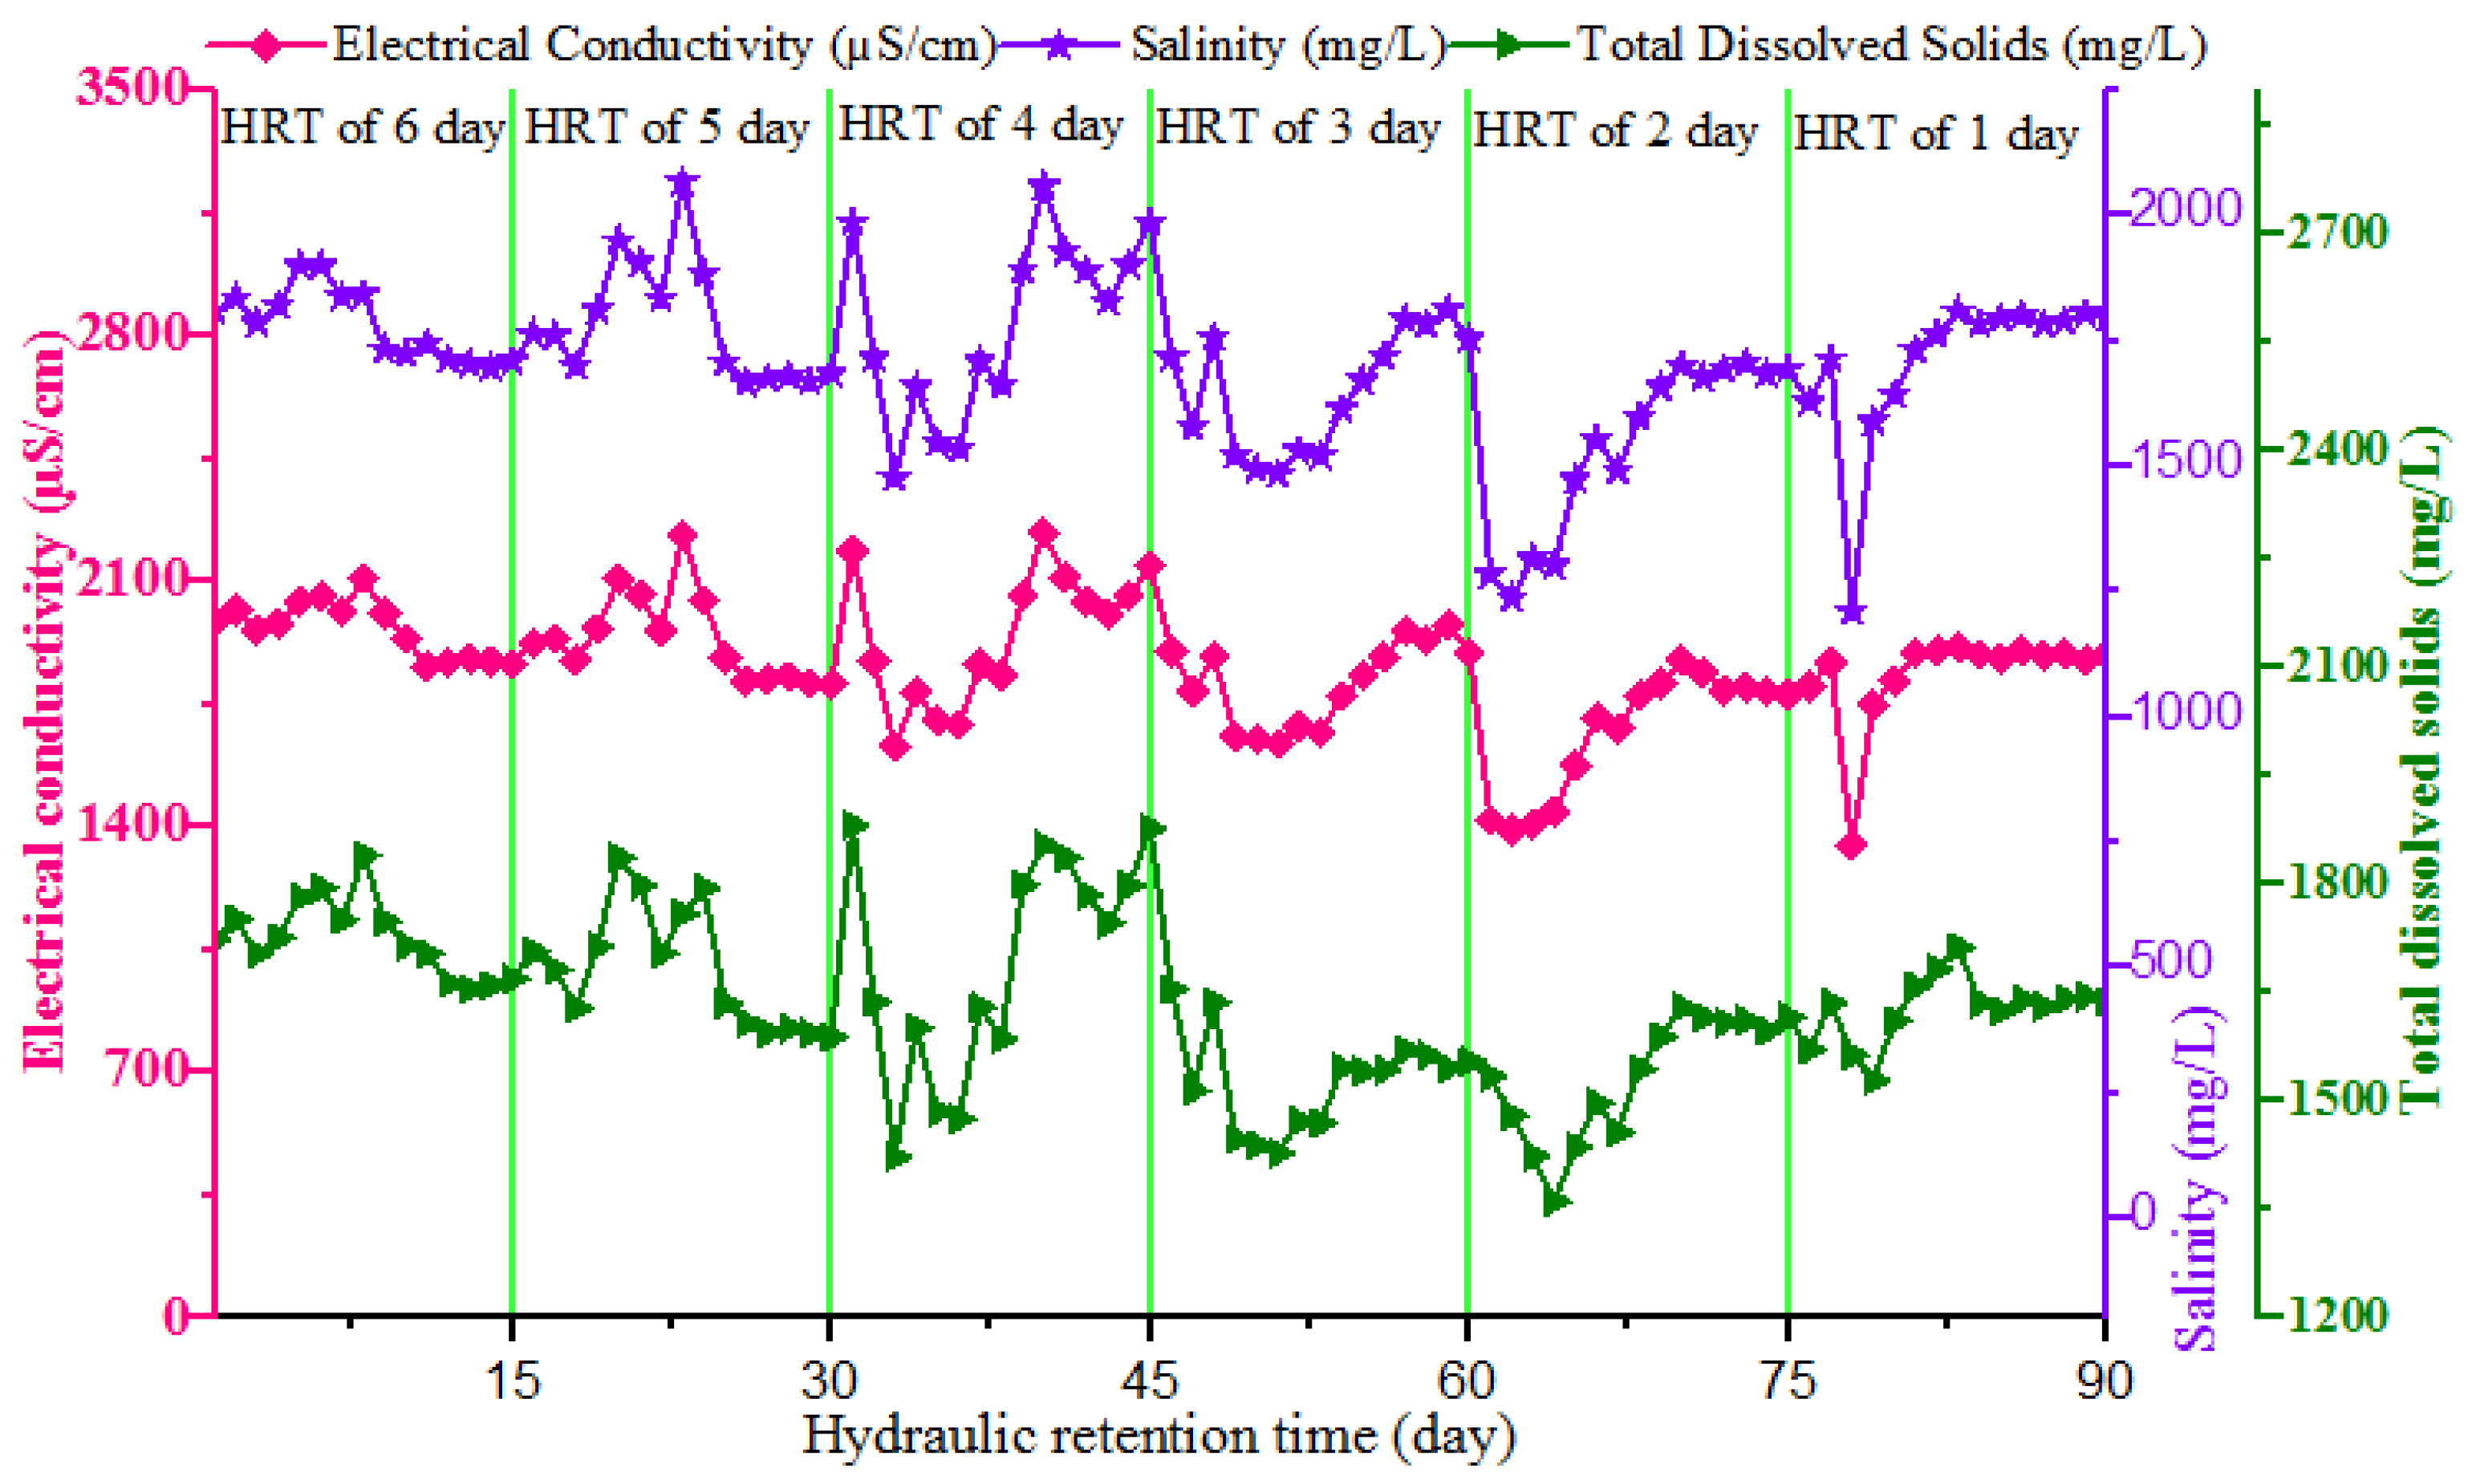
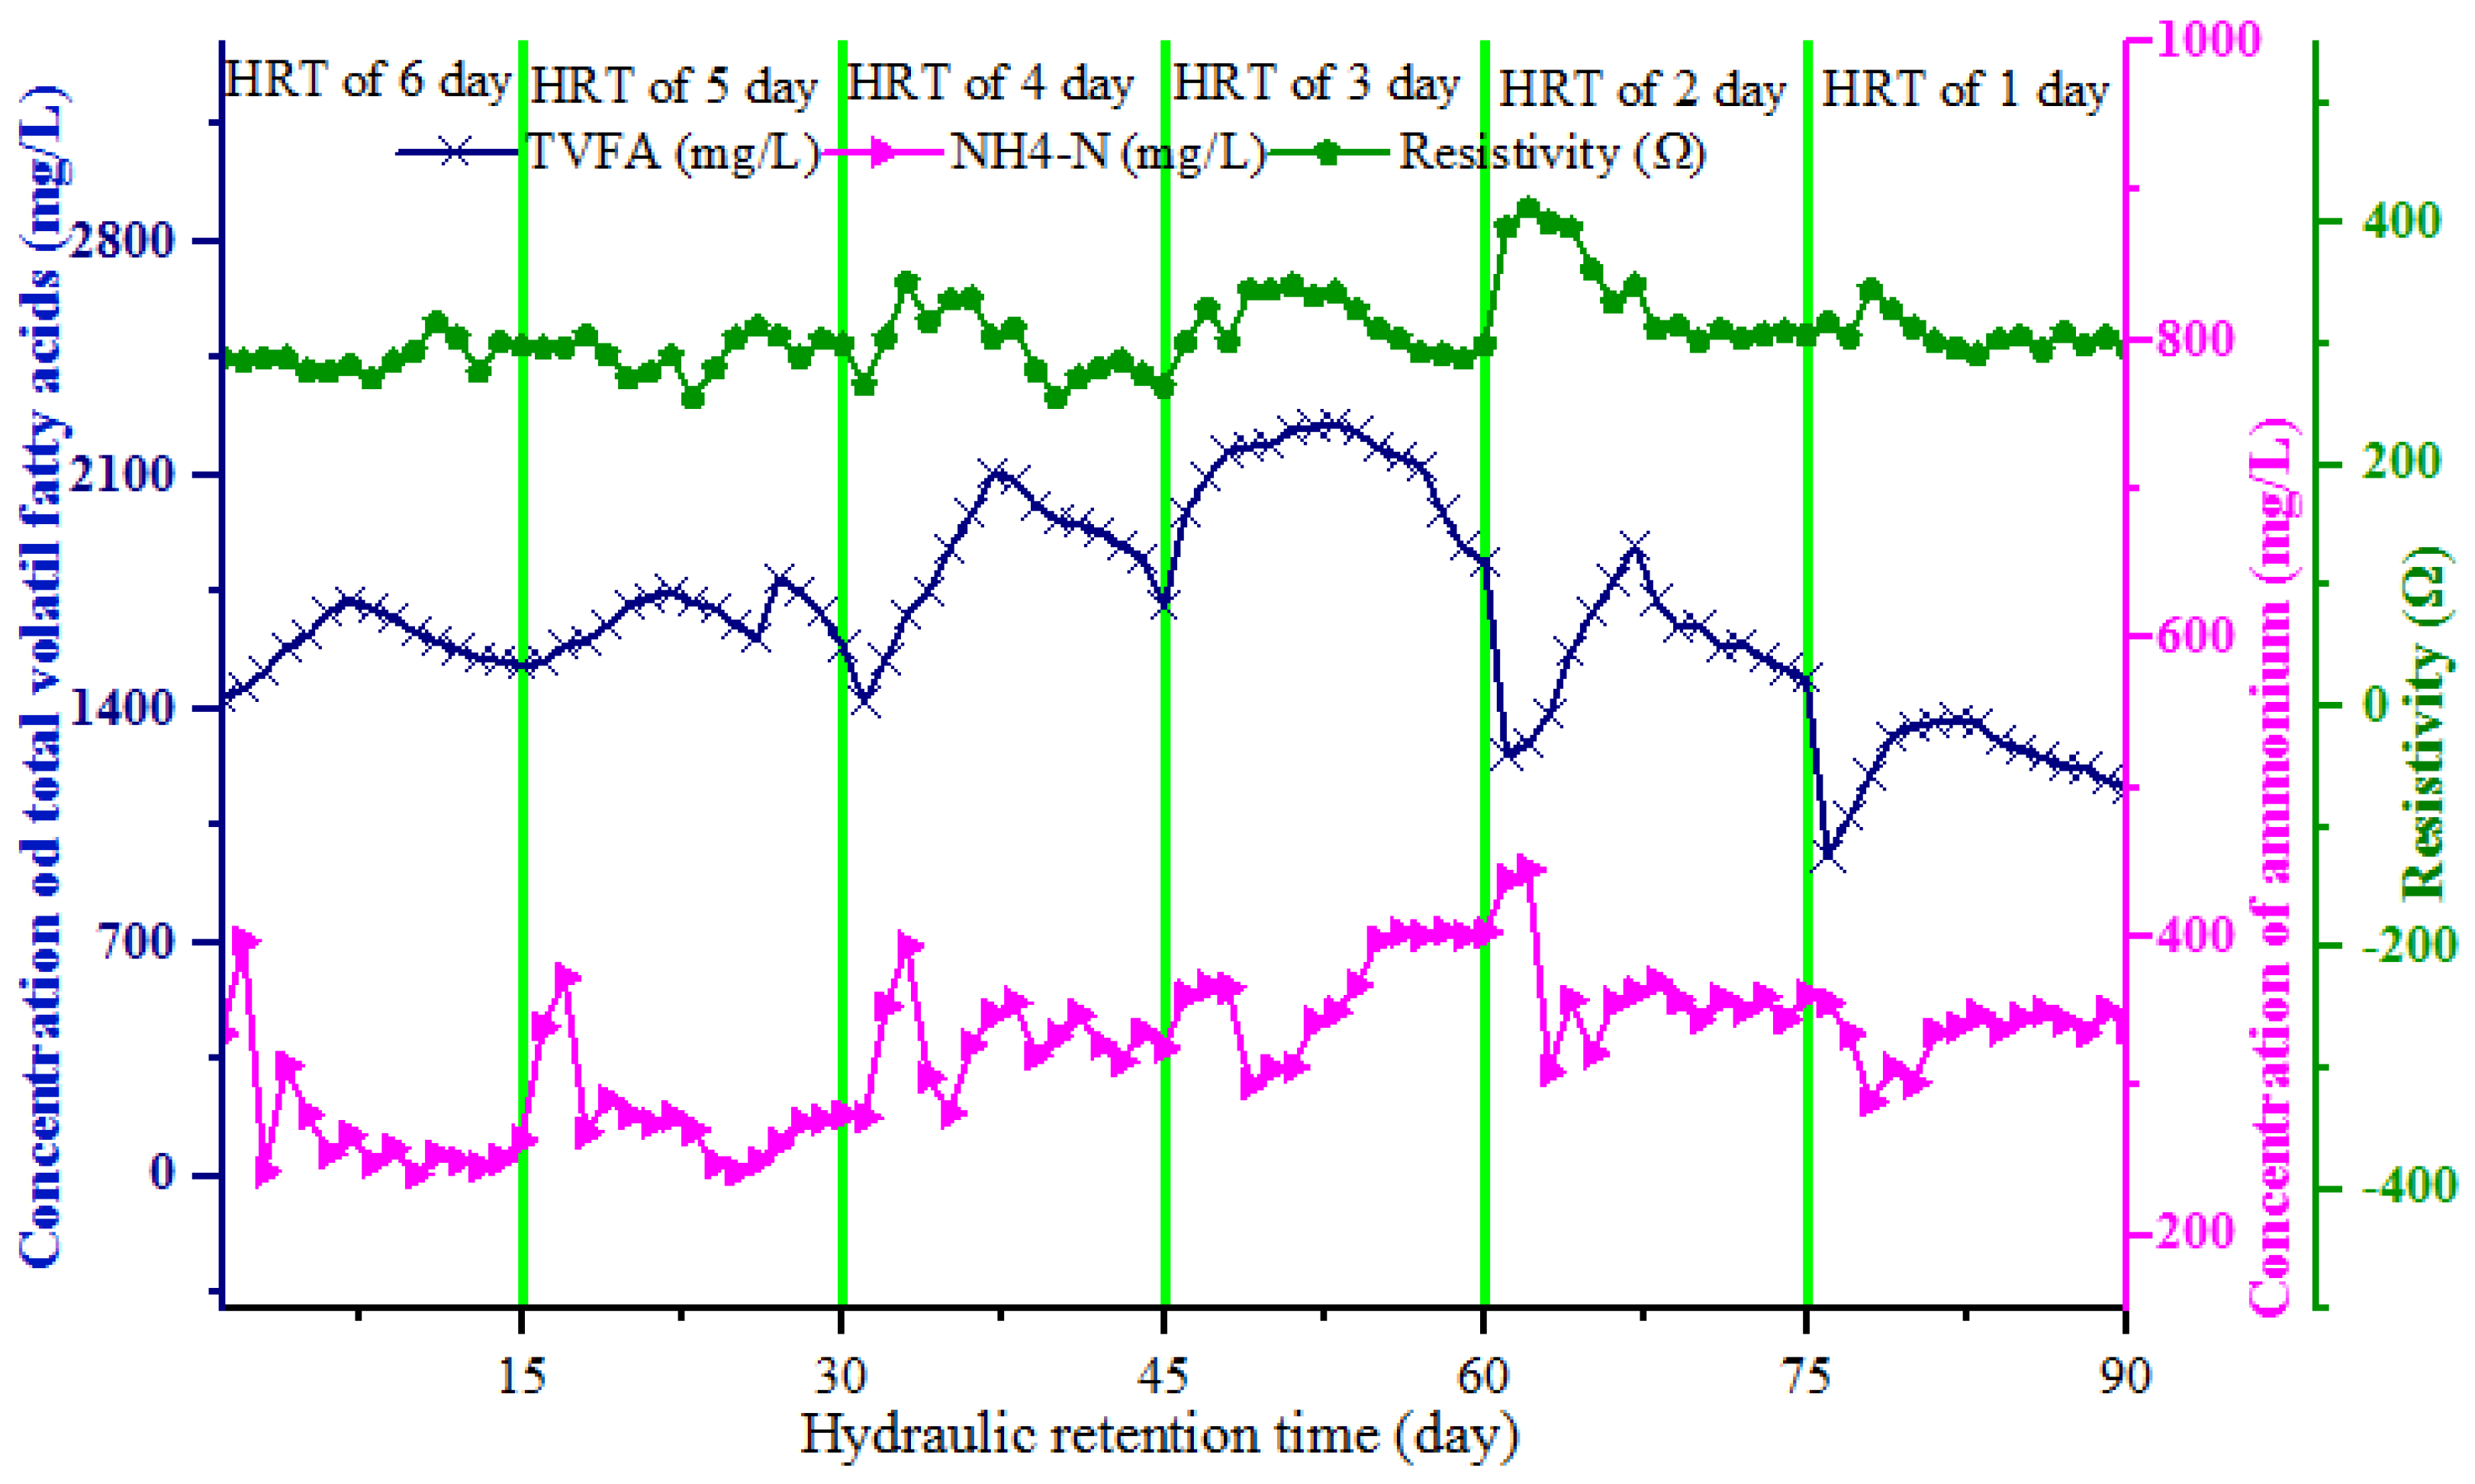
3.2.1. The Effect of OLR/HRT on Salinity, EC, TDS, and Resistivity
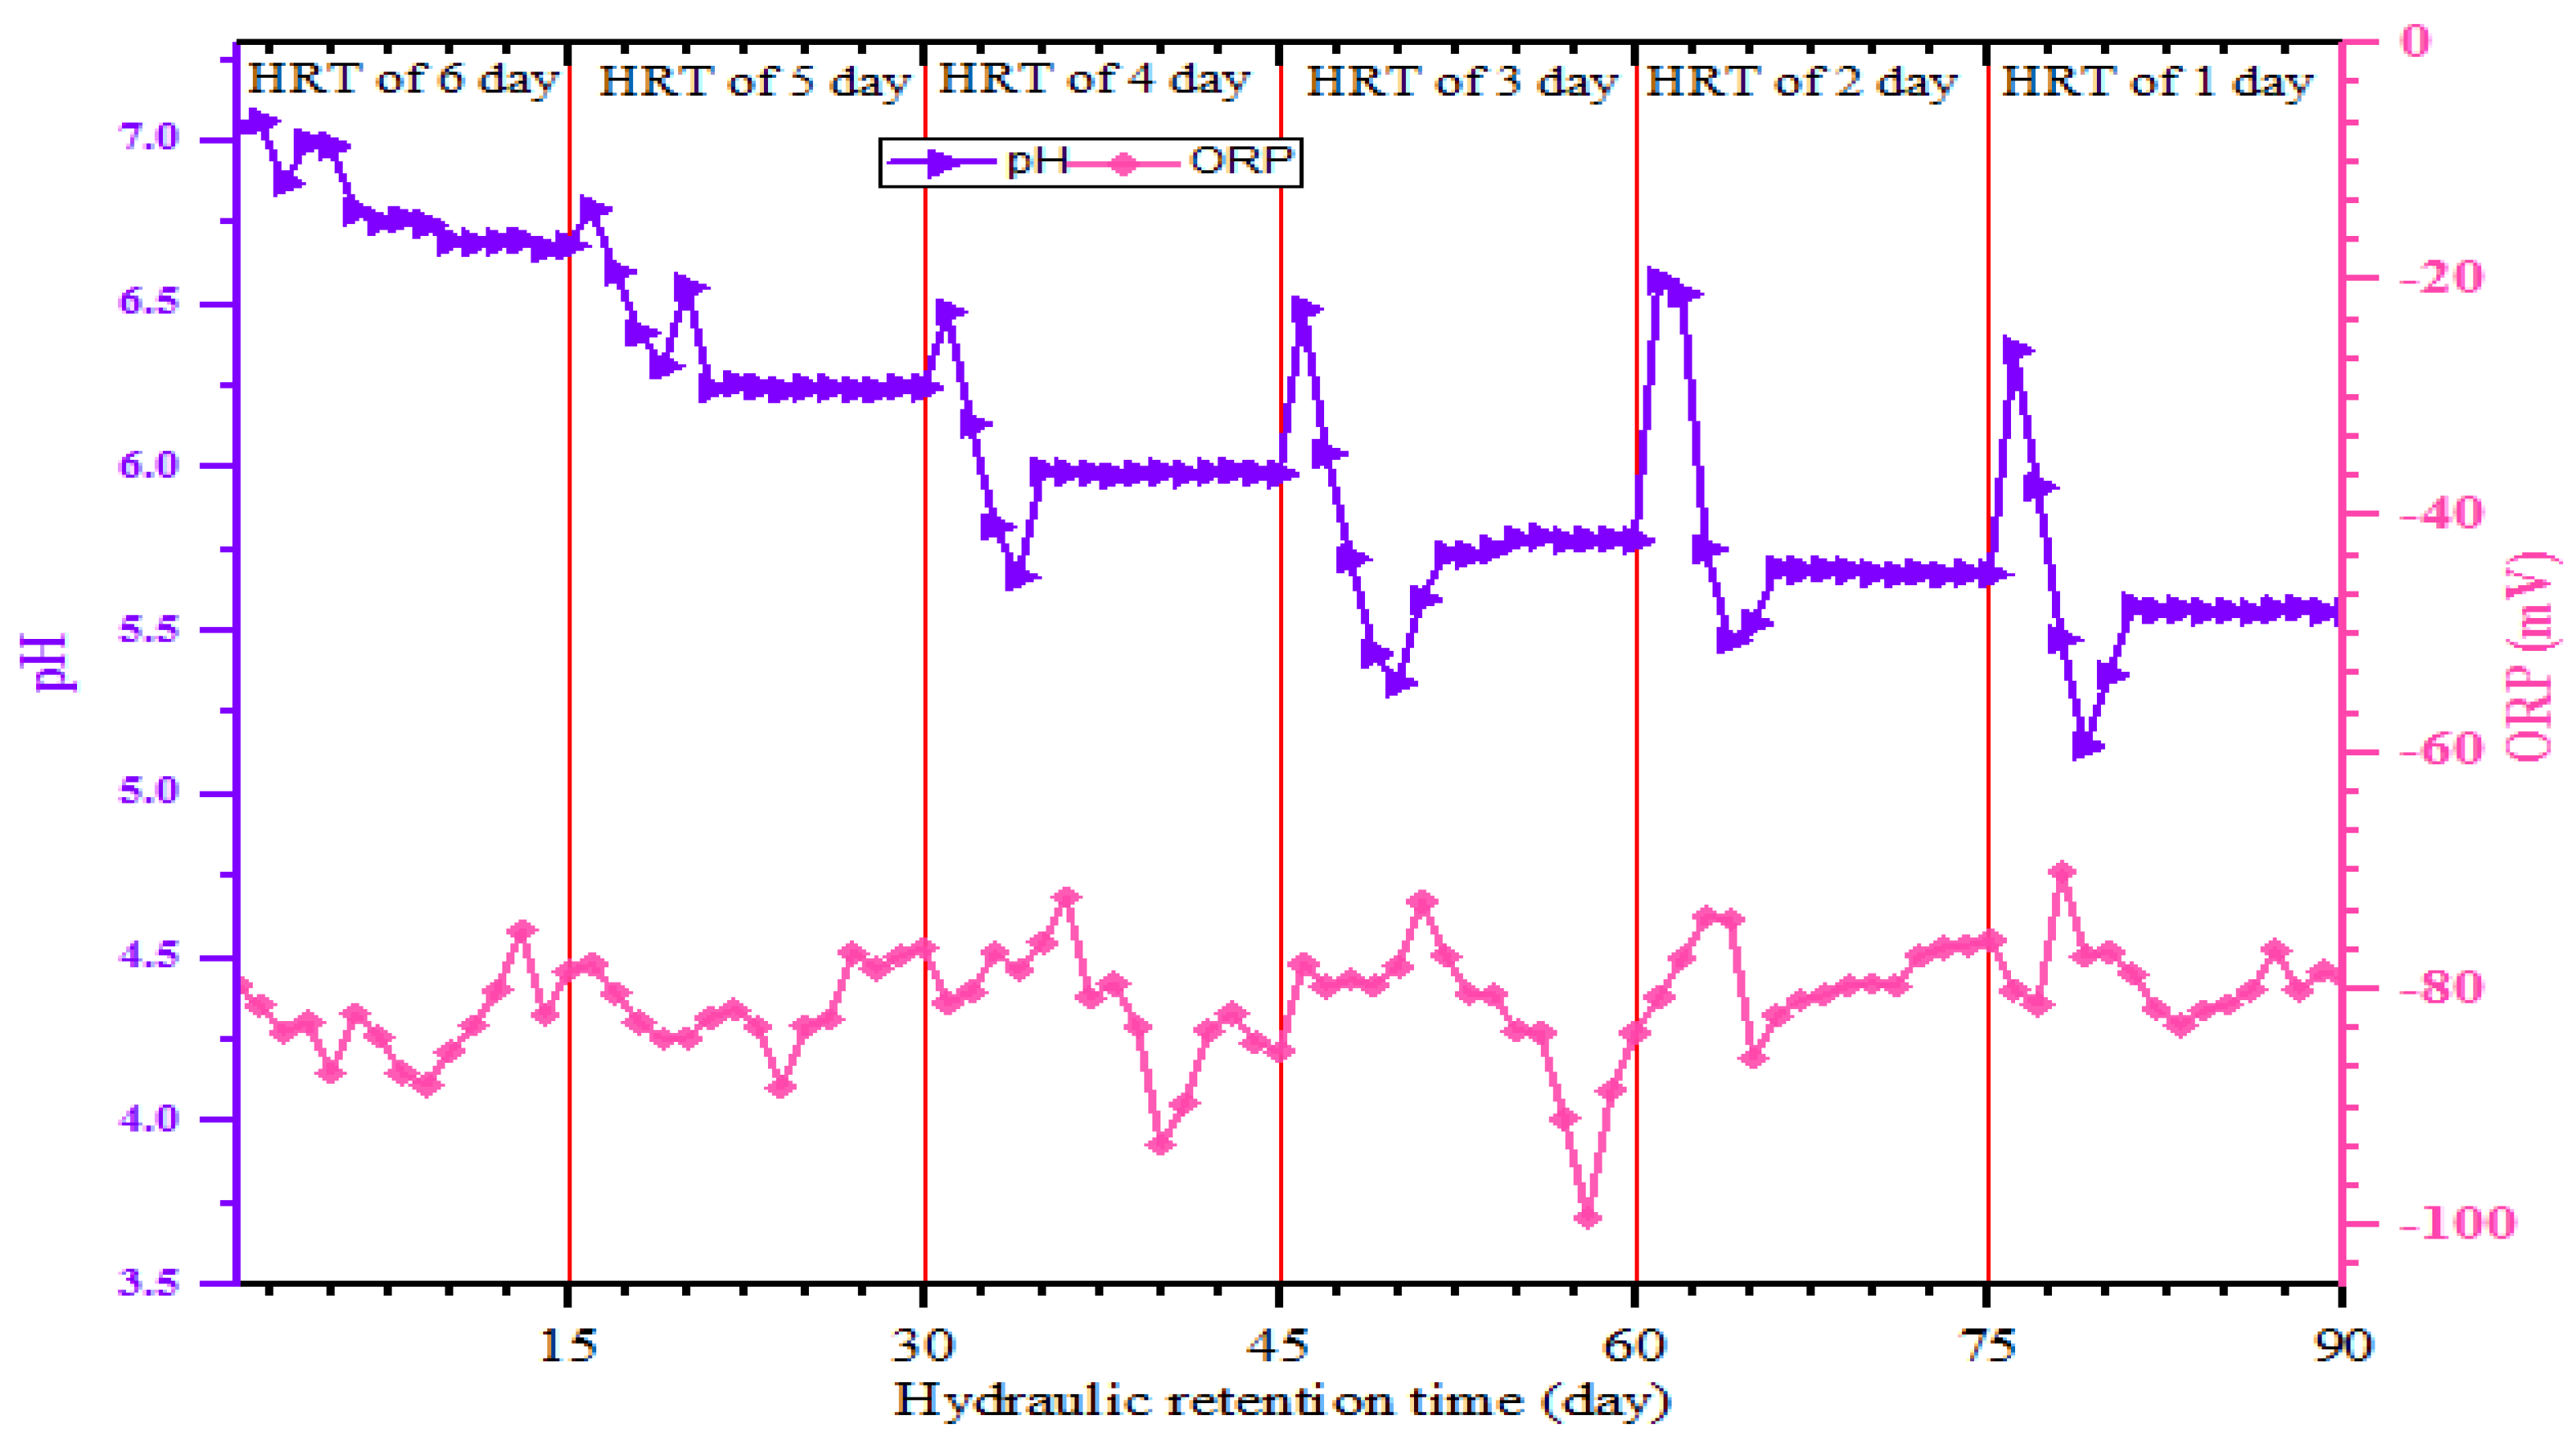
3.2.2. The Effect of OLR/HRT on pH
3.2.3. Effect of HRT/OLR on TVFA Production
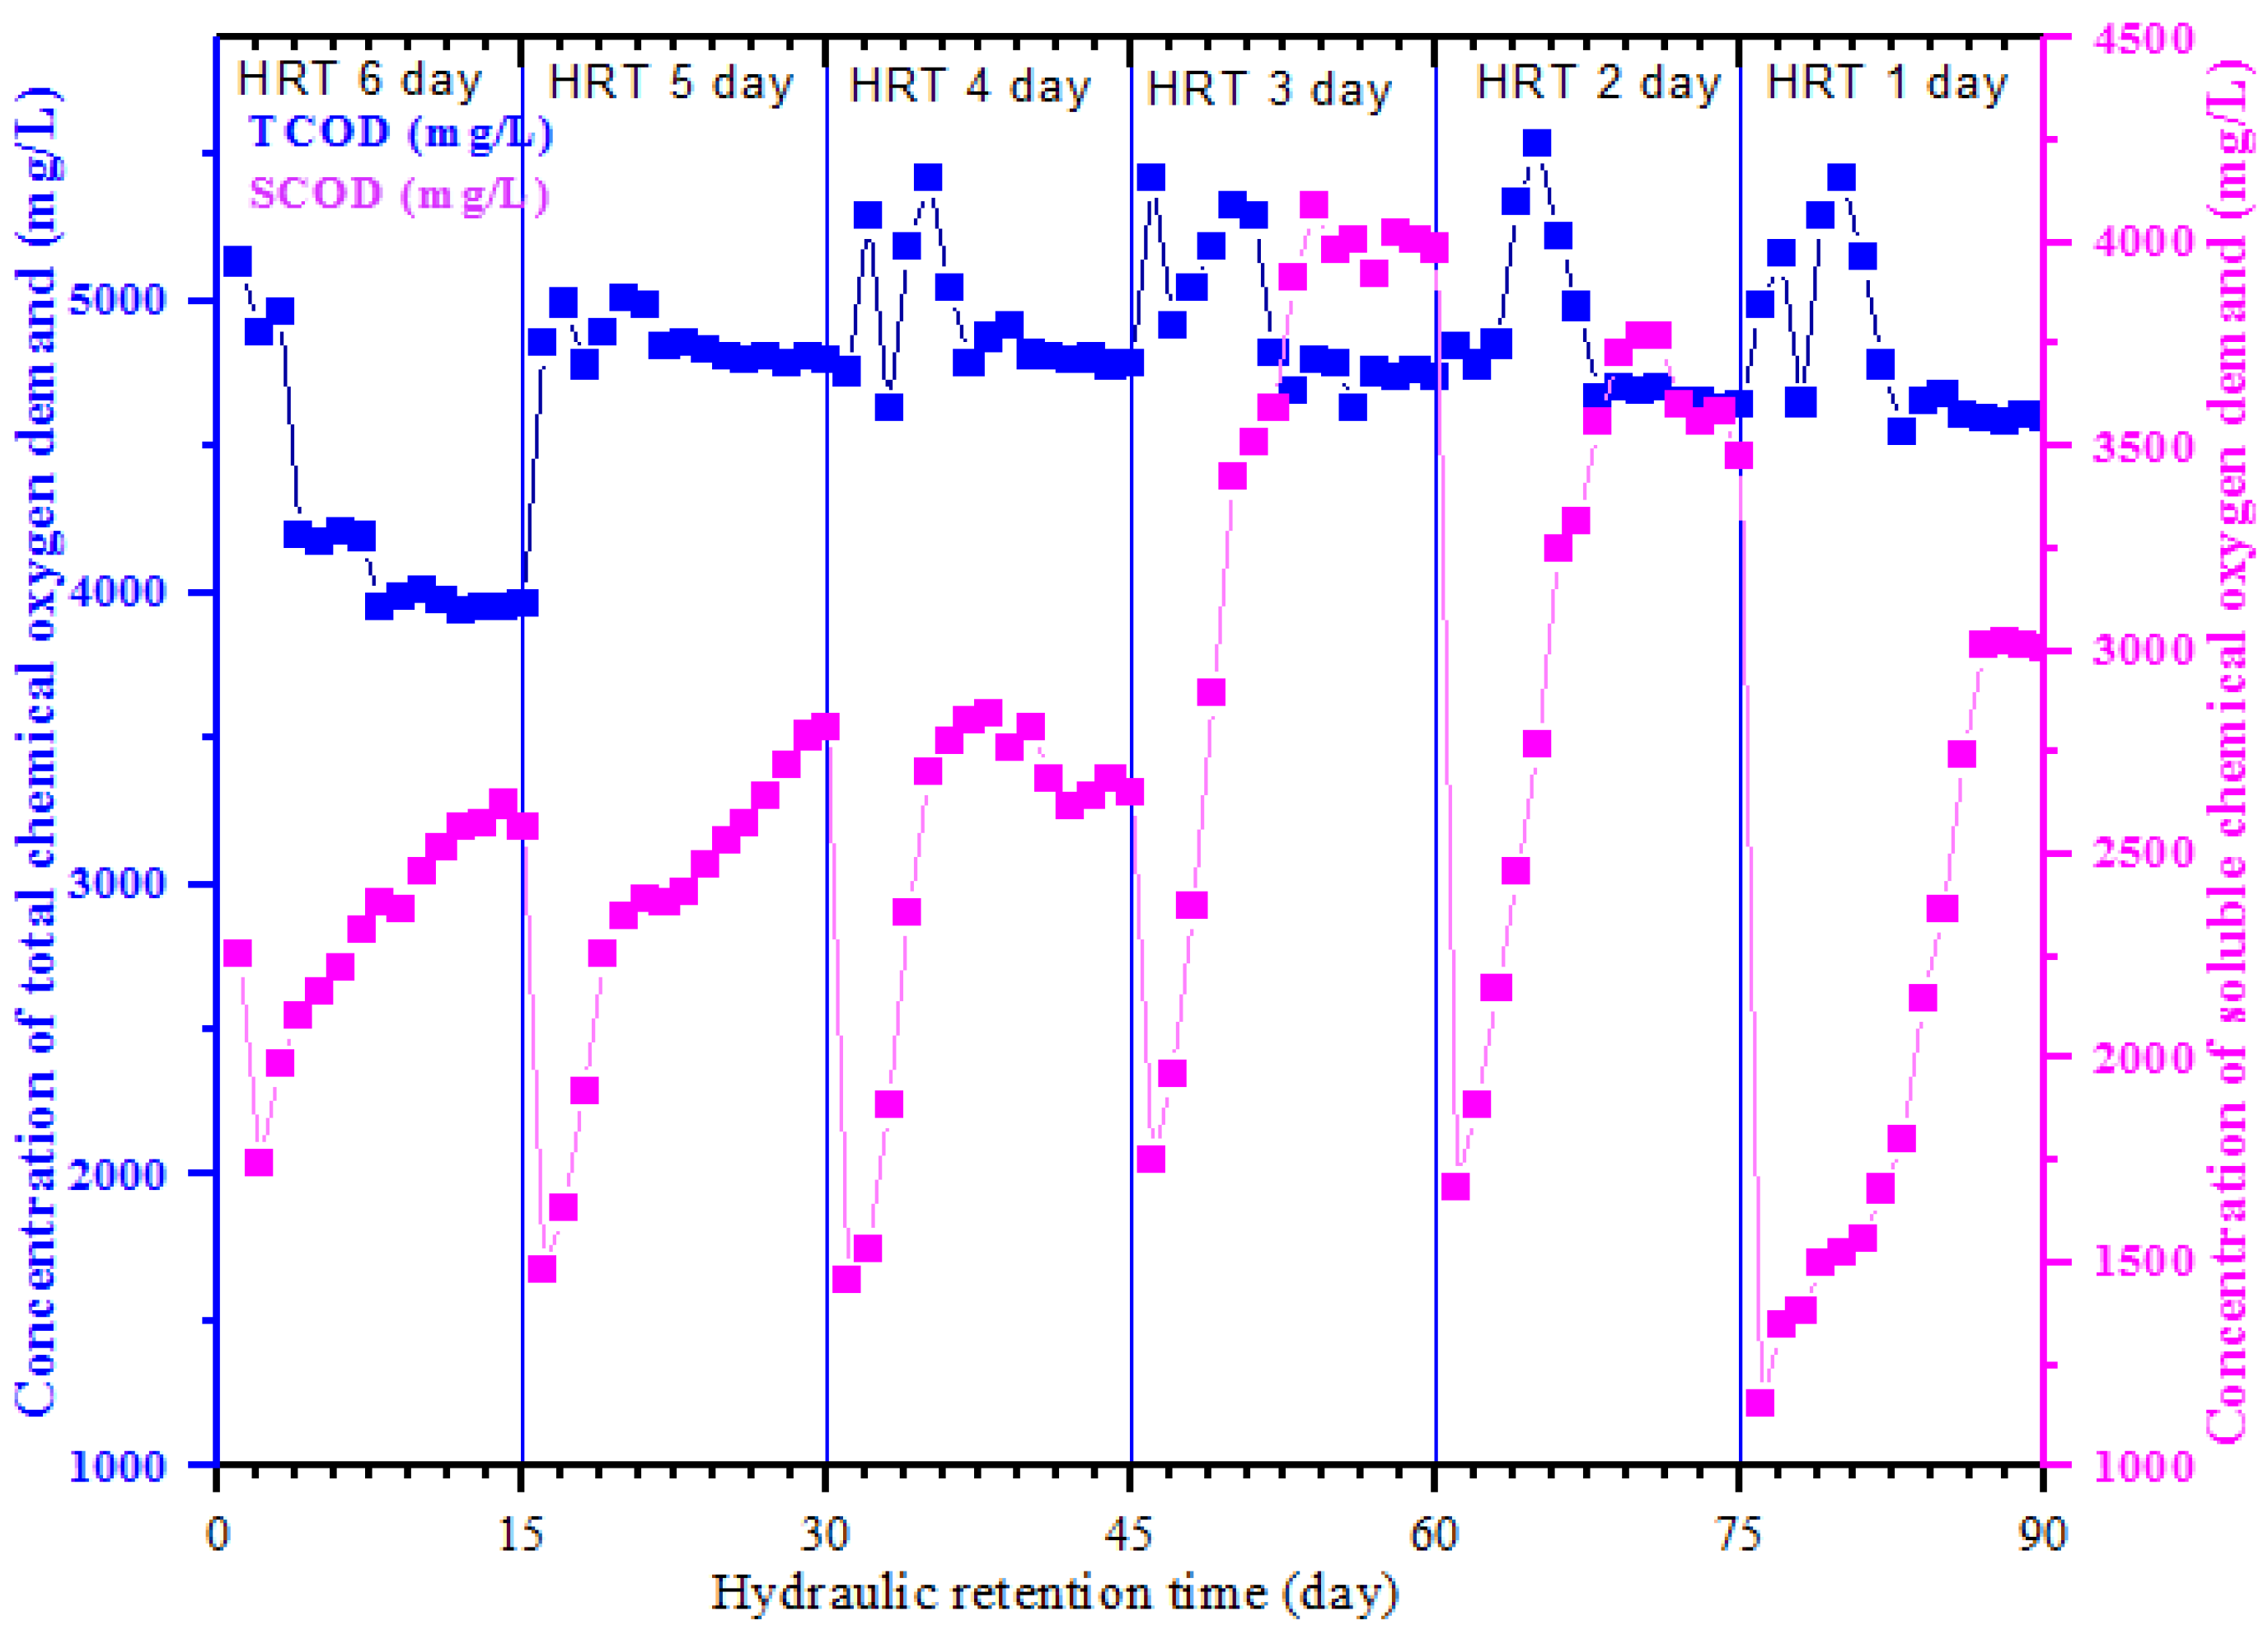
3.2.4. The TCOD and SCOD Production at Different HRT
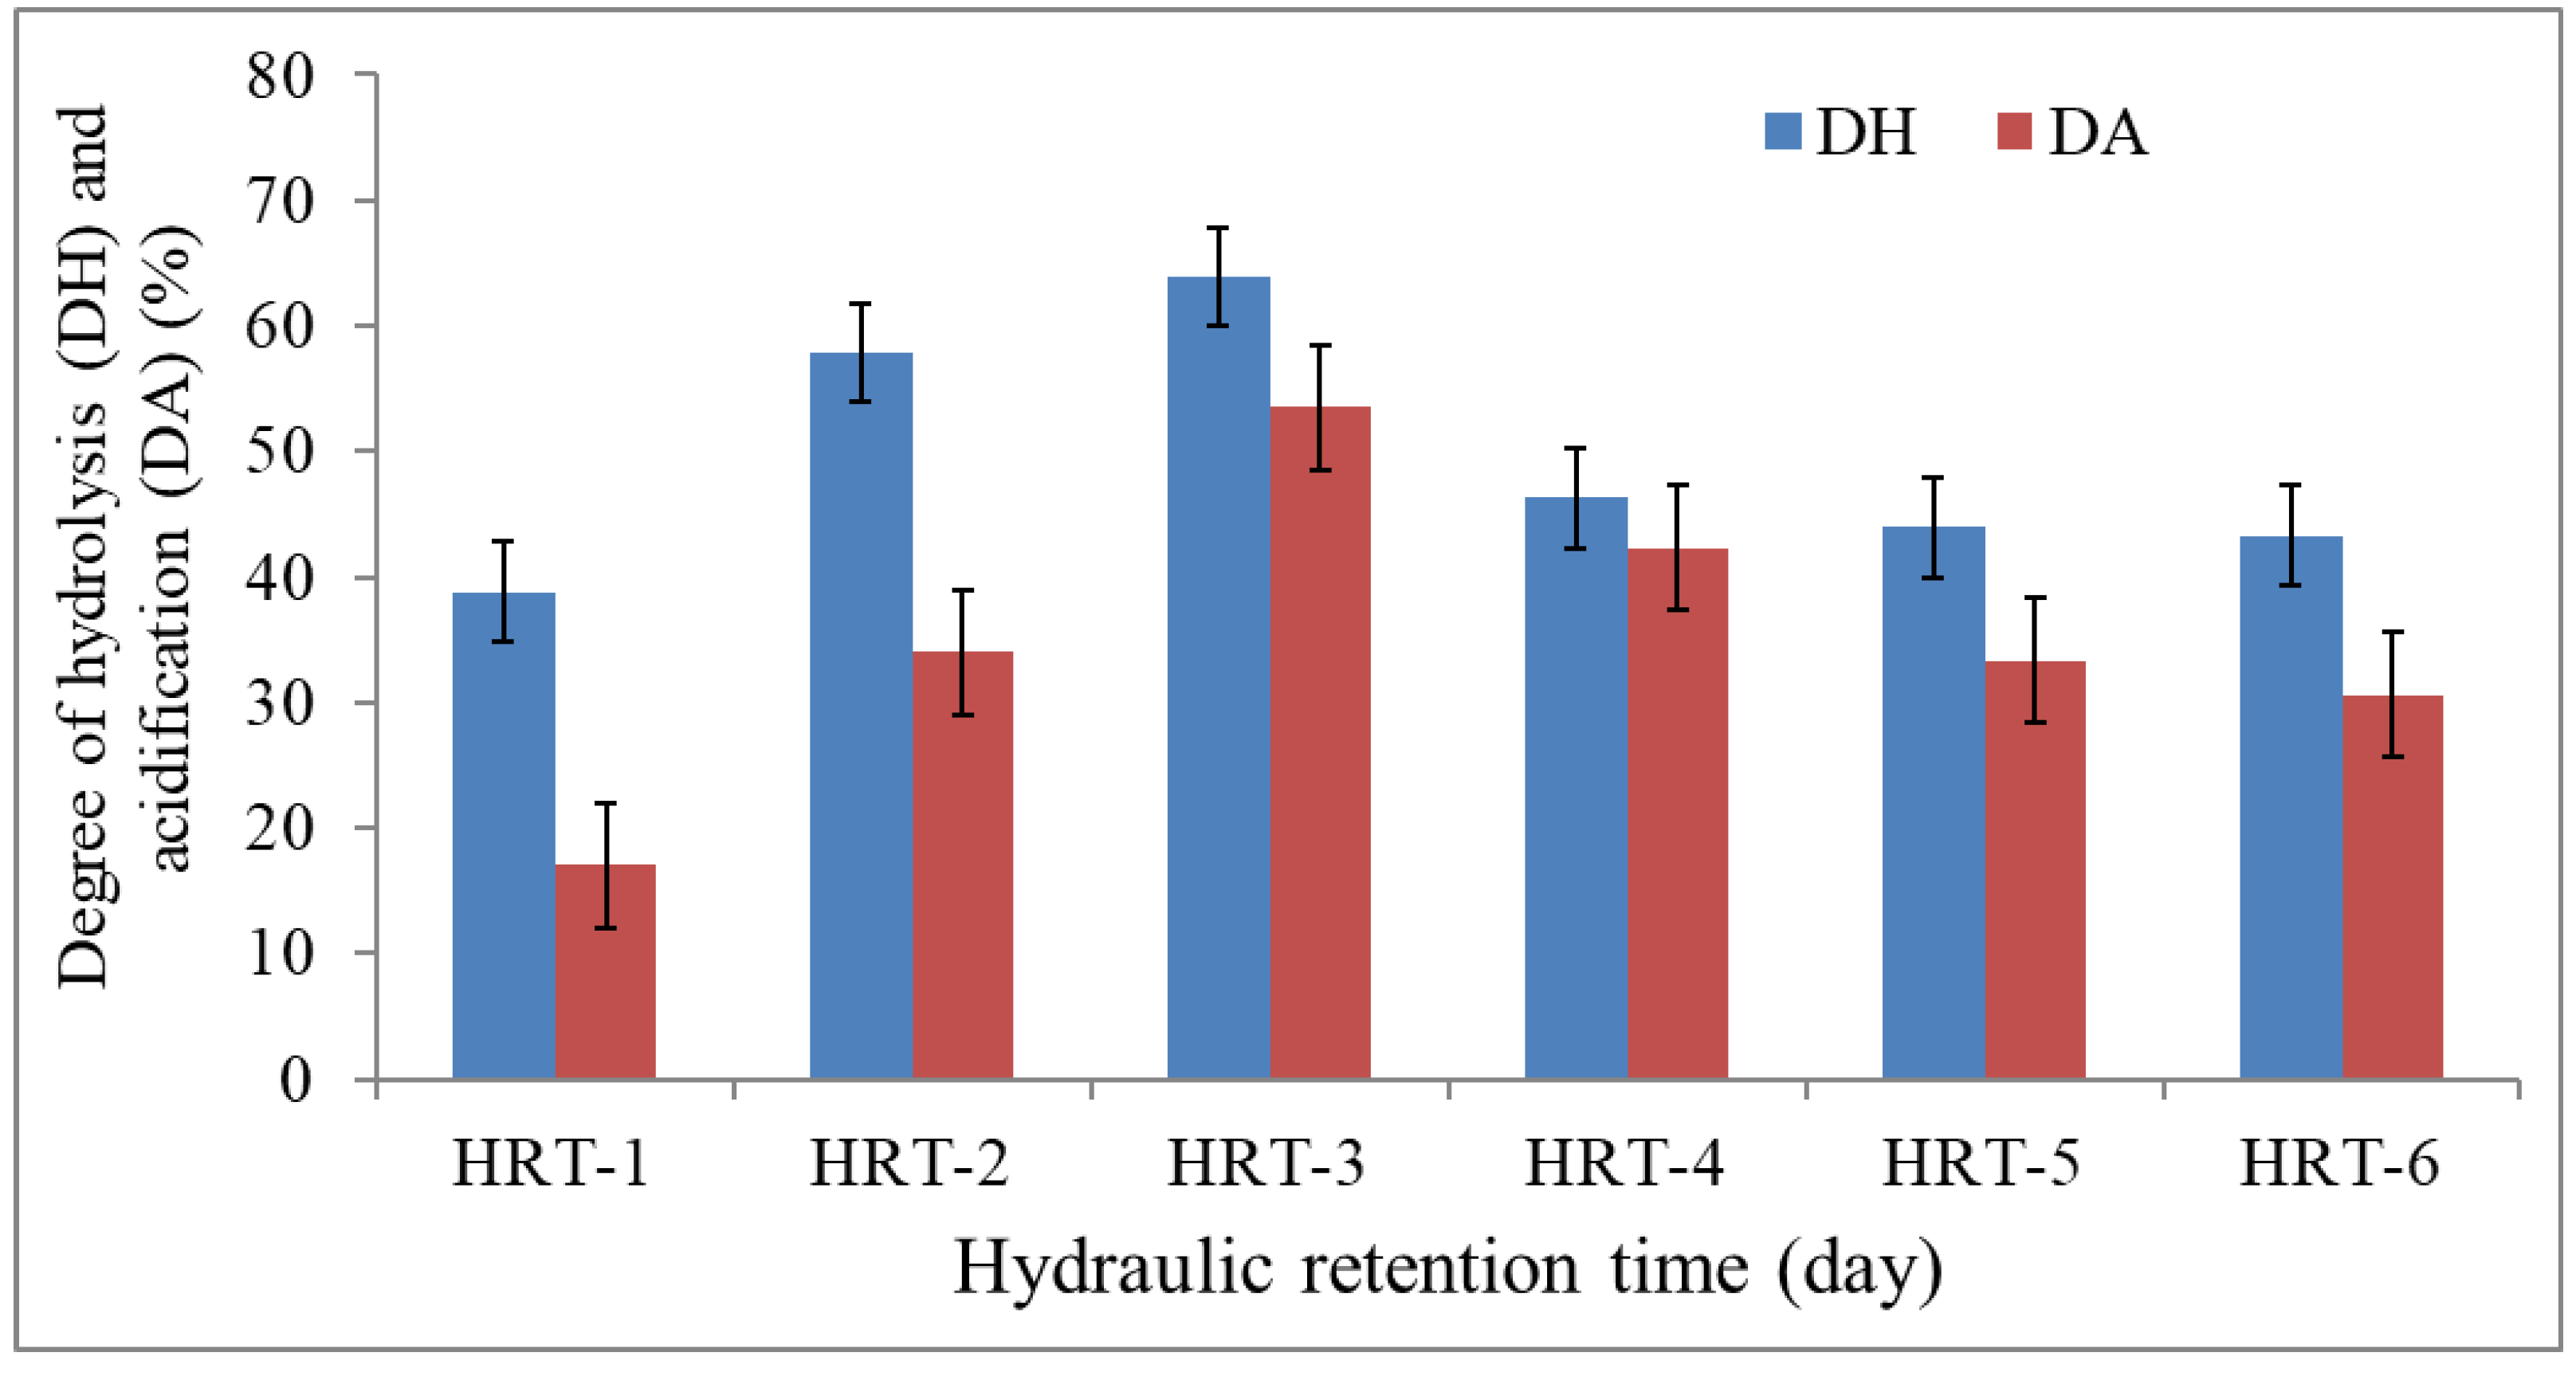
3.2.5. Degree of Acidification
3.2.6. Ammonium Nitrogen Production at Different HRT
4. Conclusions
Author Contributions
Funding
Institutional Review Board Statement
Informed Consent Statement
Data Availability Statement
Acknowledgments
Conflicts of Interest
Abbreviations
References
- Worku, Z.; Leta, S. Anaerobic Digestion of Slaughterhouse Wastewater for Methane Recovery and Treatability. Int. J. Sustain. Green Energy 2017, 6, 84–92. [Google Scholar]
- Minnesota Pollution Control Agency. Nutrients: Phosphorus, Nitrogen Sources, Impact on Water Quality—A General Overview. Encycl. Environ. Change 2008, 3, 1–2. [Google Scholar]
- Environmental Protection Agency (EPA). Effluent Limitations Guidelines and New Source Performance Standards for the Meat and Poultry Products Point Source Category. In Proposed Rule; EPA: Hong Kong, China, 2002. [Google Scholar]
- Community Development Research (CDR). Ethiopia Methane Emissions from Agricultural Waste Country Resource Assessment; Global Methane initiative: Addis Ababa, Ethiopia, 2011. [Google Scholar]
- Dyan, M.O.; Putra, G.P.; Budiyono, B.; Sumardiono, S.; Kusworo, T.D. The effect of pH and operation mode for COD removal of slaughterhouse wastewater with Anaerobic Batch Reactor (ABR). Waste Technol. 2015, 3, 7–13. [Google Scholar]
- Tritt, W.P. The anaerobic treatment of slaughterhouse wastewater in fixed-bed reactors. Bioresour. Technol. 1992, 41, 201–207. [Google Scholar] [CrossRef]
- Nweke, C.; Igbokwe, P.; Nwabanne, J. Anaerobic Digestion of Slaughterhouse Wastewater: A Kinetics Study. Open J. Renew. Energy Sustain. Dev. 2014, 1, 71–80. [Google Scholar]
- Widiasa, B.S. Study on Slaughterhouse Wastes Potency and Characteristic for Biogas Production. Int. J. Waste Resour. 2015, 1, 4–7. [Google Scholar] [CrossRef]
- Mittal, G.S. Treatment of wastewater from abattoirs before land application—A review. Bioresour. Technol. 2006, 97, 1119–1135. [Google Scholar] [CrossRef] [PubMed]
- Mulu, A.; Ayenew, T. Characterization-of-Abattoir-Wastewater-and-Evaluation-of-the-Effectiveness-of-the-Wastewater-Treatment.doc. Int. J. Sci. Eng. Res. 2015, 6, 1026–1040. [Google Scholar]
- Padilla-Gasca, E.; López-López, A.; Gallardo-Valdez, J. Evaluation of Stability Factors in the Anaerobic Treatment of Slaughterhouse Wastewater. J. Bioremediat. Biodegrad. 2011, 2, 114. [Google Scholar]
- Dawana, D.; Kassa, K. Characterization and evaluation of biogas generation of Arba Minch town slaughterhouse wastewater, Ethiopia. Water Pract. Technol. 2020, 15, 899–909. [Google Scholar]
- Abdallah, M.; Greige, S.; Beyenal, H.; Harb, M.; Wazne, M. Investigating microbial dynamics and potential advantages of anaerobic co-digestion of cheese whey and poultry slaughterhouse wastewaters. Sci. Rep. 2022, 12, 10529. [Google Scholar]
- U.S. EPA. Technical Development Document for the Final Effluent Limitations Guidelines and Standards for the Meat and Poultry Products Point Source Category (40 CFR 432); U.S. EPA: Washington, DC, USA, 2002. [Google Scholar]
- Ritchie, H.; Rosado, P.; Roser, M.; Meat and Dairy Production. Our World Data. 2017. Available online: https://ourworldindata.org/meat-production (accessed on 18 February 2023).
- Eshetie, T. Meat production, consumption and marketing tradeoffs and potentials in Ethiopia and its effect on GDP growth: A review. J. Nutr. Health Food Eng. 2018, 8, 17–24. [Google Scholar]
- Shafi, M.W. Reviw on application of hazard analysis critical control point in Ethiopian slaughtering plant. Int. J. Vet. Sci. Res. 2021, 7, 40–56. [Google Scholar] [CrossRef]
- BCaD Consulting Management PLC. Value Chain Study on Meat Processing Industry in Ethiopia: ‘Strengthening the Private Sector in Ethiopia’ Project Finance by the Danish Embassy in Ethiopia Input; Addis Ababa Chamber of Commerce and Sectoral Associations (AACCSA): Addis Ababa, Ethiopia, 2015; pp. 1–37. [Google Scholar]
- Philipp, M.; Jabri, K.M.; Wellmann, J.; Akrout, H.; Bousselmi, L.; Geißen, S.U. Slaughterhouse wastewater treatment: A review on recycling and reuse possibilities. Water 2021, 13, 3175. [Google Scholar]
- Burkhart, K.; Bernhardt, C.; Pelton, T.; Schaeffer, E.; Philips, A. Water Pollution from Slaughterhouses (Three Quarters of U.S. Meat Processing Plants That Discharge into Waterways Violated Their Permits, 2016–2018); Environmental Integrity Project: Washington, DC, USA, 2018; pp. 1–47. [Google Scholar]
- Jones, E.R.; Van Vliet, M.T.H.; Qadir, M.; Bierkens, M.F.P. Country-level and gridded estimates of wastewater production, collection, treatment and reuse. Earth Syst. Sci. Data 2021, 13, 237–254. [Google Scholar]
- Leta, S.; Assefa, F.; Dalhammar, G. Characterization of tannery wastewater and assessment of downstream pollution profiles along Modjo River in Ethiopia. Ethiop. J. Biol. Sci. 2003, 2, 157–168. [Google Scholar]
- Haddis, A.; de Geyter, A.; Smets, I.; Van der Bruggen, B. Wastewater management in Ethiopian higher learning institutions: Functionality, sustainability and policy context. J. Environ. Plan. Manag. 2014, 57, 369–383. [Google Scholar] [CrossRef]
- Salom, M.; Oliveira, V.; Alves, M.M.; Pereira, C.; Carvalho, M.; Mesquita, D.P. Volatile Fatty Acids (VFA) Production from Wastewaters with High Salinity—Influence of pH, Salinity and Reactor Configuration. Fermentation 2021, 7, 303. [Google Scholar]
- Chen, Y.; Cheng, J.J.; Creamer, K.S. Inhibition of anaerobic digestion process: A review. Bioresour. Technol. 2008, 99, 4044–4064. [Google Scholar] [CrossRef] [PubMed]
- Angelidaki, I.; Ellegaard, L.; Ahring, B.K. Applications of the anaerobic digestion process. In Biomethanation II; Advances in Biochemical Engineering/Biotechnology; Springer: Berlin/Heidelberg, Germany, 2003; Volume 82, pp. 1–33. [Google Scholar]
- Lindorfer, H.; López, C.P.; Resch, C.; Braun, R.; Kirchmayr, R. The impact of increasing energy crop addition on process performance and residual methane potential in anaerobic digestion. Water Sci. Technol. 2007, 56, 55–63. [Google Scholar] [CrossRef]
- Siegert, I.; Banks, C. The effect of volatile fatty acid additions on the anaerobic digestion of cellulose and glucose in batch reactors. Process Biochem. 2005, 40, 3412–3418. [Google Scholar] [CrossRef]
- Koutrouli, E.C.; Kalfas, H.; Gavala, H.N.; Skiadas, I.V.; Stamatelatou, K.; Lyberatos, G. Hydrogen and methane production through two-stage mesophilic anaerobic digestion of olive pulp. Bioresour. Technol. 2009, 100, 3718–3723. [Google Scholar] [CrossRef]
- Yunqin, L.; Dehan, W.; Lishang, W. Biological pretreatment enhances biogas production in the anaerobic digestion of pulp and paper sludge. Waste Manag. Res. 2010, 28, 800–810. [Google Scholar] [CrossRef] [PubMed]
- Maharaj, I.; Elefsiniotis, P. The role of HRT and low temperature on the acid-phase anaerobic digestion of municipal and industrial wastewaters. Bioresour. Technol. 2001, 76, 191–197. [Google Scholar] [CrossRef]
- Elefsiniotis, P.; Oldham, W.K. Influence of pH on the acid-phase anaerobic digestion of primary sludge. J. Chem. Technol. Biotechnol. 1994, 60, 89–96. [Google Scholar] [CrossRef]
- Elefsiniotis, P.; Oldham, W.K. Anaerobic acidogenesis of primary sludge: The role of solids retention time. Biotechnol. Bioeng. 1994, 44, 7–13. [Google Scholar] [CrossRef] [PubMed]
- Elefsiniotis, W.K.; Oldham, P. Effect of HRT on Acidogenic Digestion of Primary Sludge. J. Environ. Eng. 1994, 120, 645–660. [Google Scholar] [CrossRef]
- Mahmod, S.S.; Azahar, A.M.; Luthfi, A.A.I.; Abdul, P.M.; Mastar, M.S.; Anuar, N.; Takriff, M.S.; Jahim, J.M.D. Potential Utilisation of Dark-Fermented Palm Oil Mill Effluent in Continuous Production of Biomethane by Self-Granulated Mixed Culture. Sci. Rep. 2020, 10, 9167. [Google Scholar] [CrossRef]
- Ghosh, S.; Buoy, K.; Dressel, L.; Miller, T.; Wilcox, G.; Loos, D. Pilot- and full-scale two-phase anaerobic digestion of municipal sludge. Water Environ. Res. 1995, 67, 206–214. [Google Scholar] [CrossRef]
- Cuetos, M.J.; Gómez, X.; Otero, M.; Morán, A. Anaerobic digestion of solid slaughterhouse waste (SHW) at laboratory scale: Influence of co-digestion with the organic fraction of municipal solid waste (OFMSW). Biochem. Eng. J. 2008, 40, 99–106. [Google Scholar] [CrossRef]
- Lim, S.-J.; Kim, B.J.; Jeong, C.-M.; Choi, J.; Ahn, Y.H.; Chang, H.N. Anaerobic organic acid production of food waste in once-a-day feeding and drawing-off bioreactor. Bioresour. Technol. 2008, 99, 7866–7874. [Google Scholar] [CrossRef]
- Castellucci, S.; Cocchi, S.; Allegrini, E.; Vecchione, L. Anaerobic digestion and co-digestion of slaughterhouse wastes. J. Agric. Eng. 2013, 44, 526–530. [Google Scholar] [CrossRef]
- Wang, Q.; Liang, Y.; Zhao, P.; Li, Q.X.; Guo, S.; Chen, C. Potential and optimization of two-phase anaerobic digestion of oil refinery waste activated sludge and microbial community study. Sci. Rep. 2016, 6, 38245. [Google Scholar] [CrossRef] [PubMed] [Green Version]
- Ponsá, S.; Ferrer, I.; Vázquez, F.; Font, X. Optimization of the hydrolytic–acidogenic anaerobic digestion stage (55 °C) of sewage sludge: Influence of pH and solid content. Water Res. 2008, 42, 3972–3980. [Google Scholar] [CrossRef] [PubMed] [Green Version]
- Lin, C.Y.; Chai, W.S.; Lay, C.H.; Chen, C.C.; Lee, C.Y.; Show, P.L. Optimization of hydrolysis-acidogenesis phase of swine manure for biogas production using two-stage anaerobic fermentation. Processes 2021, 9, 1324. [Google Scholar] [CrossRef]
- Bacab, F.C.; Gamboa, E.E.; Espinoza, J.E.R.; Leal-Bautista, R.M.; Tussell, R.T.; Maldonado, J.D.; Canché, B.C.; Alzate-Gaviria, L. Two phase anaerobic digestion system of municipal solid waste by utilizing microaeration and granular activated carbon. Energies 2020, 13, 933. [Google Scholar] [CrossRef] [Green Version]
- Hailu, A.M.; Asfaw, S.L.; Tegaye, T.A. Effect of carbon-rich-waste addition as co-substrate on the performance and stability of anaerobic digestion of abattoir wastewater without agitation. Bioresour. Bioprocess. 2020, 7, 44. [Google Scholar] [CrossRef]
- Shifare, B.; Seyoum, L. Two Phase Anaerobic Co Digestion of Tannery Wastewater and Dairy Wastewater: Effect of Operational Parameters on Performance of Hydrolytic–Acidogenic Step. Int. J. Sustain. Green Energy 2017, 6, 1–9. [Google Scholar]
- Anyango, B.N.; Wandera, S.M.; Raude, J.M. Abattoir Wastewater Treatment in Anaerobic Co-Digestion with Sugar Press Mud in Batch Reactor for Improved Biogas Yield. Water 2022, 14, 2571. [Google Scholar] [CrossRef]
- Chakraborty, D.; Karthikeyan, O.P.; Selvam, A.; Palani, S.G.; Ghangrekar, M.M.; Wong, J.W.C. Two-phase anaerobic digestion of food waste: Effect of semi-continuous feeding on acidogenesis and methane production. Bioresour. Technol. 2022, 346, 126396. [Google Scholar] [CrossRef]
- Van, D.P.; Fujiwara, T.; Tho, B.L.; Toan, P.P.S.; Minh, G.H. A review of anaerobic digestion systems for biodegradable waste: Configurations, operating parameters, and current trends. Environ. Eng. Res. 2020, 25, 334. [Google Scholar] [CrossRef] [Green Version]
- Parajuli, A.; Khadka, A.; Sapkota, L.; Ghimire, A. Effect of Hydraulic Retention Time and Organic-Loading Rate on Two-Staged, Semi-Continuous Mesophilic Anaerobic Digestion of Food Waste during Start-Up. Fermentation 2022, 8, 620. [Google Scholar] [CrossRef]
- Yilmaz, V.; Demirer, G.N. Improved anaerobic acidification of unscreened dairy manure. Environ. Eng. Sci. 2008, 25, 309–317. [Google Scholar] [CrossRef] [Green Version]
- Demirer, N.; Chen, S. Effect of retention time and organic loading rate on anaerobic acidification and biogasification of dairy manure. J. Chem. Technol. Biotechnol. 2004, 79, 1381–1387. [Google Scholar] [CrossRef]
- Bustillo-Lecompte, C.F.; Mehrvar, M. Slaughterhouse wastewater characteristics, treatment, and management in the meat processing industry: A review on trends and advances. J. Environ. Manag. 2015, 161, 287–302. [Google Scholar] [CrossRef] [PubMed]
- González-Fernández, C.; Mahdy, A.; Ballesteros, I.; Ballesteros, M. Impact of temperature and photoperiod on anaerobic biodegradability of microalgae grown in urban wastewater. Int. Biodeterior. Biodegrad. 2016, 106, 16–23. [Google Scholar] [CrossRef]
- Ren, J.; Yuan, X.; Li, J.; Ma, X.; Zhao, Y.; Zhu, W.; Wang, X.; Cui, Z. Performance and microbial community dynamics in a two-phase anaerobic co-digestion system using cassava dregs and pig manure. Bioresour. Technol. 2014, 155, 342–351. [Google Scholar] [CrossRef]
- Tsegaye, D.; Leta, S. Optimization of operating parameters for biogas production using two—Phase bench—Scale anaerobic digestion of slaughterhouse wastewater: Focus on methanogenic step. Bioresour. Bioprocess. 2022, 9, 1–16. [Google Scholar] [CrossRef]
- Abdullahi, A.; Kadarman, N.; Hassan, A.; Madobi, I.S. Negative Impact of Abattoir Activities and Management in Residential Neighbourhoods in Kuala Terengganu, Malaysia. Int. J. Public Health Sci. 2015, 4, 124–130. [Google Scholar]
- Chen, S.; Zhang, J.; Wang, X. Effects of alkalinity sources on the stability of anaerobic digestion from food waste. Waste Manag. Res. 2015, 33, 1033–1040. [Google Scholar] [CrossRef] [PubMed]
- Dobre, M.F.; Nicolae, F. Main factors affecting biogas production—An overview: Letters, Romanian Biotechnological. Rom. Biotechnol. Lett. 2014, 19, 9283–9296. [Google Scholar]
- Funk, J.A.; Funk, J.A. TigerPrints Evaluation of Two-Phase Anaerobic Digestion for Increased Sludge Handling Capacity and Energy Production at the F. Wayne Hill Water Resources Center Evaluation of Two-Phase Anaerobic Digestion for Increased Sludge Handling Capacity and Energy; Clemson University: Clemson, SC, USA, 2021. [Google Scholar]
- Yu, H.G.; Fang, H.H.P. Acidogenesis of dairy wastewater at various pH levels. Water Sci. Technol. 2002, 45, 201–206. [Google Scholar] [CrossRef] [PubMed]
- García-Depraect, O.; Castro-Muñoz, R.; Muñoz, R.; Rene, E.R.; León-Becerril, E.; Valdez-Vazquez, I.; Kumar, G.; Reyes-Alvarado, L.C.; Martínez-Mendoza, L.J.; Carrillo-Reyes, J.; et al. A review on the factors influencing biohydrogen production from lactate: The key to unlocking enhanced dark fermentative processes. Bioresour. Technol. 2020, 324, 124595. [Google Scholar] [CrossRef] [PubMed]
- Menzel, T.; Neubauer, P.; Junne, S. Role of microbial hydrolysis in anaerobic digestion. Energies 2020, 13, 5555. [Google Scholar] [CrossRef]
- Chatterjee, B.; Mazumder, D. Role of stage-separation in the ubiquitous development of Anaerobic Digestion of Organic Fraction of Municipal Solid Waste: A critical review. Renew. Sustain. Energy Rev. 2019, 104, 439–469. [Google Scholar] [CrossRef]
- Alkaya, E.; Demirer, G.N. Anaerobic acidification of sugar-beet processing wastes: Effect of operational parameters. Biomass Bioenergy 2011, 35, 32–39. [Google Scholar] [CrossRef]
- Eylem Dogan Subasi, G.N.D. Phased Anaerobic Digestion of Organic Fraction of Manucipal Solid Waste. Int. J. Adv. Sci. Eng. Technol. 2017, 5, 313–314. [Google Scholar]
- Duangmanee, T. Micro-Aeration for Hydrogen Sulfide Removal from Biogas; Iowa State University: Ames, IA, USA, 2009. [Google Scholar]
- Sukphun, P.; Sittijunda, S.; Reungsang, A.; Atta-Obeng, E. Volatile Fatty Acid Production from Organic Waste with the Emphasis on Membrane-Based Recovery. Fermentation 2021, 7, 159. [Google Scholar] [CrossRef]
- Jiang, J.; Zhang, Y.; Li, K.; Wang, Q.; Gong, C.; Li, M. Volatile fatty acids production from food waste: Effects of pH, temperature, and organic loading rate. Bioresour. Technol. 2013, 143, 525–530. [Google Scholar] [CrossRef] [PubMed]
- Demirel, B.; Neumann, L.; Scherer, P. Microbial community dynamics of a continuous mesophilic anaerobic biogas digester fed with sugar beet silage. Eng. Life Sci. 2008, 8, 390–398. [Google Scholar] [CrossRef]
- Castilla-Archilla, J.; Heiberger, J.; Mills, S.; Hilbig, J.; Collins, G.; Lens, P.N.L. Continuous Volatile Fatty Acid Production from Acid Brewery Spent Grain Leachate in Expanded Granular Sludge Bed Reactors. Front. Sustain. Food Syst. 2021, 5, 664944. [Google Scholar] [CrossRef]
- Al-sulaimi, I.N.; Nayak, J.K.; Alhimali, H.; Sana, A. Effect of Volatile Fatty Acids Accumulation on Biogas Production by Sludge-Feeding Thermophilic Anaerobic Digester and Predicting Process Parameters. Fermentation 2022, 8, 184. [Google Scholar] [CrossRef]
- Cheah, Y.K.; Vidal-Antich, C.; Dosta, J.; Mata-Álvarez, J. Volatile fatty acid production from mesophilic acidogenic fermentation of organic fraction of municipal solid waste and food waste under acidic and alkaline pH. Environ. Sci. Pollut. Res. 2019, 26, 35509–35522. [Google Scholar] [CrossRef] [PubMed] [Green Version]
- Donoso-Bravo, A.; Retamal, C.; Carballa, M.; Ruiz-Filippi, G.; Chamy, R. Influence of temperature on the hydrolysis, acidogenesis and methanogenesis in mesophilic anaerobic digestion: Parameter identification and modeling application. Water Sci. Technol. 2009, 60, 9–17. [Google Scholar] [CrossRef] [PubMed]
- Zhang, L.; Lee, Y.W.; Jahng, D. Anaerobic co-digestion of food waste and piggery wastewater: Focusing on the role of trace elements. Bioresour. Technol. 2011, 102, 5048–5059. [Google Scholar] [CrossRef]
- Zhang, Y.; Banks, C.J. Co-digestion of the mechanically recovered organic fraction of municipal solid waste with slaughterhouse wastes. Biochem. Eng. J. 2012, 68, 129–137. [Google Scholar] [CrossRef] [Green Version]
- Carvalheira, M.; Duque, A.F. From Food Waste to Volatile Fatty Acids towards a Circular Economy. In Fermentation—Processes, Benefits and Risks; Laranjo, M., Ed.; InTech: London, UK, 2021; p. 22. [Google Scholar]
- Tesfaye, S. Evaluation of the Treatability and Biogas Production Potential of Slaughter House Wastewater in Anaerobic Sequential Batch Reactor; Addis Ababa University: Addis Ababa, Ethiopia, 2014. [Google Scholar]
- Demirel, B.; Yenigun, O. Anaerobic acidogenesis of dairy wastewater: The effects of variations in hydraulic retention time with no pH control. J. Chem. Technol. Biotechnol. 2004, 79, 755–760. [Google Scholar] [CrossRef]
- Karlsson, A.; Björn, A.; Yekta, S.S.; Svensson, B.H. Improvement of the Biogas Production Process; Biogas Research Center, Linköping University: Linköping, Sweden, 2014. [Google Scholar]
- Bouallagui, H.; Touhami, Y.; Cheikh, R.B.; Hamdi, M. Bioreactor performance in anaerobic digestion of fruit and vegetable wastes. Process Biochem. 2005, 40, 989–995. [Google Scholar] [CrossRef]
- Garcia-Peña, E.I.; Parameswaran, P.; Kang, D.W.; Canul-Chan, M.; Krajmalnik-Brown, R. Anaerobic digestion and co-digestion processes of vegetable and fruit residues: Process and microbial ecology. Bioresour. Technol. 2011, 102, 9447–9455. [Google Scholar] [CrossRef]
- Mehta, C.M.; Jensen, P.D.; Batstone, D.J. Pilot Scale Resource Recovery from Cattle Paunch Waste. In Proceedings of the IWA International Symposium on Waste Management Problems in Agro-Industries, Kochi, Japan, 24–26 November 2014. [Google Scholar]
- Nielsen, H.B.; Ahring, B.K. Effect of tryptone and ammonia on the biogas process in continuously stirred tank reactors treating cattle manure. Environ. Technol. 2007, 28, 905–914. [Google Scholar] [CrossRef]
- Sossa, K.; Alarcón, M.; Aspé, E.; Urrutia, H. Effect of ammonia on the methanogenic activity of methylaminotrophic methane producing Archaea enriched biofilm. Anaerobe 2004, 10, 13–18. [Google Scholar] [CrossRef] [PubMed]
- Angelidaki, I.; Ahring, B.K. Anaerobic thermophilic digestion of manure at different ammonia loads: Effect of temperature. Water Res. 1994, 28, 727–731. [Google Scholar] [CrossRef]
- Braun, R.; Huber, P.; Meyrath, J. Ammonia toxicity in liquid piggery manure digestion. Biotechnol. Lett. 1981, 3, 159–164. [Google Scholar] [CrossRef]
- Speece, R.E. Anaerobic biotechnology for industrial wastewater treatment. Environ. Sci. Technol. 1983, 17, 416A–427A. [Google Scholar] [CrossRef]


| Characteristics of Slaughterhouse Wastewater | Operating Condition | |||
|---|---|---|---|---|
| Parameter (Unit) | Mean Value ± SD | HRT (Day) | OLR (mg COD/L. Day) | Flow Rate (L/Day) |
| pH | 7.06 ± 0.30 | 6 | 894.41 | 6 |
| Salinity (ppm) | 1208.98 ± 43.48 | 5 | 1073.27 | 7.2 |
| EC (µS/cm) | 1346.00 ± 46.88 | 4 | 1341.61 | 9 |
| Resistivity (Ω) | 458.46 ± 16.75 | 3 | 1788.81 | 12 |
| TDS (ppm) | 1170.74 ± 40.84 | 2 | 2683.22 | 18 |
| ORP (mV) | −80.50 ± 18.13 | 1 | 5366.43 | 36 |
| TVFA (mg/L) | 816.60 ± 38.67 | |||
| TCOD (mg/L) | 5366.43 ± 83.80 | |||
| SCOD (mg/L) | 4842.21 ± 83.81 | |||
| NH4+-N (mg/L) | 338.40 ± 58.13 | |||
| HRT (Day) | ||||||
|---|---|---|---|---|---|---|
| Parameters | 6 | 5 | 4 | 3 | 2 | 1 |
| pH | 6.81 ± 0.14 | 6.34 ± 0.17 | 6.00 ± 0.18 | 5.78 ± 0.32 | 5.77 ± 0.25 | 5.60 ± 0.27 |
| Salinity (ppm) | 1784.67 ± 12.26 | 1784.27 ± 71.04 | 1785.27 ± 18.54 | 1650.40 ± 12.22 | 1538.33 ± 16.04 | 1710.00 ± 16.65 |
| EC (µS/cm) | 1934.47 ± 13.43 | 1964.80 ± 80.26 | 1950.20 ± 19.85 | 1809.73 ± 12.07 | 1674.07 ± 17.68 | 1835.87 ± 14.18 |
| Resistivity (Ω) | 292.23 ± 16.00 | 289.43 ± 12.49 | 296.43 ± 29.83 | 318.01 ± 22.49 | 341.66 ± 41.01 | 313.17 ± 32.41 |
| TDS (ppm) | 1697.27 ±11.48 | 1726.93 ± 53.74 | 1702.00 ± 17.20 | 1576.47 ± 11.60 | 1469.80 ± 17.75 | 1602.33 ± 13.24 |
| ORP (mV) | 81.21 ± 3.36 | 82.58 ± 3.49 | 81.69 ± 5.25 | 82.25 ± 6.54 | 78.59 ± 3.21 | 79.03 ± 3.15 |
| TVFA (mg/L) | 1084.83 ± 14.37 | 1006.42 ± 30.35 | 1155.92 ± 16.20 | 1176.50 ± 81.66 | 1006.42 ± 30.35 | 996.75 ± 14.60 |
| TCOD (mg/L) | 4924.47 ± 25.79 | 4799.33 ± 37.49 | 4913.67 ± 22.79 | 4934.6 ± 25.24 | 4721.07 ± 67.35 | 4821.73 ± 30.37 |
| SCOD (mg/L) | 2324.80 ± 25.16 | 2359.00 ± 40.79 | 2483.73 ± 47.72 | 3430.2 ± 80.44 | 3106.87 ± 72.65 | 2084.4 ± 71.00 |
| NH4+-N (mg/L) | 278.67 ± 47.25 | 281.20 ± 8.79 | 319.08 ± 40.21 | 369.46 ± 11.28 | 369.33 ± 51.75 | 346.42 ± 40.67 |
| Parameters | pH | ORP | EC | TDS | Salinity | Resistivity |
|---|---|---|---|---|---|---|
| pH | 1 | |||||
| ORP | 0.99 | 1 | ||||
| EC | 0.9 | 0.94 | 1 | |||
| TDS | 0.86 | 0.91 | 1 | 1 | ||
| Salinity | 0.9 | 0.93 | 0.99 | 0.98 | 1 | |
| Resistivity | −0.87 | −0.9 | −1 | −0.99 | −0.98 | 1 |
| S/n | Stability and Performance Indicator Parameter | Concentration |
|---|---|---|
| 1 | pH | 5.78 ± 0.32 |
| 2 | SCOD (mg/L) | 3430.20 ± 80.44 |
| 3 | NH4+-N (mg/L) | 369.46 ± 11.28 |
| 4 | TVFA (mg/L) | 1176.50 ± 81.66 |
| 5 | DH (%) | 63.92 |
| 6 | DA (%) | 57.26 |
| 7 | HRT (day) | Three |
| 8 | OLR (mg COD/L. day) | 1788.81 |
| 9 | Flow rate (L/day) | 12 |
Disclaimer/Publisher’s Note: The statements, opinions and data contained in all publications are solely those of the individual author(s) and contributor(s) and not of MDPI and/or the editor(s). MDPI and/or the editor(s) disclaim responsibility for any injury to people or property resulting from any ideas, methods, instructions or products referred to in the content. |
© 2023 by the authors. Licensee MDPI, Basel, Switzerland. This article is an open access article distributed under the terms and conditions of the Creative Commons Attribution (CC BY) license (https://creativecommons.org/licenses/by/4.0/).
Share and Cite
Tsegaye, D.; Khan, M.M.; Leta, S. Optimization of Operating Parameters for Two-Phase Anaerobic Digestion Treating Slaughterhouse Wastewater for Biogas Production: Focus on Hydrolytic–Acidogenic Phase. Sustainability 2023, 15, 5544. https://doi.org/10.3390/su15065544
Tsegaye D, Khan MM, Leta S. Optimization of Operating Parameters for Two-Phase Anaerobic Digestion Treating Slaughterhouse Wastewater for Biogas Production: Focus on Hydrolytic–Acidogenic Phase. Sustainability. 2023; 15(6):5544. https://doi.org/10.3390/su15065544
Chicago/Turabian StyleTsegaye, Dejene, Mohammed Mazharuddin Khan, and Seyoum Leta. 2023. "Optimization of Operating Parameters for Two-Phase Anaerobic Digestion Treating Slaughterhouse Wastewater for Biogas Production: Focus on Hydrolytic–Acidogenic Phase" Sustainability 15, no. 6: 5544. https://doi.org/10.3390/su15065544