Article

Quantifying the Unvoiced Carbon Pools of the Nilgiri Hill Region in the Western Ghats Global Biodiversity Hotspot—First Report

1
Department of Soil Science and Agricultural Chemistry, Tamil Nadu Agricultural University (TNAU), Coimbatore 641003, Tamil Nadu, India
2
Indian Council of Agricultural Research (ICAR)-National Academy of Agricultural Research Management (NAARM), Hyderabad 500030, Telangana, India
3
Department of Agricultural Microbiology, Tamil Nadu Agricultural University (TNAU), Coimbatore 641003, Tamil Nadu, India
4
College of Agriculture, Jawaharlal Nehru Krishi Vishwavidyalaya, Vidisha, Ganj Basoda 464221, Madhya Pradesh, India
5
Department of Soil Science, Dr. Rajendra Prasad Central Agriculture University, Samastipur, Pusa 848125, Bihar, India
6
Department of Floriculture and Landscape Architecture, Tamil Nadu Agricultural University (TNAU), Coimbatore 641003, Tamil Nadu, India
7
Department of Genetics and Plant Breeding, Tamil Nadu Agricultural University (TNAU), Coimbatore 641003, Tamil Nadu, India
8
ICAR-Indian Institute of Soil and Water Conservation, Research Center, Ooty 643004, Tamil Nadu, India
9
Centre for Water Resources Development and Management, Kozhikode 673571, Kerala, India
10
Department of Agronomy, Dr. Rajendra Prasad Central Agriculture University, Samastipur, Pusa 848125, Bihar, India
*
Author to whom correspondence should be addressed.
Sustainability 2023, 15(6), 5520; https://doi.org/10.3390/su15065520
Submission received: 15 February 2023 / Revised: 12 March 2023 / Accepted: 17 March 2023 / Published: 21 March 2023
(This article belongs to the Special Issue Carbon Sequestration in Terrestrial Ecosystems)

Abstract

:
Accelerating land-use change (LUC) in the Nilgiri Hill Region (NHR) has caused its land to mortify. Although this deterioration has been documented, the destruction of buried gem soil has not been reported. Therefore, this study was conducted to assess the impact of LUC on soil-carbon dynamics in the six major ecosystems in the NHR: croplands (CLs), deciduous forests (DFs), evergreen forests (EFs), forest plantations (FPs), scrublands (SLs), and tea plantations (TPs). Sampling was conducted at selected sites of each ecosystem at three depth classes (0–15, 15–30, and 30–45 cm) to quantify the carbon pools (water-soluble carbon, water-soluble carbohydrates, microbial biomass carbon, microbial biomass nitrogen, dehydrogenase, and different fractions of particulate organic carbon). We found that the LUC significantly decreased the concentration of carbon in the altered ecosystems (49.44–78.38%), with the highest being recorded at EF (10.25%) and DF (7.15%). In addition, the effects of the LUC on the aggregate size of the organic carbon were dissimilar across all the aggregate sizes. The relatively high inputs of the aboveground plant residues and the richer fine-root biomass were accountable for the higher concentration of carbon pools in the untouched EFs and DFs compared to the SLs, FPs, TPs, and CLs. The results of the land-degradation Index (LDI) depicted the higher vulnerability of TP (−72.67) and CL (−79.00). Thus, our findings highlight the global importance of LUC to soil quality. Henceforth, the conservation of carbon pools in fragile ecosystems, such as the NHR, is crucial to keep soils alive and achieve land-degradation neutrality.

1. Introduction

Soils are pivotal in the global carbon cycle, as they can act as weighty sinks for carbon emissions [1]. Soils hold around 2500 gigatons (GT; 1 GT = 1 pentagram = 1 billion metric tons) of carbon [2], which is two to three times more than the carbon stored in the atmosphere and vegetation [3]. The organic carbon (OC) present in these soils forms an essential prerequisite for human well-being, as it provides ecosystem services, such as climate regulation, nutrient cycling, erosion protection, and biodiversity enhancement [4,5,6,7]. It determines whether soils act as sinks or sources of carbon in the global carbon cycle. If carbon is stabilized, soils act as a sink [8] and thereby improve soil quality and environmental health [9]. Organic carbon is one of the largest carbon pools in the terrestrial ecosystem; even a slight disturbance can destabilize the carbon concentration, and it can have unintended consequences, such as climate change and global warming [10].
Thus, an understanding the changes in soil characteristics and OC fluxes can help to quantify SOC dynamics [11]. Based on varying degrees of decomposition and stability [12], the OC in soils can be classified in different ways. For instance, (a) active pools, such as light-fraction organic carbon (LFOC) [13], readily oxidized carbon [14], and microbial biomass carbon (MBC) [15], have a turnover period of a few days. In addition,(b) slow pools, with a turnover period of up to centuries, are physically stabilized forms of aggregate-size organic carbon (ASOC). One of the most critical processes in the stabilization of SOC pools is soil aggregation. As a result, the characterization of ASOC is critical for sustaining soil fertility. The classifications are large macroaggregates (2 mm), small macroaggregates (0.25 mm), micro-aggregates (0.053 mm), and silt plus clay-sized particles (<0.053 mm) [16]. Passive pools (c) are the most stable OCs, and they persist for over thousands of years [17]. Conclusively, carbon compounds with active recycling (within 5 years) are identified as active carbon pools (ACs), whereas compounds with longer residence times are considered to be recalcitrant or passive carbon pools (PCs). Because of their release and sequestration mechanisms, these carbon pools contribute differently to the carbon concentrations in the atmosphere. Active carbon pools, which serve as primary sources of soil nutrients [18], have a significant impact on soil quality [19,20]. However, owing to their short residency duration, the potential of ACs to sequester carbon is quite limited [21]. On the other hand, PCs add to the OC stock [18]. As a result, PCs can serve as solid predictors of a system’s potential for sequestering carbon [22]. The demand for energy and food has placed enormous strain on soil resources [23,24] and has resulted in a 20–25% loss in OC [25,26,27]. LUC has significant repercussions for natural resources, having degraded 33% of soils globally [28], and it is considered to be the most crucial anthropogenic disturbance to the environment. Upon conversion, soil that has previously acted as a sink for atmospheric carbon tends to act as a source [28], and this, in turn, deteriorates soil quality [29]. Therefore, an understanding of its impact on OC dynamics is imperative for exercising management strategies to improve soil quality [30].
Containing rare species of flora and fauna, the Nilgiri Hill Region (NHR) (India’s first biosphere reserve) is suffering from frequent land degradation, which is attributable to LUC [31]. Since 1837, anthropogenic pressure has been exerted on the natural characteristics of the NHR in the Western Ghats [32,33]. To meet the demands of the growing economy, wattle and eucalyptus plantations were planted on a major scale, at the cost of diversified and resource-rich sholas [34]. This has resulted in the decline of sholas by 66.7% [33]. As a result of this widespread conversion of natural forests [35,36,37], the ecological equilibrium of this terrain has been disrupted [32,33]. The increased deforestation, plantation, and urban sprawl in this region have certainly depleted the soil quality [38]. Unfortunately, these findings failed to quantify the degradation of the hidden treasure beneath our feet (soil). Hence, this study was initiated to diagnose the impact of LUC on soil-carbon pools at varying depths of the soil profile. Soil carbon, a sensitive soil-quality parameter, plays a significant role in ecosystem functioning; hence, studying these parameters will help us to better understand soil quality. We hypothesized that (1) LUC affects the quality and quantity of soil-carbon pools and (2) in different ecosystems, carbon pools are more pronounced in the upper-soil horizon and decline in line with the soil depth.
In the NHR, spongy humus no longer lines the streams, the dark moss that shaped the flow of every stream is no longer present, and the kurinji, shola trees, and dwarf bamboo that once guarded the streams have been lost. In place of these are deep cuts of gouged-out earth, revealing the underlying lateritic soil and rocks. In order to reverse this trend, there is a need for specific land-management measures. Unfortunately, the mechanisms underlying SOC build-up and losses are not sufficiently understood. This impedes the creation of better land-management strategies and adds uncertainty to the models used to forecast-climate-change feedback. Therefore, this study aimed to determine the impact of LUC on OC pools in the NHR.

2. Materials and Methods

2.1. Ethics Statement
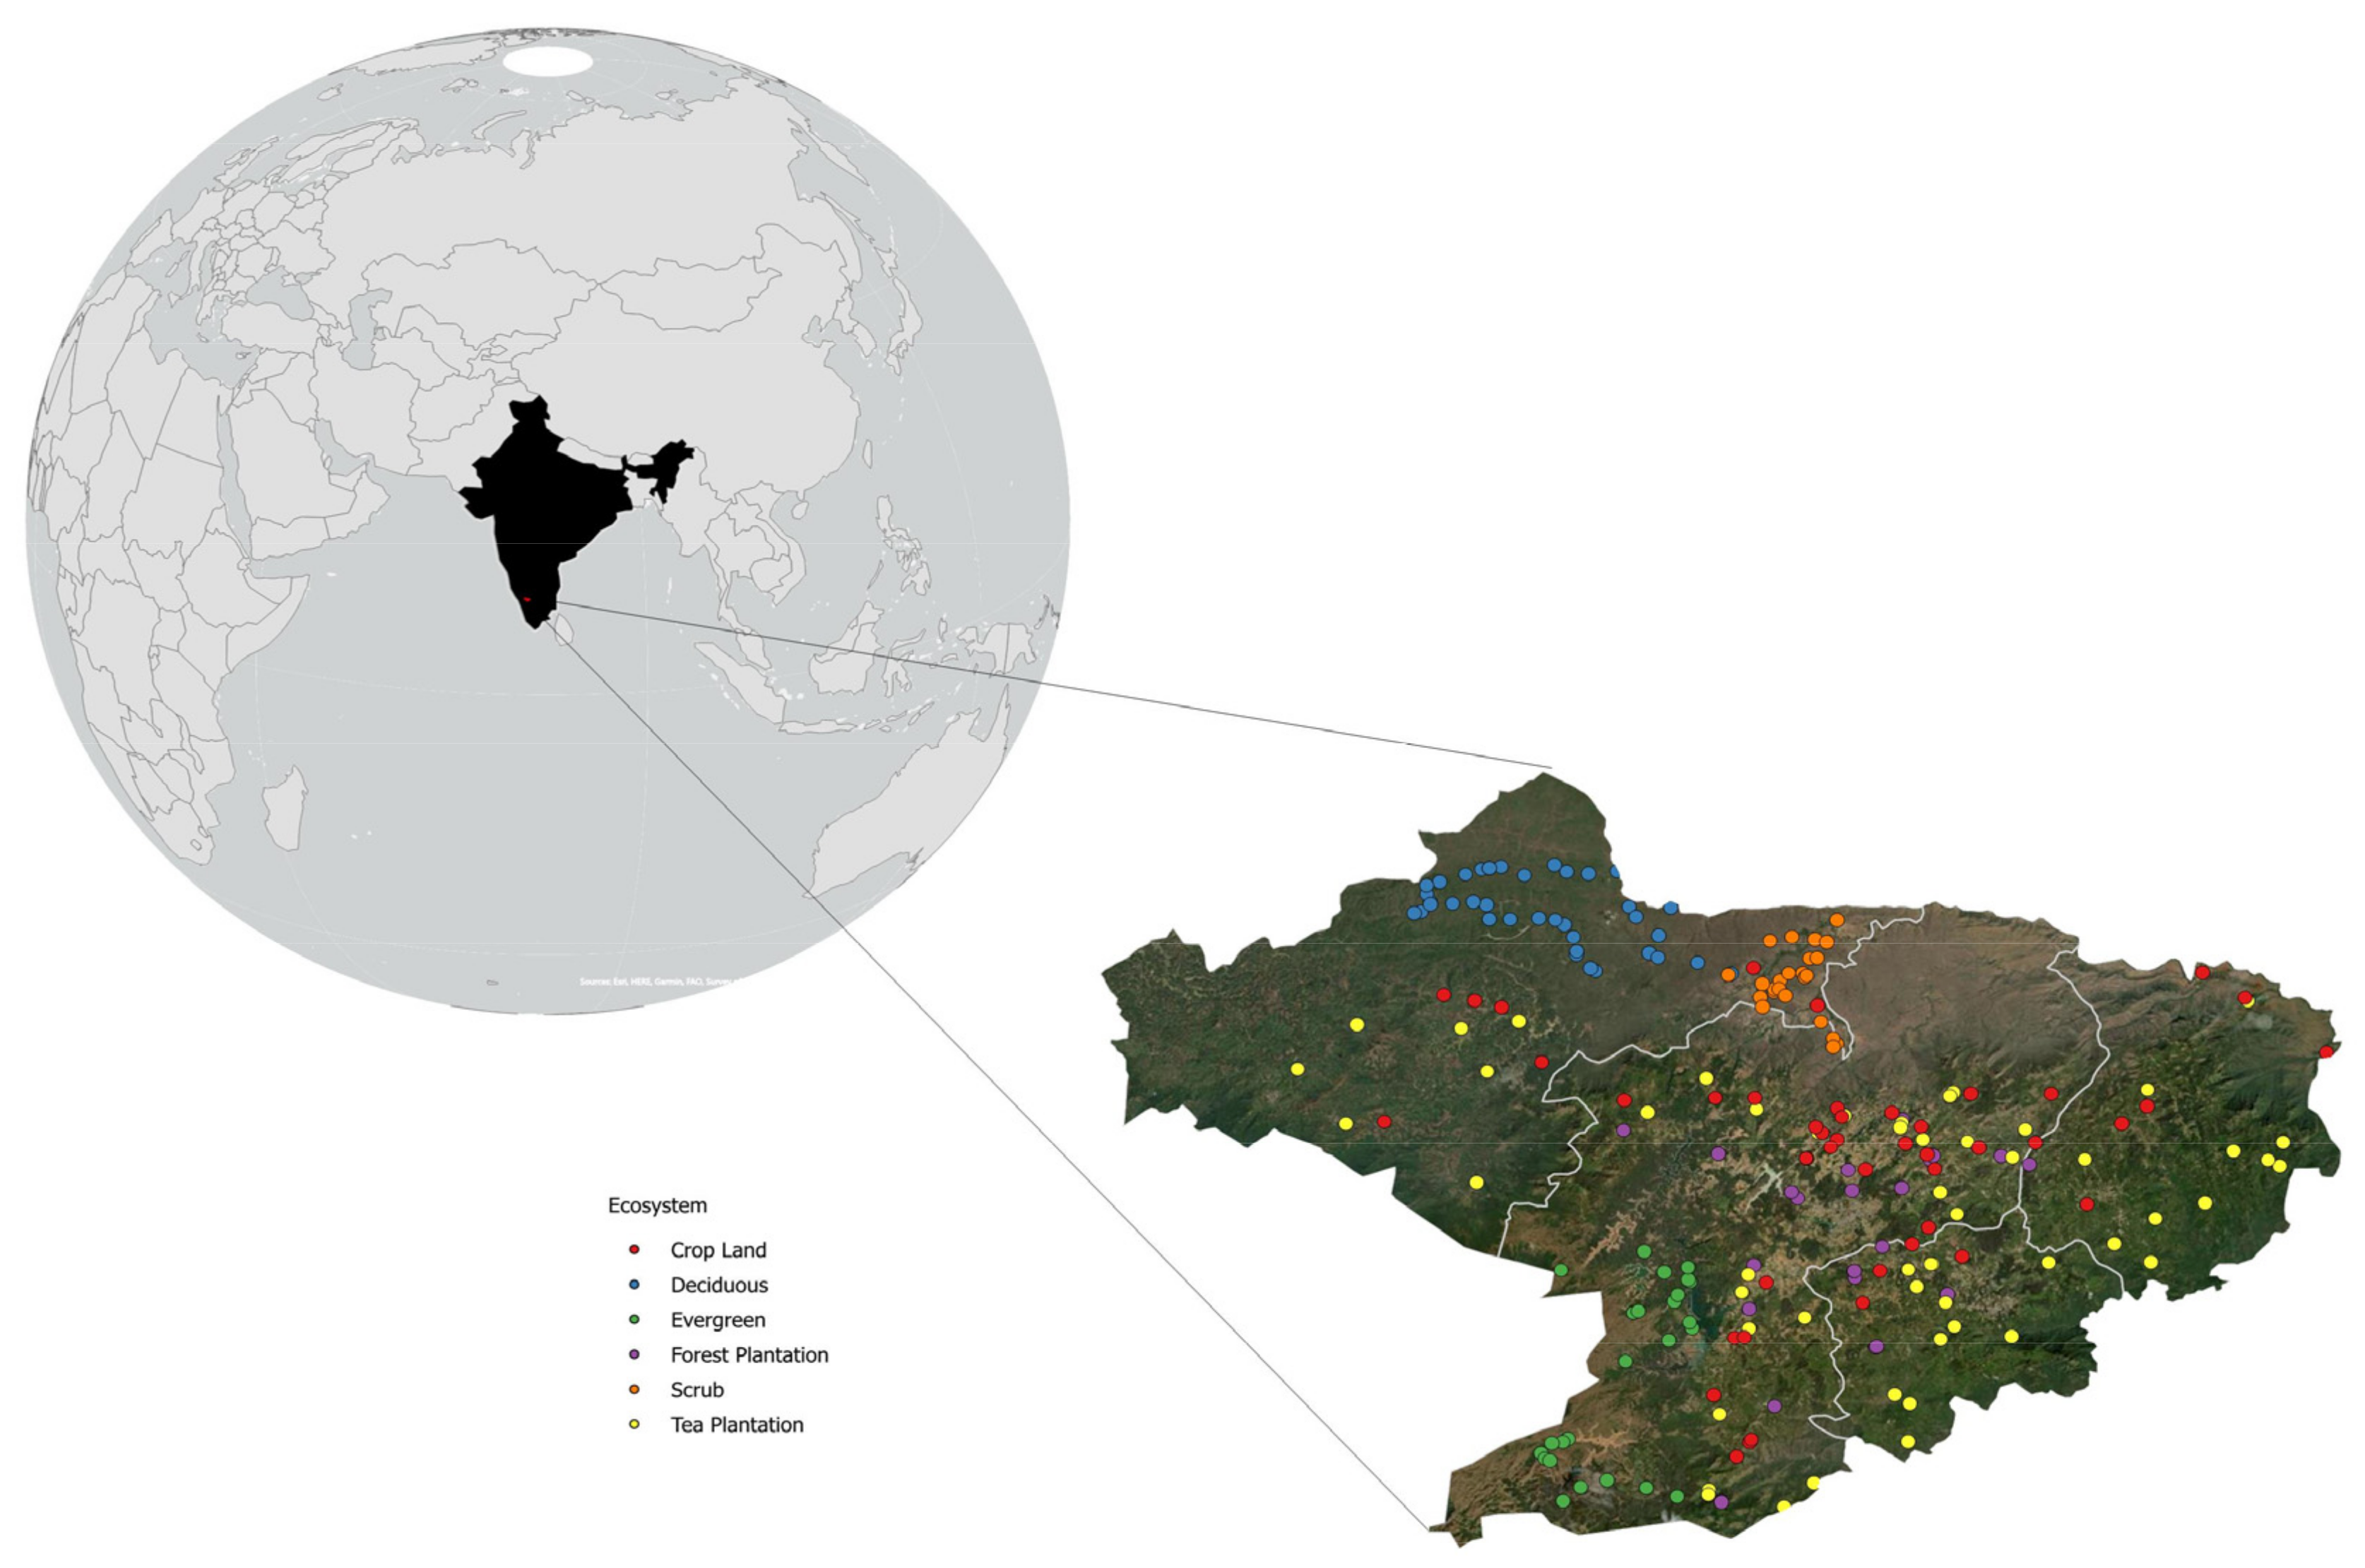
No rare or endangered animals were used in this study, nor did the study involve the use of wild animals or threatened environmental systems. Prior permission was obtained from each land owner and the Department of Forest, Horticulture, and Plantation Crops (Tamil Nadu, India) for the collection of soil samples.

2.2. Study Area

The NHR, an ancient land mass with an area of 2551 km2 formed by an upward thrust of two major mountain ranges, namely Western and Eastern Ghats, at the southern end of the Indian peninsula. Lying between 11°30′ and 11°15′ North latitude and 76°45′ and 77°00′ East longitude, NHR benefits from a bimodal pattern of rainfall distribution, with temperatures ranging from 1 °C to 25 °C [11].

2.3. Geomorphology and Soils

The charnockite group of bedrock lying under red laterite or lateritic soils in this region is amongst the hardest and least porous rocks in the world [39]. Spanning a meter-thick weathered zone between the clay and fresh rock, this region falls under the deeply weathered class [40]. Lateritic, red-loam, red sandy, black, alluvial, and colluvial are the five major soil types of Nilgiris.

2.4. Soil Sampling and Analysis

To study the distribution of carbon pools in NHR, six major ecosystems, CLs, DFs, EFs, FPs, SLs, and TPs, were selected, and sampling was conducted during 2021. A total of 214 soil profiles (47—CP, 39—DF, 27—EF, 23—FP, 24—SL, and 54—TP) (Figure 1), which had been established at least 50 years prior to sampling, were selected. Sampling was performed in five quadrats and in three depth classes (0–15, 15–30, and 30–45 cm). The five sub-samples for each depth class were pooled to obtain three composite samples per plot. The samples were sieved through a 2.0-mm mesh, shipped to the research laboratory in sterile plastic bags, and stored at −20 °C for further analysis. Three replicates for each sample were analyzed. Total organic carbon (TOC) was estimated using a TOC analyzer (Elementar, Langenselbold, Germany).

2.5. Water-Soluble Organic Carbon (WSOC)

The WSOC was determined using the method in [41], in which 40 mL of distilled water was added to 20 g soil and centrifuged for 1 h at 5000 rpm. In total, 10 mL of collected filtrate was mixed with 5 mL of 0.07 N K2Cr2O7, 10 mL of 98% H2SO4, and 5 mL of 88% H3PO4 and kept in a block digester for 30 min at 150 °C. Finally, the contents were titrated against 0.035 N of ferrous ammonium sulphate (FAS) solution using diphenylamine indicator.

2.6. Water-Soluble Carbohydrates (WSCs)

The WSCs were determined by the method outlined by [42]. A total of 5 g of air-dried soil was hydrolyzed with 10 mL of 3 N H2SO4 in a steam bath for 24 h. The aliquots were neutralized by adding an excess of 5 mL of 6 N NaOH. The residues were washed with 10 mL of hot water. The collected 5 mL of aliquot was mixed with 10 mL of 0.2% anthrone reagent and the intensity was measured at 635 nm using a spectrophotometer.

2.7. Dehydrogenase

Dehydrogenase was measured using triphenyl tetrazolium chloride (TTC) as a substrate [43]. A total of 5 g of moist soil was mixed with TTC solution (0.3–0.4 g/100 mL). It was incubated for 24 h at 30 °C. In total, 40 mL of acetone was added to the solution. Finally, the absorbance was recorded at 546 nm using a spectrophotometer, and the activity was expressed as μg TTC g−1 h−1.

2.8. Microbial Biomass Carbon (MBC)

A total of 10 g of moist soil was fumigated with ethanol-free chloroform for 24 h at 25 °C. The fumigated and non-fumigated samples were shaken for 1 h and extracted with 30 mL of 0.5 M K2SO4. The extracts were filtered, and the organic carbon in the extracts was determined by Walkley-and-Black method. The differences in filtrates between fumigated and unfumigated soil divided by the K2SO4 extract-efficiency factor (KC = 0.41) were calculated as MBC. The MBC was determined using fumigation-extraction method (FEM), with 0.38 as the correction factor [44].

2.9. Microbial Biomass Nitrogen (MBN)

The MBN was determined by fumigation–incubation technique (FIN), in which ammonium Nitrogen (N) was extracted with 2 M KCL. An aliquot of 20 mL of this filtrate was distilled with freshly ignited MgO in Bremner’s distillation apparatus. The distillate was collected in 2% boric acid containing mixed indicator. Finally, the distillate was titrated against standard H2SO4. The net N flush was converted into biomass N using a Kn factor of 0.57 [15].

2.10. Aggregate-Size Organic Carbon (ASOC)

The ASOC was determined using the method in [16] by dispersing 50 g of soil in 150 mL of 0.5% sodium hexametaphosphate. The solution was subjected to shaking for 12 h in a reciprocal shaker. The dispersed material was sieved through a nest of sieves and the suspended fraction was dried at 50 °C overnight. The materials were classified as large macroaggregates (2 mm), small macroaggregates (0.25 mm), micro-aggregates (0.053 mm), and silt plus clay-sized particles (<0.053 mm) [16]. Dried samples were analyzed for organic carbon.

2.11. Land-Degradation Index (LDI)

The LDI can be computed by comparing the degraded ecosystem with the best ecosystem [45].
LDI = D ND × 100 % 100
D—Soil-parameter values of samples,
ND—Parameter values of reference soil.

2.12. Statistical Analyses

Analysis of variance (ANOVA) was conducted with the sampling sites as replicates or as random effects and the various types of land-use pattern as treatments or fixed effects. Duncan’s multiple-range test (DMRT) was used for the comparison of means and to find significant mean variations between land-use patterns. The statistical significance was determined at p < 0.01.
The R program, v 4.1.1 was used for other statistical analyses, such as correlation, using the native function “cor”, for creating network maps using the package “qgraph”, and for computing the PCA (principal component analysis). For visualization, R packages such as ggplot, Complex Heatmap, Factoextra, FactoMineR, and dendextend were used [46].

3. Results

3.1. Total Organic Carbon (TOC) (%) Distribution among Different Ecosystems in NHR

Significant (p < 0.01) differences in TOC were observed in each ecosystem (Table 1), with the highest recorded at EF (10.25%), followed by DF (7.16%). The TOC contents in different ecosystems decreased in the following order: EF > DF > FP > SL > TP > CL. The EF recorded 75.02%, 44.80%, and 68.89% increases in TOC (0–15 cm) when compared to the CL, SL, and TP.
This study showed a higher TOC concentration in the upper layers of the soil profile (0–15 cm), which decreased significantly with increases in depth (Table 1). This decrease in concentration between the layers of the soil profile ranged from 9.83% to 53.04% among the different ecosystems.
The CL recorded the highest decrease (58.04%) in the subsurface layer (between 15–30 cm and 30–45 cm) compared to the surface layer (between 0–15 cm and 15–30 cm). Each ecosystem’s TOC showed a declining pattern with each increase in depth. The TOC at the EF and FP decreased more at depths from 0–15 cm (21.19%) and 15–30 cm (23.38%) than at depths between 15–30 cm and 30–45 cm (9.83%), whereas, in the rest of the ecosystem, it was greater at depths of 15–30 cm and 30–45 cm than at depths between 0–15 cm and 15–30 cm.

3.2. WSOC (mg kg−1) Distribution among Different Ecosystems in NHR

The WSOC varied significantly (p < 0.01) between each ecosystem, with the highest WSOC recorded at a depth of 0–15 cm in the EF (182.70 mg kg−1), followed by the DF (154.91 mg kg−1) and FP (133.87 mg kg−1). The concentration decreased along with the increase in depth of the soil profile, with the lowest recorded at CL (69.48 mg kg−1) (Figure 2). The decrease encountered at depths between 15–30 cm and 30–45 cm was higher when compared to the range from 0–15 cm to 15–30 cm in all the ecosystems, except for the SL, in which the decrease was slightly higher (19.72%) up to the 30-cm layer compared to up to the 45-cm layer (18.91%). The concentration of the WSOC in different ecosystems decreased in the following order: EF > DF > FP > SL > TP > CL. The WSOC recorded in the EF was 15%, 31%, 27%, 56%, and 62% higher than in the DF, SL, FP, TP, and CL at depths of 0–15 cm. The WSOC in the EF decreased by 15.47% at depths of up to 30 cm and by 15.93% at depths from 30 to 45 cm. Similarly, the DF, FP, TP, and CL recorded maximum decreases in WSOC concentration at depths from 15 cm to 45 cm.

3.3. Hot Water-Soluble Carbohydrate (WSC) (mg kg−1) Distribution among Different Ecosystems in NHR

In the diverse ecosystem of the NHR, the average concentration of WSCs ranged from 895.75 mg kg−1 to 12,619.37 mg kg−1. The highest and lowest concentrations of WSC were found in the EF and CL. The WSC was found to differ significantly (p < 0.01) across the ecosystems. When compared to the EF and DF, the WSCs reported in the CL decreased by 84.93% and 77.64%, respectively, and the TP decreased by 80.82% and 71.58%, respectively. The WSCs recorded in the EF were 32.59%, 69.33%, 60.33%, 80.82%, and 84.93% greater than those in the DF, SL, FP, TP, and CL. Between 0–15 cm and 15–30 cm and 15–30 cm and 30–45 cm, the concentration of WSC declined with a different trend in each of the ecosystems. However, each ecosystem showed a decreasing trend with the increased depth.

3.4. Dehydrogenase (µg TPF g−1 day−1) Distribution among Different Ecosystems in NHR

The average soil-dehydrogenase activity ranged from 65.40 to 631.07 μg TPF g−1 day−1. Except for the EF and DF, the activities of dehydrogenase at each depth were statistically (p < 0.01) dissimilar. The activity of the dehydrogenase was higher in the surface soil than in the sub-surface soils. The EF, DF, FP, and CL recorded a greater decline at 15–30 cm and 30–45 cm than at 0–15 cm and 15–30 cm, whereas the decrease in dehydrogenase activity recorded at the SL and TP was highest at 0–15 cm and 15–30 cm. The soil-dehydrogenase activity recorded in the EF was 19.77%, 48.10%, 32.38%, 70.94% and 71.89% higher than in the DF, SL, FP, TP, and CL. With each increase in depth, the soil-dehydrogenase activity decreased.

3.5. Microbial Biomass Carbon (MBC) (mg kg−1) Distribution among Different Ecosystems in NHR

The microbial biomass carbon (MBC) varied significantly (p < 0.01) among the major ecosystems of the NHR. The MBC values across the different ecosystems were as follows: EF (869.94 mg kg−1) > DF (635.11 mg kg−1) > FP (507.95 mg kg−1) > SL (497.39 mg kg−1) > TP (191.59 mg kg−1) > CL (172.00 mg kg−1). The EF recorded significantly more MBC than all the other ecosystems at various depths of the soil profile. The EF recorded 26.99%, 42.82%, 41.61%, 77.98%, and 80.23% higher MBC than the DF, SL, FP, TP, and CL. On the other hand, the TP recorded a MBC value that was 10.22% than that of the CL. There was a significant (p < 0.01) decrease in the MBC across all the depths of the soil profile. The EF and FP showed a wider variation in MBC than the other ecosystems. The significances of the MBC across each ecosystem at varying depths were found to be statistically similar (p < 0.01). The MBC followed a different trend among the ecosystems of the NHR. The decrease in MBC in the EF was higher at depths between 0–15 cm and 15–30 cm (19.62%) than at depths between 15–30 cm and 30–45 cm (3.45%). The decrease in MBC at the DF was lower at depths between 0–15 cm and 15–30 cm depth (10.29%) than at depths between 15–30 cm and 30–45 cm (11.95%). The decrease in MBC in the SL was lower at depths between 0–15 cm and 15–30 cm (3.16%) than at depths between 15–30 cm and 30–45 cm (8.39%). The decrease in MBC in the FP was lower at depths of up to 15 cm and 30 cm (1.79%) than at up to 45 cm (10.03%). The decrease in MBC in the TP was lower at depths between 0–15 cm and 15–30 cm (12.61%) than at depths between 15–30 cm and 30–45 cm (25.53%). The decrease in MBC in the CL was greater at depths between 15–30 cm and 30–45 cm (21.57%) than at depths between 0–15 cm and 15–30 cm (8.16%).

3.6. MBN (mg kg−1) Distribution among Different Ecosystems in NHR

The microbial biomass nitrogen (MBN) in the soils of the various ecosystems in the NHR varied significantly (p < 0.01). The average MBN in the NHR ranged between 27.49 mg kg−1 and 100.02 mg kg−1. When compared to other ecosystems, the soils that were under cultivation (CL and TP) recorded the lowest MBN at all the depths studied. In comparison to the DF, SL, FP, TP, and CL, the MBN reported in the EF was higher at 22.94%, 31.11%, 28.17%, 41.29%, and 44.32%, respectively. The level of significance (p < 0.01) in the MBN across each ecosystem at varying depths was higher. In each ecosystem, the MBN followed an increase in reduction in line with the depth of the soil profile. At depths between 0–15 cm and 15–30 cm, the decline in the MBN was smaller in the EF (13.64%), DF (9.28%), SL (8.03%), FP (12.27%), TP (6.98%), and CL (8.09%) than at depths between 15–30 cm and 30–45 cm (17.99%, 35.38%, 40.50%, 37.57%, 47.61%, and 50.40%, respectively).

3.7. Aggregate-Size Organic Carbon (ASOC) (g kg−1) Distribution among Different Ecosystems in NHR

The results from THE different classes of ASOC (large macroaggregates (2 mm), small macroaggregates (0.25 mm), micro-aggregates (0.053 mm), and silt plus clay-sized particles (<0.053 mm)) revealed a significant difference between the ecosystems.

3.7.1. ASOC (2 mm) (g kg−1) Distribution among Different Ecosystems in NHR

The samples analyzed for coarse-fraction ASOC varied significantly (p < 0.01) among each ecosystem. The highest average amount of coarse-fraction ASOC was recorded in the EF (64.18 g kg−1), followed by the DF (39.74 g kg−1) and the FP (28.56 g kg−1). The concentration decreased gradually in line with the depth. The ASOC (>2 mm) recorded in the EF was 38.08%, 60.67%, 55.50%, 87.58%, and 92.52% higher than the DF, SL, FP, TP, and CL. The lowest concentrations of ASOC (>2 mm) were recorded in the CL (0.1 g kg−1) and the TP (0.1 g kg−1), at depths of 30–45 cm. In line with the depth, the concentrations of ASOC decreased steadily. Each ecosystem’s ASOC (>2 mm) followed a distinct pattern. At depths between 0–15 cm and 15–30 cm, the drop in ASOC (>2 mm) in the EF was greater (29.28%) than the drop at depths between 15–30 cm and 30–45 cm (26.06%). At depths between 0–15 cm and 15–30 cm, the drop in ASOC (>2 mm) in the DF was smaller (30.86%) than at depths between 15–30 cm and 30–45 cm (36.24%). At depths between0–15 cm and 15–30 cm, there was a lower decline in the ASOC (>2 mm) in the SL (45.45%) than at depths between 15–30 cm and 30–45 cm (66.01%). The ASOC (>2 mm) in the FP decreased by 35.11% less at depths between 0–15 cm and 15–30 cm than at depths between 15–30 cm and 30–45 cm (81.82%). The ASOC (>2 mm) decline in the TP was smaller at depths between 0–15 cm and 15–30 cm (73.24%) than at depths between 15–30 cm and 30–45 cm (92.55%). The highest reduction in the ASOC (>2 mm) in the CL occurred at depths between 0–15 cm and 15–30 cm, which was (74.49%) less than the reduction at depths between 15–30 cm and 30–45 cm (93.42%).

3.7.2. ASOC (0.25 mm) (g kg−1) Distribution among Different Ecosystems in NHR

The results of the fine-fraction ASOC in the different ecosystems were as follows: TP (5.21 g kg−1) > EF (4.48 g kg−1) > CL (4.10 g kg−1) > FP (3.83 g kg−1) > SL (3.47 g kg−1) > DF (3.15 g kg−1). In all the ecosystems, the concentration of the ASOC (0.25 mm) dropped as the depth increased, with the exception of the TP, where the highest average values were recorded at depths of 15–30 cm, where the values were 38.08% greater than at depths of 0–15 cm. The ASOC (0.25 mm) in the TP was 14.01%, 39.54%, 33.40%, 26.49%, and 21.30% greater than in the DF, SL, FP, TP, and CL, respectively. At depths between 0–15 cm and 15–30 cm, the increase in the ASOC (0.25 mm) in the EF, DF, SL, FP, and TP was greater than at depths of 15–30 cm and 30–45 cm. At depths between 0–15 cm and 15–30 cm, the increase in the ASOC (0.25 mm) in the TP increased (38.08%), while at depths between 15–30 cm and 30–45 cm, it decreased (34.74%). At depths between 0–15 cm and 15–30 cm, the drop in the ASOC (0.25 mm) in the CL was smaller (46.95%) than that at depths between 15–30 cm and 30–45 cm (25.66%).

3.7.3. ASOC (0.053 mm) (g kg−1) Distribution among Different Ecosystems in NHR

The results of the fine-fraction ASOC (0.053 mm) in the different ecosystems were as follows: SL (5.74 g kg−1) > TP (5.28 g kg−1) > FP (4.54 g kg−1) > DF (3.94 g kg−1) > EF (3.82 g kg−1) > CL (3.81 g kg−1). In all the ecosystems, the concentration of the ASOC (0.053 mm) increased as the depth increased, with the exception of the TP and CL, where the highest average values were recorded at depths of 15–30 cm. The ASOC in the SL (0.053 mm) was greater than those in the EF, DF, FP, TP, and CL by 33.45%, 31.36%, 20.91%, 8.01%, and 35.74%, respectively. Each ecosystem’s ASOC (0.053 mm) showed a different pattern of behavior. At depths between 0–15 cm and 15–30 cm, the rise in the ASOC (0.053 mm) in the EF (97.09%), DF (97.34%), SL (96.61%), FP (95.45%) than at depths between 15–30 cm and 30–45 cm, where the recorded values were 16.10%, 18.20%, 17.24%, and 47.38%, respectively. At depths between 0–15 cm and 15–30 cm, the concentration of the ASOC (0.053 mm) increased in the TP (56.09%), while at depths between 15–30 cm and 30–45 cm, it decreased (11.31%).

3.7.4. ASOC (<0.053 mm) (g kg−1) Distribution among Different Ecosystems in NHR

The results of the fine-fraction ASOC in the different ecosystems were as follows: EF (10.66 g kg−1) > FP (10.36 g kg−1) > DF (9.58 g kg−1) > SL (9.02 g kg−1) > CL (6.56 g kg−1) > TP (5.75 g kg−1) (Figure 3). The EF had a greater ASOC (< 0.053 mm) than the DF, SL, FP, TP, and CL by 10.13%, 15.38%, 2.81%, 46.06%, and 38.46%, respectively. Each ecosystem’s ASOC (<0.053 mm) showed a different pattern of behavior. At depths between 0–15 cm and 15–30 cm, the rise in the ASOC (<0.053 mm) in the EF was lower (11.56%) than at depths between 15–30 cm and 30–45 cm (12.81%). In the DF, at depths between 0–15 cm and 15–30 cm, there was a fall in the ASOC (<0.053 mm), and it increased to 74.75% at depths between 15–30 cm and 30–45 cm (47.83%). The ASOC (<0.053 mm) in the SL decreased (46.56%) at depths between 0–15 cm and 15–30 cm, but it increased again at depths between 15–30 cm and 30–45 cm (11.63%). At depths between 0–15 cm and 15–30 cm in the FP, the decline in the ASOC (<0.053 mm) was 21.10%, and it increased by 22.08% at depths between 15–30 cm and 30–45 cm. At depths between 0–15 cm and 15–30 cm, the decrease in the ASOC (<0.053 mm) in the TP lower (2.30%) than at depths between 15–30 cm and 30–45 cm (63.57%). At depths between 0–15 cm and 15–30 cm, the rise in the ASOC (<0.053 mm) in the CL was 5.89%, and then it reduced by 62.07% at depths between 15–30 cm and 30–45 cm.

3.8. Relationship between TOC and Carbon Pools

The details of the correlation coefficients among the soil-carbon pools are displayed in Figure 4. Among the carbon pools studied, a significant positive correlation was observed between the TOC and the WSOC, WSC, dehydrogenase, MBC, MBN, and ASOC (2 mm, <0.053 mm), along with a non-significant relationship with the ASOC (0.25 mm, 0.053 mm). The strongest correlation was observed between the TOC and the ASOC (2 mm). The ASOC (0.25 mm, 0.053 mm) exhibited a non-significant relationship with the TOC and all the soil-carbon pools studied.

3.9. Land-Degradation Indices (LDIs) of Different Land Uses in NHR

Since the TOC accounted for the higher correlation with the carbon pools, it was chosen to evaluate the LDIs of the different land uses in the NHR. Owing to its high concentration of TOC, the EF was chosen as a reference ecosystem. The LDIs ranged from 0–87.93 (Table 2). The DF with the highest TOC resulted in higher LDIs across different depths. The lowest LDI was recorded in the CL. The LDIs of the different land uses were as follows: DF > FP > SL > TP > CL.

4. Discussion

4.1. Effect of Land-Use Change on Water-Soluble Carbon (WSOC)

Water-soluble carbon is the most mobile and reactive soil carbon source and forms an important component of soil ecology [47]. The solubility of organic carbon (OC) pools is determined by soil characteristics, land use, and management practices [48]. They exert a major impact on WSOC as they are easily oxidizable and sensitive to degradation [49]. The water-soluble organic carbon, a labile carbon pool, was discovered in the same order as the organic-carbon content in the soils of the NHR (Figure 4). The higher concentration of WSOC in the forest ecosystems (EF and DF) is attributable to the higher OC content and release of soluble carbon molecules from root exudates [50]. In addition, the litter in the forests (EF, DF, SL, and FP) contains more lignin and recalcitrant compounds than that in cultivated land (CL and TP) [51], which, in combination with the shady environment fostered by the tree architecture, maintains the soil moisture and hinders carbon degradation [11]. This ultimately helps to build up the carbon status and, thus, the WSOC [52]. The amount of WSOC in the soil profile decreased along with the depth due to its close link with the OC, which showed a comparable trend, in line with the depth-of-soil profiles. In general, only a minimal amount of soluble organic matter is eluviated from the residue layer to the mineral layer, which results in a higher amount of WSOC in surface soils than in the subsurface [52,53].
Furthermore, we found that fertilization could have a significant impact on WSOC content [54,55,56,57]. The farmers in the NHR tend to apply more fertilizer than the recommended dosage. Thus, the amount of nitrogenous fertilizer and low organic carbon added diminished the content of the WSOC in the CL and the TP [51,58].

4.2. Effect of Land-Use Change on Water-Soluble Carbohydrates (WSC)

Water-soluble carbohydrates are components of labile soil organic carbon and are also related to soil microbial biomass and micro-aggregation [59,60,61]. The accumulation of WSC in soil results from a complex set of interactions between the soil matrices, climate, topography, cultivation, and the diversity of fauna and flora. When the rate of carbon inputs from plant litter, roots, and animal excreta exceeds that of the decomposition, the accumulation of soil organic matter occurs, and if the decomposition is greater than the inputs, it decreases [62]. Therefore, the maintenance of high levels of carbon inputs in the EF and DF resulted in the highest level of OC and, thus, of water-soluble carbohydrates. Cultivation with excessive fertilization or overgrazing has inflicted a loss on the WSC and during this process, the pools of all the labile nutrients tended to decline [63]. From a production standpoint, this would imply a greater reliance on chemical fertilizers and this, in turn, poses a greater environmental risk due to nutrient leaching or run-off into rivers. Therefore, maintaining a certain level of WSC should be seen as an environmentally desirable feature for long-term production and environmental protection. The depletion of WSC could potentially be an early indicator of soil-OC decline. The present study shows that 40–50% of the carbon extracted from the hot-water carbon pool was derived from a carbohydrate, which is consistent with the findings in [61,64].

4.3. Effect of Land-Use Change on Microbial Biomass Carbon (MBC)

Microbial biomass carbon has been proposed as an index of soil stress and disturbance, and its measurement is often essential for soil ecological studies [65]. A labile carbon pool, MBC is highly sensitive to LUC. Therefore, native land (EF and DF) with a higher quantity of litterfall and deep root systems favor more microbial activity and result in higher rates of MBC [66]. The increased concentration of MBC in the forest ecosystems compared with the other sites is incongruent with other reported findings [26,67,68]. The difference in resource availability, vegetation composition, and agricultural practices such as tillage led to a decline in the MBC in the CL, SL, and TP [69]. This is in agreement with various other findings [70]. Numerous factors explain the effects of substrates and vegetation types on MBC. For instance, changes in the quality or quantity of inputs through litter and root type can have a significant impact on MBC [71,72]. Microbial biomass carbon is highly dependent on organic-matter substrates. Thus, a decrease in OC causes a decrease in MBC [73,74,75,76]. The MBC decreased along with depth in all the major ecosystems in the NHR [77]. The surface soils (O and A horizons) had significantly higher MBC values than the sub-surface (C horizon), with the AC horizon being intermediate. However, it was noted that the C horizon below the rooting zone contained 30% MBC due to the exudates. This was due to the lower volume of OC in the subsoils and the higher volume of organic matter in the top soils, which can increase microbial activities. This was in agreement with various other findings [70,78].

4.4. Effect of Land Use on Microbial Biomass Nitrogen (MBN)

Microbial biomass nitrogen is closely related to soil fertility (as defined by chemical analysis), and its concentration is attributed to climatic conditions, differences in ground-cover vegetation, the number of roots, soil types, and properties, and types of land use and management [79,80,81]. Untouched native forests (EF and DF) with relatively dense structures, greater accumulations of litter, and fine roots may favor higher total nitrogen (TN) content compared with other ecosystems. This, in turn, results in a significant contribution of nitrogen to microbial biomass growth [15,82]. In support of this finding, the highest MBN was recorded in the EF and the lowest was recorded in the CL ecosystems, as the MBN and TN were positively related and strongly influenced the activity of the MBN. With the addition of OC, the clay content of the soil is known to play a role in determining MBN [83]. Thus, high the OC, along with the clay content (>40%) in the EF and DF, led to more stabilization of the soil nitrogen and resulted in higher MBN [84].

4.5. Effect of Land-Use Change on Dehydrogenase

An intracellular enzyme, dehydrogenase, which involves the metabolism of oxidoreductase [85], is proven to be a good indicator of microbial activity and is considered essential for maintaining soil quality [86]. The dehydrogenase activity ranged from 201 to 724 µg TPF g−1 day−1, with the EF recording the highest value, which was consistent with the soil MBC. The strong catabolic activity of soil microorganisms and high organic-matter storage in comparatively cool forest ecosystems favors higher levels of dehydrogenase enzyme activity [87]. Organic matter, which is characterized by its sink and its role as a source of nutrients, can enhance soil’s physical and chemical properties and encourage biological activity [88]. It is evident from the findings that dehydrogenase has a strong connection with organic matter, which provides more substrates, supports higher microbial biomass and, ultimately, results in higher levels of enzyme production [89]. Several reports show a positive relationship between dehydrogenase and the organic-matter content in soils [89,90,91,92,93,94]. The authors of [88] reported that the activity of dehydrogenase under different forest ecosystems showed a positive relationship with microbial biomass. Thus, higher dehydrogenase activity was reported in EFs, DFs, and FPs compared with CLs, TPs, and SLs, due to lower litter input or monoculture [95]. Fertilizers commonly improve the availability of nutrients [96]. Balanced fertilization can improve the aboveground plant parts and roots [95] and helps to improve soil structure [96]. However, this form of fertilization can drastically affect microorganism populations and, thus, enzyme activities. Various findings reported that inorganic fertilizers can have a significant impact on dehydrogenase [92,97]. Dehydrogenase is used to determine the impact of pollutants (pesticides or excessive fertilization) on the soil microbiome [97,98]. Although pesticides are important tools in agriculture, helping to minimize the economic losses incurred by pathogens, weeds, and insects, they are also considered a potential threat to the environment and dehydrogenase activity [98]. The depth along the profile of the soil is one of the most common environmental factors to affect dehydrogenase. The higher microbial population in the surface-soil layer compared to the sub-surface displayed the diminishing trends of dehydrogenase across the depth of the soil. These findings [99] were in agreement with other research findings [100,101].

4.6. Effect of Land-Use Change on Aggregate-Size Organic Carbon (ASOC)

Aggregate-size organic carbon is composed of partially decomposed organic residues and is commonly considered as an index of soil-organic-matter lability with coarse (c) and fine (f) particulate organic matter representing the labile and less labile carbon pools, respectively [102]. In the SOM cycle, ASOC serves as an intermediate between newly formed organic molecules and humified OC [103]. The presence of ASOC in undisturbed native land with a constant supply of litter makes the quantity richer than in other land-use types and in the top strata of the soil profile [104,105]. However, the LUC can have a significant impact on the ASOC [106]. Compared to OC, ASOC is more sensitive to management practices [16,103] and is preferentially lost with the change in soil use from native to other land-use types [107]. Consistent with this hypothesis, our research found that the conversion of EF and DF to other land uses decreased the concentration of the ASOC (Figure 3). Furthermore, the ASOC concentration was much greater in the macro-aggregates of the EF, DF, SL, and FP than in the micro-aggregates (Figure 3), which was consistent with earlier research [108,109,110] and the hierarchical model, which states that macro-aggregates are made up of micro-aggregates and transitory and temporary organic binding agents (roots and fungal hyphae) [111]. Our findings reveal that the ASOC in the small macro-aggregates (0.25 mm) was predominant in the EF, DF, SL, and FP, which was in agreement with [112]. Unfortunately, the LUC significantly affected the macro-aggregate quantity in comparison to the stable micro-aggregates [113]. Previous research demonstrated that macro-aggregates are sensitive to soil disturbance because of their transitory and temporary binding agents, such as roots and mycelia [114,115]. As a result of the LUC, the ASOC in the macro-aggregates (2 mm and 0.25 mm) of the CL and TP were meager compared to its micro-aggregates. Our findings were similar to those in [116]. The lower concentrations in the CL and TP were mainly attributed to soil disturbances (applying pesticides, fertilizer, tillage, and crop removal), which directly affect macro-aggregates. Serving as binding agents, TOCs are used in soil aggregation, and they help in the generation of stable aggregates [117]. Furthermore, the land use and land cover of a particular ecosystem influence the quantity of organic matter (input, decomposition, and storage) and the sequestration of atmospheric CO2, which, in turn, affects the concentration of the TOC. With the native-land-use type, the aggregate stability had no significant effect on the ASOCs of any of the fractions. This could be attributable to the concentration of the TOC in the native land surpassing the threshold for exerting a strong influence on the ASOC.
We discovered that the degree of the LUC’s effect on the ASOC was dissimilar in all the aggregate sizes (Figure 5). Previously, the ASOC in the macro- and micro-aggregates of the native land was protected due to its undisturbed natural setting. However, LUC has inflicted a massive loss on the concentrations of TOC and macro-aggregates through the altered land use (Figure 5). Upon periodic tillage and cultivation, the ASOC might have altered from macro-aggregate to micro-aggregate. The results of the PCA depict the equal contributions from the major carbon pools (Figure 5), among which the ASOC in the macro-aggregates (2 mm) made the strongest contribution toward the variability. With the highest TOC and carbon pools, the EF, DF, SL, and FP clustered at the left extreme of the biplot, whereas the CL and TP clustered at the right extreme.
Interestingly, these effects were less pronounced in the micro-aggregates than in the macro-aggregates. This was consistent with other reported findings [118]. We consider that the oxides and disordered alumino-silicates in the acidic soils in the NHR are responsible for the stable nature of organic carbon in micro-aggregates. The soils in the NHR are clay-textured with high iron and aluminum contents; they can act as a cationic bridge and may immobilize the ASOC in the micro-aggregates [109]. In the CL and TP, the sole carbon sources were annual and perennial herbaceous plants and crop residues; upon cultivation, the ASOC diminishes through (i) rapid mineralization, (ii) leaching and translocation when dissolved, and (iii) accelerated erosion [107,119]. Due to these processes, the macro-aggregates are destructed and expose the inner core in the ASOC. This, in turn, facilitates the swift decomposition by microbes [13,63,120]. However, with conservative management practices (such as stubble retention and organic farming) the ASOC tends to accumulate.

4.7. Land-Degradation Index (LDI) in NHR

From the findings, it is clear that the LUC has resulted in the depletion of carbon reserves [11] in the NHR and, in order to estimate the extent of this process, the LDI was calculated, with EF as a reference land use [121]. Since the TOC represented the total carbon pools, it was chosen to calculate and compare the land degradation among the ecosystems. Negative values of LDI represent degradation in the soil properties, while t non-degraded (best) soils are represented by positive LDI values. The EF, with zero LDI, distinguished between the degraded and non-degraded soil qualities. The TOC was found to be deteriorated in all the regions investigated, with the CL (−79.00) (0–45 cm) showing the most deterioration. Hence, there is a need for the implementation of proper strategies to bridge depleted carbon pools in degraded ecosystems (CLs and TPs).
Given that EFs, DFs, SLs, and FPs have higher TOC concentrations, switching from native land to CLs and TPs should be discouraged, in order to reduce soil erosion and protect soil fertility. This will facilitate the boosting of land productivity, adaptation to climate change, the protection of biodiversity, and the provision of ecosystem services. Conservation agriculture (such as direct drilling, stubble retention, and organic farming), as well as sustainable land management, should be increased in CLs and TPs in order to protect the fragile NHR of the Western Ghats.

5. Conclusions

Increased pressure on land through human commercial activities has resulted in the interruption of the natural ecosystem, which is evident from stable natural ecosystems (EFs, DFs, FPs, and SLs) with negligible anthropogenic disturbances. In the latter, significantly higher concentrations of various carbon pools were recorded compared to the disturbed ecosystems (TPs and CLs). The LUC has altered the dynamics of organic carbon associated with different aggregate sizes, which has lowered the concentration of OC across the different land uses. These findings portray the negative impact of LUC on soil organic-carbon pools across the depths of the soil profile. The unstable carbon pools due to LUC have raised the question of climate change due to the possibility of the increased emission of CO2 upon their degradation. This invites us to focus on harnessing carbon efficiently with sustainable land-management practices in carbon-degraded ecosystems in order to curb the menace of land degradation and to keep soils alive.

Author Contributions

Conceptualization, M.J., C.S., D.S. and S.T.; methodology, M.J. and S.K.S.; software, R.K., V.A., M.D., P.R., U.S. and B.P.; validation, M.J., T.K., P.R. and U.S.; formal analysis, M.J., A.K., P.R. and U.S.; investigation, M.J., K.L. and R.K.; resources, M.J., C.S., D.S. and R.K.; data curation, M.J., T.K., S.K.S., R.K., V.A. and B.P.; writing—original draft preparation, M.J., A.K., S.K.S., M.D., P.R. and U.S.; writing—review and editing, A.K., K.L., V.A. and B.P.; visualization, M.J., S.T., T.K., K.L. and M.D.; supervision, M.J., C.S., D.S., S.T., K.L. and M.D.; project administration, M.J., C.S., D.S. and S.T.; funding acquisition, C.S., T.K., A.K., S.K.S. and B.P. All authors have read and agreed to the published version of the manuscript.

Funding

This research was funded by Department of Science and Technology, Government of India, IF190855.

Institutional Review Board Statement

There were no human or animal subjects involved in this study.

Informed Consent Statement

Not applicable.

Data Availability Statement

The data that support the findings of this study are available from the corresponding author, M.J., upon reasonable request.

Acknowledgments

We thank all the land owners and the Department of Forest, Horticulture and Plantation Crops of Tamil Nadu for granting permission for the collection of soil samples in various study areas for this research.

Conflicts of Interest

The authors declare no conflict of interest.

References

  1. Scharlemann, J.P.W.; Tanner, E.V.J.; Hiederer, R.; Kapos, V. Global Soil Carbon: Understanding and Managing the Largest Terrestrial Carbon Pool. Carbon Manag. 2014, 5, 81–91. [Google Scholar] [CrossRef]
  2. Lal, R. Sequestration of Atmospheric CO2 in Global Carbon Pools. Energy Environ. Sci. 2008, 1, 86–100. [Google Scholar] [CrossRef]
  3. Lal, R. Soil Health and Carbon Management. Food Energy Secur. 2016, 5, 212–222. [Google Scholar] [CrossRef]
  4. Villarino, S.H.; Studdert, G.A.; Laterra, P. How Does Soil Organic Carbon Mediate Trade-Offs between Ecosystem Services and Agricultural Production? Ecol. Indic. 2019, 103, 280–288. [Google Scholar] [CrossRef]
  5. Laik, R.; Kumara, B.H.; Pramanick, B.; Singh, S.K.; Nidhi; Alhomrani, M.; Gaber, A.; Hossain, A. Labile soil organic matter pools are influenced by 45 years of applied farmyard manure and mineral nitrogen in the wheat—Pearl millet cropping system in the sub-tropical condition. Agronomy 2021, 11, 2190. [Google Scholar] [CrossRef]
  6. Pramanick, B.; Kumar, M.; Naik, B.M.; Kumar, M.; Singh, S.K.; Maitra, S.; Naik, B.S.S.S.; Rajput, V.D.; Minkina, T. Long-term conservation tillage and precision nutrient management in maize–wheat cropping system: Effect on soil properties, crop production, and economics. Agronomy 2022, 12, 2766. [Google Scholar] [CrossRef]
  7. Victoria, R.; Banwart, S.; Black, H.; Ingram, J.; Joosten, H.; Milne, E.; Noellemeyer, E.; Baskin, Y. The Benefits of Soil Carbon. Foresight Chapter UNEP Yearb. 2012, 2012, 19–33. [Google Scholar]
  8. Paustian, K.; Collins, H.P.; Paul, E.A. Management Controls on Soil Carbon. In Soil Organic Matter in Temperate Agroecosystems; CRC Press: Boca Raton, FL, USA, 2019; pp. 15–49. [Google Scholar] [CrossRef]
  9. Hati, K.M.; Biswas, A.K.; Somasundaram, J.; Mohanty, M.; Singh, R.K.; Sinha, N.K.; Chaudhary, R.S. Soil Organic Carbon Dynamics and Carbon Sequestration under Conservation Tillage in Tropical Vertisols. In Carbon Management in Tropical and Sub-Tropical Terrestrial Systems; Springer: Singapore City, Singapore, 2019; pp. 201–212. [Google Scholar] [CrossRef]
  10. Zhang, L.; Zhuang, Q.; He, Y.; Liu, Y.; Yu, D.; Zhao, Q.; Shi, X.; Xing, S.; Wang, G. Toward Optimal Soil Organic Carbon Sequestration with Effects of Agricultural Management Practices and Climate Change in Tai-Lake Paddy Soils of China. Geoderma 2016, 275, 28–39. [Google Scholar] [CrossRef] [Green Version]
  11. Jagadesh, M.; Selvi, D.; Thiyageshwari, S.; Srinivasarao, C.; Kalaiselvi, T.; Lourdusamy, K.; Kumaraperumal, R.; Allan, V. Soil Carbon Dynamics Under Different Ecosystems of Ooty Region in the Western Ghats Biodiversity Hotspot of India. J. Soil Sci. Plant Nutr. 2023, 23, 1374–1385. [Google Scholar] [CrossRef]
  12. Wolters, V. Invertebrate Control of Soil Organic Matter Stability. Biol. Fertil. Soils 2000, 31, 1–19. [Google Scholar] [CrossRef]
  13. Six, J.; Callewaert, P.; Lenders, S.; de Gryze, S.; Morris, S.J.; Gregorich, E.G.; Paul, E.A.; Paustian, K. Measuring and Understanding Carbon Storage in Afforested Soils by Physical Fractionation. Soil Sci. Soc. Am. J. 2002, 66, 1981–1987. [Google Scholar] [CrossRef] [Green Version]
  14. Blair, G.J.; Lefroy, R.D.B.; Lisle, L. Soil Carbon Fractions Based on Their Degree of Oxidation, and the Development of a Carbon Management Index for Agricultural Systems. Aust. J. Agric. Res. 1995, 46, 1459–1466. [Google Scholar] [CrossRef]
  15. Jenkinson, D.S. Determination of Microbial Biomass Carbon and Nitrogen in Soil. Adv. Nitrogen Cycl. 1988, 16, 368–386. [Google Scholar]
  16. Cambardella, C.A.; Elliott, E.T. Particulate Soil Organic-matter Changes across a Grassland Cultivation Sequence. Soil Sci. Soc. Am. J. 1992, 56, 777–783. [Google Scholar] [CrossRef]
  17. Trumbore, S.E. Potential Responses of Soil Organic Carbon to Global Environmental Change. Proc. Natl. Acad. Sci. USA 1997, 94, 8284–8291. [Google Scholar] [CrossRef] [PubMed] [Green Version]
  18. Mandal, B.; Majumuder, B.; Adhya, T.K.; Bandyopadhyay, P.K.; Gangopadhyay, A.; Sarkar, D.; Kundu, M.C.; Choudhury, S.G.; Hazra, G.C.; Kundu, S.; et al. Potential of Double-Cropped Rice Ecology to Conserve Organic Carbon under Subtropical Climate. Glob. Change Biol. 2008, 14, 2139–2151. [Google Scholar] [CrossRef]
  19. Chan, K.Y.; Bowman, A.; Oates, A. Oxidizible organic carbon fractions and soil quality changes in an oxic paleustalf under different pasture leys. Soil Sci. 2001, 166, 61–67. [Google Scholar] [CrossRef]
  20. Nath, A.J.; Brahma, B.; Sileshi, G.W.; Das, A.K. Impact of Land Use Changes on the Storage of Soil Organic Carbon in Active and Recalcitrant Pools in a Humid Tropical Region of India. Sci. Total Environ. 2018, 624, 908–917. [Google Scholar] [CrossRef]
  21. Luo, Y.; White, L.W.; Canadell, J.G.; DeLucia, E.H.; Ellsworth, D.S.; Finzi, A.; Lichter, J.; Schlesinger, W.H. Sustainability of Terrestrial Carbon Sequestration: A Case Study in Duke Forest with Inversion Approach. Glob. Biogeochem. Cycles 2003, 17, 1021. [Google Scholar] [CrossRef] [Green Version]
  22. Paul, E.A.; Collins, H.P.; Leavitt, S.W. Dynamics of Resistant Soil Carbon of Midwestern Agricultural Soils Measured by Naturally Occurring 14C Abundance. Geoderma 2001, 104, 239–256. [Google Scholar] [CrossRef]
  23. Maskell, L.C.; Crowe, A.; Dunbar, M.J.; Emmett, B.; Henrys, P.; Keith, A.M.; Norton, L.R.; Scholefield, P.; Clark, D.B.; Simpson, I.C. Exploring the Ecological Constraints to Multiple Ecosystem Service Delivery and Biodiversity. J. Appl. Ecol. 2013, 50, 561–571. [Google Scholar] [CrossRef] [Green Version]
  24. Sanderman, J.; Hengl, T.; Fiske, G.J. Soil Carbon Debt of 12,000 Years of Human Land Use. Proc. Natl. Acad. Sci. USA 2017, 114, 9575–9580. [Google Scholar] [CrossRef] [PubMed] [Green Version]
  25. Goldewijk, K.K.; Beusen, A.; Van Drecht, G.; De Vos, M. The HYDE 3.1 spatially explicit database of human-induced global land-use change over the past 12,000 years. Glob. Ecol. Biogeogr. 2011, 20, 73–86. [Google Scholar] [CrossRef]
  26. Kooch, Y.; Tavakoli, M.; Akbarinia, M. Tree Species Could Have Substantial Consequences on Topsoil Fauna: A Feedback of Land Degradation/Restoration. Eur. J. For. Res. 2018, 137, 793–805. [Google Scholar] [CrossRef]
  27. Olsson, L.; Barbosa, H.; Bhadwal, S.; Cowie, A.; Delusca, K.; Flores-Renteria, D.; Hermans, K.; Jobbagy, E.; Kurz, W.; Li, D. Land Degradation: IPCC Special Report on Climate Change, Desertification, Land 5 Degradation, Sustainable Land Management, Food Security, and 6 Greenhouse Gas Fluxes in Terrestrial Ecosystems. In IPCC Special Report on Climate Change, Desertification, Land 5 Degradation, Sustainable Land Management, Food Security, and 6 Greenhouse Gas Fluxes in Terrestrial Ecosystems; Intergovernmental Panel on Climate Change (IPCC), UNEP: Nairobi, Kenya, 2019; p. 1. [Google Scholar]
  28. FAO. Recarbonization of Global Soils: A Dynamic Response to Offset Global Emissions; FAO: Rome, Italy, 2019. [Google Scholar]
  29. Wei, X.; Shao, M.; Gale, W.; Li, L. Global Pattern of Soil Carbon Losses Due to the Conversion of Forests to Agricultural Land. Sci. Rep. 2015, 4, 4062. [Google Scholar] [CrossRef] [Green Version]
  30. Sharma, G.; Sharma, L.K.; Sharma, K.C. Assessment of Land Use Change and Its Effect on Soil Carbon Stock Using Multitemporal Satellite Data in Semiarid Region of Rajasthan, India. Ecol. Process. 2019, 8, 1–17. [Google Scholar] [CrossRef]
  31. Vasantha, K.S.; Bhagavanulu, D.V.S. Effect of Deforestation on Landslides in Nilgiris District—A Case Study. J. Indian Soc. Remote Sens. 2008, 36, 105–108. [Google Scholar] [CrossRef]
  32. Sasmitha, R.; Iqshanullah, A.M.; Arunachalam, R. Ecosystem Changes in Shola Forest-Grassland Mosaic of the Nilgiri Biosphere Reserve (NBR). Environ. Issues Sustain. Dev. IntechOpen 2021. [Google Scholar] [CrossRef]
  33. Sasmitha, R.; Arunachalam, R.; Iqshanullah, M. Documentation of Soil Related Environmental Issues and It’s Contributing Factors: A Study among the Hilly Tribes of the Nilgiri District. Madras Agric. J. 2019, 106, 1. [Google Scholar] [CrossRef]
  34. Krishnan, S. Landscape, Labor, and Label: The Second World War, Pastoralist Amelioration, and Pastoral Conservation in the Nilgiris, South India (1929–1945). Int. Labor Work. Cl. Hist. 2015, 87, 92–110. [Google Scholar] [CrossRef]
  35. Baldi, G.; Paruelo, J.M. Land-Use and Land Cover Dynamics in South American Temperate Grasslands. Ecol. Soc. 2008, 13, 6. [Google Scholar] [CrossRef]
  36. Thirumalai, P.; Anand, P.H.; Murugesan, J. Changing Land Use Pattern in Nilgiris Hill Environment Using Geospatial Technology. Int. J. Recent Sci. Res. 2015, 6, 3679–3683. [Google Scholar]
  37. Vega, E.; Baldi, G.; Jobbágy, E.G.; Paruelo, J. Land Use Change Patterns in the Río de La Plata Grasslands: The Influence of Phytogeographic and Political Boundaries. Agric. Ecosyst. Environ. 2009, 134, 287–292. [Google Scholar] [CrossRef]
  38. Nalina, P.; Meenambal, T.; Sridhar, R.S. Land use land cover dynamics of nilgiris district, india inferred from satellite imageries. Am. J. Appl. Sci. 2014, 11, 455–461. [Google Scholar] [CrossRef] [Green Version]
  39. Gunnell, Y.; Louchet, A. The Influence of Rock Hardness and Divergent Weatherin g on the Interpretation of Apatite Fission-Track Denudation Rates. Evid. Charnockites South India Sri Lanka. Z. Für Geomorphol. 2000, 44, 33–57. [Google Scholar] [CrossRef]
  40. Caner, L.; Bourgeon, G.; Bourgeon Andisols, G.; Bourgeon, G.; Gunnell, Y.; Radhakrishna, B. Andisols of the Nilgiri Highlands: New Insight into Their Classification, Age and Genesis; Geological Society of India: Bangalore, India, 2001. [Google Scholar]
  41. McGill, W.B.; Cannon, K.R.; Robertson, J.A.; Cook, F.D. Dynamics of soil microbial biomass and water-soluble organic c in breton l after 50 years of cropping to two rotations. Can. J. Soil Sci. 1986, 66, 1–19. [Google Scholar] [CrossRef] [Green Version]
  42. Brink, R.H.; Dubach, P.; Lynch, D.L. Measurement of carbohydrates in soil hydrolyzates with anthrone. Soil Sci. 1960, 89, 157–166. [Google Scholar] [CrossRef]
  43. Thalmann, A. Zur Methodik Der Bestimmung Der DehydrogenaseaktivitAt Im Boden Mittels Triphenytetrazoliumchlorid (TTC). Landwirtsch 1968, 21, 249–258. [Google Scholar]
  44. Vance, E.D.; Brookes, P.C.; Jenkinson, D.S. An Extraction Method for Measuring Soil Microbial Biomass C. Soil Biol. Biochem. 1987, 19, 703–707. [Google Scholar] [CrossRef]
  45. Barrow, C.J. Land Degradation: Development and Breakdown of Terrestrial Environments; Cambridge University Press: Cambridge, UK, 1991. [Google Scholar]
  46. Tollefson, M. Introduction: Plot (), Qplot (), and Ggplot (), Plus Some. In Visualizing Data in R 4; Springer: Berkeley, CA, USA, 2021; pp. 3–7. [Google Scholar]
  47. Scaglia, B.; Adani, F. Biodegradability of Soil Water Soluble Organic Carbon Extracted from Seven Different Soils. J. Environ. Sci. 2009, 21, 641–646. [Google Scholar] [CrossRef]
  48. Jha, P.; Garg, N.; Lakaria, B.L.; Biswas, A.K.; Rao, A.S. Soil and Residue Carbon Mineralization as Affected by Soil Aggregate Size. Soil Tillage Res. 2012, 121, 57–62. [Google Scholar] [CrossRef]
  49. Ma, X.Z.; Chen, L.J.; Chen, Z.H.; Wu, Z.J.; Zhang, L.L.; Zhang, Y.L. Soil Glycosidase Activities and Water Soluble Organic Carbon under Different Land Use Types. Rev. De La Cienc. Del Suelo Y Nutr. Veg. 2010, 10, 93–101. [Google Scholar] [CrossRef] [Green Version]
  50. Moharana, P.C.; Naitam, R.K.; Verma, T.P.; Meena, R.L.; Kumar, S.; Tailor, B.L.; Singh, R.S.; Singh, S.K.; Samal, S.K. Effect of Long-Term Cropping Systems on Soil Organic Carbon Pools and Soil Quality in Western Plain of Hot Arid India. Arch. Agron. Soil Sci. 2017, 63, 1661–1675. [Google Scholar] [CrossRef]
  51. Chantigny, M.H. Dissolved and Water-Extractable Organic Matter in Soils: A Review on the Influence of Land Use and Management Practices. Geoderma 2003, 113, 357–380. [Google Scholar] [CrossRef]
  52. Christ, M.J.; David, M.B. Dynamics of Extractable Organic Carbon in Spodosol Forest Floors. Soil Biol. Biochem. 1996, 28, 1171–1179. [Google Scholar] [CrossRef]
  53. Sheng, H.; Zhou, P.; Zhang, Y.; Kuzyakov, Y.; Zhou, Q.; Ge, T.; Wang, C. Loss of Labile Organic Carbon from Subsoil Due to Land-Use Changes Insubtropical China. Soil Biol. Biochem. 2015, 88, 148–157. [Google Scholar] [CrossRef]
  54. Deng, L.; Shangguan, Z. Afforestation Drives Soil Carbon and Nitrogen Changes in China. Land Degrad. Dev. 2017, 28, 151–165. [Google Scholar] [CrossRef] [Green Version]
  55. Zsolnay, A.; Görlitz, H. Water Extractable Organic Matter in Arable Soils: Effects of Drought and Long-Term Fertilization. Soil Biol. Biochem. 1994, 26, 1257–1261. [Google Scholar] [CrossRef]
  56. Jensen, L.S.; Mueller, T.; Magid, J.; Nielsen, N.E. Temporal Variation of C and N Mineralization, Microbial Biomass and Extractable Organic Pools in Soil after Oilseed Rape Straw Incorporation in the Field. Soil Biol. Biochem. 1997, 29, 1043–1055. [Google Scholar] [CrossRef]
  57. Martin-Olmedo, P.; Rees, R.M. Short-Term N Availability in Response to Dissolved-Organic-Carbon from Poultry Manure, Alone or in Combination with Cellulose. Biol Fertil Soils 1999, 29, 386–393. [Google Scholar] [CrossRef]
  58. Jha, P.; De, A.; Lakaria, B.L.; Biswas, A.K.; Singh, M.; Reddy, K.S.; Rao, A.S. Soil Carbon Pools, Mineralization and Fluxes Associated with Land Use Change in Vertisols of Central India. Natl. Acad. Sci. Lett. 2012, 35, 475–483. [Google Scholar] [CrossRef]
  59. Ghani, A.; Dexter, M.; Sarathchandra, U.; Perrott, K.W.; Singleton, P. Assessment of Extractable Hot-Water Carbon as an Indicator of Soil Quality on Soils under Long-Term Pastoral, Cropping, Market Gardening and Native Vegetation. In Proceedings of the Australian and New Zealand Second Joint Soils Conference, Lincoln, New Zealand, 14–21 August 2000; pp. 119–120. [Google Scholar]
  60. Haynes, R.J.; Swift, R.S. Stability of Soil Aggregates in Relation to Organic Constituents and Soil Water Content. J. Soil Sci. 1990, 41, 73–83. [Google Scholar] [CrossRef]
  61. Puget, P.; Angers, D.A.; Chenu, C. Nature of Carbohydrates Associated with Water-Stable Aggregates of Two Cultivated Soils. Soil Biol. Biochem. 1998, 31, 55–63. [Google Scholar] [CrossRef]
  62. Takele, L.; Chimdi, A.; Abebaw, A. Dynamics of Soil Fertility as Influenced by Different Land Use Systems and Soil Depth in West Showa Zone, Gindeberet District, Ethiopia. Agric. For. Fish. 2014, 3, 489–494. [Google Scholar]
  63. Six, J.; Paustian, K.; Elliott, E.T.; Combrink, C. Soil Structure and Organic Matter, I. Distribution of Aggregate-size Classes and Aggregate-associated Carbon. Soil Sci. Soc. Am. J. 2000, 64, 681–689. [Google Scholar] [CrossRef]
  64. Haynes, R.J.; Francis, G.S. Changes in Microbial Biomass C, Soil Carbohydrate Composition and Aggregate Stability Induced by Growth of Selected Crop and Forage Species under Field Conditions. J. Soil Sci. 1993, 44, 665–675. [Google Scholar] [CrossRef]
  65. Hernández, T.; Garcia, C.; Reinhardt, I. Short-Term Effect of Wildfire on the Chemical, Biochemical and Microbiological Properties of Mediterranean Pine Forest Soils. Biol. Fertil. Soils 1997, 25, 109–116. [Google Scholar] [CrossRef]
  66. Arunachalam, K.; Arunachalam, A.; Melkania, N.P. Influence of Soil Properties on Microbial Populations, Activity and Biomass in Humid Subtropical Mountainous Ecosystems of India. Biol. Fertil. Soils 1999, 30, 217–223. [Google Scholar] [CrossRef]
  67. Dos Santos, U.J.; de Medeiros, E.V.; Duda, G.P.; Marques, M.C.; de Souza, E.S.; Brossard, M.; Hammecker, C. Land Use Changes the Soil Carbon Stocks, Microbial Biomass and Fatty Acid Methyl Ester (FAME) in Brazilian Semiarid Area. Arch. Agron. Soil Sci. 2019, 65, 755–769. [Google Scholar] [CrossRef]
  68. Mganga, K.Z.; Kuzyakov, Y. Glucose Decomposition and Its Incorporation into Soil Microbial Biomass Depending on Land Use in Mt. Kilimanjaro Ecosystems. Eur. J. Soil Biol. 2014, 62, 74–82. [Google Scholar] [CrossRef]
  69. Van Leeuwen, J.P.; Djukic, I.; Bloem, J.; Lehtinen, T.; Hemerik, L.; de Ruiter, P.C.; Lair, G.J. Effects of Land Use on Soil Microbial Biomass, Activity and Community Structure at Different Soil Depths in the Danube Floodplain. Eur. J. Soil Biol. 2017, 79, 14–20. [Google Scholar] [CrossRef]
  70. Soleimani, A.; Hosseini, S.M.; Bavani, A.R.M.; Jafari, M.; Francaviglia, R. Influence of Land Use and Land Cover Change on Soil Organic Carbon and Microbial Activity in the Forests of Northern Iran. Catena 2019, 177, 227–237. [Google Scholar] [CrossRef]
  71. Feng, W.; Zou, X.; Schaefer, D. Above-and Belowground Carbon Inputs Affect Seasonal Variations of Soil Microbial Biomass in a Subtropical Monsoon Forest of Southwest China. Soil Biol. Biochem. 2009, 41, 978–983. [Google Scholar] [CrossRef]
  72. Jin, H.; Sun, O.J.; Liu, J. Changes in Soil Microbial Biomass and Community Structure with Addition of Contrasting Types of Plant Litter in a Semiarid Grassland Ecosystem. J. Plant Ecol. 2010, 3, 209–217. [Google Scholar] [CrossRef] [Green Version]
  73. Chen, T.-H.; Chiu, C.-Y.; Tian, G. Seasonal Dynamics of Soil Microbial Biomass in Coastal Sand Dune Forest. Pedobiologia 2005, 49, 645–653. [Google Scholar] [CrossRef]
  74. Chen, C.; Liu, W.; Jiang, X.; Wu, J. Effects of Rubber-Based Agroforestry Systems on Soil Aggregation and Associated Soil Organic Carbon: Implications for Land Use. Geoderma 2017, 299, 13–24. [Google Scholar] [CrossRef]
  75. Wang, Q.; Wang, S. Response of Labile Soil Organic Matter to Changes in Forest Vegetation in Subtropical Regions. Appl. Soil Ecol. 2011, 47, 210–216. [Google Scholar] [CrossRef]
  76. Padalia, K.; Bargali, S.S.; Bargali, K.; Khulbe, K. Microbial Biomass Carbon and Nitrogen in Relation to Cropping Systems in Central Himalaya, India. Curr. Sci. 2018, 115, 1741–1750. [Google Scholar] [CrossRef]
  77. Lepcha, N.T.; Devi, N.B. Effect of Land Use, Season, and Soil Depth on Soil Microbial Biomass Carbon of Eastern Himalayas. Ecol. Process. 2020, 9, 1–14. [Google Scholar] [CrossRef]
  78. Fall, D.; Diouf, D.; Zoubeirou, A.M.; Bakhoum, N.; Faye, A.; Sall, S.N. Effect of Distance and Depth on Microbial Biomass and Mineral Nitrogen Content under Acacia Senegal (L.) Willd. Trees. J. Environ. Manag. 2012, 95, S260–S264. [Google Scholar] [CrossRef]
  79. Anderson, T.-H.; Domsch, K.H. Ratios of Microbial Biomass Carbon to Total Organic Carbon in Arable Soils. Soil Biol. Biochem. 1989, 21, 471–479. [Google Scholar] [CrossRef]
  80. Priha, O. Microbial Activities in Soils Under Scots Pine, Norway Spruce and Silver Birch; Hakapaino Oy: Helsinki, Finland, 1999; ISBN 9514016785. [Google Scholar]
  81. Vásquez-Murrieta, M.S.; Govaerts, B.; Dendooven, L. Microbial Biomass C Measurements in Soil of the Central Highlands of Mexico. Appl. Soil Ecol. 2007, 35, 432–440. [Google Scholar] [CrossRef]
  82. Diaz-Ravina, M.; Carballas, T.; Acea, M.J. Microbial Biomass and Metabolic Activity in Four Acid Soils. Soil Biol. Biochem. 1988, 20, 817–823. [Google Scholar] [CrossRef]
  83. McCulley, R.L.; Burke, I.C. Microbial Community Composition across the Great Plains: Landscape versus Regional Variability. Soil Sci. Soc. Am. J. 2004, 68, 106–115. [Google Scholar] [CrossRef]
  84. Schimel, D.S.; Braswell, B.H.; Holland, E.A.; McKeown, R.; Ojima, D.S.; Painter, T.H.; Parton, W.J.; Townsend, A.R. Climatic, Edaphic, and Biotic Controls over Storage and Turnover of Carbon in Soils. Glob. Biogeochem. Cycles 1994, 8, 279–293. [Google Scholar] [CrossRef] [Green Version]
  85. Gu, Y.; Wang, P.; Kong, C.H. Urease, Invertase, Dehydrogenase and Polyphenoloxidase Activities in Paddy Soil Influenced by Allelopathic Rice Variety. Eur. J. Soil Biol. 2009, 45, 436–441. [Google Scholar] [CrossRef]
  86. Nannipieri, P.; Greco, S.; Ceccanti, B. Ecological Significance of the Biological Activity in Soil. In Soil Biochemistry, 1st ed.; Routledge: Oxfordshire, UK, 1990. [Google Scholar]
  87. Zhang, Z.; Liew, C.W.; Handy, D.E.; Zhang, Y.; Leopold, J.A.; Hu, J.; Guo, L.; Kulkarni, R.N.; Loscalzo, J.; Stanton, R.C. High Glucose Inhibits Glucose-6-phosphate Dehydrogenase, Leading to Increased Oxidative Stress and Β-cell Apoptosis. FASEB J. 2010, 24, 1497–1505. [Google Scholar] [CrossRef] [Green Version]
  88. Salazar, S.; Sánchez, L.E.; Alvarez, J.; Valverde, A.; Galindo, P.; Igual, J.M.; Peix, A.; Santa-Regina, I. Correlation among Soil Enzyme Activities under Different Forest System Management Practices. Ecol. Eng. 2011, 37, 1123–1131. [Google Scholar] [CrossRef]
  89. Bing-Cheng, Y.; Dong-Xia, Y.U.E. Soil Microbial and Enzymatic Activities across a Chronosequence of Chinese Pine Plantation Development on the Loess Plateau of China. Pedosphere 2012, 22, 1–12. [Google Scholar]
  90. Chodak, M.; Niklińska, M. Effect of Texture and Tree Species on Microbial Properties of Mine Soils. Appl. Soil Ecol. 2010, 46, 268–275. [Google Scholar] [CrossRef]
  91. Moeskops, B.; Buchan, D.; Sleutel, S.; Herawaty, L.; Husen, E.; Saraswati, R.; Setyorini, D.; de Neve, S. Soil Microbial Communities and Activities under Intensive Organic and Conventional Vegetable Farming in West Java, Indonesia. Appl. Soil Ecol. 2010, 45, 112–120. [Google Scholar] [CrossRef]
  92. Romero, E.; Fernández-Bayo, J.; Díaz, J.M.C.; Nogales, R. Enzyme Activities and Diuron Persistence in Soil Amended with Vermicompost Derived from Spent Grape Marc and Treated with Urea. Appl. Soil Ecol. 2010, 44, 198–204. [Google Scholar] [CrossRef]
  93. Zhao, B.; Chen, J.; Zhang, J.; Qin, S. Soil Microbial Biomass and Activity Response to Repeated Drying–Rewetting Cycles along a Soil Fertility Gradient Modified by Long-Term Fertilization Management Practices. Geoderma 2010, 160, 218–224. [Google Scholar] [CrossRef]
  94. Zhang, N.; Xing-Dong, H.E.; Yu-Bao, G.A.O.; Yong-Hong, L.I.; Hai-Tao, W.; Di, M.A.; Zhang, R.; Yang, S. Pedogenic Carbonate and Soil Dehydrogenase Activity in Response to Soil Organic Matter in Artemisia Ordosica Community. Pedosphere 2010, 20, 229–235. [Google Scholar] [CrossRef]
  95. Chu, F.; Lidstrom, M.E. XoxF Acts as the Predominant Methanol Dehydrogenase in the Type I Methanotroph Methylomicrobium Buryatense. J. Bacteriol. 2016, 198, 1317–1325. [Google Scholar] [CrossRef] [PubMed] [Green Version]
  96. Macci, C.; Doni, S.; Peruzzi, E.; Masciandaro, G.; Mennone, C.; Ceccanti, B. Almond Tree and Organic Fertilization for Soil Quality Improvement in Southern Italy. J. Environ. Manag. 2012, 95, S215–S222. [Google Scholar] [CrossRef]
  97. Xie, W.; Zhou, J.; Wang, H.; Chen, X.; Lu, Z.; Yu, J.; Chen, X. Short-Term Effects of Copper, Cadmium and Cypermethrin on Dehydrogenase Activity and Microbial Functional Diversity in Soils after Long-Term Mineral or Organic Fertilization. Agric Ecosyst. Environ. 2009, 129, 450–456. [Google Scholar] [CrossRef]
  98. Tejada, M.; García-Martínez, A.M.; Gómez, I.; Parrado, J. Application of MCPA Herbicide on Soils Amended with Biostimulants: Short-Time Effects on Soil Biological Properties. Chemosphere 2010, 80, 1088–1094. [Google Scholar] [CrossRef]
  99. Ghorbani, M.; Amirahmadi, E.; Konvalina, P.; Moudrý, J.; Kopecký, M.; Hoang, T.N. Carbon Pool Dynamic and Soil Microbial Respiration Affected by Land Use Alteration: A Case Study in Humid Subtropical Area. Land 2023, 12, 459. [Google Scholar] [CrossRef]
  100. Xiang, S.-R.; Doyle, A.; Holden, P.A.; Schimel, J.P. Drying and Rewetting Effects on C and N Mineralization and Microbial Activity in Surface and Subsurface California Grassland Soils. Soil Biol. Biochem. 2008, 40, 2281–2289. [Google Scholar] [CrossRef]
  101. Gajda, A.M. Effect of Different Tillage Systems on Some Microbiological Properties of Soils under Winter Wheat. Int. Agrophys. 2008, 22, 201–208. [Google Scholar]
  102. Benbi, D.K.; Boparai, A.K.; Brar, K. Decomposition of Particulate Organic Matter Is More Sensitive to Temperature than the Mineral Associated Organic Matter. Soil Biol. Biochem. 2014, 70, 183–192. [Google Scholar] [CrossRef]
  103. Cambardella, C.A.; Gajda, A.M.; Doran, J.W.; Wienhold, B.J.; Kettler, T.A.; Lal, R. Estimation of Particulate and Total Organic Matter by Weight Loss-on-Ignition. In Assessment Methods for Soil Carbon; CRC Press: Boca Raton, FL, USA, 2001; pp. 349–359. [Google Scholar]
  104. Garcia-Pausas, J.; Casals, P.; Camarero, L.; Huguet, C.; Sebastia, M.-T.; Thompson, R.; Romanya, J. Soil Organic Carbon Storage in Mountain Grasslands of the Pyrenees: Effects of Climate and Topography. Biogeochemistry 2007, 82, 279–289. [Google Scholar] [CrossRef]
  105. Zhu, G.; Shangguan, Z.; Hu, X.; Deng, L. Effects of Land Use Changes on Soil Organic Carbon, Nitrogen and Their Losses in a Typical Watershed of the Loess Plateau, China. Ecol. Indic. 2021, 133, 108443. [Google Scholar] [CrossRef]
  106. Elliott, E.T.; Palm, C.A.; Reuss, D.E.; Monz, C.A. Organic matter contained in soil aggregates from a tropical chronosequence: Correction for sand and light fraction. Agric. Ecosyst. Environ. 1991, 34, 443–451. [Google Scholar] [CrossRef]
  107. Bongiovanni, M.D.; Lobartini, J.C. Particulate Organic Matter, Carbohydrate, Humic Acid Contents in Soil Macro-and Microaggregates as Affected by Cultivation. Geoderma 2006, 136, 660–665. [Google Scholar] [CrossRef]
  108. Udom, B.E.; Ogunwole, J.O. Soil Organic Carbon, Nitrogen, and Phosphorus Distribution in Stable Aggregates of an Ultisol under Contrasting Land Use and Management History. J. Plant Nutr. Soil Sci. 2015, 178, 460–467. [Google Scholar] [CrossRef]
  109. Briedis, C.; de Moraes Sá, J.C.; Caires, E.F.; de Fátima Navarro, J.; Inagaki, T.M.; Boer, A.; Neto, C.Q.; de Oliveira Ferreira, A.; Canalli, L.B.; Dos Santos, J.B. Soil Organic Matter Pools and Carbon-Protection Mechanisms in Aggregate Classes Influenced by Surface Liming in a No-till System. Geoderma 2012, 170, 80–88. [Google Scholar] [CrossRef]
  110. Chen, Y.; Zhang, X.; He, H.; Xie, H.; Yan, Y.; Zhu, P.; Ren, J.; Wang, L. Carbon and Nitrogen Pools in Different Aggregates of a Chinese Mollisol as Influenced by Long-Term Fertilization. J. Soils Sediments 2010, 10, 1018–1026. [Google Scholar] [CrossRef]
  111. Tisdall, J.M.; Oades, J.M. Organic Matter and Water-Stable Aggregates in Soils. J. Soil Sci. 1982, 33, 141–163. [Google Scholar] [CrossRef]
  112. Liao, H.; Long, J.; Li, J. Conversion of Cropland to Chinese Prickly Ash Orchard Affects Soil Organic Carbon Dynamics in a Karst Region of Southwest China. Nutr. Cycl. Agroecosyst. 2016, 104, 15–23. [Google Scholar] [CrossRef]
  113. Delelegn, Y.T.; Purahong, W.; Blazevic, A.; Yitaferu, B.; Wubet, T.; Göransson, H.; Godbold, D.L. Changes in Land Use Alter Soil Quality and Aggregate Stability in the Highlands of Northern Ethiopia. Sci. Rep. 2017, 7, 1–12. [Google Scholar]
  114. Wang, J.; Liu, L.; Qiu, X.; Wei, Y.; Li, Y.; Shi, Z. Contents of Soil Organic Carbon and Nitrogen in Water-Stable Aggregates in Abandoned Agricultural Lands in an Arid Ecosystem of Northwest China. J. Arid Land 2016, 8, 350–363. [Google Scholar] [CrossRef] [Green Version]
  115. Tisdall, J.M. Possible Role of Soil Microorganisms in Aggregation in Soils. Plant Soil 1994, 159, 115–121. [Google Scholar] [CrossRef]
  116. Cao, R.; Chen, L.; Hou, X.; Lu, X.; Li, H. Nitrogen addition reduced carbon mineralization of aggregates in forest soils but enhanced in paddy soils in South China. Ecol. Process. 2021, 10, 45. [Google Scholar] [CrossRef]
  117. Dorji, T.; Field, D.J.; Odeh, I.O.A. Soil Aggregate Stability and Aggregate-associated Organic Carbon under Different Land Use or Land Cover Types. Soil Use Manag 2020, 36, 308–319. [Google Scholar] [CrossRef]
  118. Debasish-Saha; Kukal, S.S.; Bawa, S.S. Soil organic carbon stock and fractions in relation to land use and soil depth in the degraded shiwaliks hills of lower himalayas. Land Degrad. Dev. 2014, 25, 407–416. [Google Scholar] [CrossRef]
  119. Li, X.-G.; Li, F.-M.; Zed, R.; Zhan, Z.-Y. Soil Physical Properties and Their Relations to Organic Carbon Pools as Affected by Land Use in an Alpine Pastureland. Geoderma 2007, 139, 98–105. [Google Scholar] [CrossRef]
  120. Six, J.; Elliott, E.T.; Paustian, K. Soil Macroaggregate Turnover and Microaggregate Formation: A Mechanism for C Sequestration under No-Tillage Agriculture. Soil Biol. Biochem. 2000, 32, 2099–2103. [Google Scholar] [CrossRef]
  121. Chidozie, E.I.; Ifeanyi, I.F.; Johnbosco, O.M.; Onyekachi, I.A.; Anthony, C.C.; Obinna, O.M.; Glory, M.O. Assessment of Hydraulic Conductivity and Soil Quality of Similar Lithology under Contrasting Landuse and Land Cover in Humid Tropical Nigeria. Soil Environ. 2019, 38, 75–80. [Google Scholar] [CrossRef]
Figure 1. Distribution of sampling sites in different ecosystems of NHR.
Sustainability 15 05520 g001
Figure 2. Soil-carbon pools under different ecosystems of NHR. The figure represents the effect of land-use change on water-soluble organic carbon (WSOC) mg kg−1, water-soluble carbohydrates (WSC) mg kg−1, dehydrogenase μg TPF g−1day−1, microbial biomass carbon (MBC) mg kg−1, and microbial biomass nitrogen (MBN) mg kg−1 in different ecosystems of the Nilgiri Hill Region (NHR). Histograms with distinct letters are significantly different (p < 0.01) according to DMRT. At depths between 0–15 cm and 15–30 cm, there was a slight drop in WSC in EF, FP, and CL compared to DF, SL, and TP.
Sustainability 15 05520 g002
Figure 3. Aggregate-size organic carbon (ASOC) (g kg−1) in NHR. The figure represents the effect of land-use change on aggregate-size organic carbon (ASOC) ((2 mm), (0.25 mm), (0.053 mm), and (<0.053 mm)) (g kg−1) under different ecosystems in Nilgiri Hill Region (NHR). Histograms with distinct letters are significantly different (p < 0.01) according to DMRT.
Sustainability 15 05520 g003
Figure 4. Distribution of total organic carbon and carbon pools under different ecosystems in NHR. The correlation values with * = significant correlations. Significant codes: 0 “***’ 0.001 ‘**’ 0.01 ‘*’ 0.05 ‘.’ 0.1 ‘ ’ 1). Water-soluble organic carbon (WSOC) mg kg−1; water-soluble carbohydrates (WSC) mg kg−1; dehydrogenase (μg TPF g−1day−1); microbial biomass carbon (MBC) (mg kg−1); microbial biomass nitrogen (MBN) (mg kg−1); aggregate-size organic carbon (ASOC) (2 mm, 0.25 mm, 0.053 mm, <0.053 mm) g kg−1.
Sustainability 15 05520 g004
Figure 5. Principal component analysis of carbon pools indifferent ecosystems in NH. The PCA depicts the impact of land-use change on soil-carbon status. ASOC (2 mm), TOC, dehydrogenase, MSC, WSCarb, and WSC accounted for 58.7% of variability, whereas the ASOC (0.25 mm, 0.053 mm, <0.053 mm) contributed 13.9% of variability among the different ecosystems in NHR. The principal components (1 and 2) with variable clustering at the left end of the biplot make the evergreen and deciduous forest unique, due to its high concentration of TOC and carbon pools. In both dimensions (1 and 2), the cropland and tea plantation with minimal TOC and carbon pools were far away from the evergreen and deciduous-forest ecosystems. Total organic carbon (TOC), water-soluble organic carbon (WSC), water-soluble carbohydrates (WS Carb), microbial biomass carbon (MBC), microbial biomass nitrogen (MBN), aggregate-size organic carbon (ASOC) (2 mm, 0.25 mm, 0.053 mm, <0.053 mm).
Sustainability 15 05520 g005
Table 1. Total organic carbon (TOC) (g kg−1) of soil in different ecosystems in NHR.
EcosystemSoil Depth
0–15 cm15–30 cm30–45 cm
Evergreen forest102.53 a
(63.22–156.72)
80.80 a
(51.97–136.30)
72.85 a
(35.62–103.40)
Deciduous forest71.55 b
(53.56–110.90)
57.57 b
(41.33–94.45)
41.68 b
(29.22–64.12)
Scrubland56.59 d
(35.31–90.56)
43.53 c
(22.33–83.55)
29.38 c
(10.36–68.87)
Forest plantation64.40 c
(39.22–96.49)
49.34 c
(24.44–76.84)
32.85 c
(11.65–59.86)
Tea plantation31.90 e
(13.00–54.89)
25.98 d
(11.55–50.58)
13.65 d
(5.95–38.72)
Cropland25.61 e
(18.94–47.03)
20.97 d
(13.66–35.13)
8.80 d
(1.82–24.70)
Mean58.76
(37.21–92.77)
46.37
(27.55–79.48)
33.20
(15.77–59.95)
The data represent the mean and range of total organic carbon (TOC) under different ecosystems in Nilgiri Hill Region (NHR). The values in the same column followed by different letters are significantly different. Duncan’s multiple-range test (DMRT) was used to compare the means and significance of the mean variations between ecosystems. The statistical significance was determined at p < 0.01.
Table 2. Land-degradation indices (LDIs) of different ecosystems in NHR.
Land-Degradation Index
S. NoEcosystem0–15 cm15–30 cm30–45 cmMean
1Evergreen0.000.000.000.00
2Deciduous−30.21−28.75−42.78−33.91
3Scrub−44.81−46.12−59.67−50.20
4Forest Plantation−37.19−38.94−54.91−43.68
5Tea Plantation−68.89−67.85−81.27−72.67
6Crop Land−75.02−74.04−87.93−79.00
Total organic carbon was used to calculate the land-degradation indices. The evergreen ecosystem, which had the highest total organic carbon, was chosen as a reference ecosystem. Negative values in each ecosystem indicate their vulnerability to land-use change.
Disclaimer/Publisher’s Note: The statements, opinions and data contained in all publications are solely those of the individual author(s) and contributor(s) and not of MDPI and/or the editor(s). MDPI and/or the editor(s) disclaim responsibility for any injury to people or property resulting from any ideas, methods, instructions or products referred to in the content.

