Passengers’ Intentions to Use Public Transport during the COVID-19 Pandemic: A Case Study of Bangkok and Jakarta


Department of Civil Engineering, Faculty of Engineering, Chulalongkorn University, Phyathai Road, Wangmai, Pathumwan, Bangkok 10330, Thailand
*
Author to whom correspondence should be addressed.
Sustainability 2023, 15(6), 5273; https://doi.org/10.3390/su15065273
Submission received: 21 February 2023
/
Revised: 10 March 2023
/
Accepted: 11 March 2023
/
Published: 16 March 2023
(This article belongs to the Section Sustainable Transportation)
Abstract
:Several problems have arisen due to the COVID-19 pandemic, particularly in the public transportation sector. Data from 2021 show that the number of bus passengers in Bangkok has decreased by 40–60% below normal conditions, and the number of bus passengers in Jakarta has decreased by around 76% compared to June 2019. In the new normal period, public transport is required to implement strict health protocols in its operations. This paper aims to evaluate potential indicators underlying the intention to use public transport during a pandemic. The target groups are public and paratransit buses in Bangkok and Jakarta, two metropolitan areas in ASEAN that have been greatly affected by this pandemic. A total of 400 questionnaires were distributed in each city. The outcome from the structural equation model reveals a relatively similar finding in both cities. Tangibility is one of the five dimensions of service quality that is influential in both cities; this indicator affects the intention to use public transportation in Jakarta (Coeff. = 14.670, p-value < 0.001) and Bangkok (Coeff. = 1.164, p-value < 0.001). In this study, confidence (CO) is significant for the intention to use public transportation in both cities with a coefficient of 0.105 for Bangkok and 0.969 for Jakarta. Furthermore, the health measure indicator (HM) has a significant value on passenger confidence (CO) in using public transportation for both cities (Coeff. = 0.808, p-value = <0.001 in Bangkok and Coeff. = −1.413, p-value = 0.008 in Jakarta). Health measures such as wearing a mask, always washing hands and not traveling if unwell are considered to be the right policies to prevent the spread of the virus during the COVID-19 pandemic. This practical implication can become a core strategy for improving the quality of public transport services in similar cities.
1. Introduction
Coronavirus is one of the major pathogens that primarily targets the human respiratory system [1]. The WHO China Country Office was notified on 31 December 2019, of cases of pneumonia of unknown etiology (unknown cause) discovered in Wuhan City, Hubei Province, China. By 3 January 2020, 44 patients with pneumonia of unknown etiology had been reported to the WHO by the national authorities in China; of the 44 cases, 11 were severely ill, while the remaining 33 patients were stable [2]. In several nations, politicians and public health authorities have spoken with individuals about the urgency of adhering to non-pharmaceutical (non-medical) regulations to stop the virus’ spread [3].
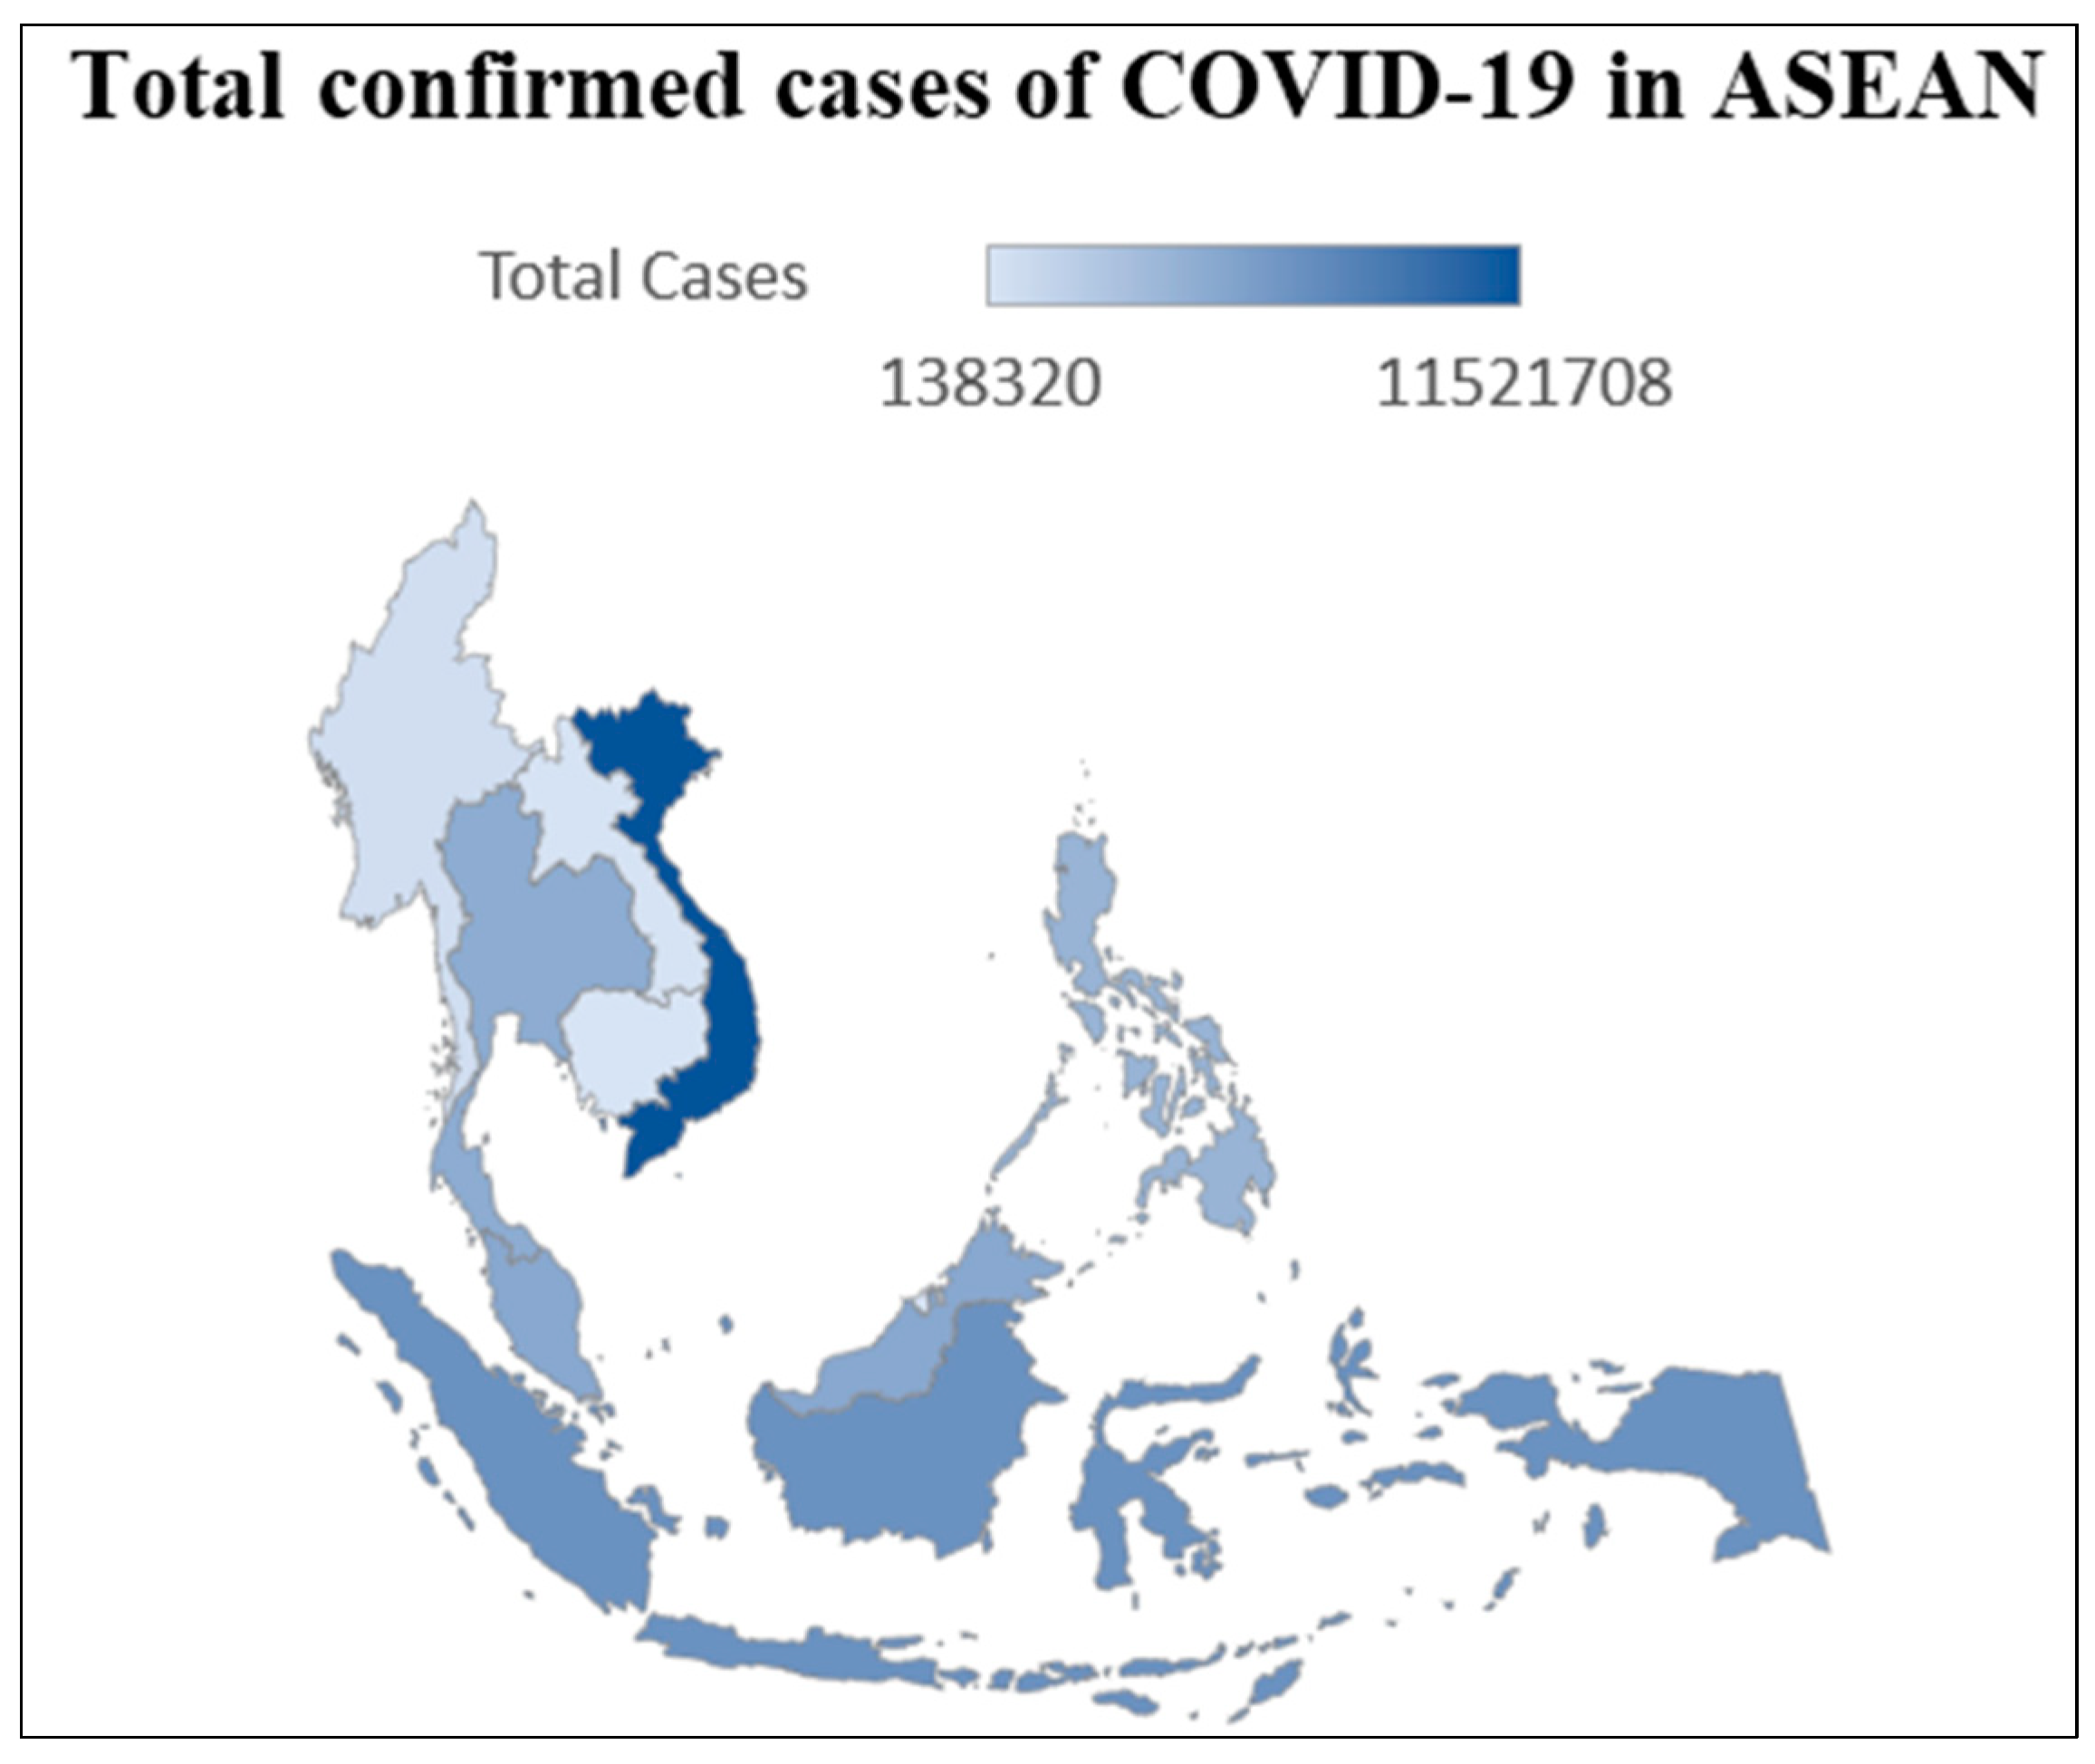
When COVID-19 was declared a global pandemic in February 2020, the Economic Ministers of Association of Southeast Asian Nations (ASEAN) recognized ‘the adverse impacts of the COVID-19 outbreak on the economy, notably including but not limited to the travel and tourism, manufacturing, retail, and other services sectors as well as the disruption of supply chains and the financial markets’ [4]. It is shown in Figure 1 that from February 2020 to December 2022, COVID-19 cases in all ASEAN countries have experienced a significant, continuous increase. Some countries experienced the highest cases in their national capitals, including Jakarta and Bangkok, the capitals of Indonesia and Thailand.
Jakarta is one of the provinces severely affected by COVID-19, with 20% positive cases and 9% deaths nationwide. The capital city of Indonesia is one of the provinces with the highest community transmission rate, indicating a high risk of COVID-19 infection for the general population [6]. Similarly, in Bangkok, the gateway for foreign visitors to Thailand, the first COVID-19 case was detected in January 2020, and the alarming rise in COVID-19 cases there in March 2020 prompted the Thai government to take action [7].
Suppose the new normal was interpreted as everyone coming to work on a schedule, such as conditions before the pandemic; in that case, the capacity of mass public transportation would undoubtedly decrease due to the implementation of social distancing measures. In fact, many people nowadays prefer to switch to private vehicles to avoid the COVID-19 virus because public transportation passengers would be exposed to a large number of individuals with unknown origins and disease histories. Users worry about being unwell and surrounded by potentially infectious people [8].
Captive community groups have no choice but to use public transport, because they do not have private vehicles as an option [9]. Furthermore, public transportation is essential to a region’s economy and must continually adapt to all conditions and policies. Public transportation services during this pandemic must also be adjusted to several health protocols such as the use of face masks, provision of handwashing alcohol, and capacity restrictions with social distancing [10].
Enhancing the quality of public transportation services can potentially address the declining public interest in utilizing this mode of transport. Factors such as reliability, tangibility, responsiveness, assurance, and empathy are considered crucial [11]. Furthermore, in the context of the ongoing pandemic, there is a need to emphasize positive values such as self-confidence, contact tracing applications, adherence to health measures, and social distancing in research related to public transportation use [12]. It is anticipated that improving public transportation services during the pandemic can potentially increase passengers’ intention to resume utilizing this mode of transport.
For some years, social distancing has been practiced in almost all cities and countries, including Jakarta and Bangkok. Public transportation, especially the land transportation in Jakarta, covering the MRT, KRL (Train with electric energy), buses (Trans Jakarta), and minibuses (Angkot), is also implementing similar measures to overcome the spread of the COVID-19 virus [13]. One step ahead of Jakarta, Bangkok also has its way of handling the spread of this virus in many public transport modes, such as temperature checkpoints when entering the BTS and MRT stations [14]. Other indicators are similar to those implemented in Jakarta, i.e., using masks and social distancing.
Public transport agencies and the person in charge of transportation decided to take some corrective actions, some of which were well received by the passengers. Furthermore, most of these were reduced capacity measures, resulting in a potential decline in service levels [11]. Consequently, these measures make passengers feel safe and confident. This paper aims to identify effective COVID-19 policy actions that meet public health criteria and increase travel safety. The research questions are:
- How significant is the service quality variable on passengers’ intention to use public transportation during a pandemic?
- What are the effective countermeasures that could contribute to passenger confidence in using public transport during a pandemic?
The outline in this paper is as follows. Section 2 contains a literature review regarding the impact of the COVID-19 pandemic on the usage of public transportation and their intention to return to public transportation during this pandemic. Next, Section 3 describes the materials and methodology applied in this study, such as research hypotheses, conceptual models, sample collection, questionnaire development, and data analysis tools. Section 4 discusses the results of data collection, statistical analysis, and structural equation models. Section 5 discusses the findings of this study, such as the effect of service quality on the intention to use public transportation, passenger perceptions of implementing social distancing, and passenger trust in using public transport. Lastly, Section 6 concludes the findings of this study.
2. Literature Review
2.1. Impact of Public Transport during the COVID-19 Pandemic
As a result of global travel restrictions, the transportation sector is crucial due to reduced mobility in various sectors of the transportation industry, which reduces demand. Travel restrictions established to halt the transmission of COVID-19 have resulted in a significant decrease in traffic across the country [15]. China, Iran, and the United States faced a drop in passenger ridership during the lockdown of up to 80–90% in major cities, while public transport ridership in the United Kingdom decreased by 70% [16].
The public transport sector was severely affected by COVID-19 [15]. Passengers are still reluctant to use public transportation, and there is a greater level of anxiety about the hygiene of public transit than before COVID. According to Mogaji [17], with the implementation of the lockdown due to the pandemic in Lagos, Nigeria, the transportation sector must take three steps to overcome this negative impact: avoid, shift, and improve. Besides buses, paratransit vehicles also serve as a means of public transportation in several African towns. Many of Ghana’s public transit hubs are overcrowded and poorly designed, with little room for waiting passengers or passing vehicles [18].
The Bangkok Mass Transit Authority (BMTA) operates bus, minibus, songthaew, and van services in Bangkok. The services included a total of 6484 buses [19]. In addition, the rail-based transportation in Bangkok includes the Mass Rapid Transit (MRT) Blue Line and Purple Line, Airport Rail Link (ARL), Bangkok Mass Transit System (BTS), and the Suburban Mass Transit System (SRT) Red Lines [20]. In Jakarta, bus public transportation services are run by Trans Jakarta, which operates a total of 4079 fleet units, consisting of articulated buses, single buses, maxi buses, double-decker buses, medium buses, and small buses mainly serving 13 corridors [21]. The rail-based transport in Jakarta consists of the KRL Commuter Line, Airport Train Railink, Mass rapid transit (MRT), and light rail transit (LRT) [22].
In Bangkok, Thailand, public transportation was greatly affected by the pandemic and its control policies. The 2021 data indicated that the number of bus passengers (Bangkok Mass Transit Authority) in Bangkok decreased to 40–60% below normal levels [20]. A similar situation also occurred in Jakarta, Indonesia, where bus passengers (Trans Jakarta) decreased by up to 76% below normal due to restrictions during the pandemic [23].
As a result of the widespread panic caused by the COVID-19 outbreak, public transportation providers have seen a precipitous drop in total passengers and revenue. As such, public transport is vulnerable to disruptions and shocks due to the pandemic [24]. During this pandemic, it is undeniable that there has been more use of private vehicles than before the pandemic because commuters are afraid of meeting other people and being infected in public transportation [8]. Therefore, policies must overcome people’s increasing intention to use public transportation during a pandemic. Implementing social distancing is a fundamental step in the public transportation system during this period. To maintain a certain level of social distance, it is important to effectively control demand such that the percentage of occupied vehicles remains below that threshold, both in terms of location and time [25]. Thus, an understanding of potential variables that affect the spread of the disease to the public can better provide an increased awareness of the transmission of the COVID-19 virus [26].
2.2. Service Quality of Public Transport
The customer’s perspective on the quality of service provided is crucial in the highly competitive service sector [27]. The level of service offered, often known as SERVQUAL, is a key indicator of customer satisfaction. This notion has already been used in various service sectors, including mobile banking, health management, telecommunications, online education, hospitality, and tourism. In the service sector, after-sale support is one of the potential indicators of SERVQUAL [11]. Moreover, considerable attention has been given to its conceptualization and measurement scales [28].
Based on Parasuraman [29], there are ten comprehensive dimensions of service quality, i.e., tangibility, reliability, responsiveness, understanding the customers, access, communication, credibility, security, competence, and courtesy. These dimensions were later refined into five dimensions: tangibility, reliability, responsiveness, assurance, and empathy. Academics, researchers, and practitioners in numerous sectors widely acknowledge the SERVQUAL scale [30], providing a complete measurement scale with practical consequences for customers’ perceived service quality [29]. Wu and Ko [31] emphasized that SERVQUAL offers a general guideline for assessing service quality by including several dimensions and context; however, the service quality dimensions must be researched and examined separately to incorporate various issues.
Service quality is customer satisfaction with various attributes, including transfer environment, accessibility, directions, safety, security, public utility, and convenience [32]. Currently, public transportation must adjust the quality of its services due to the pandemic by including some related indicators related to handling the spread of the virus [32]. Since the purpose of SERVQUAL is to evaluate the quality of service provided by businesses and to increase customer satisfaction, there is a need to consider the new normal living situation to create a foundation for how businesses should be adequately managed during the COVID-19 pandemic [11].
The policies implemented by public transportation during this pandemic limit passenger capacity and encourage the use of masks; this has been proven to minimize the risk of COVID-19 transmission significantly [33]. Moreover, operators of public transportation hubs provide mobile handwashing facilities and hand sanitizer dispensers at locations near platforms and trains [12]. Public areas on trains and stations are also routinely sanitized after each journey, in the meantime, as part of the company’s efforts to provide better service during the COVID-19 outbreak [34]. Being desensitized in public areas causes a customer to fear transmission of the COVID-19 virus and makes them reluctant to use public transport [35].
2.3. Intention to Use Public Transport during the Pandemic
A better service quality provided by public transport operator results not only in users’ satisfaction, but also more intention to use the service [36]. This intention can be derived from some influencing variables, such as the SERVQUAL technique’s five variables (reliability, responsiveness, empathy, assurance, and tangibility). Previous studies have shown that the perception of value, rather than satisfaction or quality, is a more reliable indicator of future purchase intent. For instance, a study proposed by Jen and Hu [37] demonstrated that passengers’ behavioral intentions are significantly influenced by perceived value. Likewise, service quality is observed to have a favorable effect on passenger satisfaction. Yilmaz and Ari [38] investigated the relationship between service quality, image, satisfaction, complaints, and passenger reuse intentions. The results revealed a significant effect of service quality and corporate image on customer satisfaction, leading to passenger loyalty. In a similar line of research, Chou and Kim [39] found that service quality positively impacts customer satisfaction and future reuse intentions. The service quality was found to be an important factor in increasing passenger intention to reuse. This technique basically determines the value of user satisfaction, but in other cases, it can be used to identify the user’s intention to use public transportation [39]. Past research can be summarized in Table 1.
According to Chuenyindee [39], the results in the Philippines revealed influential variables, including tangibility and assurance. Furthermore, the intention to use public transport during this pandemic was influenced by the confidence of public transport users, similar to Vichiensan et al. [12] on rail-based transport in Bangkok. The variables of health measures and tracing apps influence rail transportation usage during a pandemic. Lastly, social distancing widely existed in public transportation during this pandemic, aiming to reduce the spread of the virus by providing a distance between passengers ranging from one to two meters [40].
3. Material and Methodology
3.1. Research Hypotheses
The variables that support the research questions in this study are taken as hypotheses aiming for a causal relationship for public transport users. These variables include reliability, tangibility, responsiveness, assurance, empathy, confidence, tracing apps, health measures, and social distancing.
3.1.1. Reliability
Service reliability reflects the ability of transit to depart and arrive on time [46]. Service reliability is regarded as the trust of passengers and users in bus services, indicating the intention to use public transportation. The operators’ ability to handle everything that can hinder the implementation of services will affect the intention to use them, which will positively impact them [47].
Hypothesis 1 (H1).
Reliability (RL) has a significant positive effect on public transport user Intention.
3.1.2. Tangibility
Significant signs include interior space, cleanliness, comfort, temperature, scent, vibrations, sounds, the visibility of the signboard, and the driver’s appearance. In Philippines, tangibles significantly affected service quality [40]. In Jakarta, Zahra et al. [48] argued that if the physical appearance, completeness, and communication of transport staff or drivers are good, then it will positively affect the intentions of public transport users.
Hypothesis 2 (H2).
Tangibility (TA) has a significant positive effect on public transport user Intention.
3.1.3. Responsiveness
Passengers who positively perceive service quality will have a higher chance of positive purchase intention [49]. A customer is more likely to be pleased with a catered service if the service provider is attentive to their needs [39]. This finding is also in line with the support of other studies regarding the significant influence of perceived service quality dimensions on customer purchase intentions [50].
Hypothesis 3 (H3).
Responsiveness (RE) has a significant positive effect on public transport user intention.
3.1.4. Assurance
Assurance refers to travel safety and knowledge with courtesy of employees and their ability to inspire and convey trust [51]. Passengers feel safe when they have suitable travel insurance during their travel. The operator’s knowledge and driving behavior give customers trust and confidence to feel safe using public transport. In a similar opinion by Sam et al. [52], the guarantee is one of the important factors in the quality of bus transportation services in Ghana.
Hypothesis 4 (H4).
Assurance (AS) has a significant positive effect on public transport user intentions.
3.1.5. Empathy
With the change in lifestyle during the COVID-19 pandemic, the service provided by different sectors has been changing. This behavior also causes changes in empathy in public transportation services, such as the drivers’ and assistants’ behavior in handling passengers [11]. The re-evaluation of the different service sectors was deemed relevant due to the implemented protocols for the new normal [39].
Hypothesis 5 (H5).
Empathy (EM) has a significant positive effect on public transport user intentions.
3.1.6. Confidence
The close relationship between the local government, public transport operators, and security officers regarding the spread of COVID-19 has given users confidence in this pandemic [53]. In Lahore, Pakistan, the intention to utilize public transportation was impacted by COVID-19 attitudes, knowledge, responsibility, and the difficulty of complying with measures such as hand washing and face mask use [49]. Eliminating passenger anxiety and restoring their confidence in public transport after a major safety crisis is greatly important for transport management [54].
Hypothesis 6 (H6).
Confidence (CO) has a significant positive effect on public transport user intentions.
3.1.7. Tracing Apps
A tracking application was used to track people’s health movements during this COVID-19 pandemic. Since its inception in the first month of 2020, COVID-19 has generated several waves, mitigated by various measures to reduce its spread [55]. An effective and practical tracking application increases passenger awareness of COVID-19 and indirectly increases trust in public transportation users in Bangkok [12].
Hypothesis 7 (H7).
Tracing Apps (TR) have a significant positive effect on Confidence (CO).
3.1.8. Health Measures
One of the most effective preventative self-confidence measures related to public health and hygiene includes checking passengers’ temperatures, enforcing the use of face masks, and providing hand sanitizers [12]. The handling of strict health protocols greatly influenced the intention to use public transportation during this pandemic [56].
Hypothesis 8 (H8).
Health Measures (HM) have a significant positive effect on Confidence (CO).
3.1.9. Social Distancing
Jewell et al. [57] utilized data from southern Italy and Hubei province to inform a wide area of differences in factors related to social distancing. Applying social distancing policies in areas with high transmission is more needed than in areas with low transmission [58].
Hypothesis 9 (H9).
Social Distancing (SD) has a significant positive effect on public transport user intention.
The research hypotheses and their a priori effects can be summarized in Table 2, combining the service quality variable with those related to the prevention of the COVID-19 pandemic.
3.2. Sample and Data Collection
The respondents in this study were passengers using public buses. The survey was targeted in many transportation terminals, which are centers of integration among public transport modes. In Jakarta, the surveys were administered at Kampung Rambutan Terminal, Lebak Bulus Terminal, and Sudirman. Similarly, the surveys in Bangkok were conducted at Siam, Victory Monument, and Mochit in Bangkok. Victory Monument and Mochit in Bangkok, and the Kampung Rambutan Terminal and Lebak Bulus Terminal in Jakarta are locations that are at the center of the road network. They are considered major transport nodes connecting buses with various routes inside and outside the city. In addition, Siam in Bangkok and Sudirman in Jakarta are the city’s central business districts (CBD). In this study, Cochran’s formula (1977) is applied with a 95% confidence level and a margin of error of 5%. The target respondents are 384 per city.
A pilot questionnaire survey was carried out with 30 respondents in Bangkok and 50 respondents in Jakarta. After the pilot surveys, further improvements were made. In the actual surveys, there were 407 respondents in Bangkok and 410 respondents in Jakarta.
3.3. Questionnaire Development
The survey questionnaire was divided into two parts. Part A includes inquiries related to the socioeconomic variables of the respondents, such as gender, age, occupation, education level, personal income (monthly), and the number of cars available. Part B of the questionnaire contains a total of 36 statements related to variables of interest, consisting of reliability (RL), responsiveness (RE), assurance (AS), tangibility (TA), empathy (EM), Intention (IPT and IPC), confidence (CO), health measures (HM), tracing apps (TR), and social distancing (SD). These constructs are based on a five-point Likert scale, i.e., 1 = strongly disagree, 2 = disagree, 3 = neutral, 4 = agree, and 5 = strongly agree. Table 3 presents these 36 statements.
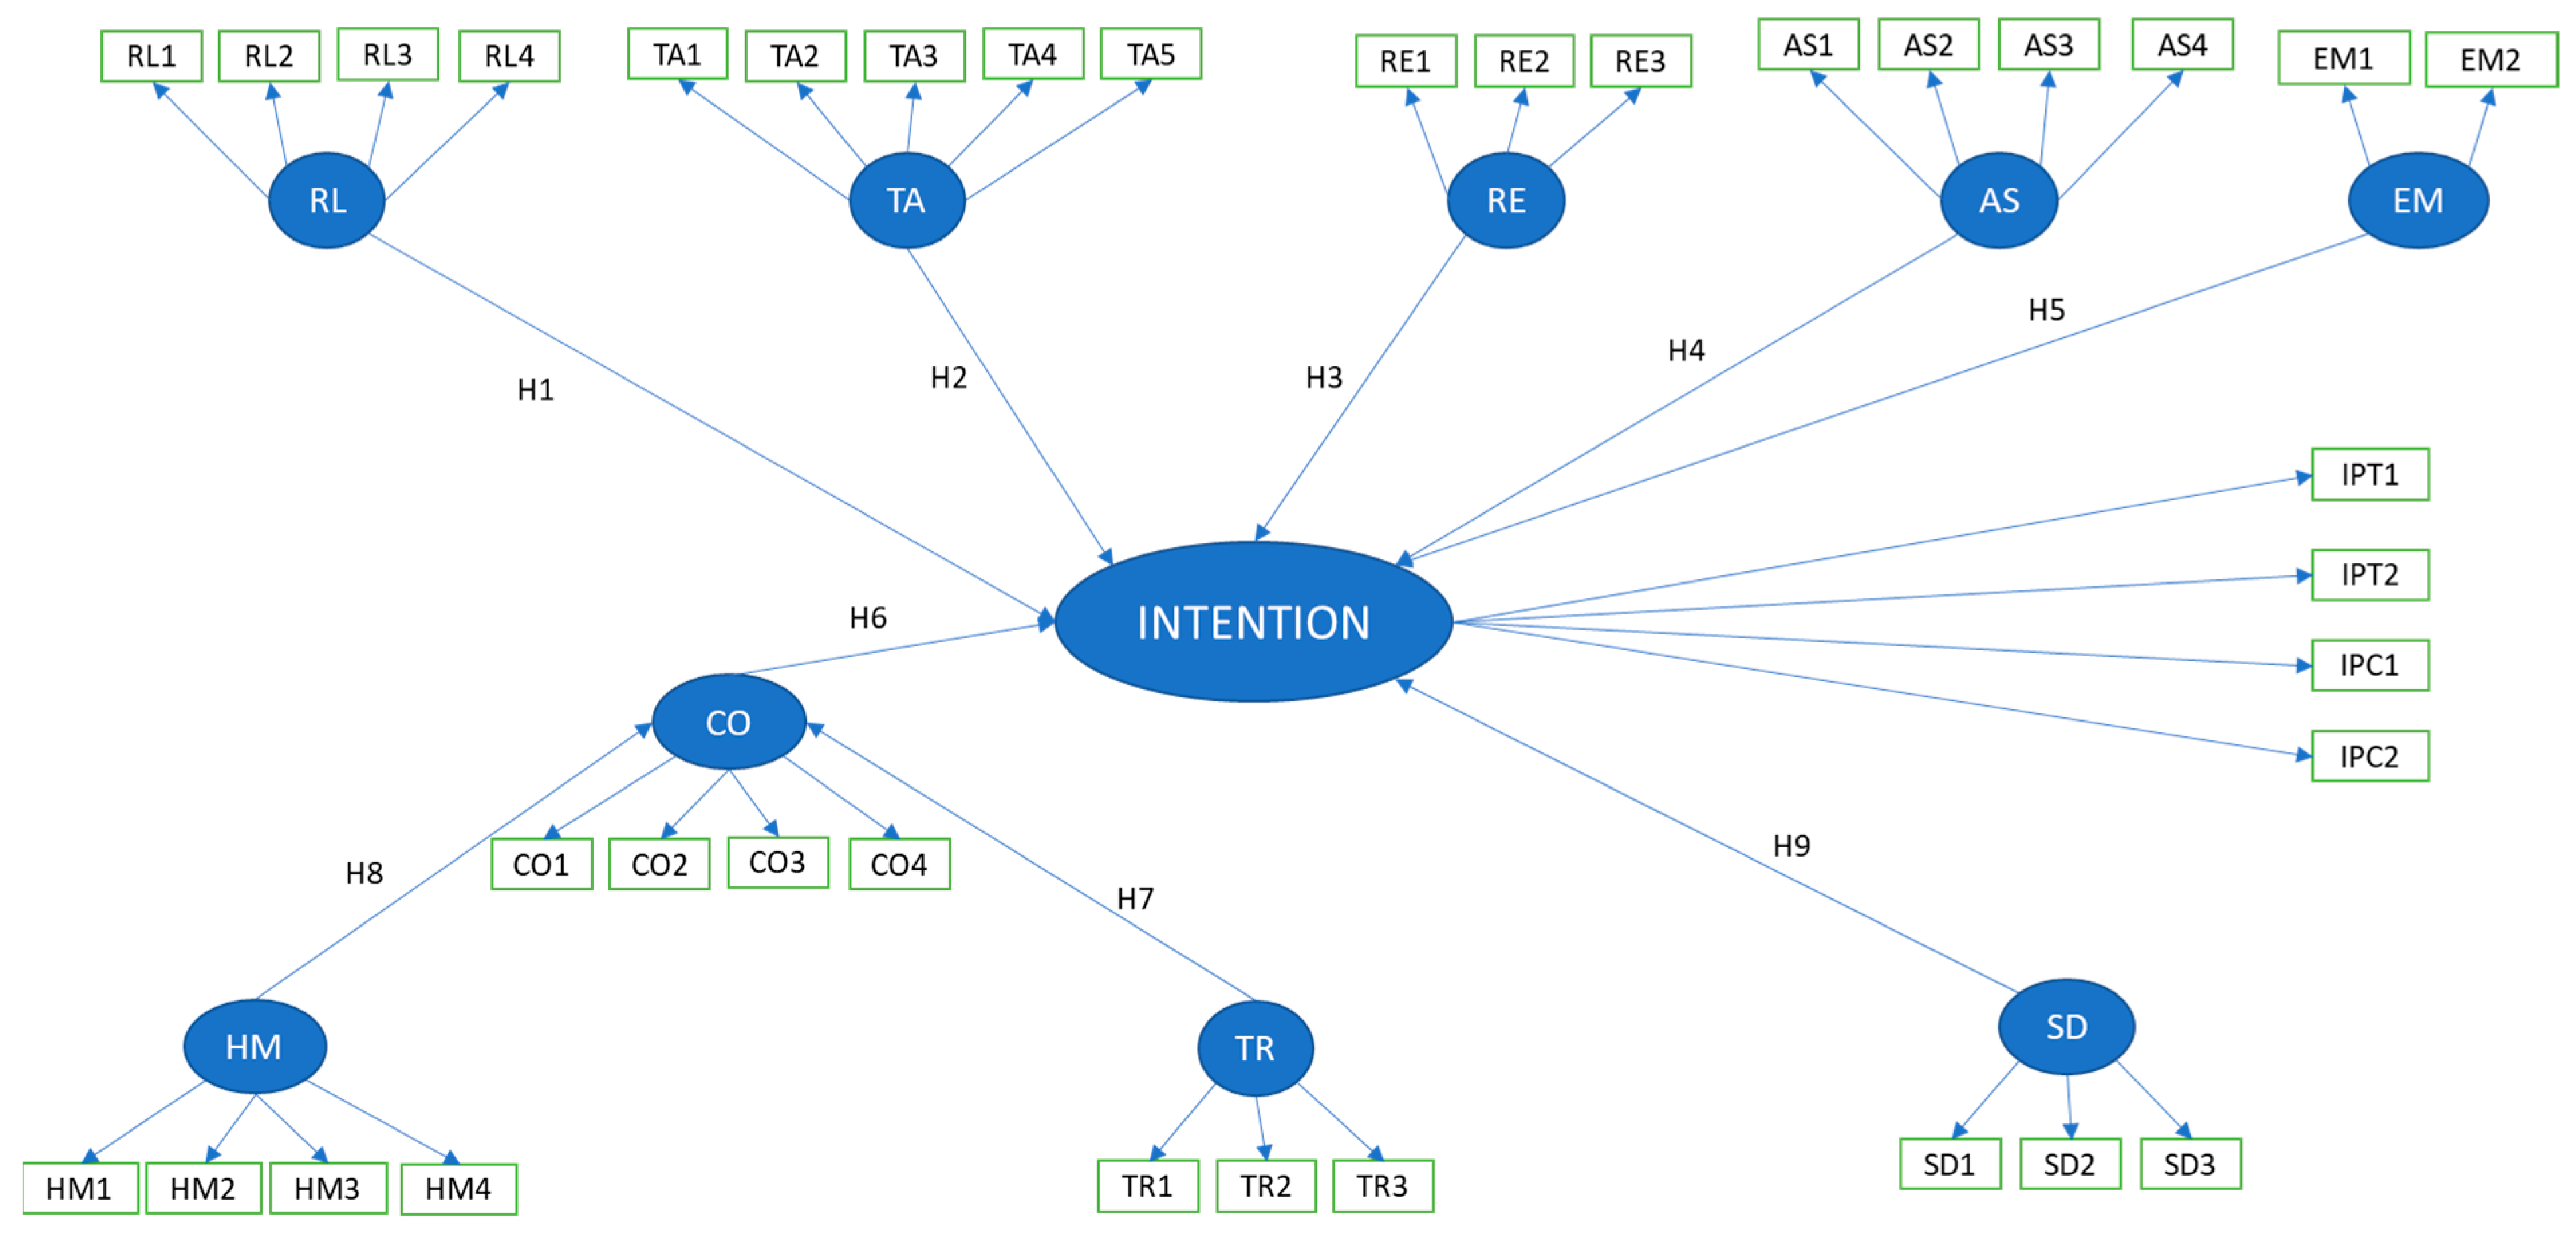
Figure 2 illustrates the study’s conceptual model based on the hypotheses outlined in Section 3.1. The proposed model focuses on the intention as its goal with five service quality variables: reliability (RL), tangibility (TA), responsiveness (RE), assurance (AS), and empathy (EM). Furthermore, in the service quality variable, variables related to health and policies for handling the transmission of the COVID-19 virus, such as confidence (CO), health measures (HM), tracing apps (TR), and social distancing (SD) are incorporated. Thus, the findings from the proposed model would review how these variables are related to the intention to use public transportation during this pandemic. The model is applied to both Jakarta and Bangkok datasets.
3.4. Methodology and Tools for Data Analysis
Structural Equation Modeling (SEM) analysis is utilized as a statistical tool to perform multivariate analysis in the present study. The process of handling SEM data is distinguishable from processing regression data and involves both measurement and structural models. In SEM, three tasks are performed simultaneously, namely, confirming the instrument’s reliability and validity (confirmatory factor analysis), assessing the relationship model between variables (path analysis), and constructing a suitable predictive model (structural model analysis and regression analysis) [70].
The IBM SPSS Statistics 27 was utilized for an exploratory factor analysis (EFA) using principal component extraction and varimax factor rotation. The IBM SPSS AMOS 28 was used to conduct a confirmatory factor analysis (CFA) to evaluate the measurement models of the latent variables found by EFA. The composite reliability, Cronbach’s alpha, and the average variance extracted (AVE) are considered for the construct’s validity. Furthermore, to satisfy the requirements of a suitable model in the structural equation model (SEM), a fit measure model is carried out, focusing on the goodness-of-fit index (GFI), incremental fit index (IFI), normed fit index (NFI), adjusted goodness index (AGFI), Tucker-Lewis index (TLI), comparative fitness index (CFI), the minimum value of the difference function with divided degrees of freedom (CMIN/DF), and the root-mean-squared estimate error (RMSEA) [71].
4. Results
4.1. Descriptive Statistics
The survey was conducted from September 2022 to October 2022 using survey teams from local areas in both cities. In total, there were 407 respondents in Bangkok and 410 respondents in Jakarta. Table 4 presents descriptive statistics of respondents’ socioeconomic variables. In Bangkok, most of the respondents work as company staff, with almost all respondents having a bachelor’s level of education, and the average income level is around 10,001–20,001 THB. In contrast, most of those in Jakarta are students with less than IDR 4,000,000 income. Consistently, a majority of the respondents in the two cities had received vaccination twice.
The descriptive statistical analysis of the 1–5 Likert indicators is shown in Table A1 (Appendix A). In general, respondents from both cities give an average score above 3 for all variables. Several variables, such as confidence, health measures, and tracing apps have answers close to 4 and more, meaning that respondents generally possess strong confidence about the health indicators that could significantly impact their public transport usage during the pandemic.
4.2. Validity of the Latent Constructs and Model Fit
In the analysis of the validity of the latent constructs, three indicators are required to meet minimum standards, namely, the composite reliability, Cronbach’s alpha, and the average variation extract (AVE). Composite reliability analysis is the variance due to the factor divided by the total variance of the composite, so the total variance of the sum is divided by the variation due to the factor. The average variance extract (AVE) is approximately the average of the scale indicator reliability estimates. Table 5 reveals that the composite reliability values for the two cities are above the minimum limit of 0.6. The Cronbach’s alpha value is also acceptable since it is above the minimum limit value of 0.7. Finally, the average variation extract (AVE) value of all variables from the two cities is also acceptable as it has a minimum value above 0.5 [72].
Table 6 presents the model fit results based on several indices, including the goodness of fit index (GFI) test, adjusted goodness of fit index (AGFI), Tucker-Lewis’ index (TLI), comparative fit index (CFI), incremental fit index (IFI), normed fit index (NFI), minimum discrepancy function divided by degrees of freedom (CMIN/DF), and root-mean-square error of approximation (RMSEA). All values were found acceptable and meet the requirements.
4.3. Structural Equation Modeling Results
The estimated path coefficients for the two cities are shown in Table 7. The study results show the statistical significance of several service quality indicators. It can be seen that Hypothesis 1 (H1) has no effect in Bangkok but has a statistically significant impact in Jakarta, implying that respondents in Bangkok do not pay much attention to reliability in determining their intention to use public transportation. Hypothesis 2 (H2) related to tangibility, i.e., the cleanliness and appearance of the vehicle, significantly affects the intention to use public transport for respondents in both Bangkok and Jakarta. Hypothesis 3 (H3), which includes the ease of finding and using public transportation, significantly affects the intention to use public transport in Bangkok. However, this variable has no effect in Jakarta. Furthermore, for hypothesis 4 (H4), which is related to assurance, a statistically significant path occurs for Bangkok but not for Jakarta. One of the plausible reasons is that the respondent feels that security is not a major concern in using public transportation. The Empathy variable in Hypothesis 5 (H5) was also found differently in the two cities. In Jakarta, the attitude of the driver and his assistant is an important factor influencing the intention to use public transport, which is not the case in Bangkok.
Furthermore, Hypotheses 6–9 are indicators of countermeasures and policies due to the COVID-19 pandemic. Hypothesis 6 (H6) shows beliefs regarding comfort and a sense of security from a pandemic when using public transportation, which are clear indicators in Bangkok and Jakarta. Hypotheses 7 and 8 are indicators that are related to confidence in using public transportation. In Hypothesis 7 (H7), tracing apps do not affect people’s intentions to use public transport in Bangkok, but they do in Jakarta. Furthermore, both cities agree that health measures such as using masks and constantly washing hands with sanitizer can affect their intention to use public transportation, as shown in Hypothesis 8 (H8). Finally, social distancing in hypothesis 9 (H9) has no effect in Bangkok, but it is found to be influential for the respondents in Jakarta in reducing contact with other passengers.
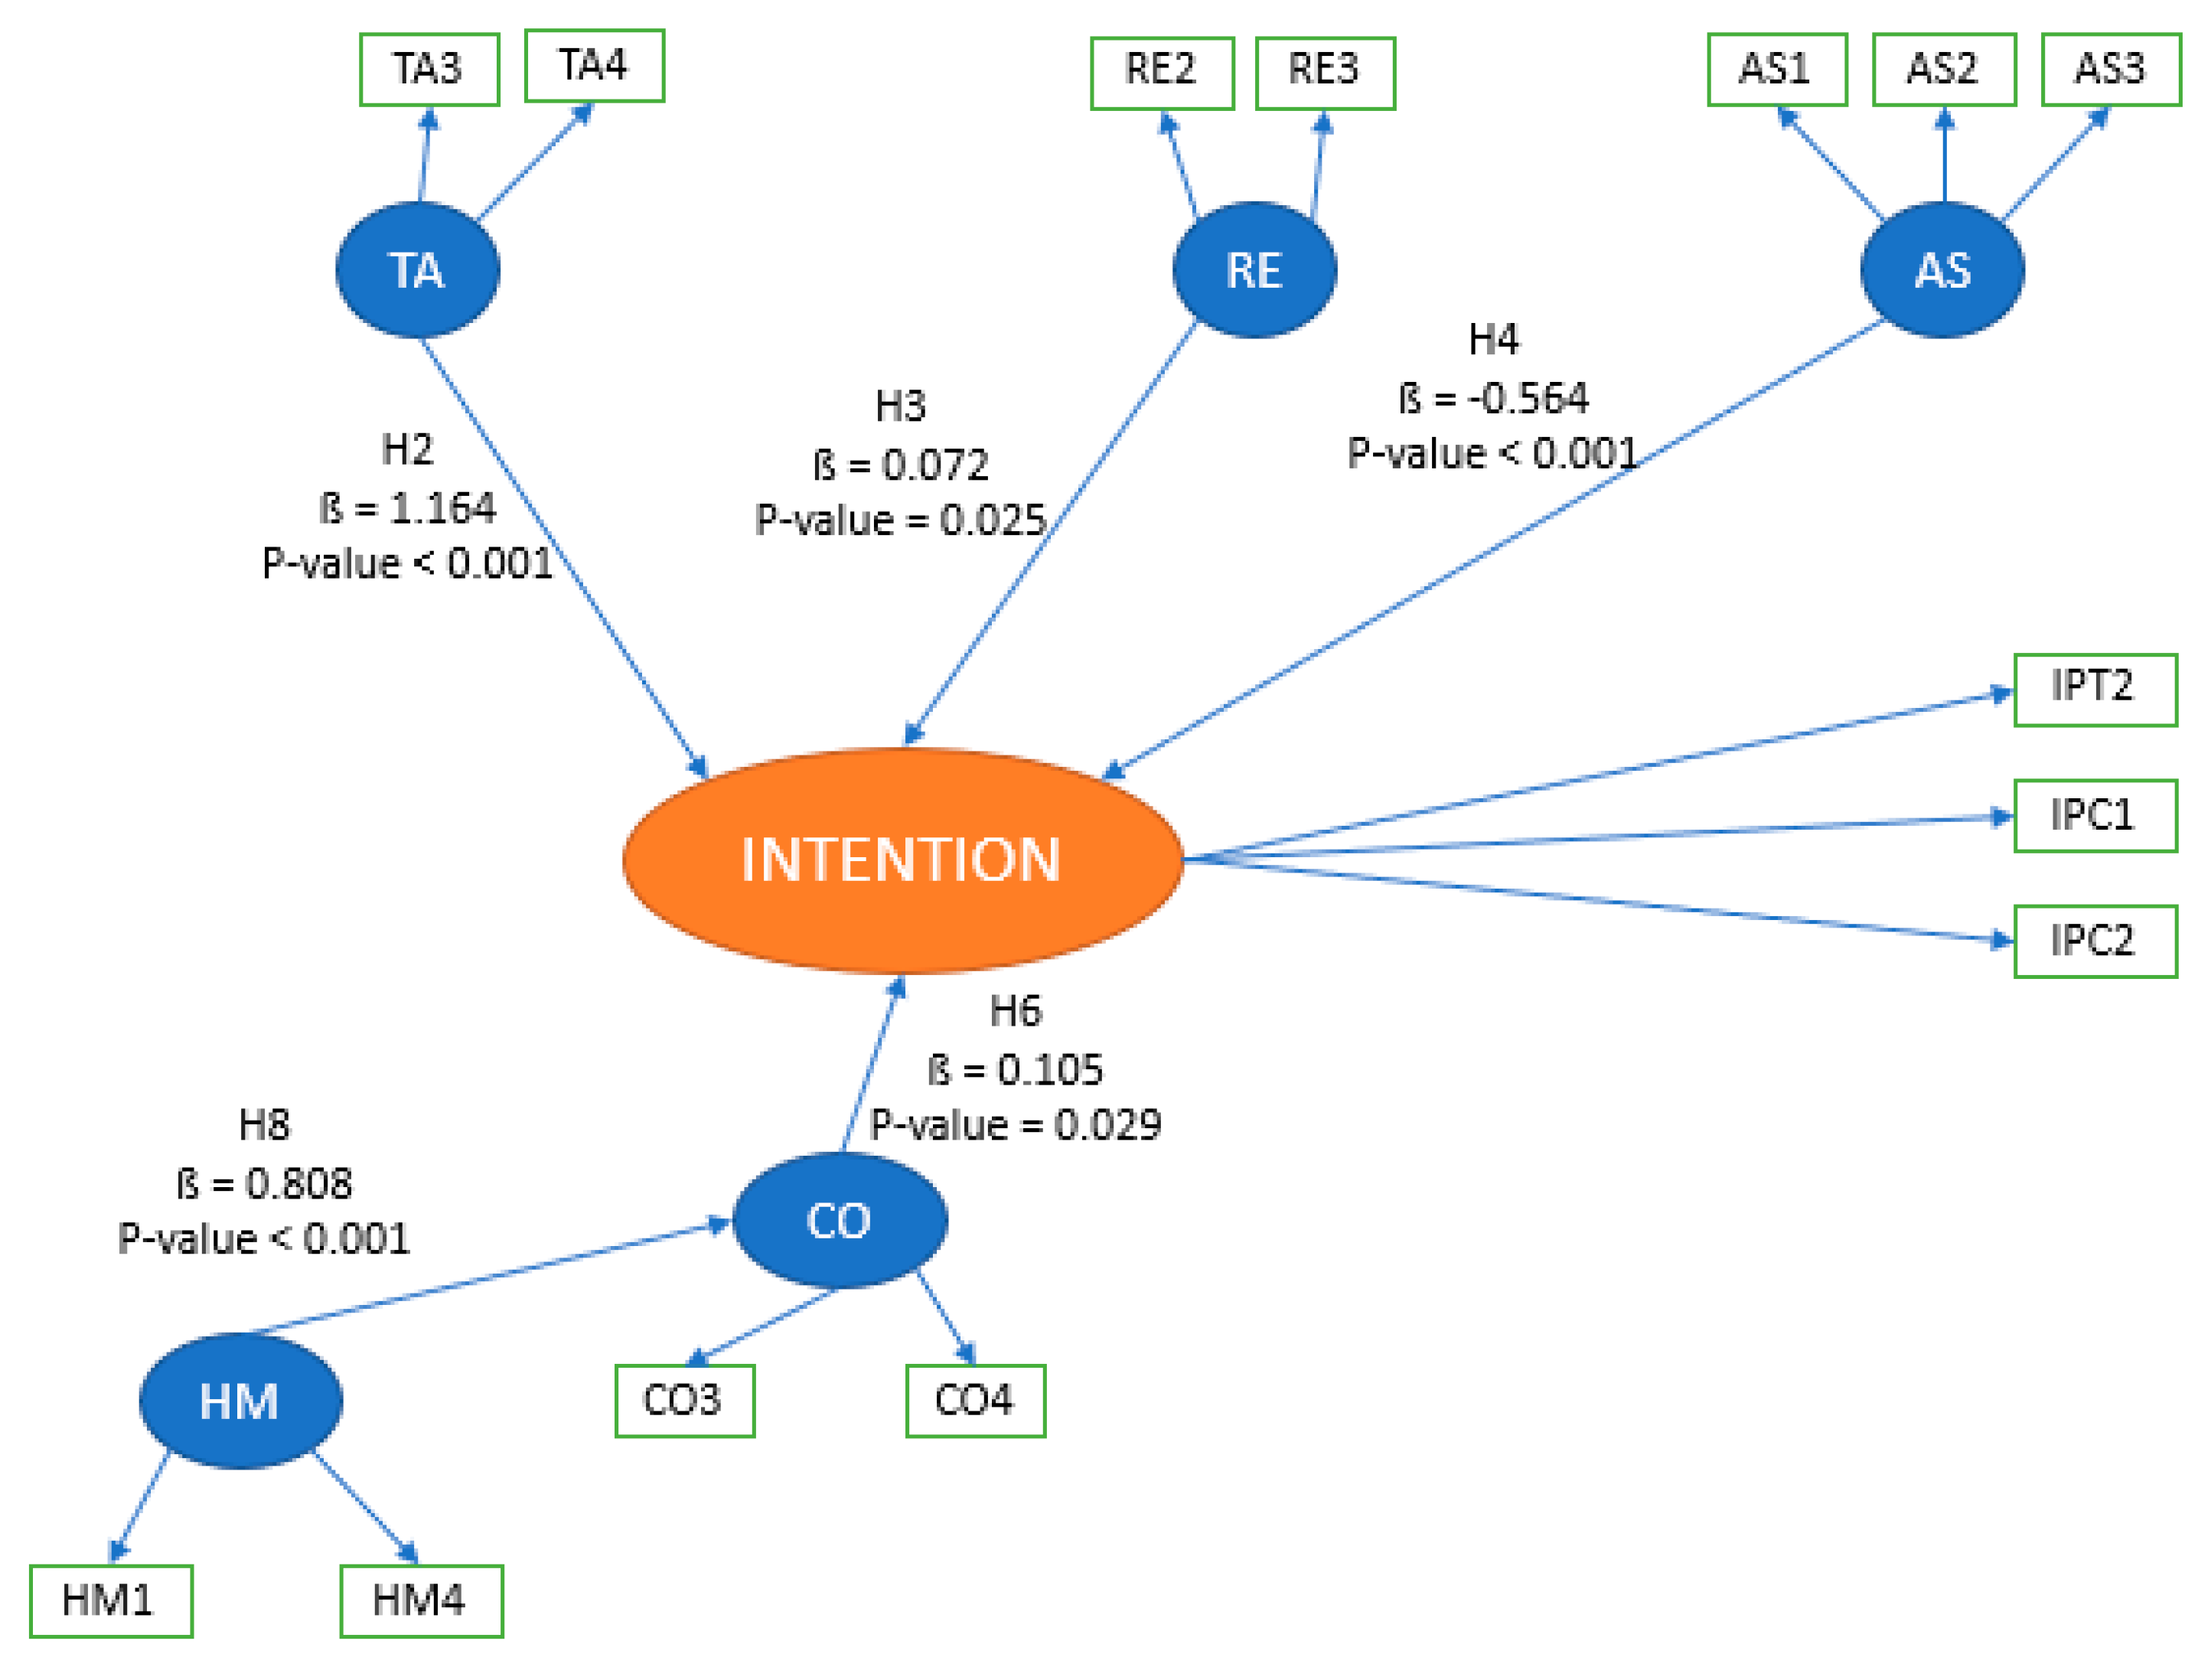
When statistically insignificant paths are removed, the final models are presented along with the corresponding coefficients in Figure 3 and Figure 4 for Bangkok and Jakarta, respectively. It can be seen in Figure 3 that Tangibility (TA), Responsiveness (RE), and Assurance (AS) have a significant direct relationship to the intention. Furthermore, the Confidence (CO) variable also has a statistically significant value on intention, while health measures have a substantial value on CO.
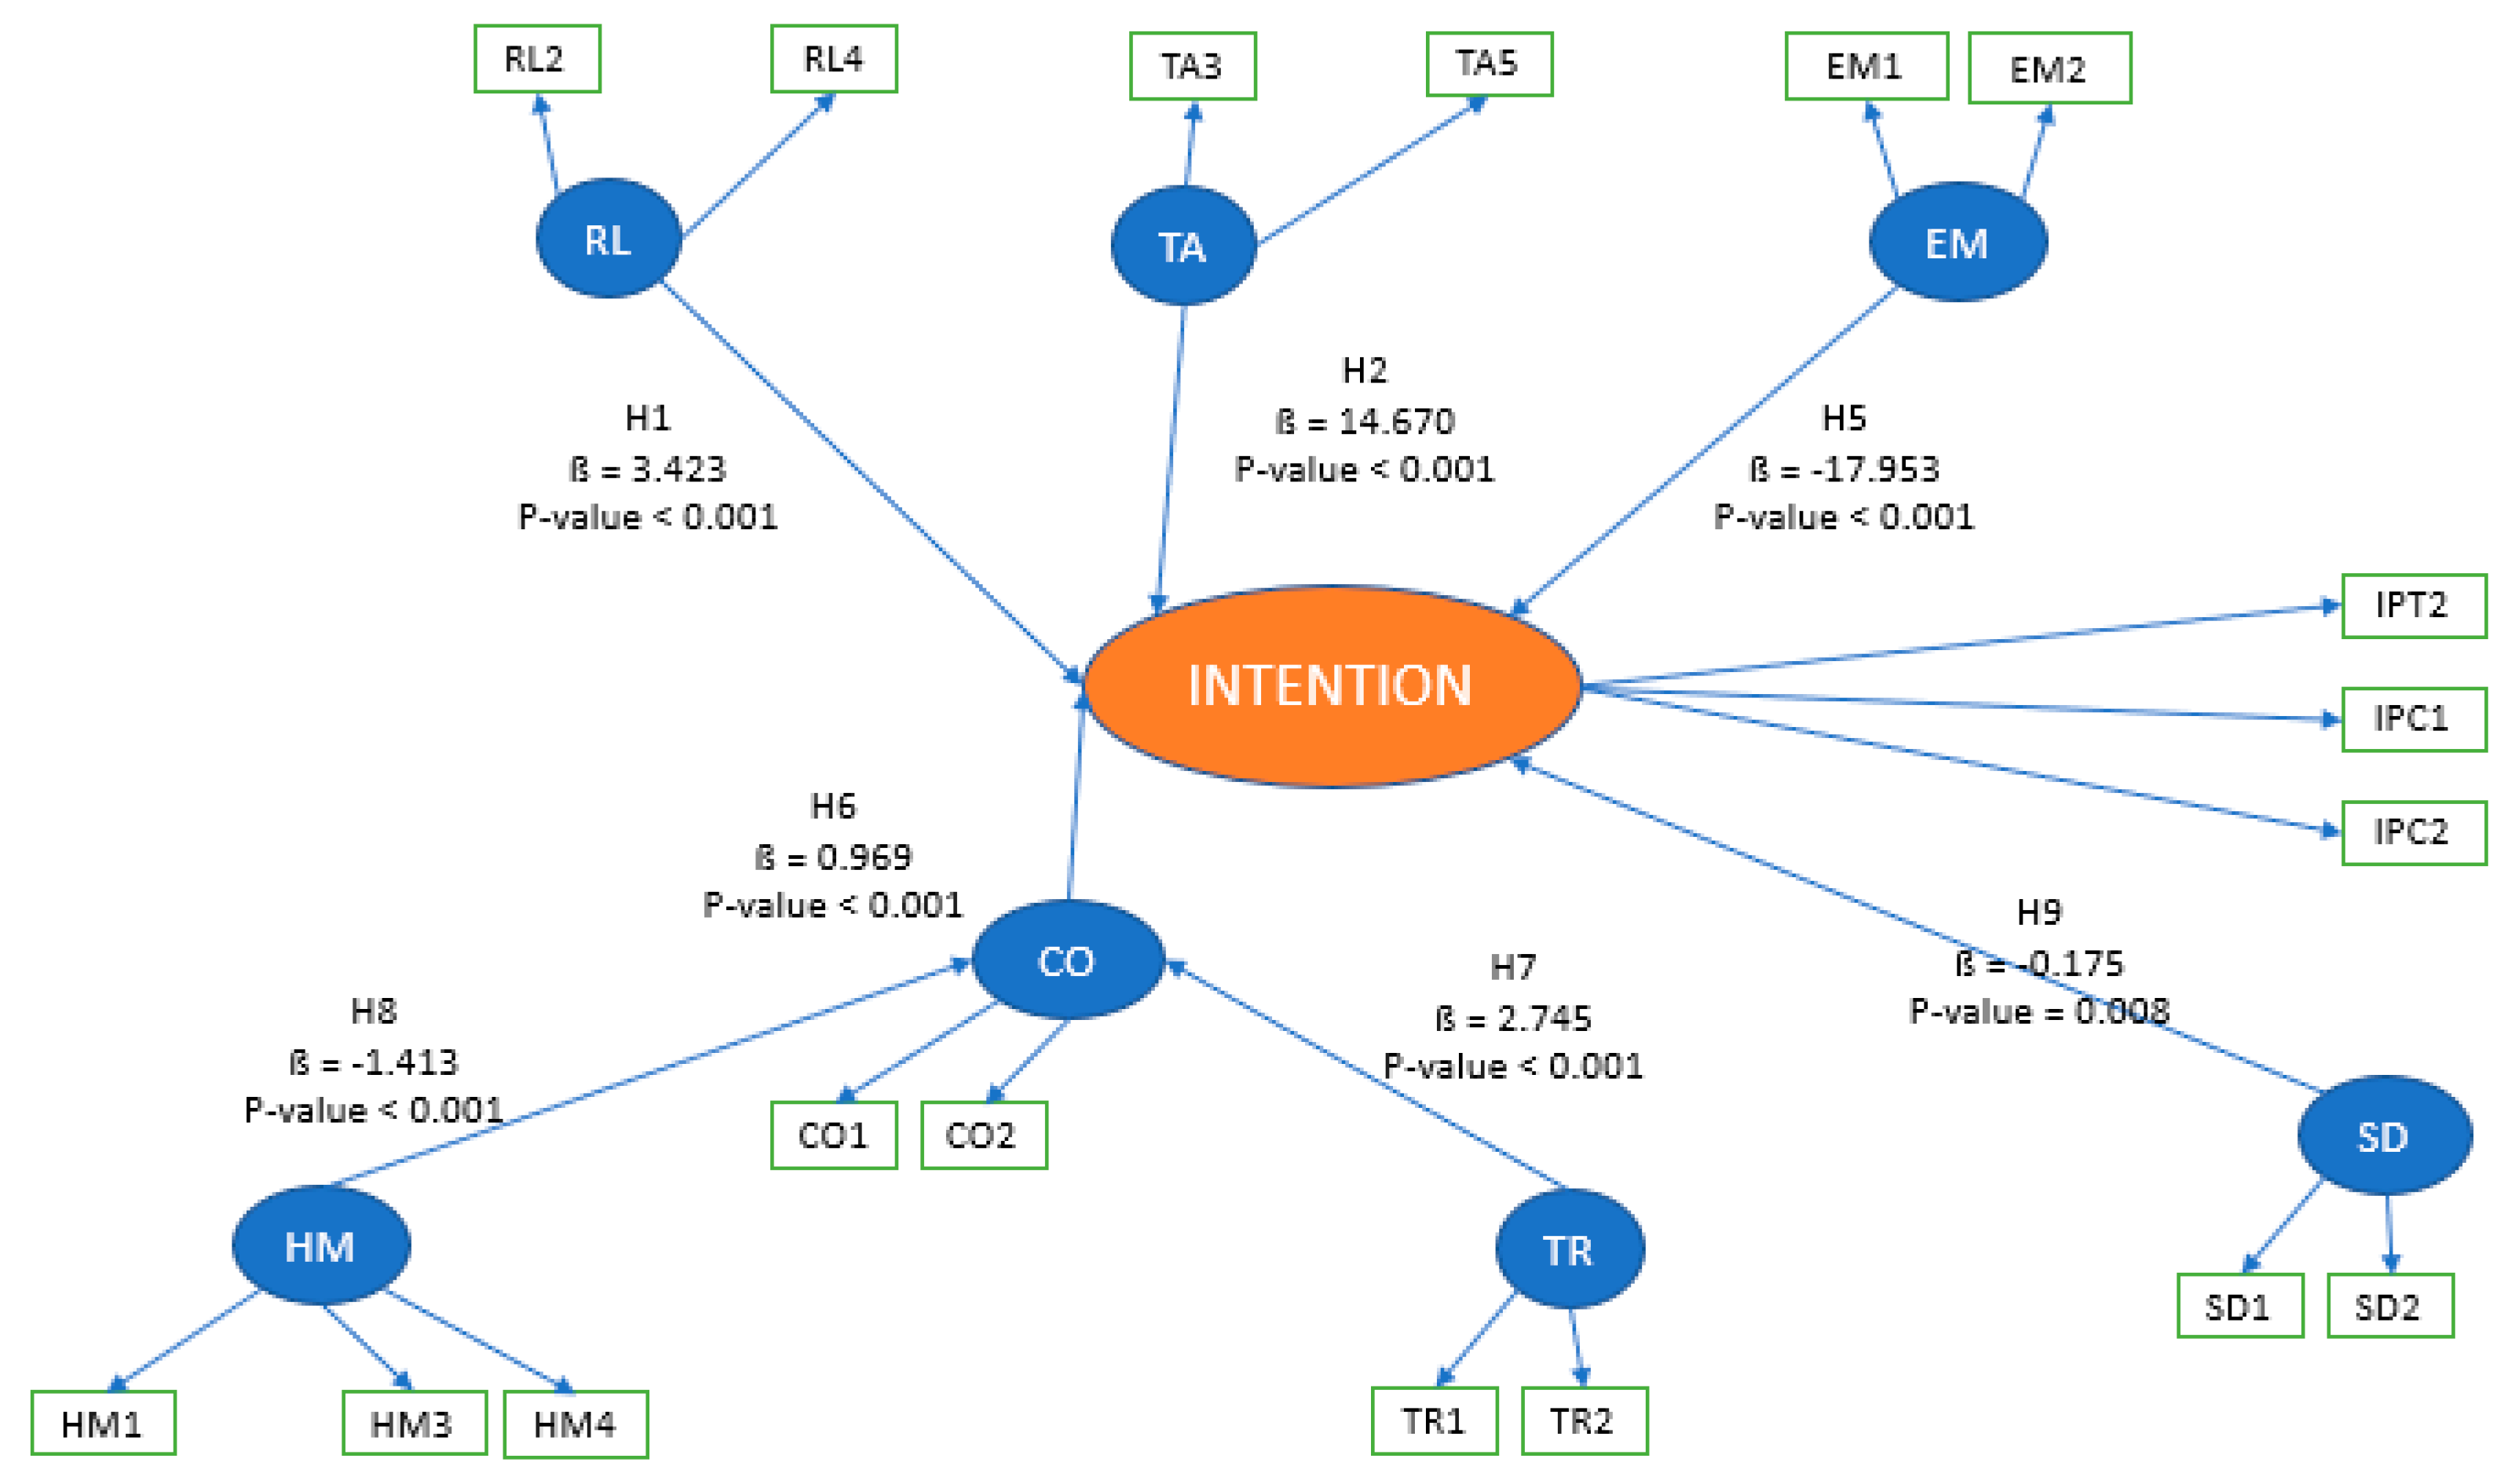
In Figure 4, the components of the SERVQUAL indicators such as the Reliability (RL), Tangibility (TA), and Empathy (EM) variables have a significant relationship to the intention. Other indicators such as Confidence (CO) are also found to be statistically significant for the intention. Furthermore, Health Measure (HM) and Tracing Apps (TR) have a significant impact on the CO. Additionally, indicators related to this COVID-19 policy, namely, Social Distancing (SD), have a direct statistically significant effect on intentions.
5. Discussion
5.1. Effect of Service Quality on the Intention to Use Public Transport
The quality of service from public transportation is very influential in the decision to use public transport [73]. From the findings, Reliability (RL) has a significant value in Jakarta with a coefficient of 3.423, but this indicator has no effect in Bangkok. Responsiveness (RE), which includes ease of use during working hours and short waiting times, has an impact in Bangkok (Coeff. = 0.161, p-value = 0.025) but has no effect in Jakarta (Coeff. = 0.245, p-value = 0.142). Responsiveness is vital in determining the quality of public transportation system services [32]. Apart from its significant effect on service quality, responsiveness seems to indirectly affect the intention to use public transport [63]. In Jakarta, the variable that has a different influence is Empathy (EM), with a coefficient value of −17.953, meaning that passengers pay attention to communication between drivers and officers who assist in public transport. As in Farooq’s opinion [28], companies should recruit and train their human resources to provide better and personalized services with higher empathy.
Moreover, the significant service quality variables in Bangkok besides responsiveness are Tangibility (TA) and Assurance (AS), with coefficient values of 1.164 and −0.564, respectively. Interestingly, the coefficient value in the assurance variable has a negative effect, meaning that these conditions still cannot satisfy general users to encourage them to use public transport frequently. A similar finding was found by Taufikkurahman [74] in Malang, Indonesia, i.e., the negative value indicated that the current service condition is still below the users’ expectations. Thus, the quality of service on the assurance dimension is presumably unsatisfactory.
Overall, the service quality appears to have the highest direct effect significance. Positive service quality indicators are good, safe, and secure services to be used during the COVID-19 pandemic in Jakarta and Bangkok. Thus, it can be implied that public transportation in Jakarta and Bangkok generally complies with COVID-19 safety protocol, leading to customer satisfaction and greater user intentions to use public transport.
5.2. Passenger Perceptions of Social Distancing Measures
One of the variables that could attract people’s interest in reusing public transportation during this pandemic is the implementation of social distancing. Social distancing is an approach to prevent transmission of the COVID-19 virus. In a Bangkok study by Vichiensan [12], it was shown that social distancing is significant for COVID-19 awareness and affects public transport efficiency. As social distancing was practically challenging, reducing the peak demand in rush hours would help prevent crowding in the system [15].
From the present finding, social distancing significantly affects the intention to use public transportation in Jakarta with a coefficient value of −0.175. Moreover, social distancing in Bangkok does not affect the intention to use public transport (Coeff. = −0.370, p-value = 0.182). Similar results were also obtained by Nilsen et al. [3] in Denmark and Sweden, i.e., social distancing rules positively impacted the transmission of the COVID-19 virus. In Jakarta, starting in early 2021, the Indonesian government adopted a policy to lower the level of handling the COVID-19 pandemic from level 3 to level 1, increasing the level of public transport usage to 14.65% from the initial level of 8.69% [23].
Social distancing is a fundamental step that public transport operators should implement during this pandemic [16], notably in Jakarta and Bangkok, where perceptions of implementing social distancing on public transportation are found to be significant from the study’s findings. The implementation of social distancing rules was strict when the infection rate was very high and finally relaxed when the infection rate decreased. Specifically, more than 80 percent of the respondents in Bangkok had been vaccinated up to a booster.
5.3. Confidence in Using Public Transport during the Pandemic
Using public transportation during a pandemic is challenging because of its vulnerability to the spread of the COVID-19 virus [51]. Nevertheless, such a situation is unavoidable since economic development requires that each individual’s economic prosperity be maintained [75]. Furthermore, strong confidence is required in using public transport. Health measures and the implementation of tracing apps need attention to increase people’s confidence and trust in public transportation [12]. Examples are the use of masks on public transport, the provision of alcohol gel for washing hands, and the availability of tracking applications in several public places such as train stations or other crowded places. These implementations can be considered similarly in the two cities in this study, Jakarta and Bangkok.
According to Vichiensan [12], there was no drastic decrease in rail passengers in Bangkok during the day because the shutdown did not wholly hinder people’s ability to travel to and from work and other necessary activities. Demand for public transportation would have to be carefully managed so that the system could meet passenger needs despite its diminished capacity [53]. In this study, the coefficients of the confidence variable are positive in both cities, namely 0.105 for Bangkok and 0.969 for Jakarta. These results indicate that public transportation services related to healthcare are still unable to attract passengers to use public transport again. Passengers must feel safe and comfortable and not worry about contracting the COVID-19 virus when using public transportation [58]
Additionally, the health measures variable in Hypothesis 8 (H8) has a significant value on the Confidence (CO) of passengers in using public transportation for both cities (Coeff. = 0.808, p-value = <0.001 in Bangkok and Coeff. = −1.413, p-value = <0.001 in Jakarta). Hypothesis 7, with the Tracing apps indicator, shows a difference between Bangkok and Jakarta. In Bangkok, the “Mor Chana” application was used to identify individuals with COVID-19 [12]; however, such a measure was not mandatory for public transport. As a result, using a tracking application in Bangkok is not a significant determinant in increasing riders’ confidence in using public transport. On the contrary, the “Peduli Lindungi” application in Jakarta must be used as a requirement for public transport in order to identify the spread of the COVID-19 virus in Indonesia. [13]. This application has a positive value for public trust in public transportation; this indicates that motorists would feel more comfortable using public transport after scanning the barcode and reporting using the application.
6. Conclusions
The COVID-19 pandemic has dramatically changed travel patterns and modes of transportation. Previously, people tended to pay attention to travel time and costs in determining transportation choices. In this case, people pay more attention to safety factors for their health. In addition to this, the community is expected to be cautious in transport activities by deciding to stay at home and not travel at all if there are no urgent needs. A more private and hygienic transport mode that does not allow direct contact with other passengers is one of the preferred ways to travel during this pandemic. There are various policies to deal with transmissions, such as social distancing and the use of masks, and in several places, there is a tracking system via health applications.
The policy implications for public transportation during the ongoing pandemic include social distancing measures such as limiting the number of seats and passenger capacity. Additionally, implementing a tracking system for passengers boarding and disembarking from public transportation is vital to monitor potential transmission within the vehicle. Wearing a mask is also recommended to prevent transmission when interacting with public transport operators or other individuals. Lastly, the provision of alcohol for hand-washing purposes within the vehicle is also crucial in maintaining hygiene and preventing transmission.
Choosing an appropriate policy of implementing health protocols in the transportation sector significantly affects intentions to use public transport during this pandemic. From our findings, key issues that are noteworthy to increase public interest in public transport are indicators of health efforts, tracing apps, and social distancing. Public transport users need to understand the dangers of COVID-19, especially groups who are vulnerable to exposure, because no matter how strict the implementation of health protocols by public transport operators, transmission on public transport will continue.
On top of this, social distancing, i.e., limiting public transportation capacity and the lack of active transport, could lead to a tendency to use private motorized vehicles. Apart from that, the trust of public transport users is also critical in determining policies to encourage the intention to use public transport during this pandemic.
Although this research focuses on indicators influencing passengers intentions to use public transportation during the COVID-19 pandemic, further research is needed to investigate how travel distance affects an interest in using public transportation during this pandemic. In addition, further research related to the potential psychological factors of passengers on the application of social distancing is needed to gain more understanding of such a policy during a pandemic.
One limitation of this research is the insufficient inclusion of cities to comprehensively identify and analyze the policies adopted in different regions that share similar characteristics, particularly in several cities within the ASEAN region. Furthermore, a more comprehensive review of urban rail-based transportation systems would complement investigating public transportation modes.
Author Contributions
Conceptualization, A.M.H. and K.C.; methodology, A.M.H.; investigation, A.M.H. and K.C.; formal analysis, A.M.H.; validation, A.M.H.; writing—original draft preparation, A.M.H.; writing—review and editing, A.M.H. and K.C. All authors have read and agreed to the published version of the manuscript.
Funding
This research received no external funding.
Informed Consent Statement
Informed consent was obtained from all subjects involved in the study.
Acknowledgments
The authors are grateful for the scholarship support from Chulalongkorn University.
Conflicts of Interest
The authors declare no conflict of interest.
Appendix A

Table A1.
Descriptive statistics of constructs by cities.
| Variable Construct | Indicator | Bangkok | Jakarta | ||
|---|---|---|---|---|---|
| Mean | SD. | Mean | SD. | ||
| Reliability | RL1 | 4.02 | 0.73 | 3.64 | 1.05 |
| RL2 | 4.01 | 0.72 | 3.58 | 1.02 | |
| RL3 | 3.92 | 0.76 | 3.34 | 1.13 | |
| RL4 | 3.99 | 0.64 | 3.74 | 1.06 | |
| Tangibility | TA1 | 4.12 | 0.68 | 3.33 | 1.01 |
| TA2 | 3.94 | 0.67 | 3.33 | 1.07 | |
| TA3 | 3.91 | 0.65 | 3.23 | 1.12 | |
| TA4 | 3.69 | 0.78 | 3.19 | 1.05 | |
| TA5 | 3.70 | 0.80 | 3.29 | 1.06 | |
| Responsiveness | RE1 | 3.52 | 0.98 | 3.43 | 1.00 |
| RE2 | 3.52 | 1.07 | 3.16 | 1.22 | |
| RE3 | 3.45 | 1.08 | 3.19 | 1.19 | |
| Assurance | AS1 | 3.69 | 0.82 | 3.12 | 1.25 |
| AS2 | 3.69 | 0.82 | 3.51 | 1.04 | |
| AS3 | 3.67 | 0.86 | 3.46 | 1.03 | |
| AS4 | 3.66 | 0.85 | 3.72 | 0.99 | |
| Empathy | EM1 | 3.68 | 0.77 | 3.43 | 1.02 |
| EM2 | 3.52 | 0.94 | 3.60 | 1.03 | |
| Confidence | CO1 | 3.78 | 0.78 | 4.01 | 0.92 |
| CO2 | 3.72 | 0.79 | 4.04 | 0.91 | |
| CO3 | 3.90 | 0.73 | 4.34 | 0.86 | |
| CO4 | 3.93 | 0.75 | 4.32 | 0.86 | |
| Health Measure | HM1 | 3.89 | 0.76 | 4.30 | 0.90 |
| HM2 | 4.03 | 0.71 | 4.43 | 0.82 | |
| HM3 | 3.89 | 0.76 | 4.23 | 0.92 | |
| HM4 | 3.97 | 0.74 | 4.18 | 0.93 | |
| Tracing Apps | TR1 | 3.69 | 0.96 | 3.89 | 1.11 |
| TR2 | 4.32 | 0.73 | 4.42 | 0.93 | |
| TR3 | 3.67 | 1.00 | 3.79 | 1.13 | |
| Social Distancing | SD1 | 3.67 | 0.95 | 4.11 | 1.00 |
| SD2 | 3.81 | 0.85 | 4.19 | 0.91 | |
| SD3 | 3.92 | 0.75 | 4.33 | 0.86 | |
| Intention | IPT1 | 3.93 | 0.68 | 3.60 | 1.01 |
| IPT2 | 3.89 | 0.66 | 3.42 | 1.03 | |
| IPC1 | 3.91 | 0.66 | 3.50 | 0.99 | |
| IPC2 | 3.88 | 0.64 | 3.39 | 1.01 | |
References
- Rothan, H.A.; Byrareddy, S.N. The epidemiology and pathogenesis of coronavirus disease (COVID-19) outbreak. J. Autoimmun. 2020, 109, 102433. [Google Scholar] [CrossRef] [PubMed]
- World Health Organization. Laboratory Testing for Coronavirus Disease (COVID-19) in Suspected Human Cases: Interim Guidance, 11 Setember 2020. Interim Guid. 2020, p. 20. Available online: https://who.int/ (accessed on 12 December 2022).
- Nilsen, P.; Seing, I.; Ericsson, C.; Andersen, O.; Stefánsdóttir, N.T.; Tjørnhøj-Thomsen, T.; Kallemose, T.; Kirk, J.W. Implementing social distancing policy measures in the battle against the coronavirus: Protocol of a comparative study of Denmark and Sweden. Implement. Sci. Commun. 2020, 1, 1–10. [Google Scholar] [CrossRef] [PubMed]
- Economic Research Institute for ASEAN and East Asia. The COVID-19 Pandemic: Impact on ASEAN Connectivity and Recovery Strategies; Association of Southeast Asian Nations: Jakarta, Indonesia, 2022. [Google Scholar]
- World Health Organization. WHO Coronavirus (COVID-19) Dashboard 2022. Available online: https://covid19.who.int/ (accessed on 16 December 2022).
- Pontoh, R.S.; Toharudin, T.; Ruchjana, B.N.; Gumelar, F.; Putri, F.A.; Agisya, M.N.; Caraka, R.E. Jakarta Pandemic to Endemic Transition: Forecasting COVID-19 Using NNAR and LSTM. Appl. Sci. 2022, 12, 5771. [Google Scholar] [CrossRef]
- Tantrakarnapa, K.; Bhopdhornangkul, B.; Nakhaapakorn, K. Influencing factors of COVID-19 spreading: A case study of Thailand. J. Public Health 2020, 30, 621–627. [Google Scholar] [CrossRef] [PubMed]
- Kim, Y.; Kim, E.-J.; Jang, S.; Kim, D.-K. A comparative analysis of the users of private cars and public transportation for intermodal options under Mobility-as-a-Service in Seoul. Travel Behav. Soc. 2021, 24, 68–80. [Google Scholar] [CrossRef]
- Berg, J.; Ihlström, J. The Importance of Public Transport for Mobility and Everyday Activities among Rural Residents. Soc. Sci. 2019, 8, 58. [Google Scholar] [CrossRef] [Green Version]
- Fumagalli, L.A.W.; Rezende, D.A.; Guimarães, T.A. Challenges for public transportation: Consequences and possible alternatives for the Covid-19 pandemic through strategic digital city application. J. Urban Manag. 2021, 10, 97–109. [Google Scholar] [CrossRef]
- Balinado, J.R.; Prasetyo, Y.T.; Young, M.N.; Persada, S.F.; Miraja, B.A.; Redi, A.A.N.P. The effect of service quality on customer satisfaction in an automotive after-sales service. J. Open Innov. Technol. Mark. Complex. 2021, 7, 116. [Google Scholar] [CrossRef]
- Vichiensan, V.; Hayashi, Y.; Kamnerdsap, S. COVID-19 Countermeasures and Passengers’ Confidence of Urban Rail Travel in Bangkok. Sustainability 2021, 13, 9377. [Google Scholar] [CrossRef]
- Luthfiyah, T.S.; Miro, F. Pengaruh Covid-19 Terhadap Transportasi Di Daerah Jabodetabek. J. Thalita Sahda. 2020, pp. 1–6. Available online: https://pustaka.bunghatta.ac.id/index.php/profile/224-pengaruh-covid-19-terhadap-transportasi-di-daerah-jabodetabek (accessed on 5 December 2022).
- Wetchayont, P. Investigation on the Impacts of COVID-19 Lockdown and Influencing Factors on Air Quality in Greater Bangkok, Thailand. Adv. Meteorol. 2021, 2021, 1–11. [Google Scholar] [CrossRef]
- Hu, Y.; Barbour, W.; Samaranayake, S.; Work, D. Impacts of COVID-19 Mode Shift on Road Traffic. arXiv 2020, arXiv:2005.01610. [Google Scholar]
- Gkiotsalitis, K.; Cats, O. Public transport planning adaption under the COVID-19 pandemic crisis: Literature review of research needs and directions. Transp. Rev. 2020, 41, 374–392. [Google Scholar] [CrossRef]
- Mogaji, E. Impact of COVID-19 on transportation in Lagos, Nigeria. Transp. Res. Interdiscip. Perspect. 2020, 6, 100154. [Google Scholar] [CrossRef]
- Sogbe, E. The evolving impact of coronavirus (COVID-19) pandemic on public transportation in Ghana. Case Stud. Transp. Policy 2021, 9, 1607–1614. [Google Scholar] [CrossRef]
- BMTA. Bangkok Mass Transit Authority. 2023. Available online: http://www.bmta.co.th/en/home (accessed on 7 March 2023).
- Laosunthara, A.; Saengtabtim, K.; Sochoeiya, P.; Leelawat, N.; Tang, J.; Kodaka, A.; Onda, Y.; Kohtake, N. Impact of COVID-19 Measures on Mobility in Bangkok, Thailand. J. Disaster Res. 2022, 17, 546–551. [Google Scholar] [CrossRef]
- TransJakarta. Pejabat Pengelola Informasi dan Dokumentasi Trans Jakarta. 2023. Available online: https://ppid.transjakarta.co.id/ (accessed on 7 March 2023).
- Dinas Komunikasi. Informasi Trayek. 2022. Available online: https://www.jakarta.go.id/informasi-trayek (accessed on 8 March 2023).
- Pramesti, M.P.B. Impact of COVID-19 on Urban Mobility in Greater Jakarta. Econ. Soc. Comm. Asia Pac. 2022, 18, 1–12. [Google Scholar]
- Liu, L.; Miller, H.J.; Scheff, J. The impacts of COVID-19 pandemic on public transit demand in the United States. PLoS ONE 2020, 15, e0242476. [Google Scholar] [CrossRef]
- Hörcher, D.; Singh, R.; Graham, D.J. Social distancing in public transport: Mobilising new technologies for demand management under the COVID-19 crisis. Transportation 2021, 49, 735–764. [Google Scholar] [CrossRef] [PubMed]
- Thomas, M.M.; Mohammadi, N.; Taylor, J.E. Investigating the association between mass transit adoption and COVID-19 infections in US metropolitan areas. Sci. Total Environ. 2021, 811, 152284. [Google Scholar] [CrossRef] [PubMed]
- Guirao, B.; García-Pastor, A.; López-Lambas, M.E. The importance of service quality attributes in public transportation: Narrowing the gap between scientific research and practitioners’ needs. Transp. Policy 2016, 49, 68–77. [Google Scholar] [CrossRef]
- Farooq, M.S.; Salam, M.; Fayolle, A.; Jaafar, N.; Ayupp, K. Impact of service quality on customer satisfaction in Malaysia airlines: A PLS-SEM approach. J. Air Transp. Manag. 2018, 67, 169–180. [Google Scholar] [CrossRef]
- Parasuraman, A.; Zeithaml, V.A.; Berry, L.L. A conceptual model of service quality and its implications for future research. J. Mark. 1985, 49, 41–50. [Google Scholar] [CrossRef]
- Butt, M.M.; de Run, E.C. Private healthcare quality: Applying a SERVQUAL model. Int. J. Health Care Qual. Assur. 2010, 23, 658–673. [Google Scholar] [CrossRef] [PubMed]
- Wu, H.-C.; Cheng, C.-C. A hierarchical model of service quality in the airline industry. J. Hosp. Tour. Manag. 2013, 20, 13–22. [Google Scholar] [CrossRef]
- Ojo, T.K.; Mireku, D.O.; Dauda, S.; Nutsogbodo, R.Y. Service Quality and Customer Satisfaction of Public Transport on Cape Coast-Accra Route, Ghana. Dev. Ctry. Stud. 2014, 4, 142–149. [Google Scholar]
- Kospandani, R.; Wahyudi, L. Public Transportation Trust and Satisfaction During the Covid-19 Pandemic: Study on Electric Train Services in Kai Commuter Region 6 Yogyakarta. Int. J. Econ. Bus. Manag. Res. 2021, 5, 2021. Available online: www.ijebmr.com (accessed on 7 December 2022).
- Yilmaz, V.; Ari, E.; Oğuz, Y.E. Measuring service quality of the light rail public transportation: A case study on Eskisehir in Turkey. Case Stud. Transp. Policy 2021, 9, 974–982. [Google Scholar] [CrossRef]
- Chauhan, V.; Gupta, A.; Parida, M. Demystifying service quality of Multimodal Transportation Hub (MMTH) through measuring users’ satisfaction of public transport. Transp. Policy 2021, 102, 47–60. [Google Scholar] [CrossRef]
- Ambak, K.; Kasvar, K.K.; Daniel, B.D.; Prasetijo, J.; Ghani, A.R.A. Behavioral intention to use public transport based on theory of planned behavior. In MATEC Web Conferences; EDP Sciences: Paris, France, 2016; Volume 47. [Google Scholar] [CrossRef] [Green Version]
- Jen, W. Application of perceived value model to identify factors affecting passengers’ repurchase intentions on city bus: A case of the Taipei metropolitan area. Transportation 2003, 30, 307–327. [Google Scholar] [CrossRef]
- Yilmaz, V.; Ari, E. The effects of service quality, image, and customer satisfaction on customer complaints and loyalty in high-speed rail service in Turkey: A proposal of the structural equation model. Transp. A Transp. Sci. 2016, 13, 67–90. [Google Scholar] [CrossRef]
- Chuenyindee, T.; Ong, A.K.S.; Ramos, J.P.; Prasetyo, Y.T.; Nadlifatin, R.; Kurata, Y.B.; Sittiwatethanasiri, T. Public utility vehicle service quality and customer satisfaction in the Philippines during the COVID-19 pandemic. Util. Policy 2022, 75, 101336. [Google Scholar] [CrossRef] [PubMed]
- Przybylowski, A.; Stelmak, S.; Suchanek, M. Mobility Behaviour in View of the Impact of the COVID-19 Pandemic—Public Transport Users in Gdansk Case Study. Sustainability 2021, 13, 364. [Google Scholar] [CrossRef]
- Ceccato, R.; Rossi, R.; Gastaldi, M. Travel Demand Prediction during COVID-19 Pandemic: Educational and Working Trips at the University of Padova. Sustainability 2021, 13, 6596. [Google Scholar] [CrossRef]
- Song, K.-H.; Choi, S. A Study on the Behavioral Change of Passengers on Sustainable Air Transport After COVID-19. Sustainability 2020, 12, 9207. [Google Scholar] [CrossRef]
- Luo, J.M.; Lam, C.F. Travel Anxiety, Risk Attitude and Travel Intentions towards ‘ Travel Bubble ’ Destinations in Hong Kong: E ff ect of the Fear of COVID-19. Int. J. Environ. Res. Public Health 2020, 17, 7859. [Google Scholar] [CrossRef]
- Tiglao, N.C.C.; De Veyra, J.M.; Tolentino, N.J.Y.; Tacderas, M.A.Y. The perception of service quality among paratransit users in Metro Manila using structural equations modelling (SEM) approach. Res. Transp. Econ. 2020, 83, 100955. [Google Scholar] [CrossRef]
- Wang, Y.; Zhang, Z.; Zhu, M.; Wang, H. The Impact of Service Quality and Customer Satisfaction on Reuse Intention in Urban Rail Transit in Tianjin, China. SAGE Open 2020, 10. [Google Scholar] [CrossRef]
- Abu Bakar, M.F.; Norhisham, S.; Katman, H.Y.; Fai, C.M.; Azlan, N.N.I.M.; Samsudin, N.S.S. Service Quality of Bus Performance in Asia: A Systematic Literature Review and Conceptual Framework. Sustainability 2022, 14, 7998. [Google Scholar] [CrossRef]
- Barabino, B.; Deiana, E.; Tilocca, P. Measuring service quality in urban bus transport: A modified SERVQUAL approach. Int. J. Qual. Serv. Sci. 2012, 4, 238–252. [Google Scholar] [CrossRef]
- Zahra, N.; Baihaqi, I.; Ardiantono, D.S. Evaluasi Kualitas Pelayanan Pada Industri Angkutan Umum: Studi Kasus Mikrotrans Jak Lingko. J. Sains dan Seni ITS 2020, 9, D58–D63. [Google Scholar] [CrossRef]
- Abdullah, M.; Ali, N.; Dias, C.; Campisi, T.; Javid, M.A. Exploring the Traveler ’ s Intentions to Use Public Transport during the COVID-19 Pandemic While Complying with Precautionary Measures. Appl. Sci. 2021, 11, 3630. [Google Scholar] [CrossRef]
- Chongsanguan, P.; Trimetsoontorn, J.; Fongsuwan, W. Examining the relationships between service quality, perceived value, customer satisfaction and purchase intentions: A marketing study of Bangkok’s metropolitan rapid transit system, Thailand. J. Glob. Bus. Adv. 2017, 10, 3. [Google Scholar] [CrossRef]
- Tumsekcali, E.; Ayyildiz, E.; Taskin, A. Interval valued intuitionistic fuzzy AHP-WASPAS based public transportation service quality evaluation by a new extension of SERVQUAL Model: P-SERVQUAL 4.0. Expert Syst. Appl. 2021, 186, 115757. [Google Scholar] [CrossRef]
- Sam, E.F.; Hamidu, O.; Daniels, S. SERVQUAL analysis of public bus transport services in Kumasi metropolis, Ghana: Core user perspectives. Case Stud. Transp. Policy 2017, 6, 25–31. [Google Scholar] [CrossRef]
- Villacé-Molinero, T.; Fernández-Muñoz, J.J.; Orea-Giner, A.; Fuentes-Moraleda, L. Understanding the new post-COVID-19 risk scenario: Outlooks and challenges for a new era of tourism. Tour. Manag. 2021, 86, 104324. [Google Scholar] [CrossRef]
- Dong, H.; Ma, S.; Jia, N.; Tian, J. Understanding public transport satisfaction in post COVID-19 pandemic. Transp. Policy 2020, 101, 81–88. [Google Scholar] [CrossRef]
- Hernández-Orallo, E.; Manzoni, P.; Calafate, C.T.; Cano, J.-C. A methodology for evaluating digital contact tracing apps based on the COVID-19 experience. Sci. Rep. 2022, 12, 12728. [Google Scholar] [CrossRef]
- Shen, J.; Duan, H.; Zhang, B.; Wang, J.; Ji, J.S.; Wang, J.; Pan, L.; Wang, X.; Zhao, K.; Ying, B.; et al. Prevention and control of COVID-19 in public transportation: Experience from China. Environ. Pollut. 2020, 266, 115291. [Google Scholar] [CrossRef] [PubMed]
- Jewell, N.P.; Lewnard, J.A.; Jewell, B.L. Caution Warranted: Using the Institute for Health Metrics and Evaluation Model for Predicting the Course of the COVID-19 Pandemic. Ann. Intern. Med. 2020, 173, 226–227. [Google Scholar] [CrossRef] [PubMed] [Green Version]
- Cartenì, A.; Di Francesco, L.; Martino, M. How mobility habits influenced the spread of the COVID-19 pandemic: Results from the Italian case study. Sci. Total Environ. 2020, 741, 140489. [Google Scholar] [CrossRef]
- Liou, J.J.; Hsu, C.-C.; Chen, Y.-S. Improving transportation service quality based on information fusion. Transp. Res. Part A Policy Pr. 2014, 67, 225–239. [Google Scholar] [CrossRef]
- Munim, Z.H.; Noor, T. Young people’s perceived service quality and environmental performance of hybrid electric bus service. Travel Behav. Soc. 2020, 20, 133–143. [Google Scholar] [CrossRef]
- de Oña, J.; de Oña, R.; López, G. Transit service quality analysis using cluster analysis and decision trees: A step forward to personalized marketing in public transportation. Transportation 2015, 43, 725–747. [Google Scholar] [CrossRef]
- de Oña, J.; de Oña, R.; Eboli, L.; Mazzulla, G. Perceived service quality in bus transit service: A structural equation approach. Transp. Policy 2013, 29, 219–226. [Google Scholar] [CrossRef]
- Grujičić, D.; Ivanovic, I.; Jovic, J.; Djoric, V. Customer perception of service quality in public transport. Transport 2014, 29, 285–295. [Google Scholar] [CrossRef] [Green Version]
- Eboli, L.; Mazzulla, G. Relationships between rail passengers’ satisfaction and service quality: A framework for identifying key service factors. Public Transp. 2014, 7, 185–201. [Google Scholar] [CrossRef]
- Mikhaylov, A.S.; Gumenuk, I.S.; Mikhaylova, A.A. The servqual model in measuring service quality of public transportation: Evidence from Russia. Qual. Access Success 2015, 16, 78–83. [Google Scholar]
- Aaditya, B.; Rahul, T. Psychological impacts of COVID-19 pandemic on the mode choice behaviour: A hybrid choice modelling approach. Transp. Policy 2021, 108, 47–58. [Google Scholar] [CrossRef]
- Mahikul, W.; Chotsiri, P.; Ploddi, K.; Pan-Ngum, W. Evaluating the Impact of Intervention Strategies on the First Wave and Predicting the Second Wave of COVID-19 in Thailand: A Mathematical Modeling Study. Biology 2021, 10, 80. [Google Scholar] [CrossRef]
- Parker, M.E.; Li, M.; Bouzaghrane, M.A.; Obeid, H.; Hayes, D.; Frick, K.T.; Rodríguez, D.A.; Sengupta, R.; Walker, J.; Chatman, D.G. Public transit use in the United States in the era of COVID-19: Transit riders’ travel behavior in the COVID-19 impact and recovery period. Transp. Policy 2021, 111, 53–62. [Google Scholar] [CrossRef]
- Chen, C.; Feng, T.; Gu, X.; Yao, B. Investigating the effectiveness of COVID-19 pandemic countermeasures on the use of public transport: A case study of The Netherlands. Transp. Policy 2022, 117, 98–107. [Google Scholar] [CrossRef] [PubMed]
- Robi, M.; Kusnandar, D.; Sulistianingsih, E. Penerapan Structural Equation Modeling (SEM) untuk analisis kompetensi alumni. Bul. Ilm. Mat. Stat. Dan Terap. 2017, 6, 113–120. [Google Scholar]
- Hair, J.; Black, W.; Babin, B.; Anderson, R. Multivariate Data Analysis, 7th ed.; Pearson: New York City, NY, USA, 2018. [Google Scholar]
- Manutworakit, P.; Choocharukul, K. Factors Influencing Battery Electric Vehicle Adoption in Thailand—Expanding the Unified Theory of Acceptance and Use of Technology’s Variables. Sustainability 2022, 14, 8482. [Google Scholar] [CrossRef]
- Cserdi, Z.; Kenesei, Z. Attitudes to forced adoption of new technologies in public transportation services. Res. Transp. Bus. Manag. 2020, 41, 100611. [Google Scholar] [CrossRef]
- Taufikkurrahman. Kajian kinerja pelayanan angkutan umum di kota malang. 19th International Symposium of FSTPT. Islamic University of Indonesia, Islamic University of Indonesia, Yogyakarta, Indonesia, 11–13 October 2016; Volume 12, pp. 11–13. [Google Scholar]
- Hale, T.; Angrist, N.; Goldszmidt, R.; Kira, B.; Petherick, A.; Phillips, T.; Webster, S.; Cameron-Blake, E.; Hallas, L.; Majumdar, S.; et al. A global panel database of pandemic policies (Oxford COVID-19 Government Response Tracker). Nat. Hum. Behav. 2021, 5, 529–538. [Google Scholar] [CrossRef]
Figure 1.
Total Confirmed cases of COVID-19 in ASEAN countries [5].
Figure 1.
Total Confirmed cases of COVID-19 in ASEAN countries [5].

Figure 2.
The conceptual model of the intention to use public transportation during a pandemic.

Figure 3.
Structural Equation Model for Bangkok.

Figure 4.
Structural Equation Model for Jakarta.

Table 1.
Literature review of existing studies.
| Reference | Methodology | Key Findings/Factors |
|---|---|---|
| Chuenyindee et al. [39] | Structural Equation Model | Three essential aspects of COVID-19 are its protocols, tangibility, and assurance. |
| Vichiensan et al. [12] | Exploratory factor analysis, structural equation model | Socioeconomic variables, travel behavior, and perceptions of the Covid-19 countermeasures are examined. |
| Przybylowski et al. [40] | Descriptive statistics, chi-square test | Factors such as affluent or poor socioeconomic status; long travel times; congestion; and poor sanitation; |
| Ceccato et al. [41] | Exploratory factor analysis and regression analysis | COVID-19 countermeasures on each mode of transportation according to socioeconomic variables |
| Song [42] | Confirmatory factor analysis, structural equation model | Self-isolation, trip location, the social environment of international travel, and disinfection procedures are all factors to consider. |
| Luo et al. [43] | Structural equation model | People are afraid of COVID-19, have travel anxiety, and are willing to take risks. |
| Tiaglao et al. [44] | Structural equation model | Five constructs of perceptions of paratransit service quality, namely, vehicle condition, reliability, information, convenience, and availability |
| Wang et al. [45] | Structural equation model | Service quality has a direct impact on customer satisfaction and reuse intentions. |
Table 2.
Research Hypotheses.
| Hypotheses | Variable | A priori Effect |
|---|---|---|
| H1 | Reliability (RL) → Intention | Positive |
| H2 | Tangibility (TA) → Intention | Positive |
| H3 | Responsiveness (RE) → Intention | Positive |
| H4 | Assurance (AS) → Intention | Positive |
| H5 | Empathy (EM) → Intention | Positive |
| H6 | Confidence (CO) → Intention | Positive |
| H7 | Tracing apps (TR) → Confidence (CO) | Positive |
| H8 | Health Measures (HM) → Confidence (CO) | Positive |
| H9 | Social Distancing (SD) → Intention | Positive |
Table 3.
Statements regarding variables and indicators.
| Variable | Indicator | Reference | |
|---|---|---|---|
| Reliability | I find it easy to find public transport stops near me | RL1 | [59] |
| There are benches at the bus stop near me | RL2 | [60] | |
| This public transport has never experienced engine failure | RL3 | [32] | |
| Rates that are still affordable by the passenger | RL4 | [61] | |
| Responsiveness | Public transportation looks modern | RE1 | [62] |
| I didn’t wait long to use the public transportation | RE2 | [62] | |
| I can easily use public transportation at busy times | RE3 | [63] | |
| Assurance | Driver picks up and drops passengers at the appropriate stop | AS1 | [59] |
| Driver driving at the appropriate speed | AS2 | [63] | |
| I feel safe in the vehicle and at the bus stop | AS3 | [47] | |
| The driver ensures passengers get on/off safely | AS4 | [60] | |
| Tangibility | There is not enough space for public transport | TA1 | [63] |
| The seats are clean and comfortable | TA2 | [64] | |
| The temperature in the vehicle is satisfactory | TA3 | [65] | |
| The vehicle engine is not noisy and does not vibrate | TA4 | [60] | |
| The appearance of the driver is neat and clean | TA5 | [60] | |
| Empathy | The driver and his assistant are polite and friendly when communicating with passengers | EM1 | [59] |
| The driver and his assistant help the disabled and the elderly | EM2 | [65] | |
| Intention to use Public Transport | I use public transportation to reach work because there is no other option | IPT1 | [43] |
| I use public transportation to work because of my attitude | IPT2 | ||
| I use public transportation for leisure because there is no other option | IPC1 | ||
| I use public transportation for recreation because of my attitude | IPC2 | ||
| Confidence | I feel safe when other passengers are standing 1 meter from me | CO1 | [54] |
| I feel safe when the seat is blocked | CO2 | ||
| I feel safe when there is good air circulation in the vehicle | CO3 | [66] | |
| I feel comfortable using a more flexible payment system | CO4 | ||
| Health measures | I believe that wearing a face mask protects us from COVID-19 when traveling on public transport | HM1 | [67] |
| I feel safe when I travel in good condition | HM2 | [12] | |
| I believe using hand sanitizers or disinfectants can prevent us from contracting COVID-19 when traveling on public transportation. | HM3 | ||
| I believe if we get vaccinated, we can travel safely | HM4 | [68] | |
| Tracing app | Important to check in &-out with the app | TR1 | [66] |
| I feel I have a moral obligation to avoid traveling by public transport if I have symptoms of COVID-19 | TR2 | ||
| I feel worried when passengers do not check in and check out with the app | TR3 | ||
| Social distancing | It is important to block every other seat | SD1 | [69] |
| It is important to maintain a distance of 1 m at bus stops and on public transport | SD2 | ||
| It is important to limit the number of passengers | SD3 | ||
Table 4.
Socioeconomic variables of respondents by cities.
| Variable | Description | Bangkok | Jakarta | ||
|---|---|---|---|---|---|
| Frequency | % | Frequency | % | ||
| Gender | Male | 138 | 34 | 188 | 45.9 |
| Female | 269 | 66 | 222 | 54.1 | |
| Age | <18 | 7 | 1.7 | 28 | 6.8 |
| 19–30 | 241 | 59.2 | 239 | 58.3 | |
| 31–45 | 135 | 33.2 | 119 | 29 | |
| 46–60 | 21 | 5.2 | 19 | 4.6 | |
| >61 | 3 | 0.7 | 5 | 1.2 | |
| Occupation | Unemployed | 16 | 3.9 | 7 | 1.7 |
| Retired | 3 | 0.7 | 22 | 5.4 | |
| Government Staff | 46 | 11.3 | 112 | 27.3 | |
| Company Staff | 164 | 40.3 | 80 | 19.5 | |
| Student | 133 | 32.7 | 140 | 34.1 | |
| Own Business | 41 | 10.1 | 20 | 4.9 | |
| Other | 4 | 1 | 29 | 7.1 | |
| Education Level | High school or below | 22 | 5.4 | 86 | 21 |
| Diploma | 50 | 12.3 | 68 | 16.6 | |
| Undergraduates | 299 | 73.5 | 197 | 48 | |
| Graduates or above | 36 | 8.8 | 59 | 14.4 | |
| Monthly income | Less than 10,000 THB/4,000,000 IDR | 131 | 32.2 | 268 | 65.4 |
| 10,001–20,000 THB/4,000,001–8,000,000 IDR | 159 | 39.1 | 97 | 23.7 | |
| 20,001–30,000 THB/8,000,001–12,000,000 IDR | 61 | 150 | 33 | 8 | |
| 30,001–40,000 THB/12,000,001–16,000,000 IDR | 21 | 5.2 | 7 | 1.7 | |
| 40,001–50,000 THB/16,000,001 –20,000,000 IDR | 17 | 4.2 | 4 | 1 | |
| >50,001 TB/20,000,001 IDR | 18 | 4.4 | 1 | 0.2 | |
| Car ownership | 0 | 127 | 31.2 | 130 | 31.7 |
| 1 | 213 | 52.3 | 184 | 44.9 | |
| >1 | 67 | 16.5 | 96 | 23.4 | |
| Motorcycle ownership | 0 | 194 | 47.7 | 36 | 8.8 |
| 1 | 187 | 45.9 | 167 | 40.7 | |
| >1 | 26 | 6.4 | 207 | 50.5 | |
| Number of vaccinations | No Vaccinations | 2 | 0.5 | 2 | 0.5 |
| Yes, one dose | 0 | 0 | 16 | 3.9 | |
| Yes, two doses | 66 | 116.2 | 116 | 28.3 | |
| Yes, two doses + booster | 339 | 83.3 | 276 | 67.3 | |
Table 5.
Validity of the latent construct’s measurement model.
| Bangkok | Jakarta | |||||
|---|---|---|---|---|---|---|
| Construct | Composite Reliability | Cronbach’s Alpha | AVE | Composite Reliability | Cronbach’s Alpha | AVE |
| RL | 0.857 | 0.774 | 0.602 | 0.867 | 0.791 | 0.619 |
| RE | 0.935 | 0.895 | 0.828 | 0.881 | 0.797 | 0.711 |
| AS | 0.957 | 0.940 | 0.847 | 0.874 | 0.794 | 0.636 |
| TA | 0.900 | 0.850 | 0.667 | 0.953 | 0.792 | 0.803 |
| EM | 0.907 | 0.786 | 0.831 | 0.922 | 0.832 | 0.856 |
| CO | 0.897 | 0.846 | 0.685 | 0.875 | 0.809 | 0.638 |
| HM | 0.934 | 0.906 | 0.780 | 0.931 | 0.902 | 0.773 |
| TR | 0.831 | 0.711 | 0.642 | 0.831 | 0.733 | 0.642 |
| SD | 0.927 | 0.877 | 0.809 | 0.946 | 0.913 | 0.855 |
| Intention | 0.921 | 0.885 | 0.744 | 0.902 | 0.853 | 0.697 |
Note: RL = Reliability, RE = Responsiveness, AS = Assurance, TA = Tangibility, EM = Empathy, CO = Confidence, HM = Health Measures, TR = Tracing apps, SD = Social Distancing.
Table 6.
Model fit based on several indices.
| Statistical Testing Model Fit | Criteria [66] | Statistical Values | |
|---|---|---|---|
| Bangkok | Jakarta | ||
| Goodness of fit index (GFI) | >0.90 | 0.970 | 0.998 |
| Adjusted goodness of fit index (AGFI) | >0.90 | 0.943 | 0.990 |
| Tucker-Lewis’s index (TLI) | >0.95 | 0.961 | 0.996 |
| Comparative Fit Index (CFI) | >0.95 | 0.977 | 0.990 |
| Incremental fit index (IFI) | >0.9 | 0.977 | 0.990 |
| Normed fit index (NFI) | >0.9 | 0.974 | 0.998 |
| CMIN/DF | <2.00 | 1.438 | 1.801 |
| Root-mean-square error of approximation (RMSEA) | <0.08 | 0.033 | 0.017 |
Table 7.
Estimated path coefficients for Bangkok and Jakarta.
| Bangkok | Jakarta | ||||||
|---|---|---|---|---|---|---|---|
| Hypothesis | Path Coefficient | S.E. | p-Value | Hypothesis | Path Coefficient | S.E. | p-Value |
| H1 | 0.001 | 0.051 | 0.830 | H1 | 3.423 | 0.898 | <0.001 |
| H2 | 1.164 | 0.125 | <0.001 | H2 | 14.670 | 3.799 | <0.001 |
| H3 | −0.161 | 0.072 | 0.025 | H3 | 0.245 | 0.167 | 0.142 |
| H4 | −0.564 | 0.112 | <0.001 | H4 | −0.251 | 0.187 | 0.513 |
| H5 | 0.224 | 0.343 | 0.513 | H5 | −17.953 | 4.804 | <0.001 |
| H6 | 0.105 | 0.069 | 0.029 | H6 | 0.969 | 0.109 | <0.001 |
| H7 | 0.0001 | 0.102 | 0.786 | H7 | 2.745 | 0.072 | <0.001 |
| H8 | 0.808 | 0.066 | <0.001 | H8 | −1.413 | 0.057 | <0.001 |
| H9 | −0.370 | 0.278 | 0.182 | H9 | −0.175 | 0.066 | 0.008 |
Disclaimer/Publisher’s Note: The statements, opinions and data contained in all publications are solely those of the individual author(s) and contributor(s) and not of MDPI and/or the editor(s). MDPI and/or the editor(s) disclaim responsibility for any injury to people or property resulting from any ideas, methods, instructions or products referred to in the content. |
© 2023 by the authors. Licensee MDPI, Basel, Switzerland. This article is an open access article distributed under the terms and conditions of the Creative Commons Attribution (CC BY) license (https://creativecommons.org/licenses/by/4.0/).
Share and Cite
MDPI and ACS Style
Hidayat, A.M.; Choocharukul, K. Passengers’ Intentions to Use Public Transport during the COVID-19 Pandemic: A Case Study of Bangkok and Jakarta. Sustainability 2023, 15, 5273. https://doi.org/10.3390/su15065273
AMA Style
Hidayat AM, Choocharukul K. Passengers’ Intentions to Use Public Transport during the COVID-19 Pandemic: A Case Study of Bangkok and Jakarta. Sustainability. 2023; 15(6):5273. https://doi.org/10.3390/su15065273
Chicago/Turabian StyleHidayat, Aditya Mahatidanar, and Kasem Choocharukul. 2023. "Passengers’ Intentions to Use Public Transport during the COVID-19 Pandemic: A Case Study of Bangkok and Jakarta" Sustainability 15, no. 6: 5273. https://doi.org/10.3390/su15065273
Note that from the first issue of 2016, this journal uses article numbers instead of page numbers. See further details here.