Article

Country-Level Modeling of Forest Fires in Austria and the Czech Republic: Insights from Open-Source Data

1
Department of Forest Protection and Wildlife Management, Faculty of Forestry and Wood Technology, Mendel University in Brno, 613 00 Brno, Czech Republic
2
Department of Forestry, Faculty of Forestry, University of Belgrade, 11030 Belgrade, Serbia
3
Department of Forest and Soil Sciences, Institute of Silviculture, University of Natural Resources and Life Sciences, Vienna (BOKU), 1190 Vienna, Austria
4
Department for Biomechanics, Biomedical Engineering and Physics of Complex Systems, Institute for Medical Research, University of Belgrade, 11000 Belgrade, Serbia
5
Department of Forest and Soil Sciences, Institute of Forest Entomology, Forest Pathology and Forest Protection (IFFF), University of Natural Resources and Life Sciences, Vienna (BOKU), 1190 Vienna, Austria
6
Department of Landscape, Spatial and Infrastructure Sciences, Institute of Geomatics, University of Natural Resources and Life Sciences, Vienna (BOKU), 1190 Vienna, Austria
7
Department of Silviculture, Faculty of Forestry and Wood Technology, Mendel University in Brno, 613 00 Brno, Czech Republic
8
Research Institute of Forests and Rangelands, Agricultural Research, Education and Extension Organization (AREEO), Tehran 1496793612, Iran
*
Authors to whom correspondence should be addressed.
These authors contributed equally to this work.
Sustainability 2023, 15(6), 5269; https://doi.org/10.3390/su15065269
Submission received: 31 January 2023 / Revised: 9 March 2023 / Accepted: 10 March 2023 / Published: 16 March 2023
(This article belongs to the Special Issue Sustainable Forest Management and Natural Hazards Prevention)

Abstract

:
Forest fires are becoming a serious concern in Central European countries such as Austria (AT) and the Czech Republic (CZ). Mapping fire ignition probabilities across countries can be a useful tool for fire risk mitigation. This study was conducted to: (i) evaluate the contribution of the variables obtained from open-source datasets (i.e., MODIS, OpenStreetMap, and WorldClim) for modeling fire ignition probability at the country level; and (ii) investigate how well the Random Forest (RF) method performs from one country to another. The importance of the predictors was evaluated using the Gini impurity method, and RF was evaluated using the ROC-AUC and confusion matrix. The most important variables were the topographic wetness index in the AT model and slope in the CZ model. The AUC values in the validation sets were 0.848 (AT model) and 0.717 (CZ model). When the respective models were applied to the entire dataset, they achieved 82.5% (AT model) and 66.4% (CZ model) accuracy. Cross-comparison revealed that the CZ model may be successfully applied to the AT dataset (AUC = 0.808, Acc = 82.5%), while the AT model showed poor explanatory power when applied to the CZ dataset (AUC = 0.582, Acc = 13.6%). Our study provides insights into the effect of the accuracy and completeness of open-source data on the reliability of national-level forest fire probability assessment.

1. Introduction

Forest fires are among the most destructive extreme events that have steadily increased during the last century and the current century [1]. More than 44,000 forest fires occurred in Europe in 2021 alone, covering an area of almost half a million hectares [2]. In general, most fires occurred in the southern part of Europe [3], while Central European countries have been less affected in the last two decades [4]. For example, the average burned area per year in Austria and in the Czech Republic over this period was 71 and 350 hectares, respectively. Climate change, manifested in increased temperature and prolonged drought [5], has worsened the situation and made Austria and the Czech Republic significantly more prone to forest fires, as was experienced in the past [2]. According to the Statistical Yearbook of the national fire rescue service, over the last four years (2018–2021), there were 7594 forest fires in the Czech Republic, which is approximately the same amount as in the entire 2001–2010 decade [4]. Therefore, there is an imminent need to be better prepared for such serious threats, and measures to mitigate the impact of forest fires in the future must be undertaken as soon as possible [5]. First, the territory at the country level must be classified in terms of forest fire risk, to label those parts more endangered by the threat of fires as those of the highest priority. Additionally, reliable data must be collected from various local, regional, and global sources to build a proper model for predicting and mapping forest fire ignition. In some studies, models have relied on specific local data [6] for predicting forest fire probability, whereas in other studies, local data were combined with regional data sources [7], even for the same territory. Regardless of whether they are local or regional, these data can be divided into several groups, including vegetational, climatic, topographic, and anthropogenically characterized [8,9,10,11].
In general, two different approaches, namely, a deterministic or a stochastic approach can be used to model fire ignition probability [12]. In the deterministic models, fire ignition probability was estimated using the weight assigned to each of the predictors. This approach presumes prior knowledge of all predisposing variables that contribute to fire ignition, or they are evaluated by regression analysis. The ease of application and interpretation of the deterministic model has been confirmed in other studies [13]. Further, the selection of the appropriate model depends mainly on the spatial and temporal scales of the study area and available data [14]. Geographically weighted regression was used to model the fire ignition probability of large areas or time series data [15,16,17,18,19,20]. For the same purpose, generalized additive regression models have been applied in other studies [21,22,23]. Alternatively, in the stochastic approach, randomness is included as a component of fire probability models characterized by complex behaviors and patterns. Machine learning (ML), which has prevailed in forest fire and wildfire modeling during the last decade [24], represents a category of stochastic methods. In contrast to deterministic methods, ML models are not dependent on prior knowledge of the investigated phenomenon, and can use nonparametric data. ML methods can identify nonlinear patterns of fire ignition predictors, but they require large datasets to create accurate models. This and the predictor importance in interpretation, which is not as straightforward as in regression methods, complicate their application. The most common and widely used ML methods are Artificial Neural Networks (ANN), Decision Trees (DT), and Support Vector Machines (SVM) [24]. Random Forest (RF), as a DT method [25], has proven efficiency compared to other ML methods, based on the mean sum of squared errors (MSE) metric [26], percentage of fire points in higher probability classes [27], or model precision [28].
Countries that have not experienced a serious problem with forest fires in the past do not practice collecting historical fire events required for ignition modeling. Open-source data can overcome this problem [29,30], although the accuracy and reliability of the data require verification. For this purpose, open-source data related to forest fire events and features that affect ignition were collected in two central European countries: Austria and the Czech Republic. To predict fire ignition probability at the country scale, RF models were developed for both countries independently, and applied to the country of origin and to other countries. More specifically, two objectives guided our study: (i) to evaluate the contribution of the variables obtained from the open-source data for modeling fire ignition probability at the country level; and (ii) to test the predictive power of the obtained model when applied from one country to the other and vice versa, and to create the corresponding ignition probability maps. This is the first study that uses ML methods to predict the ignition probability of forest fires in Austria and the Czech Republic using only variables derived from open-source data.

2. Materials and Methods
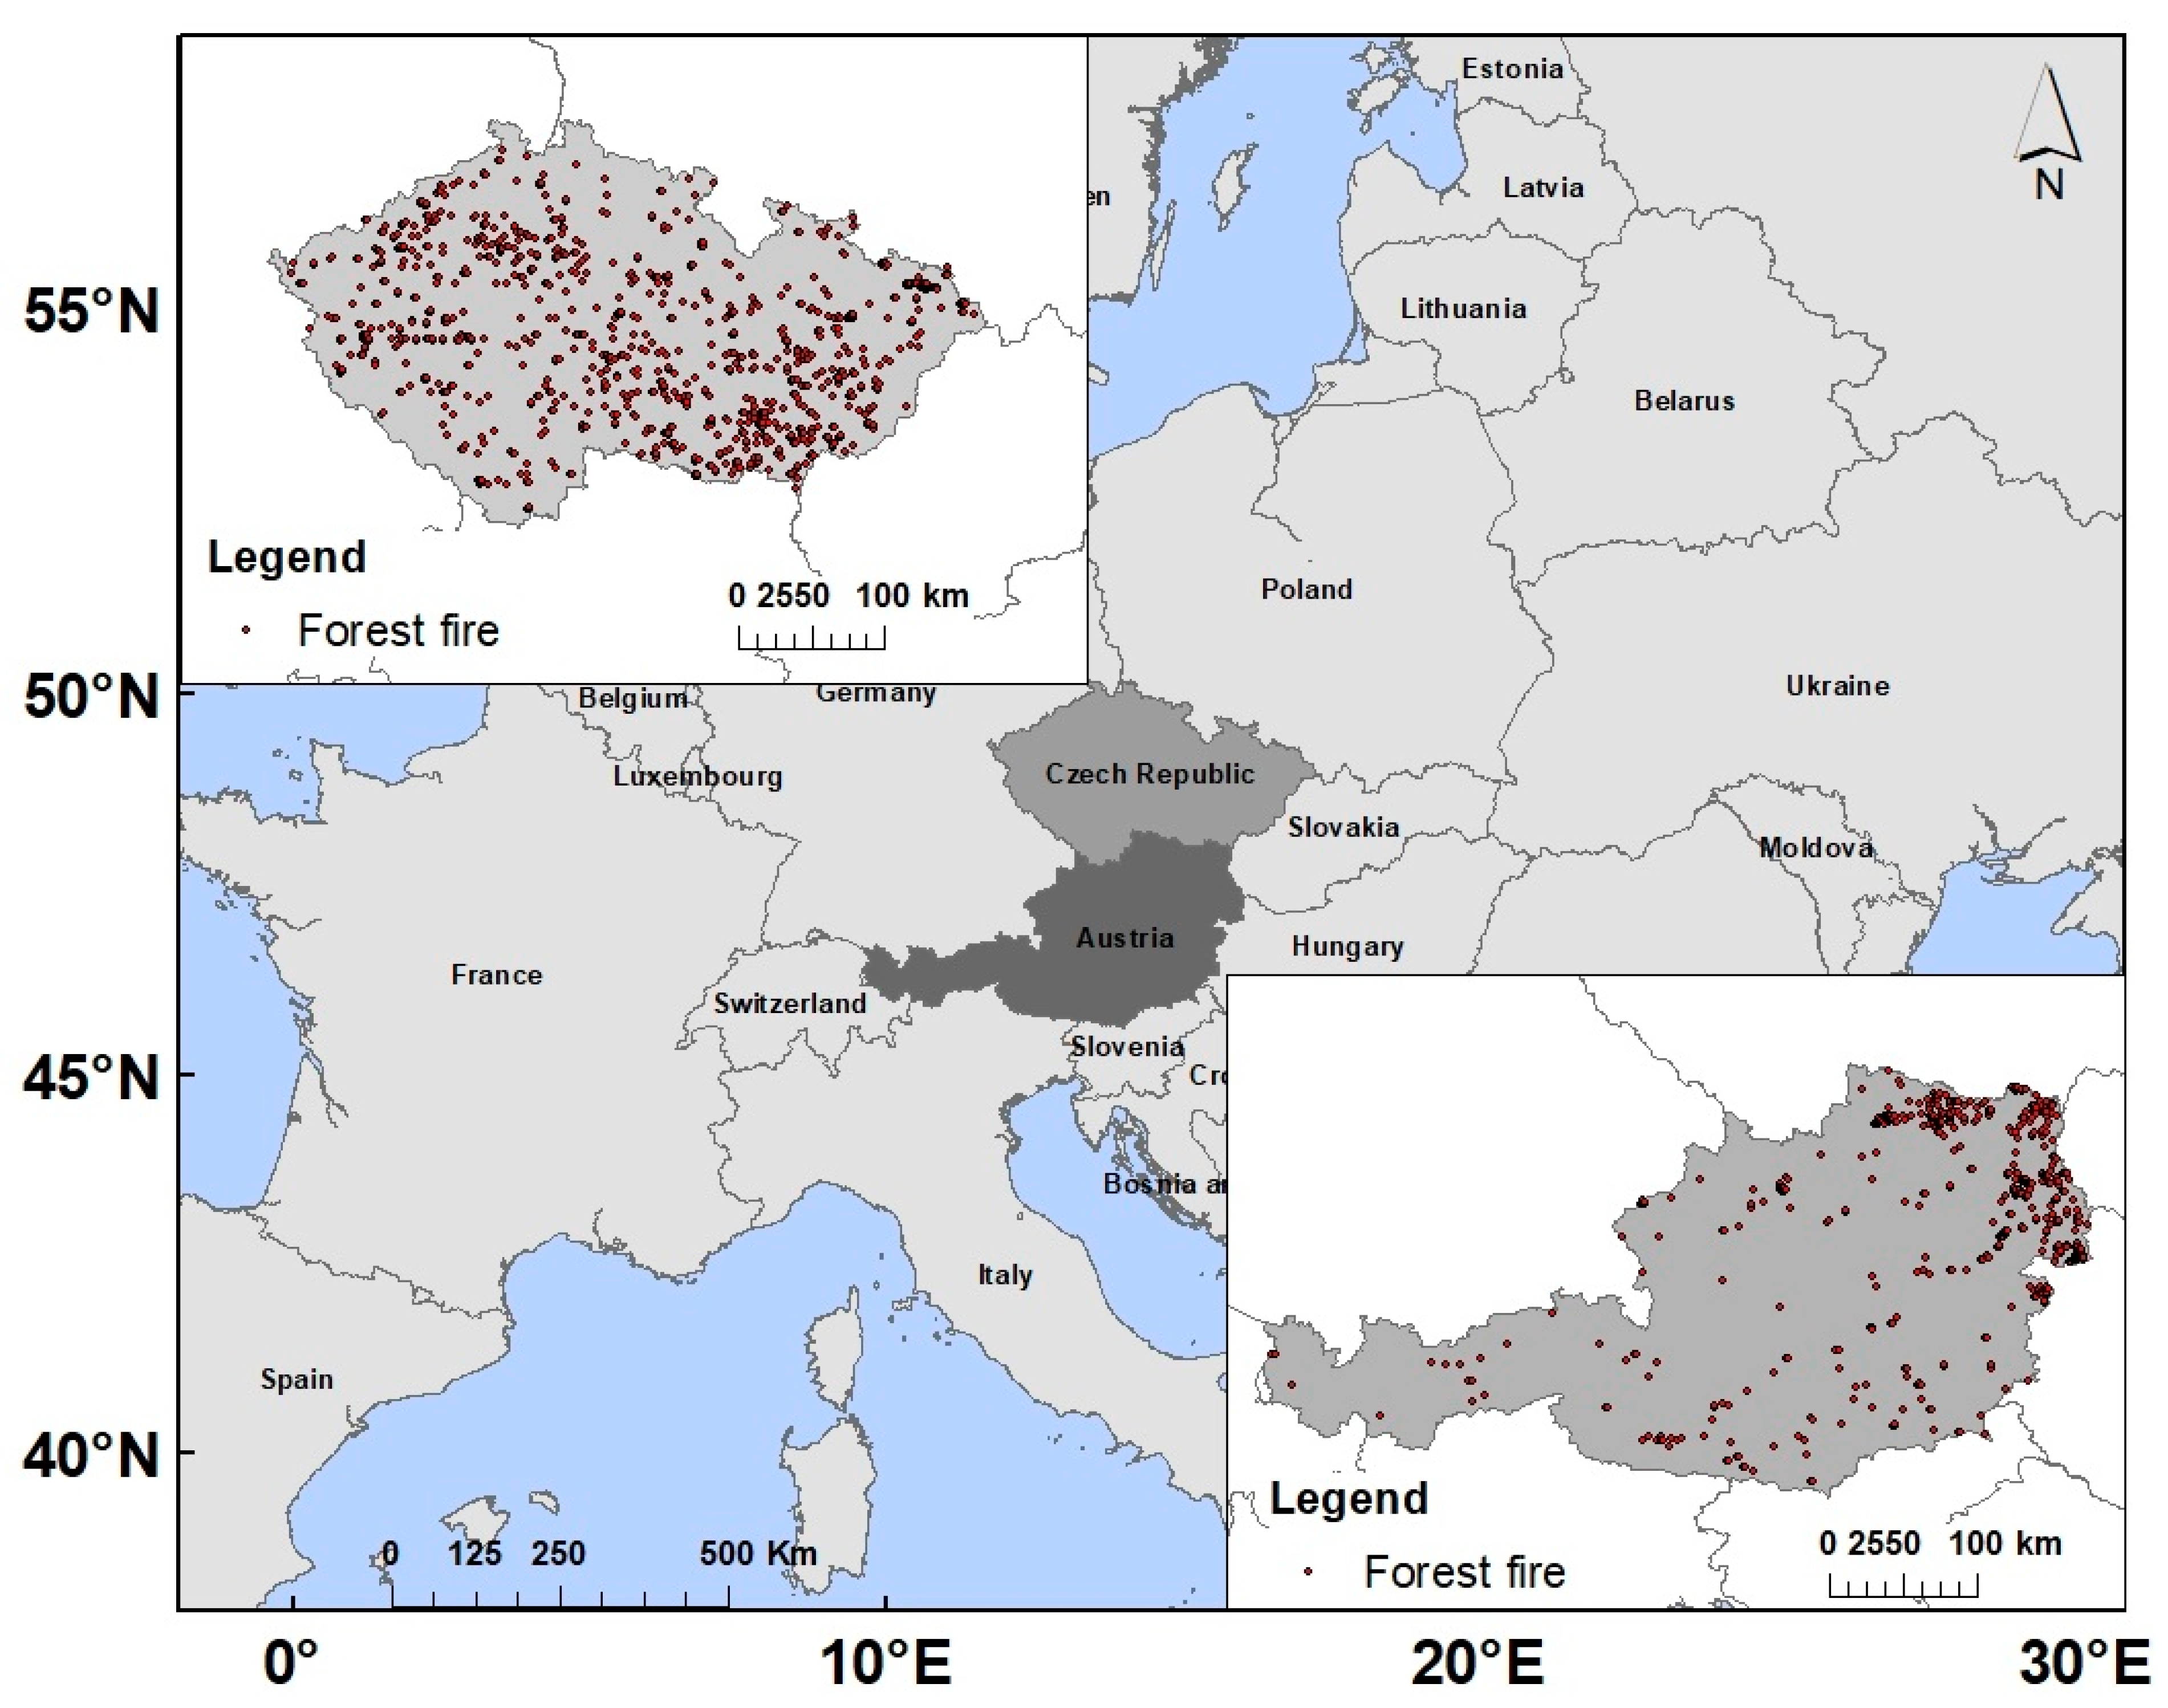
2.1. Study Areas

The two Central European countries included in this study are similar in size and share a border of 466 km. Austria has an area of 83,882 km² and the Czech Republic covers an area of 78,866 km² (Figure 1). Austria is a predominantly alpine country with the highest peak at 3798 m above sea level, whereas the Czech Republic is a predominantly flat country with the highest peak at 1603 m. Both countries belong to the temperate climate zone, where humid westerly winds prevail. Temperatures vary with altitude. Specifically, at higher altitudes, the temperature decreases and precipitation increases. On the other hand, in eastern areas, a continental climate with little precipitation prevails, with warm summers and cold winters. In Austria, the average yearly temperature varies between −7 °C in the Alps and 12 °C in the lower parts; and the overall annual rainfall varies between 450 mm in the lower parts and 3000 mm in the Alps [31,32]. Meanwhile, the average yearly temperature in the Czech Republic varies between −0.4 °C in the alpine part and 10 °C in the lower parts of the southeast. The overall annual rainfall varies between 410 to 1705 mm; however, most of the country receives 500 to 700 mm of rainfall per year [33].
The forest area in Austria is more than four million hectares, which corresponds to 47.9% of Austria’s national territory. The most common tree species by growing stock (volume) are the Norway spruce (Picea abies L.) (60.2%), followed by the European beech (Fagus sylvatica L.) (10.3%), pines (Pinus sp.) (7.4 %), and the European larch (Larix decidua L.) (7.1%) [34]. In turn, the forest area in the Czech Republic is more than 2.6 million hectares, which corresponds to 34.1% of the national territory. In this case, the most common tree species by growing stock (volume) are the Norway spruce (48.8%), followed by the Scots pine (Pinus sylvestris L.) at 16.1%, and the European beech at 9.0% [35]. The fire season in the Czech Republic is characterized by two peaks in ignition frequency; the first during April and the second during August [36,37]. In almost 90% of forest fires, the burnt area is less than 1 ha. The main cause of forest fires is negligence, while natural causes such as lightning have a minor share [36]. The annual number of forest fires in Austria varies between 100 and 300. Similarly, most fires in the Czech Republic are recorded in Spring during April, and later in Summer during July and August. Approximately 40.5% of all forest fires in Austria are caused directly or indirectly by people, while 41.1% of forest fire ignition is due to undetermined causes [38]. On the other hand, lightning is a natural ignition source responsible for approximately 15% of all forest fires in Austria [39].
According to the Eurostat database, Austria and Czech Republic had 8,978,929 and 10,516,707 citizens, respectively, at the end of 2022 [40]. The total length of the road network in Austria is 137,552 km, while road density is 173.4 km per 100 square kilometers. The Czech Republic has 130,710 km of roads, with a road density of 165.7 km per 100 square kilometers. The total length of the rail in Austria is 5724 km, while the rail network density is 7.2 km per 100 square kilometers. The Czech Republic has a 9355 km long rail, with a rail network density of 11.9 km per 100 square kilometers.

2.2. Data Collection

2.2.1. Fire Events (the Dependent Variable)

Historical fire data were obtained from the NASA National Aeronautics and Space Administration Fire Information for Resource Management System [41] for the period between January 2000 and December 2020. Moderate resolution imaging spectroradiometer (MODIS) data from the Terra and Aqua platforms with a spatial resolution of 1 km were used as the dependent variable. All fire events with a confidence level higher than 50% (one or more) were attributed to each of the 1 × 1 km grid cells and were considered for further analysis. Grid cells with the occurrence of forest fires were labeled with “1” and those without forest fires with “0”. In all, 576 (out of 86,524) cells in Austria and 1007 (out of 80,099) cells in the Czech Republic were selected as “fire cells” and labeled with “1” for further analysis.

2.2.2. Predictors (the Independent Variables)

The independent variables were classified into four groups: topography, vegetation, climate, and anthropogenic factors. Variables that were specific to each of the primary groups were chosen according to prior knowledge of fire ignition [7,42,43,44,45,46,47]. Topographic features, including elevation (E), slope (S), aspect (A), and the topographic wetness index (TWI), were derived from the digital elevation model (DEM) of the study area. Average values for elevation (E), slope (S), dominant aspect (A), and TWI were computed for all polygons within a 1 × 1 km grid using ArcGIS software 10.2 (ESRI, Redlands, CA, USA).
Vegetational predictors were downloaded from the CORINE 2018 database [48]. The following land cover classes (CLC) were extracted as a vector layer and used for further analysis: broad-leaved forest (BF), coniferous forest (CF), mixed forest (MF), natural grasslands (NG), moors and heathland (MH), transitional woodland–shrub (TWS), and sparsely vegetated areas (SVA) (Figure 2). The CLC vector layer was then intersected with the 1 × 1 km polygon grid data creating a new layer with a respective table of attributes containing information about the polygon grid object and area covered by the selected CLC layer.
We considered the following bioclimatic variables as potential predictors of forest fire ignition in both countries: mean temperature of the warmest quarter of the year (MTempWrQ), mean temperature of the driest quarter (MTempDQ), precipitation in the warmest quarter (PrecWrQ), and precipitation in the driest quarter (PrecDQ). Bioclimatic variables were downloaded from the WorldClim portal [49] as GeoTiff files with a spatial resolution of 30 s (~1 km2).
To assess the effect of anthropogenic predictors of forest fire ignition, data about roads, railroads, populated places, and agricultural land were obtained from the OpenStreetMap [50]. Distance from the center of the 1 × 1 km grid layer to the nearest object such as building (DisBld), roads (DisRo_A, DisRo_B, and DisRo_C), railway (DisRa), and agricultural land (DisAgL) was computed in the ArcGIS environment. Population density (PopD) was obtained as a raster dataset available from the Center for International Earth Science Information Network (CIESIN), Columbia University [51], as a GeoTiff file. The Zonal Statistic Tool of the ArcGIS software was used to calculate the sum of the number of people per polygon.
All acquired information was stored in the databases for both countries separately, and used later for data processing, model building, and model transferability testing (Figure 2).

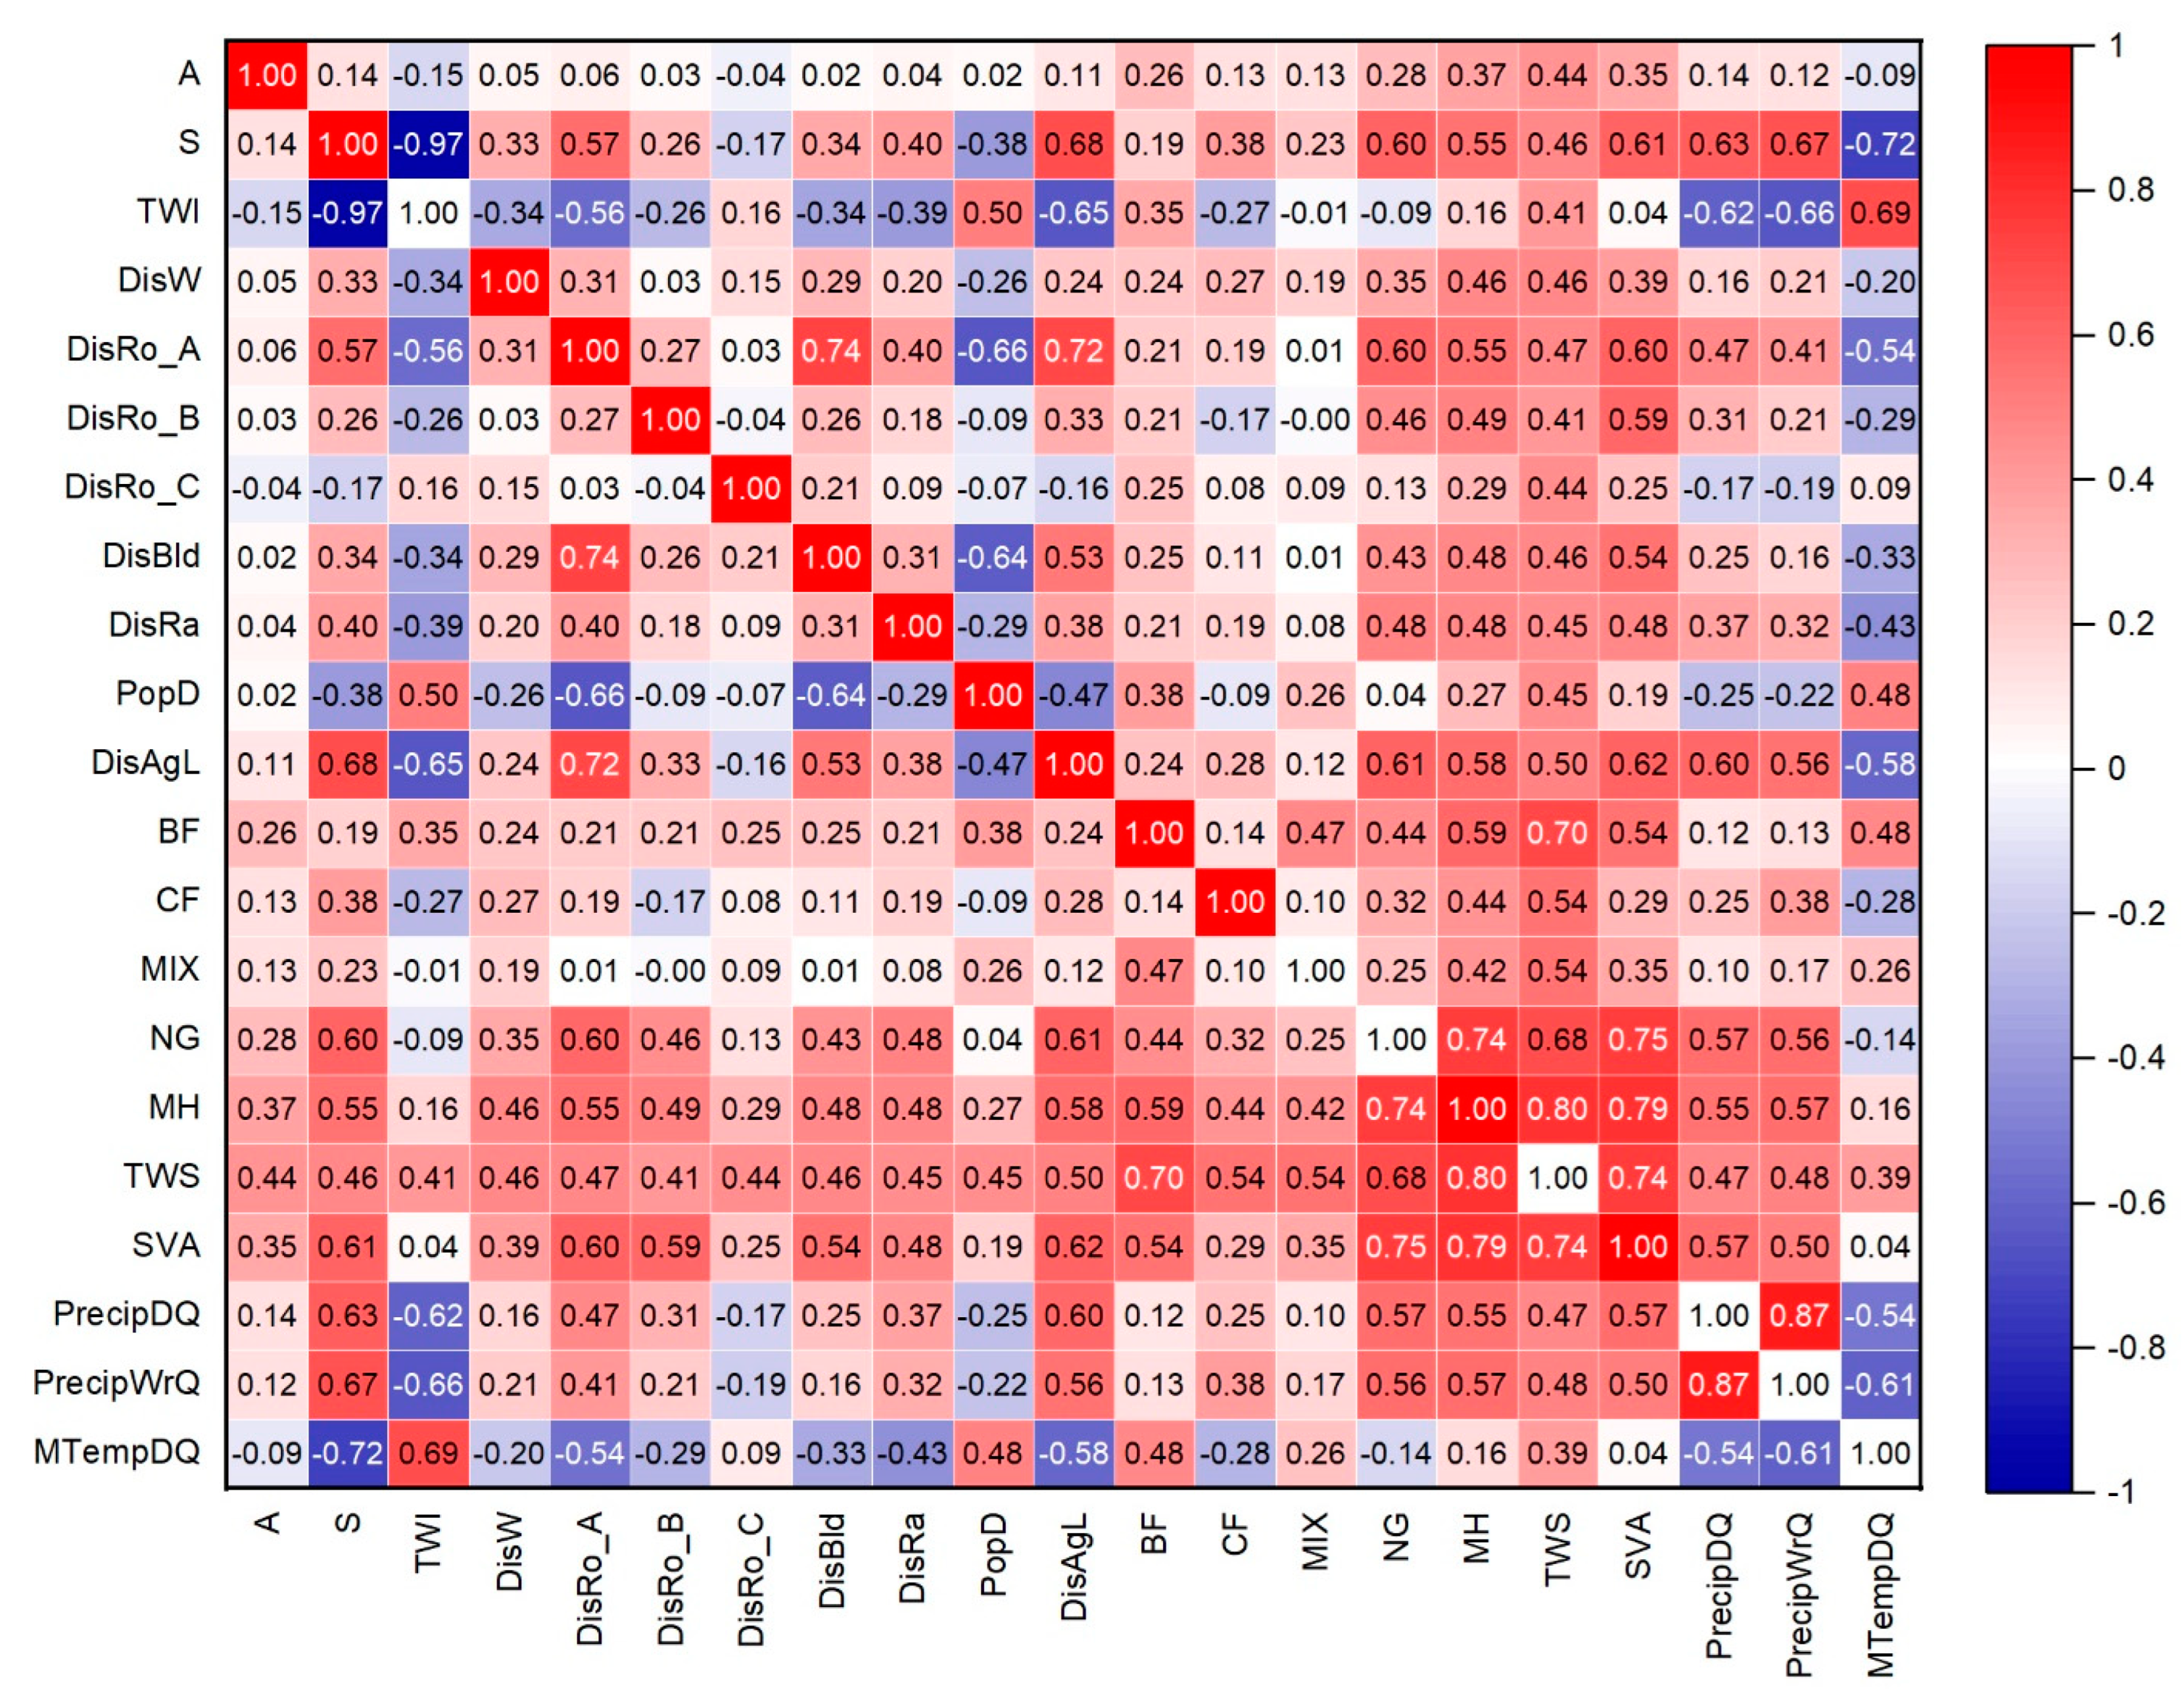
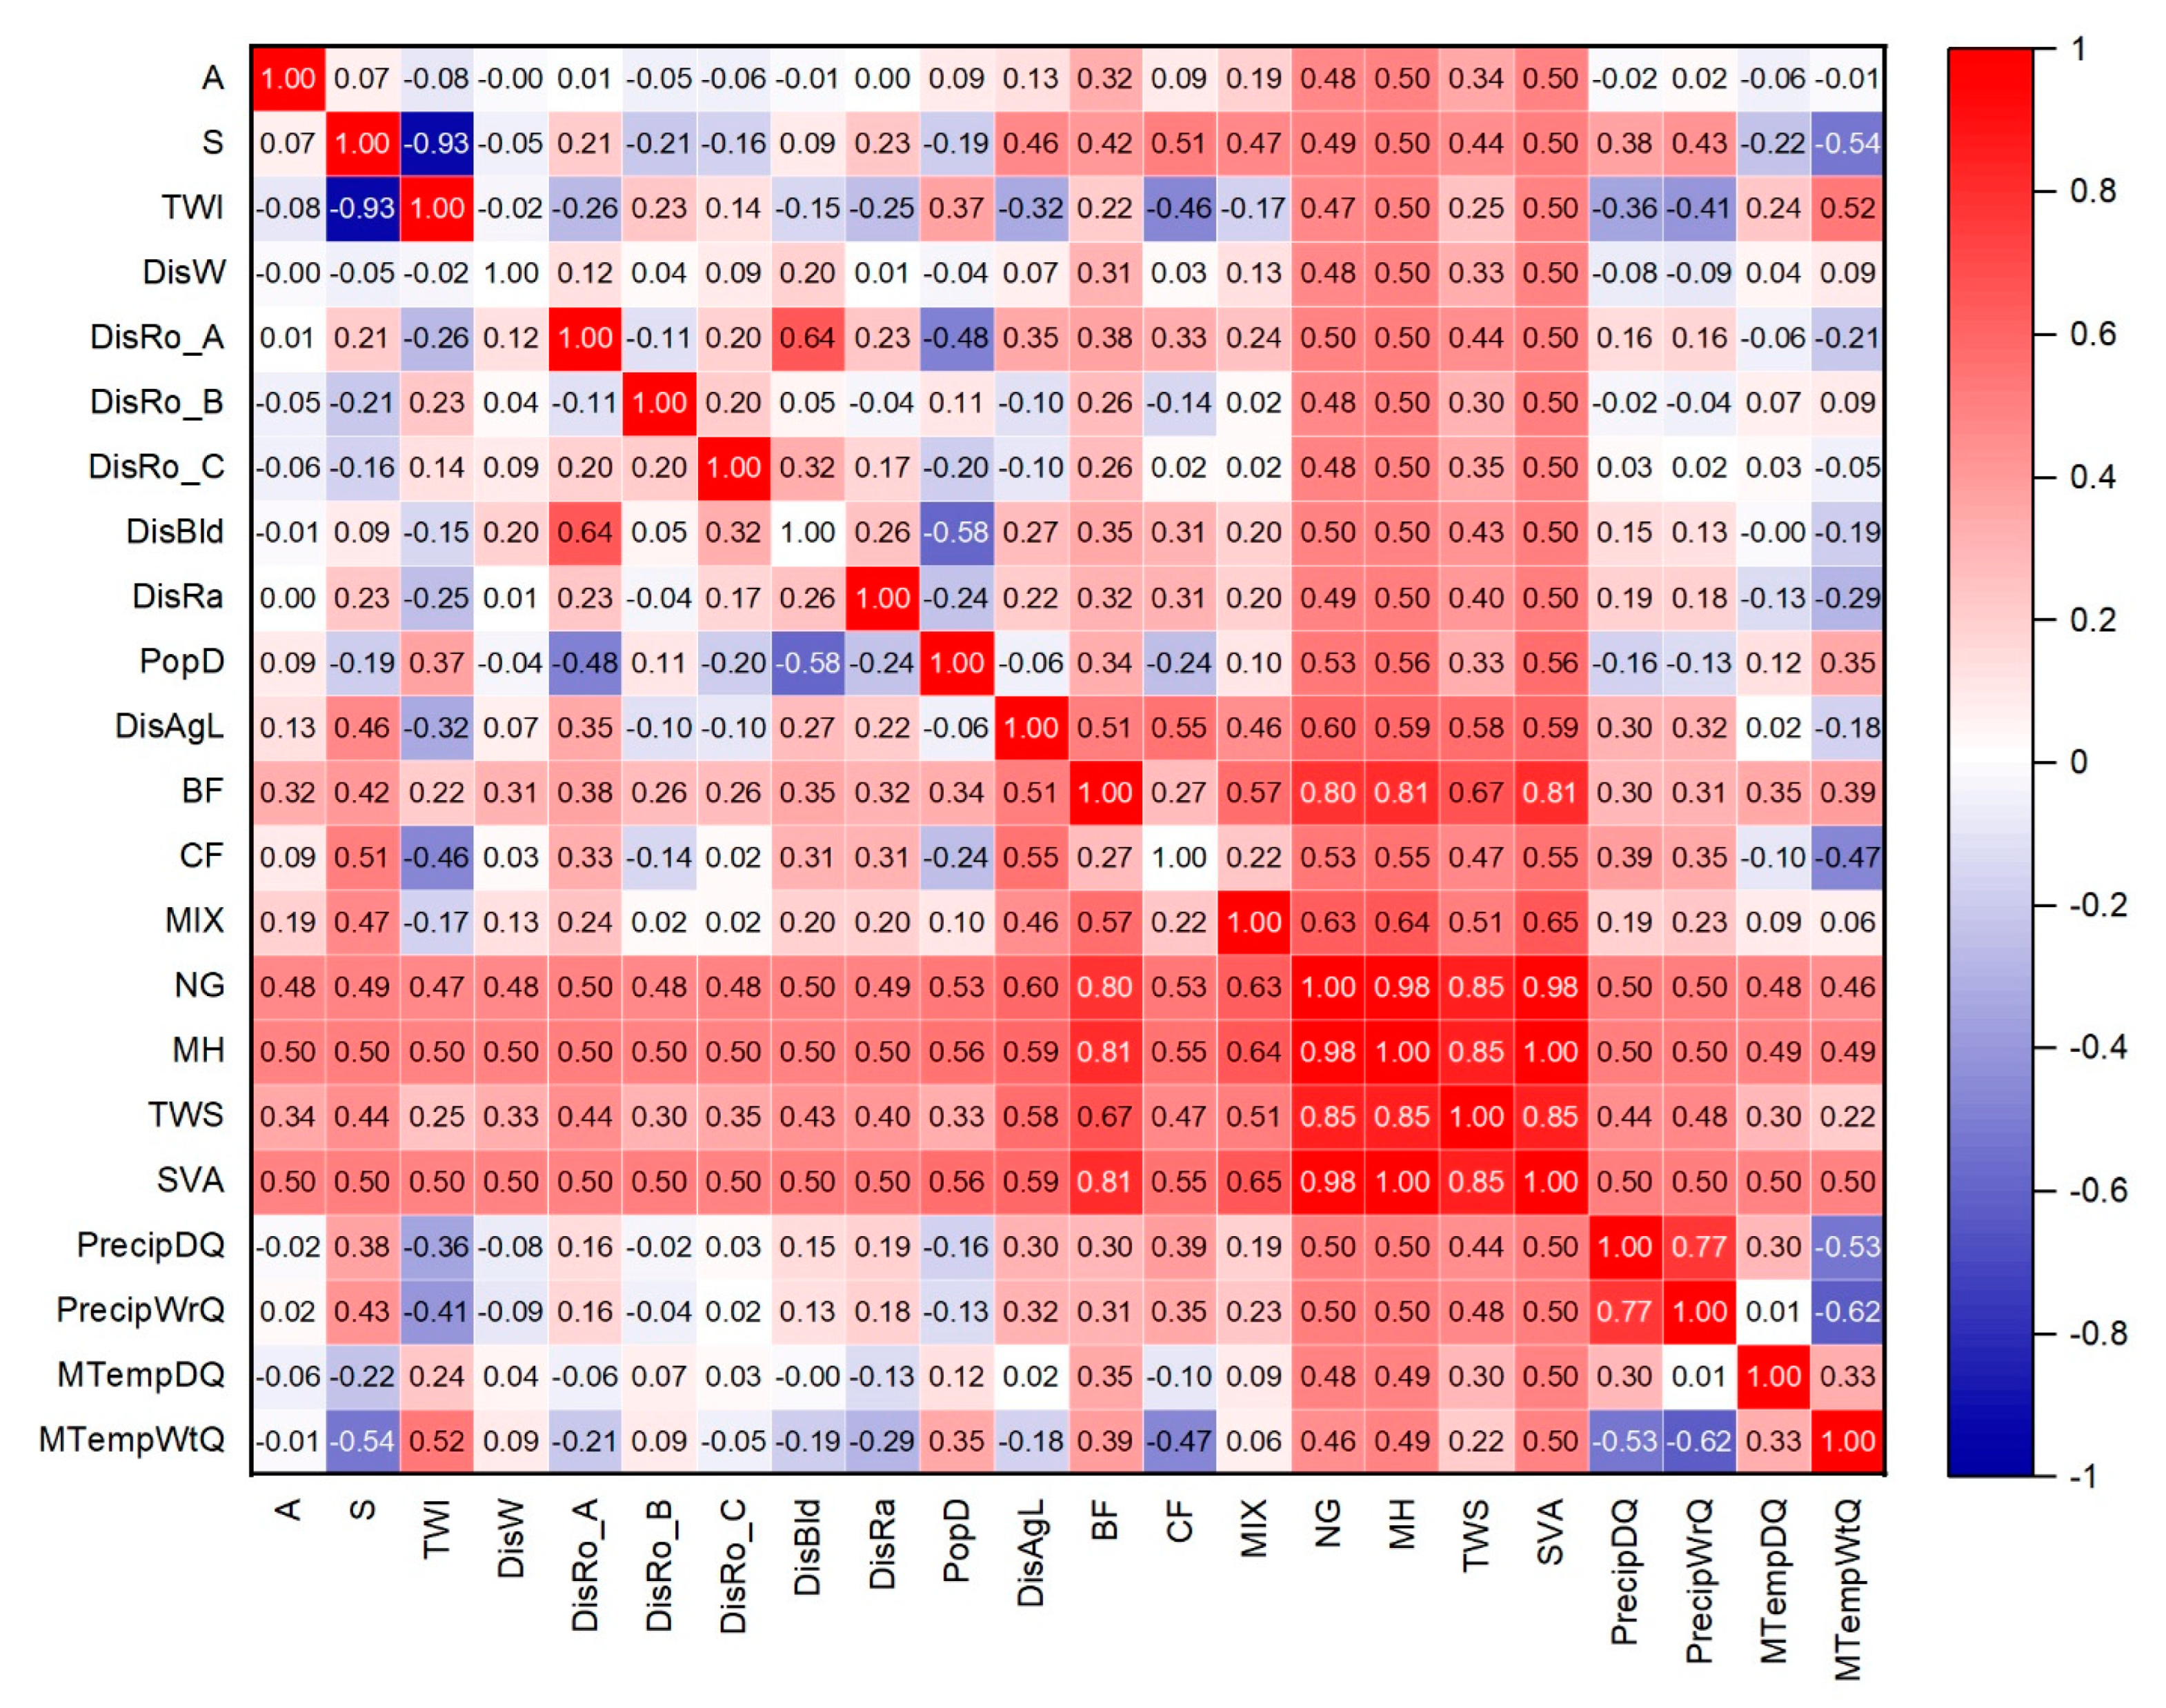
2.3. Variable Evaluation and Selection

Based on a comprehensive literature review and personal experience, we preselected 24 potential variables for further analysis (Table A1). All variables were checked for multicollinearity in two steps. First, the variables were evaluated for multicollinearity by the variance inflation factor (VIF) [52]. Only variables with a VIF of ≤10 were selected for further analysis (Table A1). We followed the procedure described by Kuhn and Johnson [53] to perform the second step. In short, Spearman’s rho correlation matrix was calculated for all variables remaining after VIF analysis. Then, conflicting pairs of variables with a correlation coefficient > 0.7 were identified. One of the variables from the conflicting pairs was removed in the second step if the model performance, measured by the AUC (area under curve) value, was reduced when this variable was included in the model. As a final step, we recalculated the correlation matrix until no two variables had a correlation coefficient > 0.7 (Figure A1 and Figure A2). This procedure was independently performed for the Austrian and Czech datasets. Thus, we separately ranked and selected the variables for each spatial entity. The maximum number of variables that could be included in the model was defined for each dataset based on the number of fire events [54]. Finally, variable importance in the RF was assessed using the Gini impurity function for a classification problem [55]. A variable with a value of 1 is considered to be most important in RF when the variable importance measures are averaged across all trees in the forest.

2.4. Model Training and Validation

We used Statistica 14.0.0.15 to build a Random Forest (RF) model [25] for both Austria (AT) and the Czech Republic (CZ). We trained the model using 70% of the data, and independently evaluated it based on the remaining 30% using the receiver operating characteristic (ROC) curve within OriginPro software ver. 2023 (OriginLab Corporation, Northampton, MA, USA). An area under the ROC curve (AUC) with 0.5–0.7 indicates low performance; in turn, an AUC with 0.7–0.8 indicates good performance; while an AUC with 0.8–0.9 indicates excellent performance; and an AUC > 0.9 indicates outstanding model performance [56].
Forest fire modeling based on binary classification yielded a confusion matrix in which the rows indicate the observed classes and the columns indicate the predicted classes. From this matrix, the following metrics were extracted: the number of fire cells correctly predicted as fire cells (true positive, TP), the number of non-fire cells correctly predicted as non-fire cells (true negative, TN), the number of non-fire cells incorrectly predicted as fire cells (false positive, FP), and the number of fire cells incorrectly predicted as non-fire cells (false negative, FN) [57,58]. We used these four metrics to compute accuracy (Acc) and precision (Prec):
A C C = ( T P + T N ) ( T P + F P + T N + F N )
P r e c = ( T P ) ( T P + F P )
To designate each cell as a fire or non-fire cell for each country, we determined a cutoff point using the sensitivity equal-specificity method [59] available in the easyROC web tool [60]. The probability estimated by the model for each cell was then compared to the optimal cutoff point. If the probability estimated by the model for a particular cell was higher than the optimal cutoff point, the cell was categorized as a fire cell. In contrast, the particular cell was categorized as a non-fire cell if the estimated probability was lower than the optimal cutoff point.
The selection of the variables for the model followed the procedure described by Ye et al. [44] and Genuer et al. [61]. Each variable was included in the model N-1 times, where N represents the number of variables that met the criteria of VIF < 10 and Spearman’s rho correlation < 0.7; therefore, they were considered predictors for each country. The RF models were run N times and another variable was excluded in each iteration. The obtained variable importance, ranked from 0 to 1, was used to calculate the relative variable importance, which represents an average value from all iterations for a specific variable. All variables were assigned a value ranging from 1 to N based on their average importance. The highest important variable was assigned 1, and the least important variable was assigned N. RF models with 1–N variables were generated and evaluated before the selection of the best model for each country. All RF analyses were performed using the optimal number of trees in the forest (ntree) with a default value of mtry, which was equal to the square root of the number of variables included in the model, and which represents the number of variables at each split. In the final models for both countries, mtry was set up as 4, since the number of predictors were 12 and 14 in AT and CZ datasets, respectively. The ntree was set up as 500 in both models because for the given number of mtry there is no significant improvement in the accuracy with an increase in the number of trees in the forest [62]. The same number of trees was used in similar studies related to wildland fire occurrence prediction [63,64].

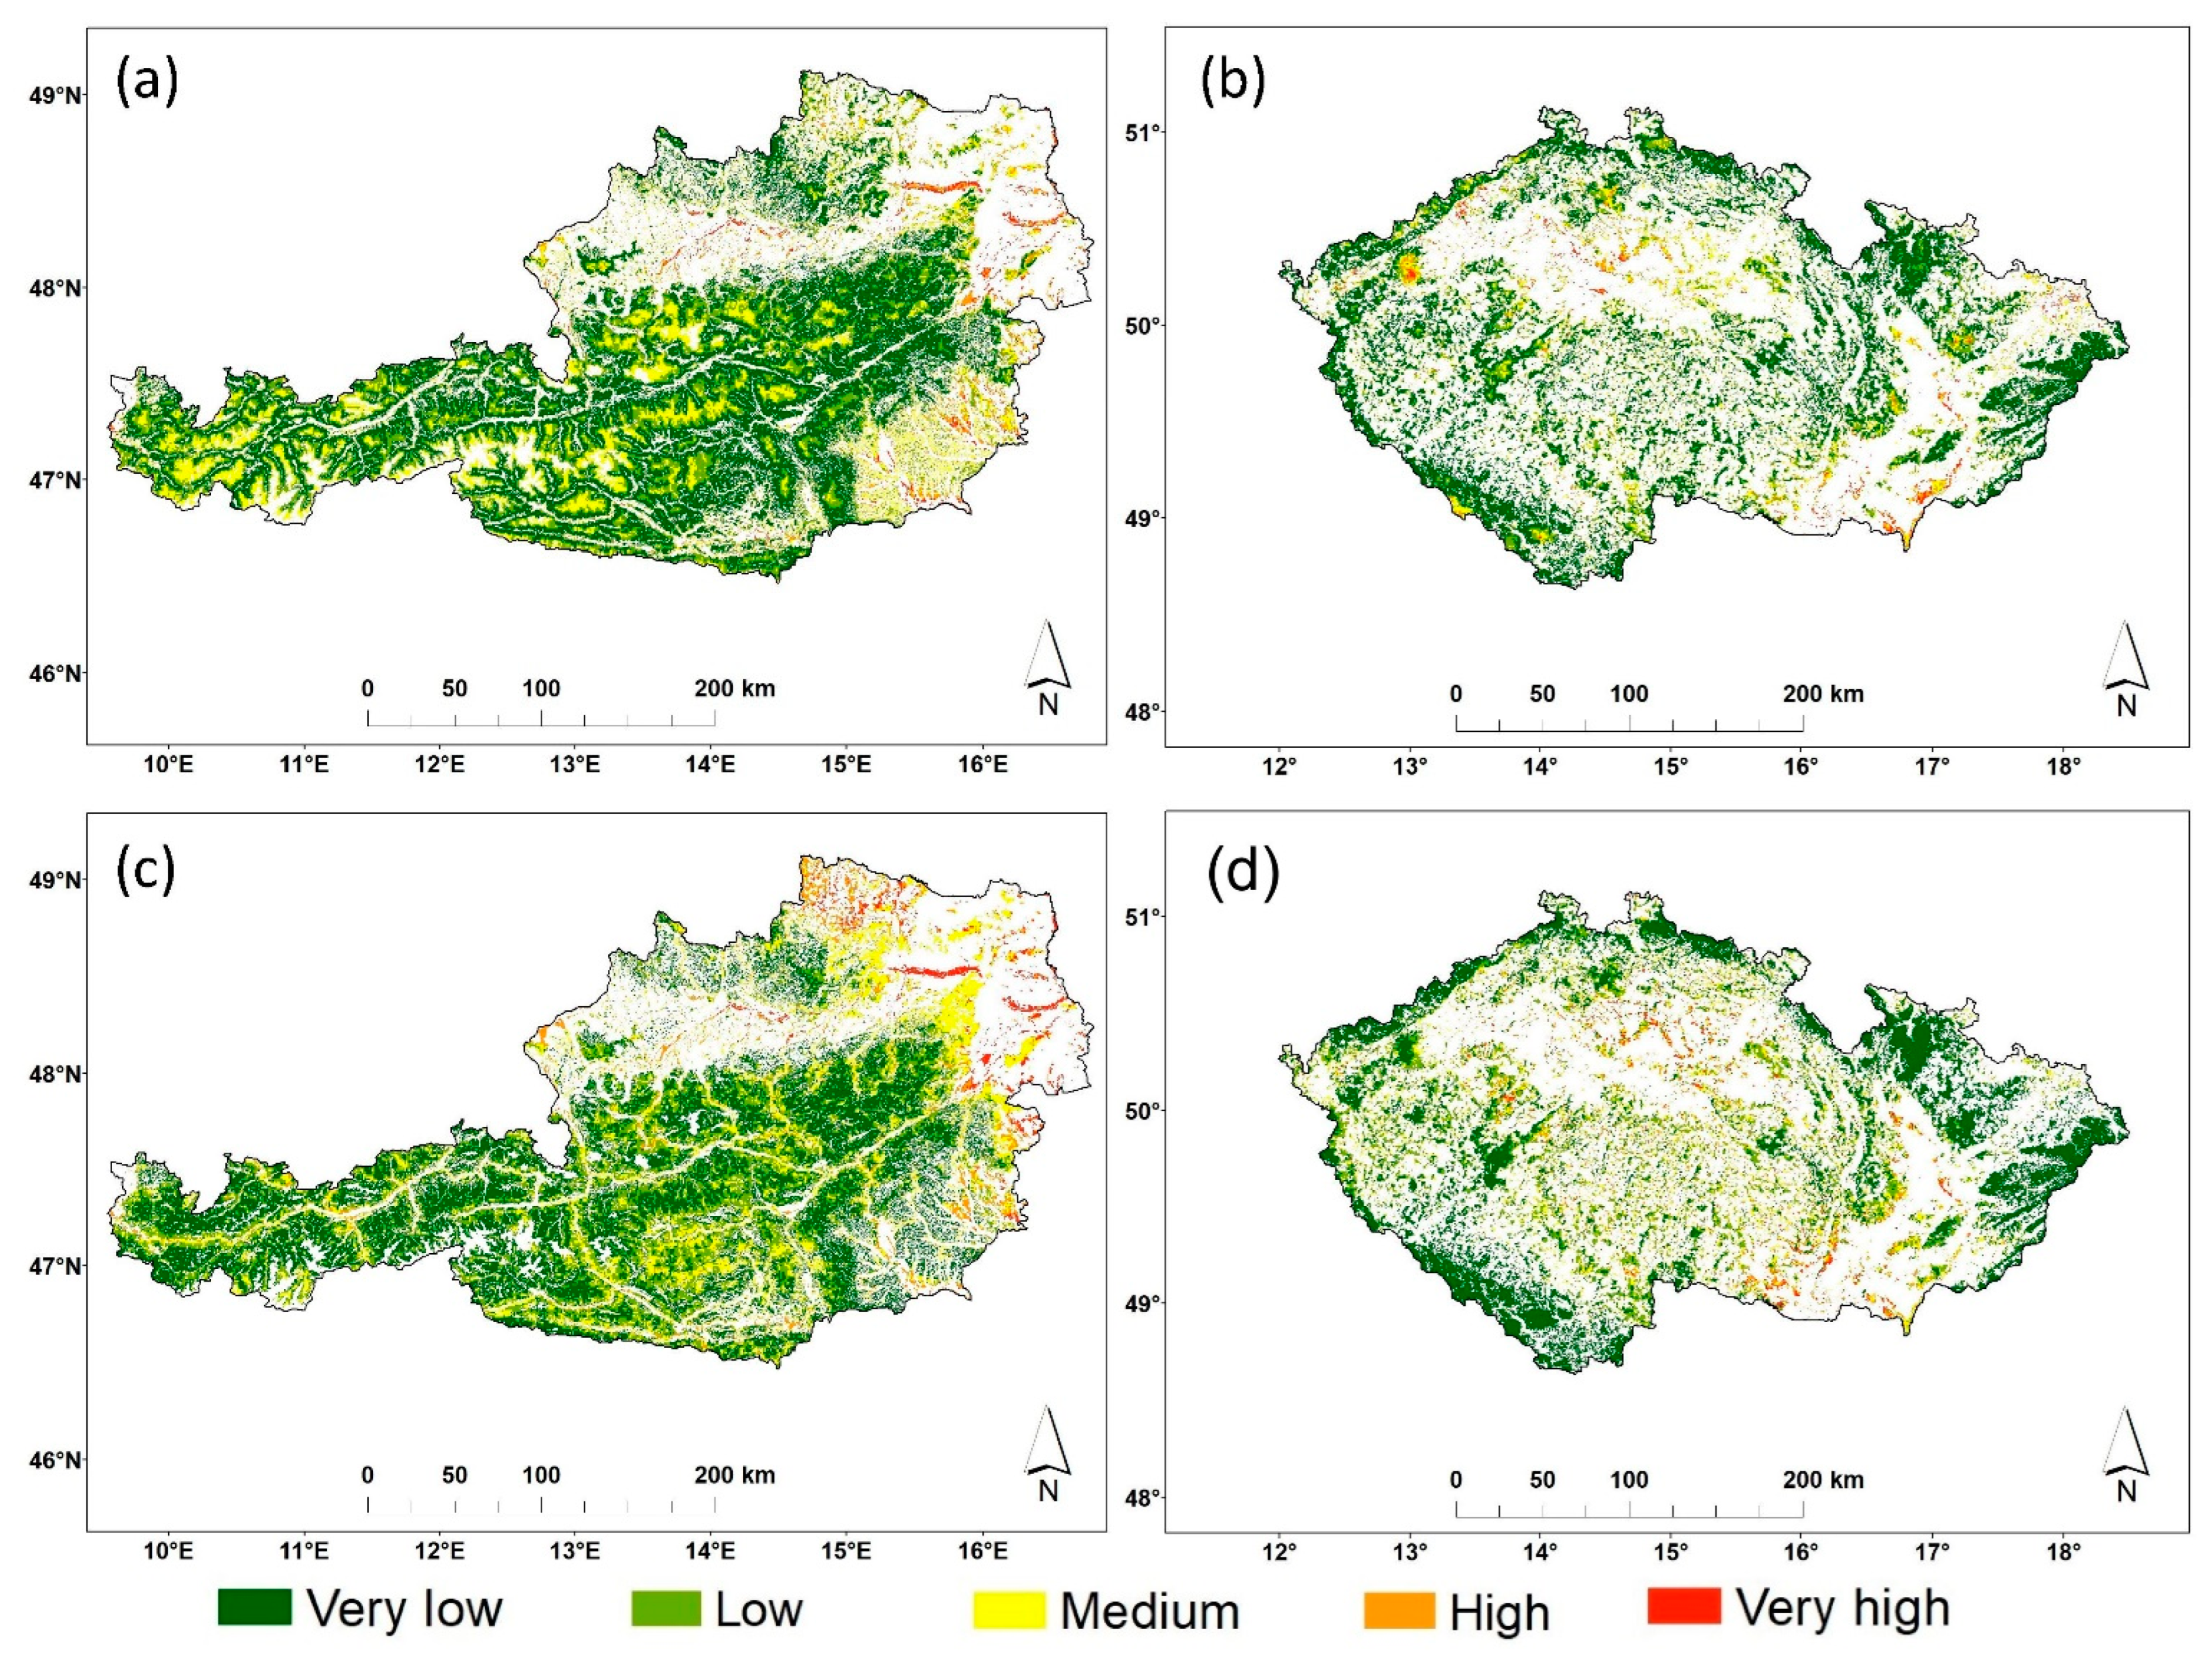
2.5. Probability Mapping

The RF models were utilized to estimate forest fire ignition probabilities for both fire cells and non-fire cells. Subsequently, ArcGIS 10.2 was employed to produce corresponding maps for each country. The probability maps were classified into five categories based on the percentile method: very low (1–40 %), low (21–65 %), medium (66–85 %), high (86–95 %), and very high (96–100 %) forest fire ignition probability [65]. Maps were generated based on the original country model, and by transferring the original country-specific models from one country to another; that is, by applying the AT model to the Czech Republic and CZ model to Austria. In all, four maps were generated: two “authentic” and two with transferred models.

2.6. Transferability of the Forest Fire Probability Models

The transferability of the forest fire probability models from one country to another was evaluated primarily using the AUC, Acc, and Prec metrics (Section 2.4). The metrics were compared between the original models for both countries, and the models generated for one country and applied to the other country dataset. The performance of the model was further assessed by comparing the distribution of fire events across probability classes [7,42,43].

3. Results

3.1. Variable Contribution to Forest Fire Occurrence

Among the 24 preselected explanatory variables (Table A1), the conditions of VIF ≤ 10 and Spearman’s rho < 0.7 were met by 12 variables included in the AT model and by 14 in the CZ model (Table 1). The topographic wetness index (TWI) had the highest influence on fire probability in the AT model, followed by precipitation in the warmest quarter (PrecWrQ), distance to rail (DisRa), distance to roads (DisRo C), and distance to agricultural land (DisAgL). Coniferous forest (CF) was found to be the least significant variable in the AT model. The slope (S) had the highest influence on fire probability in the CZ model, followed by distance to rail (DisRa), mean temperature of the warmest quarter (MTempWrQ), and distance to buildings (DisBld). The least important variable in the CZ model was the distance to agricultural land (DisAgL) (Table 1).

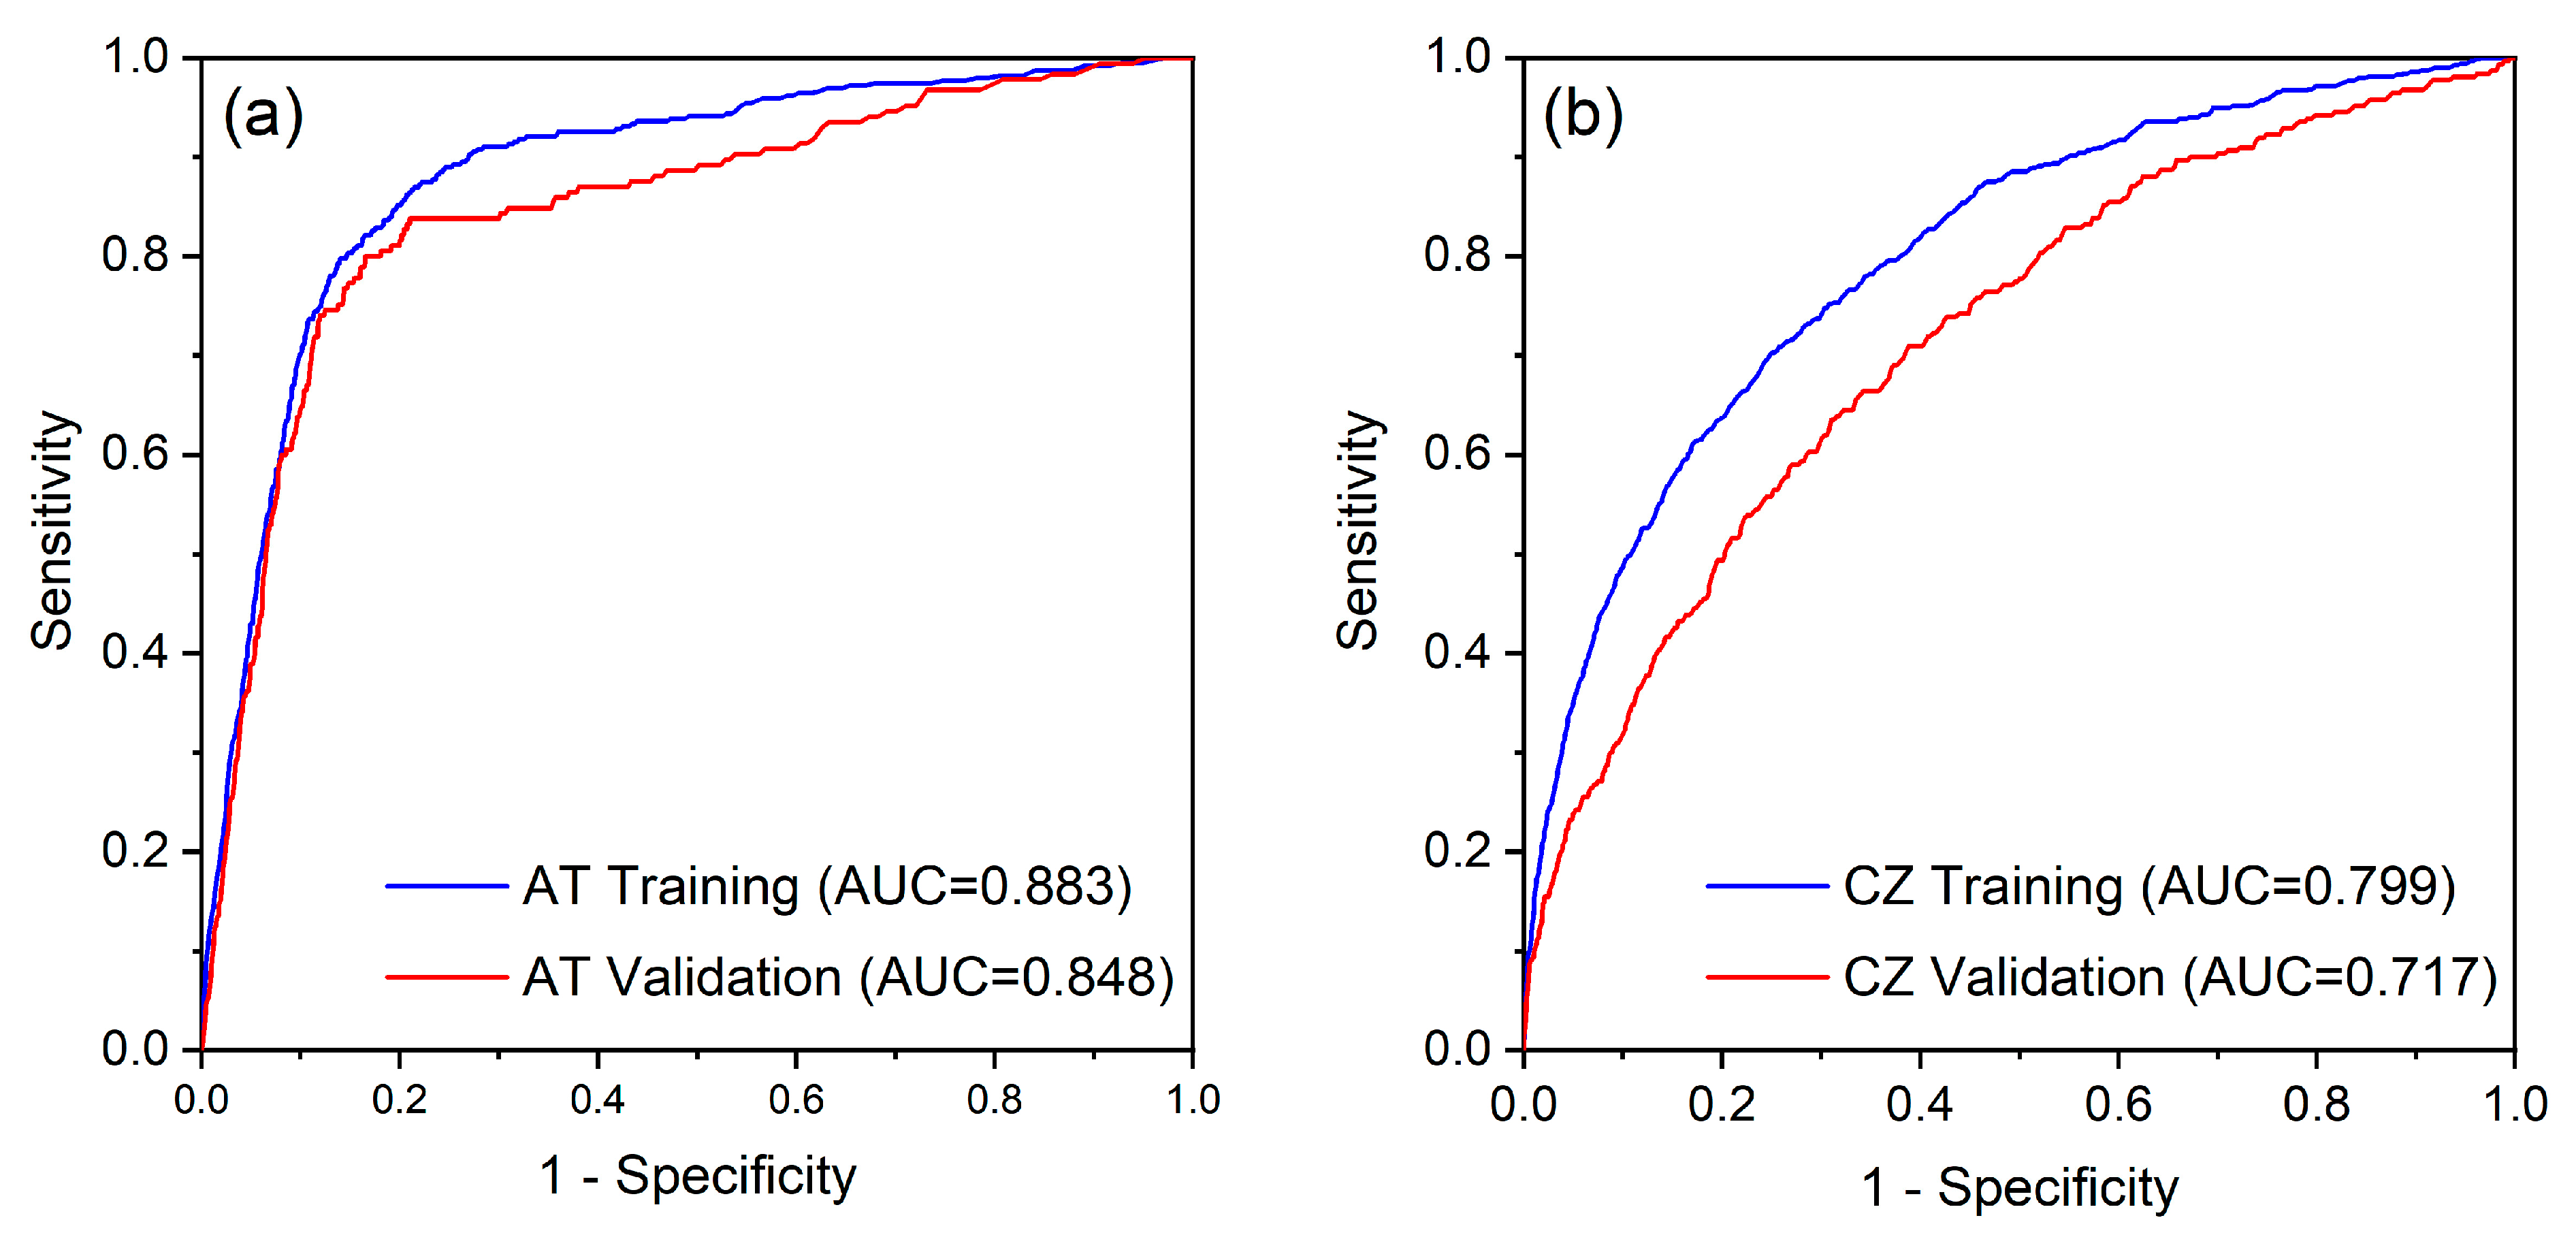
3.2. Model Evaluation

In the training phase, the AUC values of the RF models applied to the AT and CZ datasets were 0.883 and 0.799, respectively (Figure 3). In the validation phase, the values were 0.848 (AT) and 0.717 (CZ), respectively. The AT model had higher Acc (82.1%) and Prec (83.9%) in the training data set compared to the CZ model (Acc: 66.5%; Prec: 76.8%). In the validation data set, Acc (81.9%) and Prec (80.5%) of the AT model were higher than in the CZ model (Acc: 66.0%, Prec: 66.1%) (Table 2).
According to the AT model and CZ model applied to the AT dataset (CZ to AT), zones with a very high probability of forest fire ignition in Austria are located in the eastern and southeastern regions of the country and range from 1.5% (AT) to 2.2% (AT to CZ) at the country level. In contrast, areas with a very low probability of forest fire occurrence are situated in the central and southwestern parts of Austria, accounting for 49.4% (AT) to 43.4% (CZ to AT) of the forested land (Figure 4). On the other hand, the authentic CZ model indicates that zones with a very high probability of forest fire ignition in the Czech Republic are located in the eastern and southeastern regions, consistent with when the AT model was applied to the CZ dataset (AT to CZ). At the country level, these variations range from 1.8% (CZ) to 2.8% (AT to CZ). Furthermore, areas with a very low probability of forest fire occurrence in the Czech Republic are situated in the southern, southwestern, and northern regions, accounting for 59.7% (CZ) to 51.6% (AT to CZ) of the forested land (Figure 4).
The predictive ability of the AT and CZ models was additionally assessed by applying them to the country of origin or to the dataset of the other country. Acc and Prec of the observed and predicted values from the confusion matrix were used to evaluate the predictive ability of the models. The Acc values of the AT and CZ models applied to the Austrian dataset were 82.0% and 82.5%, respectively. When the same models were applied to the Czech Republic dataset, Acc was 66.4% for the CZ model and 13.6% for the AT model (Table 3). The AUC for the AT and CZ models applied to the Austrian dataset were 0.872 and 0.808, respectively. When the same models were applied to the dataset of the Czech Republic, the AUC values were 0.774 for the CZ model and 0.582 for the AT model (Figure 5). The AT model applied to the Austrian and Czech Republic datasets demonstrated high and very high precision, respectively. In contrast, the CZ model applied to the Austrian and Czech Republic datasets demonstrated acceptable and moderate precisions, respectively (Table 3).

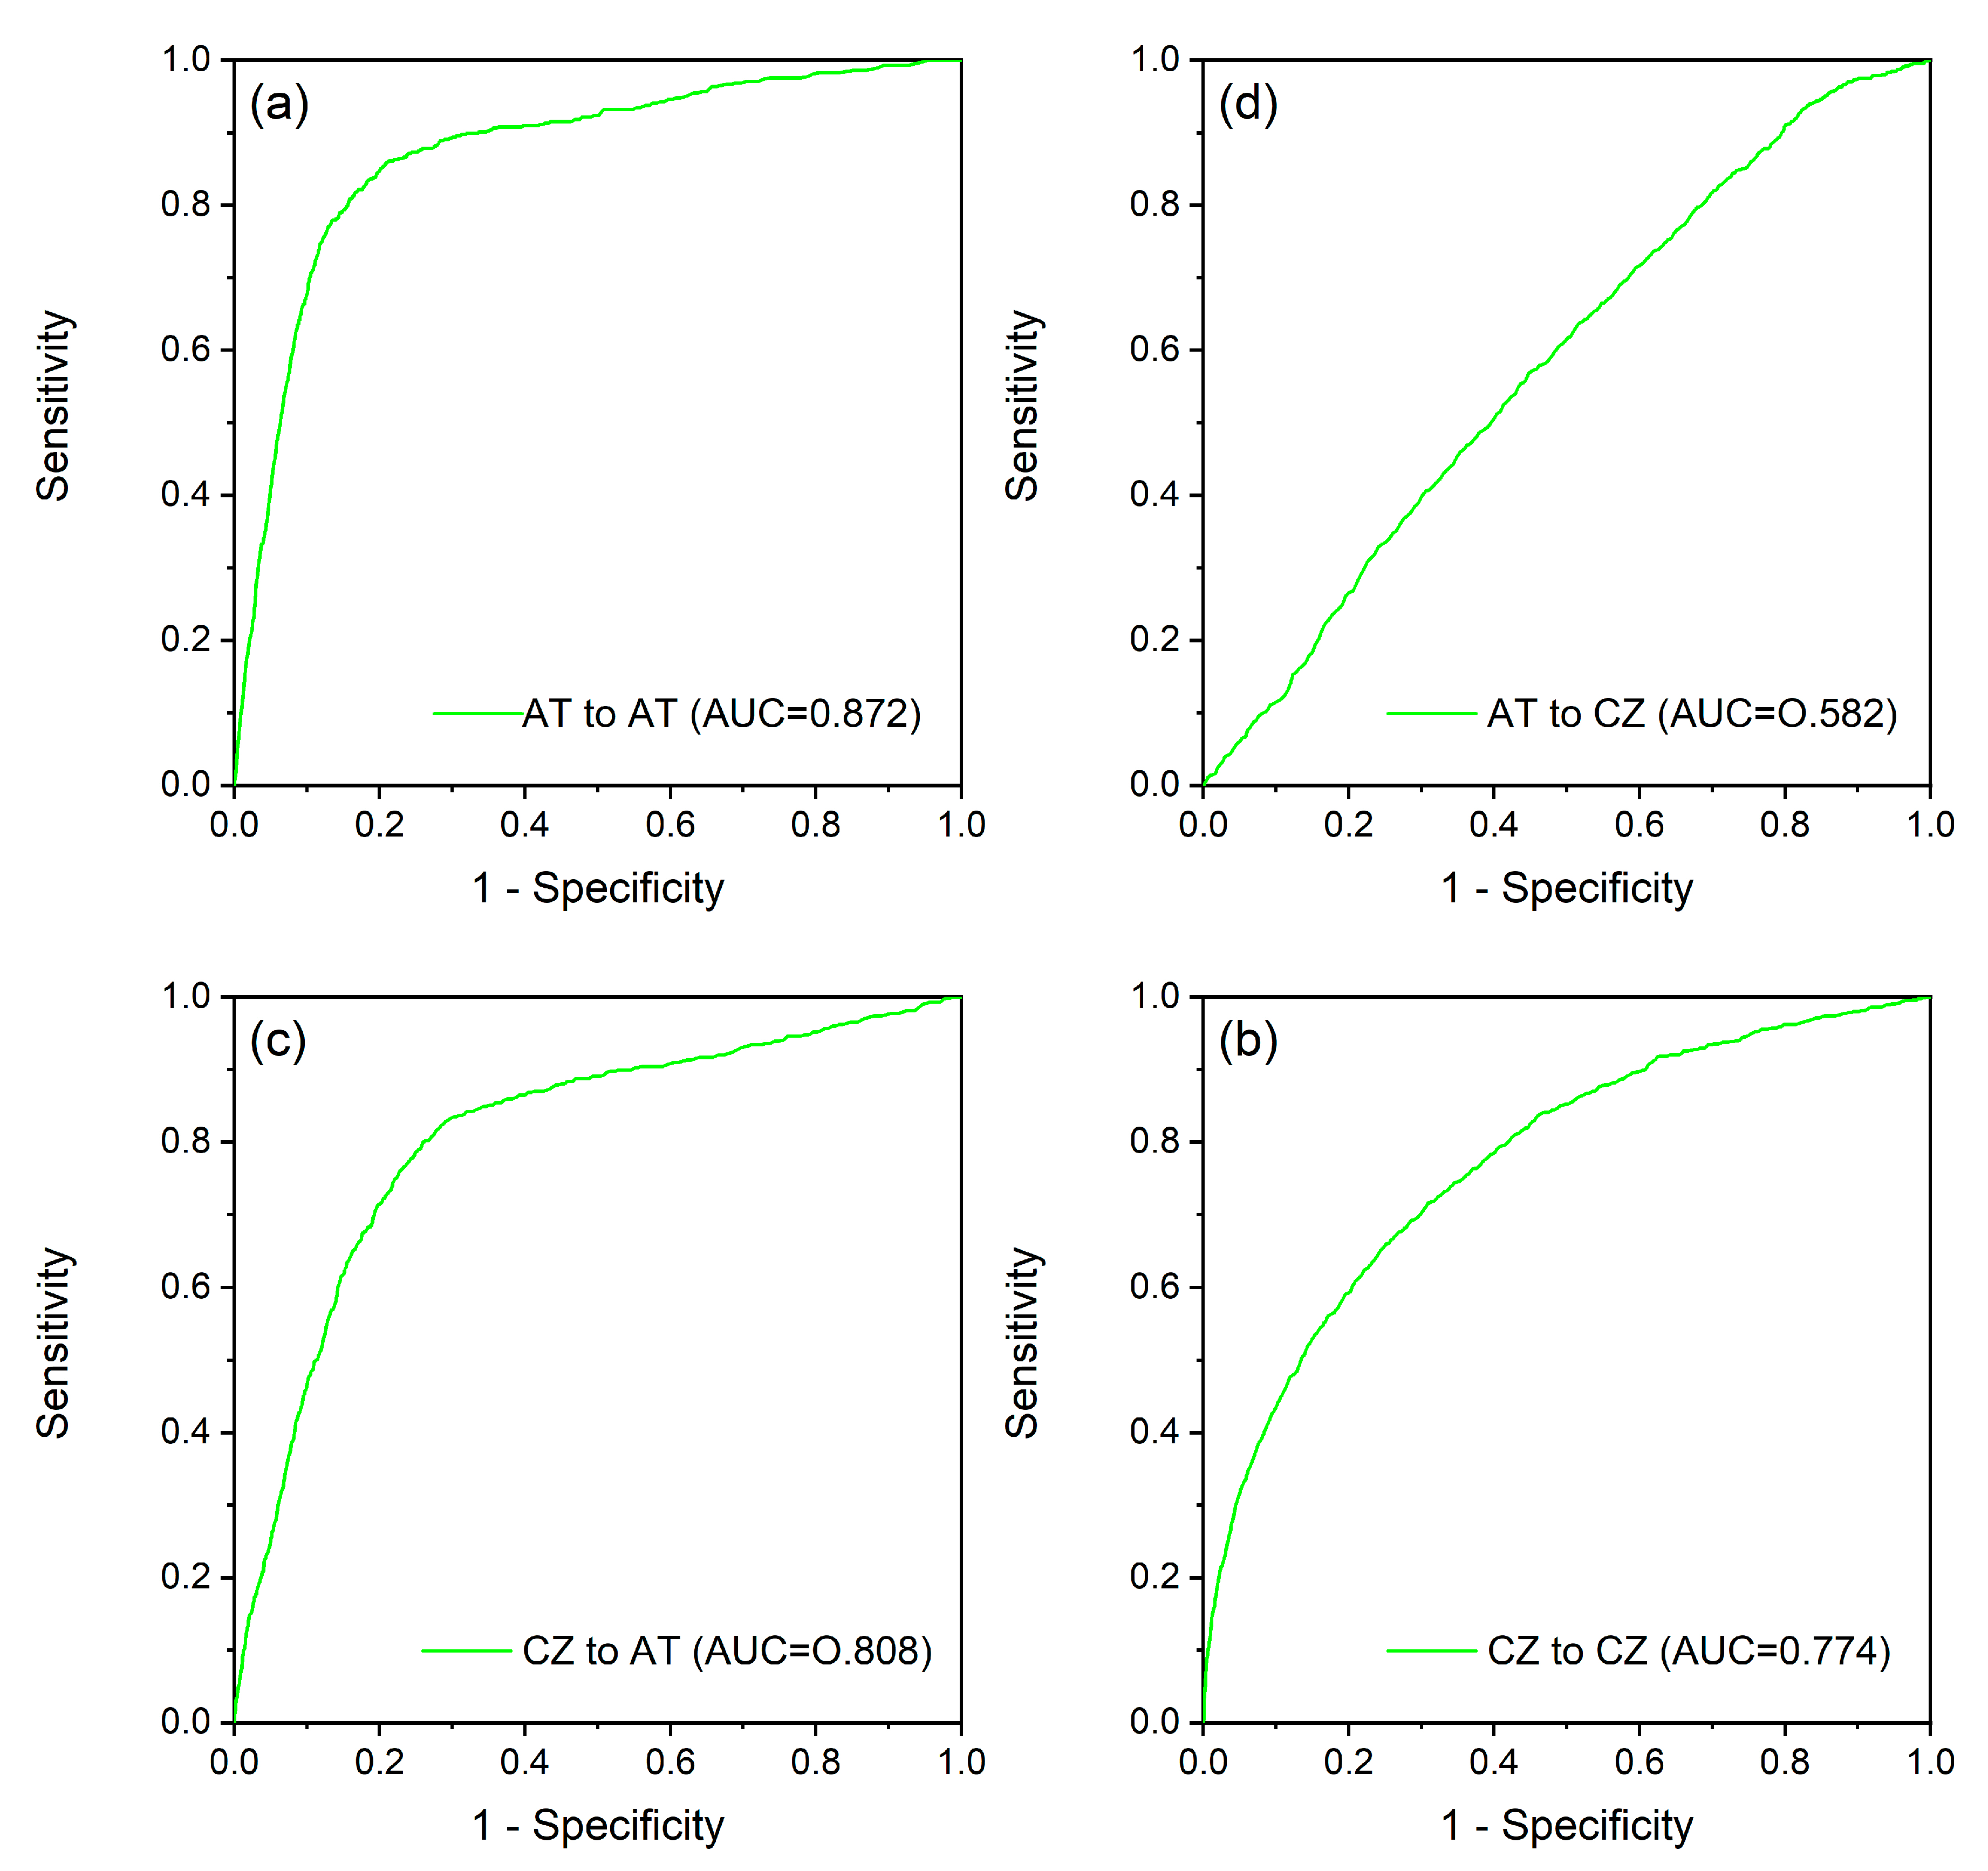
3.3. Evaluation of Model Applicability

When applied to the country of origin, the AT model showed superior performance in identifying lower forest fire probability in the very low, low, and moderate probability classes as compared to the CZ model. On the other hand, when the models were applied to the dataset of the other country, the CZ model demonstrated better performance in identifying lower forest fire probability in the very low, low, and moderate probability classes as compared to the AT model (Table 4). When applied to the country of origin, the AT model exhibited superior performance in identifying a higher incidence of forest fires and was more effective in the high- and very-high-risk classes as compared to the CZ model. However, when the models were applied to the dataset of the other country, the CZ model showed better performance in identifying a higher probability of forest fires and was more effective in the high- and very-high-risk classes as compared to the AT model (Table 4). A significant difference was observed in the aggregated relative probability of the three highest classes (moderate, high, and very high) between the AT (82.7%) and CZ (61.8%) models when applied to the dataset of the country-of-origin. On the other hand, when the models were applied to the dataset of the other country, the CZ model (86.8%) outperformed the AT model (45.4%) in terms of the aggregated relative probability of the three highest classes. When applied to the country of origin, the AT model categorized 17.3% of forest fire events in the low and very low classes, while the CZ model categorized 38.8% of forest fire events in the same classes. However, when the models were applied to the dataset of the other country, the CZ model classified 13.1% of forest fire events in the low and very low classes, while the AT model classified 54.5% of forest fire events in the same classes.

4. Discussion

4.1. Variable Contribution to Forest Fire Occurrence

The impact of vegetation, topography, human activity, and climate on the ignition of forest fires was assessed using the machine learning (ML) approach for two Central European countries, Austria and the Czech Republic. The contribution of the selected variables, derived from widely available open data sources, was independently estimated using Random Forest (RF) models for each country. In both models, the variables contributing the most were from the group of topographic features, namely the topographic wetness index (TWI) in the AT model and slope (S) in the CZ model. The importance of topographic features in fire ignition has been revealed in several studies [47,66,67,68]. In general, topographic features change fuel conditions and their ability to burn [12,69,70,71,72]. The TWI emphasizes the effect of topography on soil moisture distribution, indirectly affecting the initial fire behavior, and it is negatively correlated to the ignition probability [67]. Thus, a higher TWI indicates a lower ignition probability [68]. Some studies have found that TWI effectively predicts fire occurrence [68], whereas the role of TWI in other studies was minor [73]. In contrast to TWI, a higher slope (inclination) value indicates a higher ignition probability [68]. A study conducted by Penman et al. [66] found that lightning ignitions are predicted to occur most likely on ridges and upper slopes further away from roads and houses. In contrast, the interaction between the slope and the anthropogenic features in the study by Calviño-Cancela et al. [74] revealed that fires occurred on similarly inclined slopes within and outside the area with a pronounced wildland-urban interface (WUI).
Climatic variables define the condition of fire fuel, [75,76,77] which is of the greatest importance for fire ignition [78,79]. The importance of climatic variables for fire ignition, which has been highlighted in many studies [77,80,81,82], was also confirmed in our study, particularly using PrecWrQ (AT model) and MTempWrQ (CZ model), which had high explanatory power. Fire-related climatic indices explain current fire ignition in suburban and protected areas of the Czech Republic, but they also predict a significant increase in fire frequency due to expected climate change-related alterations that will strongly influence fuel dryness [83]. In addition, weather indices corresponded well with the forest fire frequency locally and at the country scale [84]. Indeed, a strong relationship between wildfire ignition frequency and weather conditions has been demonstrated in the Czech Republic, where a significant increase in drought and heat waves was recorded in the period 1991–2015, compared to the years 1971–1990 [85]. In addition to ignition frequency, global warming–which leads to increased air temperature, reduced humidity, and stronger winds–will significantly affect the size of forest fires until the end of this century [86,87]. The effects of climate change were evaluated indirectly by comparing changes in fire frequency in years, seasons, days, and daytime [36]. A greater frequency of forest fires in the afternoon hours and on weekends was found during the period 1992–2014 compared to 1974–1983. Anomalies in fire activity in Austria during 2012 were connected to exceptionally dry conditions combined with high temperatures and strong spring convection, which led to widespread thunderstorm occurrence [88]; emphasizing the role of weather indices in forest fire ignition, particularly in alpine areas. In our study, the AT model ranked PrecWrQ as the second most important predictor of fire ignition, whereas MTempDQ ranked fifth. In addition, the role of PrecWrQ can be explained by the naturally induced ignition of forest fires in Austria, which is typical for alpine zones, where lower mean precipitation occurs in areas with a higher number of thunderstorms and lightning events during the summer months [89].
Among anthropogenic features, the most important variables in our study, listed in descending order, were distance to railways (DisRa), distance to roads (DisRo_C), and distance to agricultural land (DisAgL) in the AT model; and distance to railways (DisRa), distance to buildings (DisBld), and distance to roads (DisRo_B) in the CZ model. Arndt et al. [90] confirmed the effect of the proximity of railway routes on forest fire ignition in Austria, as did Nezval et al. [91] in the Czech Republic; as were other anthropogenic features such as forest roads and settlements in other countries [90,92]. A similar study conducted in China showed the positive effect of railway density on fire ignition, whereas road density had a negative impact on fire ignition [93]. In contrast, a positive relationship between road density and fire ignition was observed in Sweden [94]. Moreover, previous studies conducted in Serbia and Poland have underlined the role of anthropogenic factors in forest fire ignition [6,7,42].
Among vegetation-related features, only coniferous forests (CF) were included in both the AT and CZ models. Other vegetation-related features were excluded during the variable selection (Table A1, Figure A1 and Figure A2) and model-building processes because of their low influence on model performance. This remaining vegetation characteristic had the lowest influence on forest fire ignition in both countries compared to the other groups of predictors, emphasizing the dominant role of climatic and anthropogenic factors in the models. Our findings related to the contribution of vegetation to forest fire ignition are in accordance with the main causes of forest fires in both countries, which are negligence and/or accidental ignition, being particularly serious during warm and dry weather conditions and at particularly vulnerable sites [36,38,39,95]. Hence, if the weather conditions are favorable and the influence of topographic factors on fuel conditions is strong, in combination with the strong influence of anthropogenic factors, the probability of forest fire ignition will be higher regardless of vegetation type.

4.2. Evaluation of Model Applicability and Transferability

The developed AT model displayed excellent performance on the validation dataset, whereas the CZ model showed a notably lower performance (Figure 3, Table 2). RF models often perform better in accuracy than other ML and logistic regression (LR) models [42,92]. This was confirmed when the AT model metrics were compared to a logistic regression model developed for the same territory [90]. However, when the AT model developed in this study was compared to RF and maximal entropy (MaxEnt) models developed for the province of Tyrol in Austria [96], a slightly higher AUC value was recorded in the present AT model; but all models can be appraised as excellent [56].
Model quality was strongly influenced by the accuracy of the available datasets [97,98,99,100]. On the one hand, it is expected that some “fire-resistant” countries will face increased fire activity in the future due to the expected global warming [86,87]. However, there is a lack of historical data to build accurate models that may help practitioners plan measures for fire-risk mitigation. One of the solutions for this problem could be the transfer of models from a territory with more reliable data (where they have been developed) to another territory with data of poor quality or without any data. Using this approach, Bekar et al. [101] tested the transferability of cross-regional and regional forest fire ignition models in the Alps and the Mediterranean Basin. They found that the transferability potential of the cross-regional model was higher than that of regional models. The predictive ability of the regional models was only good when they were transferred across regions with similar environmental conditions [101]. One of the main aims of this study was to test the predictive ability of models developed separately for Austria and the Czech Republic when they were applied from one country to the other (AT to CZ and CZ to AT). As the AT model showed better predictive power than the CZ model, it was expected that the prediction for the territory of the Czech Republic would be improved by applying the AT model. However, this analysis revealed that the AT model showed a low level of accuracy in forest fire ignition in the Czech Republic. In contrast, the predictive ability of the CZ model was even better when it was applied to Austria than to the territory of the Czech Republic.
The differences in the accuracies of the models can be explained by the inconsistency in the quality of the available input data between the investigated countries. Exploration of the accuracy and completeness of the global land cover/land use data in OpenStreetMap (OSM) revealed significant differences between Austria and the Czech Republic [102]. Thus, the accuracy of OSM data was higher in Austria (80–98%) than in the Czech Republic (60–80%). In contrast, the completeness of OSM data was higher in the Czech Republic (80–98%) than in Austria (60–80%). According to a study by Azimi and Pahl [100], data incorrectness (e.g., lower accuracy) is more significant than data incompleteness for model accuracy. On one hand, the ML method may ignore the missing rows or features and not include them in the predictions and therefore control the disadvantage of the incompleteness of the model accuracy. However, the ML tool is forced to use all the values regardless of their level of accuracy; therefore, it cannot control or minimize the negative effect of lower data accuracy on the obtained model accuracy [100]. These findings and our results emphasize the necessity of checking the accuracy and completeness of the input data prior to transferring the obtained model from one dataset to another.

4.3. Study Limitations

Nonetheless, our study showed some limitations. We used as a dependent variable NASA FIRMS fire events observed by the MODIS Terra and Aqua platforms that are capable of recording only fire events bigger than 0.1 ha [103]; while national fire inventory databases record more or even nearly all fire events, in some countries even those smaller than 0.01 hectares. For example, more than 90% of the forest fires recorded in the Czech Republic and Austria are smaller than 1 ha [36,38]. Therefore, the results obtained in this study can be considered relevant for predicting forest fire events larger than 0.1 hectare.

5. Conclusions

In this study, we investigated the usefulness of open-source MODIS, OpenStreetMap, and WorldClim data for the prediction of country-level forest fire probability in two Central European countries. The RF model performed better in Austria (AUC = 0.848) than in the Czech Republic (AUC = 0.717) when we used the country-of-origin datasets. In contrast, the model performance changed to AUC = 0.582 and AUC = 0.808 when the AT model was applied to the Czech Republic and the CZ model was applied to Austria, respectively. We are inclined to attribute these asymmetric results to the difference between the data obtained from OpenStreetMap, where the Czech Republic has more complete data and Austria has more accurate data. The most influential variables on forest fire probability were TWI in Austria and slope in the Czech Republic. We expect the explanatory variables of forest fires to not change significantly over time, so the results can be considered long-term predictions of the countries’ fire susceptibility. However, human activities that change land use patterns would render the long-term susceptibility estimates obsolete, resulting in a need to regularly update the current susceptibility maps. Despite the differences between model performances, open-source data from multiple sources provided detailed information on different objects, e.g., historical fires, individual buildings, asphalt and forest roads, temperature, and rainfall; and significantly alleviated the data scarcity problem associated with country-level assessments of forest fire probability. As these data are freely available, we conclude that they can significantly reduce the amount of time, effort, and costs associated with fire monitoring and detection by focusing resources on areas where fires are more likely to occur (i.e., high and very high probability classes). Forest managers could therefore use these easily available data as a planning tool in the lead-up to predict whether fire probability is increasing across the country and when fire season is likely to reach peak levels. Since these data are becoming updated and increasingly available in near real-time, they could offer huge potential for low-cost probability assessments of forest fire probability across the globe. Therefore, this study could be extended to other countries where forest fires are a critical issue to provide more in-depth insight into the usefulness of open-source data.

Author Contributions

Conceptualization, S.M. and Z.T.; methodology, S.M., Z.T. and S.D.M.; software, S.M., S.D.M. and Z.T.; validation, T.K., E.H., P.Č., R.P. and A.J.; formal analysis, S.M., Z.T. and S.D.M.; investigation, S.M. and Z.T.; resources, E.H. and L.J.; data curation, S.M., Z.T., M.I. and S.D.M.; writing—original draft preparation, S.M. and Z.T.; writing—review and editing, T.K., M.I., R.P. and A.J.; visualization, S.M. and Z.T.; supervision, T.K., M.I. and A.J.; project administration, E.H., R.P., P.Č. and L.J.; funding acquisition, E.H. and L.J. All authors have read and agreed to the published version of the manuscript.

Funding

This research was funded by Interreg V-A AT-CZ—Austria–Czech Republic, grant “Cross-border forest risk management—FORRISK ATCZ251” (German: “Grenzüberschreitendes forstliches Risikomanagement”, Czech: “Přeshraniční řízení rizik v lesnictví”) co-financed by ERDF.

Institutional Review Board Statement

Not applicable.

Informed Consent Statement

Not applicable.

Data Availability Statement

The data presented in this study are available from the corresponding authors upon reasonable request.

Acknowledgments

This paper and the research behind it would not have been possible without the exceptional support of Elisabeth Gerhardt from BOKU and Alena Šamonilova from MENDELU.

Conflicts of Interest

The authors declare no conflict of interest.

Appendix A

Table A1. Independent variables initially considered for forest fire occurrence models with codes, units, sources, and variance inflation factor (VIF) values. Z an p values based on the Mann-Whitney U test for the fire cells.
VariableCodeUnitsSourceAT
VIF
CZ
VIF
AT
Mean ± SD
CZ
Mean ± SD
z Scorep
Vegetation
Broad-leaved forestBFhaCORINE 20181.421.346.2 ± 17.35.0 ± 15.0−6.00.000
Coniferous forestCFha 2.672.3030 ± 33.828.8 ± 31.58.80.000
Mixed forestMFha 1.951.5013.6 ± 23.111.0 ± 19.2−4.60.000
natural grasslandNGha 1.94 **1.13 **8.5 ± 20.90.5 ± 4.6−115.30.000
moors and heathlandMHha 1.29 **1.14 **2.7 ± 10.10.0 ± 1.5−86.60.000
transitional woodland–shrubTWSha 1.051.360.8 ± 4.53.3 ± 11.662.10.000
sparsely vegetated areasSVAha 1.73 **1.10 **4.2 ± 13.40.0 ± 0.4−100.70.000
Total forested area (BF + CF + MF)TFAha 1.3 × 10⁸ **1.9 × 10⁸ **49.9 ± 34.544.8 ± 33.3−22.90.000
anthropogenic
Distance to BuildingsDisBldmOpenStreetMap2.401.93449.7 ± 445457.6 ± 389.916.70.429
Distance to asphalt roadsDisRo_Am 3.59 **1.90955.3 ± 1292.2480.1 ± 517.6−37.20.000
Distance to forest roadsDisRo_Bm 3.301.17297 ± 503.5193.3 ± 183.08.50.000
Distance to hiking trails DisRo_Cm 1.261.28569.5 ± 536.1783.7 ± 707.559.00.000
Distance to RailDisRam 1.391.286105 ± 4737.43728.3 ± 2987.5−93.60.000
Distance to Agricultural LandDisAgLmCORINE 20183.242.18854.9 ± 1231.1258.7 ± 536.6−107.30.000
Population densityPopDN/km2CIESIN1.121.2956.3 ± 203.476.7 ± 282.9−13.60.000
topographic
Distance to WaterDisWmOpenStreetMap1.301.101061.4 ± 847.7253.9 ± 234.6−231.40.000
ElevationEmDEM28.40 *11.96 *1019.2 ± 627.8496.3 ± 181.6−167.70.000
AspectAdegree 1.031.02175.5 ± 44.5174.5 ± 43.6−2.80.149
SlopeSdegree 8.77 **4.0419 ± 11.16.0 ± 3.6−216.00.000
Topographic wetness indexTWI 7.464.00 **5.6 ± 17.5 ± 0.6274.60.000
climatic
mean temperature of the warmest quarterMTempWrQ°CWorldClim25.62 *8.2514.1 ± 3.616.1 ± 1.395.30.000
mean temperature of the driest quarterMTempDQ°C 6.022.76−1.9 ± 2.40.5 ± 1.7190.50.000
precipitation in the warmest quarterPrecWrQmm 8.264.56 **400.2 ± 98.2254.1 ± 36.2−252.80.000
precipitation in the driest quarterPrecDQmm 10.09 *8.08187.3 ± 63.9111.7 ± 38.8−219.40.000
* Variables excluded for further analysis due to VIF values higher or equal to 10. ** Variables excluded for further analysis due to Spearman’s rho correlation coefficient higher than 0.7.
Figure A1. Correlation plot for all preselected variables based on Spearman’s rho coefficient in the Austrian data set.
Sustainability 15 05269 g0a1
Figure A2. Correlation plot for all preselected variables based on Spearman’s rho coefficient in the Czech Republic data set.
Sustainability 15 05269 g0a2

References

  1. Patacca, M.; Lindner, M.; Lucas-Borja, M.E.; Cordonnier, T.; Fidej, G.; Gardiner, B.; Hauf, Y.; Jasinevičius, G.; Labonne, S.; Linkevičius, E.; et al. Significant Increase in Natural Disturbance Impacts on European Forests since 1950. Glob. Chang. Biol. 2022, 29, 1359–1376. [Google Scholar] [CrossRef]
  2. San-Miguel-Ayanz, J.; Durrant, T.; Boca, R.; Maianti, P.; Liberta’, G.; Artes Vivancos, T.; Jacome Felix Oom, D.; Branco, A.; de Rigo, D.; Ferrari, D.; et al. Forest Fires in Europe, Middle East and North Africa 2021; Publications Office of the European Union: Luxembourg, 2022. [Google Scholar]
  3. Senf, C.; Seidl, R. Storm and Fire Disturbances in Europe: Distribution and Trends. Glob. Chang. Biol. 2021, 27, 3605–3619. [Google Scholar] [CrossRef]
  4. Kocinová, M.; Nedělníková, H. Statistical Yearbook 2021 of the Fire Rescue Service of the Czech Republic; Fire Rescue Service of the Czech republic: Prague, Czech Republic, 2021. [Google Scholar]
  5. Troumbis, A.Y.; Kalabokidis, K.; Palaiologou, P. Diverging Rationalities between Forest Fire Management Services and the General Public after the 21st-Century Mega-Fires in Greece. J. For. Res. Harbin 2022, 33, 553–564. [Google Scholar] [CrossRef]
  6. Ciesielski, M.; Bałazy, R.; Borkowski, B.; Szczęsny, W.; Zasada, M.; Kaczmarowski, J.; Kwiatkowski, M.; Szczygieł, R.; Milanović, S. Contribution of Anthropogenic, Vegetation, and Topographic Features to Forest Fire Occurrence in Poland. IForest 2022, 15, 307. [Google Scholar] [CrossRef]
  7. Milanović, S.; Kaczmarowski, J.; Ciesielski, M.; Trailović, Z.; Mielcarek, M.; Szczygieł, R.; Kwiatkowski, M.; Bałazy, R.; Zasada, M.; Milanović, S.D. Modeling and Mapping of Forest Fire Occurrence in the Lower Silesian Voivodeship of Poland Based on Machine Learning Methods. Forests 2023, 14, 46. [Google Scholar] [CrossRef]
  8. Moreno, M.V.; Conedera, M.; Chuvieco, E.; Pezzatti, G.B. Fire Regime Changes and Major Driving Forces in Spain from 1968 to 2010. Environ. Sci. Policy 2014, 37, 11–22. [Google Scholar] [CrossRef]
  9. Álvarez-Díaz, M.; González-Gómez, M.; Otero-Giraldez, M.S. Detecting the Socioeconomic Driving Forces of the Fire Catastrophe in NW Spain. Eur. J. For. Res. 2015, 134, 1087–1094. [Google Scholar] [CrossRef]
  10. Nunes, A.N. Regional Variability and Driving Forces behind Forest Fires in Portugal an Overview of the Last Three Decades (1980–2009). Appl. Geogr. 2012, 34, 576–586. [Google Scholar] [CrossRef]
  11. Pechony, O.; Shindell, D.T. Driving Forces of Global Wildfires over the Past Millennium and the Forthcoming Century. Proc. Natl. Acad. Sci. USA 2010, 107, 19167–19170. [Google Scholar] [CrossRef] [Green Version]
  12. Leuenberger, M.; Parente, J.; Tonini, M.; Pereira, M.G.; Kanevski, M. Wildfire Susceptibility Mapping: Deterministic vs. Stochastic Approaches. Environ. Model. Softw. 2018, 101, 194–203. [Google Scholar] [CrossRef]
  13. Müller, M.M.; Vilà-Vilardell, L.; Vacik, H. Towards an Integrated Forest Fire Danger Assessment System for the European Alps. Ecol. Inform. 2020, 60, 101151. [Google Scholar] [CrossRef]
  14. Costafreda-Aumedes, S.; Comas, C.; Vega-Garcia, C. Human-Caused Fire Occurrence Modelling in Perspective: A Review. Int. J. Wildland Fire 2017, 26, 983–998. [Google Scholar] [CrossRef]
  15. Su, Z.; Zheng, L.; Luo, S.; Tigabu, M.; Guo, F. Modeling Wildfire Drivers in Chinese Tropical Forest Ecosystems Using Global Logistic Regression and Geographically Weighted Logistic Regression. Nat. Hazards 2021, 108, 1317–1345. [Google Scholar] [CrossRef]
  16. Rodrigues, M.; Jiménez-Ruano, A.; Peña-Angulo, D.; de la Riva, J. A Comprehensive Spatial-Temporal Analysis of Driving Factors of Human-Caused Wildfires in Spain Using Geographically Weighted Logistic Regression. J. Environ. Manag. 2018, 225, 177–192. [Google Scholar] [CrossRef] [Green Version]
  17. Monjarás-Vega, N.A.; Briones-Herrera, C.I.; Vega-Nieva, D.J.; Calleros-Flores, E.; Corral-Rivas, J.J.; López-Serrano, P.M.; Pompa-García, M.; Rodríguez-Trejo, D.A.; Carrillo-Parra, A.; González-Cabán, A.; et al. Predicting Forest Fire Kernel Density at Multiple Scales with Geographically Weighted Regression in Mexico. Sci. Total Environ. 2020, 718, 137313. [Google Scholar] [CrossRef]
  18. Martínez-Fernández, J.; Chuvieco, E.; Koutsias, N. Modelling Long-Term Fire Occurrence Factors in Spain by Accounting for Local Variations with Geographically Weighted Regression. Nat. Hazards Earth Syst. Sci. 2013, 13, 311–327. [Google Scholar] [CrossRef]
  19. Oliveira, S.; Pereira, J.M.C.; San-Miguel-Ayanz, J.; Lourenço, L. Exploring the Spatial Patterns of Fire Density in Southern Europe Using Geographically Weighted Regression. Appl. Geogr. 2014, 51, 143–157. [Google Scholar] [CrossRef]
  20. Koutsias, N.; Martínez-Fernández, J.; Allgöwer, B. Do Factors Causing Wildfires Vary in Space? Evidence from Geographically Weighted Regression. GIScience Remote Sens. 2013, 47, 221–240. [Google Scholar] [CrossRef]
  21. Sá, A.C.L.; Turkman, M.A.A.; Pereira, J.M.C. Exploring Fire Incidence in Portugal Using Generalized Additive Models for Location, Scale and Shape (GAMLSS). Model Earth Syst. Env. 2018, 4, 199–220. [Google Scholar] [CrossRef]
  22. Ager, A.A.; Preisler, H.K.; Arca, B.; Spano, D.; Salis, M. Wildfire Risk Estimation in the Mediterranean Area. Environmetrics 2014, 25, 384–396. [Google Scholar] [CrossRef]
  23. Pausas, J.G. Changes in Fire and Climate in the Eastern Iberian Peninsula (Mediterranean Basin). Clim. Chang. 2004, 63, 337–350. [Google Scholar] [CrossRef]
  24. Jain, P.; Coogan, S.C.P.; Subramanian, S.G.; Crowley, M.; Taylor, S.; Flannigan, M.D. A Review of Machine Learning Applications in Wildfire Science and Management. Environ. Rev. 2020, 28, 478–505. [Google Scholar] [CrossRef]
  25. Breiman, L. Random Forests. Mach. Learn. 2001, 45, 5–32. [Google Scholar] [CrossRef] [Green Version]
  26. Xu, Z.; Liu, D.; Yan, L. Temperature-Based Fire Frequency Analysis Using Machine Learning: A Case of Changsha, China. Clim. Risk Manag. 2021, 31, 100276. [Google Scholar] [CrossRef]
  27. Janiec, P.; Gadal, S. A Comparison of Two Machine Learning Classification Methods for Remote Sensing Predictive Modeling of the Forest Fire in the North-Eastern Siberia. Remote Sens. 2020, 12, 4157. [Google Scholar] [CrossRef]
  28. Ghorbanzadeh, O.; Blaschke, T.; Gholamnia, K.; Meena, S.R.; Tiede, D.; Aryal, J. Evaluation of Different Machine Learning Methods and Deep-Learning Convolutional Neural Networks for Landslide Detection. Remote Sens. 2019, 11, 196. [Google Scholar] [CrossRef] [Green Version]
  29. Shao, Y.; Wang, Z.; Feng, Z.; Sun, L.; Yang, X.; Zheng, J.; Ma, T. Assessment of China’s forest fire occurrence with deep learning, geographic information and multisource data. J. For. Res. 2022. [Google Scholar] [CrossRef]
  30. Wan, C.; Roy, S. Sen Geospatial Characteristics of Fire Occurrences in Southern Hemispheric Africa and Madagascar during 2001–2020. J. For. Res. 2022, 1, 1–11. [Google Scholar]
  31. Hiebl, J.; Frei, C. Daily Precipitation Grids for Austria since 1961—Development and Evaluation of a Spatial Dataset for Hydroclimatic Monitoring and Modelling. Theor. Appl. Climatol. 2018, 132, 327–345. [Google Scholar] [CrossRef]
  32. Phillips, I.D. Austrian Long-Term Climate 1767–2000: Multiple Instrumental Climate Time Series from Central Europe (Österreichische Beiträge Zu Meteorologie Und Geophysik, Heft 25), by I. Auer, R. Böhm and W. Schöner, Central Institute for Meteorology and Geodynamics, Hohe Warte 38, A-1190 Vienna, 2001. Publication Number 397. No. of Pages: 155. ISSN 1016-6254 (Paperback). Int. J. Climatol. 2002, 22, 1143. [Google Scholar] [CrossRef]
  33. Wheeler, D. Climate Atlas of Czechia. By R. Tolasz et al. Czech Hydrometeorological Institute, Prague, 2007. 254pp. Hardback ISBN 978-80-86690-1. Weather 2008, 63, 23. [Google Scholar] [CrossRef]
  34. Waldinventur. Available online: https://www.waldinventur.at/#/ENG (accessed on 7 January 2023).
  35. Riedl, M.; Šišák, L.; Kahuda, J.; Hofmeister, T.; Ulrich, R. Information on Forests and Forestry in the Czech Republic by 2020; eAGRI Portal: Prague, Czech Republic, 2021. [Google Scholar]
  36. Kula, E.; Jankovská, Z. Forest Fires and Their Causes in the Czech Republic (1992–2004). J. For. Sci. 2013, 59, 41–53. [Google Scholar] [CrossRef] [Green Version]
  37. Špulák, P. Wildland Fires in the Czech Republic—Review of Data Spanning 20 Years. ISPRS Int. J. Geo-Inf. 2022, 11, 289. [Google Scholar] [CrossRef]
  38. Vacik, H.; Arndt, N.; Arpaci, A.; Koch, V.; Müller, M. Characterisation of Forest Fires in Austria. Austrian J. For. Sci. 2011, 128, 1–32. [Google Scholar]
  39. Müller, M.M.; Vacik, H.; Diendorfer, G.; Arpaci, A.; Formayer, H.; Gossow, H. Analysis of Lightning-Induced Forest Fires in Austria. Theor. Appl. Climatol. 2013, 111, 183–193. [Google Scholar] [CrossRef] [Green Version]
  40. Data—Eurostat. Available online: https://ec.europa.eu/eurostat/web/main/data (accessed on 8 March 2023).
  41. Archive Download—NASA|LANCE|FIRMS. Available online: https://firms.modaps.eosdis.nasa.gov/download/ (accessed on 20 December 2021).
  42. Milanovic, S.; Markovic, N.; Pamucar, D.; Gigovic, L.; Kostic, P.; Milanovic, S.D. Forest Fire Probability Mapping in Eastern Serbia: Logistic Regression versus Random Forest Method. Forests 2021, 12, 5. [Google Scholar] [CrossRef]
  43. Nhongo, E.J.S.; Fontana, D.C.; Guasselli, L.A.; Bremm, C. Probabilistic Modelling of Wildfire Occurrence Based on Logistic Regression, Niassa Reserve, Mozambique. Geomat. Nat. Hazards Risk 2019, 10, 1772–1792. [Google Scholar] [CrossRef] [Green Version]
  44. Ye, T.; Wang, Y.; Guo, Z.; Li, Y. Factor Contribution to Fire Occurrence, Size, and Burn Probability in a Subtropical Coniferous Forest in East China. PLoS ONE 2017, 12, e0172110. [Google Scholar] [CrossRef] [Green Version]
  45. Guo, F.; Su, Z.; Wang, G.; Sun, L.; Lin, F.; Liu, A. Wildfire Ignition in the Forests of Southeast China: Identifying Drivers and Spatial Distribution to Predict Wildfire Likelihood. Appl. Geogr. 2016, 66, 12–21. [Google Scholar] [CrossRef]
  46. Catry, F.X.; Rego, F.C.; Bação, F.L.; Moreira, F.; Catry, F.X.; Rego, F.C.; Bação, F.L.; Moreira, F. Modeling and Mapping Wildfire Ignition Risk in Portugal. Int. J. Wildland Fire 2009, 18, 921–931. [Google Scholar] [CrossRef] [Green Version]
  47. Carmo, M.; Moreira, F.; Casimiro, P.; Vaz, P. Land Use and Topography Influences on Wildfire Occurrence in Northern Portugal. Landsc. Urban Plan. 2011, 100, 169–176. [Google Scholar] [CrossRef] [Green Version]
  48. CLC 2018—Copernicus Land Monitoring Service. Available online: https://land.copernicus.eu/pan-european/corine-land-cover/clc2018?tab=download (accessed on 16 March 2021).
  49. Historical Climate Data—WorldClim 1 Documentation. Available online: https://www.worldclim.org/data/worldclim21.html (accessed on 20 December 2021).
  50. Geofabrik Download Server. Available online: https://download.geofabrik.de/europe.html (accessed on 16 August 2021).
  51. Population Count Grid, v3: Gridded Population of the World (GPW), v3|SEDAC. Available online: https://sedac.ciesin.columbia.edu/data/set/gpw-v3-population-count (accessed on 12 July 2021).
  52. Midi, H.; Sarkar, S.K.; Rana, S. Collinearity Diagnostics of Binary Logistic Regression Model. J. Interdiscip. Math. 2013, 13, 253–267. [Google Scholar] [CrossRef]
  53. Kuhn, M.; Johnson, K. Data Pre-Processing. Appl. Predict. Model. 2013, 27–59. [Google Scholar] [CrossRef]
  54. Beleites, C.; Neugebauer, U.; Bocklitz, T.; Krafft, C.; Popp, J. Sample Size Planning for Classification Models. Anal. Chim. Acta 2013, 760, 25–33. [Google Scholar] [CrossRef] [Green Version]
  55. Nembrini, S.; König, I.R.; Wright, M.N. The Revival of the Gini Importance? Bioinformatics 2018, 34, 3711–3718. [Google Scholar] [CrossRef] [PubMed] [Green Version]
  56. Hosmer, D.; Lemeshow, S.; Sturdivant, R. Applied Logistic Regression, 3rd ed.; Wiley: Hoboken, NJ, USA, 2013; ISBN 978111854838. [Google Scholar]
  57. Webb, G.I. Model Evaluation. In Encyclopedia of Machine Learning; Sammut, C., Webb, G.I., Eds.; Springer: Boston, MA, USA, 2011. [Google Scholar] [CrossRef]
  58. Fawcett, T. An Introduction to ROC Analysis. Pattern Recognit. Lett. 2006, 27, 861–874. [Google Scholar] [CrossRef]
  59. López-Ratón, M.; Rodríguez-Álvarez, M.X.; Cadarso-Suárez, C.; Gude-Sampedro, F. OptimalCutpoints: An R Package for Selecting Optimal Cutpoints in Diagnostic Tests. J. Stat. Softw. 2014, 61, 1–36. [Google Scholar] [CrossRef] [Green Version]
  60. Goksuluk, D.; Korkmaz, S.; Zararsiz, G.; Karaagaoglu, A.E. EasyROC: An Interactive Web-Tool for Roc Curve Analysis Using r Language Environment. R J. 2016, 8, 213–230. [Google Scholar] [CrossRef] [Green Version]
  61. Genuer, R.; Poggi, J.M.; Tuleau-Malot, C. Variable Selection Using Random Forests. Pattern Recognit. Lett. 2010, 31, 2225–2236. [Google Scholar] [CrossRef] [Green Version]
  62. Ramo, R.; Chuvieco, E. Developing a Random Forest Algorithm for MODIS Global Burned Area Classification. Remote Sens. 2017, 9, 1193. [Google Scholar] [CrossRef] [Green Version]
  63. Phelps, N.; Woolford, D.G.; Phelps, N.; Woolford, D.G. Comparing Calibrated Statistical and Machine Learning Methods for Wildland Fire Occurrence Prediction: A Case Study of Human-Caused Fires in Lac La Biche, Alberta, Canada. Int. J. Wildland Fire 2021, 30, 850–870. [Google Scholar] [CrossRef]
  64. Ngoc Thach, N.; Bao-Toan Ngo, D.; Xuan-Canh, P.; Hong-Thi, N.; Hang Thi, B.; Nhat-Duc, H.; Dieu, T.B. Spatial Pattern Assessment of Tropical Forest Fire Danger at Thuan Chau Area (Vietnam) Using GIS-Based Advanced Machine Learning Algorithms: A Comparative Study. Ecol. Inform. 2018, 46, 74–85. [Google Scholar] [CrossRef]
  65. Romero, R.; Mestre, A.; Botey, R. A New Calibration for Fire Weather Index in Spain (AEMET). In Advances in Forest Fire Research; University of Coimbra: Coimbra, Portugal, 2014; pp. 1044–1053. [Google Scholar] [CrossRef]
  66. Penman, T.D.; Bradstock, R.A.; Price, O.; Penman, T.D.; Bradstock, R.A.; Price, O. Modelling the Determinants of Ignition in the Sydney Basin, Australia: Implications for Future Management. Int. J. Wildland Fire 2012, 22, 469–478. [Google Scholar] [CrossRef]
  67. Kim, S.J.; Lim, C.H.; Kim, G.S.; Lee, J.; Geiger, T.; Rahmati, O.; Son, Y.; Lee, W.K. Multi-Temporal Analysis of Forest Fire Probability Using Socio-Economic and Environmental Variables. Remote Sens. 2019, 11, 86. [Google Scholar] [CrossRef] [Green Version]
  68. Zhao, P.; Zhang, F.; Lin, H.; Xu, S. GIS-Based Forest Fire Risk Model: A Case Study in Laoshan National Forest Park, Nanjing. Remote Sens. 2021, 13, 3704. [Google Scholar] [CrossRef]
  69. Cao, Y.; Wang, M.; Liu, K. Wildfire Susceptibility Assessment in Southern China: A Comparison of Multiple Methods. Int. J. Disaster Risk Sci. 2017, 8, 164–181. [Google Scholar] [CrossRef] [Green Version]
  70. Trucchia, A.; Meschi, G.; Fiorucci, P.; Gollini, A.; Negro, D. Defining Wildfire Susceptibility Maps in Italy for Understanding Seasonal Wildfire Regimes at the National Level. Fire 2022, 5, 30. [Google Scholar] [CrossRef]
  71. Nguyen, Q.-H.; Nguyen, H.-D.; Le, D.T.; Bui, Q.-T. Fine-Tuning LightGBM Using an Artificial Ecosystem-Based Optimizer for Forest Fire Analysis. For. Sci. 2022, 69, 73–82. [Google Scholar] [CrossRef]
  72. Satir, O.; Berberoglu, S.; Donmez, C. Mapping Regional Forest Fire Probability Using Artificial Neural Network Model in a Mediterranean Forest Ecosystem. Geomat. Nat. Hazards Risk 2015, 7, 1645–1658. [Google Scholar] [CrossRef] [Green Version]
  73. Moayedi, H.; Khasmakhi, M.A.S.A. Wildfire Susceptibility Mapping Using Two Empowered Machine Learning Algorithms. Stoch. Environ. Res. Risk Assess. 2022, 37, 49–72. [Google Scholar] [CrossRef]
  74. Calviño-Cancela, M.; Chas-Amil, M.L.; García-Martínez, E.D.; Touza, J. Interacting Effects of Topography, Vegetation, Human Activities and Wildland-Urban Interfaces on Wildfire Ignition Risk. For. Ecol. Manag. 2017, 397, 10–17. [Google Scholar] [CrossRef] [Green Version]
  75. Benali, A.; Sá, A.C.L.; Ervilha, A.R.; Trigo, R.M.; Fernandes, P.M.; Pereira, J.M.C. Fire Spread Predictions: Sweeping Uncertainty under the Rug. Sci. Total Environ. 2017, 592, 187–196. [Google Scholar] [CrossRef] [PubMed] [Green Version]
  76. Atchley, A.L.; Linn, R.; Jonko, A.; Hoffman, C.; Hyman, J.D.; Pimont, F.; Sieg, C.; Middleton, R.S.; Atchley, A.L.; Linn, R.; et al. Effects of Fuel Spatial Distribution on Wildland Fire Behaviour. Int. J. Wildland Fire 2021, 30, 179–189. [Google Scholar] [CrossRef]
  77. Clements, C.B.; Lareau, N.P.; Seto, D.; Contezac, J.; Davis, B.; Teske, C.; Zajkowski, T.J.; Hudak, A.T.; Bright, B.C.; Dickinson, M.B.; et al. Fire Weather Conditions and Fire–Atmosphere Interactions Observed during Low-Intensity Prescribed Fires—RxCADRE 2012. Int. J. Wildland Fire 2016, 25, 90–101. [Google Scholar] [CrossRef]
  78. Morgan Varner, J.; Kane, J.M.; Kreye, J.K.; Engber, E. The Flammability of Forest and Woodland Litter: A Synthesis. Curr. For. Rep. 2015, 1, 91–99. [Google Scholar] [CrossRef]
  79. Anderson, H.E. Forest Fuel Ignitibility. Fire Technol. 1970, 6, 312–322. [Google Scholar] [CrossRef]
  80. Hilton, J.E.; Miller, C.; Sullivan, A.L.; Rucinski, C. Effects of Spatial and Temporal Variation in Environmental Conditions on Simulation of Wildfire Spread. Environ. Model. Softw. 2015, 67, 118–127. [Google Scholar] [CrossRef]
  81. Balzter, H.; Gerard, F.; George, C.; Weedon, G.; Grey, W.; Combal, B.; Bartholomé, E.; Bartalev, S.; Los, S. Coupling of Vegetation Growing Season Anomalies and Fire Activity with Hemispheric and Regional-Scale Climate Patterns in Central and East Siberia. J. Clim. 2007, 20, 3713–3729. [Google Scholar] [CrossRef] [Green Version]
  82. Amiro, B.D.; Stocks, B.J.; Alexander, M.E.; Flannigan, M.D.; Wotton, B.M. Fire, Climate Change, Carbon and Fuel Management in the Canadian Boreal Forest. Int. J. Wildland Fire 2001, 10, 405–413. [Google Scholar] [CrossRef]
  83. Trnka, M.; Možný, M.; Jurečka, F.; Balek, J.; Semerádová, D.; Hlavinka, P.; Štěpánek, P.; Farda, A.; Skalák, P.; Cienciala, E.; et al. Observed and Estimated Consequences of Climate Change for the Fire Weather Regime in the Moist-Temperate Climate of the Czech Republic. Agric. For. Meteorol. 2021, 310, 108583. [Google Scholar] [CrossRef]
  84. Jurečka, F.; Možný, M.; Balek, J.; Žalud, Z.; Trnka, M. Comparison of Methods for the Assessment of Fire Danger in the Czech Republic. Acta Univ. Agric. Et Silvic. Mendel. Brun. 2019, 67, 1285–1295. [Google Scholar] [CrossRef] [Green Version]
  85. Mozny, M.; Trnka, M.; Brázdil, R. Climate Change Driven Changes of Vegetation Fires in the Czech Republic. Theor. Appl. Climatol. 2021, 143, 691–699. [Google Scholar] [CrossRef]
  86. Mohammadi, Z.; Lohmander, P.; Kašpar, J.; Berčák, R.; Holuša, J.; Marušák, R. The Effect of Climate Factors on the Size of Forest Wildfires (Case Study: Prague-East District, Czech Republic). J. For. Res. Harbin 2022, 33, 1291–1300. [Google Scholar] [CrossRef]
  87. Lohmander, P.; Mohammadi, Z.; Kašpar, J.; Tahri, M.; Berčák, R.; Holuša, J.; Marušák, R. Future Forest Fires as Functions of Climate Change and Attack Time for Central Bohemian Region, Czech Republic. Ann. For. Res. 2022, 65, 17–30. [Google Scholar] [CrossRef]
  88. Müller, M.M.; Vacik, H.; Valese, E. Anomalies of the Austrian Forest Fire Regime in Comparison with Other Alpine Countries: A Research Note. Forests 2015, 6, 903–913. [Google Scholar] [CrossRef]
  89. Müller, M.M.; Vacik, H. Characteristics of Lightnings Igniting Forest Fires in Austria. Agric. For. Meteorol. 2017, 240–241, 26–34. [Google Scholar] [CrossRef]
  90. Arndt, N.; Vacik, H.; Koch, V.; Arpaci, A.; Gossow, H. Modeling Human-Caused Forest Fire Ignition for Assessing Forest Fire Danger in Austria. IForest 2013, 6, 315. [Google Scholar] [CrossRef] [Green Version]
  91. Nezval, V.; Andrášik, R.; Bíl, M. Vegetation Fires along the Czech Rail Network. Fire Ecol. 2022, 18, 15. [Google Scholar] [CrossRef]
  92. Guo, F.; Zhang, L.; Jin, S.; Tigabu, M.; Su, Z.; Wang, W. Modeling Anthropogenic Fire Occurrence in the Boreal Forest of China Using Logistic Regression and Random Forests. Forests 2016, 7, 250. [Google Scholar] [CrossRef] [Green Version]
  93. Su, Z.; Tigabu, M.; Cao, Q.; Wang, G.; Hu, H.; Guo, F. Comparative Analysis of Spatial Variation in Forest Fire Drivers between Boreal and Subtropical Ecosystems in China. For. Ecol. Manag. 2019, 454, 117669. [Google Scholar] [CrossRef]
  94. Pinto, G.A.S.J.; Rousseu, F.; Niklasson, M.; Drobyshev, I. Effects of Human-Related and Biotic Landscape Features on the Occurrence and Size of Modern Forest Fires in Sweden. Agric. For. Meteorol. 2020, 291, 108084. [Google Scholar] [CrossRef]
  95. Adámek, M.; Jankovská, Z.; Hadincová, V.; Kula, E.; Wild, J. Drivers of Forest Fire Occurrence in the Cultural Landscape of Central Europe. Landsc. Ecol. 2018, 33, 2031–2045. [Google Scholar] [CrossRef]
  96. Arpaci, A.; Malowerschnig, B.; Sass, O.; Vacik, H. Using Multi Variate Data Mining Techniques for Estimating Fire Susceptibility of Tyrolean Forests. Appl. Geogr. 2014, 53, 258–270. [Google Scholar] [CrossRef]
  97. Castedo-Dorado, F.; Rodriguez-Perez, J.R.; Marcos-Menendez, J.L.; Alvarez-Taboada, M.F. Modelling the Probability of Lightning-Induced Forest Fire Occurrence in the Province of León (NW Spain). For. Syst. 2011, 20, 95–107. [Google Scholar] [CrossRef] [Green Version]
  98. Hoelzemann, J.J.; Schultz, M.G.; Brasseur, G.P.; Granier, C.; Simon, M. Global Wildland Fire Emission Model (GWEM): Evaluating the Use of Global Area Burnt Satellite Data. J. Geophys. Res. Atmos. 2004, 109, 14–18. [Google Scholar] [CrossRef]
  99. Cai, L.; Zhu, Y. The Challenges of Data Quality and Data Quality Assessment in the Big Data Era. Data Sci. J. 2015, 14. [Google Scholar] [CrossRef] [Green Version]
  100. Azimi, S.; Pahl, C. The Effect of IoT Data Completeness and Correctness on Explainable Machine Learning Models. In Lecture Notes in Computer Science (Including Subseries Lecture Notes in Artificial Intelligence and Lecture Notes in Bioinformatics), Proceedings of the International Conference on Database and Expert Systems Applications, 27–30 September 2021, Vienna, Austria; Springer: Berlin/Heidelberg, Germany, 2021; Volume 12924, pp. 151–160. [Google Scholar] [CrossRef]
  101. Bekar, İ.; Tavşanoğlu, Ç.; Pezzatti, G.B.; Vacik, H.; Pausas, J.G.; Bugmann, H.; Petter, G.; Bekar, İ.; Tavşanoğlu, Ç.; Pezzatti, G.B.; et al. Cross-Regional Modelling of Fire Occurrence in the Alps and the Mediterranean Basin. Int. J. Wildland Fire 2020, 29, 712–722. [Google Scholar] [CrossRef]
  102. Zhou, Q.; Wang, S.; Liu, Y. Exploring the Accuracy and Completeness Patterns of Global Land-Cover/Land-Use Data in OpenStreetMap. Appl. Geogr. 2022, 145, 102742. [Google Scholar] [CrossRef]
  103. Vilar, L.; Camia, A.; San-Miguel-Ayanz, J. European Journal of Remote Sensing A Comparison of Remote Sensing Products and Forest Fire Statistics for Improving Fire Information in Mediterranean Europe. Eur. J. Remote Sens. 2017, 48, 345–364. [Google Scholar] [CrossRef] [Green Version]
Figure 1. Austria and the Czech Republic with forest fires (2000–2020) documented by moderate resolution imaging spectroradiometer (MODIS).
Sustainability 15 05269 g001
Figure 2. Data processing workflow.
Sustainability 15 05269 g002
Figure 3. AUC values of the RF model for the training and validation data sets from Austria (AT, (a)) and the Czech Republic (CZ, (b)).
Sustainability 15 05269 g003
Figure 4. Maps of forest fire ignition probability: (a) AT model applied to AT territory; (b) AT model applied to CZ territory; (c) CZ model applied to AT territory; (d) CZ model applied to CZ territory.
Sustainability 15 05269 g004
Figure 5. (a) AUC values of the AT model applied to the AT territory; (b) the AT model applied to the CZ territory; (c) the CZ model applied to the AT territory; and (d) the CZ model applied to the CZ territory.
Sustainability 15 05269 g005
Table 1. Evaluation of predictors’ importance on fire probability for the AT and CZ models based on RF Gini impurity.
PredictorCodeUnitATCZ
Coniferous forestCFm20.4670.718
Distance to BuildingsDisBldm0.4980.799
Distance to asphalt roadsDisRo_Am*0.765
Distance to forest roadsDisRo_Bm0.5280.791
Distance to hiking trailsDisRo_Cm0.6520.762
Distance to RailDisRam0.7430.817
Distance to Agricultural LandDisAgLm0.6390.667
Population densityPopDn/km20.5190.760
Distance to WaterDisWm0.5550.705
AspectAdegree0.5290.728
SlopeSdegree*1.000
Topographic wetness indexTWI 1.000*
Mean temperature of the warmest quarterMTempWrQ°C*0.814
Mean temperature of the driest quarterMTempDQ°C0.6370.787
Precipitation in the warmest quarterPrecWrQmm0.863*
Precipitation in the driest quarterPrecDQmm*0.754
* Variables excluded due to VIF higher than 10 or Spearman’s rho correlation coefficient higher than 0.7.
Table 2. Confusion matrix for the training and validation data sets from Austria (AT) and the Czech Republic (CZ).
CountryCut Off TrainingValidation
PredictedAccPrec PredictedAccPrec
01(%)(%) 01(%)(%)
AT0.605Observed049,31510,78382.183.9021,166468481.980.5
163328136149
CZ0.575Observed036,65718,53366.576.8015,763813966.066.1
11625351105205
Table 3. Confusion matrix for the AT and CZ models when they were applied to the country of origin or transferred to the other country: AT to AT, when the AT is model applied to the AT territory; AT to CZ, when the AT model is applied to the CZ territory; CZ to AT, when the CZ model is applied to the AT territory; CZ to CZ, when the CZ model is applied to the CZ territory.
Model PredictedAccPrec
01(%)(%)
AT to ATObserved070,48115,46782.082.8
199477
CZ to CZObserved052,42026,67266.473.5
1267740
CZ to AT Observed071,01714,93182.566.5
1193383
AT to CZObserved0995069,14213.696.3
137970
Table 4. Forest fire distribution across different probability classes based on the AT and CZ models applied to country of the model origin and transferred to the other country: AT to AT, when the AT is model applied to the AT territory; AT to CZ, when the AT model is applied to the CZ territory; CZ to AT, when the CZ model is applied to the AT territory; CZ to CZ, when the CZ model is applied to the CZ territory.
Forest Fire Probability (%)Forest Fire
Probability Class
AT to ATAT to CZCZ to ATCZ to CZ
0–40Very low10.726.57.217.4
41–65Low6.628.05.920.9
66–85Moderate25.227.413.524.7
86–95High38.313.443.421.0
96–100Very high19.24.629.916.1
Disclaimer/Publisher’s Note: The statements, opinions and data contained in all publications are solely those of the individual author(s) and contributor(s) and not of MDPI and/or the editor(s). MDPI and/or the editor(s) disclaim responsibility for any injury to people or property resulting from any ideas, methods, instructions or products referred to in the content.

