


Analysis of Countries in Terms of Artificial Intelligence Technologies: PROMETHEE and GAIA Method Approach

Department of Business Administration, Yildiz Technical University, 34220 Istanbul, Turkey
*
Author to whom correspondence should be addressed.
Sustainability 2023, 15(5), 4604; https://doi.org/10.3390/su15054604
Submission received: 5 January 2023
/
Revised: 24 February 2023
/
Accepted: 28 February 2023
/
Published: 4 March 2023
(This article belongs to the Special Issue Artificial Intelligence (AI) for the Sustainable Economics and Business)
Abstract
:Artificial intelligence development and research leaders in business, industry, and nations gain a major competitive edge. Additionally, it is clear that nations with a well-established national artificial intelligence policy have an edge over others, both technologically and economically. To further their artificial intelligence capability, nations also seek to develop a strategy, vision, structure, and working environment that encourages collaboration between the public sector, private industry, and educational institutions. Artificial intelligence is thought to be a tool that will help bridge the gap between powerful and developing countries growing in the future. Using data from “The Global AI Index” for 2021, this study aims to examine and analyze the present state of artificial intelligence management in 62 nations in terms of talent, infrastructure, business environment, development and research government policy, and commercial efforts. The research used PROMETHEE, which is widely used in multi-criteria decision-making evaluations, and its geometric representation, the GAIA plane. This study also found that the United States of America is the world leader in artificial intelligence (AI) research and development as well as AI investment. The United Kingdom, China, Israel, Canada, the Netherlands, South Korea, and Germany all rank well. China is rapidly catching up to the USA. At the very bottom of the list are nations such as Armenia, Kenya, Egypt, South Africa, and Pakistan. Turkey’s values are more similar to those of nations towards the bottom of the list than of those in the top half. There is a significant gap between the top three countries and the rest of the world in all parameters included in the survey. Except for the ‘State Strategy’ category, Turkey scores quite low compared to the top-performing countries. Decision makers are expected to address the identified global challenges of the study by creating a more comprehensive national AI strategy, both financially and in terms of content.
1. Introduction
Artificial intelligence is a discipline under computer science that studies the ability of machines to imitate human cognitive abilities. With its complex and ambiguous nature, it has become one of the most challenging topics in computer science today. The question of whether a machine really has the ability to think was discussed for the first time in an article written by Alan Turing in 1950 [1,2]. The concept of artificial intelligence was first introduced by John McCarthy at an academic conference in 1956 [3]. It can be said that it is one of the young technologies. Although there are many types of artificial intelligence, it is evaluated under four different expanded categories: responsive artificial intelligence, artificial intelligence with limited memory capacity, artificial intelligence theory of mind, and artificial intelligence with awareness [4,5]. These refer to the basic categories accepted as a result of current studies. On the other hand, artificial intelligence studies are active today and new categories are likely to emerge [6,7].
The potential that artificial intelligence promises to increase efficiency, security, prosperity, and other economic and social goals has become one of the most important elements of the digital economy today [7,8]. As of 2022, artificial intelligence has started to show its effect in production, health, transportation, finance, law, advertising, education, and many other sectors. Since 1995, many unrealistic predictions have been made regarding the potential of artificial intelligence. At the point reached today, it is seen that some of these predictions have come true [8,9]. It can be said that the increasing volume and diversity of data processed through developing algorithms and big data analysis are the two main components in the development of artificial intelligence. Artificial intelligence has started to become a part of daily life with its increasing usage areas [10].
Artificial intelligence-based evaluation and decision mechanisms are increasingly used in business and public activities. One of the fields where artificial intelligence is used as a tool is law. In the United States of America, a great deal of software has been developed for the tasks of lawyers. Some examples of these are ROSS Intelligence, a virtual lawyer software developed with artificial intelligence hardware, Lex-Machina, a legal analytics platform that analyzes entered data, KIRA Systems, which performs contract analysis, and LawGeex software, which detects legal problems by analyzing contracts in a similar way [11,12,13].
Countries, industries, and corporations that invest heavily in artificial intelligence research and development have a distinct competitive edge. It is clear that nations that have a strong national artificial intelligence policy have an edge over others, both technologically and economically. The world’s most sophisticated militaries are arming its borders with cutting-edge artificial intelligence (AI)-based weaponry and support systems, such as Unmanned Aerial Vehicles (UAVs) and AI-guided missiles [14,15,16]. In order to boost their artificial intelligence capabilities, nations are also seeking to develop a strategy, vision, structure, and working environment that encourages collaboration between the public sector, private industry, and educational institutions. Artificial intelligence is a technology that is expected to further divide the world’s superpowers and developing countries in the coming future [8,17,18].
Thus, it can be said that there is a significant increase in both competitiveness and technology nationalism in artificial intelligence technology. The World Economic Forum’s ‘Framework for Developing a National Artificial Intelligence Strategy’ states that nations must cooperate and a structure and system should be established in which mutual benefits are achieved. Artificial intelligence is a catalyst in technology and well-being. We face a threat of the creation of a world divided into AI-leading country groups that exacerbate divisions within or between nations, exacerbating existing inequalities, and outpacing those without skills and capital. This is clearly seen in the budgets and the number of projects that the two superpowers, the USA and China, have strategized to dominate in space as their primary goal. Then, there are the AI pioneer countries, which specialize in a number of specialist small-state and national comparative advantage fields that can play an important role in setting standards. For example, the UK is highly advanced in medical technology (MedTech). On the other hand, there are countries that want to be included in these groups but are currently not compatible with the objectives of their strategy or investment level. These countries need to take more serious steps in terms of budget and policy without wasting much time [19,20,21,22].
Such a developments in artificial intelligence will undoubtedly lead to new balances in the digital economy. Many countries have started to compete in the field of artificial intelligence in order to gain this innovation advantage arising from the power of artificial intelligence in the global competition. Artificial intelligence offers different efficiency, productivity, and national security mechanisms that can increase the competitiveness of countries. In this sense, artificial intelligence is expected to be an important driving force for economic development [19,23]. There is a global artificial intelligence competition between the USA, China, and the European Union, which are important actors in international trade. Looking at the current data, the United States of America maintains its leading position, but China is rapidly closing this gap and aiming to lead by 2030 [22]. It is seen that the European Union lags significantly behind these two states within the scope of artificial intelligence studies in this competition. This competition between states in the field of artificial intelligence is also reflected in the preparatory work that can provide more active use, development, and control of technology within the scope of national artificial intelligence strategies [24,25].
The hypothesis was made stating that, due to the dearth of studies in this field, it would be useful to create a set of multi-criteria decision-making procedures or other multivariate statistical methods to assess and compare countries or regions based on indications of their AI development. It was decided to conduct an analysis study by making use of the data of the Global Artificial Intelligence [26] Index, which is one of the indices that evaluates as many countries as possible and possesses undoubtably reliable data. “The Global AI Index”, the first artificial intelligence index comparing countries in terms of investment, innovation, and artificial intelligence applications, and organized by Tortoise Media in December 2020, expands its scope of countries every year and collected data on 62 countries in the 2021 index. In this research, all 62 countries were included in the evaluation. The research employed the PROMETHEE methodology and its geometric presentation, the GAIA plane.
As another topic, if we want to evaluate the precise impact of COVID-19 on the global development of artificial intelligence, it is seen that data on this subject have not yet been collected and reported by institutions and organizations that collect international data. When the indicators are evaluated, it is seen that newly established companies are at the forefront of the areas that were definitely damaged. In Q1 2020, there were 529 AI startups listed on Crunchbase in the UK, while there were 338 companies based on Q1 2021 data. Similar dramatic decreases are observed in these indicators of other countries [26].
The pandemic has created areas where some countries allow new initiatives to be created with artificial intelligence and where solutions are attempted to be produced with artificial intelligence. The coronavirus has become the primary market for artificial intelligence startups in Israel, and a number of Israeli businesses have established themselves as industry leaders in a variety of subfields, including diagnostics, illness management, and monitoring systems. By way of illustration, the Ministry of Defense funded a company called Vocalis Health to investigate the possibility of accurately diagnosing COVID-19 by analyzing the speech patterns of individuals [27,28].
When discussing the usefulness of the index, Russia is a good model to bring up as a potential barrier to its use. Almost all of the artificial intelligence expenditures in Russia are related to the studies carried out for military purposes, and it is not possible for an index or institution to collect or track these data. There are also artificial intelligence expenditures and studies that cannot be collected or monitored, especially in less transparent countries such as Russia, which cannot contribute to studies and benchmarking analyses. However, while this index uses the Crunchbase API data source, almost all of the other information it obtains is obtained from open sources. When looking at artificial intelligence on a global scale, the amount of money spent by governments on covert AI projects is a relatively insignificant portion of the overall financing and advancement in the field. Even if a country spends substantial amounts of implicit funding on artificial intelligence, these expenditures involve secrecy, and do not contribute to other sectors or general use in society or add to the total development that a nation makes in AI [26].
This article is divided into six parts. The first part serves as an introduction, describing the reason for this study, its principal purpose, and the specific research objectives. The section that follows is a literature review of works on comparable methodologies and topics. The third part describes the research sources and methods utilized. Results are reported in the fourth section. The fifth part discusses the policies regarding artificial intelligence. The article concludes with a conclusion section that presents the acquired findings and their limitations. In addition, the conclusion section includes suggestions for further study.
2. Literature Review on Studies on Similar Methods and Subjects
Considerable studies, including the following, have been published using the methodology used in this study. Behzadyan et al. (2010) performed an exhaustive literature study on PROMETHEE techniques and applications. Only 195 out of 217 papers (90.1%) were considered relevant to the objectives of the research. On the basis of the 195 papers, PROMETHEE approaches were categorized into nine types. The table below shows the total number of articles published in each area as well as their proportion of total publications. Table 1 shows that the majority of PROMETHEE articles regarded the management of an issue in the environment, finance, resources, energy, or other social areas [29].
Since this study aims to evaluate countries in terms of artificial intelligence policy and management, we decided to use the PROMETHEE method. In this section, a brief literature review of some of the studies conducted in the field is also presented.
Kshetri [30] provided information on important artificial intelligence practices and policies implemented in developing countries. Guo and Li [31] discussed the current state of countries by reviewing the research on the future of medical AI technology, healthcare disparities, and the deployment of computer-assisted or AI medical procedures in rural parts of emerging nations. To shed light on what factors lead to the development of AI technology, Fujii and Managi [32] devised a decomposition framework. Publication information from the USA, Japan, China, Europe, and the Patent Cooperation Treaty (PCT) were all included in the global collection of 13,567 AI technology patents covering the years 2000–2016. The emphasis on the USA and Japan, they say, has switched from biological and knowledge-based models to specific mathematical models and other artificial intelligence technologies. Based on their research, it can be seen that there are significant differences in the features of patent publishing for AI technology across organizations and nations, regardless of the technology type being compared. Concerns about job loss and rising inequality are at the forefront of discussions about the current wave of technological change based on breakthroughs in artificial intelligence (AI). Ernst and Merola [33] looked at the history of similar worries, comparing the technical progress made possible by the widespread use of AI to that of earlier waves of automation and robotization. The research contends that enormous prospects for productivity gains may result, particularly for emerging nations. Nguyen and Nguyen [34] utilized the Fuzzy AHP to determine the factor weights of the important components, and used Pythagorean fuzzy CoCoSo to order the benefit expectations according to AI adoption. To demonstrate the applicability of the framework, a Vietnam Telecom Corporation scenario was enacted. The most consequential AI technologies to embrace are ‘Managerial capabilities and associated benefits,’ followed by ‘government participation,’ ‘technical capability and vendor partnership for AI adoption,’ and finally, ‘compatibility.’ Nasrollahi and Kazemi [35] proposed an MCDM framework that combines the Delphi method (FDM) and the PROMETHEE technique in order to evaluate significant approaches to generate wave energy, taking into account twenty converters and fifty-two criteria. Strategic variables, availability, technical expertise, technological attributes, economic, social, and environmental issues, and other criteria were all also taken into account while evaluating each technology. Using TheGlobalEconomy.com indicators and the entropy-based PROMETHEE methodology, Özkaya [36] attempted to assess and analyze 36 nations on their energy consumption preferences and policies before to and after the COVID-19 pandemic. Grybaitė and Stankevičienė [37] aimed to compare the condition of the sharing economy in EU nations using recent multiple criterion approaches. Therefore, the authors used multi-criteria decision-making approaches for their study, such as EDAS and PROMETHEE II, and the newly created CILOS and IDOCRIW for calculating the weight of factors.
3. Methodology and Data
The PROMETHEE approach is widely regarded as one of the best techniques for making decisions based on several criteria at once, and the GAIA plane, which is a geometric representation of the method, is used to take advantage of the visual advantages provided to the decision maker. This is because PROMETHEE methods allow both visual evaluations and rankings of countries based on relevant indicators.
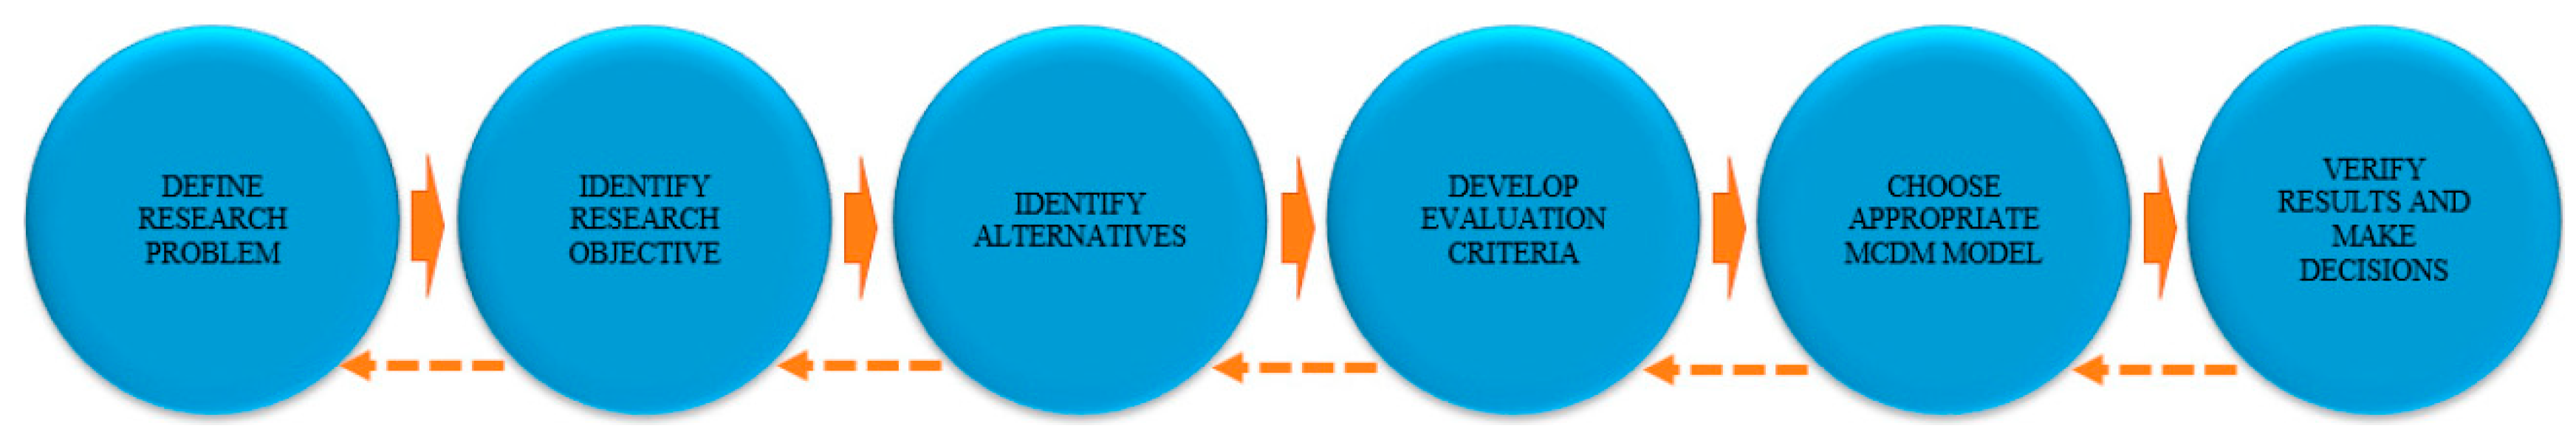
Figure 1 represents the structure of the research.
The index covers a total of 62 countries in an effort to be as comprehensive as feasible without compromising the quality or usefulness of the underlying data.
Each indicator has been individually considered and one of the following strategies applied [26]:
- Imputation by zero: used when data are not pre-defined but are the logical or necessary values; e.g., if the number of Kaggle Grandmasters is empty, it is most likely because a country has never had one.
- Imputation by average value: used when the variable in question is independent of a country’s population size or GDP, placing the mean or median value in place of a missing value.
- Imputation by last observation carried forward: used when alternative data sources show only values from previous years; in some cases, previous values are taken as indicators of a country’s current state.
- Imputation by model: used in observation of obvious relationships between a country’s demographics—population, GDP, employment rates, etc. In some cases, it was necessary to build a generalized linear model to predict what value should be used.
- Imputation by aggregated k-nearest neighbor search: used in the several cases where a model is inadequate, an average of all countries is not sensible, or there are no previous values for an indicator. In these cases, it was necessary to implement a k-nearest neighbors algorithm, with k = 3, in search of the most similar countries (by region, population, GDP) for a particular observation. When these countries were identified, the imputed value was the median average of those 3 most similar countries.
It was important to normalize each data point to a [0, 1] scale to guarantee the data behind the index rankings were consistent and comparable. This step is critical for ensuring that the analyses are not skewed by outliers. This was necessary since our data had elements of many kinds, including binary, continuous, ordinal, and proportional elements. It was also necessary to de-unitize variables to ensure relationship and comparability [26].
Xnew = (x − xmin)/(xmax − xmin)
While determining their relative weights, it was stated that some indicators and dimensions had more relative evaluation superiority than others.
The significance of a metric in the index was evaluated in relation to the indicator’s apparent linkages to the overall change in artificial intelligence capability. The index gives considerable weight to the ‘Talent’ sub-pillar since, for instance, the “Existing Number of ‘Data Scientists’” is seen as a very significant component in contributing to capacity. Comparatively, “Percentage access to electricity” is seen as less important while being directly related to capacity. Thus, the index’s ‘Infrastructure’ component gives it a lower weighting. The weighting coefficients determined by Tortoise Global for indicator dimensions are shown in Table 2 [26].
The Global AI Index is built on three pillars: investment, innovation, and implementation. Two sub-pillars comprise the investment pillar: commercial ventures and government strategies. Two sub-pillars comprise the innovation pillar: research and development. The last sub-pillar of the implementation pillar is talent, followed by infrastructure and operating environment.
- Talent: This dimension evaluates the availability of qualified professionals for delivering artificial intelligence approaches [26]. Appendix A represents the talent indicators.
- Infrastructure: The availability and scalability of essential services such as power grids, the internet, and powerful computers are given primary consideration [26]. Appendix B represents the infrastructure indicators.
- Operating Environment: The regulatory framework and public opinion towards artificial intelligence are the primary determiners of this dimension [26]. Appendix C represents the operating environment indicators.
- Research: It takes into consideration the number of publications and citations that have been found in reputable academic journals and focuses on the extent of specialized study as well as the researchers that conduct it [26]. Appendix D represents the research indicators.
- Development: It places a primary emphasis on the creation of fundamental platforms and algorithms, which serve as the foundation for cutting-edge AI initiatives [26]. Appendix E represents the development indicators.
- Government Strategy: This dimension focuses on the level of dedication shown by national governments to artificial intelligence, as well as pledges to expenditure on research and national plans. Appendix F represents the government strategy indicators.
- Commercial: The quantity of funding and number of company initiatives is the primary focus of startup activities based on artificial intelligence [26]. Appendix G represents the commercial indicators.
Multi-Criteria Decision-Making (MCDM) techniques are used to choose the most optimal option from a variety of options that differ with respect to several criteria [39]. The method evaluates the alternatives, which are the basis of the decision-making problem, based on the determined preference functions, and determines the partial and full priorities of the alternatives with the pairwise comparison technique [40].
Graphical representation in MCDM methods is not a common representation. The GAIA (Geometrical Analysis for Interactive Aid) plane is a graphical presentation in which the PROMETHEE results are simply presented to the decision maker. With the GAIA geometric representation, the DM decides more easily and quickly by seeing the results of the conflicting criteria of the problem on a plane.
Proposed Multi-Criteria Decision-Making Method—PROMETHEE (Preference Ranking Organization Method for Enrichment Evaluation)
The PROMETHEE technique is a kind of MCDM in which the preference functions are set in accordance with the criteria that will be used to assess the alternatives. Pairwise comparisons provide this assessment with options [41]. Partial ranking is performed using the PROMETHEE I approach provided by Mareschal and Brans [42], while complete ranking is performed by the PROMETHEE II method. In addition, in 1988, Mareschal and Brans [43] created the GAIA approach, which gives graphical representations and aids in the implementation of the PROMETHEE method. There are 4 processing steps for the PROMETHEE approach [29,44,45,46]:
Step 1. Evaluate the n solutions (a1, a2, …, an) in A under m criteria Ck, and get the decision matrix X = (xik) (i = 1, 2, …, n; k = 1, 2, …, m). When Gk(dij) = 0, there is no difference between scheme ai and scheme aj. When Gk(dij) = 1, scheme ai has definite priority over scheme aj.
Step 2. Based on the weight (W) provided by the decision maker, a multi-criteria preference ranking index (H) is calculated.
Step 3. The positive and negative directions of the order of Ai’s preference are defined by Φ+(ai) and Φ−(ai), respectively.
Step 4. The exact ranking of the alternatives is obtained according to the values of Φ(ai).
4. Results
62 countries were evaluated in seven dimensions (Talent, Infrastructure, Business Environment, Research, Development, Government Strategy, Commercial) consisting of 142 sub-indicators. The Global Artificial Intelligence Index (Global AI Index) scores obtained for the seven dimensions were analyzed with the PROMETHEE method and GAIA plane.
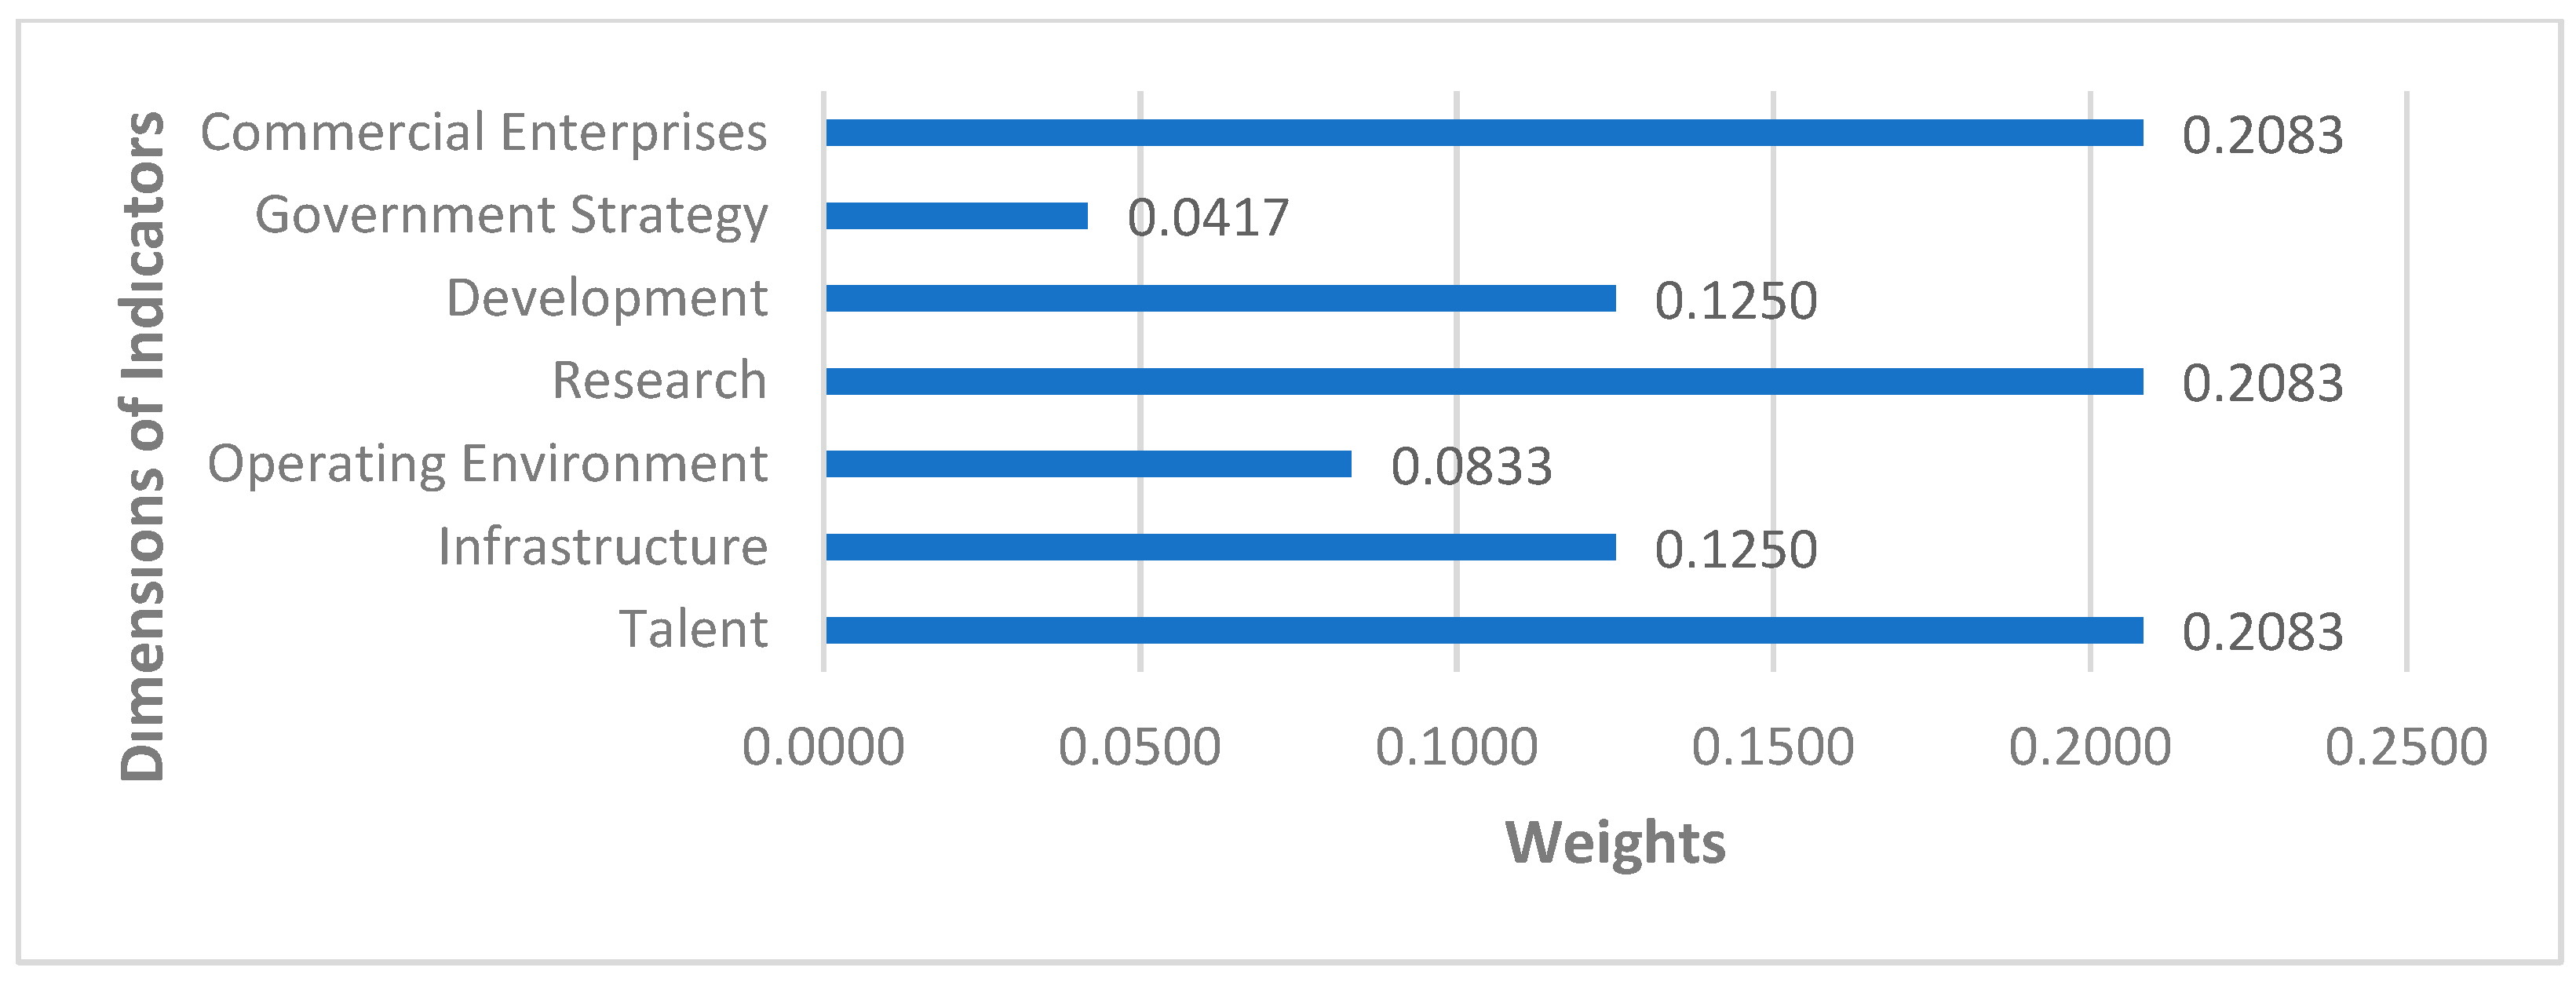
The weighting coefficients values in Table 2 were used in weighting the dimensions so that the sum of the weights is 1. Thus, the weight values in Figure 2 were obtained.
The countries included in the study and their indicator values are presented in Table 3.
It was important to normalize each data point to a [0, 1] scale to guarantee the data behind the index rankings were consistent and comparable. This step is critical for ensuring that the analyses are not skewed by outliers. This was necessary since our data had elements of many kinds, including binary, continuous, ordinal, and proportional elements. It is also necessary to de-unitize variables to ensure relationship and comparability [26]. Xnew = (x – xmin)/(xmax – xmin). Normalized decision matrix values are presented in Table 4.
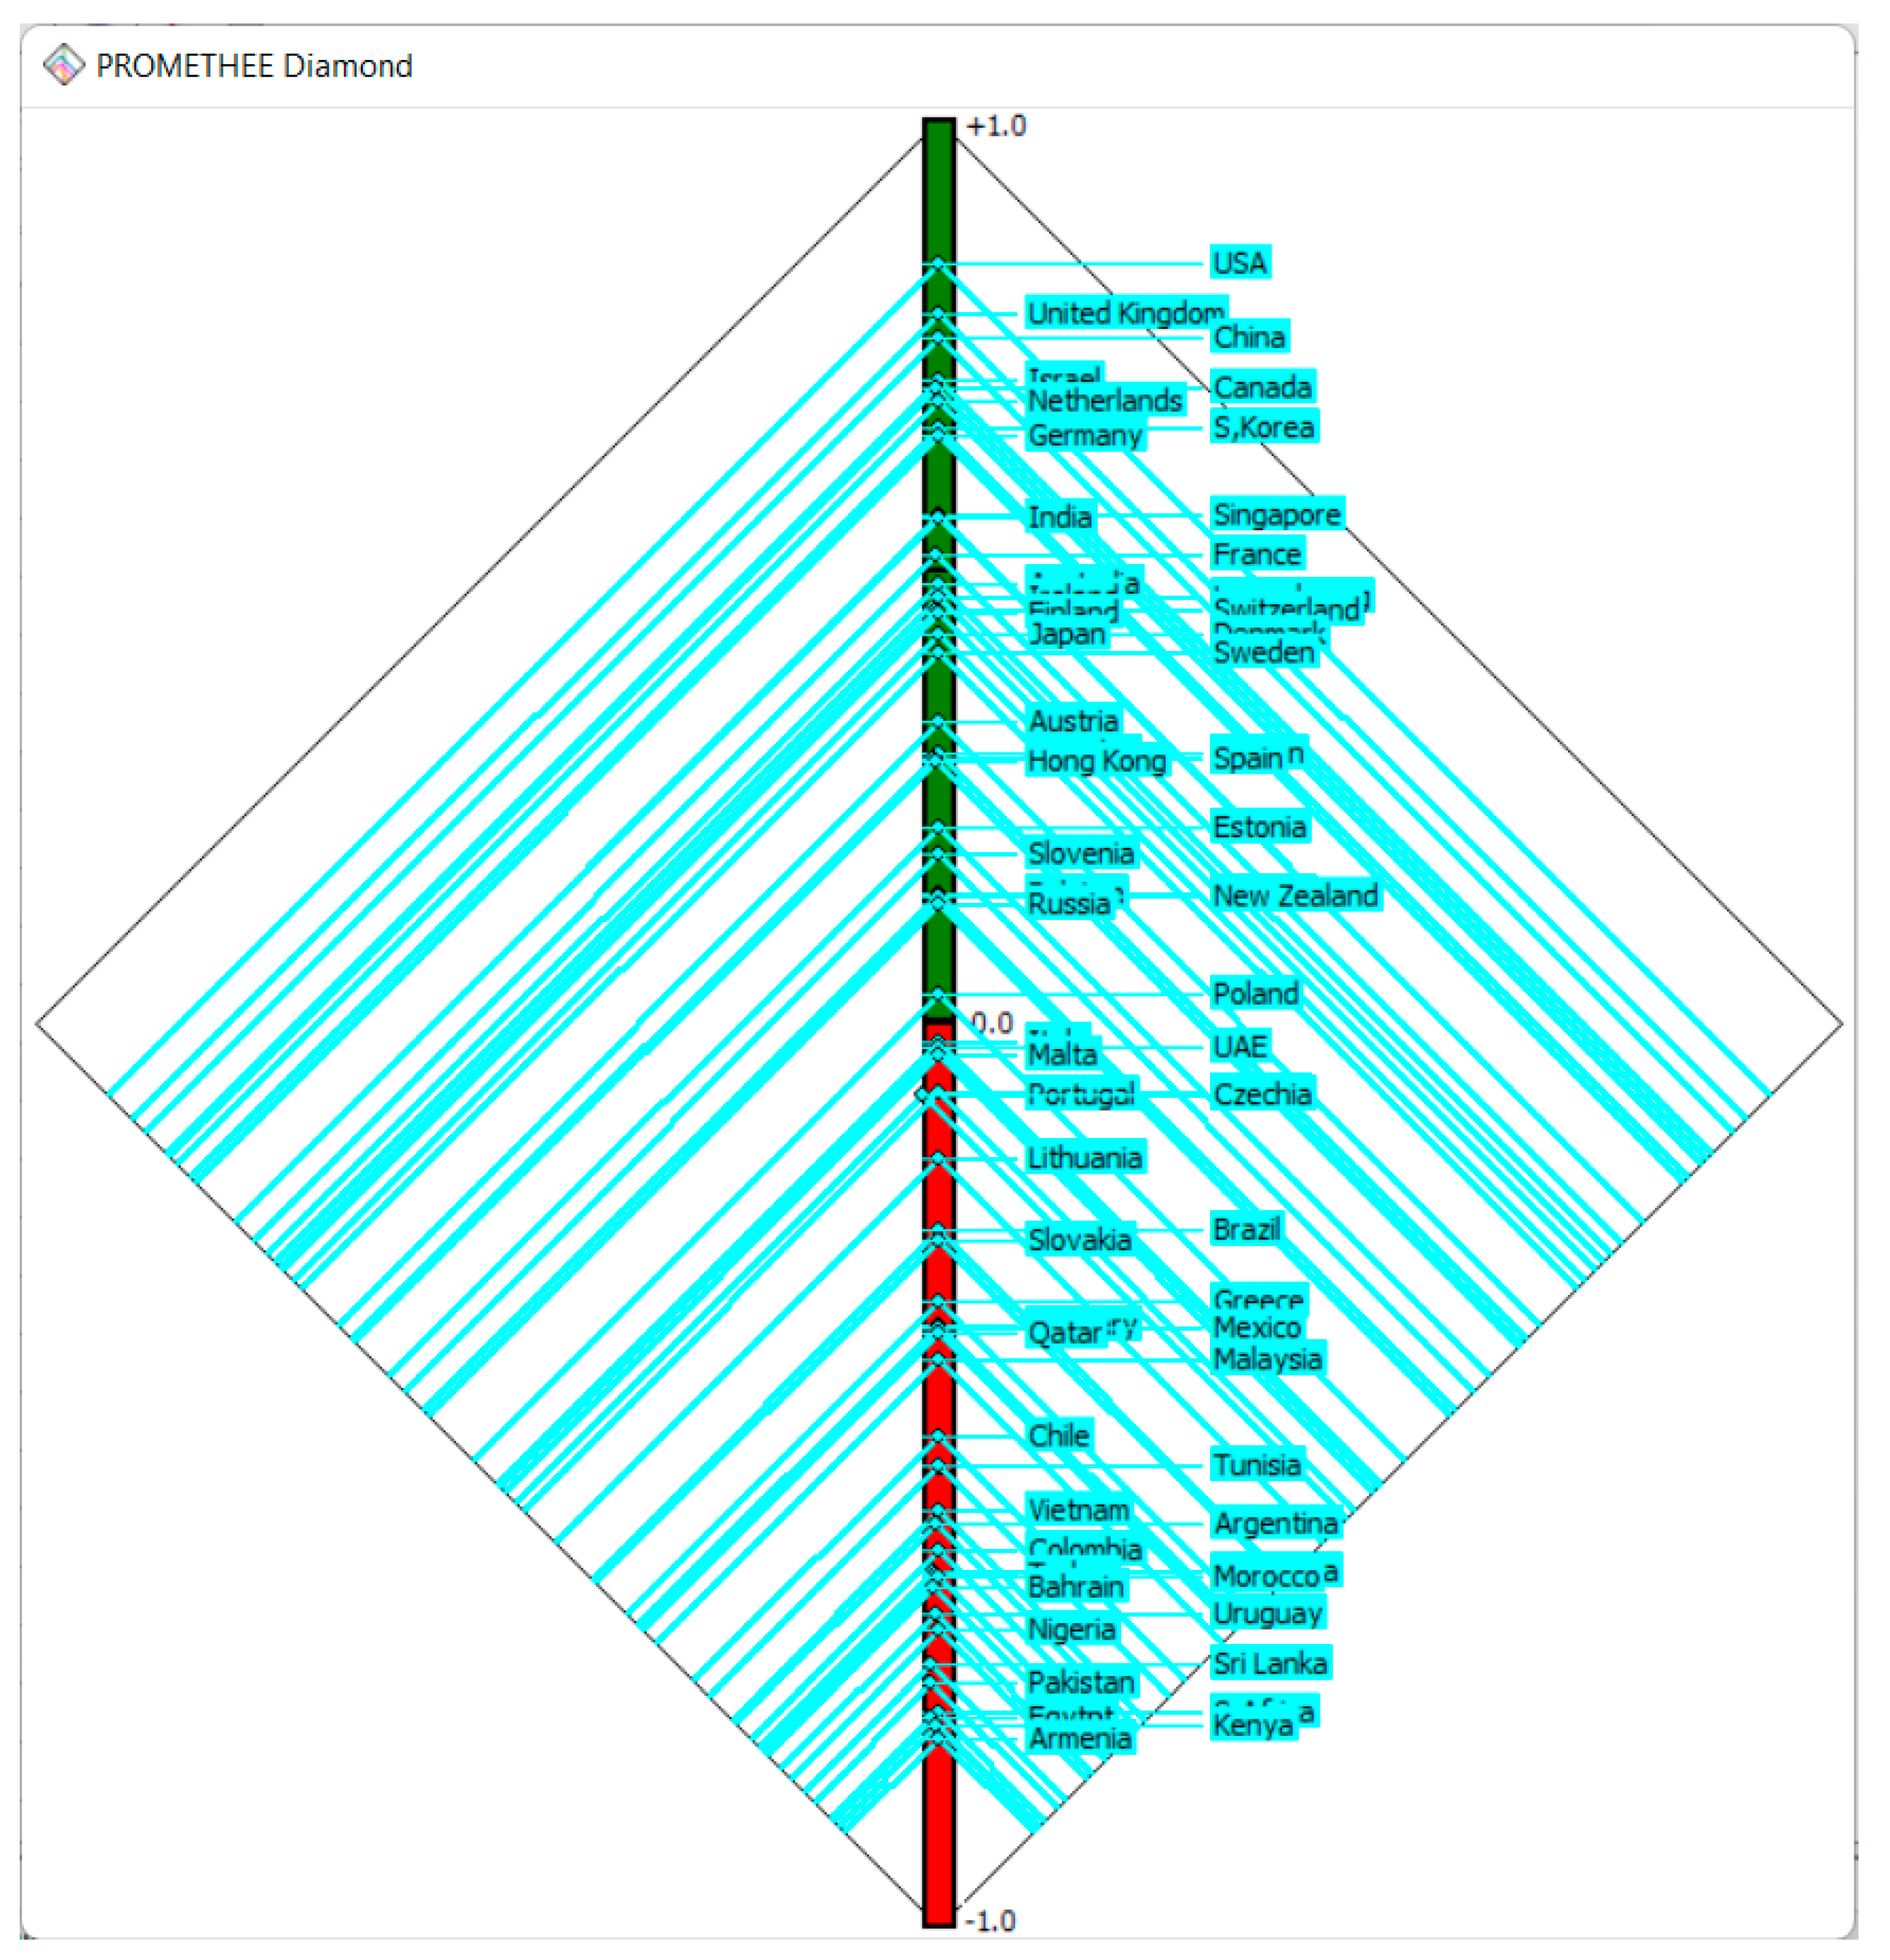
In the following parts, we discuss the interpretations as well as the results of the analysis. Each individual movement in the PROMETHEE Diamond is denoted by a point on the (Phi+, Phi-) plane. The plane is tilted at an angle of 45 degrees such that the vertical dimension, which is denoted by the green-to-red axis, corresponds to the Phi net flow. Scores on the Phi+ axis rise from the left to the top corner of the chart, whereas scores on the Phi- axis rise from the bottom to the top corner.
In Figure 3, Each nation is indicated with a conical shape. Overlapping cones in the PROMETHEE I Partial Ranking indicate a preference for one nation over another. A set of cones whose vertices intersect stands for incomparable endeavors. Since Phi is a vertical number, we may see both PROMETHEE sequences at the same time in this representation. The USA is unquestionably superior to all other nations, whereas Israel, the Netherlands, and Canada simply cannot be compared. If we take Turkey as another example, we cannot compare Turkey to Bahrain, Indonesia, or Morocco.
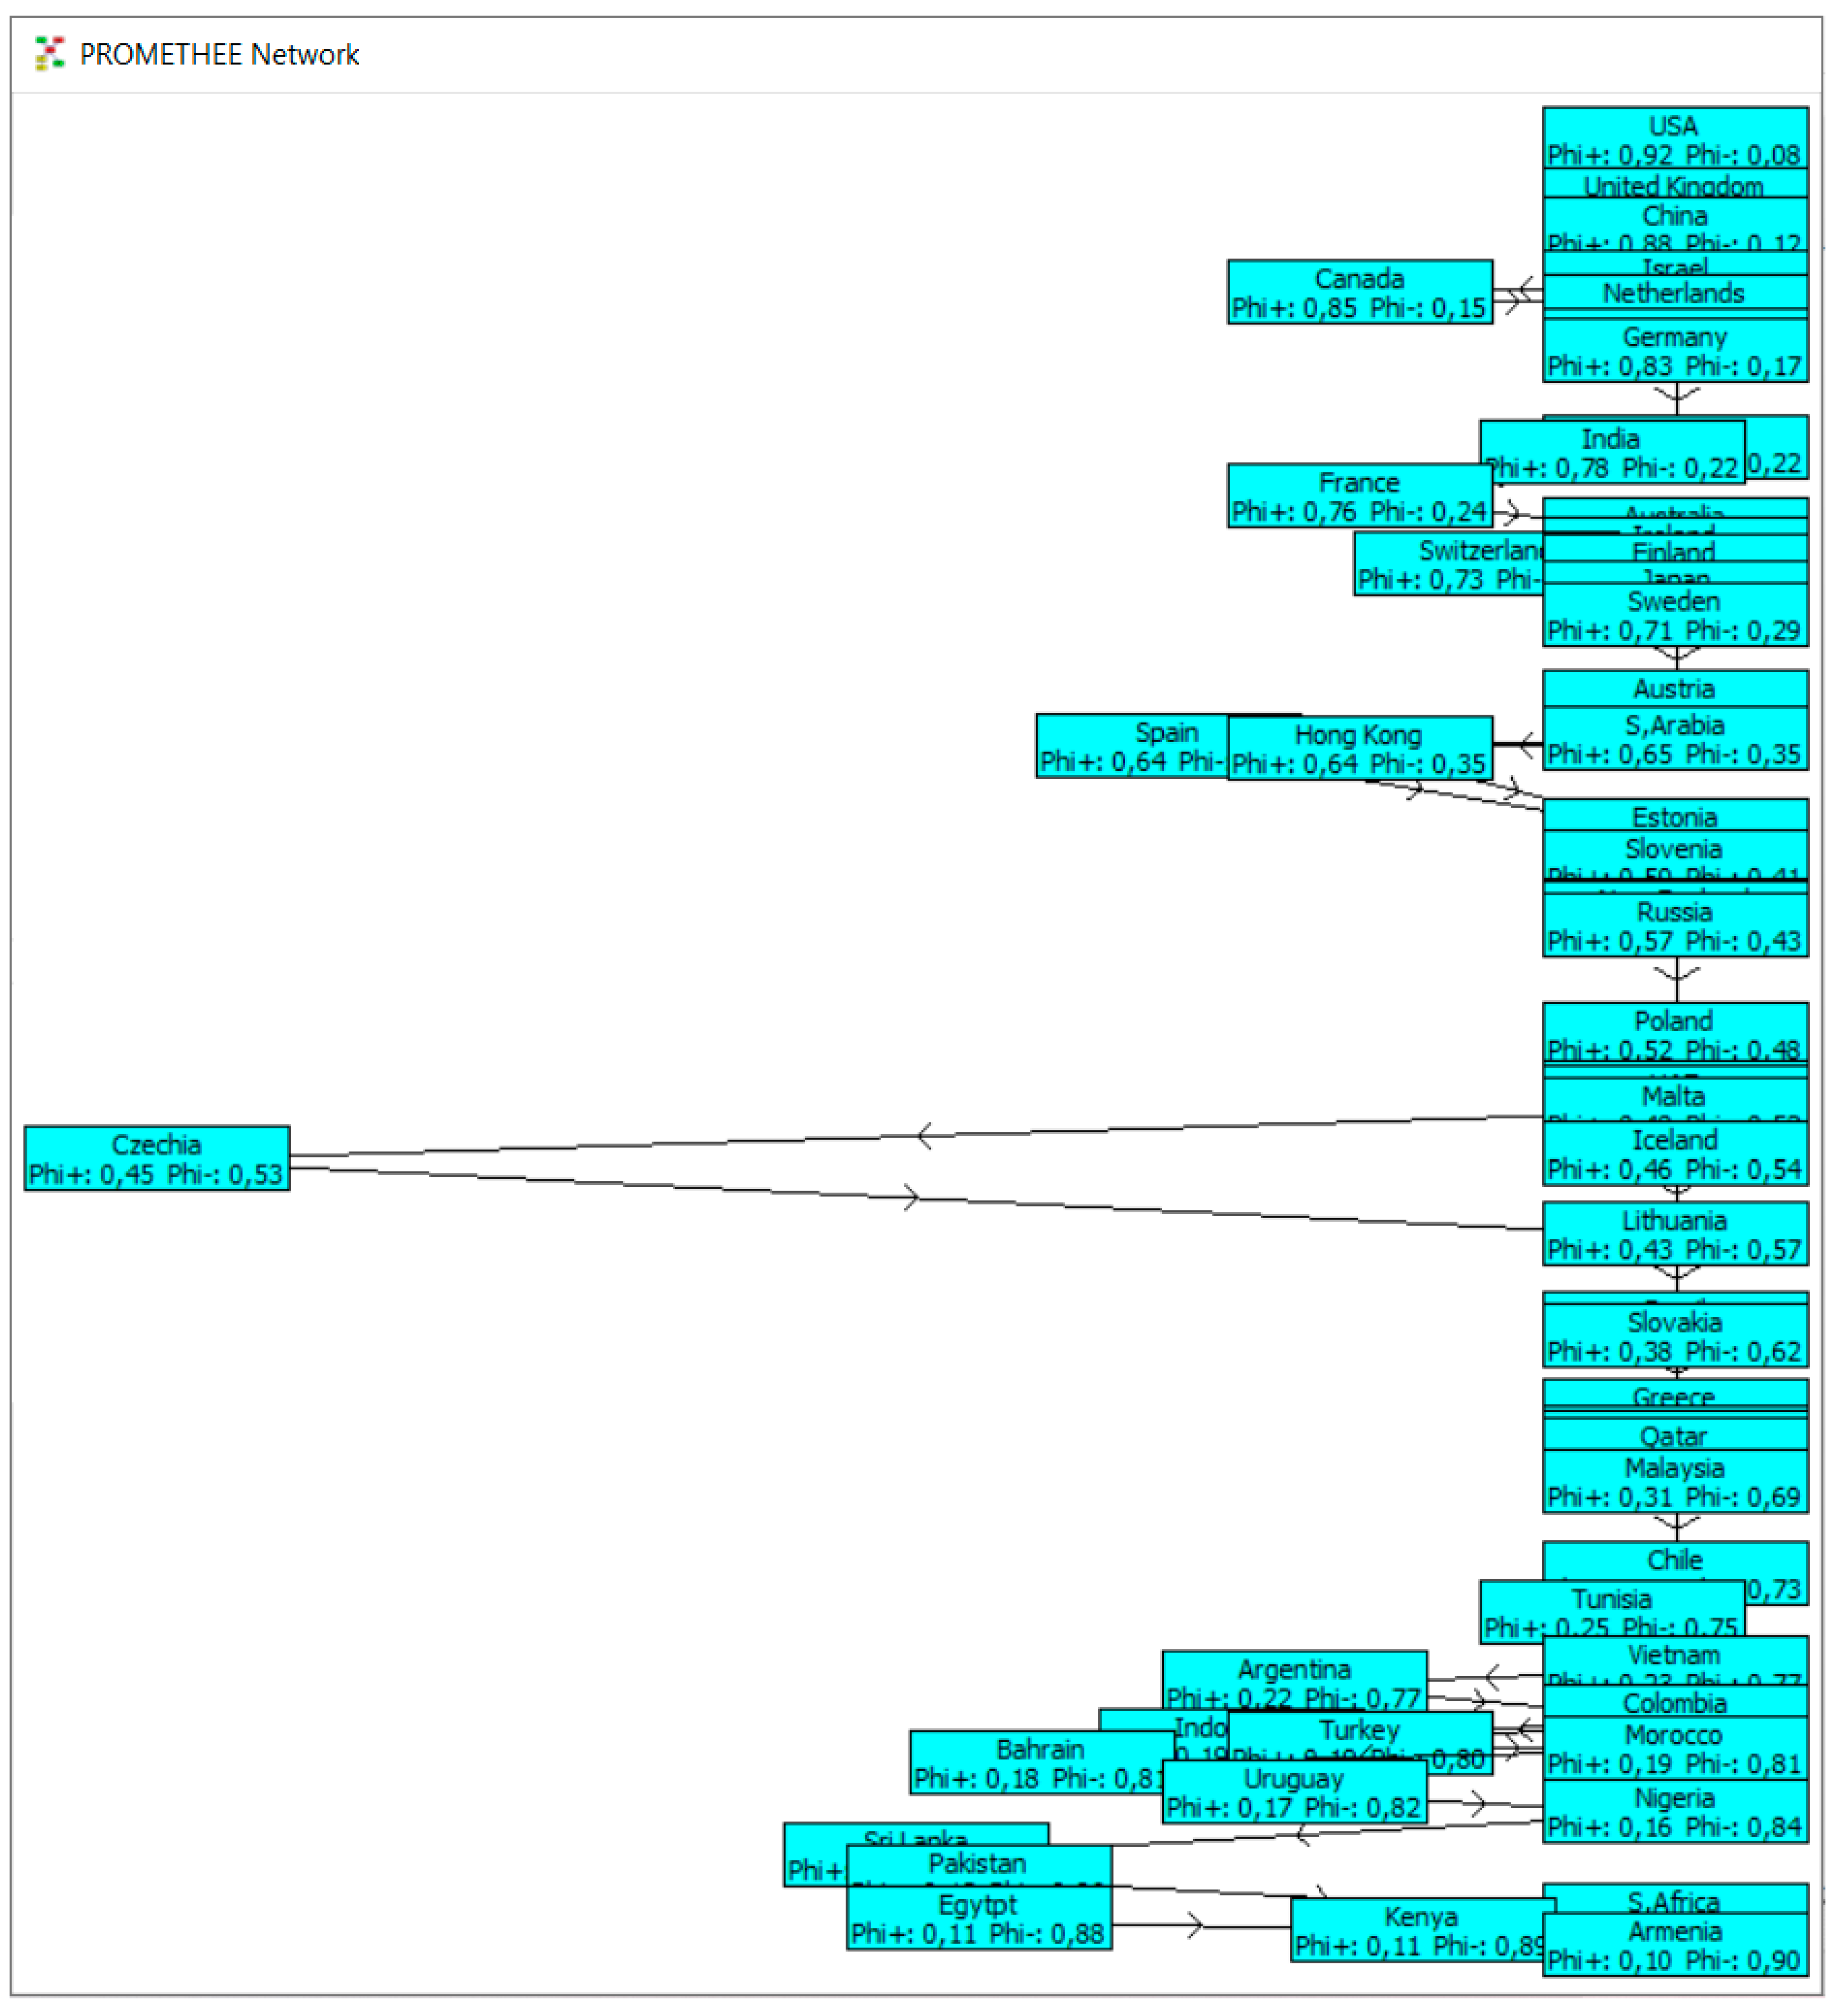
The results of PROMETHEE I offer a rating of countries that is partially determined by AI criteria. There are three possible results for the nations that were compared in this research, which involves pairwise comparisons of countries that have been computed to have either positive or negative superiority values. In a nutshell, these findings demonstrate that one nation is noticeably more advanced than another, that one nation is on level with another, and that one nation is in an unimaginably more precarious situation than another. In Figure 4, under the heading “PROMETHEE Network,” you can see a representation of the PROMETHEE I method’s partial sequence. On the screen of the PROMETHEE Network, each action is represented by a node, and preferences are shown by arrows. The positioning of the nodes in relation to the PROMETHEE Diamond highlights the closeness of the flow values.
The United States of America is also superior over all others in the PROMETHEE Network, and Israel, Canada, and the Netherlands are quite close to each other. Next to the USA, the United Kingdom and China are the world’s most powerful nations in terms of AI criteria.
The PROMETHEE II method is used in order to achieve a complete ranking for those nations for whom the outcomes of the comparison are ambiguous.
The findings of PROMETHEE II provide a thorough ranking of countries by taking into consideration the net advantage value, which is established by using both positive and negative superiority values. The entire rank value, or Phi, was produced by first finding the value of the negative superiority, or Phi-, and then subtracting that value from the value of the positive superiority, or Phi+. The findings of PROMETHEE II are shown in Table 5, which lists the nations according to their positive advantage value, negative advantage value, net advantage value, and overall ranking. According to the findings of this study, the United States of America has the greatest net Phi value of any country in 2021. Other leading nations on the list are the United Kingdom, China, Israel, Canada, the Netherlands, South Korea, and Germany, respectively. At the very bottom of the scale are nations such as Armenia, Kenya, Egypt, South Africa, and Pakistan. In addition, Turkey has a score that is more comparable to the nations that are positioned at the bottom of the ranking, as opposed to the countries that are positioned in the higher and medium rankings. Table 5 presents the PROMETHEE II Flow values.
Table 6 presents the scores and rankings obtained from PROMETHEE II method.
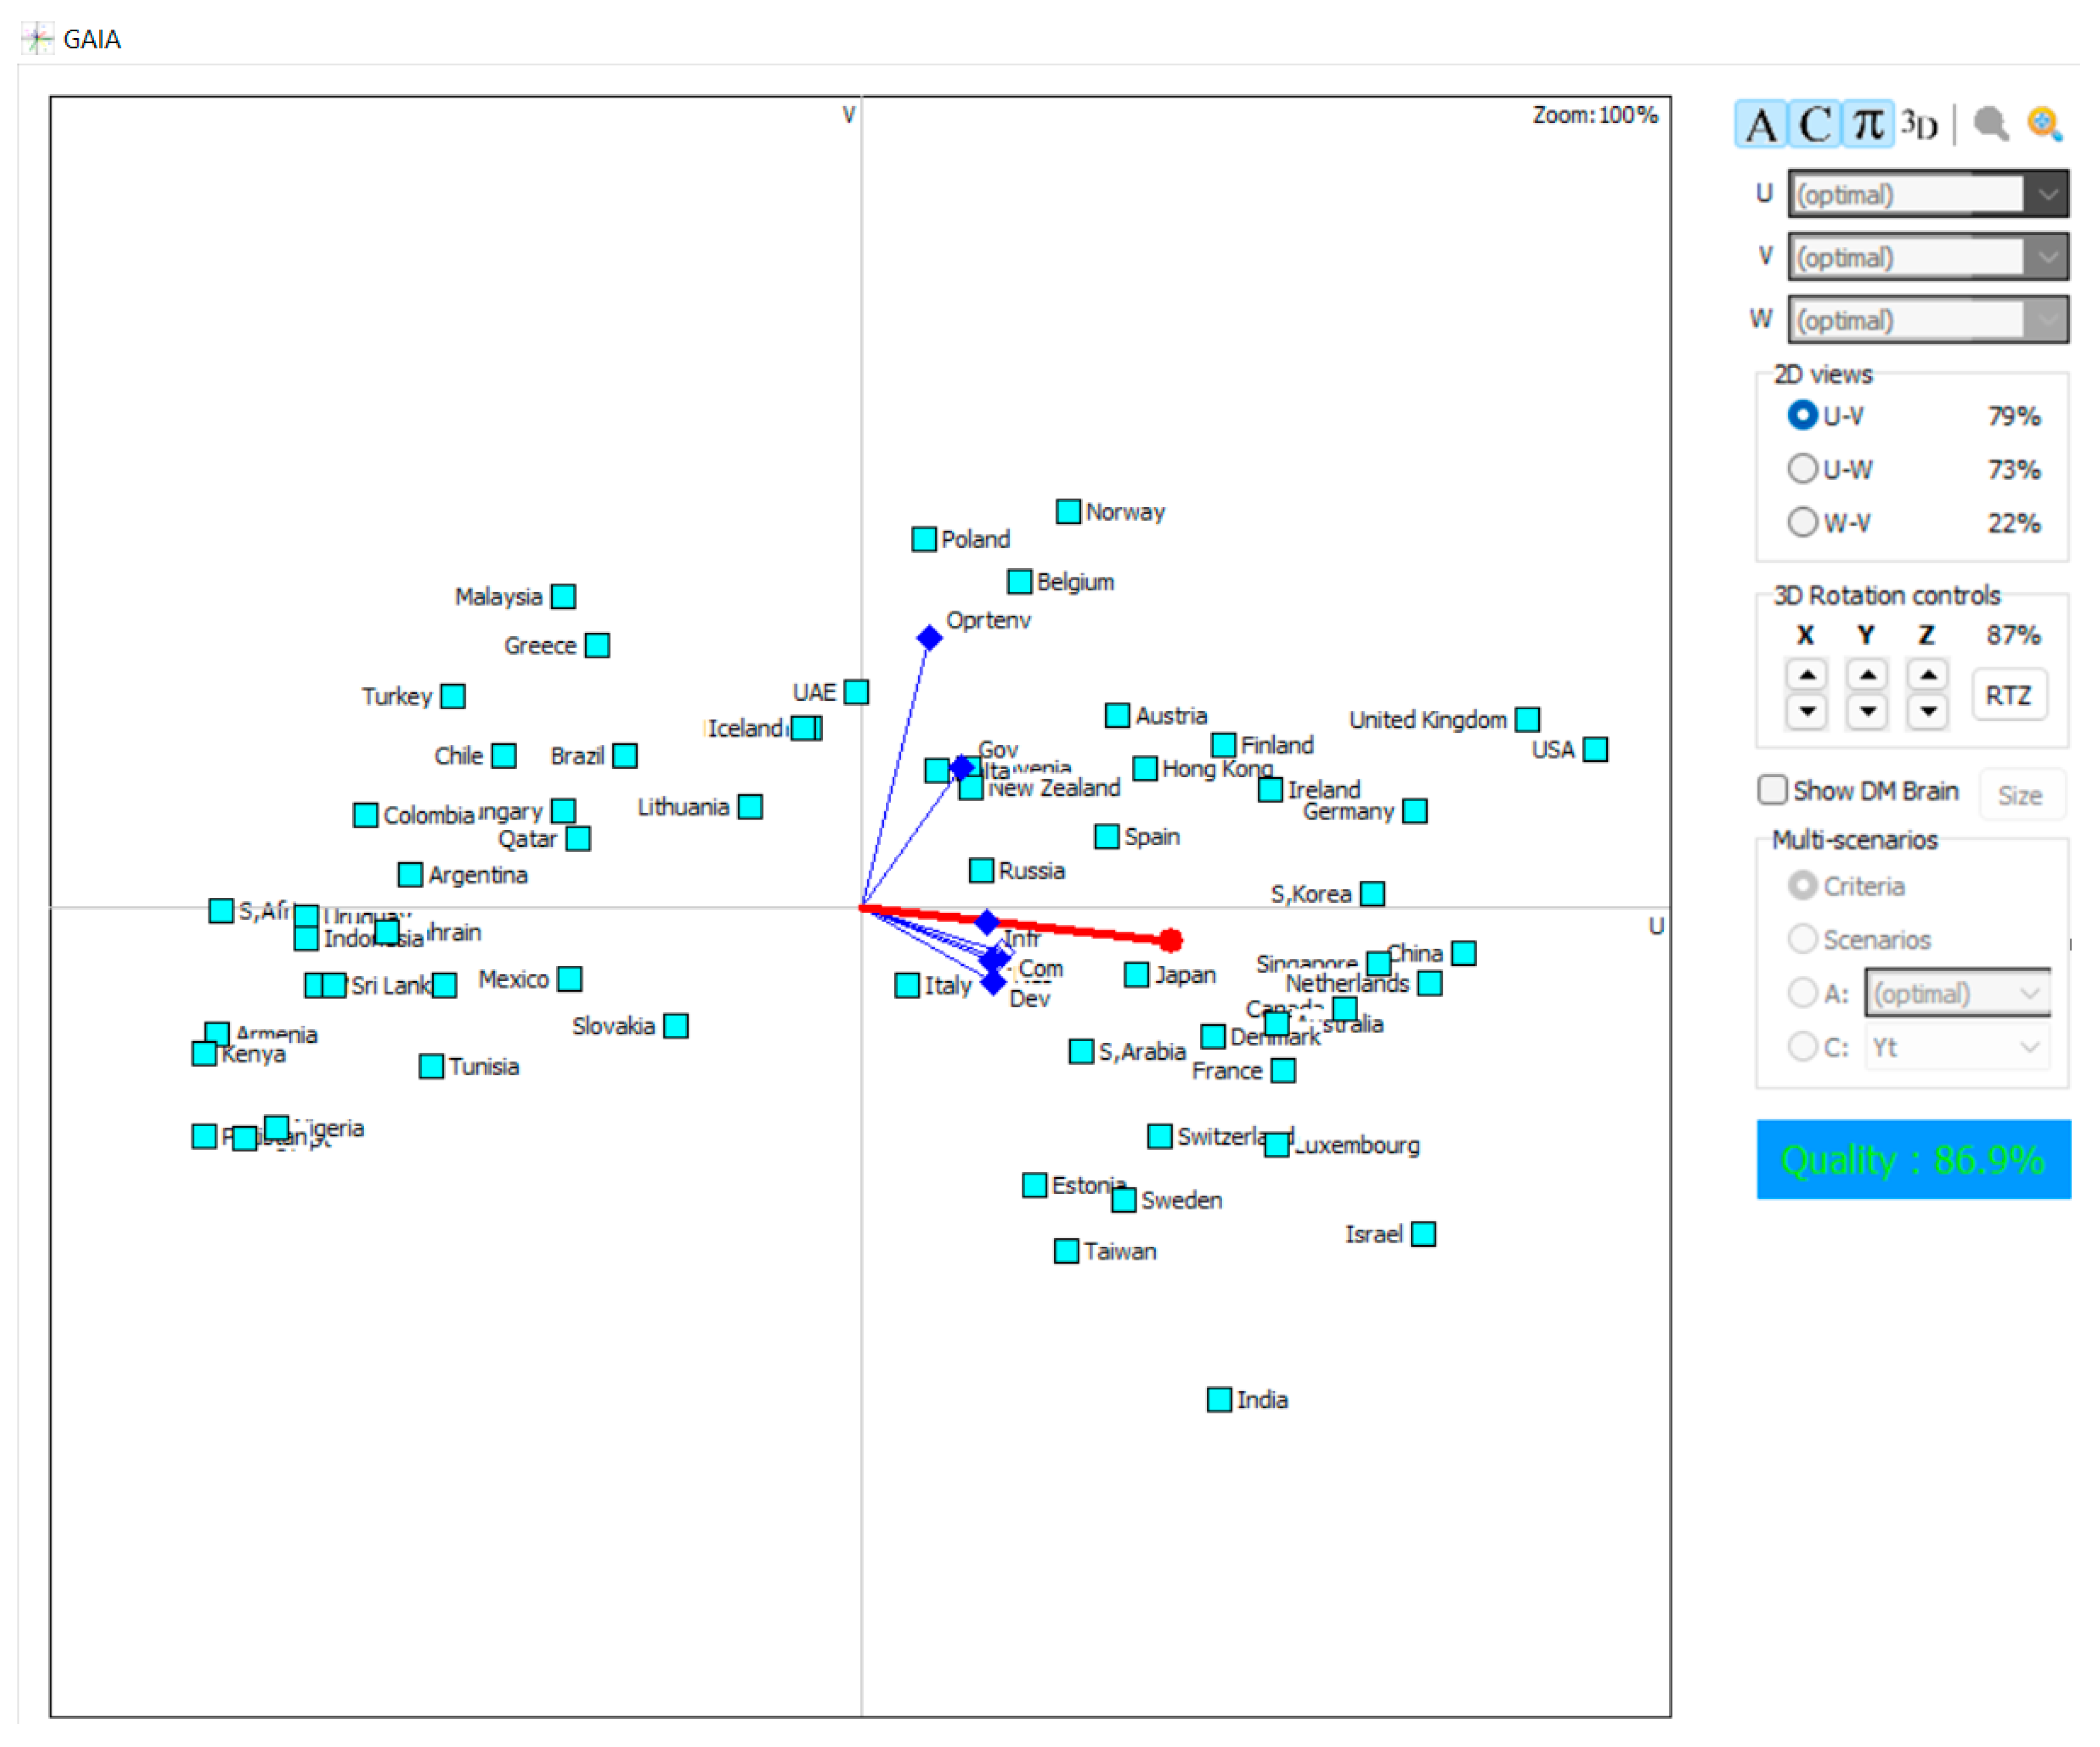
Figure 5 presents the results of the PROMETHEE II evaluation performed in the GAIA plane. The PROMETHEE IV technique was used in the creation of this graph. In point of fact, there are two different scenarios that may occur:
1. The PROMETHEE sequence must be maintained at all times since the Decision Axis is always positioned in the same direction when the red decision stick is totally on one side of the GAIA plane. It is not difficult to determine which nations are favored.
2. The Decision Axis will show that the GAIA plane may be guided in any direction when the decision stick is in a position where it overlaps the center of the GAIA plane.
As a result, the PROMETHEE sequences might be rather distinct from one another depending on the weight values that are used within the boundaries that have been established by the decision maker. As a direct consequence of this, the problem becomes far more difficult to evaluate. The placement of countries along the criterion axis provides insight into the degree to which certain aspects of their activity meet expectations.
When considering the location of the decision stick that was developed as a consequence of the research, there is the potential for a constrained shift in the scores that may be brought about by a modification to the indicator weights. Because the weights were decided as a consequence of the work of the expert teams comprising various fields of study of the institution that produced the index, the same weights were utilized in this research because they were the same weights that were calculated.
On the GAIA plane in Figure 5, each country is positioned as close to good value indicators as possible, or in the same direction. They are also positioned in the opposite direction of the indicators in which they have bad value. The decision bar, shown in red, acts as a component of all indicators.
Evidently, the accuracy of this information is constrained by the limitations of the GAIA plane. On the GAIA plane, the Decision Axis provides a graphical depiction of the relative importance of each criterion. Because various factors are given varying amounts of weight, the top nations in the PROMETHEE ranking are influenced to varying degrees by each of the criteria. The Decision Axis may be thought of as the weighted average of the axes representing the criteria. It provides an illustration of the direction that the PROMETHEE II ranking is heading, and as a consequence, it reveals which criteria are consistent with the PROMETHEE II ranking and which are not. This might be helpful in determining whether elements have an inadequate or excessive amount of weighting.
Alternatives, which represent the nations, are shown as points on the GAIA plane, while criteria are illustrated as vectors. The nations that have the greatest performance ratings are those that are the farthest in the direction that is shown by this decision stick. On the other hand, the countries that have the lowest scores are those that are the furthest in the reverse directions. The USA, the United Kingdom, and China are, in order, the nations that have the best positions according to the decision stick. On the other hand, the nations that have the lowest scores are Kenya, Pakistan, Armenia, and South Africa.
When assessing the GAIA plane, the length of the Decision Axis is a very crucial factor to take into consideration. When the Decision Axis is short, this implies that it is thus not accurately represented. The U–V plane in Visual PROMETHEE has a high quality (86.9%). Therefore, the third axis does not add much to the overall quality of the product. The quality of the three-dimensional display comes in at 91%. It is important to keep in mind that the third axis is responsible for about 4% of the total quality level while analyzing U–W (quality level: 73%) or W–V (quality level: 22%). As a result, U is clearly the best axis to use. Therefore, the main distinctions between these 62 countries may be summarized along one dimension.
It is possible to say that nations that are located in close proximity to one another on the GAIA plane have profiles that are comparable in terms of artificial intelligence (AI). In a similar vein, one may say that there is a significant difference in the values of criteria across nations that are positionally far from one another. The number of comments made above may be increased by decision makers if they so want, and this can be performed in accordance with the criteria and nations on the GAIA level. Displaying all net flows of the nations using a single representative criterion together simplifies exposing the profiles of the countries. It is easy to see that nations that are positionally adjacent to one another have profile graphs that are fairly similar to one another in terms of the positive and unfavorable factors.
The Spearman Correlation Test was applied to see if there is consistency between the results of the index presented in Table 7 and the results of this study.
According to the correlation test result presented in Table 8, there is a positive perfect correlation of approximately 99% between the PROMETHEE II and Global AI Index rankings and evaluations. This shows that this method also has a very successful level of consistency with the index.
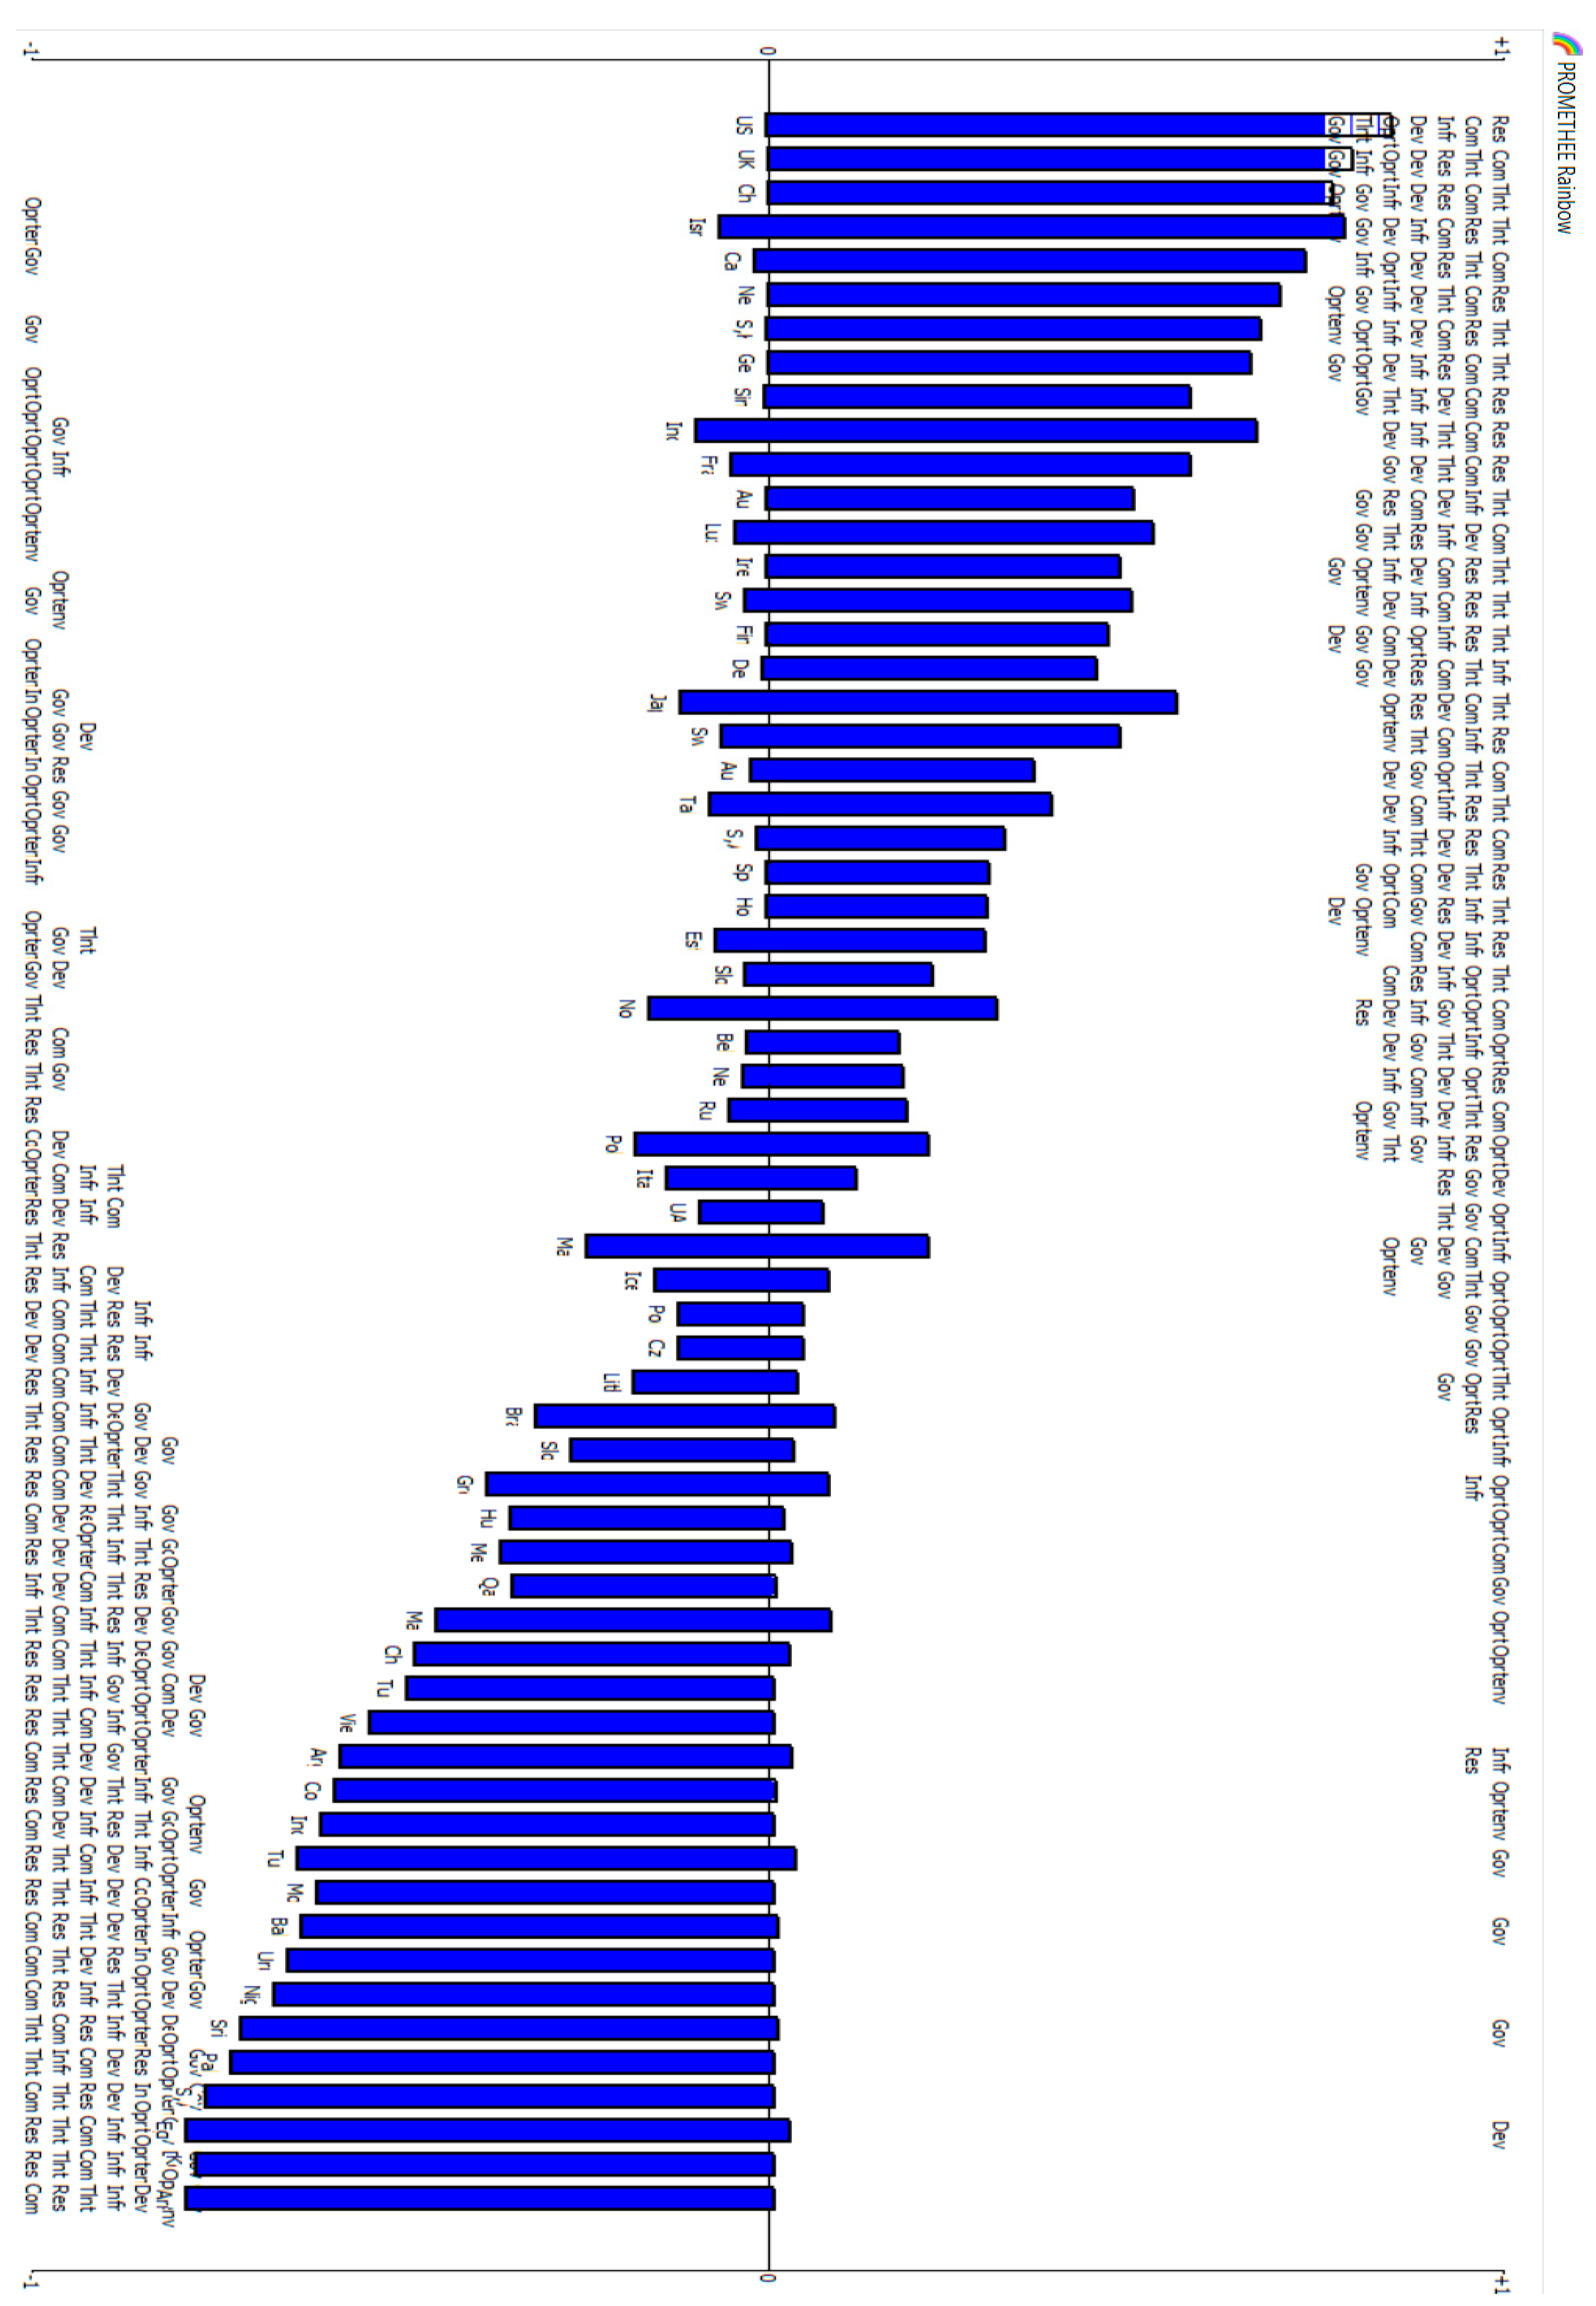
Graphical aids were constructed in Visual PROMETHEE. One of them is a diagram called a “rainbow” (see Figure 5). The advantages and disadvantages of each option are outlined in this chart, which is quite useful. Above the histograms (on the +1 axis) are the positive aspects, while below are the drawbacks (on the −1 axis). Figure 6 shows that the top three rated countries do not have the disadvantage indication. This helps explain why these countries are so high on the list. As you travel to the bottom on the nation assessment, the percentage of criteria with a disadvantage, that is, a low score, rises. With the exception of the indicator labeled “State Strategy,” all of the others have relatively low values when assessed for Turkey.
5. Discussion and Conclusions
The technological competition between countries has started to be measured in terms of the capabilities of the various artificial intelligence technologies. As a consequence of this, there is a widespread belief that artificial intelligence is a kind of technology that, in the not-too-distant future, will widen the disparity between wealthy and developing nations. Thus, in order for countries to improve their capabilities in the field of artificial intelligence, they need build a plan, a philosophy, a system, and an operating atmosphere that encourage cooperation among the public sector, the commercial sector, and research institutes. Future-focused nations that catch up with AI advancements, or even take the lead, will swiftly enjoy massive rewards in the form of efficiency improvements, cost savings, and technological breakthroughs that will boost almost every area of their global competitiveness. However, governments may also contribute to national policies and goals by swiftly incorporating new technologies into action plans as necessary, even if the private sector is responsible for the majority of the current research.
After the literature review, it became clear that there is a great need for more research into the comparative assessment of nations in terms of their artificial intelligence (AI) technology advancement and policies. In order to address this deficiency, a comprehensive evaluation of AI and, by extension, the current level of technology, was intended. The goal of this research was to use the PROMETHEE and GAIA techniques, which are based on the weights determined in the (Tortoise Global AI Index) Global Artificial Intelligence Index, to compare and analyze 62 nations with data on all metrics. According to the literature study, PROMETHEE methodologies are among the most popular MCDM approaches to management and strategy. There is no research comparing and assessing AI using MCDM over such a broad scope as the 62 nations that can be found in the existing body of academic literature.
Globally, governmental and commercial sector operations are being rapidly transformed by artificial intelligence. The Global AI Index has a weighting that takes into account the variation in artificial intelligence and technology progress by location. The index comprises 62 countries in an effort to include as many economies as feasible while retaining the reliability and usefulness of the underlying data collection. In this study, the strengths and weaknesses of the countries according to their current situation and their relative comparisons are presented. As in many studies, it aims to make an assessment on a global scale as much as possible, rather than addressing a specific country or region. When it comes to visually examining the similarities of nations as well as comparable and dissimilar country groupings in terms of indicator values, the PROMETHEE approach has a modest edge over other methods since it was developed specifically for this purpose. In addition, as was underlined in the portion of the literature review that was devoted to the technique, the fact that it is a favored method in management studies is the reason why it was chosen in this research.
The originality of the research is that it includes essential data on the present artificial intelligence literature and examines 62 nations with considerable economic strength from almost all continents in terms of key variables using pandemic data from 2021. When the findings of this research are compared to the rankings of other studies in the scientific literature, they are consistent. According to the Spearman Correlation test result, there is a positive close-to-perfect correlation of approximately 99% between the rankings and scores obtained with the PROMETHEE II method and the Global AI Index methodology. This shows that this method also has a very successful level of consistency with the index, meaning the PROMETHEE method, one of the MCDM methods, can be a remarkable alternative method to benefit from such indices. Future research may provide different rankings as a result of the computational variations between various MCDM approaches. Due to the subjective nature of MCDM techniques such as the Analytical Network Process (ANP) and the Analytical Hierarchy Process (AHP), various analyses for the same indicators might have vastly different outcomes. When criteria weights are chosen based on subjective judgements, even outcomes produced using identical procedures and indications will vary.
According to the findings of this study, the United States of America is clearly in the leading position when it comes to artificial intelligence (AI) invention, implementation, and investment. In addition to these nations, the United Kingdom, China, Israel, Canada, the Netherlands, South Korea, and Germany are also considered to be among the best in the world. China is making significant progress in catching up to the United States of America. At the very bottom of the list are nations such as Armenia, Kenya, Egypt, South Africa, and Pakistan. In addition, Turkey’s values are more comparable to those of the nations that are at the bottom of the list, as opposed to the countries that are in the top and medium positions.
All of the study’s metrics had relatively high values for the top three countries, particularly when compared to the values for other nations. In relation to Turkey, all of the other indicators, excluding the ‘Government Strategy’ metric, had values that are somewhat low when compared to those of countries that have a high ranking. It is strongly advised that authorities should create a more elaborate national artificial intelligence approach, both financially and content-wise, keeping in view the advantages and drawbacks of their potential. This recommendation is made in light of the study conducted.
In countries like Turkey, which are at the bottom of the list, more than two-thirds of the incentives and financing of technology and R&D activities are undertaken by the state. With these incentives, private-sector companies generally carry out these activities. It can be seen from the relevant expenditure indicators that the willingness of the private sector to invest in activities such as R&D is quite weak. In the leading countries in artificial intelligence and R&D, it works in the opposite way. Governments spend much less than major tech platforms. Amazon spends nearly ten times the total budget of DARPA (The Defense Advanced Research Projects Agency) (USD 36 billion and USD 3.5 billion in 2019, respectively) on R&D and infrastructure. The UK’s new public research agency ARIA (Advanced Research and Invention Agency) will have a budget of just GBP 800 m through the next parliament. However, the private sector in England undertakes tens of times more than this public expenditure.
The most striking result is the rapid development of China. Taking into consideration these seven dimensions and 143 indicators, while the gap between the top three rankings is large, the USA is still well ahead of China, and the United Kingdom is considerably, behind despite being in second position. On the other hand, China ranks second in the ranking of the index and third in the ranking of PROMETHEE II.
Compared to 2019 data, China has achieved significant gains in 2020. In terms of sub-indicators, another Chinese university joined the Times’s list of top 100 computer science universities; the total number of citations for high-achieving Chinese computer science academics increased by 67 percent in 2020 compared to 2019; the number of Chinese academic AI papers accepted by the IEEE (Institute of Electrical and Electronics Engineers), an institution that sets AI standards and also publishes a number of influential AI journals, is now seven times more than US academics; and China surpassed the US in terms of AI patents granted nearly two years ago, and have been making the difference even greater since 2018. China also excels in launching supercomputers with almost twice the US’s supercomputers, continuing the US’s growing threat to artificial intelligence supremacy.
The UK has announced that it will declare a new AI strategy due to the narrowing gap with China, but it has not been published yet. Additionally, UK universities have lost momentum in areas such as supercomputing, research, patents, and expert diversity.
Israel draws attention with its fourth place in the ranking. It has a very good value in the Talent dimension, especially with its indicators of coding development and learning outside of formal education. They also rank highly for AI entrepreneurs relative to the population for a small country, with stats of three AI startups per 100,000 people (compared to five new AI startups per 1,000,000 people in the US).
Although it is 16th in the ranking, Finland should also be taken into account, which bought a pre-exascale supercomputer and significantly increased its coding efficiency. Finland’s Fin AI Accelerator, Tampere AI Hub, and AI Academy at the University of Turku have created an excellent ecosystem, along with both government strategy and driven skills development programs, which comprise another outcome that needs focus. However, exciting technology startups such as Rovio, Supercell, and CRF Health show that Finland has the potential to be among the top 10 countries in the near future.
Although the Netherlands is in the sixth place, when its place in the Global AI ranking has been evaluated in the past years, it is the country that has made the most progress; the Netherlands scores high in speeding up coding and development activities and in talent size indicators, such as number of data scientists per capita, aided by the slowdown in some previously higher-ranked countries (Japan).
The indicator weight coefficients in the index were taken into account in the study. These weights were handled with the PROMETHEE method, which is one of the objective multi-criteria decision-making methods that only takes into account the indicator values. When the same indicator values were analyzed by the PROMETHEE method with indicator weights to be determined by different methods, there may have been slight differences in the country rankings. However, there may be some differences in the rankings when the same values are handled with different MCDM methods. This is one of the limitations of the research. Meanwhile, the results of the study and the Spearman correlation results of the ranking of the index show that the results of the research are quite reliable.
Indicator values, weights, and country scores are shared in full detail in the study. Policy makers and decision makers of the countries can benefit from this study and evaluate their current situation compared to their competitors. It is easy to see which indicators and dimensions they should prioritize and which countries are doing well in this regard. Benchmarking can be conducted by evaluating the policies of countries that are in good standing according to them.
As a suggestion in terms of expanding the scope of the study indicator, it can be said that more indicators and data on the concept of ethics are needed in the evaluation and comparison of artificial intelligence technology and its developments.
Author Contributions
G.O.: conceptualization; data curation; methodology; investigation; validation; writing—original draft; writing—review and editing; supervision; and proofreading. A.D.: methodology; validation; writing—review and editing; and proofreading. All authors have read and agreed to the published version of the manuscript.
Funding
This research received no external funding.
Institutional Review Board Statement
Not applicable.
Informed Consent Statement
Not applicable.
Data Availability Statement
The data sources presented in this study are available in the manuscript.
Conflicts of Interest
The authors declare no conflict of interest.
Appendix A. The Talent Indicators

| Indicator | Source | Indicator | Source |
|---|---|---|---|
| Number of ‘Artificial Intelligence’ Meetup Members | Meetup | Number of GitHub ‘Stars’ | GitHub |
| Proportion of Total ‘Artificial Intelligence Engineers’ on Social Media | Linkedin, Element AI | Coursera Machine Learning score | Coursera Global Skills Index |
| Existing number of ‘Data Scientists’ on Social Media | Linkedin, Element AI | Coursera Cloud Computing score | Coursera Global Skills Index |
| Proportion of Total ‘Data Scientists’ on Social Media | Linkedin, Element AI | Existing number of ‘Artificial Intelligence Engineers’ on Social Media | Linkedin, Element AI |
| Proportion of Total ‘Machine Learning Engineers’ on Social Media | Linkedin, Element AI | Existing number of ‘Machine Learning Engineers’ on Social Media | Linkedin, Element AI |
| Existing number of ‘Artificial Intelligence Engineers’ on Social Media per capita | Linkedin, Element AI | Existing number of ‘Data Engineers’ on Social Media per capita | Linkedin, Element AI |
| Existing number of ‘Artificial Intelligence Engineers’ per million labour force | Linkedin, Element AI | Number of Kaggle ‘Grandmasters’ | Kaggle |
| Number of GitHub Commits | GitHub | Number of Kaggle ‘Grandmasters’ per capita | Kaggle |
| Existing number of ‘Data Engineers’ on Social Media | Linkedin, Element AI | Number of ‘Artificial Intelligence’ Meetup Members per capita | Meetup |
| Proportion of Total ‘Data Engineers’ on Social Media | Linkedin, Element AI | Number of GitHub ‘Stars’ per capita | GitHub |
| Existing number of ‘Data Engineers’ per million labour force | Linkedin, Element AI | Proportion of Total Github ‘Stars’ | GitHub |
| Existing number of ‘Data Scientists’ on Social Media per capita | Linkedin, Element AI | Number of STEM Graduates per capita | UNESCO |
| Existing number of ‘Data Scientists’ per million labour force | Linkedin, Element AI | Number of Science Graduates per capita | UNESCO |
| Existing number of ‘Machine Learning Engineers’ on Social Media per capita | Linkedin, Element AI | Number of Science Undergraduates per capita | UNESCO |
| Existing number of ‘Machine Learning Engineers’ per million labour force | Linkedin, Element AI | Number of R ‘Artificial Intelligence’ Package Downloads | CRAN |
| Number of Answers to ‘Artificial Intelligence’ Questions | Google Big Query | Number of R ‘Artificial Intelligence’ Package Downloads per capita | CRAN |
| Proportion of Total Answers to ‘Artificial Intelligence’ Questions | Google Big Query | Proportion of Total R ‘Artificial Intelligence’ Package Downloads | CRAN |
| Number of ‘Artificial Intelligence’ Questions Posted | Google Big Query | Number of IT Graduates per capita | UNESCO |
| Proportion of Total ‘Artificial Intelligence’ Questions Posted | Google Big Query | Number of IT Undergraduates per capita | UNESCO |
| Ratio of ‘Artificial Intelligence’ Questions to Answers | Google Big Query | Number of Python ‘Artificial Intelligence’ Package Downloads | Google Big Query |
| Number of GitHub Commits per capita | GitHub | Number of Python ‘Artificial Intelligence’ Package Downloads per capita | Google Big Query |
| Proportion of Total GitHub Commits | GitHub | Proportion of Total Python ‘Artificial Intelligence’ Package Downloads | Google Big Query |
| Proportion of Total Kaggle ‘Grandmasters’ | Kaggle | Alexa MOOC Website Rank | Alexa API |
Appendix B. The Infrastructure Indicators
| Indicator | Source |
|---|---|
| Proportion of Population with Access to Electricity | World Bank |
| Proportion of Population using Internet | ISP review |
| Number of Top500 Non-Distributed Super Computers | top500 |
| Number of Top500 Non-Distributed Super Computers per capita | top500 |
| Average Download Speed | speedtest.net |
| 5G Implementation Score | Speedtest Ookla 5G Map |
| Proportion of Total Integrated Circuits Imports | OEC |
| Mobile Penetration Rate per 100 Persons | World Bank |
| Proportion of Total Integrated Circuits Exports | OEC |
Appendix C. The Operating Environment Indicators
| Indicator | Source |
|---|---|
| Level of Data Protection Regulation | UNCTAD |
| Gender Diversity of ‘AI professionals’ | Kaggle Machine Learning & Data Science Survey |
| Signatory to The International Open Data Charter | The International Open Data Charter |
| Proportion of Population that ‘Does not Trust AI’ | Ipsos MORI |
| Proportion of Population that ‘Does Trust AI’ | Ipsos MORI |
| Speed of Visa Processing for Skilled Worker, or Equivalent | Various Government data-sets |
| Gender Diversity of IT Graduates | UNESCO, World Bank |
| OURdata Index Global Score | OECD OURdata Index |
| Gender Diversity of Science Graduates | UNESCO, World Bank |
| Length of Residence of Visa | Various Government data-sets |
| Cost of Visa | Various Government data-sets |
| Permanent Visa Option for Skilled Workers | Various Government data-sets |
| Presence of Right to Explanation | Various Government sources |
| Dependents Allowed as part of Visa Application | Various Government data-sets |
| Kaspersky Cybersecurity Score | Comparitech |
Appendix D. The Research Indicators
| Indicator | Source |
|---|---|
| Number of Universities in Times Higher Education Top 100 Computer Science Universities | The Times Higher Education Rankings |
| Total Spending on Research & Development | World Bank |
| Number of AI Related Papers | Scopus |
| Number of AI Related Papers Per Capita | Scopus |
| Number of Citations on AI Related Papers | Scopus |
| Number of Citations on AI Related Papers Per Capita | Scopus |
| Number of Accepted IEEE papers | IEEE, SCOPUS Impact Factor & various other sources |
| Number of Universities in Times Higher Education Top 100 Physical Sciences Universities | The Times Higher Education Rankings |
| Number of Submissions to ‘AI Conferences’ | Various Conference Publications |
| Number of Citations on Academic Publications | SCOPUS |
| Highest Rank on H-Index | H-Index |
| Number of Researchers | UNESCO |
| Number of Universities with Artificial Intelligence Courses | Various Search Engine Returns |
| Number of Universities with Artificial Intelligence Courses per capita | Various Search Engine Returns |
| Number of Academic Publications on ‘Artificial Intelligence’ | H-Index and Guide2Research |
| Position on GLUE ‘AI Model’ Leaderboard | GLUE |
Appendix E. The Development Indicators
| Indicator | Source |
|---|---|
| Level of Participation in ISO Artificial Intelligence Committee | ISO |
| Number of Collaborators on ‘Open Source AI Packages’ | GitHub |
| Proportion of Total Commits on ‘Open Source AI Packages’ | GitHub |
| Number of Granted ‘AI Patents’ by inventor | Google Big Query |
| Average days taken for approval by patent office | Google Big Query |
| Number Commits on ‘Open Source AI Packages’ | GitHub |
| Commits on ‘Open Source AI Packages’ per capita | GitHub |
| Number of Granted ‘AI Patents’ by applicant | Google Big Query |
| Number of Granted ‘AI Patents’ by applicant per capita | Google Big Query |
| Average Commits per Collaborator on ‘Open Source AI Packages’ | GitHub |
| Number of Filed ‘AI Patents’ by inventor | Google Big Query |
| Number of Filed ‘AI Patents’ by inventor per capita | Google Big Query |
| Proportion of Total Filed ‘AI Patents’ by inventor | Google Big Query |
| Number of Granted ‘AI Patents’ by inventor per capita | Google Big Query |
| Number of Filed ‘AI Patents’ by applicant | Google Big Query |
| Number of Filed ‘AI Patents’ by applicant per capita | Google Big Query |
| Proportion of Total Filed ‘AI Patents’ | Google Big Query |
| Proportion of Total Granted ‘AI Patents’ by applicant | Google Big Query |
| AI Patent’ Application Acceptance Rate | Google Big Query |
| Proportion of Total Granted ‘AI Patents’ by inventor | Google Big Query |
| Acceptance Rate for ‘AI Patents’ by inventors | Google Big Query |
Appendix F. The Government Strategy Indicators
| Indicator | Source |
|---|---|
| Government has Publicly Dedicated Money to AI | Various National Strategy Documents |
| National AI Strategy was Signed by Senior Member of Government | Various National Strategy Documents |
| Length of Spend Period in National AI Strategy | Various National Strategy Documents |
| Dedicated Spending on Artificial Intelligence | Various National Strategy Documents |
| Dedicated Strategy Mention of Training or upskilling | Various National Strategy Documents |
| Dedicated Strategy received External Consultation | Various National Strategy Documents |
| Number of Months since Release of National AI Strategy | Various National Strategy Documents |
| Government has Dedicated National AI Strategy | Various National Strategy Documents |
| Government has Measurable AI Targets | Various National Strategy Documents |
| Presence of Tracking of Previous Years Efforts | Various National Strategy Documents |
| Government has a ‘Dedicated AI Governmental Body’ | Various National Strategy Documents |
| Dedicated Spending on Artificial Intelligence Proportional to GDP | Various National Strategy Documents |
| Level of Tax Credit for Research and Development | Various National Strategy Documents |
| Time Scale of National AI Strategy | Various National Strategy Documents |
| Government has ‘Dedicated AI Minister’ | Various National Strategy Documents |
| Dedicated Spending on Artificial Intelligence by Year since Release | Various National Strategy Documents |
Appendix G. The Commercial Indicators
| Indicator | Source |
|---|---|
| Number of ‘AI Unicorns’ | Crunchbase |
| Number of ‘AI Companies’ | Crunchbase |
| Total Funding of ‘AI Companies’ | Crunchbase |
| Total Funding to ‘AI Startups’ | Crunchbase |
| Total Number of ‘AI Startups’ | Crunchbase |
| Number of business articles on ‘artificial intelligence’ | Reuters |
| Proportion of Total Number of ‘AI Companies’ | Crunchbase |
| Proportion of Total Funding of ‘AI Companies’ | Crunchbase |
| Proportion of Total Number of ‘AI Startups’ | Crunchbase |
| Number of ‘AI Companies’ per capita | Crunchbase |
| Average Funding of ‘AI Company’ | Crunchbase |
| Total Funding of ‘AI Companies’ Proportional to GDP | Crunchbase |
| Proportion of Total Number of Listed ‘AI Companies’ | Crunchbase |
| Average Funding to ‘AI Startups’ | Crunchbase |
| Number of ‘AI Startups’ per capita | Crunchbase |
| Number of Publicly Traded ‘AI Companies’ | Crunchbase |
| Number of Listed ‘AI Companies’ | Crunchbase |
References
- Turing, A.M.; Haugeland, J. Computing machinery and intelligence. In The Turing Test: Verbal Behavior as the Hallmark of Intelligence; Bradford Books: London, England, 1950; pp. 29–56. [Google Scholar]
- Turing, A.M. Computing Machinery and Intelligence. Mind 1950, 59, 433–460. [Google Scholar] [CrossRef]
- McCarthy, J.; Hayes, P.J. Some philosophical problems from the standpoint of artificial intelligence. In Readings in Artificial Intelligence; Elsevier: Amsterdam, The Netherlands, 1981; pp. 431–450. [Google Scholar]
- Hunt, E.B. Artificial Intelligence; Academic Press: Cambridge, MA, USA, 2014. [Google Scholar]
- McCarthy, J. What Is Artificial Intelligence? 2007. Available online: https://www.researchgate.net/publication/28762490_What_is_Artificial_Intelligence (accessed on 13 February 2022).
- Wang, W.; Siau, K. Artificial intelligence, machine learning, automation, robotics, future of work and future of humanity: A review and research agenda. J. Database Manag. JDM 2019, 30, 61–79. [Google Scholar] [CrossRef]
- Haenlein, M.; Kaplan, A. A brief history of artificial intelligence: On the past, present, and future of artificial intelligence. Calif. Manag. Rev. 2019, 61, 5–14. [Google Scholar] [CrossRef]
- Davenport, T.H. The AI Advantage: How to Put the Artificial Intelligence Revolution to Work; MIT Press: Cambridge, MA, USA, 2018. [Google Scholar]
- Mou, X. Artificial intelligence: Investment trends and selected industry uses. Int. Financ. Corp. 2019, 8. Available online: http://documents1.worldbank.org/curated/en/617511573040599056/pdf/Artificial-Intelligence-Investment-Trends-and-Selected-Industry-Uses.pdf (accessed on 4 January 2023).
- Foresti, R.; Rossi, S.; Magnani, M.; Bianco, C.G.L.; Delmonte, N. Smart society and artificial intelligence: Big data scheduling and the global standard method applied to smart maintenance. Engineering 2020, 6, 835–846. [Google Scholar] [CrossRef]
- Wang, R. Legal technology in contemporary USA and China. Comput. Law Secur. Rev. 2020, 39, 105459. [Google Scholar] [CrossRef]
- Dabass, J.; Dabass, B.S. Scope of Artificial Intelligence in Law. 2018. Available online: https://legaldesire.com/scope-of-artificial-intelligence-in-law/ (accessed on 4 May 2022).
- Kufakwababa, C.Z. Artificial intelligence tools in legal work automation: The use and perception of tools for document discovery and privilege classification processes in Southern African legal firms. Ph.D. Thesis, Stellenbosch University, Stellenbosch, South Africa, 2021. [Google Scholar]
- Davis, Z. Artificial intelligence on the battlefield. Prism 2019, 8, 114–131. [Google Scholar]
- Horowitz, M.C.; Allen, G.C.; Kania, E.B.; Scharre, P. Strategic Competition in an Era of Artificial Intelligence; Center for a New American Security: Washington, DC, USA, 2018. [Google Scholar]
- Wang, Y.; Chen, D. Rising sino-US competition in artificial intelligence. China Q. Int. Strateg. Stud. 2018, 4, 241–258. [Google Scholar] [CrossRef]
- Sinha, S. Technology: A Path Towards A More Collaborative World Order? Fletcher F. World Aff. 2021, 45, 5. [Google Scholar]
- Deshevykh, N.; Yudaev, V. Prospects of the Development of Artificial Intelligence in the World Arena. Contemp. Probl. Soc. Work. 2020, 6, 58–64. [Google Scholar] [CrossRef]
- Allen, G.C. Understanding China’s AI Strategy: Clues to Chinese Strategic Thinking on Artificial Intelligence and National Security. 2019. Available online: http://www.globalhha.com/doclib/data/upload/doc_con/5e50c522eeb91.pdf (accessed on 25 November 2021).
- Goralski, M.A.; Tan, T.K. Artificial intelligence and sustainable development. Int. J. Manag. Educ. 2020, 18, 100330. [Google Scholar] [CrossRef]
- Uchegbu, I.; Rodriguez-Guadarrama, Y.; Rua, T.; Kartha, M.R.; Abdulkareem, M.; Petersen, S.E. Health Economics, Economic Evaluation and Artificial Intelligence Technology. In Artificial Intelligence in Cardiothoracic Imaging; Springer: Berlin/Heidelberg, Germany, 2022; pp. 535–547. [Google Scholar]
- Barton, D.; Woetzel, J.; Seong, J.; Tian, Q. Artificial Intelligence: Implications for China. 2017. Available online: https://www.mckinsey.com/~/media/McKinsey/Featured%20Insights/China/Artificial%20intelligence%20Implications%20for%20China/MGI-Artificial-intelligence-implications-for-China.pdf (accessed on 25 October 2022).
- Feijóo, C.; Kwon, Y.; Bauer, J.M.; Bohlin, E.; Howell, B.; Jain, R.; Potgieter, P.; Vu, K.; Whalley, J.; Xia, J. Harnessing artificial intelligence (AI) to increase wellbeing for all: The case for a new technology diplomacy. Telecommun. Policy 2020, 44, 101988. [Google Scholar] [CrossRef]
- Brattberg, E.; Rugova, V.; Csernatoni, R. Europe and AI: Leading, Lagging Behind, or Carving Its Own Way? Carnegie Endowment for International Peace: Washington, DC, USA, 2020; Volume 9. [Google Scholar]
- Nouveau, P. Falling behind and in between the United States and China: Can the European Union drive its digital transformation away from industrial path dependency? In EU Industrial Policy in the Multipolar Economy; Edward Elgar Publishing: Cheltenham, UK, 2022; pp. 332–381. [Google Scholar]
- Intelligence, T. The Global AI Index. Available online: https://www.tortoisemedia.com/intelligence/global-ai/ (accessed on 15 February 2022).
- Mehta, N.; Shukla, S. Pandemic analytics: How countries are leveraging big data analytics and artificial intelligence to fight COVID-19? SN Comput. Sci. 2022, 3, 1–20. [Google Scholar] [CrossRef]
- Samuel, S.; Hameed, V.A.; Rajadorai, K.P. Application of Artificial Intelligence (AI) for the Effective Screening of COVID-19. In Impact of AI and Data Science in Response to Coronavirus Pandemic; Springer: Berlin/Heidelberg, Germany, 2021; pp. 53–70. [Google Scholar]
- Behzadian, M.; Kazemzadeh, R.B.; Albadvi, A.; Aghdasi, M. Promethee: A comprehensive literature review on methodologies and applications. Eur. J. Oper. Res. 2010, 200, 198–215. [Google Scholar] [CrossRef]
- Kshetri, N. Artificial intelligence in developing countries. IT Prof. 2020, 22, 63–68. [Google Scholar] [CrossRef]
- Guo, J.; Li, B. The application of medical artificial intelligence technology in rural areas of developing countries. Health Equity 2018, 2, 174–181. [Google Scholar] [CrossRef] [Green Version]
- Fujii, H.; Managi, S. Trends and priority shifts in artificial intelligence technology invention: A global patent analysis. Econ. Anal. Policy 2018, 58, 60–69. [Google Scholar] [CrossRef] [Green Version]
- Ernst, E.; Merola, R.; Samaan, D. Economics of artificial intelligence: Implications for the future of work. IZA J. Labor Policy 2019, 9. [Google Scholar] [CrossRef] [Green Version]
- Nguyen, T.M.H.; Nguyen, V.; Nguyen, D. A new hybrid Pythagorean fuzzy AHP and COCOSO MCDM based approach by adopting artificial intelligence technologies. J. Exp. Theor. Artif. Intell. 2022, 1–27. [Google Scholar] [CrossRef]
- Nasrollahi, S.; Kazemi, A.; Jahangir, M.-H.; Aryaee, S. Selecting suitable wave energy technology for sustainable development, an MCDM approach. Renew. Energy 2023, 202, 756–772. [Google Scholar] [CrossRef]
- Özkaya, G. Energy Consumption Trends before and during the COVID-19 Pandemic: An Entropy-Based PROMETHEE Analysis. Curr. Res. Soc. Sci. 2022, 8, 1–28. [Google Scholar] [CrossRef]
- Grybaitė, V.; Stankevičienė, J.; Lapinskienė, G.; Podvezko, A. Comparison of the environment of EU countries for sharing economy state by modern multiple criteria methods. Amfiteatru Econ. 2022, 24, 194–213. [Google Scholar] [CrossRef]
- Wang, C.-N.; Dang, T.-T.; Tibo, H.; Duong, D.-H. Assessing renewable energy production capabilities using DEA window and fuzzy TOPSIS model. Symmetry 2021, 13, 334. [Google Scholar] [CrossRef]
- Erdin, C.; Ozkaya, G. R&D investments and quality of life in Turkey. Heliyon 2020, 6, e04006. [Google Scholar]
- Erdin, C.; Ozkaya, G. The performance evaluation of the ASEAN countries and Turkey in the sustainable development index framework with the TOPSIS method. Yildiz Soc. Sci. Inst. J 2017, 1, 150–163. [Google Scholar]
- Tolga, G. PROMETHEE yöntemi ve GAIA düzlemi. Afyon Kocatepe Üniversitesi İktisadi İdari Bilim. Fakültesi Derg. 2013, 15, 133–154. [Google Scholar]
- Mareschal, B.; Brans, J.P.; Vincke, P. PROMETHEE: A New Family of Outranking Methods in Multicriteria Analysis; ULB—Universite Libre de Bruxelles: Bruxelles, Belgium, 1984. [Google Scholar]
- Mareschal, B.; Brans, J.-P. Geometrical representations for MCDA. Eur. J. Oper. Res. 1988, 34, 69–77. [Google Scholar] [CrossRef]
- Brans, J.-P.; Vincke, P. Note—A Preference Ranking Organisation Method: (The PROMETHEE Method for Multiple Criteria Decision-Making). Manag. Sci. 1985, 31, 647–656. [Google Scholar] [CrossRef] [Green Version]
- Dağdeviren, M.; Erarslan, E. PROMETHEE siralama yöntemi ile tedarikçi seçimi. Gazi Üniversitesi Mühendislik-Mimar. Fakültesi Derg. 2008, 23, 69–75. [Google Scholar]
- Ishizaka, A.; Nemery, P. Selecting the best statistical distribution with PROMETHEE and GAIA. Comput. Ind. Eng. 2011, 61, 958–969. [Google Scholar] [CrossRef] [Green Version]
Figure 1.
Generalized framework for MCDM process [38].
Figure 1.
Generalized framework for MCDM process [38].

Figure 2.
The weights of dimensions.

Figure 3.
PROMETHEE Diamond.

Figure 4.
PROMETHEE Network.

Figure 5.
GAIA graphic.

Figure 6.
PROMETHEE Rainbow (Advantages and Disadvantages Indicators).

Table 1.
Amount of studies using the PROMETHEE approach, broken down by field [29].
Table 1.
Amount of studies using the PROMETHEE approach, broken down by field [29].
| Fields of PROMETHEE Application | N | % | Fields of PROMETHEE Application | N | % |
|---|---|---|---|---|---|
| Environmental Management | 47 | 24.1 | Energy Management | 17 | 8.7 |
| Business and Financial Management | 25 | 12.8 | Manufacturing and Assembly | 19 | 9.7 |
| Hydrology and Water Management | 28 | 14.4 | Social | 7 | 3.6 |
| Chemistry | 24 | 12.3 | Other Topics | 9 | 4.6 |
| Logistics and Transportation | 19 | 9.7 | Total | 195 | 100 |
Table 2.
The weighting coefficients determined by Tortoise Global.
| Pillars | Weighting Coefficients |
|---|---|
| Talent | 5 |
| Infrastructure | 3 |
| Operating Environment | 2 |
| Research | 5 |
| Development | 3 |
| Government strategy | 1 |
Table 3.
Countries and indicator values included in the study.
| Country | Talent Score | Infrastructure Score | Operating Score | Research Score | Development Score | Government Score | Commercial Score |
|---|---|---|---|---|---|---|---|
| Argentina | 8.4 | 56.15 | 75.95 | 1.25 | 3.19 | 54.94 | 0.34 |
| Armenia | 6.69 | 37.84 | 58.4 | 0.28 | 0.33 | 14.4 | 1.37 |
| Australia | 25.43 | 63.43 | 61.23 | 32.63 | 41.15 | 82.11 | 6.72 |
| Austria | 16.97 | 64.49 | 76.3 | 23.56 | 17.81 | 72.14 | 3.08 |
| Bahrain | 4.99 | 60.39 | 60.9 | 2.53 | 0 | 17.72 | 0.24 |
| Belgium | 15.17 | 65.1 | 64.08 | 22.15 | 19.81 | 63.58 | 5.31 |
| Brazil | 13.46 | 62.61 | 72.82 | 4.83 | 5.07 | 67.72 | 1.36 |
| Canada | 31.28 | 77.05 | 93.94 | 30.67 | 25.78 | 100 | 14.88 |
| Chile | 10.56 | 61.97 | 56.73 | 1.49 | 0.67 | 60.5 | 2.95 |
| China | 16.51 | 100 | 91.57 | 71.42 | 79.97 | 94.87 | 44.02 |
| Colombia | 4.97 | 54.8 | 62.37 | 0 | 0.89 | 85.29 | 0.5 |
| Czech Republic | 11.11 | 64.26 | 76.97 | 11.26 | 2.7 | 70.29 | 1.75 |
| Denmark | 27.07 | 74.08 | 85.39 | 26.01 | 8.92 | 74.23 | 3.46 |
| Egypt | 1.11 | 38.84 | 0 | 2.08 | 1.54 | 68.72 | 0.31 |
| Estonia | 18.74 | 63.65 | 88.67 | 11.75 | 9.31 | 72.08 | 12.51 |
| Finland | 24.99 | 71.6 | 78.76 | 25.21 | 18.32 | 85.99 | 4.64 |
| France | 28.32 | 77.15 | 80.02 | 25.48 | 21.44 | 91.2 | 7.65 |
| Germany | 27.63 | 77.22 | 70.22 | 35.84 | 24.79 | 84.65 | 8.29 |
| Greece | 7.62 | 55.44 | 83.58 | 15.12 | 2.21 | 22.15 | 0.92 |
| Hong Kong | 17.56 | 96.11 | 59.5 | 31.51 | 8.63 | 33.29 | 5.3 |
| Hungary | 10.34 | 69.17 | 58.01 | 4.31 | 5.4 | 55.01 | 1.08 |
| Iceland | 18.45 | 72.45 | 41.19 | 18.29 | 0.19 | 22.15 | 5.74 |
| India | 45.27 | 33.91 | 77.3 | 18.92 | 30.86 | 58.83 | 7.39 |
| Indonesia | 5.51 | 47.52 | 51.18 | 0.98 | 3.52 | 59.99 | 0.91 |
| Ireland | 29.93 | 89.5 | 70.15 | 16.79 | 30.85 | 69.44 | 3.94 |
| Israel | 35.76 | 67.58 | 82.44 | 32.63 | 27.96 | 43.91 | 27.33 |
| Italy | 11.09 | 64.76 | 83.25 | 20.3 | 14.66 | 61.43 | 2.64 |
| Japan | 15.18 | 84.58 | 57.53 | 22.51 | 34.47 | 71.96 | 7.31 |
| Kenya | 0.75 | 14.11 | 29.84 | 0.07 | 12.15 | 7.75 | 0.31 |
| Lithuania | 14.3 | 63.19 | 80.67 | 3.22 | 6.18 | 64.28 | 1.77 |
| Luxembourg | 21.66 | 94.88 | 66.96 | 19.39 | 19.95 | 66.69 | 4.68 |
| Malaysia | 10.44 | 62.04 | 73.24 | 5.57 | 0.88 | 47.6 | 0.63 |
| Malta | 15.87 | 67.12 | 70.96 | 5.96 | 11.72 | 70.49 | 4.3 |
| Mexico | 1.72 | 41.85 | 97.03 | 8.11 | 4.46 | 54.21 | 0.78 |
| Morocco | 3.36 | 44.88 | 60.17 | 1.46 | 0.05 | 15.9 | 0.1 |
| New Zealand | 23.3 | 69.78 | 90.35 | 12.23 | 5.96 | 47.62 | 2.49 |
| Nigeria | 2.74 | 0 | 50.1 | 0.45 | 2.06 | 7.75 | 0.33 |
| Norway | 27.61 | 76.2 | 36.65 | 21.18 | 13.56 | 59.05 | 3.95 |
| Pakistan | 8 | 2.43 | 12.48 | 2.17 | 1.09 | 13.92 | 0.27 |
| Poland | 14.21 | 70.96 | 99.56 | 10.6 | 9.09 | 78.14 | 2.25 |
| Portugal | 13.43 | 64.2 | 80.66 | 8.96 | 3.92 | 70.69 | 2.05 |
| Qatar | 0 | 67.97 | 62.58 | 11.94 | 0 | 33.49 | 0 |
| Russia | 12.46 | 62.59 | 52.85 | 14.21 | 19.48 | 90.4 | 1.38 |
| Saudi Arabia | 4.49 | 70.8 | 100 | 13.63 | 14.38 | 91.63 | 4.73 |
| Singapore | 39.38 | 84.3 | 43.15 | 37.67 | 22.55 | 79.82 | 15.07 |
| Slovakia | 8.55 | 65.36 | 88.71 | 2.97 | 0.34 | 43.07 | 0.67 |
| Slovenia | 13.02 | 72.06 | 94.55 | 19.1 | 1.06 | 80.38 | 0.61 |
| South Africa | 4.61 | 45.73 | 58.43 | 0.83 | 7.52 | 0 | 2.03 |
| South Korea | 14.54 | 85.23 | 68.86 | 26.66 | 77.25 | 87.5 | 5.41 |
| Spain | 17.61 | 73.32 | 75.36 | 18.6 | 10.87 | 91.28 | 3.08 |
| Sri Lanka | 6.27 | 34.64 | 35.79 | 0.12 | 0.95 | 35.57 | 0.09 |
| Sweden | 28.21 | 75.19 | 66.77 | 27.61 | 17.81 | 40.35 | 4.51 |
| Switzerland | 25.63 | 78.43 | 44.14 | 38.24 | 23.11 | 12.18 | 7.76 |
| Taiwan | 12.34 | 77.86 | 56.67 | 25.71 | 19.99 | 55.97 | 2.53 |
| The Netherlands | 33.83 | 81.99 | 88.05 | 25.54 | 30.17 | 62.35 | 4.97 |
| Tunisia | 8.94 | 38.59 | 62.32 | 3.9 | 0 | 12.18 | 0.15 |
| Turkey | 8.49 | 40.74 | 64.34 | 9.53 | 1.02 | 67.45 | 0.95 |
| U.A.E. | 2.65 | 79.16 | 72.12 | 5.13 | 15.53 | 81.38 | 3.22 |
| United Kingdom | 39.65 | 71.43 | 74.65 | 36.5 | 25.03 | 82.82 | 18.91 |
| U.S.A. | 100 | 94.02 | 64.56 | 100 | 100 | 77.39 | 100 |
| Uruguay | 7.28 | 58.77 | 70.75 | 0.73 | 0.26 | 30.92 | 0.43 |
| Vietnam | 6.34 | 55.76 | 37.61 | 2.03 | 0.3 | 68.86 | 0.31 |
Table 4.
Normalized Decision Matrix.
| max/min | max | max | max | max | max | Max | max |
| Weights | 0.2083 | 0.125 | 0.0833 | 0.2083 | 0.125 | 0.0417 | 0.2083 |
| Country | Talent | Infrastructure | Operating Environment | Research | Development | Government Strategy | Commercial Enterprises |
| Argentina | 0.084 | 0.5615 | 0.7595 | 0.0125 | 0.0319 | 0.5494 | 0.0034 |
| Armenia | 0.0669 | 0.3784 | 0.584 | 0.0028 | 0.0033 | 0.144 | 0.0137 |
| Australia | 0.2543 | 0.6343 | 0.6123 | 0.3263 | 0.4115 | 0.8211 | 0.0672 |
| Austria | 0.1697 | 0.6449 | 0.763 | 0.2356 | 0.1781 | 0.7214 | 0.0308 |
| Bahrain | 0.0499 | 0.6039 | 0.609 | 0.0253 | 0 | 0.1772 | 0.0024 |
| Belgium | 0.1517 | 0.651 | 0.6408 | 0.2215 | 0.1981 | 0.6358 | 0.0531 |
| Brazil | 0.1346 | 0.6261 | 0.7282 | 0.0483 | 0.0507 | 0.6772 | 0.0136 |
| Canada | 0.3128 | 0.7705 | 0.9394 | 0.3067 | 0.2578 | 1 | 0.1488 |
| Chile | 0.1056 | 0.6197 | 0.5673 | 0.0149 | 0.0067 | 0.605 | 0.0295 |
| China | 0.1651 | 1 | 0.9157 | 0.7142 | 0.7997 | 0.9487 | 0.4402 |
| Colombia | 0.0497 | 0.548 | 0.6237 | 0 | 0.0089 | 0.8529 | 0.005 |
| Czech Republic | 0.1111 | 0.6426 | 0.7697 | 0.1126 | 0.027 | 0.7029 | 0.0175 |
| Denmark | 0.2707 | 0.7408 | 0.8539 | 0.2601 | 0.0892 | 0.7423 | 0.0346 |
| Egypt | 0.0111 | 0.3884 | 0 | 0.0208 | 0.0154 | 0.6872 | 0.0031 |
| Estonia | 0.1874 | 0.6365 | 0.8867 | 0.1175 | 0.0931 | 0.7208 | 0.1251 |
| Finland | 0.2499 | 0.716 | 0.7876 | 0.2521 | 0.1832 | 0.8599 | 0.0464 |
| France | 0.2832 | 0.7715 | 0.8002 | 0.2548 | 0.2144 | 0.912 | 0.0765 |
| Germany | 0.2763 | 0.7722 | 0.7022 | 0.3584 | 0.2479 | 0.8465 | 0.0829 |
| Greece | 0.0762 | 0.5544 | 0.8358 | 0.1512 | 0.0221 | 0.2215 | 0.0092 |
| The Netherlands | 0.3383 | 0.8199 | 0.8805 | 0.2554 | 0.3017 | 0.6235 | 0.0497 |
| Hong Kong | 0.1756 | 0.9611 | 0.595 | 0.3151 | 0.0863 | 0.3329 | 0.053 |
| Hungary | 0.1034 | 0.6917 | 0.5801 | 0.0431 | 0.054 | 0.5501 | 0.0108 |
| Iceland | 0.1845 | 0.7245 | 0.4119 | 0.1829 | 0.0019 | 0.2215 | 0.0574 |
| India | 0.4527 | 0.3391 | 0.773 | 0.1892 | 0.3086 | 0.5883 | 0.0739 |
| Indonesia | 0.0551 | 0.4752 | 0.5118 | 0.0098 | 0.0352 | 0.5999 | 0.0091 |
| Ireland | 0.2993 | 0.895 | 0.7015 | 0.1679 | 0.3085 | 0.6944 | 0.0394 |
| Israel | 0.3576 | 0.6758 | 0.8244 | 0.3263 | 0.2796 | 0.4391 | 0.2733 |
| Italy | 0.1109 | 0.6476 | 0.8325 | 0.203 | 0.1466 | 0.6143 | 0.0264 |
| Japan | 0.1518 | 0.8458 | 0.5753 | 0.2251 | 0.3447 | 0.7196 | 0.0731 |
| Kenya | 0.0075 | 0.1411 | 0.2984 | 0.0007 | 0.1215 | 0.0775 | 0.0031 |
| Lithuania | 0.143 | 0.6319 | 0.8067 | 0.0322 | 0.0618 | 0.6428 | 0.0177 |
| Luxembourg | 0.2166 | 0.9488 | 0.6696 | 0.1939 | 0.1995 | 0.6669 | 0.0468 |
| Malaysia | 0.1044 | 0.6204 | 0.7324 | 0.0557 | 0.0088 | 0.476 | 0.0063 |
| Malta | 0.1587 | 0.6712 | 0.7096 | 0.0596 | 0.1172 | 0.7049 | 0.043 |
| Mexico | 0.0172 | 0.4185 | 0.9703 | 0.0811 | 0.0446 | 0.5421 | 0.0078 |
| Morocco | 0.0336 | 0.4488 | 0.6017 | 0.0146 | 0.0005 | 0.159 | 0.001 |
| New Zealand | 0.233 | 0.6978 | 0.9035 | 0.1223 | 0.0596 | 0.4762 | 0.0249 |
| Nigeria | 0.0274 | 0 | 0.501 | 0.0045 | 0.0206 | 0.0775 | 0.0033 |
| Norway | 0.2761 | 0.762 | 0.3665 | 0.2118 | 0.1356 | 0.5905 | 0.0395 |
| Pakistan | 0.08 | 0.0243 | 0.1248 | 0.0217 | 0.0109 | 0.1392 | 0.0027 |
| Poland | 0.1421 | 0.7096 | 0.9956 | 0.106 | 0.0909 | 0.7814 | 0.0225 |
| Portugal | 0.1343 | 0.642 | 0.8066 | 0.0896 | 0.0392 | 0.7069 | 0.0205 |
| Qatar | 0 | 0.6797 | 0.6258 | 0.1194 | 0 | 0.3349 | 0 |
| Russia | 0.1246 | 0.6259 | 0.5285 | 0.1421 | 0.1948 | 0.904 | 0.0138 |
| Saudi Arabia | 0.0449 | 0.708 | 1 | 0.1363 | 0.1438 | 0.9163 | 0.0473 |
| Singapore | 0.3938 | 0.843 | 0.4315 | 0.3767 | 0.2255 | 0.7982 | 0.1507 |
| Slovakia | 0.0855 | 0.6536 | 0.8871 | 0.0297 | 0.0034 | 0.4307 | 0.0067 |
| Slovenia | 0.1302 | 0.7206 | 0.9455 | 0.191 | 0.0106 | 0.8038 | 0.0061 |
| South Africa | 0.0461 | 0.4573 | 0.5843 | 0.0083 | 0.0752 | 0 | 0.0203 |
| South Korea | 0.1454 | 0.8523 | 0.6886 | 0.2666 | 0.7725 | 0.875 | 0.0541 |
| Spain | 0.1761 | 0.7332 | 0.7536 | 0.186 | 0.1087 | 0.9128 | 0.0308 |
| Sri Lanka | 0.0627 | 0.3464 | 0.3579 | 0.0012 | 0.0095 | 0.3557 | 0.0009 |
| Sweden | 0.2821 | 0.7519 | 0.6677 | 0.2761 | 0.1781 | 0.4035 | 0.0451 |
| Switzerland | 0.2563 | 0.7843 | 0.4414 | 0.3824 | 0.2311 | 0.1218 | 0.0776 |
| Taiwan | 0.1234 | 0.7786 | 0.5667 | 0.2571 | 0.1999 | 0.5597 | 0.0253 |
| Tunisia | 0.0894 | 0.3859 | 0.6232 | 0.039 | 0 | 0.1218 | 0.0015 |
| Turkey | 0.0849 | 0.4074 | 0.6434 | 0.0953 | 0.0102 | 0.6745 | 0.0095 |
| U.A. Emirates | 0.0265 | 0.7916 | 0.7212 | 0.0513 | 0.1553 | 0.8138 | 0.0322 |
| U.K. | 0.3965 | 0.7143 | 0.7465 | 0.365 | 0.2503 | 0.8282 | 0.1891 |
| U.S.A. | 0.0728 | 0.5877 | 0.7075 | 0.0073 | 0.0026 | 0.3092 | 0.0043 |
| Uruguay | 1 | 0.9402 | 0.6456 | 1 | 1 | 0.7739 | 1 |
| Vietnam | 0.0634 | 0.5576 | 0.3761 | 0.0203 | 0.003 | 0.6886 | 0.0031 |
Table 5.
PROMETHEE II Flow Values.
| Rank | Action | Phi | Phi+ | Phi− | Rank | Action | Phi | Phi+ | Phi− |
|---|---|---|---|---|---|---|---|---|---|
| 1 | USA | 0.8415 | 0.9208 | 0.0792 | 32 | Italy | −0.0218 | 0.4891 | 0.5109 |
| 2 | U. Kingdom | 0.7869 | 0.8934 | 0.1066 | 33 | U.A.E. | −0.026 | 0.487 | 0.513 |
| 3 | China | 0.7609 | 0.8805 | 0.1195 | 34 | Malta | −0.0355 | 0.4823 | 0.5177 |
| 4 | Israel | 0.7118 | 0.8559 | 0.1441 | 35 | Iceland | −0.0765 | 0.4617 | 0.5383 |
| 5 | Canada | 0.7042 | 0.8504 | 0.1462 | 36 | Portugal | −0.0806 | 0.4515 | 0.5321 |
| 6 | Netherlands | 0.6899 | 0.845 | 0.155 | 36 | Czech R. | −0.0806 | 0.4515 | 0.5321 |
| 7 | S. Korea | 0.6598 | 0.8299 | 0.1701 | 38 | Lithuania | −0.1489 | 0.4255 | 0.5745 |
| 8 | Germany | 0.6503 | 0.8251 | 0.1749 | 39 | Brazil | −0.2296 | 0.3852 | 0.6148 |
| 9 | Singapore | 0.5629 | 0.7814 | 0.2186 | 40 | Slovakia | −0.2404 | 0.3798 | 0.6202 |
| 10 | India | 0.5594 | 0.7794 | 0.22 | 41 | Greece | −0.3074 | 0.3463 | 0.6537 |
| 11 | France | 0.5185 | 0.7575 | 0.2391 | 42 | Hungary | −0.3334 | 0.3333 | 0.6667 |
| 12 | Australia | 0.4877 | 0.7439 | 0.2561 | 43 | Mexico | −0.3374 | 0.3313 | 0.6687 |
| 13 | Luxembourg | 0.4713 | 0.7357 | 0.2643 | 44 | Qatar | −0.3429 | 0.3286 | 0.6714 |
| 14 | Ireland | 0.4713 | 0.7357 | 0.2643 | 45 | Malaysia | −0.3716 | 0.3142 | 0.6858 |
| 15 | Switzerland | 0.4569 | 0.7274 | 0.2705 | 46 | Chile | −0.4563 | 0.2719 | 0.7281 |
| 16 | Finland | 0.4549 | 0.7275 | 0.2725 | 47 | Tunisia | −0.4911 | 0.2541 | 0.7452 |
| 17 | Denmark | 0.4317 | 0.7159 | 0.2841 | 48 | Vietnam | −0.541 | 0.2295 | 0.7705 |
| 18 | Japan | 0.4317 | 0.7158 | 0.2842 | 49 | Argentina | −0.5533 | 0.2213 | 0.7746 |
| 19 | Sweden | 0.4112 | 0.7056 | 0.2944 | 50 | Colombia | −0.5847 | 0.2076 | 0.7924 |
| 20 | Austria | 0.3333 | 0.6667 | 0.3333 | 51 | Indonesia | −0.6073 | 0.194 | 0.8012 |
| 21 | Taiwan | 0.3006 | 0.6503 | 0.3497 | 52 | Turkey | −0.6086 | 0.194 | 0.8026 |
| 22 | S. Arabia | 0.2992 | 0.6496 | 0.3504 | 53 | Morocco | −0.6134 | 0.1933 | 0.8067 |
| 23 | Spain | 0.2924 | 0.6434 | 0.3511 | 54 | Bahrain | −0.6256 | 0.1838 | 0.8094 |
| 24 | Hong Kong | 0.2917 | 0.6441 | 0.3524 | 55 | Uruguay | −0.653 | 0.1714 | 0.8245 |
| 25 | Estonia | 0.2172 | 0.6086 | 0.3914 | 56 | Nigeria | −0.6708 | 0.1646 | 0.8354 |
| 26 | Slovenia | 0.1871 | 0.5936 | 0.4064 | 57 | Sri Lanka | −0.709 | 0.1414 | 0.8504 |
| 27 | Norway | 0.1435 | 0.5717 | 0.4283 | 58 | Pakistan | −0.7302 | 0.1311 | 0.8613 |
| 28 | Belgium | 0.1434 | 0.5717 | 0.4283 | 59 | S. Africa | −0.7637 | 0.1182 | 0.8818 |
| 29 | New Zealand | 0.1421 | 0.571 | 0.429 | 60 | Egypt | −0.7671 | 0.1127 | 0.8798 |
| 30 | Russia | 0.1312 | 0.5656 | 0.4344 | 61 | Kenya | −0.7773 | 0.11 | 0.8873 |
| 31 | Poland | 0.0314 | 0.5157 | 0.4843 | 62 | Armenia | −0.791 | 0.1045 | 0.8955 |
Table 6.
Scores and Rankings According to PROMETHEE II Method Results.
| Rank | Country | Score | Rank | Country | Score |
|---|---|---|---|---|---|
| 1 | United States of America | 100 | 32 | Italy | 8.24 |
| 2 | United Kingdom | 72.15 | 33 | United Arab Emirates | 8.17 |
| 3 | China | 63.38 | 34 | Malta | 8.02 |
| 4 | Israel | 51.1 | 35 | Iceland | 7.38 |
| 5 | Canada | 49.57 | 36 | Portugal | 7.32 |
| 6 | The Netherlands | 46.89 | 37 | Czech Republic | 7.32 |
| 7 | South Korea | 41.98 | 38 | Lithuania | 6.37 |
| 8 | Germany | 40.6 | 39 | Brazil | 5.39 |
| 9 | Singapore | 30.76 | 40 | Slovakia | 5.27 |
| 10 | India | 30.45 | 41 | Greece | 4.56 |
| 11 | France | 27.13 | 42 | Hungary | 4.3 |
| 12 | Australia | 24.99 | 43 | Mexico | 4.26 |
| 13 | Ireland | 23.95 | 44 | Qatar | 4.21 |
| 14 | Luxembourg | 23.95 | 45 | Malaysia | 3.94 |
| 15 | Switzerland | 23.08 | 46 | Chile | 3.21 |
| 16 | Finland | 22.97 | 47 | Tunisia | 2.94 |
| 17 | Denmark | 21.68 | 48 | Vietnamese | 2.56 |
| 18 | Japan | 21.67 | 49 | Argentina | 2.47 |
| 19 | Sweden | 20.62 | 50 | Colombia | 2.25 |
| 20 | Austria | 17.21 | 51 | Indonesia | 2.1 |
| 21 | Taiwan | 16 | 52 | Turkey | 2.09 |
| 22 | Saudi Arabia | 15.95 | 53 | Morocco | 2.06 |
| 23 | Spain | 15.71 | 54 | Bahrain | 1.98 |
| 24 | Hong Kong | 15.69 | 55 | Uruguay | 1.81 |
| 25 | Estonia | 13.38 | 56 | Nigeria | 1.7 |
| 26 | Slovenia | 12.57 | 57 | Sri Lanka | 1.47 |
| 27 | Norway | 11.49 | 58 | Pakistan | 1.34 |
| 28 | Belgium | 11.49 | 59 | South Africa | 1.15 |
| 29 | New Zealand | 11.45 | 60 | Egypt | 1.13 |
| 30 | Russia | 11.2 | 61 | Kenya | 1.08 |
| 31 | Poland | 9.16 | 62 | Armenia | 1 |
Table 7.
Global Artificial Intelligence Index and PROMETHEE II Results.
| Country | Global AI Index | PROMETHEE II | Country | Global AI Index | PROMETHEE II |
|---|---|---|---|---|---|
| Germany | 36.04 | 40.6 | Japan | 30.53 | 21.67 |
| U.S.A. | 100 | 100 | Canada | 40.19 | 49.57 |
| Argentina | 15.24 | 2.47 | Qatar | 14.66 | 4.21 |
| Australia | 33.86 | 24.99 | Kenya | 2.3 | 1.08 |
| Austria | 26.89 | 17.21 | Colombia | 13.85 | 2.25 |
| Bahrain | 11.79 | 1.98 | Lithuania | 19.59 | 6.37 |
| Belgium | 25.52 | 11.49 | Luxembourg | 30.73 | 23.95 |
| U.A.E. | 21.17 | 8.17 | Hungary | 17 | 4.3 |
| U.K. | 40.93 | 72.15 | Malaysia | 16.66 | 3.94 |
| Brazil | 18.89 | 5.39 | Malta | 21.85 | 8.02 |
| Czech Rep. | 20.31 | 7.32 | Mexico | 15.48 | 4.26 |
| China | 62.92 | 63.38 | Egypt | 4.83 | 1.13 |
| Denmark | 30.87 | 21.68 | Nigeria | 1.38 | 1.7 |
| Indonesia | 11.47 | 2.1 | Norway | 25.77 | 11.49 |
| Armenia | 8.49 | 1 | Pakistan | 0 | 1.34 |
| Estonia | 26.6 | 13.38 | Poland | 25.2 | 9.16 |
| Morocco | 8.87 | 2.06 | Portugal | 20.89 | 7.32 |
| Finland | 31.36 | 22.97 | Russia | 21.99 | 11.2 |
| France | 34.42 | 27.13 | Chile | 15.33 | 3.21 |
| S. Africa | 9.71 | 1.15 | Singapore | 38.67 | 30.76 |
| S. Korea | 38.6 | 41.98 | Slovakia | 17.24 | 5.27 |
| India | 30.36 | 30.45 | Slovenia | 25.19 | 12.57 |
| The Netherlands | 36.35 | 46.89 | Sri Lanka | 6.62 | 1.47 |
| Hong Kong | 29.11 | 15.69 | Saudi Arabia | 25.6 | 15.95 |
| Ireland | 33.04 | 23.95 | Taiwan | 25.79 | 16 |
| Spain | 26.95 | 15.71 | Tunisia | 9.87 | 2.94 |
| Israel | 39.89 | 51.1 | Turkey | 14.39 | 2.09 |
| Sweden | 29.85 | 20.62 | Uruguay | 13.27 | 1.81 |
| Switzerland | 30.25 | 23.08 | Vietnam | 11.62 | 2.56 |
| Italy | 24.45 | 8.24 | New Zealand | 24.88 | 11.45 |
| Iceland | 19.81 | 7.38 | Greece | 17.33 | 4.56 |
Table 8.
Spearman Correlation Test Result.
| Correlations | ||||
|---|---|---|---|---|
| Global_AI_Index | PROMETHEE_II | |||
| Spearman’s rho | Global_AI_Index | Correlation Coefficient | 1000 | 0.989 ** |
| Sig. (2-tailed) | 0.000 | |||
| N | 62 | 62 | ||
| PROMETHEE_II | Correlation Coefficient | 0.989 ** | 1000 | |
| Sig. (2-tailed) | 0.000 | |||
| N | 62 | 62 | ||
**. Correlation is significant at the 0.01 level (2-tailed).
Disclaimer/Publisher’s Note: The statements, opinions and data contained in all publications are solely those of the individual author(s) and contributor(s) and not of MDPI and/or the editor(s). MDPI and/or the editor(s) disclaim responsibility for any injury to people or property resulting from any ideas, methods, instructions or products referred to in the content. |
© 2023 by the authors. Licensee MDPI, Basel, Switzerland. This article is an open access article distributed under the terms and conditions of the Creative Commons Attribution (CC BY) license (https://creativecommons.org/licenses/by/4.0/).
Share and Cite
MDPI and ACS Style
Ozkaya, G.; Demirhan, A. Analysis of Countries in Terms of Artificial Intelligence Technologies: PROMETHEE and GAIA Method Approach. Sustainability 2023, 15, 4604. https://doi.org/10.3390/su15054604
AMA Style
Ozkaya G, Demirhan A. Analysis of Countries in Terms of Artificial Intelligence Technologies: PROMETHEE and GAIA Method Approach. Sustainability. 2023; 15(5):4604. https://doi.org/10.3390/su15054604
Chicago/Turabian StyleOzkaya, Gokhan, and Ayse Demirhan. 2023. "Analysis of Countries in Terms of Artificial Intelligence Technologies: PROMETHEE and GAIA Method Approach" Sustainability 15, no. 5: 4604. https://doi.org/10.3390/su15054604
Note that from the first issue of 2016, this journal uses article numbers instead of page numbers. See further details here.