
Evaluation of Sustainable Development Policy of Sichuan Citrus Industry in China Based on DEA–Malmquist Index and DID Model
School of Management, Sichuan Agricultural University, Ya’an 625014, China
*
Author to whom correspondence should be addressed.
Sustainability 2023, 15(5), 4260; https://doi.org/10.3390/su15054260
Submission received: 19 January 2023
/
Revised: 21 February 2023
/
Accepted: 23 February 2023
/
Published: 27 February 2023
Abstract
:The citrus industry is an important fruit industry, with the widest cultivation area and the most crucial economic status in southern China. Evaluating the sustainable development of citrus industry is the basis for accurately grasping the food safety situation and scientifically formulating industrial development policies. This research aims to evaluate the sustainable development policies of citrus industry in 20 citrus-growing cities and states in Sichuan province in China from two dimensions of efficiency and effect. To this end, this study develops a DEA–Malmquist index and DID model using city and state panel data from 2009–2020. The results have the following implications: (1) The low technical efficiency and technological progress index together cause the general inefficiency of citrus production in Sichuan cities and states, and the improper scale of inputs is the main reason for the low technical efficiency. (2) The implementation of sustainable development policies has increased citrus total factor productivity and widened the gap between cities and states in Sichuan. (3) Excessive production factors and financial inputs have hindered the sustainable development of the Sichuan citrus industry.
1. Introduction
Sustainable development of the agricultural industry is the foundation for China to achieve the goal of building an “Agricultural powerhouse”. China is the world’s largest producer of citrus, which is the number 1 fruit in China (according to the China Statistical Yearbook (2022), China’s citrus output was 55.9561 million tons, and the planting area was 2935.30 thousand hectares in 2021, accounting for 18.67% and 22.65% of the national fruit output and planting area, respectively, ranking the first in the national fruit output and planting area. This value is equivalent to 8.19% of the total annual grain output and 1.74% of the planting area). In some central and western areas, poverty alleviation mainly relies on horticultural crops represented by citrus, economic benefits, and ecological benefits such as prevention of soil erosion. Sichuan is the largest late-ripening citrus-producing area in inland China. In Sichuan, citrus industry is the first major fruit industry, included in Sichuan modern agriculture, a “10+3” industrial system focusing on supporting the ten advantageous characteristic industries. “Sichuan late-ripening citrus industry cluster” is one of the first 50 advantageous and characteristic industrial clusters in China. Since 2016, Sichuan has comprehensively reformed the citrus industry according to the concept of “sustainable development” to improve the comprehensive benefits of agriculture and the competitiveness of the industry. This reform promotes the development of citrus industry by relying on resource consumption, mainly to meet both the quantity demanded pursuing green, ecological, and sustainable development, and the needs for high-quality characteristics to achieve qualified products and industrial efficiency. This approach increases the orange farmers’ income level in case of achieving the industry’s sustainable development goals. However, the continuous expansion of citrus planting scale and improvement of output have decreased the citrus price and orange farmers’ income year by year and emerged the unsustainable phenomenon of occupying arable land to develop citrus planting [1]. In this environment, sustainable development faces new challenges in this industry.
China is one of the most controversial countries regarding sustainable development issues due to its rapid economic growth and the concomitant environmental issues. First, despite including the implementation of sustainable development policies in the local government performance assessment in November 2020, China has disregarded publishing unified evaluation criteria, causing different qualities of evaluations. Practically, China has ignored the basic requirements of public policy evaluation by simply considering the sustainable development evaluation as the sustainable development policy evaluation. In view of this, selecting the citrus industry in Sichuan is an appropriate approach for sustainable development policy evaluation. In this approach, the cost is an important index in the evaluation category, the least factor input maximizes the output value of citrus industry, and the input and output adjustment value is theoretically calculated based on the evaluation results. This technique provides further analysis of how to adjust the input factors to make the production reach the optimal state under the given output level. Also, the effectiveness of sustainable development policies is another factor needing an estimated measurement.
Based on this research gap, this paper aims to investigate whether sustainable development policies have improved the total factor productivity of citrus, and scientifically evaluates the net effect of sustainable development policies on the total factor productivity of specific agricultural industries. The results can help decision-makers further promote the sustainable development of citrus industry. To this end, this paper uses the panel data of Sichuan, China from 2009 to 2020 to expand the research idea of directly comparing the relevant data before and after the implementation of sustainable development policies. According to the two logical levels of efficiency and effect, efficiency evaluation is carried out using the data envelopment analysis (DEA)–Malmquist index model, the mainstream model measured by total factor productivity, and the targeted analysis of the relationship between input and output. The effect evaluation was carried out with the mainstream method of public policy evaluation, the difference-in-differences (DID) method, which reflected the causality relationship and the effect of implementing the industrial sustainable development policies. This method empirically tests the effectiveness of sustainable development policies on the improvement of the production efficiency of the Sichuan citrus industry, effectively stripping the superimposed effect of policies, and reducing the deviation of policy estimation. Figure 1 shows the evaluation process.
Compared with the existing literature, this paper may have the following marginal contributions: (1) Reflecting industrial and regional heterogeneity, the evaluation index system of sustainable development policy in the citrus industry constructed is more comprehensive and systematic, the selection of indicators pays more attention to green ecology, and the study of Sichuan as the geographical scope can comprehensively reflect the reality of China’s citrus industry. (2) The DEA–Malmquist model and DID model used in this study could effectively avoid subjective bias and improve the accuracy of testing the implementation effect of the sustainable development policy in the citrus industry. (3) This approach explores the sustainable development policy evaluation of citrus industry at two logical levels. The first level is efficiency evaluation, which focuses on the relationship between input and output to find the optimal allocation. The second level is effect evaluation, which emphasizes the changes in the process of policy implementation. These changes break through the previous limitations of mixed weighted scoring of indicators at different logical levels and form the total score according to the analytic hierarchy process. (4) This model quantitatively analyzes the adjustment of citrus production factors input to achieve sustainable development under the given output conditions. The DEA input analysis was carried out on the specific values that should be adjusted to achieve the optimal state in citrus production factors in each city and prefecture of Sichuan in 2020. This comparative analysis reveals the specific problems existing in citrus production in different regions, which enhances the scientific nature and pertinence of route suggestions.
The rest of this paper is structured as follows: Section 2 represents the literature review and research methods, including the literature review, the comparison and specification of the models. Then, Section 3 describes the evaluation indicators and data description, including the selection of indicators and data sources. Section 4 presents empirical research, focusing on the analysis of model results. Section 5 discusses the main findings of this research and compares them with those of previous studies. Section 5 also proposes the deficiencies of this research to introduce a direction for future research. Finally, Section 6 comprises the conclusion and policy recommendations.
2. Literature Review and Research Methods
2.1. Literature Review
2.1.1. Research on Sustainable Development Evaluation of Different Industries
Abundant academic studies exist on the evaluation of sustainable development. In 1972, the United Nations Conference on the Human Environment first proposed the concept of “sustainable development” [2]. Since then, international organizations and researchers have proposed various indicators, dimensions, and perspectives regarding sustainable development to pave the way for further analysis of this concept. For example, the United Nations introduced three pillars of social, environment, and economy for sustainable development in the Earth Charter in 1992. According to the triangular pillars, researchers defined three perspectives of weak, strong, and integrated sustainability. Weak sustainability provides equal value to each pillar while strong sustainability attaches the greatest importance to the environmental pillar [3]. In contrast, the perspective of integrated sustainability considers the spillover effects among the three pillars as the most effective and the fourth pillar [4]. Moreover, the United Nations introduced 8 Millennium Development Goals (MDGs) for the current millennium. Then, this organization designed 17 Sustainable Development Goals (SDGs) in 2015 as a platform for the progress of sustainable development by 2030 [5]. Furthermore, international organizations and scholars have added more and more sustainable development indicators such as the United Nations Sustainable Development Indicators [6], Agenda 21 Sustainable Development Indicators [7], Social Development Indicators from the World Bank [8], environmental and sustainability indicators [9], and OECD environmental indicators [10].
These indicators, pillars, and perspectives provide a practical reference for sustainable development evaluation in various fields using different methods. In recent years, researchers focused on sustainable development in different areas of the environment [11], energy [12,13], health [14], culture [15], and food security [16], as well as various industries including the food industry [17], financial industry [18,19], and manufacturing [20,21]. More specifically, many studies concentrated on “high-quality development”, as the fundamental way to achieve sustainable development at different levels of the province [22,23], city [24], and area [25].
Although numerous researchers have emphasized on various kinds of evaluation of the food industry [26,27,28], they have disregarded the policy evaluation of agricultural sustainable development, specifically the citrus industry, which has the most serious land competition concerning grain, cotton, and oil in China. Ineffective policy implementation causes unsustainable development of the citrus industry, which threatens food security, as well as the effective adjustment of the ratio of grain-to-cash crops against the realistic background that the potential development of cultivated land resources is approaching its limit.
2.1.2. Research on Public Policy Evaluation Methods
Choosing the correct, reasonable, and scientific evaluation method is an important supporting link of public policy evaluation. The evaluation of the sustainable development policy in the citrus industry should not only judge the implementation status of the policy, but also analyze the elements impacting the implementation and the effect of the policy, find out the main factors affecting the role of the policy, and put forward suggestions for adjusting and improving the policy based on the evaluation results. Table 1 shows typical evaluation methods involving different evaluation purposes such as the efficiency and effect of public policies in existing studies.
According to Table 1, previous studies have employed a wide variety of approaches to determine the weight of the evaluation index, including vertical and horizontal scaling methods, the entropy value method, analytic hierarchy process, and principal component analysis.
Among the methods, DEA is a quantitative analysis method that evaluates the relative effectiveness of decision-making units (DMUs) of the same type using a linear programming method based on multiple input and output indicators [29]. In recent years, researchers have widely used DEA for the evaluation of efficiency, specifically in energy [30,31,32], technology [33,34,35,36,37], ecology [38,39,40], and other fields. This method has many advantages. First, it needs no dimensionless data processing. Second, this method works without setting the index weight, using the actual data of input–output to obtain the optimal efficiency value, which can eliminate the influence of subjective factors. Third, DEA can quantitatively analyze the reasons and factors of non-DEA effectiveness, so as to provide more intuitive and effective information for the evaluator. Moreover, public policy evaluation has greatly utilized DEA method because of its advantage in efficiency evaluation [41,42,43,44,45]. However, DEA also has some limitations, mainly reflected in that the evaluation results are only valid and invalid; there may be a large number of effective decision units, making it is impossible to rank the effectiveness of all decision units; and the effectiveness or ineffectiveness are relative cases rather than absolute effectiveness or ineffectiveness. Therefore, the key to using DEA for policy evaluation lies in the design of reasonable evaluation indicators. Despite various applications of DEA, types of DEA three applications have received the most attention in recent years, which involve three-stage model [46], VCS, and CVS model [47]. Also, scholars use the DEA–Malmquist model to calculate the total factor productivity of citrus specifically in China, Hubei, and Chongqing.
DID is one of the main methods for evaluating the effect of economic policies, which mainly studies the changes in dependent variables before and after treatment. DID could effectively control the interaction effect between explained variables and explanatory variables, and control and eliminate the influence of unobserved individual heterogeneity on explained variables [48]. This technique evaluates the net impact of implementing a certain policy using a couple of statistical sample data groups. One group is the treatment group (experimental group), affected by the policy. The other group is a control group, not affected by the same policy. Then, an economic (or other) index evaluates the difference according to the time before and after implementing the policy. Both the groups of changes are obtained for the first time, eliminating the heterogeneity of individuals that does not change with time. The second difference eliminates the increment over time and gets the net effect of policy implementation.
Chen Lin (2015) [49] and Chen Qiang (2014) [50] showed that the differential model should meet the following basic conditions. First, each sample should have the same opportunity to receive the same experimental treatment, namely random grouping. Second, the randomness of the experiment time; that is, random events must be ensured. Third, the control group is not affected by the treatment. Fourth, the samples of the experimental and control groups are statistically homogeneous individuals; that is, homogeneity. Fifth, the policy impact on experimental variables occurred only once during the experiment; that is, the uniqueness of experimental treatment [51]. Proving the randomness and homogeneity of samples is a difficult process in practice. Therefore, the DID model has high requirements for experiments, needing a complicated procedure.
2.1.3. Literature Evaluation
The previous studies provide this research with a comprehensive perspective, specifically regarding the comparison, selection, and applicability of models. In this regard, this paper studies the citrus industry in Sichuan Province in China. In terms of research content, the existing literature on the citrus industry mainly focuses on evaluating the development of the industry [52] and the development of citrus production cooperatives [53,54], which is neither sustainable development nor policy evaluation. This lack shows the insufficient attention to the total factor productivity, which is the core goal of the sustainable development in citrus industry, as well as the effectiveness evaluation of sustainable development policy implementation regarding the total factor productivity. Secondly, in terms of research methods, the development evaluation of the citrus industry mainly adopts econometric models such as comparative advantage model or entropy method. The measurement of citrus total factor productivity unfollows the econometric requirements and assumptions in terms of the relationship between the number of decision units and indicators, creating invalid and unreliable results. Thirdly, in terms of selecting the geographical scope of the research, it is difficult to obtain relevant data on the Sichuan citrus industry in China. The existing research results are mainly qualitative, based on open data such as yield and planting area, but lack quantitative studies on the Sichuan citrus industry, which mismatch the research value of Sichuan as the largest main producing area of late ripening citrus in China. In addition, previous studies have excluded the calculation of the total factor productivity in Sichuan, obscuring the actual situation of China’s citrus industry.
Aiming at the two core links of sustainable development policy evaluation: efficiency evaluation and causality analysis, this paper selected DEA–Malmquist, respectively, for efficiency evaluation and DID for effect evaluation, so as to reflect the objectivity of evaluation and reduce subjective interference.
2.2. Model Construction
2.2.1. DEA–Malmquist
The DEA was proposed by American operations research researchers Charnes, Cooper, and Rhodes (1978), also known as CCR, which is the acronym of the researchers’ names. They applied this method as linear programming to estimate an empirical production technology frontier for the first time, considering each evaluated object as a DMU [55,56]. These researchers considered the DMU as a whole to determine the effective production frontier by analyzing the ratio of input and output. Also, they analyzed the DEA effectiveness of each DMU according to the distance between each DMU and the effective production frontier.
The Malmquist index method was introduced by Malmquist Sten, a Swedish economist and statistician, in 1953. Then, Caves combined this index with the DEA theory in 1978. This compound index is widely used in the measurement of total factor productivity. Then, Banker, Charnes, and Cooper (1984) introduced an evolutionary form of the CCR and DEA, known as BCC, which is the abbreviation of the researchers’ names [57]. In 1994, Fare and Grosskopf et al. transformed the BCC model to the variable return to scale (VRS) model in order to calculate the Malmquist production efficiency index, based on the distance function [58]. The following equations suppose n DMUs while each DMU has inputs and outputs in period .
where and are both positive numbers, = 1, 2, ⋯, T, and the first is a decision-making unit in stage of input.
According to DMU, the production possibility set with constant returns to scale in period is constructed as Equation (1):
According to DMU, the production possibility set with variable returns to scale in period t is constructed as Equation (2):
If the returns to scale remain unchanged, the distance function of in period is set as ; the distance function in period is ; the distance function of in period is ; the distance function in period is .
If returns to scale are variable, let the distance function of in period be ; the distance function in period is ; the distance function of in period is ; the distance function in period is .
Under the technology level in period , the change in technical efficiency from period to period is shown in Equation (3):
Under the technology level in period , the change of technical efficiency from period to period is shown in Equation (4):
On this basis, the geometric mean of Equations (3) and (4) is used to calculate the change of production efficiency from period to period as shown in Equation (5):
On this basis, according to the Malmquist index decomposition model proposed by Ray and Desli in 1997, Equation (6) can be formulated:
The Malmquist productivity index can reflect the changing trend of production efficiency from to period. If the Malmquist productivity index value is less than 1, the efficiency has improved; if it is equal to 1, the efficiency has been constant; and if it is greater than 1, the efficiency has decreased. Malmquist productivity index can be expressed as the product of technical efficiency change (effch) and technological progress index change (techch). effch can be further decomposed into pure technical efficiency change index (pech) and scale efficiency change index (sech).
effch represents the changing degree of comprehensive technical efficiency, reflecting whether the management means and methods of DMU are appropriate and whether the management decisions are wise. effch > 1 indicates improvement in technical efficiency, effch = 1 shows constant technical efficiency, effch < 1 implies the deterioration of technical efficiency. techch represents the degree of technological progress or innovation, reflecting whether the quality of production factors and technical level of DMU have been improved. techch > 1 shows that the evaluated subjects have improved the quality of production factors, and the level of science and technology has advanced greatly. techch = 1 indicates that the technology level is constant. techch < 1 infers that the quality of production factors has declined and the use of science and technology has regressed. pech represents the efficiency in the use of input factors, indicating whether DMU can effectively use production technology to maximize output. sech represents the suitability degree of factor input scale, indicating whether DMU’s input and output match, and whether the input of various production factors reaches the optimal combination.
2.2.2. DID
In 2016, Sichuan Provincial People’s Government issued the Action Plan for Promoting Agricultural Supply-Side Structural Reform and Accelerating Sichuan Agricultural Innovation and Green Development; specific objectives for the sustainable development of the citrus industry in the province were proposed. In the same year, the Department of Agriculture of Sichuan Province listed 11 cities and states, including Chengdu, Zigong, Luzhou, Neijiang, Leshan, Nanchong, Meishan, Guang ‘an, Dazhou, Ziyang, and Liangshan Prefecture, as the key development (support) areas of the citrus industry in the province (hereinafter referred to as key cities and states).
In view of this, the paper first sets the grouping dummy variable . Since the implementation of the sustainable development policy, 11 key cities and prefectures in the Sichuan citrus industry were taken as the “treatment group” (experimental group), with a value of 1. The 9 cities and states excluded in the key development (support) are taken as the “control group” and assigned a value of 0. Second, the time dummy variable is set. Since the actual start time of the sustainable development of Sichuan citrus industry and the determined time of key cities and states are both in 2016, 2016 is taken as the year of policy impact. Assign value of 1 for 2016 and subsequent years. The value before 2016 is assigned to 0. Considering the availability of data (The relevant data of each city and prefecture in Sichuan in 2021 will be released from March to April 2023, so the statis-tical data involved in this study can only be up to 31 December 2020.), the investigation period is set as 2010–2020, which meets the requirements of the DID policy for more than two periods (years). The sample size is 220, which meets the DID requirement for a sample size greater than 100. Therefore, the specific model constructed is shown in Equation (7):
where is city-state; is the year; represents the explained variable citrus total factor productivity; is the interaction term of the group dummy variable and the time dummy variable, indicating the implementation of the sustainable development policy in the citrus industry; is a series of control variables, is the estimated coefficient of the core explanatory variable, reflecting the net effect of the policy, is the individual fixed effects, is the time fixed effects, and is the random disturbance term.
3. Evaluation Index and Data Description
3.1. Construction of Evaluation Indicator System
3.1.1. Efficiency Evaluation Index
In view of DEA’s requirement that the number of DMU should be at least twofold greater than the product of the number of input and output indicators or the threefold sum of the number of input and output indicators, one output index and three input indicators were selected and deflated through the corresponding price index, as shown in Table 2.
3.1.2. Effect Evaluation Index
This research selects one explained variable, one core explanatory variable, and five control variables. The indicators involving prices are deflated by the corresponding price index, according to Table 3.
Among them, the coefficient of resource endowment is generally calculated by the ratio of the share of a certain resource in a certain country or region in the next-level region to the share of the output value of a certain resource in that country or region in the next-level output value [59]. Equation (8) represents the calculation method.
where is the resource endowment coefficient of citrus production in region in period t, and are citrus production and agricultural output value in period in region , respectively, and and denote the citrus production and agricultural output value of the next-level region of region in period , respectively. If 0 < < 1, citrus production in this region has no resource endowment advantage. If 1 ≤ < 2, citrus production in the region has a resource endowment advantage. If ≥ 2, citrus production in this area has an overwhelming advantage of resource endowment.
The comprehensive comparative advantage index is usually used to measure the comparative advantage of a certain product between different regions or between different products in the same region. The comprehensive comparative advantage index is the geometric average of the scale comparative advantage index and the efficiency comparative advantage index. Equation (9) shows the calculation method.
where signifies the scale comparative advantage index of citrus industry in region in period , and is the efficiency comparative advantage index of citrus industry in region in period .
and were first proposed by Ma Huilan (2007) [60]. Then, it was widely used by Qi chunjie (2014) and other scholars in the analysis of regional comparative advantages of citrus industry [61]. Equations (10) and (11) show the calculation method.
where represents the proportion of citrus planting area in fruit planting area in region in period , and is the proportion of citrus planting area to fruit planting area in the upper-level region of region in period . The general experience is that 0 < < 1, indicating the lack of scale comparative advantage in the citrus industry in the region. A value of 1 ≤ < 2 infers that the citrus industry in this region has a certain scale comparative advantage. ≥ 2 implies that the citrus industry in this region has a considerable comparative advantage in scale.
where and are the yield per unit area of fruit and the yield per unit area of citrus in region in period , respectively; and show the yield per unit area of fruit and the yield per unit area of citrus in region in period , respectively. 0 < < 1 indicates the lack of efficiency comparative advantage in the citrus industry in the region. A value of 1 ≤ < 2 infers that the citrus industry in the region has a certain comparative advantage in efficiency. ≥ 2 implies that the citrus industry in this region has an enormous comparative advantage in efficiency.
3.2. Data Sources
The research sample is the 20 citrus planting cities and states in Sichuan from 2010 to 2020 including Chengdu, Zigong, Panzhihua, Luzhou, Deyang, Mianyang, Guangyuan, Suining, Neijiang, Leshan, Nanchong, Meishan, Yibin, Guang’an, Dazhou, Ya’an, Bazhong, Ziyang, Ganzi, and Liangshan. Among them, the key cities and states are Chengdu, Zigong, Luzhou, Neijiang, Leshan, Nanchong, Meishan, Guang’an, Dazhou, Ziyang, and Liangshan, a total of 11. Non-key cities and prefectures include Panzhihua, Deyang, Mianyang, Guangyuan, Suining, Yibin, Ya’an, Bazhong, and Ganzi, a total of 9. From 2010 to 2020, the citrus planting area and yield in the above 20 cities and prefectures all accounted for 100% of the citrus planting area and yield in Sichuan, and the data are highly representative.
The index data involved in the calculation of citrus total factor productivity from 2009 to 2020 were obtained after requesting them from the Sichuan Provincial Department of Agriculture and Rural Affairs for disclosure. The Sichuan Statistical Yearbook (2011–2021) is the source of the data involved in the calculation of citrus production resource endowment and citrus industrial structure from 2010 to 2020, including the output, output value, and planting area. Also, Sichuan Statistical Yearbook (2011–2021) is the source of the local economic development level, financial support level, and employment scale during 2010–2020. In addition, Sichuan Statistical Yearbook (2010–2021) is the source of the index data involving the price index deflator. Table 4 represents the descriptive statistical results of the variables.
4. Results
4.1. Efficiency Evaluation Results and Analysis
4.1.1. Mean Change and Decomposition of Citrus Total Factor Productivity in Sichuan Cities and Prefectures
Table 5 shows the differences in the mean value and composition of citrus total factor productivity in 20 citrus-growing cities and states in Sichuan during the investigation period.
According to Table 5, the mean value and composition of citrus total factor productivity in 20 citrus-growing cities and prefectures in Sichuan have the following three characteristics.
(1) Various cities and prefectures show insignificant and slight differences of citrus production efficiency in Sichuan. The total factor productivity index of citrus was greater than 1.0 on average in Meishan during the sample period. Except for Mianyang, Guangyuan, Guang’an, and Ganzi, this value was greater than 0.90 but less than 1.0 in the other 15 cities and prefectures, reflecting the relative advantages of Meishan in Sichuan citrus production efficiency and the relative disadvantage of other cities and prefectures in improving production efficiency. Guangyuan ranks the lowest in the total factor productivity index of the whole province since the citrus industry was not the leading industry in Guangyuan, receiving insufficient attention to the improvement of citrus technology and management level. At the same time, the large practical fly infestation caused a devastating blow to the citrus industry in Guangyuan in 2008, and its negative impact is still difficult to be eliminated after many years. This highlights the importance of citrus product quality and safety to sustainable development.
(2) The low effch and techch were the reasons for the low total factor productivity of citrus in Sichuan. Only Meishan, Ya’an, and Liangshan had an effch mean greater than 1.0, while no city had an effch mean greater than 1.0. Ten cities had an EFFCH mean lower than average, and nine cities had a techch mean lower than average. This result reflects the relatively slow technological progress of citrus production in each city and state and the low management level, which hinders the improvement of production efficiency.
(3) sech was the main reason for the overall low technical efficiency of citrus production in Sichuan. During the investigation period, the mean value of pech was greater than that of sech in all cities and states, and the mean value of pech was greater than that of sech in 11 cities and states. The pech value was greater than 1.0 in Meishan, Ya’an, Bazhong, and Liangshan, but equal to 1.0 in Nanchong and Ganzi. However, effch was ineffective due to low sech, except for Meishan. In this province, only Meishan citrus sech was greater than 1.0, while the sech of Ya’an, Bazhong, Ganzi, and Liangshan were all lower than 0.9, which lowered the level of the whole province. This result indicates that the above four cities and states had an improper ratio of input to output in citrus production, and the input of various production factors had not reached the optimal combination.
4.1.2. Time Value Changes in Citrus Total Factor Productivity in Sichuan Cities and Prefectures
Table 6 shows that the citrus total factor productivity of 20 citrus-growing cities and prefectures in Sichuan showed great differences in various years within the sample period.
Based on Table 6, the time value changes of citrus total factor productivity in 20 citrus-growing cities and prefectures in Sichuan have the following two characteristics:
(1) After implementing the sustainable development policy, the total factor productivity of citrus improved in all cities and prefectures in Sichuan. Comparing the mean value of citrus total factor productivity index before and after implementing the policy shows that, except for Mianyang and Dazhou, the other 18 cities and prefectures all showed positive growth. Among these cities, citrus total factor productivity index shows high values of the mean growth exceeding 0.20 in Chengdu, Zigong, Meishan, and Bazhong all exceeded 0.20. Before implementing the policy, no city or state show a high mean value of citrus total factor productivity index greater than 1.0. In contrast, after implementing the policy, this value is greater than 1.0 in 12 cities or states. In addition, after implementing the policy, the citrus total factor productivity index of Liangshan in key cities and states was greater than 1.0 over the years, while that of Chengdu, Meishan, Leshan, and other cities and states was lower than 1.0 only in one year.
(2) The key cities and states widened the gap with non-key cities and states in citrus total factor productivity improvement through sustainable development. After implementing the policy, the average value of total factor productivity index of citrus in 11 key cities and states was 1.036, which was 0.125 higher than before the reform. The mean value of the total factor productivity index of citrus was 0.972 in the nine non-key cities and states, showing a 0.094 increase compared with the pre-reform value. Also, the mean value of citrus total factor productivity index shows a 0.063 difference between the key and non-key cities and states after implementing the policy, representing a 0.031 increase compared with the pre-reform value. Among the key cities and states, Neijiang, Guang’an, Dazhou, and Ziyang showed a less than 1.0 average citrus total factor productivity after implementing the policy, but all were greater than 0.95. However, this value is greater than 1.0 in all the remaining seven cities and states. Among them, Chengdu and Meishan had a greater than 1.1 value of this index, leading the whole province, reflecting the sufficient effect of the policy implementation in the above key cities and states.
4.2. DEA Improvement of Efficiency
This research selects the input-oriented VRS model in DEA, and used DEP2.1 software to calculate the citrus input adjustment of 20 citrus planting cities and states in Sichuan in 2020, represented in Table 7.
With regard to Table 7, the vast majority of cities and states in Sichuan have the problem of excessive input to varying degrees, in case of a fixed output value of main citrus products per 667 m2. Except for Nanchong, Meishan, Ya’an, and Ganzi, the other 16 cities and states have an excessive investment in the three factors of labor, land, and capital. Among them, Chengdu, Mianyang, and Suining have the highest redundancy in the province regarding the costs of labor, land, and pharmaceutical fertilizer, respectively. In particular, the excessive input caused by more pesticides and chemical fertilizers is more serious. To achieve the purpose of income increase, various regions apply more pesticides and fertilizers to make citrus fruits larger, brighter, and sweeter. Particularly, due to relatively poor natural and environmental conditions, non-key cities and states can make up for the “innate deficiencies” such as light, moisture, and soil pH through “external forces” such as pesticides and fertilizers. Under the competitive pressure of non-key cities and states that can also produce good quality fruits by such means, key cities and states also fall into the mode of applying more pesticides and fertilizers for quality improvement. This issue has restricted the improvement of Sichuan citrus production efficiency to a certain extent and has become an urgent problem that should be corrected for the sustainable development of the Sichuan citrus industry.
4.3. Effect Evaluation Results and Analysis
4.3.1. Parallel Trend Test
The parallel trend test is one of the important preconditions for DID policy evaluation [62]. Having parallel trends ensures that the policy treatment group and the control group are completely random in the sample allocation. The year 2016 is an important time node for implementing the sustainable development policy in the Sichuan citrus industry, and a parallel trend test should be conducted on the total factor productivity of citrus before this time point. Figure 1 illustrates the parallel trend test results of the total factor productivity index of citrus in Sichuan cities and states with 95% confidence interval.
According to Figure 2, the total factor productivity index of citrus did not improve significantly in Sichuan from 2010 to 2015. Similarly, this index had a basically consistent trend in both the treatment and control groups before implementing the sustainable development policy, meeting the assumption of a parallel trend. At the same time, the policy had a significant impact on the total factor productivity of citrus in the year of implementation, indicating no lag effect of the sustainable development policy on the total factor productivity of Sichuan citrus.
4.3.2. Benchmark Regression Results
This study uses a two-way fixed effect model to investigate the effect of sustainable development policy on the total factor productivity of Sichuan citrus. Equation (2) adds control variables such as citrus production resource endowment (cre), local economic development level (pgdp), financial support level (finance), employment scale (labor), and citrus industry structure (indu). Table 8 presents the specific regression results.
Based on the results in Table 8, the interaction term shows a positive coefficient regardless of whether adding the control variables or not. Before adding the control variables, the results of the basic regression process show that the coefficient of treat × time is statistically significant at 5% level. Moreover, the total factor productivity index of citrus increased by 0.130 percentage points in the experimental group compared with the control group. After adding the control variables, the coefficient of treat × time is statistically significant at 10% level in the basic regression process.
The regression results of the five control variables show that the coefficient of citrus production resource endowment is negative and insignificant. This result has two implications. First, orange farmers have a strong awareness of “relying on mountains to eat” and do not pay enough attention to production input in cities and states with suitable natural resources, leading to the weak improvement of citrus total factor productivity. Second, even if the input increases, the output value of citrus has not achieved a matching increase due to the fierce homogenization competition between cities and states. This effect results in a small difference in total factor productivity between cities and states. The coefficient of local economic development level is positive but insignificant, indicating that a higher economic development level is accompanied by a large investment capacity for citrus production infrastructure. This result realizes the scale effect of production factor utilization and improves the total factor productivity of citrus. The coefficient of financial support level is negative and statistically significant at the 5% level, implying excessive financial input problems in different degrees in each city and state. The incremental amount of financial support increases the costs of labor, land, medicine, and fertilizer, and strengthens the negative impact on the total factor productivity of citrus. The coefficient of the scale of employees is negative and insignificant, which has the following implications: With the continuous increase in the number of labor force in all cities and states, the labor force lacks professional quality, does not master the planting technology and knowledge, and is only motivated by interests to engage in citrus planting, which cannot promote the improvement of production efficiency. In addition, the increase in bagging, spraying medicine, the laying of plastic film, and other kinds of work stimulated the demand for labor to a certain extent, raised the labor cost, and had a negative impact on the total factor productivity of citrus. The citrus industry’s structure has a positive coefficient, which is statistically significant at the 1% level. This result indicates that the optimization of industrial structure and the improvement of comprehensive comparative advantage are the important driving forces to achieve the sustainable development of citrus industry.
4.3.3. Robustness Test
(1) Counterfactual test
Following Lyu et al. (2019), this research conducts the counterfactual test by changing the policy implementation window [63]. The sample period is from before implementing the sustainable development policy of Sichuan citrus industry (2010–2015). The policy implementation practice is in 2013 and 2014. If the policy treatment effect is still significant in the above two periods, the changes in citrus total factor productivity are likely to come from other factors rather than the sustainable development policy. Table 9 represents the results.
According to Table 9, the coefficients of the interaction term are insignificant when the policy implementation time is 2013 or 2014.
(2) Placebo test
Following Lu et al. (2021), this research conducts the placebo test by randomly selecting cities and states that enjoy key support policies and randomly generating the implementation time of reform policies [64]. This approach avoids the bias of subjective selection, and further excludes the influence of random factors and omitted variables. Eleven cities and states were randomly selected from the 20 cities and states as the virtual experimental group, and the policy implementation time was randomly selected to form the virtual policy DID term and conduct benchmark regression.
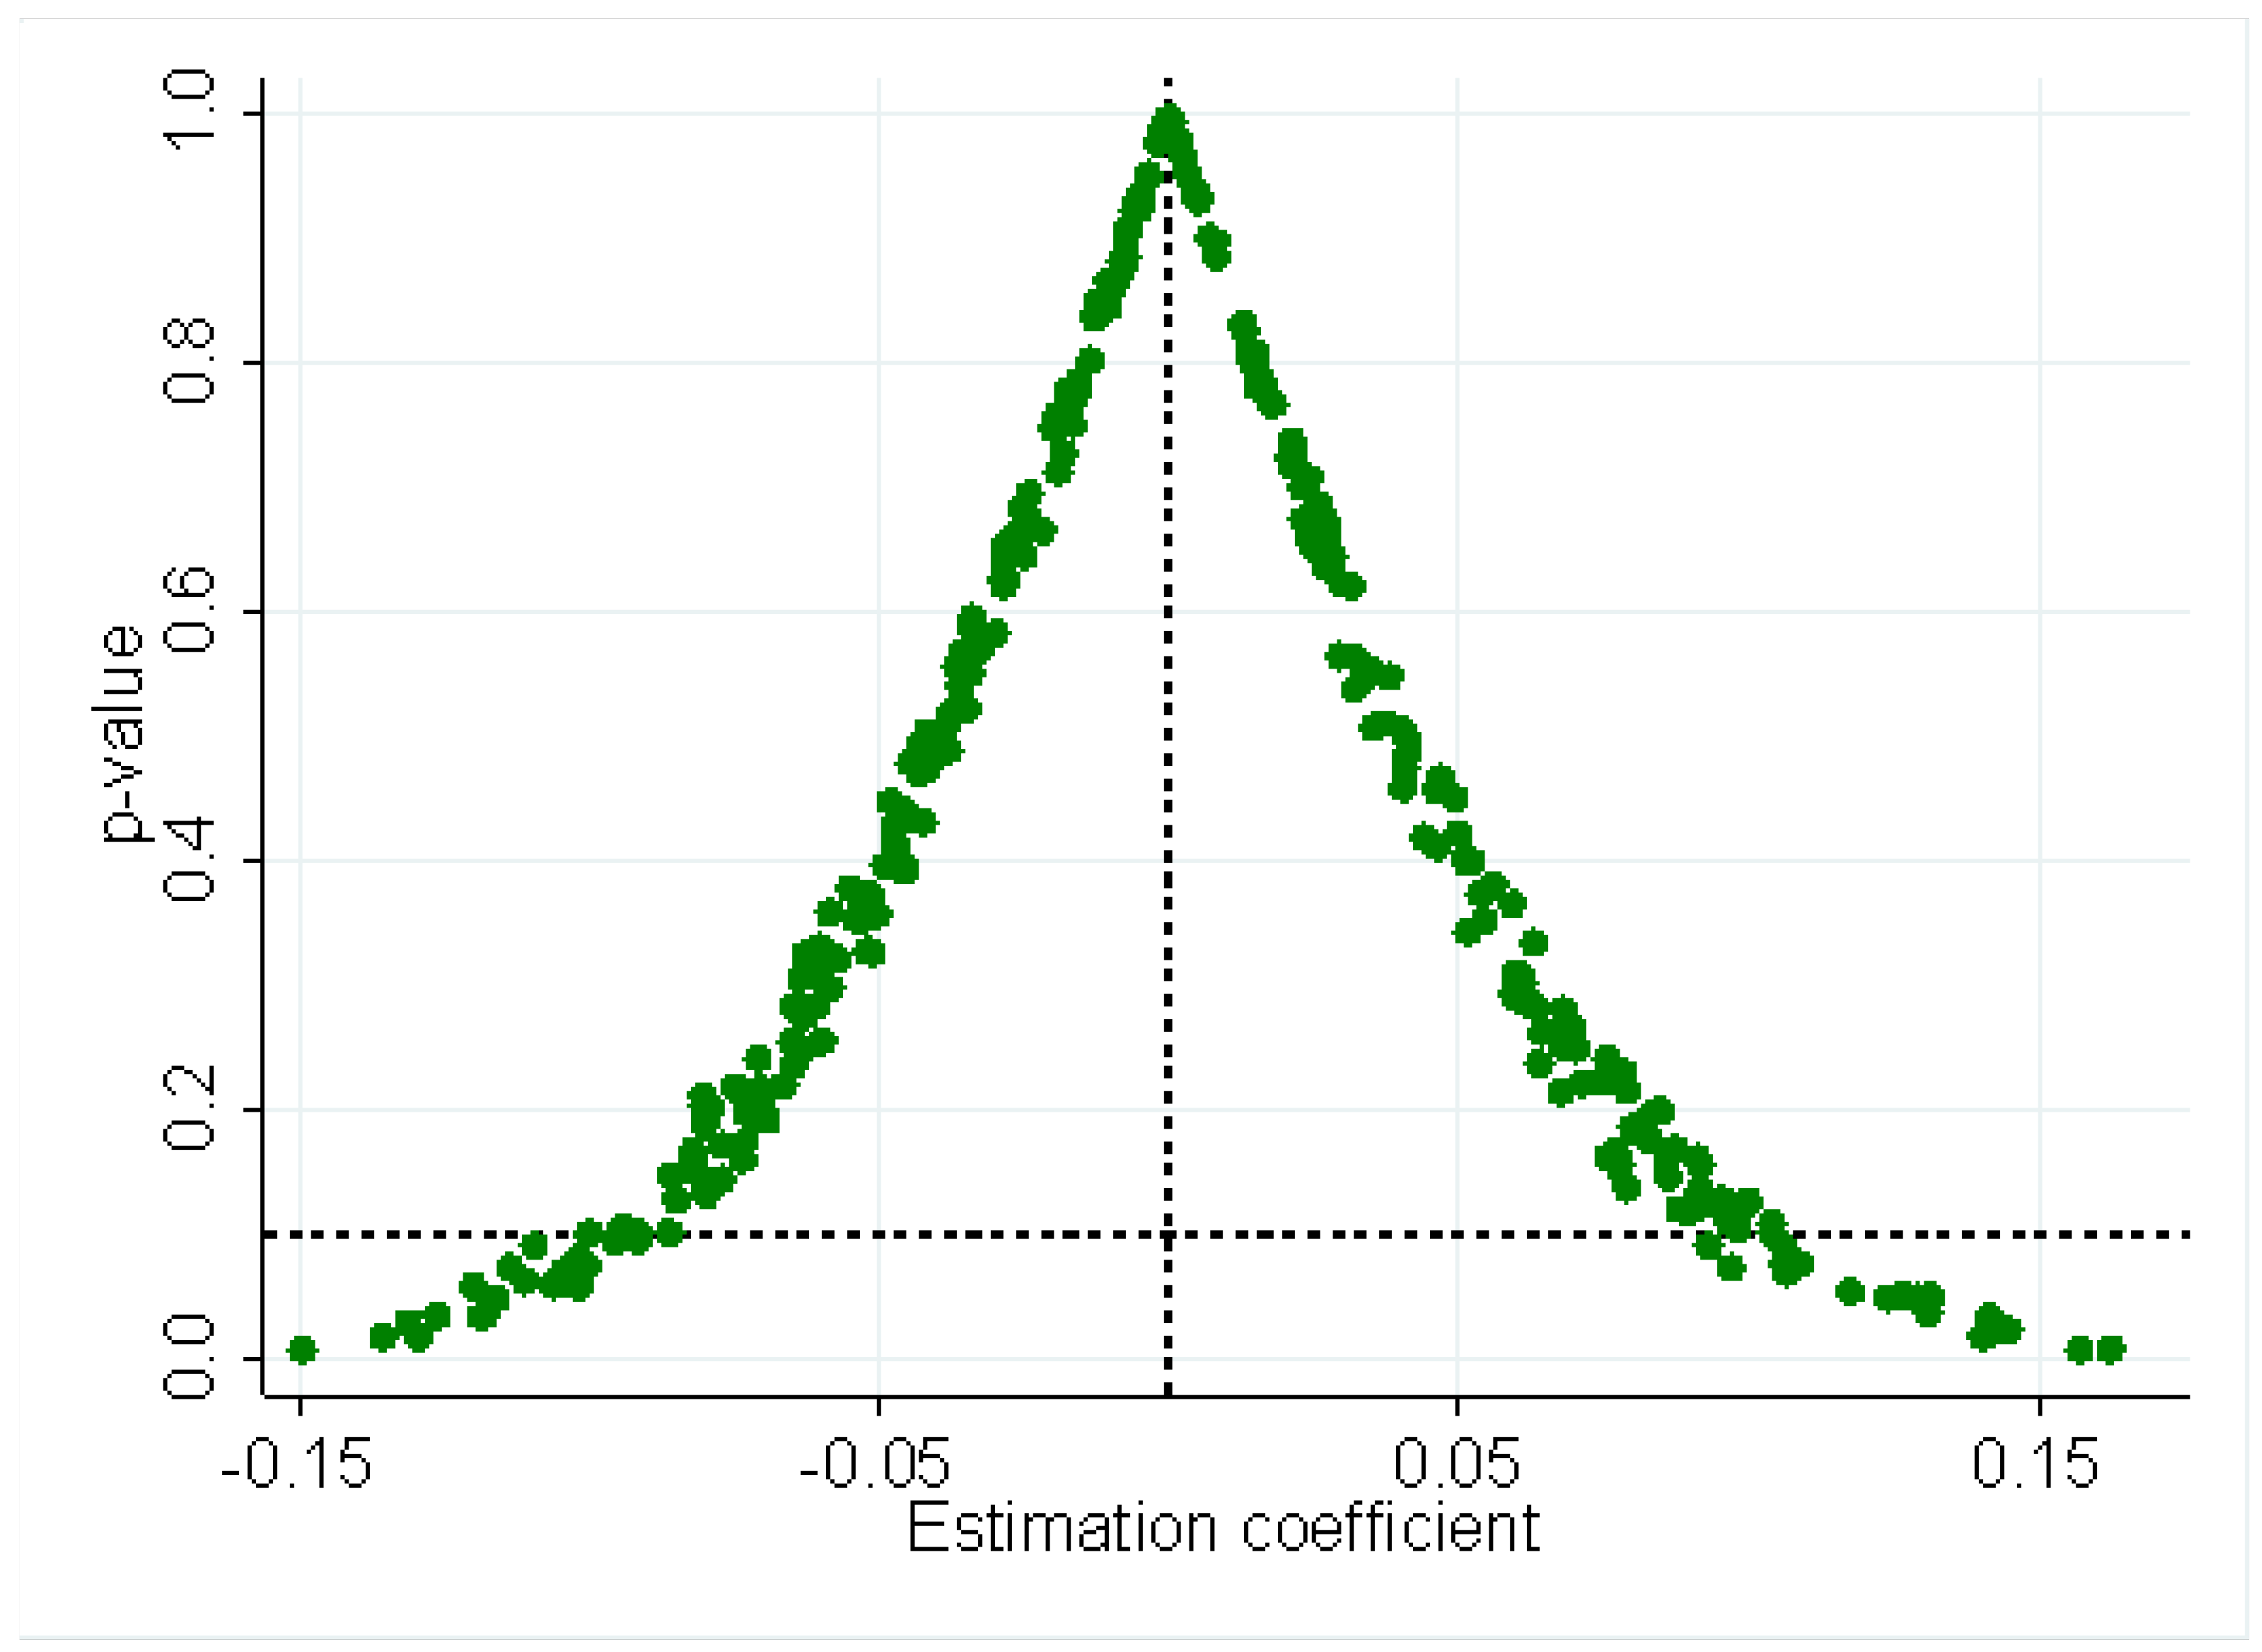
With regard to Figure 3, the estimated coefficients are concentrated around 0, which is consistent with the normal distribution. The results show that the sustainable development policy can indeed improve the total factor productivity of Sichuan citrus, and the core conclusion is robust.
5. Discussion
The findings of this research show that the citrus industry has failed to achieve its goals in Sichuan after implementing the sustainable development policy. This finding is inconsistent with the previous qualitative analysis, which concluded that all cities and prefectures actively promoted the sustainable development of citrus industry in Sichuan. Total factor productivity was low, factor input was excessive, and financial input was excessive, which explained why the yield and planting area increased year by year. The continuous decline of citrus sales price in Sichuan provides an empirical basis, which reflects the improper implementation of sustainable development policies in Sichuan citrus industry to a certain extent.
In the process of implementing policies, local governments are greedy for more and faster, and “sustainable development” is simply understood as scale expansion and variety. Retail planting is still the main mode of citrus production in Sichuan, and a large number of retail orange farmers do not have citrus planting technology. Hence, few opportunities exist for participating in the government-led training of citrus planting technology and conducting onsite guidance is difficult for technicians in the field of retail planting. In addition, some retail farmers increase the input costs by increasing the application rate of chemical fertilizers and pesticides to improve the appearance and sweetness of fruit due to the minimal supervision in retail planting and sales. Although the supervision and punishment have increased on the application of chemical fertilizers and pesticides, implementing the sustainable development policy of citrus industry has only had a minor effect on large households (e.g., family farms and cooperatives), limited constraints on a large number of retail investors, and failed to effectively reduce the cost input of chemical fertilizers and other costs. Combined with the adverse impact of frequent natural disasters in Sichuan in recent years, this input cost has risen to ensure the basic quality of fruit, threatening the sustainable development in this industry.
Sichuan orange farmers generally carry out single fruit bagging when planting varieties with relatively high returns such as Chunjian, Qingjian, Mihuo, and Wogan. This approach can effectively reduce sun burning and insect and bird pecking and achieve the purpose of good fruit appearance and high price, but it increases labor costs to a certain extent. Due to the difficult operation and high price of citrus bagging machinery, retail investors and even family farms and cooperatives are reluctant to use it when planting. Thus, they still pay specialized workers to complete the bagging work manually on a daily basis. The survey found that the daily salary can reach 300 yuan (excluding lunch and dinner) for a skilled bagger in Meishan, Chengdu, and other places, while this value is not less than 150 yuan in non-key cities and states. When the price of Sichuan citrus increased significantly from 2016 to 2018, the increase in bagging and other labor costs has an insignificant impact on the orange farmers’ income, while the income of middle and high-end fruits can still increase because of the improvement of fruit quality by bagging. However, the price of national citrus has sharply fallen, for example, in Sichuan citrus since 2019, and the salary is still increasing for bagging workers. A large number of low-end fruits were bagged without the need for bagging, the technical level of superposition bagging workers was uneven, and the timing and tightness of bagging were not well grasped. These conditions not only failed to improve the fruit quality, but also reduced the sweetness of fruits to a certain extent. Therefore, the taste was poor, which intensified the dilemma of low-price operation, and finally affected the income of Sichuan citrus planting.
This paper has limitations for considering the actual situation of citrus production in Sichuan since 2021 due to data unavailability. The researchers plan to obtain the data of the above years in the follow-up study, so as to fully study the impact of COVID-19 on the citrus industry. Due to the unavailability of data, this paper disregards the impact of changes in Chinese consumers’ “online” shopping habits and changes in the age structure of orange farmers on the citrus industry since 2010. The researchers plan to find evaluation indicators that can reflect these two factors in the follow-up research process and conduct empirical research on them. In addition, this paper uses the DEA–Malmquist index and DID model for efficiency and effect evaluation, without comparing and analyzing the results calculated by using the RDD model, which is one of the mainstream methods of policy evaluation. A future study can use this model for a more comprehensive result.
6. Conclusions and Suggestions
This paper is an attempt to evaluate the sustainable development policy of the citrus industry in Sichuan. To this end, this study uses the DEA–Malmquist index model to calculate the total factor productivity of 20 citrus planting cities and states in Sichuan, based on the city-state panel data of Sichuan citrus production from 2009 to 2020, according to the two logical levels of efficiency and effect. In addition, this research employs the DID model to empirically test the effectiveness of sustainable development policy in improving the production efficiency of Sichuan citrus industry.
The results have the following implications: (1) The comprehensive technical efficiency and technical progress index are low, causing the inefficiency of citrus production in Sichuan. The main reason for the low comprehensive technical efficiency is the improper input scale. During the sample period, the citrus total factor productivity index has a mean value greater than 1.0 only in Meishan, and the other 19 cities and states all show the ineffective total factor productivity of citrus. Except for Meishan, Ya’an, and Liangshan, the mean value of the comprehensive technical efficiency of citrus is less than 1.0 in the other 17 cities and states, and the mean value of the citrus technical progress index is less than 1.0 in all the 20 cities and states. In addition to Meishan, the other 19 cities and states were all caused by the low scale efficiency of citrus, indicating that the proportion of input and output in citrus production was improper, and the input of production factors did not reach the optimal combination. (2) The implementation of sustainable development policy has improved the total factor productivity of Sichuan citrus and widened the gap between cities and prefectures. The efficiency evaluation results showed that the mean value of the citrus total factor productivity index was lower than 1.0 in all the cities or states before implementing the sustainable development policy. In sharp contrast, this value increased and became greater than 1.0 in 12 cities or states after implementing the policy. Effect evaluation results showed that the coefficient of interaction term is statistically significant at 5% level, and the total factor productivity index of citrus increased by 0.130% in the experimental group compared with the control group, before adding control variables. After the control variables were added, the coefficient of the interaction term was statistically significant at the 10% level, and the total factor productivity index of citrus in the treatment group was 0.123% higher than that in the control group. (3) Excessive production factors and financial investment hindered the sustainable development of Sichuan citrus industry. The efficiency evaluation results show that, except for Nanchong, Meishan, Ya’an, and Ganzi, the other 16 cities and states have an excessive investment in the three factors of labor, land, and capital. Among them, Chengdu, Mianyang, and Suining have the highest redundancy in the province in terms of labor cost, land cost, and pharmaceutical fertilizer cost, respectively. In addition to the factors that the high level of local economic development will inevitably increase the cost of labor and land, the unnecessary bagging consumes a lot of labor, transfers a lot of land or even farmland for citrus planting, and the homogenization competition intensifies the indiscriminate application of pesticides and fertilizers, which are the main reasons for the excessive investment in citrus production in Sichuan cities and states, and restricts the improvement of citrus production efficiency in Sichuan to a certain extent. The effect evaluation results show that the coefficient of financial support level is negative, which is statistically significant at 5% level, implying excessive financial input problems in different degrees in each city and prefecture.
The findings of this research have the following suggestions. First, policymakers should adjust the layout of production areas and optimize the product structure. Based on the principle of optimal ecology, we will support the gradual concentration of citrus industry in advantageous cities and states and encourage cities and states with unsuitable natural resources or frequent extreme meteorological disasters to gradually withdraw from citrus cultivation or change to other garden fruits. The government should change the support mode of product seeking market to the mode of market-determined product and arrange citrus production according to the change in market demand if the improvement effect is inappropriate. Also, strategists should gradually eliminate the citrus varieties that are inconsistent with the consumer’s preference (such as Huangguo orange) and develop new citrus varieties that meet the market demand, and constantly improve the added value of products.
Second, the government should avoid offside intervention in citrus production and investment behavior. It is necessary to avoid the government’s production-oriented industrial poverty alleviation and industrial revitalization, especially to correct the trend of citrus scale competition between cities and states in time. What and how much farmers plant should be determined by market demand rather than by the government. Governments at all levels should not hesitate to occupy cultivated land in exchange for the development of citrus industry in order to achieve the target task of rural revitalization. The occupied cultivated land should be withdrawn in an orderly and steady manner, and the bottom-line principle of “not competing with grain for land” should be adhered to in the citrus industry. Moreover, the government needs to reduce the support for enterprises directly engaged in citrus planting and focus on supporting enterprises in the field of commercial services such as preproduction, mid-production, and postproduction of citrus. Especially for the phenomenon of “real estate developers participating in citrus industry”, access and daily supervision should be strengthened to avoid mass incidents caused by “capital flight”.
Third, Sichuan should strengthen oversight of quality and safety. To this end, decision-makers should establish fruit quality inspection centers and other agricultural product quality monitoring systems in citrus base towns, design a base quasi-exit system, and establish a production ledger. Furthermore, strategists should realize the effective connection between origin quasi-exit and market access, ensure that fruit production and transportation can be traced and tracked throughout the process, at the same time, strengthen agricultural input supervision, and continue to implement the action of zero growth in pesticide and chemical fertilizer use. Sichuan should strictly prohibit highly toxic and highly residual pesticides from entering the production process, constantly improve the inspection and quarantine standards of citrus, and strive to open the European and American markets and expand their sales.
Author Contributions
Conceptualization, Y.H. and W.C.; methodology, Y.H.; software, Y.H.; validation, Y.H. and W.C.; formal analysis, Y.H. and W.C.; writing—original draft preparation, Y.H.; writing—review and editing, Y.H.; supervision, Y.H. and W.C.; funding acquisition, W.C. All authors have read and agreed to the published version of the manuscript.
Funding
This research was supported by the 2022 Major Project of Sichuan Development and Reform Commission of the People’s Republic of China (Project number: 202206; Project Host: Chen Wenkuan; Project duration: June 2022 to present) and the 2022 Excellent Project of the Federation of Social Sciences of Ya’an, Sichuan Province, the People’s Republic of China (Project number: YAA20220030; Project Host: He Yu; Project duration: May 2022 to present).
Institutional Review Board Statement
The study did not require ethical approval.
Informed Consent Statement
The study did not involve humans.
Data Availability Statement
Support all data of this study, please by sichuan province statistical yearbook (2009–2021) the query, the query url: http://tjj.sc.gov.cn/scstjj/c105855/nj.shtml, accessed on 15 January 2023.
Conflicts of Interest
The authors declare no conflict of interest.
References
- Deng, X. Thinking on some problems of fruit industry development in our country. J. Fruit Sci. 2021, 38, 121–127. [Google Scholar] [CrossRef]
- Commoner, B. Making Peace with the Planet; The New Press: New York, NY, USA, 1992. [Google Scholar]
- Nasrollahi, Z.; Hashemi, M.; Bameri, S.; Taghvaee, V.M. Environmental pollution, economic growth, population, industrialization, and technology in weak and strong sustainability: Using STIRPAT model. Environ. Dev. Sustain. 2020, 22, 1105–1122. [Google Scholar] [CrossRef]
- Nodehi, M.; Arani, A.A.; Taghvaee, V.M. Sustainability spillover effects and partnership between East Asia & Pacific versus North America: Interactions of social, environment and economy. Lett. Spat. Resour. Sci. 2022, 15, 311–339. [Google Scholar] [CrossRef] [PubMed]
- Smith, M.S.; Cook, C.; Sokona, Y.; Elmqvist, T.; Fukushi, K.; Broadgate, W.; Jarzebski, M.P. Advancing sustainability science for the SDGs. Sustain. Sci. 2018, 13, 1483–1487. [Google Scholar] [CrossRef] [PubMed]
- United Nations Department of Economic and Social Affairs. Indicators of Sustainable Development Guidelines and Methodologies; United Nations: New York, NY, USA, 2001.
- UNEP. Towards a Pathways to Sustainable Development and Poverty Eradication; United Nations: New York, NY, USA, 2011.
- World Bank. Expanding the Measure of Wealth. Indicators of Environmentally Sustainable Development; The World Bank: Washington, DC, USA, 1997; pp. 48–98. [Google Scholar]
- World Bank. Environmental Performance Indicators: A Second Editor’s Note; The World Bank: Washington, DC, USA, 1999. [Google Scholar]
- OECD. OECD Environmental Indicators: Development, Measurement and Use; OECD: Paris, France, 2003; pp. 1–37. [Google Scholar]
- Nie, C.; Luo, W.; Feng, Y.; Chen, Z. The impact of economic growth target constraints on environmental pollution: Evidence from China. Int. J. Environ. Res. Public Health 2023, 20, 2831. [Google Scholar] [CrossRef] [PubMed]
- Gitelman, L.; Kozhevnikov, M.; Visotskaya, Y. diversification as a method of ensuring the sustainability of energy supply within the energy transition. Resources 2023, 12, 19. [Google Scholar] [CrossRef]
- Taghvaee, V.M.; Arani, A.A.; Soretz, S.; Agheli, L. Diesel demand elasticities and sustainable development pillars of economy, environment and social (health): Comparing two strategies of subsidy removal and energy efficiency. Environ. Dev. Sustain. 2022, 25, 2285–2315. [Google Scholar] [CrossRef]
- Lau, P.L.; Nandy, M.; Chakraborty, S. Accelerating UN sustainable development goals with ai-driven technologies: A systematic literature review of women’s healthcare. Healthcare 2023, 11, 401. [Google Scholar] [CrossRef] [PubMed]
- Benshuo, B.W.; Dai, L.; Liao, B. System architecture design of a multimedia platform to increase awareness of cultural heritage: A case study of sustainable cultural heritage. Sustainability 2023, 15, 2504. [Google Scholar] [CrossRef]
- Ibrahim, R.L.; Al-Mulali, U.; Ajide, K.B.; Mohammed , A.; Al-Faryan , M.A.S. The implications of food security on sustainability: Do trade facilitation, population growth, and institutional quality make or mar the target for SSA? Sustainability 2023, 15, 2089. [Google Scholar] [CrossRef]
- Zhang, X.Y.; Bao, J.; Xu, S.W.; Wang, Y.; Wang, S.W. Prediction of China’s grain consumption from the perspective of sustainable development—Based on GM(1,1) model. Sustainability 2022, 14, 10792. [Google Scholar] [CrossRef]
- Gang, Y. Continue to expand the opening of financial industry to promote high-quality economic development. Macroecon. Manag. 2019, 4, 15–16+24. [Google Scholar] [CrossRef]
- Yu, H.; Zhao, Y.; Qiao, G.; Ahmad, M. Can green financial reform policies promote enterprise development? empirical evidence from China. Sustainability 2023, 15, 2692. [Google Scholar] [CrossRef]
- Xiaozhong, L. The evaluation of China’s manufacturing industry’s high-quality development and the comparative analysis of regional differences. Soc. Sci. 2022, 17–25. [Google Scholar]
- Qiao, R.; Weike, F.C.; Qiao, Y. Sustainable development path of resource-based cities—Taking datong as an example. Sustainability 2022, 14, 14474. [Google Scholar] [CrossRef]
- Xiao-e, Q.; Huang-Long, M.; Xiaofang, W. Comprehensive evaluation of high quality development level of provincial economy. Stat. Decis. 2020, 38, 98–103. [Google Scholar] [CrossRef]
- Gan, W.; Yao, W.; Huang, S. Evaluation of green logistics efficiency in Jiangxi Province based on Three-Stage DEA from the perspective of high-quality development. Sustainability 2022, 14, 797. [Google Scholar] [CrossRef]
- Dunping, H.; Lei, Y. Comprehensive evaluation of high quality development of urban economy in the Yellow River Basin. Stat. Decis. 2012, 38, 103–106. [Google Scholar] [CrossRef]
- Fengzhen, C.; Qiuxiao, C.; Zhaozhao, Y. Evaluation and empirical study on county development in Binhu region guided by high-quality development: A case study of Binpoyang Lake Region. Archit. Cult. 2022, 11, 60–63. [Google Scholar] [CrossRef]
- Kathy, L.R.; Kathy, L.R. Measurement of household food security in the USA and other industrialised countries. Public Health Nutr. 2002, 5, 859–864. [Google Scholar]
- Poczta-Wajda, A. Measures and Dimensions of Food Security.Probl. World Agric. 2018, 18, 203–213. [Google Scholar]
- Monserrath, X.L.G. AES prize essay resilience to food insecurity: Theory and empirical evidence from international food assistance in Malawi. J. Agric. Econ. 2020, 71, 936–961. [Google Scholar]
- Narayanan, E.; Ismail, W.R.; Mustafa, Z. A data-envelopment analysis-based systematic review of the literature on innovation performance. Heliyon 2022, e11925. [Google Scholar] [CrossRef] [PubMed]
- Haider, S.; Danish, M.S.; Sharma, R. Assessing energy efficiency of Indian paper industry and influencing factors: A slack-based firm-level analysis. Energy Econ. 2019, 81, 454–464. [Google Scholar] [CrossRef]
- Mirmozaffari, M.; Shadkam, E.; Khalili, S.M.; Kabirifar, K.; Yazdani, R.; Asgari Gashteroodkhani, T. A novel artificial intelligent approach: Comparison of machine learning tools and algorithms based on optimization DEA Malmquist productivity index for eco-efficiency evaluation. Int. J. Energy Sect. Manag. 2021, 15, 523–550. [Google Scholar] [CrossRef]
- Tachega, M.A.; Yao, X.; Liu, Y.; Ahmed, D.; Li, H.; Mintah, C. Energy efficiency evaluation of oil producing economies in Africa: DEA, malmquist and multiple regression approaches. Clean. Environ. Syst. 2021, 2, 100025. [Google Scholar] [CrossRef]
- Tengey, C.; Nwulu, N.I.; Adepoju, O.; Longe, O.M. Analysis of the Productivity Dynamics of Electricity Distribution Regions in Ghana. Energies 2022, 15, 9414. [Google Scholar] [CrossRef]
- Andrews, A. An application of PCA-DEA with the double-bootstrap approach to estimate the technical efficiency of New Zealand District Health Boards. Health Econ. Policy Law 2022, 17, 175–199. [Google Scholar] [CrossRef]
- Zhang, H.; Nisar, U.; Mu, Y. Evaluation of Technical Efficiency in Exotic Carp Polyculture in Northern India: Conventional DEA vs. Bootstrapping Methods. Fishes 2022, 7, 168. [Google Scholar] [CrossRef]
- Mirmozaffari, M.; Yazdani, R.; Shadkam, E.; Khalili, S.M.; Tavassoli, L.S.; Boskabadi, A. A novel hybrid parametric and non-parametric optimisation model for average technical efficiency assessment in public hospitals during and post-COVID-19 pandemic. Bioengineering 2021, 9, 7. [Google Scholar] [CrossRef]
- Mirmozaffari, M.; Yazdani, R.; Shadkam, E.; Khalili, S.M.; Mahjoob, M.; Boskabadi, A. An integrated artificial intelligence model for efficiency assessment in pharmaceutical companies during the COVID-19 pandemic. Sustain. Oper. Comput. 2022, 3, 156–167. [Google Scholar] [CrossRef]
- Mirmozaffari, M.; Yazdani, M.; Boskabadi, A.; Ahady Dolatsara, H.; Kabirifar, K.; Amiri Golilarz, N. A novel machine learning approach combined with optimization models for eco-efficiency evaluation. Appl. Sci. 2020, 10, 5210. [Google Scholar] [CrossRef]
- Yang, G.; Gong, G.; Gui, Q. Exploring the spatial network structure of agricultural water use efficiency in China: A social network perspective. Sustainability 2022, 14, 2668. [Google Scholar] [CrossRef]
- Li, S.; Zhu, Z.; Dai, Z.; Duan, J.; Wang, D.; Feng, Y. Temporal and Spatial Differentiation and Driving Factors of China’s Agricultural Eco-Efficiency Considering Agricultural Carbon Sinks. Agriculture 2022, 12, 1726. [Google Scholar] [CrossRef]
- Nodin, M.N.; Mustafa, Z.; Hussain, S.I. Assessing rice production efficiency for food security policy planning in Malaysia: A non-parametric bootstrap data envelopment analysis approach. Food Policy 2022, 107, 102208. [Google Scholar] [CrossRef]
- Zhao, J.; Zhang, L. Fiscal Expenditure Efficiency Measurement and Its Convergence Analysis on Aging Undertakings in China: Based on a Global Super-Efficiency Slacks-Based Measure Model. Sustainability 2023, 15, 2486. [Google Scholar] [CrossRef]
- Mirmozaffari, M.; Shadkam, E.; Khalili, S.M.; Yazdani, M. Developing a novel integrated generalised data envelopment analysis (DEA) to evaluate hospitals providing stroke care services. Bioengineering 2021, 8, 207. [Google Scholar] [CrossRef] [PubMed]
- Parra Santiago, J.I.; Camarero Orive, A.; Díaz Gutiérrez, D.; De Manuel López, F.D.A. Employing DEA for Assessment of Cruise Market: A Case Study in Malaga—Spanish Port. J. Mar. Sci. Eng. 2022, 10, 1805. [Google Scholar] [CrossRef]
- Cavaignac, L.; Dumas, A.; Petiot, R. Third-party logistics efficiency: An innovative two-stage DEA analysis of the French market. Int. J. Logist. Res. Appl. 2021, 24, 581–604. [Google Scholar] [CrossRef]
- Xuping, H. Study on industrial water use efficiency based on three-stage DEA-Malmquist index decomposition. Water Resour. Power 2022, 40, 89–93. [Google Scholar] [CrossRef]
- Mirmozaffari, M.; Yazdani, R.; Shadkam, E.; Tavassoli, L.S.; Massah, R. VCS and CVS: New combined parametric and non-parametric operation research models. Sustain. Oper. Comput. 2021, 2, 36–56. [Google Scholar] [CrossRef]
- Qu, C. Research on Performance Evaluation of Ecological Compensation—Taking the Yangtze River Economic Belt as an Example; University of Chinese Academy of Social Sciences: Beijing, China, 2020. [Google Scholar]
- Chen, L.; Wu, H. Research status and potential problems of differential differential method in China. Quant. Econ. Technol. Econ. 2015, 32, 133–148. [Google Scholar] [CrossRef]
- Chen, Q. Advanced Econometrics and Stata Applications, 2nd ed.; Higher Education Press: Beijing, China, 2014. [Google Scholar]
- Wu, B. Review of policy evaluation methods. Stat. Theory Pract. 2021, 36, 15–22. [Google Scholar] [CrossRef]
- Zhang, H.; Zhong, Z. How does environmental regulation affect the green growth of China’s Citrus industry? the mediating role of technological innovation. Int. J. Environ. Res. Public Health 2022, 19, 13234. [Google Scholar] [CrossRef] [PubMed]
- Liu, Y.; Liu, Z.; Liu, J.; Qiu, L.; Wang, Y.; Fu, X. Research on the impact of members’ social capital within agricultural cooperatives on their adoption of IPM in China. Int. J. Environ. Res. Public Health 2022, 19, 11538. [Google Scholar] [CrossRef]
- Liu, Y.; Shi, R.; Peng, Y.; Wang, W.; Fu, X. Impacts of technology training provided by agricultural cooperatives on farmers’ adoption of biopesticides in China. Agriculture 2022, 12, 316. [Google Scholar] [CrossRef]
- Charnes, A.; Cooper, W.W.; Rhodes, E. Measuring the Efficiency of Decision-making Units. Eur. J. Oper. Res. 1978, 2, 429–444. [Google Scholar] [CrossRef]
- Sadeghloo, A.A.; Nasiri, M.J. Application of Malmquist Index in Two-Stage DEA for Measurement of Productivity Growth. J. Money Econ. 2016, 11, 31–51. [Google Scholar]
- Banker, R.D.; Charnes, A.; Cooper, W.W. Some Models for the Estimation of Technical and Scale Inefficiencies in Data Envelopment Analysis. Manag. Sci. 1984, 30, 1078–1092. [Google Scholar] [CrossRef] [Green Version]
- Yu, G.; Wei, Q.L.; Brockett, P. A Generalized data envelopment analysis model. Ann. Oper. Res. 1996, 66, 47–89. [Google Scholar] [CrossRef]
- Zhang, L.X.; Liang, J. The influence of regional resource endowment on resource utilization efficiency. J. Nat. Resour. 2010, 25, 1237–1247. [Google Scholar]
- Ma, H. Regional difference analysis of Comparative superiority of Chinese cotton Production and Export competitiveness. Int. Trade Issues 2007, 61–65. [Google Scholar]
- Xiang, Y.; Qi, C. Study on regional comparative advantage and influencing factors of citrus production in Hubei Province. Econ. Geogr. 2014, 34, 134–139+192. [Google Scholar]
- Beck, T.; Levine, R.; Levkov, A. Big bad banks? the winners and losers from bank deregulation in the United States. J. Financ. 2010, 65, 1637–1667. [Google Scholar] [CrossRef] [Green Version]
- Lu, Y.; Lu, Y.; Wu, S.B.; Wang, Y. The promotion effect of the Belt and Road Initiative on foreign investment: A DID test of Chinese enterprises’ greenfield investment from 2005 to 2016. Econ. Res. J. 2019, 54, 187–202. [Google Scholar]
- Lu, S.F.; Dong, R.Y.; Ye, C.S. Does the Belt and Road Initiative promote China’s high quality export: Evidence from micro enterprises. China Ind. Econ. 2021, 80–98. [Google Scholar] [CrossRef]
Figure 1.
Flowchart of sustainable development policy evaluation of Sichuan citrus industry.

Figure 2.
Parallel trend test of citrus total factor productivity index in each city and prefecture of Sichuan.
Figure 2.
Parallel trend test of citrus total factor productivity index in each city and prefecture of Sichuan.

Figure 3.
Results of placebo test.


Table 1.
Typical methods of public policy evaluation.
| Purpose of Evaluation | Main Evaluation Problem | Typical Method | Method Introduction |
|---|---|---|---|
| Policy efficiency evaluation | Economic efficiency | Valuation method | This method includes the willingness to pay method, hedonic price method, and opportunity cost method. The main idea is to monetize the costs and benefits generated by the policy, so as to evaluate the efficiency of the policy. |
| Econometric model using panel data | Using the nonparametric estimation method, the ecological information and spatial location of policy data are introduced into the regression to analyze the changes in the regression coefficients. | ||
| Social impact efficiency | Time series model | This model involves the DEA and directional distance function method, which mainly analyzes the impact of a series of factors such as policy implementation on economic activities. | |
| Eco-environmental efficiency | Geographical weighted regression method | This method considers the time factor to establish the time lag variable model for evaluating the various influences before and after the implementation of the policy. | |
| Time–space efficiency | Spatial econometric law | The spatial effects are analyzed by combining spatial panel data with remote sensing interpretation technology, GIS technology, and the CA–Markov model. | |
| Policy effect evaluation | Causal analysis | Logistic regression method | This method analyzes the relationship between the probability of occurring a certain type of event and the independent variable. This approach applies to a situation where the dependent variable is a binary variable (or multiple categories), which belongs to the probabilistic regression method. |
| Instrumental variable method | This method is applicable if a variable is highly correlated with the random explanatory variable in the model, but not with the random error term. This variable is an instrumental variable used to obtain a consistent estimator with the corresponding regression coefficient in the model. | ||
| Regression discontinuity design (RDD) | Whether a key variable of an individual is greater than the critical value determines if the individual is subject to policy intervention. Individuals less than the critical value can be used as a control group to reflect the situation of the individual without intervention, and the difference of samples near the critical value can reflect the causal link between intervention and outcome variables, so as to calculate the effect variable of the policy. There are two types of precise breakpoint regression and fuzzy breakpoint regression. | ||
| Differences-in-differences (DID) | The effect of unobjectionable factors is allowed, but it is assumed that they do not change with time. This method uses panel data to build a dual fixed effects model and estimate the parameters. | ||
| Matching analysis method | For a dataset that is incapable to distinguish between the experimental group and the control group, an approximate experimental method can make individuals with the same characteristics have the same response to the policy after controlling the covariates. |
Table 2.
Efficiency evaluation index system (unit: RMB/667 m2 (667 m2 is a special unit in line with China’s statistical habits of agricultural production, pronounced “mu”, which is used to represent unit area in the publicly available data involved in the efficiency evaluation of this paper)).
Table 2.
Efficiency evaluation index system (unit: RMB/667 m2 (667 m2 is a special unit in line with China’s statistical habits of agricultural production, pronounced “mu”, which is used to represent unit area in the publicly available data involved in the efficiency evaluation of this paper)).
| Type of Indicator | Content of Indicator | Explanation of Indicator (Calculation Method) |
|---|---|---|
| Indicator of output | Output value of main citrus products per unit area | |
| Index of inputs | Citrus labor cost per unit area | Labor cost = household labor discount + labor cost |
| Cost of citrus land per unit area | Land cost = transfer land rent + self-operated land discount rent | |
| Cost of citrus pesticides and fertilizers per unit area | Pharmaceutical and fertilizer cost = pesticide cost + fertilizer cost |
Table 3.
Effect evaluation index system.
| Type of Indicator | Content of Indicators | Symbol of Indicator | Explanation of Indicators (Calculation Method) |
|---|---|---|---|
| Variable explained | Total factor productivity of citrus | TFP | Total factor productivity of citrus in Sichuan (Efficiency Evaluation Results) |
| Core explanatory variable | Policy on sustainable development of citrus industry | treat × time | Measured by the DID term, if the city-state is selected as a key city-state, and the observation time is after the selected time, takes the value 1 and 0 otherwise |
| Control variable | Citrus production resource endowment | cre | Coefficient of citrus production resource endowment in each city and state () |
| Level of local economic development | pgdp | Per capita regional GDP of cities and prefectures (Yuan) | |
| Level of local financial support for agriculture | inance | Proportion of agriculture, forestry, and water affairs in the general public budget expenditure of cities and prefectures (%) | |
| Number of employees | labour | Proportion of employed persons in the primary industry among the third employed persons in each city and prefecture (%) | |
| Comparative advantage of citrus industry | indu | Index of comprehensive comparative advantage of citrus industry in each city and state () |
Table 4.
Descriptive statistics of variables.
| Variables | Symbol | Sample Size | Average | S.D. * | Minimum | Maximum |
|---|---|---|---|---|---|---|
| Total factor productivity of citrus | TFP | 220 | 0.943 | 0.174 | 0.445 | 1.413 |
| Policy on sustainable development of citrus industry | treat × time | 220 | 0.250 | 0.433 | 0 | 1 |
| Citrus production resource endowment | cre | 220 | 0.946 | 0.958 | 0.0104 | 4.441 |
| Level of local economic development | pgdp | 220 | 42,523 | 20,138 | 13,792 | 109,611 |
| Level of local financial support for agriculture | finance | 220 | 1.089 | 0.293 | 0.395 | 1.965 |
| Number of employees | labour | 220 | 1.120 | 0.305 | 0.323 | 1.967 |
| Comparative advantage of citrus industry | indu | 220 | 0.856 | 0.435 | 0.166 | 2.097 |
* S.D. is standard deviation.
Table 5.
Mean and decomposition of total factor productivity of citrus in 20 citrus-growing prefectures in Sichuan from 2009 to 2020.
Table 5.
Mean and decomposition of total factor productivity of citrus in 20 citrus-growing prefectures in Sichuan from 2009 to 2020.
| Area | Effch | Techch | Pech | Sech | TFP | Ranking |
|---|---|---|---|---|---|---|
| Chengdu | 0.986 | 0.973 | 0.998 | 0.988 | 0.959 | 5 |
| Zigong | 0.970 | 0.967 | 0.974 | 0.996 | 0.938 | 7 |
| Panzhihua | 0.935 | 0.970 | 0.976 | 0.958 | 0.907 | 15 |
| Luzhou | 0.983 | 0.977 | 0.997 | 0.986 | 0.961 | 4 |
| Deyang | 0.936 | 0.966 | 0.955 | 0.981 | 0.905 | 16 |
| Mianyang | 0.910 | 0.977 | 0.913 | 0.997 | 0.889 | 18 |
| Guangyuan | 0.860 | 0.975 | 0.901 | 0.955 | 0.839 | 20 |
| Suining | 0.964 | 0.972 | 0.977 | 0.986 | 0.937 | 8 |
| Neijiang | 0.949 | 0.965 | 0.962 | 0.986 | 0.916 | 12 |
| Leshan | 0.964 | 0.979 | 0.976 | 0.988 | 0.945 | 6 |
| Nanchong | 0.962 | 0.971 | 1.000 | 0.962 | 0.934 | 9 |
| Meishan | 1.019 | 0.982 | 1.003 | 1.017 | 1.001 | 1 |
| Yibin | 0.955 | 0.971 | 0.961 | 0.994 | 0.927 | 10 |
| Guangan | 0.920 | 0.975 | 0.960 | 0.958 | 0.896 | 17 |
| Dazhou | 0.942 | 0.964 | 0.995 | 0.947 | 0.909 | 14 |
| Yaan | 1.004 | 0.973 | 1.269 | 0.791 | 0.977 | 2 |
| Bazhong | 0.937 | 0.975 | 1.061 | 0.883 | 0.914 | 13 |
| Ziyang | 0.944 | 0.982 | 0.973 | 0.970 | 0.927 | 10 |
| Ganzi | 0.882 | 0.969 | 1.000 | 0.882 | 0.855 | 19 |
| Liangshan | 1.005 | 0.966 | 1.126 | 0.893 | 0.971 | 3 |
| Mean | 0.951 | 0.972 | 0.996 | 0.954 | 0.925 | - |
Data source: Statistics of Cash Crops of the Department of Agriculture and Rural Affairs of Sichuan Province of the People’s Republic of China (2009–2020), calculated and sorted using DEAP2.1 software.
Table 6.
Temporal variation of total factor productivity of citrus in 20 citrus-growing cities and prefectures in Sichuan from 2009 to 2020.
Table 6.
Temporal variation of total factor productivity of citrus in 20 citrus-growing cities and prefectures in Sichuan from 2009 to 2020.
| 2009– 2010 | 2010– 2011 | 2011 –2012 | 2012- 2013 | 2013– 2014 | 2014–2015 | 2015– 2016 | 2016– 2017 | 2017– 2018 | 2018– 2019 | 2019– 2020 | |
|---|---|---|---|---|---|---|---|---|---|---|---|
| Chengdu | 0.927 | 1.018 | 0.867 | 1.017 | 0.439 | 0.91 | 1.204 | 1.502 | 0.951 | 1.088 | 1.014 |
| Zigong | 0.901 | 1.024 | 1.026 | 0.972 | 0.445 | 0.838 | 0.989 | 1.073 | 0.991 | 1.279 | 1.066 |
| Panzhihua | 0.901 | 0.859 | 0.904 | 0.923 | 0.739 | 0.789 | 0.889 | 0.915 | 1.068 | 1.039 | 1.007 |
| Luzhou | 0.916 | 1.055 | 1.077 | 1.178 | 0.534 | 0.955 | 0.996 | 0.903 | 1.004 | 1.058 | 1.079 |
| Deyang | 0.928 | 1.026 | 0.897 | 0.951 | 0.459 | 0.935 | 0.967 | 0.843 | 1.264 | 0.881 | 1.047 |
| Mianyang | 0.933 | 0.983 | 0.997 | 1.032 | 0.584 | 0.941 | 0.921 | 0.607 | 1.042 | 0.904 | 0.997 |
| Guangyuan | 0.955 | 0.971 | 0.996 | 0.942 | 0.459 | 0.827 | 0.942 | 0.811 | 0.972 | 1.086 | 0.545 |
| Suining | 0.938 | 1.093 | 1.014 | 0.956 | 0.517 | 0.878 | 0.947 | 1.070 | 1.077 | 1.031 | 0.965 |
| Neijiang | 0.984 | 1.065 | 1.102 | 0.968 | 0.449 | 0.799 | 0.954 | 0.978 | 0.998 | 1.009 | 1.009 |
| Leshan | 0.923 | 0.964 | 1.030 | 0.988 | 0.495 | 0.856 | 0.959 | 1.024 | 1.075 | 1.179 | 1.118 |
| Nanchong | 0.994 | 1.053 | 1.009 | 1.009 | 0.511 | 0.847 | 0.938 | 0.945 | 1.18 | 0.978 | 1.004 |
| Meishan | 0.949 | 1.035 | 1.013 | 0.971 | 0.624 | 0.913 | 0.993 | 1.402 | 1.009 | 1.311 | 1.003 |
| Yibin | 0.917 | 1.047 | 1.031 | 1.045 | 0.507 | 0.837 | 0.963 | 0.839 | 1.089 | 1.035 | 1.090 |
| Guangan | 0.937 | 0.974 | 1.025 | 1.097 | 0.405 | 0.847 | 0.978 | 0.907 | 0.993 | 1.023 | 0.945 |
| Dazhou | 0.952 | 0.961 | 0.935 | 1.148 | 1.000 | 0.849 | 0.990 | 0.921 | 0.945 | 0.946 | 1.012 |
| Yaan | 0.972 | 0.988 | 1.197 | 1.227 | 0.577 | 0.918 | 0.972 | 1.029 | 1.021 | 1.062 | 0.958 |
| Bazhong | 0.944 | 0.904 | 0.962 | 0.78 | 0.596 | 0.818 | 0.985 | 0.84 | 0.970 | 1.051 | 1.413 |
| Ziyang | 1.055 | 0.884 | 1.577 | 0.836 | 0.534 | 0.860 | 0.766 | 0.981 | 1.107 | 0.864 | 1.075 |
| Ganzi | 0.819 | 0.778 | 0.779 | 0.861 | 0.837 | 0.760 | 0.911 | 0.913 | 0.888 | 0.919 | 0.968 |
| Liangshan | 0.979 | 0.979 | 1.117 | 1.093 | 0.582 | 0.846 | 1.020 | 1.010 | 1.089 | 1.075 | 1.045 |
| Mean | 0.940 | 0.980 | 1.018 | 0.994 | 0.531 | 0.860 | 0.961 | 0.959 | 1.033 | 1.035 | 1.006 |
Data source: Statistics of Cash Crops of the Department of Agriculture and Rural Affairs of Sichuan Province of the People’s Republic of China (2009–2020), calculated and sorted using DEAP2.1 software.
Table 7.
Adjusted value of citrus input in each city and prefecture of Sichuan in 2020 (Unit: RMB/667 m2).
Table 7.
Adjusted value of citrus input in each city and prefecture of Sichuan in 2020 (Unit: RMB/667 m2).
| Area | Index of Inputs | ||
|---|---|---|---|
| Labor Cost Adjustment Value | Land Cost Adjustment Value | Adjustment Value of Pharmaceutical Fertilizer Cost | |
| Chengdu | −682.767 | −100.201 | −450.618 |
| Zigong | −339.495 | −77.961 | −474.266 |
| Panzhihua | −602.361 | −66.901 | −356.890 |
| Luzhou | −369.722 | −79.353 | −512.185 |
| Deyang | −566.581 | −89.407 | −505.003 |
| Mianyang | −501.285 | −104.317 | −616.166 |
| Guangyuan | −44.275 | −11.543 | −223.219 |
| Suining | −368.198 | −94.646 | −899.437 |
| Neijiang | −242.983 | −59.173 | −459.481 |
| Leshan | −351.588 | −82.955 | −475.245 |
| Nanchong | 0 | 0 | 0 |
| Meishan | 0 | 0 | 0 |
| Yibin | −294.281 | −71.756 | −481.311 |
| Guangan | −339.464 | −47.612 | −273.623 |
| Dazhou | −168.773 | −18.781 | −117.244 |
| Yaan | 0 | 0 | 0 |
| Bazhong | −50.192 | −12.966 | −353.184 |
| Ziyang | −266.253 | −23.198 | −140.989 |
| Ganzi | 0 | 0 | 0 |
| Liangshan | −115.535 | −15.066 | −98.553 |
Table 8.
Benchmark regression results.
| Variables | Regression (1) | Regression (2) |
|---|---|---|
| treat × time | 0.130 ** | 0.123 * |
| (2.029) | (1.813) | |
| lncre | −0.008 | |
| (−0.066) | ||
| lnpgdp | 0.182 | |
| (1.150) | ||
| lnfinance | −0.107 ** | |
| (−2.110) | ||
| lnlabor | −0.251 | |
| (−1.346) | ||
| lnindu | 1.068 *** | |
| (4.258) | ||
| _cons | −0.111 *** | −1.68 |
| (−7.047) | (−1.038) | |
| Individual fixed effects | yes | yes |
| Time fixed effects | yes | yes |
| R2 | 0.778 | 0.822 |
| N | 220 | 220 |
Note: the value in ( ) is t-statistics; *, **, and *** indicate the statistical significance at 10%, 5%, and 1% levels, respectively. Stata15.0 software estimated the regressions.
Table 9.
Counterfactual test results.
| Variables | Advance to 2013 | Advance to 2014 |
|---|---|---|
| treat × time | −0.057 | −0.114 |
| (−0.809) | (−1.348) | |
| lncre | −0.017 | −0.015 |
| (−0.131) | (−0.122) | |
| lnpgdp | 0.189 | 0.19 |
| (1.296) | (1.304) | |
| lnfinance | −0.095 * | −0.107 * |
| (−1.899) | (−1.954) | |
| lnlabor | −0.261 | −0.283 |
| (−1.382) | (−1.486) | |
| lnindu | 1.068 *** | 1.043 *** |
| (4.206) | (4.079) | |
| _cons | −1.708 | −1.71 |
| (−1.142) | (−1.142) | |
| Individual fixed effects | yes | yes |
| Time-fixed effect | yes | yes |
| R2 | 0.819 | 0.822 |
| N | 220 | 220 |
Note: the value in ( ) is t-statistics; *, **, and *** indicate the statistical significance at 10%, 5%, and 1% levels, respectively. Stata15.0 software estimated the regressions.
Disclaimer/Publisher’s Note: The statements, opinions and data contained in all publications are solely those of the individual author(s) and contributor(s) and not of MDPI and/or the editor(s). MDPI and/or the editor(s) disclaim responsibility for any injury to people or property resulting from any ideas, methods, instructions or products referred to in the content. |
© 2023 by the authors. Licensee MDPI, Basel, Switzerland. This article is an open access article distributed under the terms and conditions of the Creative Commons Attribution (CC BY) license (https://creativecommons.org/licenses/by/4.0/).
Share and Cite
MDPI and ACS Style
He, Y.; Chen, W. Evaluation of Sustainable Development Policy of Sichuan Citrus Industry in China Based on DEA–Malmquist Index and DID Model. Sustainability 2023, 15, 4260. https://doi.org/10.3390/su15054260
AMA Style
He Y, Chen W. Evaluation of Sustainable Development Policy of Sichuan Citrus Industry in China Based on DEA–Malmquist Index and DID Model. Sustainability. 2023; 15(5):4260. https://doi.org/10.3390/su15054260
Chicago/Turabian StyleHe, Yu, and Wenkuan Chen. 2023. "Evaluation of Sustainable Development Policy of Sichuan Citrus Industry in China Based on DEA–Malmquist Index and DID Model" Sustainability 15, no. 5: 4260. https://doi.org/10.3390/su15054260
Note that from the first issue of 2016, this journal uses article numbers instead of page numbers. See further details here.