Article

Sustainable Utilization of Machine-Vision-Technique-Based Algorithm in Objective Evaluation of Confocal Microscope Images

1
Mechatronics Engineering Department, Engineering College, University of Mosul, Mosul 00964, Iraq
2
College of Science for Women, University of Baghdad, Baghdad 10071, Iraq
3
Information Technology Center, University of Technology, Baghdad 10066, Iraq
4
Mechanical Engineering Department, Engineering College, Tikrit University, Tikrit 34001, Iraq
5
Plant Protection Department, University of Baghdad, Baghdad 10071, Iraq
*
Author to whom correspondence should be addressed.
Sustainability 2023, 15(4), 3726; https://doi.org/10.3390/su15043726
Submission received: 29 December 2022 / Revised: 15 February 2023 / Accepted: 15 February 2023 / Published: 17 February 2023

Abstract

:
Confocal microscope imaging has become popular in biotechnology labs. Confocal imaging technology utilizes fluorescence optics, where laser light is focused onto a specific spot at a defined depth in the sample. A considerable number of images are produced regularly during the process of research. These images require methods of unbiased quantification to have meaningful analyses. Increasing efforts to tie reimbursement to outcomes will likely increase the need for objective data in analyzing confocal microscope images in the coming years. Utilizing visual quantification methods to quantify confocal images with naked human eyes is an essential but often underreported outcome measure due to the time required for manual counting and estimation. The current method (visual quantification methods) of image quantification is time-consuming and cumbersome, and manual measurement is imprecise because of the natural differences among human eyes’ abilities. Subsequently, objective outcome evaluation can obviate the drawbacks of the current methods and facilitate recording for documenting function and research purposes. To achieve a fast and valuable objective estimation of fluorescence in each image, an algorithm was designed based on machine vision techniques to extract the targeted objects in images that resulted from confocal images and then estimate the covered area to produce a percentage value similar to the outcome of the current method and is predicted to contribute to sustainable biotechnology image analyses by reducing time and labor consumption. The results show strong evidence that t-designed objective algorithm evaluations can replace the current method of manual and visual quantification methods to the extent that the Intraclass Correlation Coefficient (ICC) is 0.9.

1. Introduction

The revolutionary technique of confocal microscopy is considered one of the most useful optical imaging techniques in Biotechnology. It utilizes point illumination through a spatial pinhole to avoid out-of-focus signals [1]. The technique is based on a laser that provides the excitation light to produce fluorescence with high intensities from the focal spot. In vitro and ex vivo samples are analyzed by Fluorescence confocal microscopy (FCM) in biotechnology laboratories globally. Some of the advantages of FCM include higher optical resolution with better contrast in the live image of a sample and the possibility of reconstruction of a 3D image. One of the particularly important uses of FCM is the demonstration of co-localization of two endogenous varicolored labeled proteins intracellularly [1,2].
FCM imaging is an addition to the biotechnology research field, but analyzing a large number of images that are resulted from each experiment remains challenging. Accurate subcellular object segmentation is very important in image analysis. For instance, it is required to quantify and characterize different parameters associated with tiny organelles in the cell and to set very high requirements for the accuracy of analysis of the image in order to correctly interpret cellular phenotypes [3]. In addition, images containing cellular structures that are obtained using FCM require accurate detection to help analyze accurately [4,5]. FCM allows determining the concentration of adsorbed protein perfectly within a stationary phase particle as long as proteins are labeled with a fluorescent probe [6]. Fluorescent labeling of specific cellular structures is a revolutionary advancement in cell imaging technology as it enables automation in the image acquisition of tiny subcellular objects [7,8].
With the popularity of imaging throughput and the huge amount of data acquired in biotechnology laboratories, the challenge of analyzing images and interpreting collected information has to be moved from visual interpretation to more automated methods. Previously, an assay was developed involving transient expression in Nicotiana benthamiana utilizing FCM. A reporter protein labeled with Green Fluorescent Protein (GFP) was used to detect the silencing suppression activity of viral protein P6 of the cauliflower mosaic virus (CaMV) [9]. However, the assay can be used to detect a wide range of silencing suppressor proteins from any pathogens. In the assay, a simple visual method was used to analyze FCM images acquired from each test. The method is dependent on the vision of human workers to determine the spatial distribution of the green or red fluorescent protein. Utilizing visual quantification methods to quantify confocal images with naked human eyes is the standard approach to estimating the spatial distribution of fluorescence in images resulting from the confocal microscope imaging system. Visual quantification of the spatial distribution method of pathogen silencing suppressor functions is remarkably reproducible [9]. This method provides fast and conventional measures. However, the drawback of this approach is that it is very time-consuming when the number of images acquired is too high. Moreover, the natural differences between the two workers’ visions make the visual assessment less accurate. In this context, automated object classification and detection in images become critical.
Various image processing techniques have been used to improve biotechnology imaging. For example, autofluorescence from untargeted components contributes to noise, so denoising steps are important to interpret results accurately [10]. Several algorithms have already been proposed to solve different issues in automated image analyses. Among these algorithms is the Feature Point Detection algorithm, which discriminates non-particles and detects percentile [4]. There is also an h-dome detection algorithm that filters h-dome morphology [11], a Kernel Method algorithm that estimates Kernel density with a family of kernels [12], a Sub-Pixel Localization algorithm that fits Gaussian kernels to focal intensity maxima [5], a Local Comparison algorithm that maximizes between direction-specific convolutions of image [13], Morphometry algorithm [13], Top-Hat Filtering algorithm that filters top-hat and entropy-based thresholding [14], Multiscale wavelets that estimate wavelets coefficients of the multiscale product [15], and Source Extractor algorithm that applies convolution for background clipped image [16]. However, most of the above-mentioned algorithms are not suitable for accurate assessment of the spatial distribution of a mix of fluorescent proteins in the same image as they suffer from major drawbacks, including false detection of noise that could affect the interpretation of the results.
In this work, a novel image processing algorithm is presented to analyze FCM images by assessing the spatial distribution of a mix of fluorescent proteins in a sustainable way that decreases the time and resources required to visually analyze FCM images. The proposed work also identified the series of specific denoising steps for the image. The steps used in image processing to analyze the spatial distribution of protein aggregates in biological samples have not been reported previously. The dataset used in this work was obtained from our previous work [9]. The FCM images were captured at varying time points.

2. Materials and Methods

Utilizing visual quantification methods to quantify confocal images with naked human eyes is the standard approach to evaluate an experimental outcome by fluorescence quantification in images. Visual quantification of the spatial distribution method of pathogen silencing suppressor functions is remarkably reproducible [9]. This method provides fast and conventional measures. Hence, the main objective is to mechanize the visual quantification of the spatial distribution method described in [9]. An intelligent system that is supported by machine vision techniques was designed to achieve this objective. Fundamentally, this section starts with a brief description of the visual quantification of the spatial distribution method, then the intelligent system and the utilized machine vision techniques are discussed in detail.

2.1. Visual Quantification of Spatial Distribution Method

After acquisition from the confocal microscope, images must be saved as a TIFF or JPEG file. Each individual image was inserted into a PowerPoint slide, and the size of the image was adjusted to fill the entire slide. In order to analyze the spatial distribution of fluorescence in each image, a grid of 100 squares was drawn on a separate PowerPoint slide. This grid was copied and overlaid onto each image. Figure 1 illustrates the results at one time point for leaves infiltrated with GFP alone, as well as leaves infiltrated with MP-GFP and P6-RFP [9]. The number of grids that contain a GFP or RFP signal was counted and expressed as a percentage of 100. The subjective evaluation was performed by dividing the image into a mesh of 100 parts and then finding the total number of colored regions. This number represents the outcome of the experiments.

2.2. Intelligent Machine Spatial Distribution Quantification System

Because such subjective evaluation is time-consuming, an alternative evaluation method based on only objective factors is required for objective evaluation. To this end, this work aimed to investigate the extent to which subjective evaluation results can be approximated using machine vision techniques. The Leica model TCP SP8 MP is an inverted spectral confocal microscope with fixed visible laser lines (405–514 nm), tunable white light laser (470–670 nm), three HyD and two PMT detectors, a resonant scanner, and Mai Tai DeepSee multiphoton laser tunable to 680–1060 nm for deep tissue imaging. The confocal microscope images are produced from the Leica model TCP SP8 MP, but any other model with similar features should give a similar image.
The confocal microscope output images are differed based on the number of channels, filters, etc. As can be inferred from Figure 2, images have a great diversity of processing perspectives. This, in turn, provides a challenging opportunity for artificial intelligence to be part of the processing system. Consequently, the designed intelligent machine spatial distribution quantification system starts with an intelligent selector. The intelligent selector is responsible for activating the appropriate processing algorithm to extract the spatial distribution of red and green colors as a percentage. The system’s main parts are shown in Figure 3 and discussed accordingly.

2.3. Intelligent Selector

The complexity of the confocal microscope output images leads to the process of the images in three different algorithms based on color and object size in the image. It is difficult to select a suitable algorithm for a specific confocal microscope image. This motivates the design of an accurate, intelligent selector proficient at achieving smart selection. The complete procedure for analyzing images is shown in Figure 3. The images are imported into MATLAB as a three-dimensional (3D) matrix of dimension J × K × 3. The third dimension of the matrix is designated for every color. Red (R), green (G), and blue (B) are the color channels. J × K are the number of pixels in the image, where J points to the row and K to the column. Value in pixels of each channel ranges from 0 to 255, where 0 demonstrates the nonappearance of transmission of color intensity and 255 shows total transmission of that color intensity. The intensity mean of every color may represent the color distribution in the image; however, this is not always true. Hence the raw images without any filter, in some cases, produce red or green colors with very high intensity. Consequently, this misleads the system to activate the wrong algorithm. Therefore, it is essential to study and design the intelligent selector wisely. The start was to collect the data on the total mean of each color channel and the selected algorithm based on the average of three experts’ opinions (the three experts are three researchers who work actively with confocal microscopy experiments implementation and analysis). Figure 4 shows the mean opinion with R, G, and B means for the collected 100 confocal microscope images. Class 1 is represented by an integer one value and means the red channel filtered algorithm is activated. Class 2 is represented by an integer 15 value, which means the green channel filtered algorithm is activated. Class 3 is represented by an integer 30 value to indicate the actual image algorithm is activated. Points in Figure 4 are difficult to classify as many out-layer points exist. To solve this challenge, a novel multiclass adaptive neuro-fuzzy classifier was designed and implemented for fast and accurate classification to work as the core of the intelligent selector.
The multiclass adaptive neuro-fuzzy classifier (MANFC) is designed based on the dataset in Figure 4. The features extracted by filtering and averaging of green, red, and blue color calculation blocks in Figure 3 are fed to the classifier. The adaptive neuro-fuzzy model has been developed to implement multiclass. A MANFC-based structure that combines the superiorities of the fuzzy membership output layer in classification with the capabilities of neuro-fuzzy models in handling uncertainties. A fuzzy membership output layer provides class selection certainty in addition to class selection. Two-sided symmetrical triangular membership functions were considered in planning to improve the generalization and non-stationarity, taking care of the system’s capability. Hybrid-based learning algorithm [17] was implied to investigate the knowledge contained in the training data. All layers were utilized during the training procedure, and only the fuzzy membership output layer was applied for estimating the class label. Figure 5 shows the designed adaptive neuro-fuzzy single output structure without the fuzzy membership output layer implied to investigate the knowledge content in training data. All layers were utilized during the training procedure, and only the fuzzy membership output layer was applied for estimating the class label. Figure 5 shows the designed adaptive Neuro-Fuzzy single output structure without the Fuzzy membership output layer.
By giving X as the input vector (R-mean, G-mean, B-mean) and l ∈ (1, 2, 3) as the corresponding class label, the input and class vectors are sequentially presented to the system. Layer 1 transfers the input vector to the next layer. Layer 2 implies four two-sided symmetrical triangular membership functions to the input vector as depicted in Figure 6.
The nodes in Layer 3 (rules layer) provide what is known as firing strength, which is the AND operation of fuzzy membership in all dimensions. The node i of Layer 4 takes the ratio of the ith rule’s firing strength to the sum of all rule’s firing strengths. For that reason, the outputs of this layer represent the normalized firing strength. The single fixed node in Layer 5 computes the overall output by summing all coming signals from the previous layer. Consequently, the process of defuzzification is achieved by obtaining a crisp overall output. For a multiclass problem, the final layer is the fuzzy membership output layer that uses the membership function shown in Figure 6 to select one of the three classes called the fuzzy membership classifier.

2.4. Intelligent Machine Spatial Distribution Quantification Algorithm (IMSDQA)

The three IMSDQAs have many common processing units; however, they are initiated with a dedicated preprocessing unit. The common processing units are based on machine vision techniques. Machine vision is a field that includes making a machine “see”. The intelligent selector output activates one of the three intelligent machine spatial distribution quantification-filtered algorithms. This innovation utilizes a camera and PC rather than the natural eye to distinguish, track, and measure focuses for additional picture handling. With the improvement of PC vision, such innovation has been generally utilized in farming mechanization and assumes a critical part in its events [18].
The intelligent machine spatial distribution quantification filtered algorithm starts with subtracting the objects in the image from the background by replacing all values above a globally determined threshold with 1 s and setting the rest values to 0 s. The globally specified threshold is selected based on Otsu’s method. Otsu’s method chooses the threshold value using a 256-bin image histogram [19]. Next, the Binary image is subdivided into 100 sub-images. Subsequently, the process of every sub-image finds if there is any portion of the object or not. If there is any, it is counted to end after all the 100 sub-images are processed. This way, the maximum counter number is 100, which means it fully covers hundred percent. Finally, the algorithm’s output is the total number of sub-images with or even part of an object. The flow chart and Pseudo code are shown in Figure 7 and Figure 8. In order to clarify the algorithm and the difference in preprocessing of the three algorithms, the algorithm was applied to the three types of processed confocal images. In Figure 9, the red and green channel confocal microscope images are started directly to phase 1. In contrast, the actual confocal microscope image is preprocessed to filter out two images, pure red and pure green, then processed as in Figure 7. In addition, Figure 9 shows the four main processing phases applied to the three types of confocal images with the modification effect of every phase.

3. Results

The intelligent machine spatial distribution quantification system is tested with collected data from 100 confocal microscope images of three types, as depicted in Table 1.
The data collection is designed to provide three expert readings to compare them with the reading of the system of every image type, besides the experts’ opinion about the image type to train and test the intelligent selector. The raters choose the image class from three types; red channel FCM (1), green channel FCM (2), and actual FCM (3). Table 2 shows samples of the data collection.
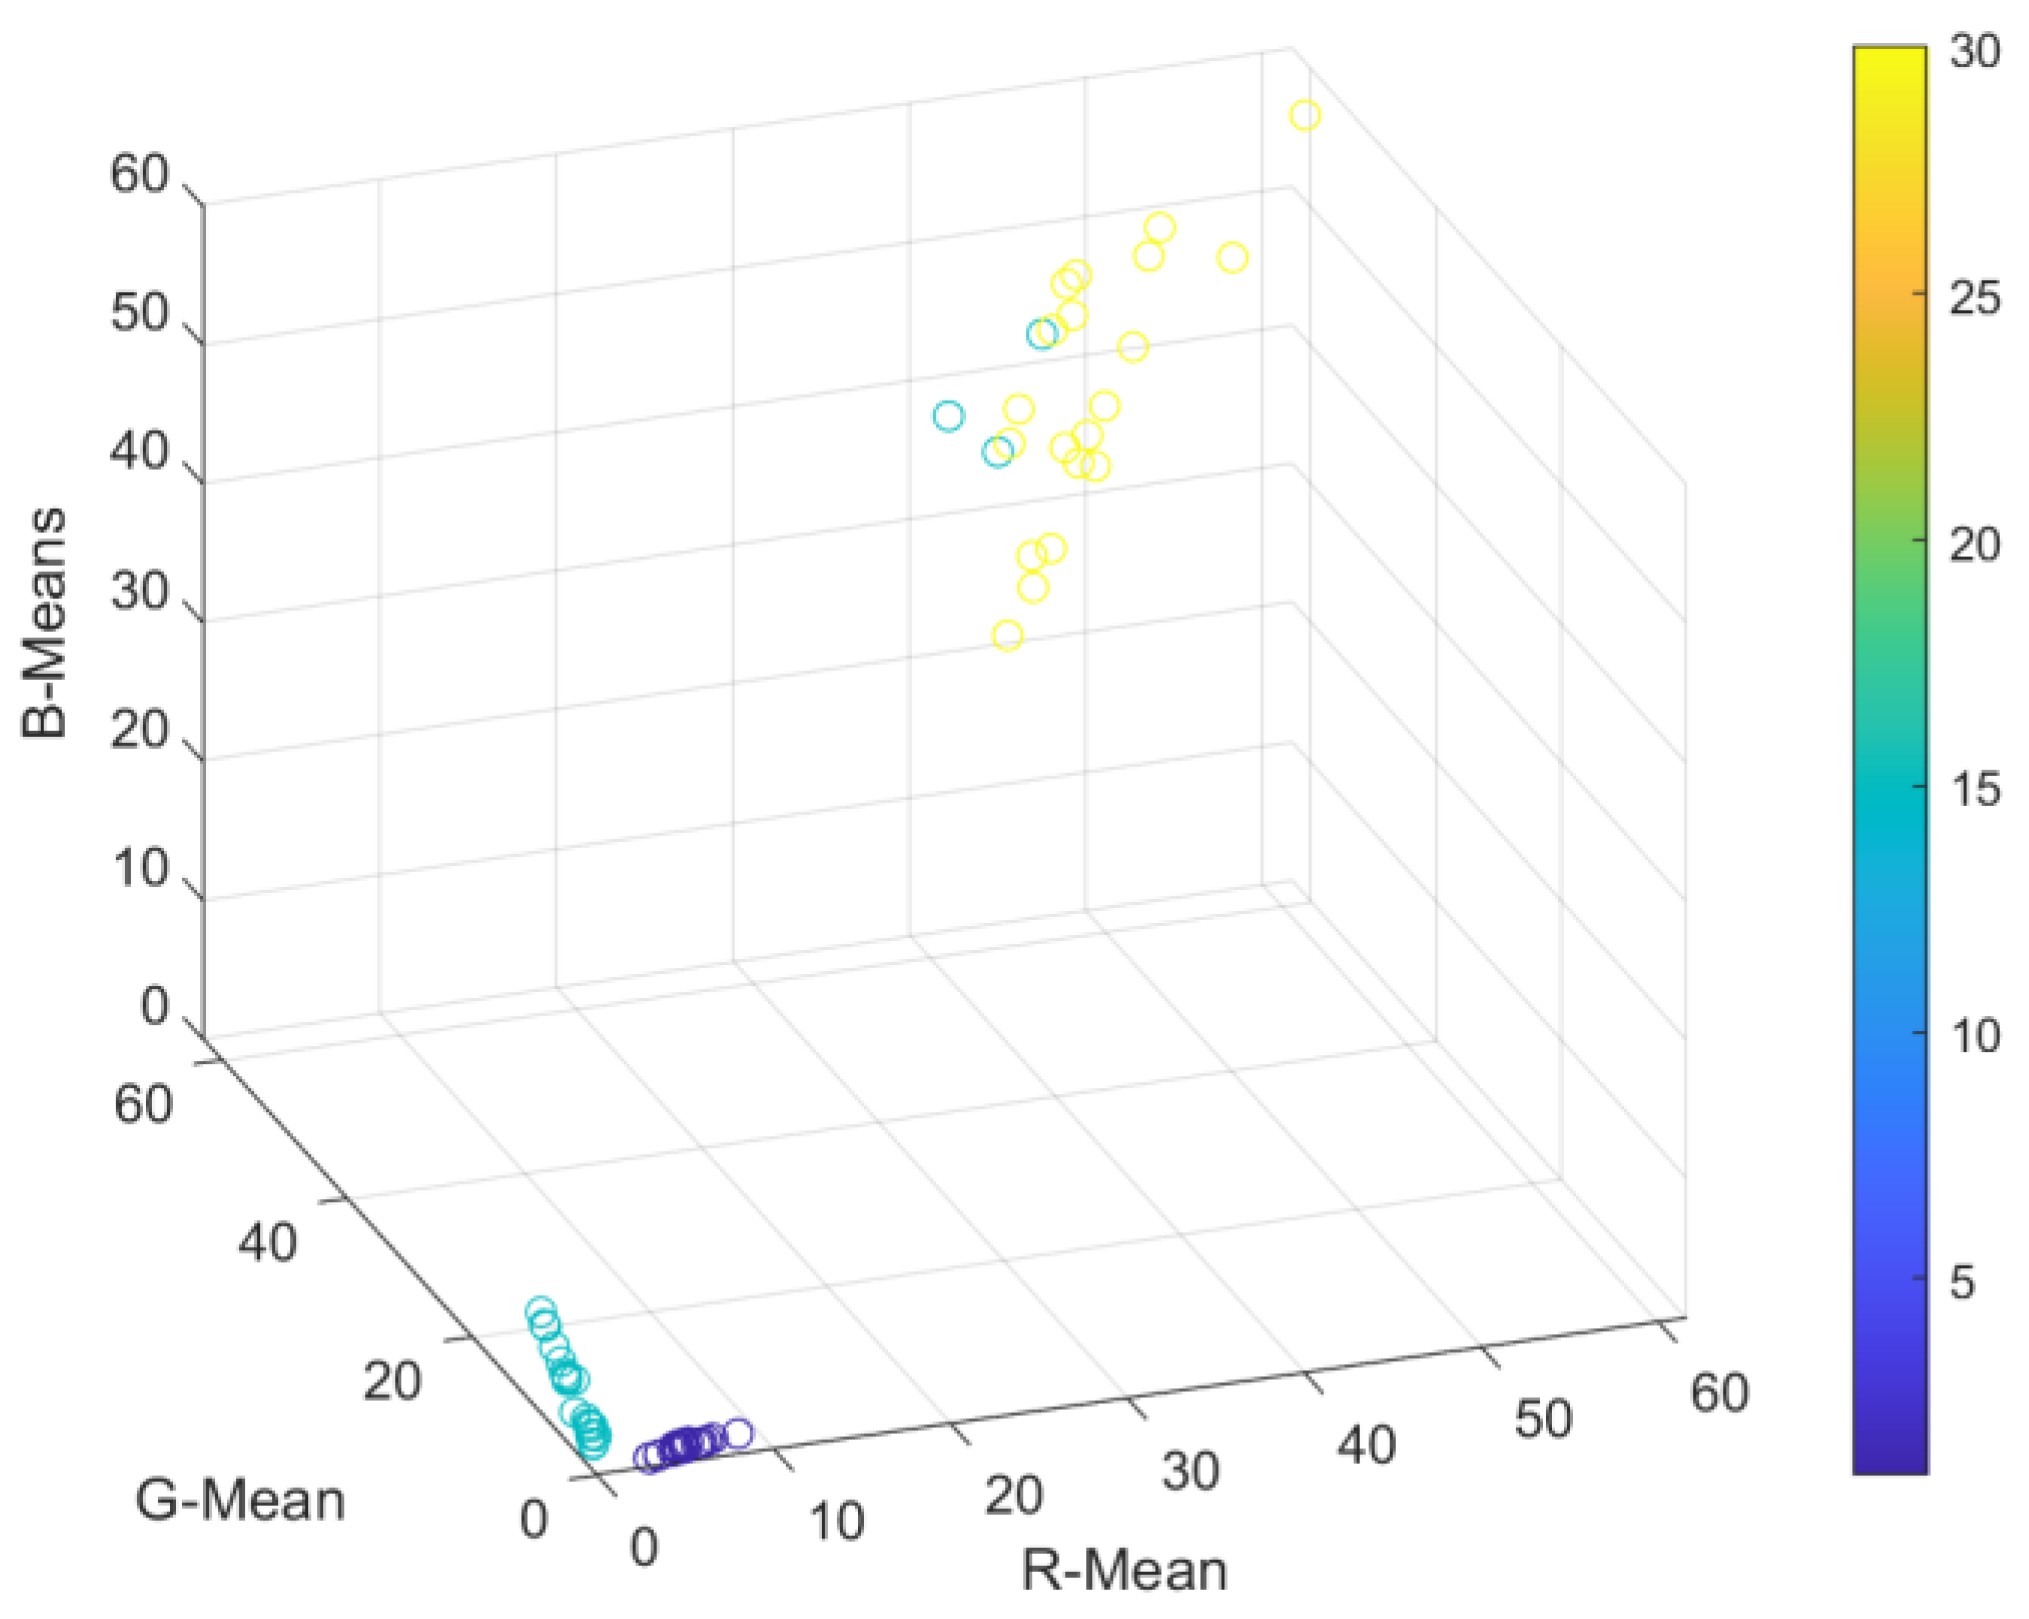
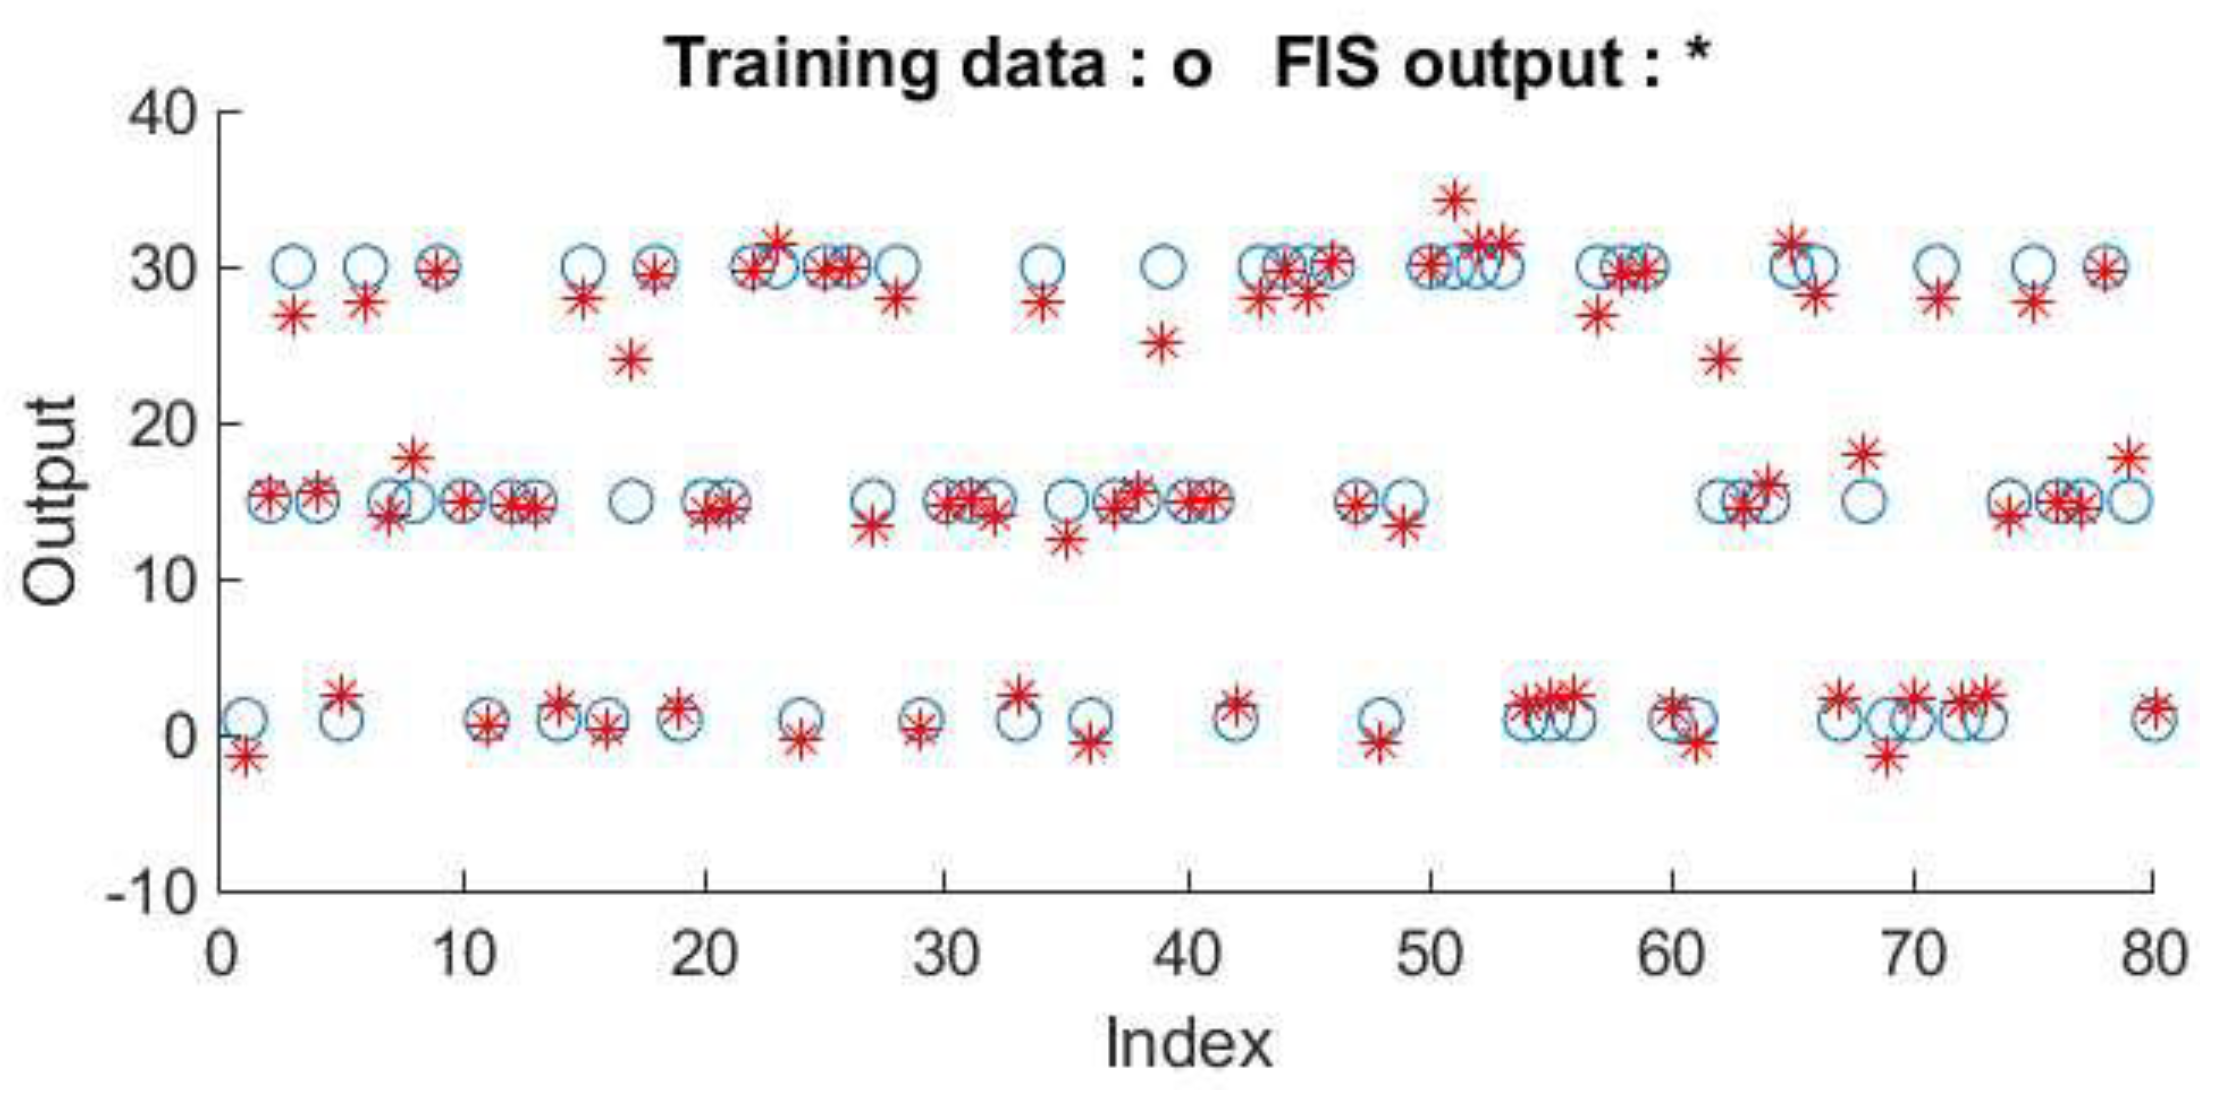
The four-fold technique is used to train the adaptive neuro-fuzzy system while keeping 20% of the dataset for an accurate system evaluation. The average of raters’ opinions about the image class is used as a label to train and test the intelligent selector. Hence the adaptive neuro-fuzzy system architecture has one output with integer values. Classes are labeled as follows: class (1) with (1), class (2) with (15), and class (3) with (30). The system is then trained to the integer values, and Figure 10 clearly shows the training dataset with the system output after training is passed.
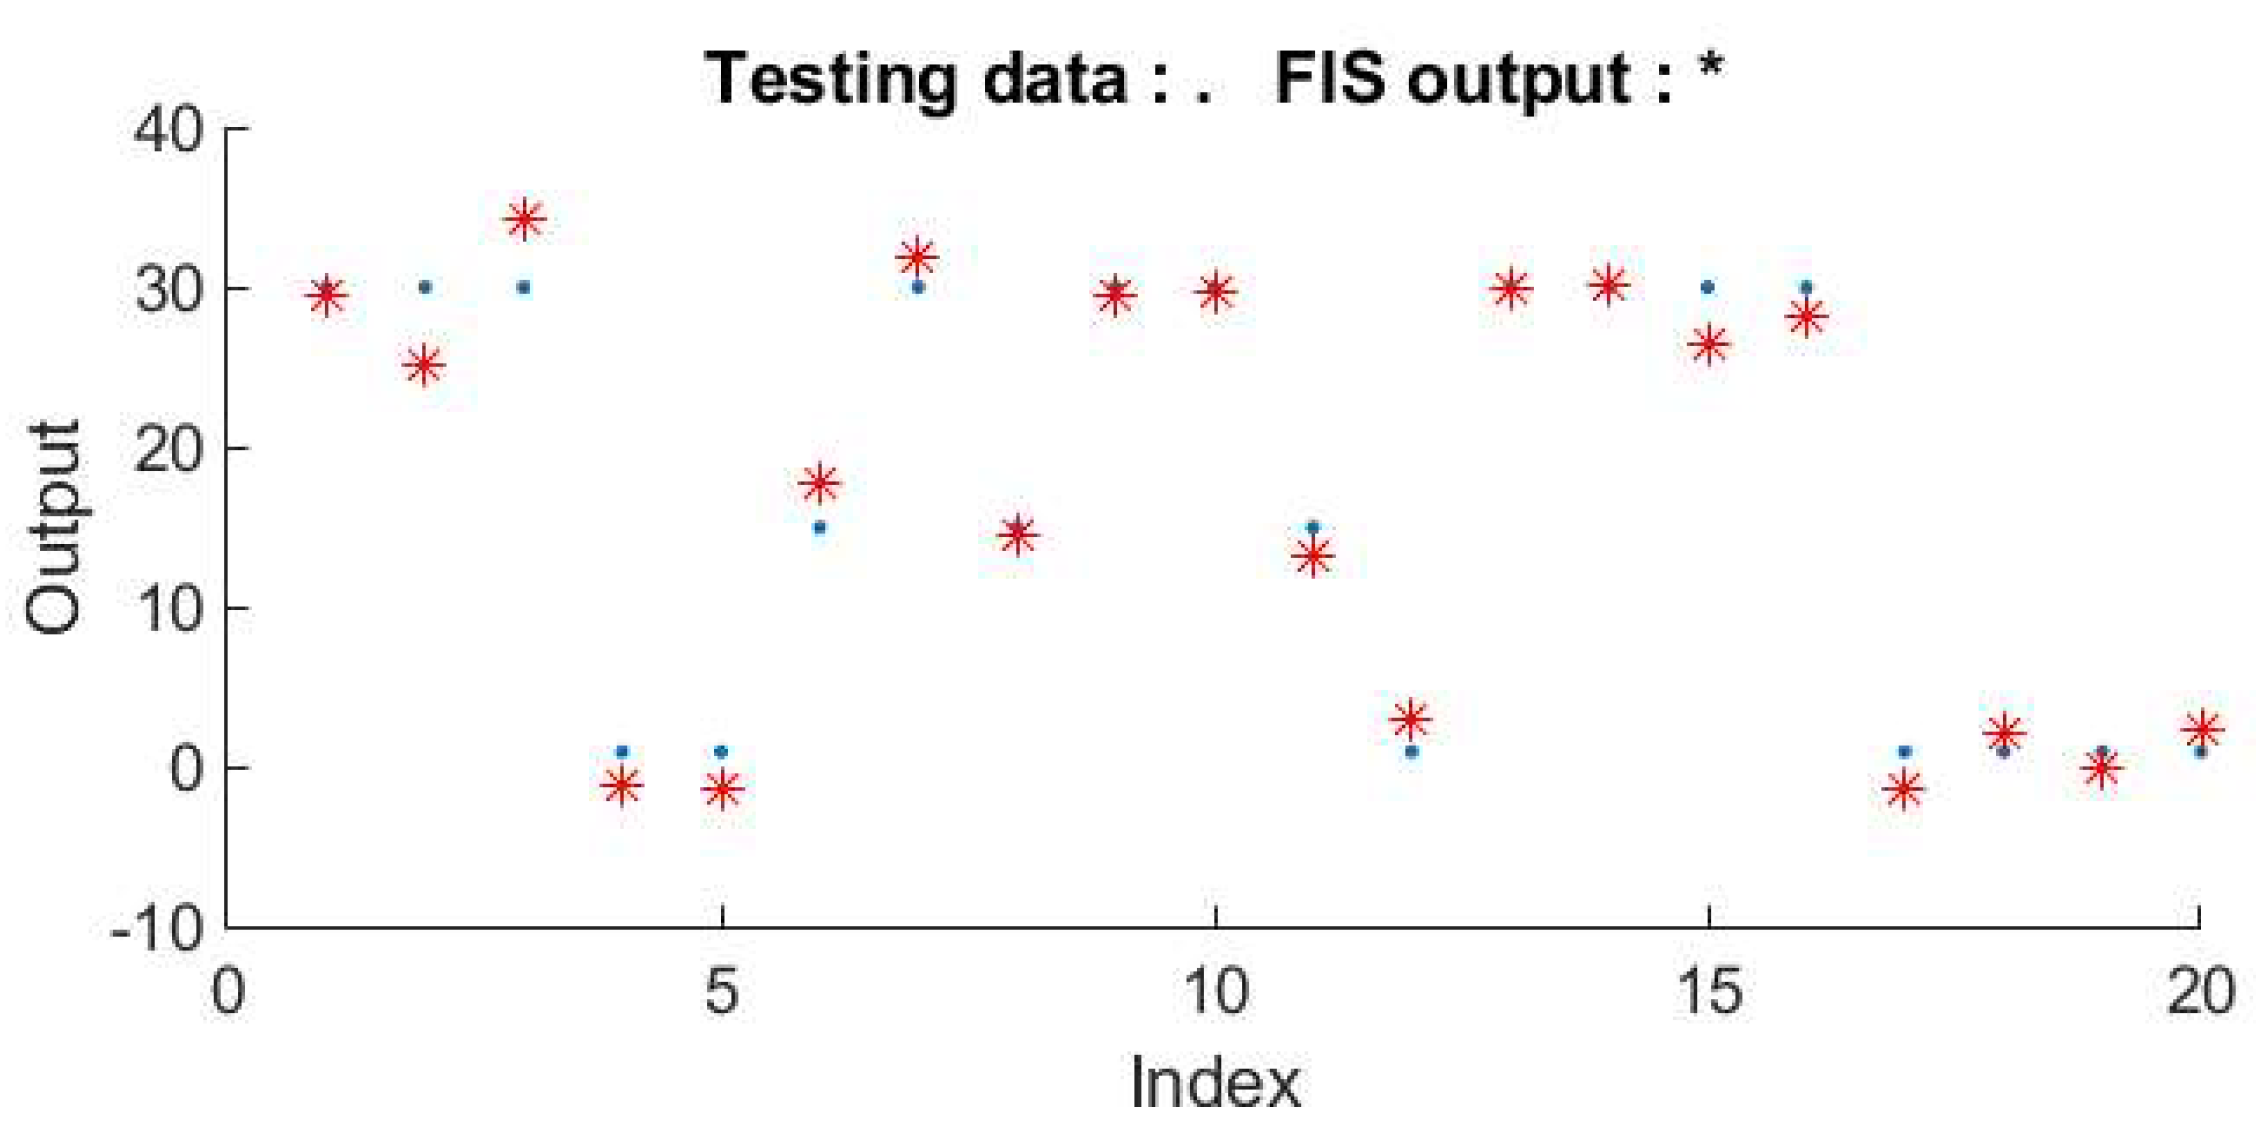
The adaptive neuro-fuzzy system is tested with 20 new samples never seen before to make an unbiased decision about the system’s performance. The results, as seen in Figure 11, prove that the performance of tracking the right classes is achieved in the testing samples and can be achieved when the system deals with new samples other than any of the 100 collected samples.
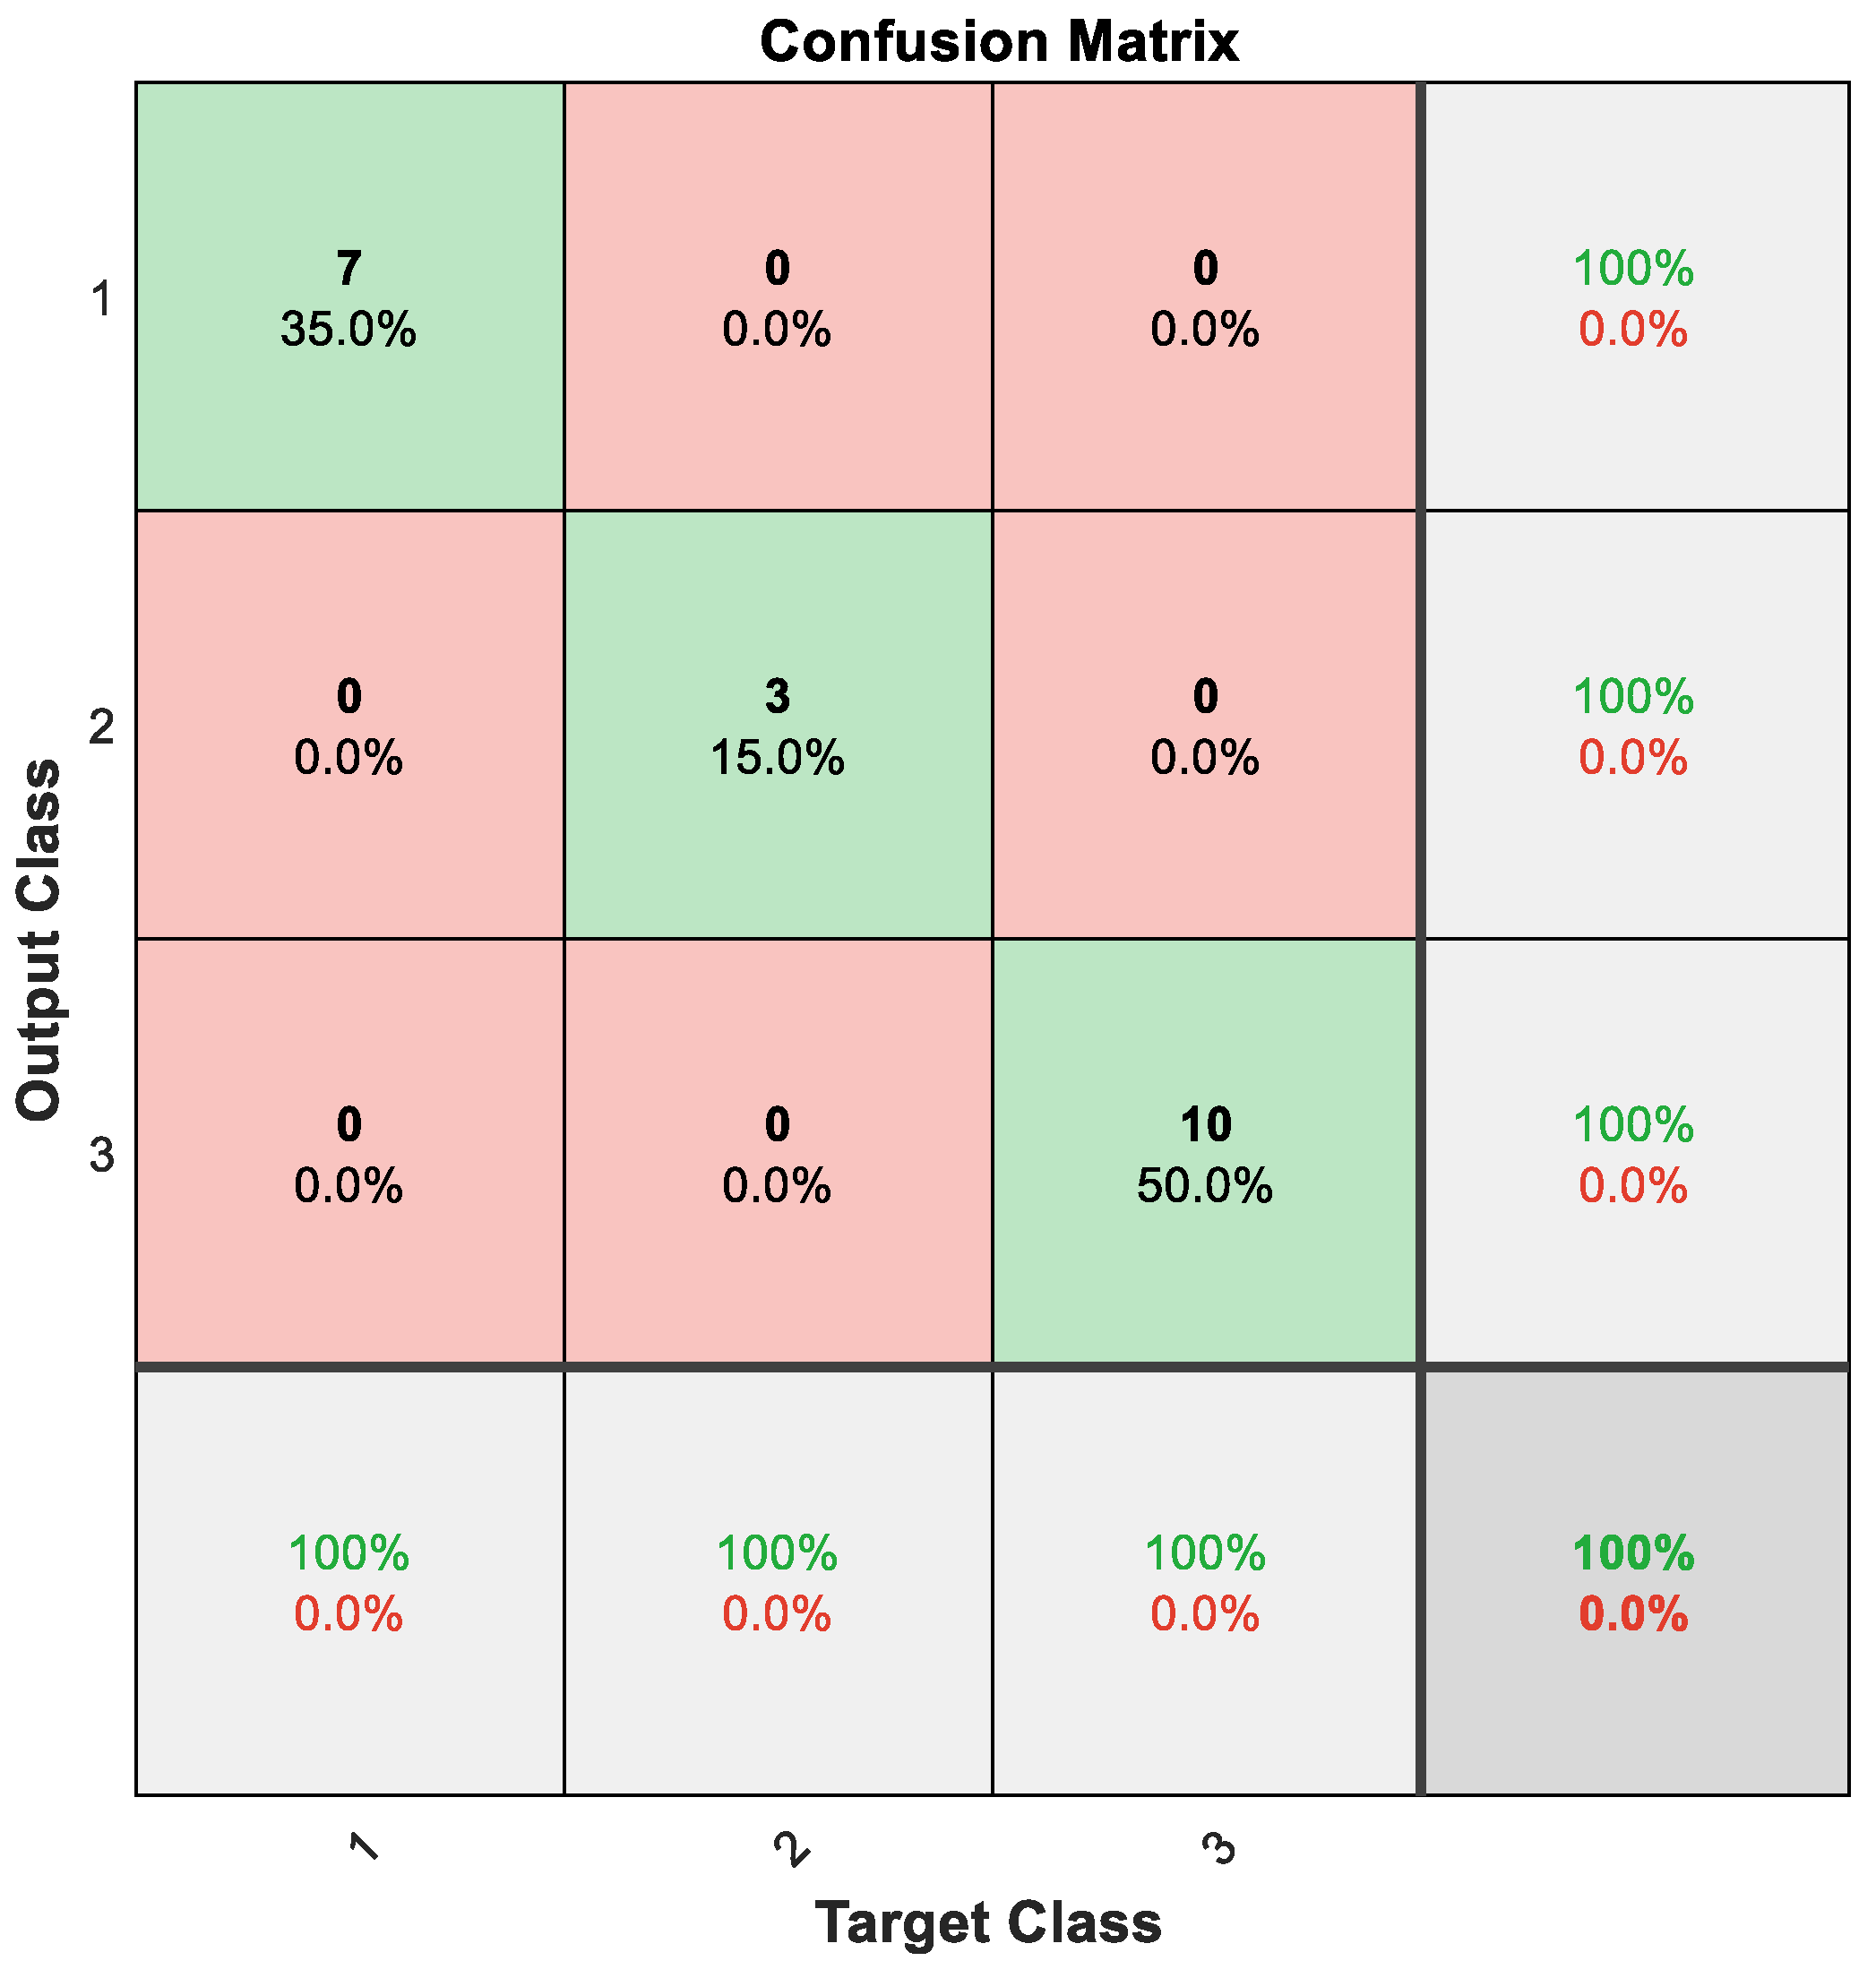
The system tracking ability is high enough to achieve high accuracy in the output fuzzy membership layer. The classification accuracy is 100% in total and 100% for each class, as seen from the confusion matrix in Figure 12. Accordingly, the intelligent selector works perfectly in activating the suitable algorithm for the FCM image.
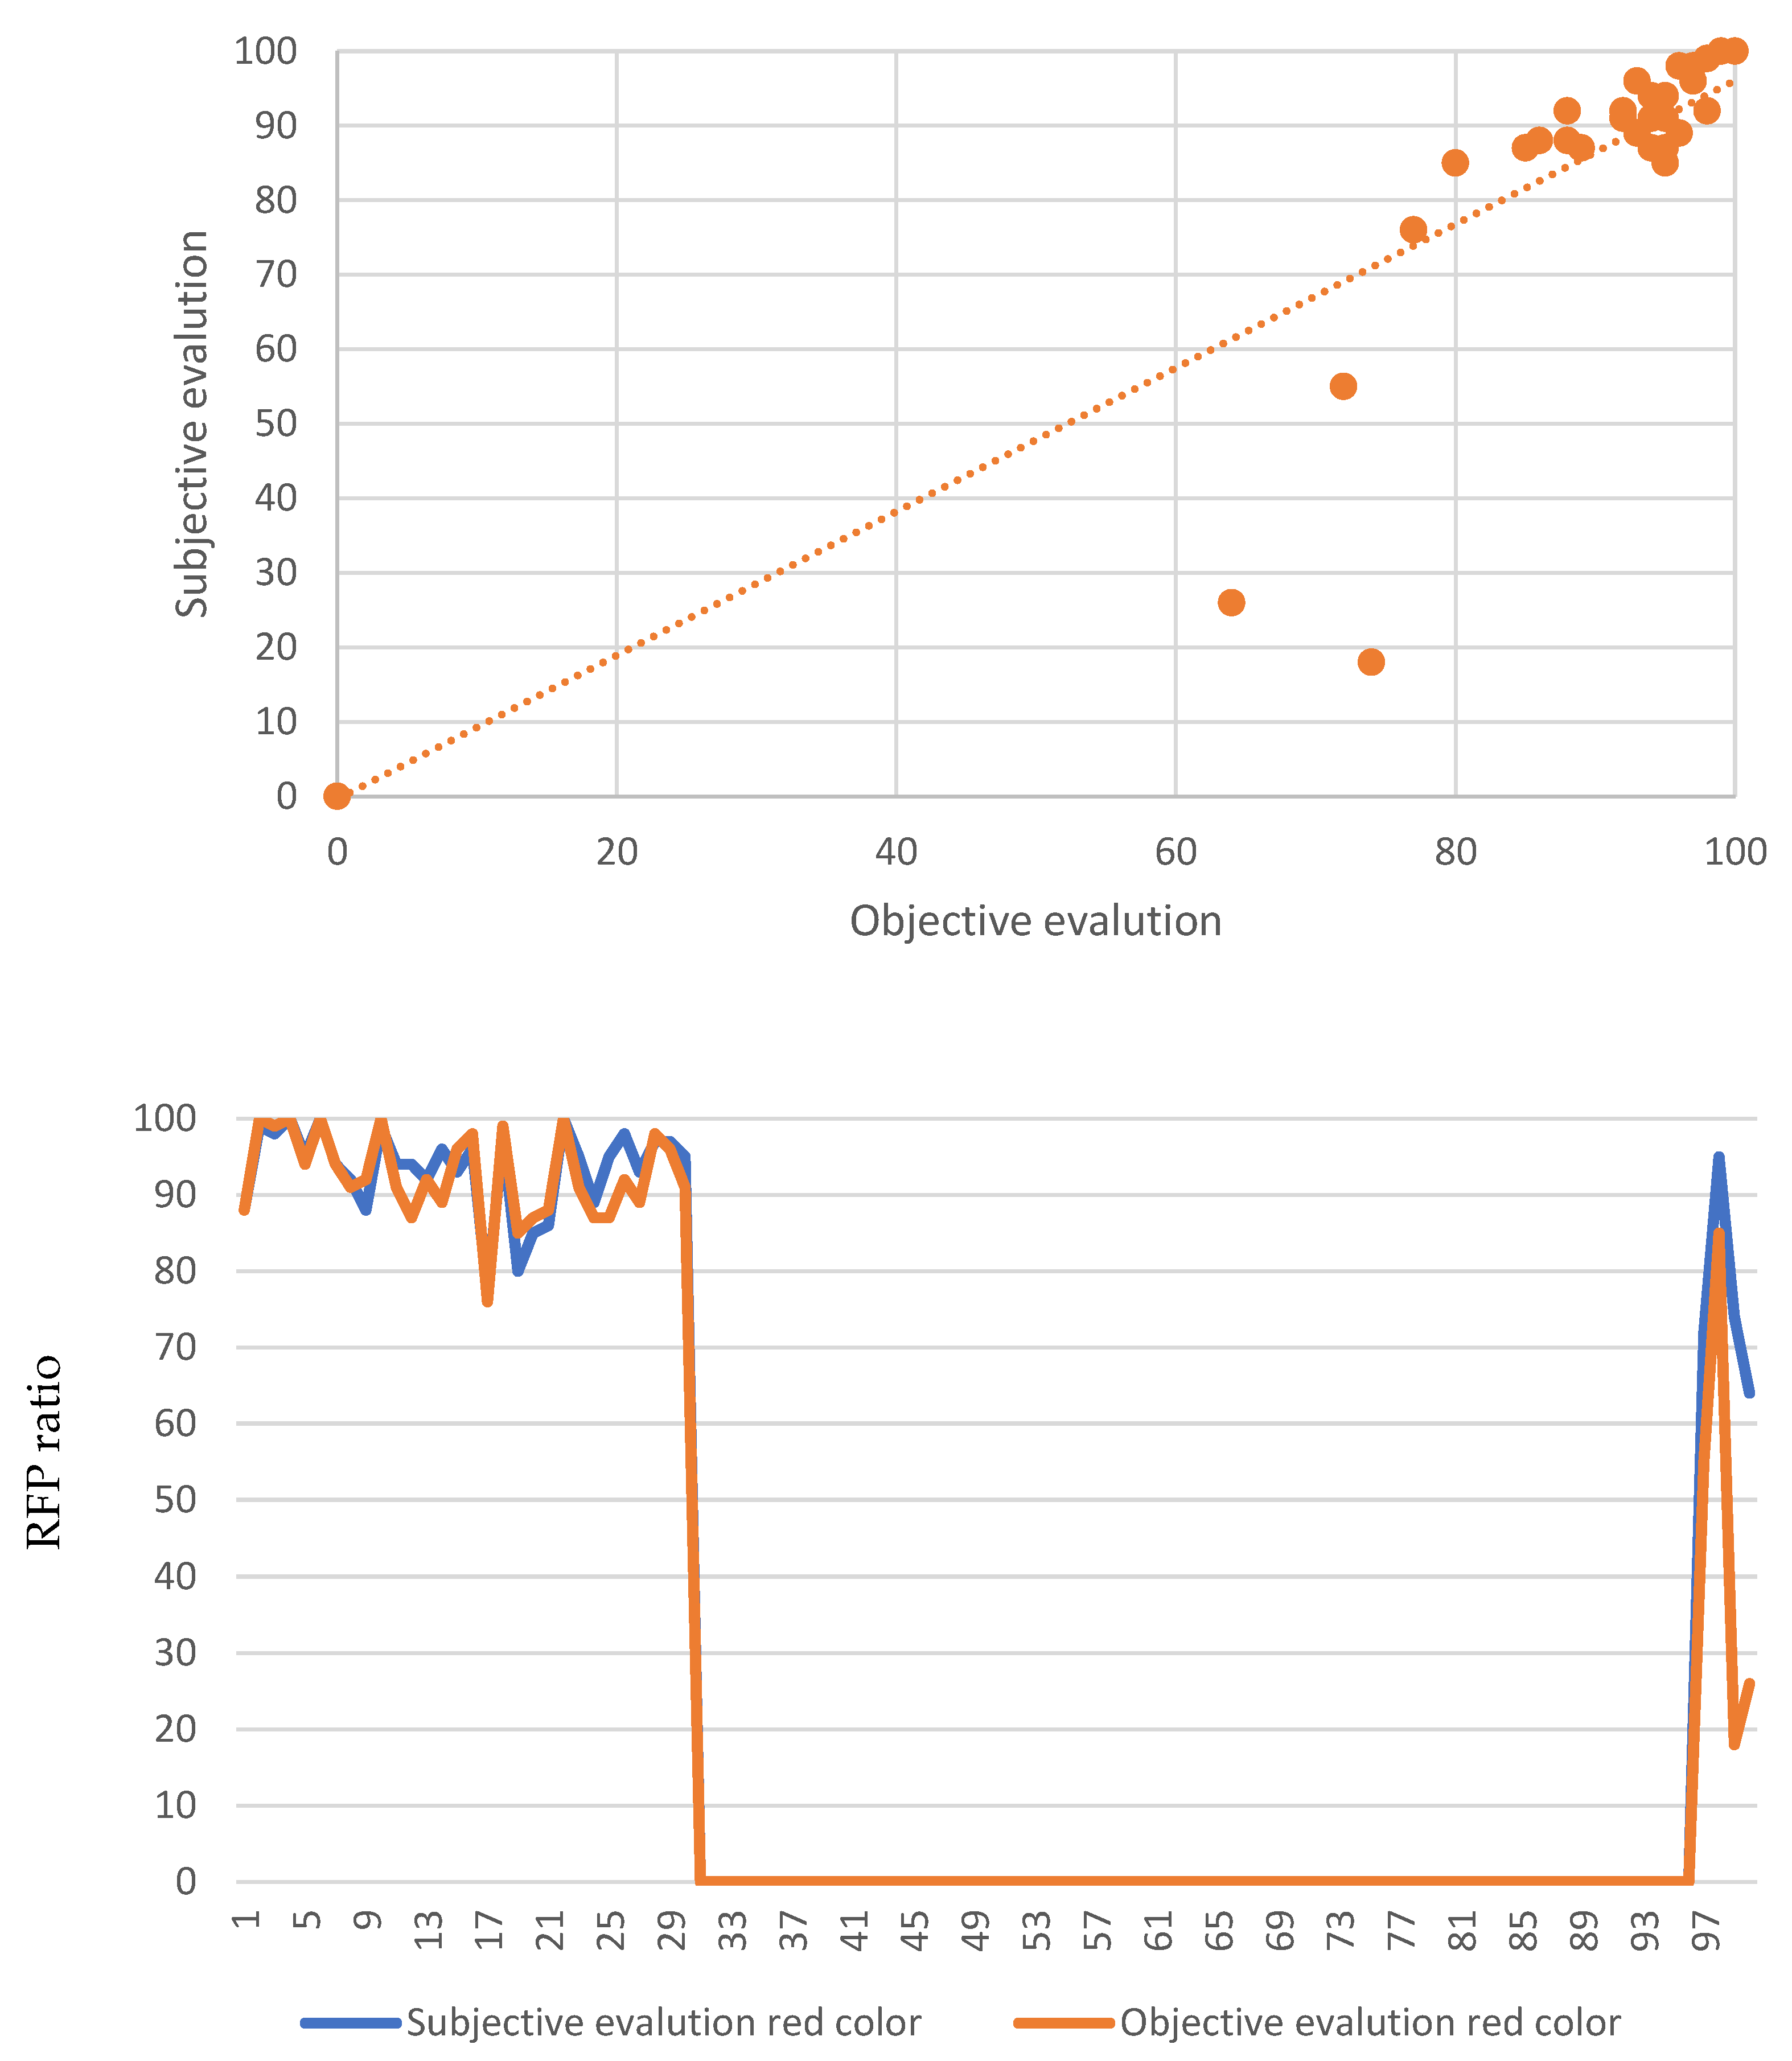
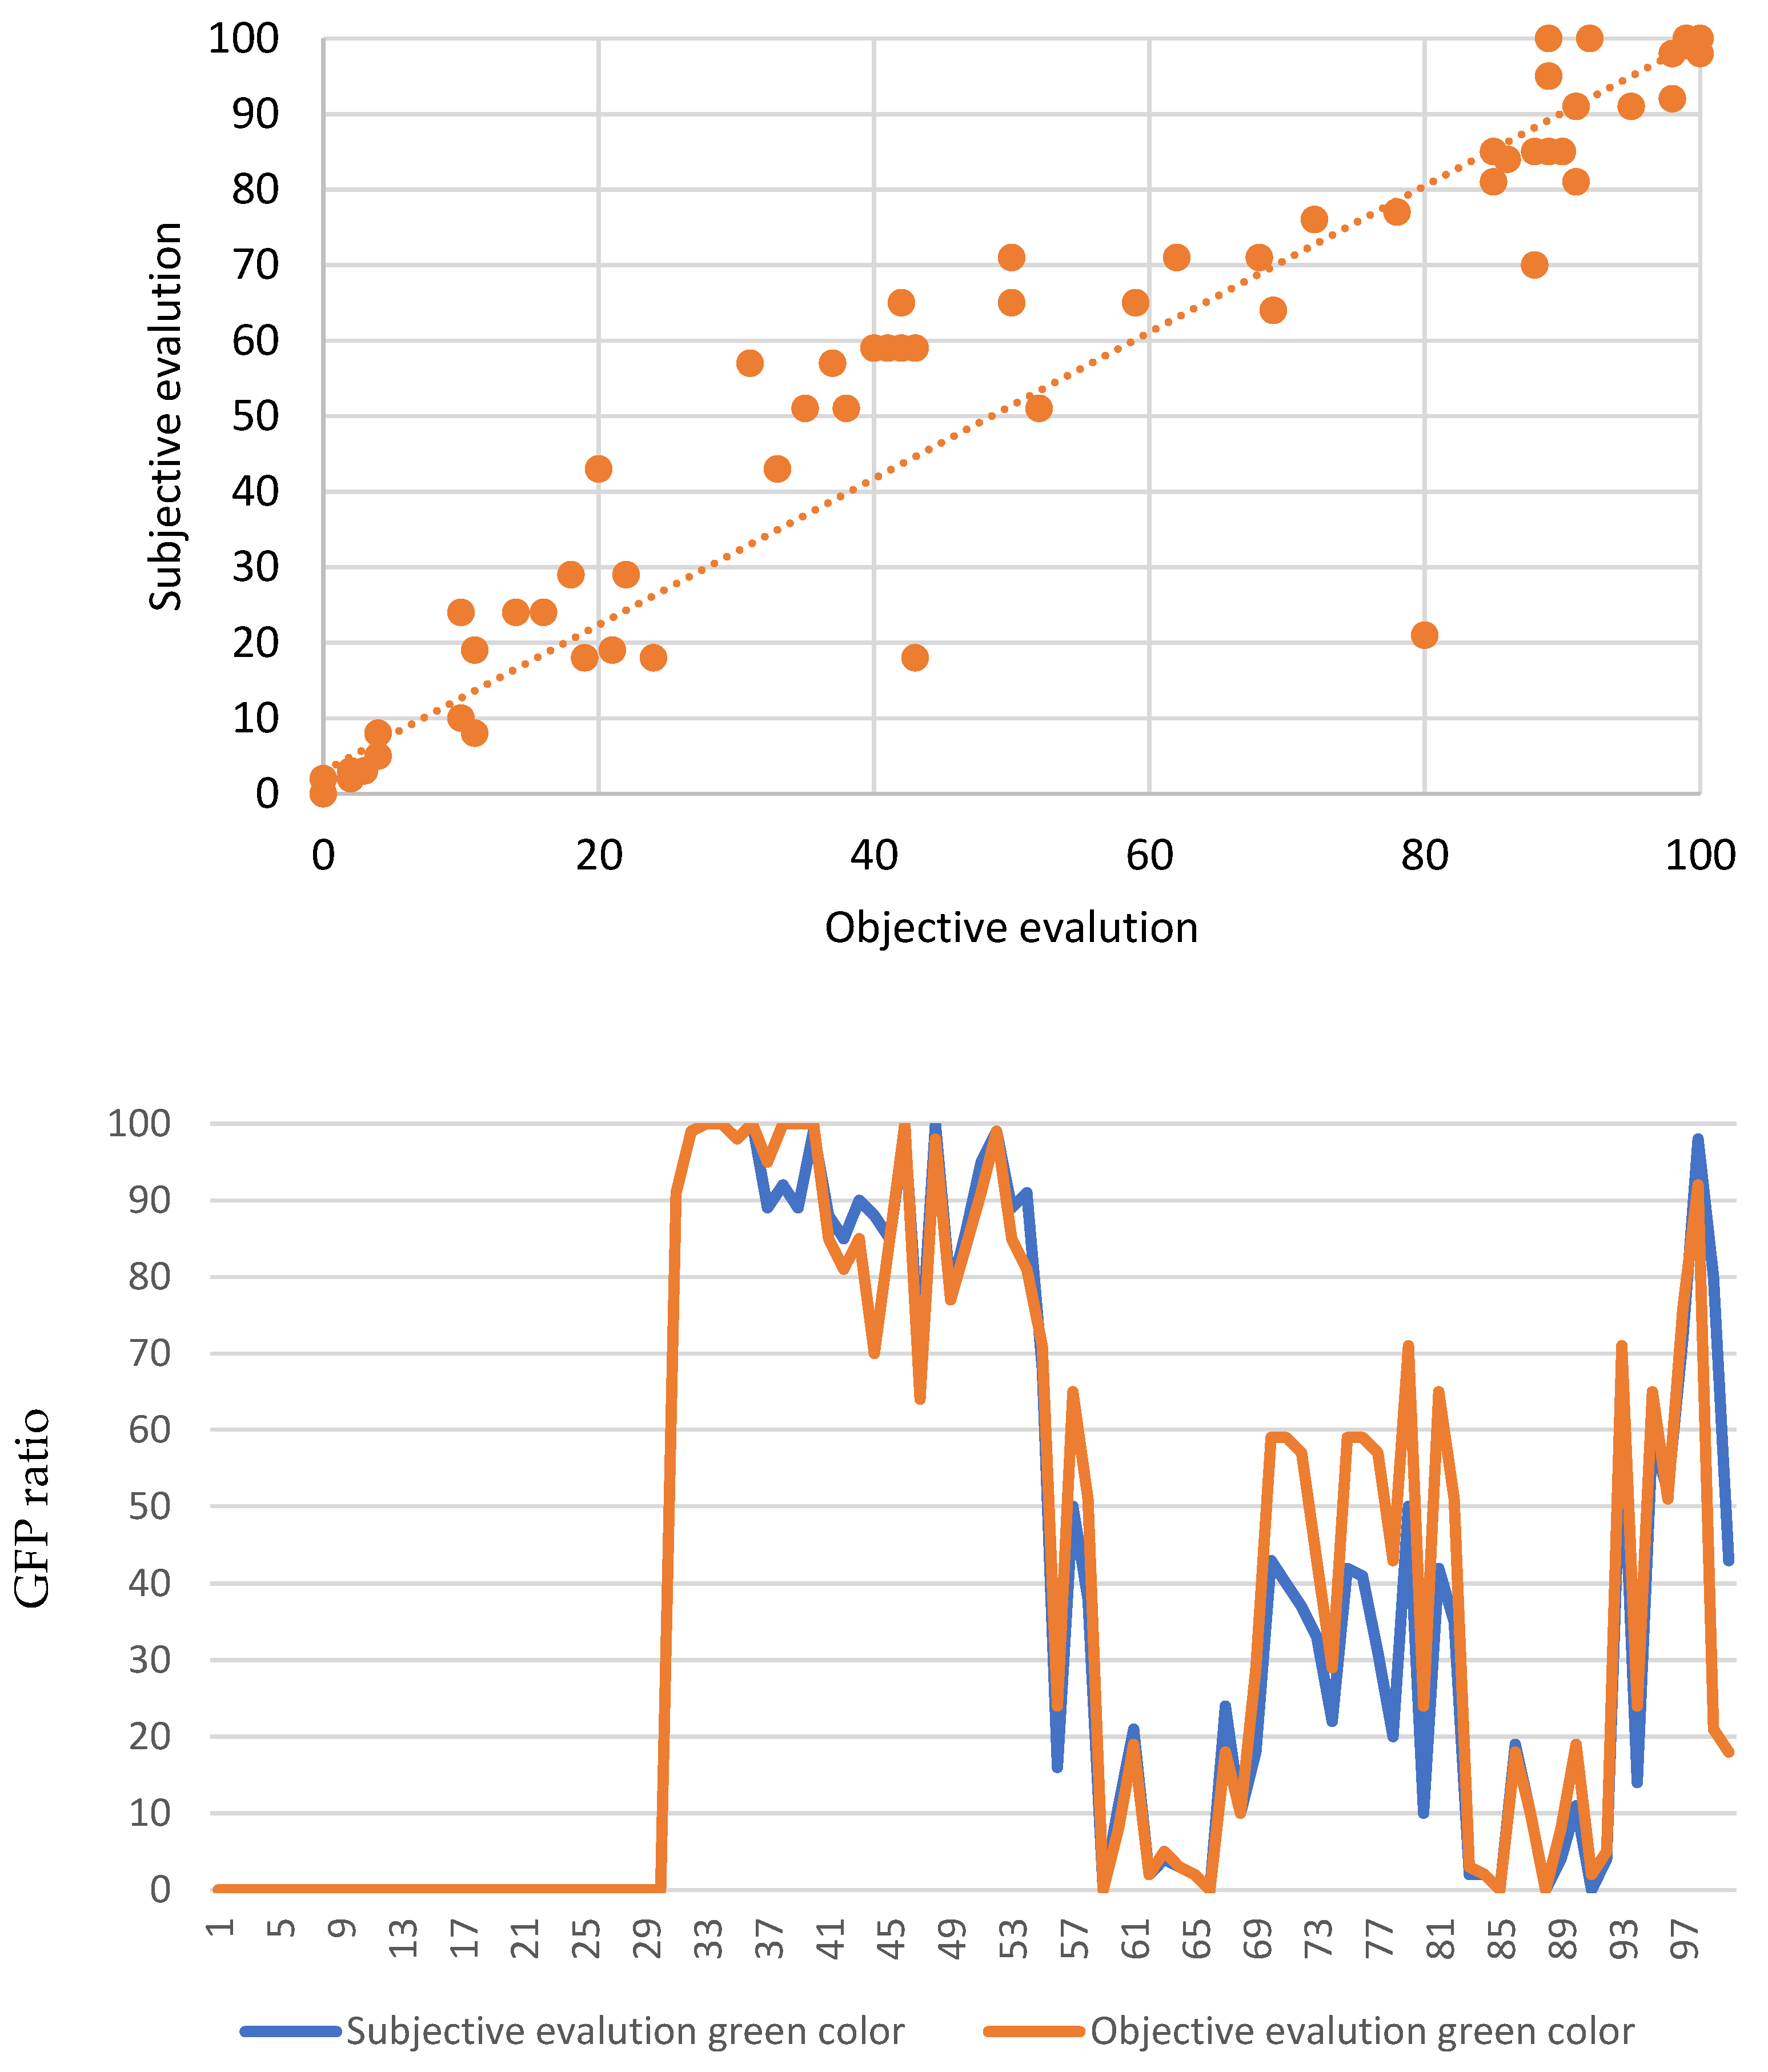
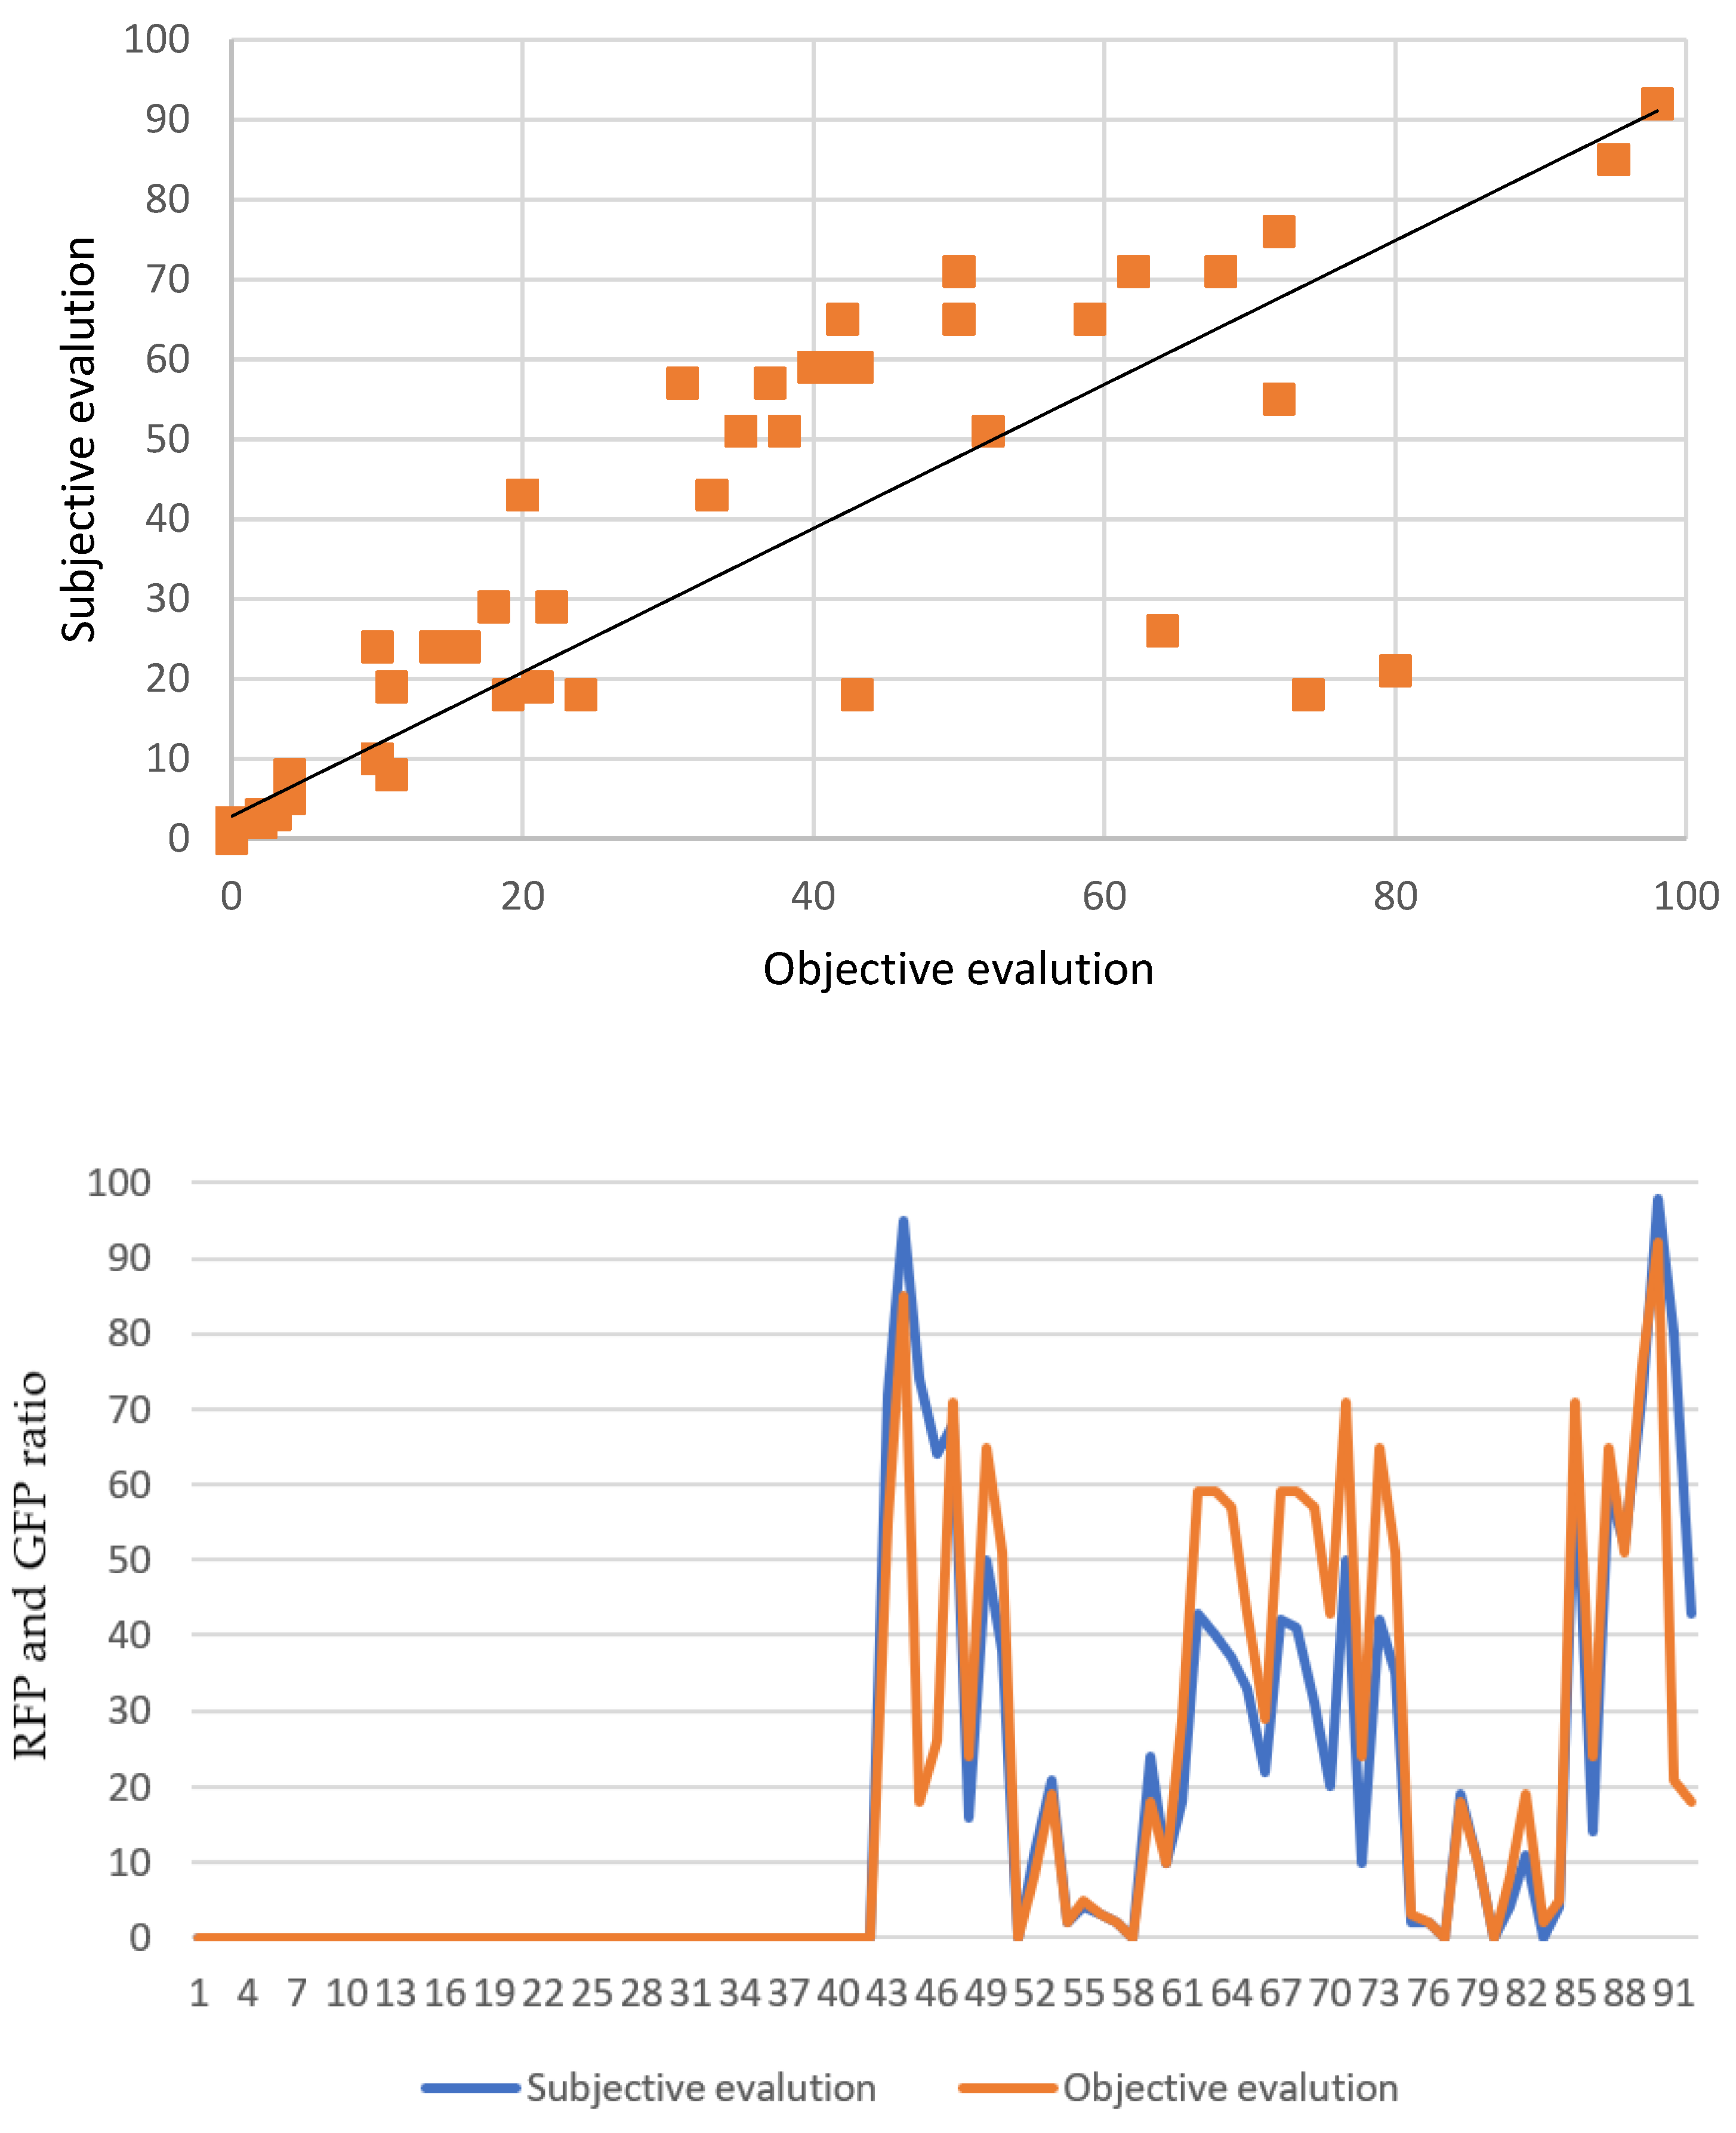
The intelligent machine spatial distribution quantification system is tested with the collected dataset. The test produces GFP and RFP percentages as a response output of the system to one of the FCM images. The system output responses to the 100 FCM images are collected and compared to the average expert’s opinion to evaluate the novel system. The test results show a high correlation between the system output and the experts’ estimation based on the method published in [9]. The correlation between them shows an ICC of 99% for RFP percentage estimation and 97% for GFP percentage estimation. This subjective and objective evaluation of RFP and GFP appears highly correlated, as can be noticed clearly in Figure 13 and Figure 14, respectively.
In order to study the efficiency of the three algorithms individually, the algorithms were tested based on the dataset 
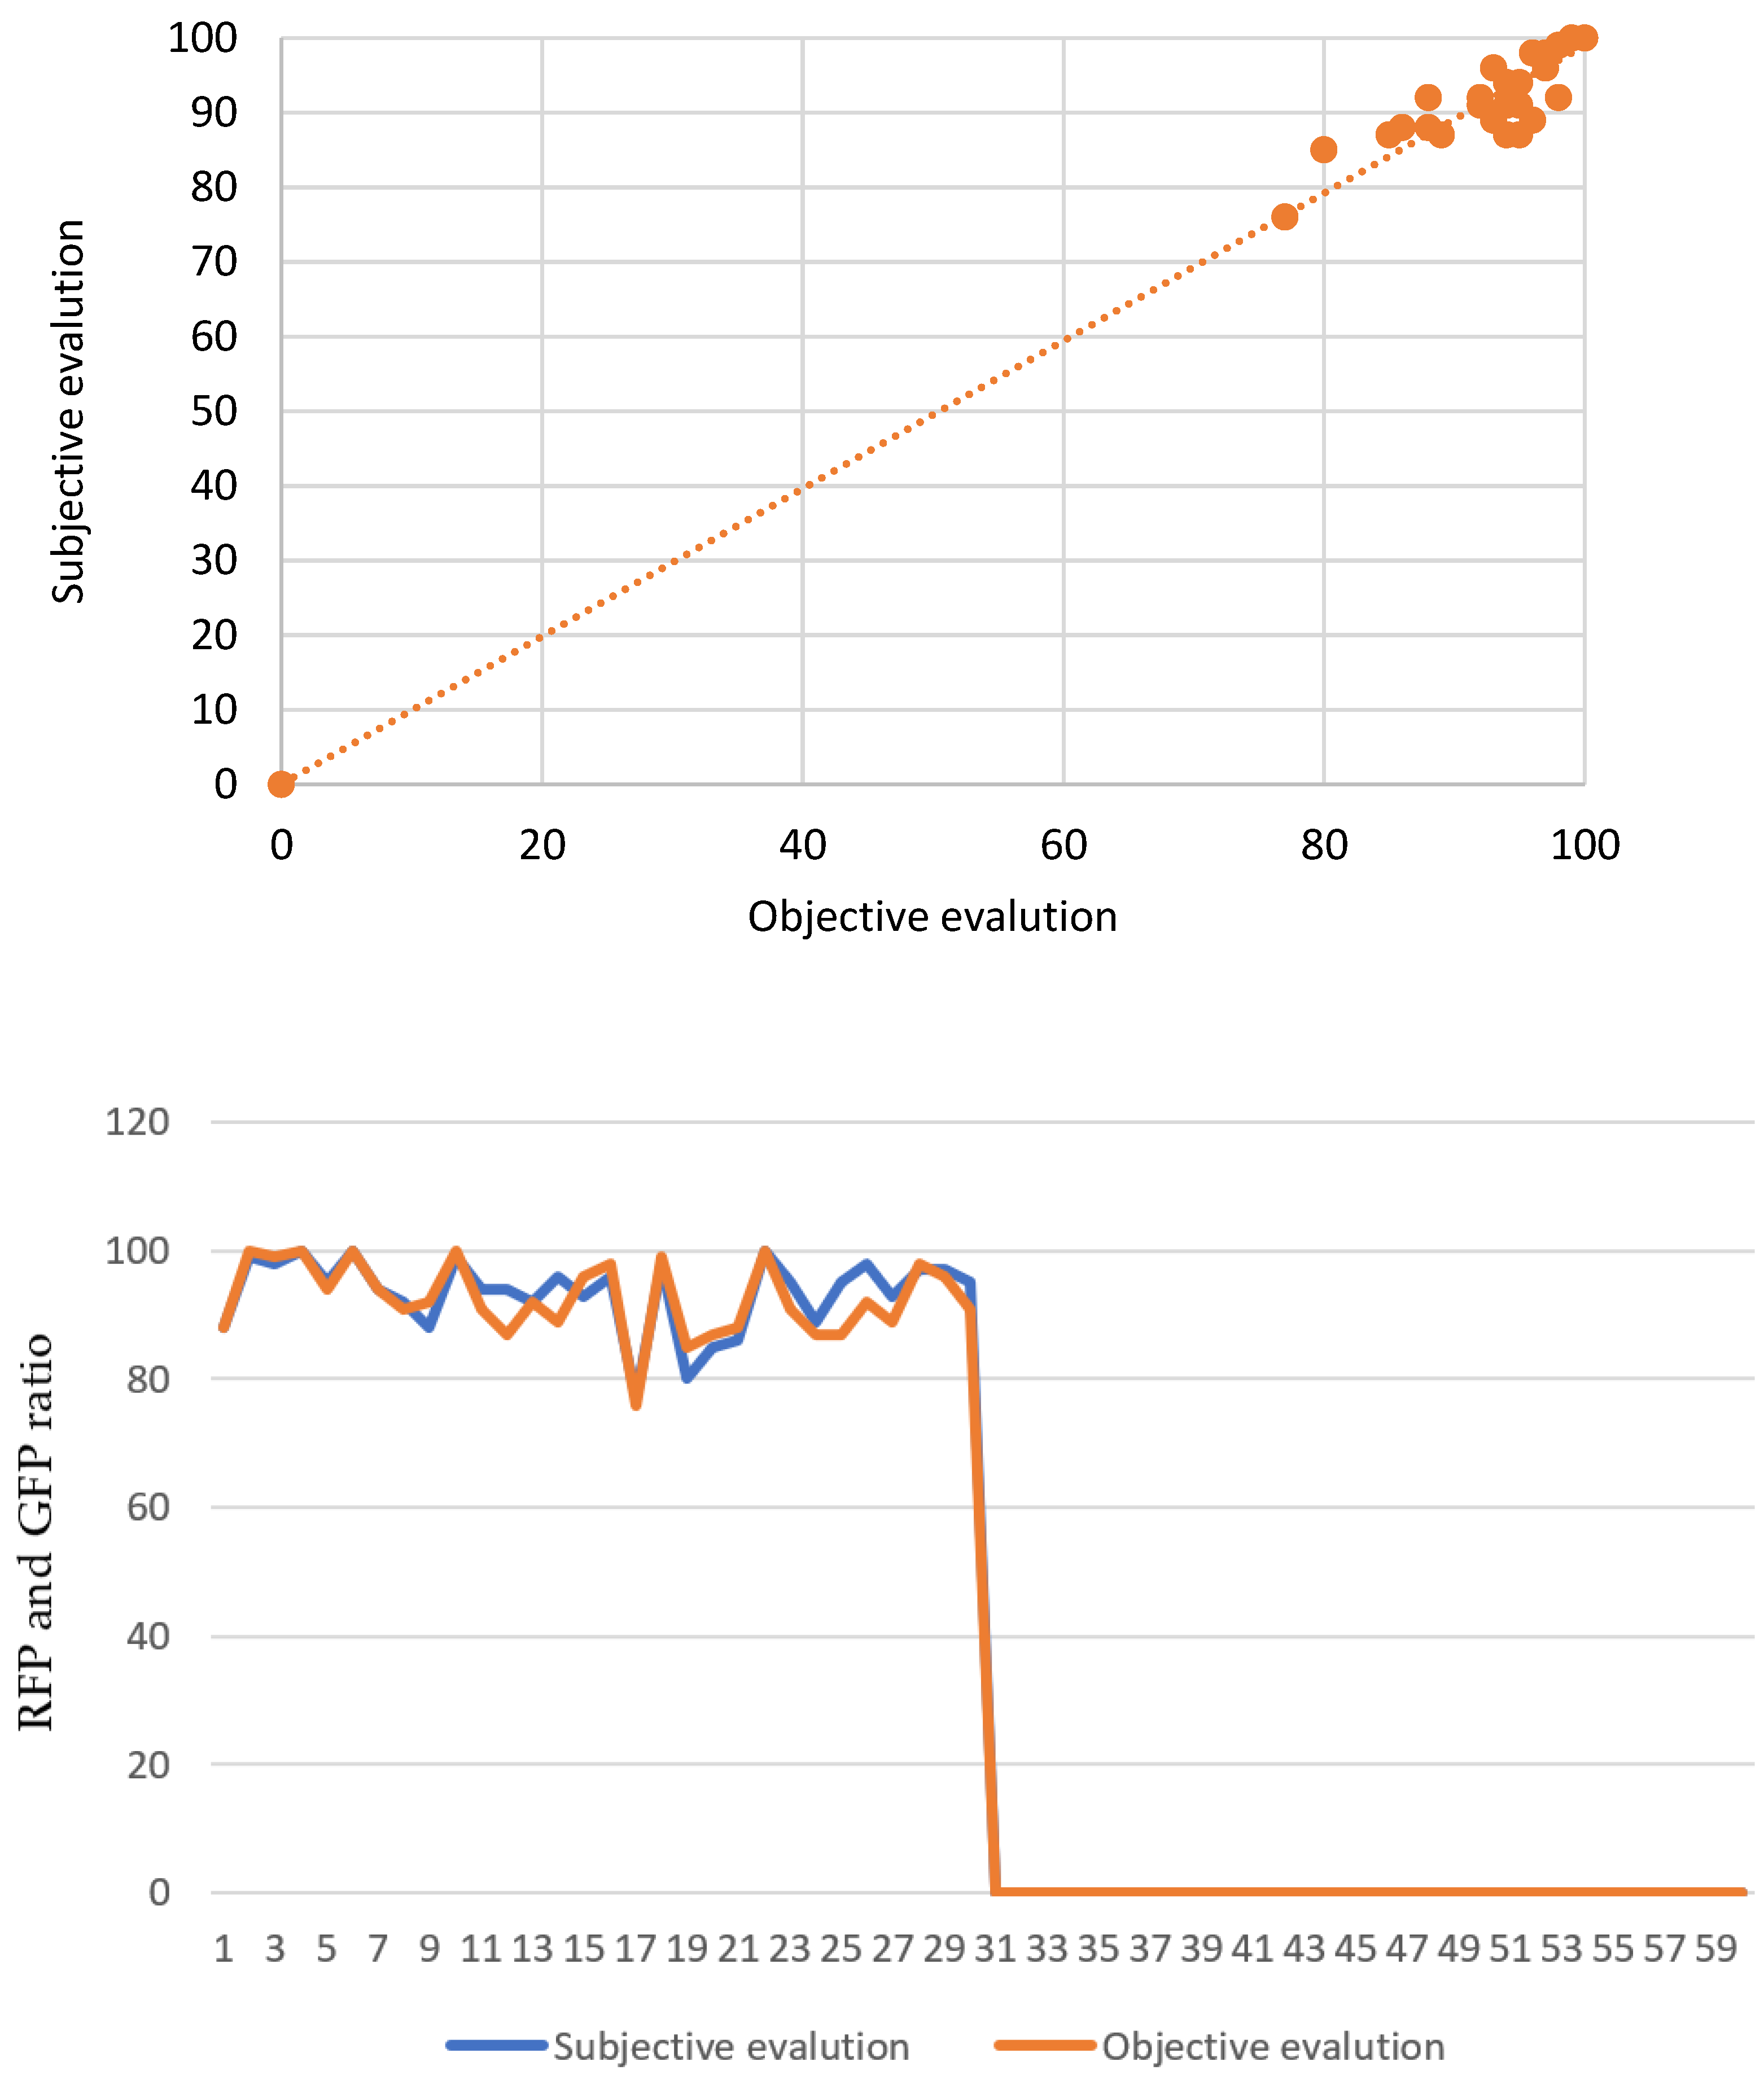
Table 1. For the Red Channel Intelligent machine spatial distribution quantification algorithm, the correlation between the experts’ rates and the tested algorithm shows an ICC of 99% for RFP and GFP percentage estimation. This subjective and objective evaluation of RFP and GFP appears highly correlated, as can be noticed clearly in Figure 15.
For the green channel intelligent machine spatial distribution quantification algorithm, the correlation between the experts’ rates and the tested algorithm shows an ICC of 99% for RFP and GFP percentage estimation. This subjective and objective evaluation of RFP and GFP appears highly correlated, as can be noticed clearly in Figure 16.
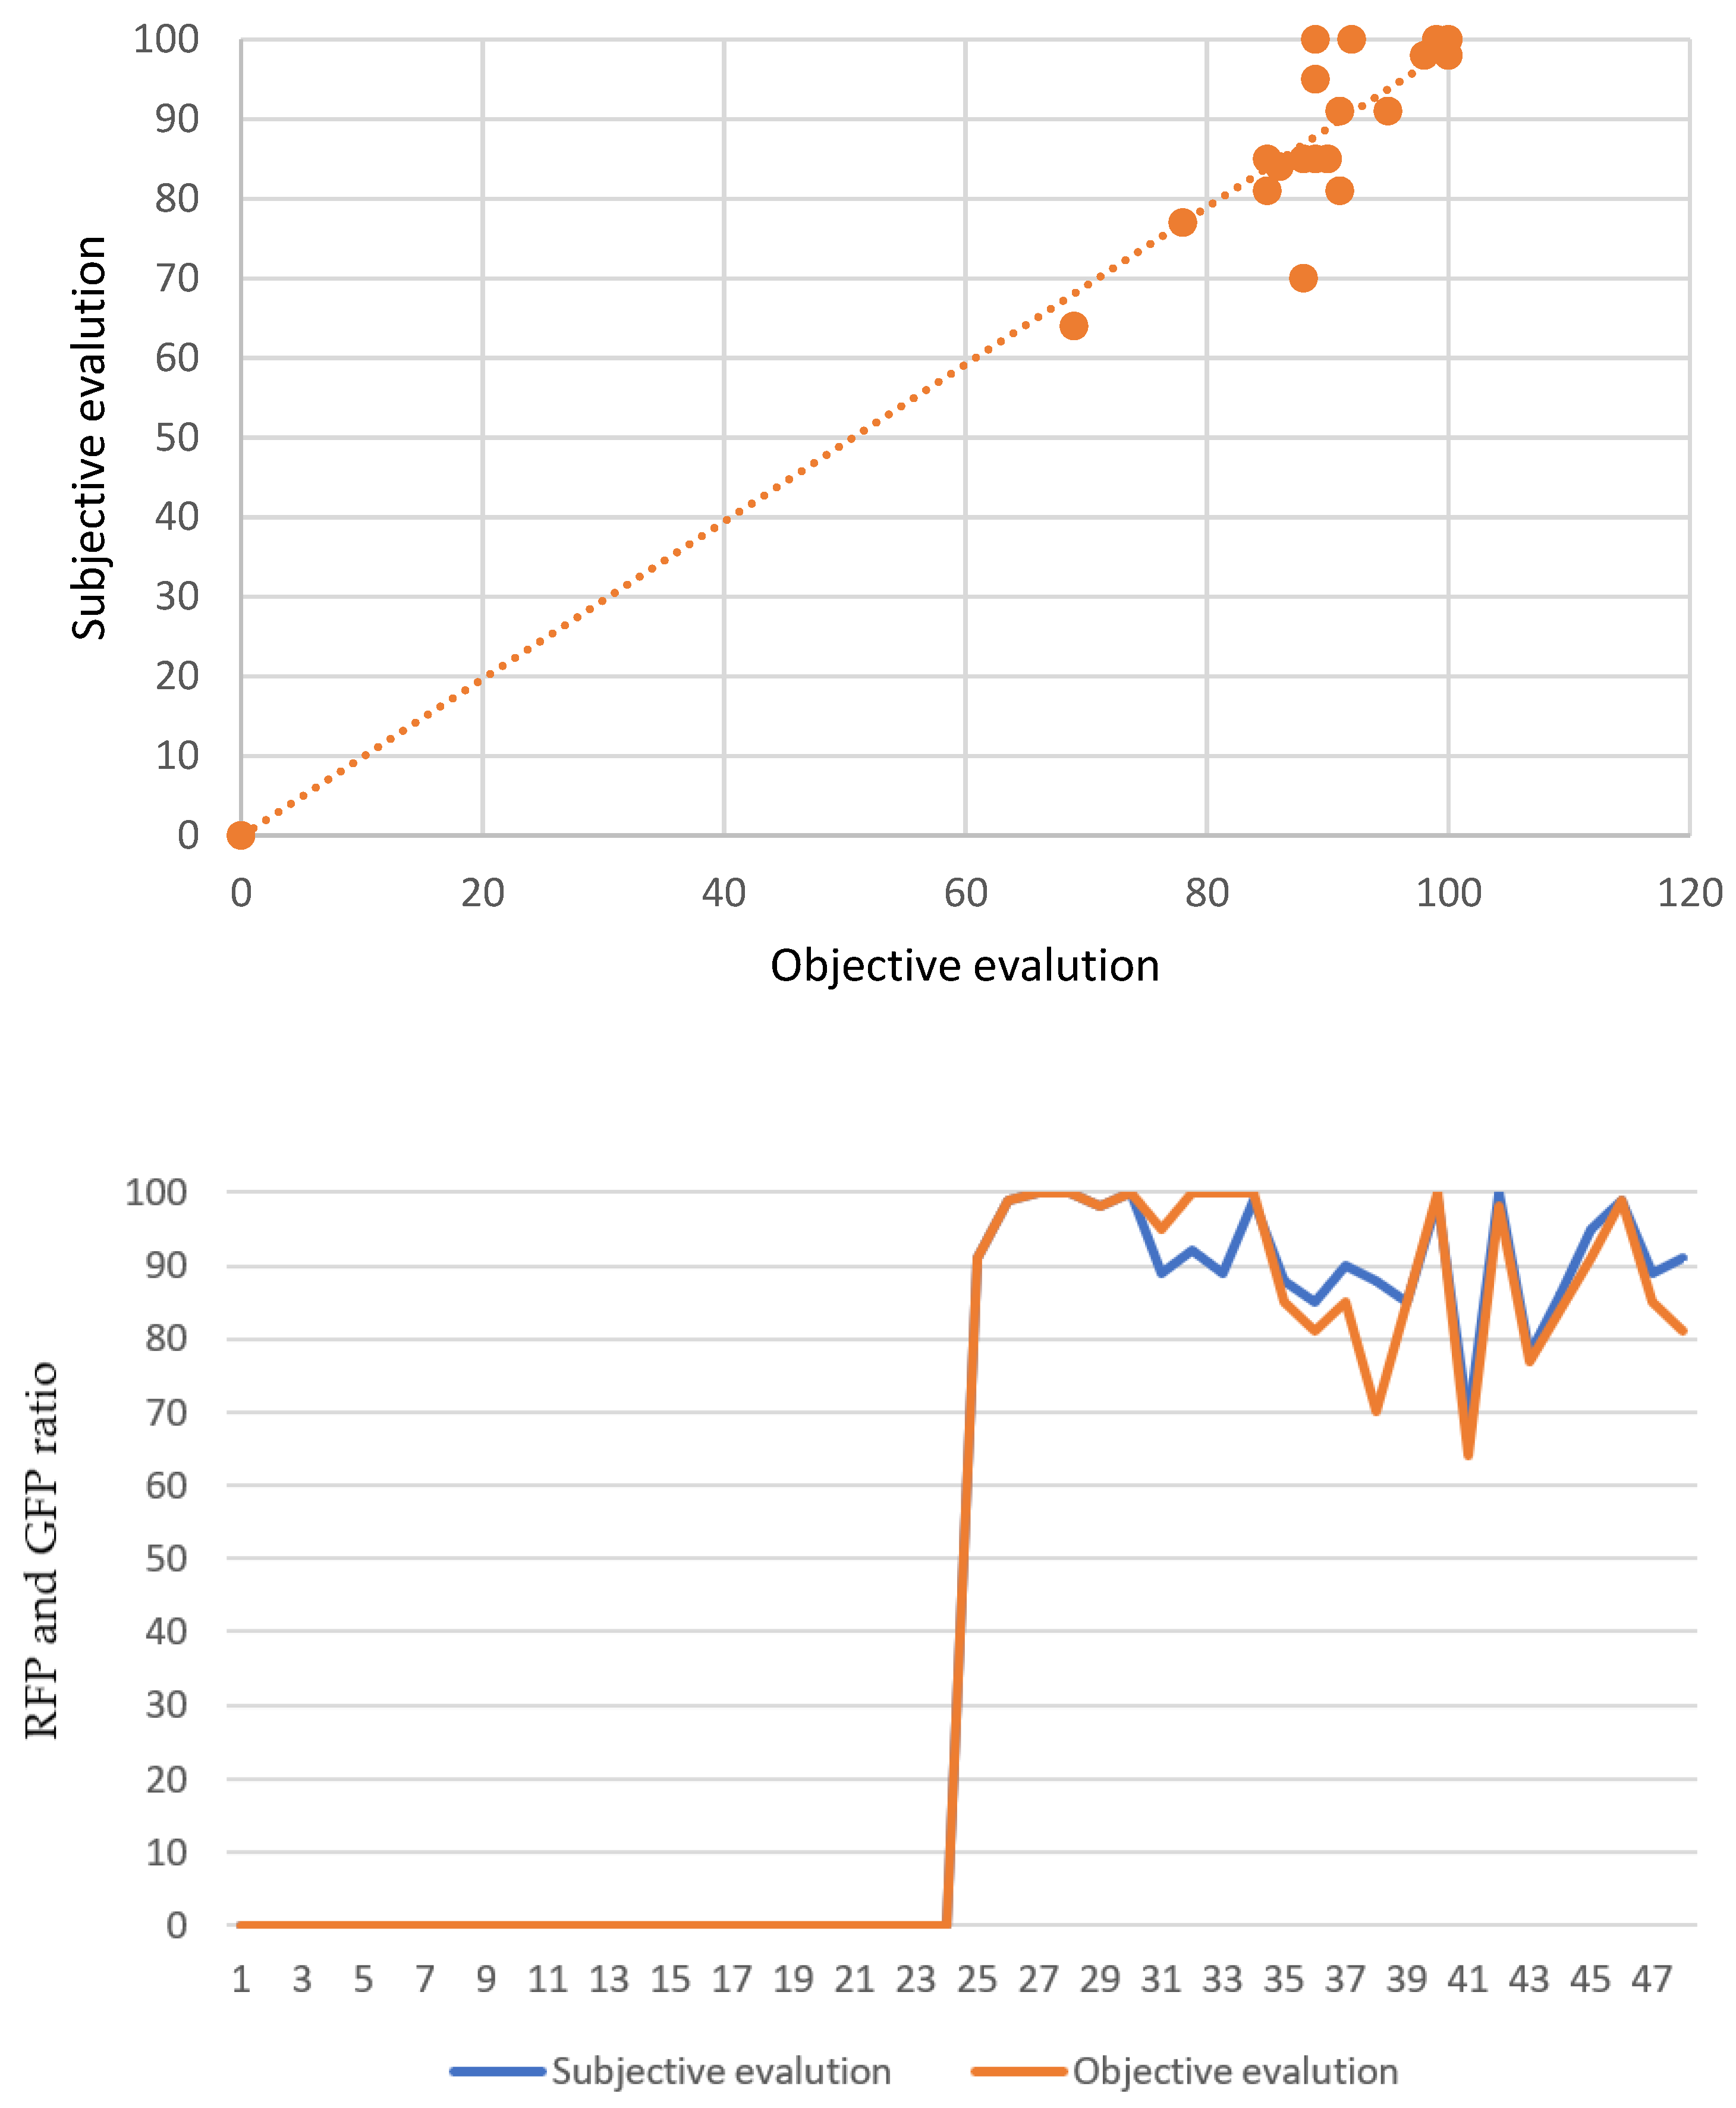
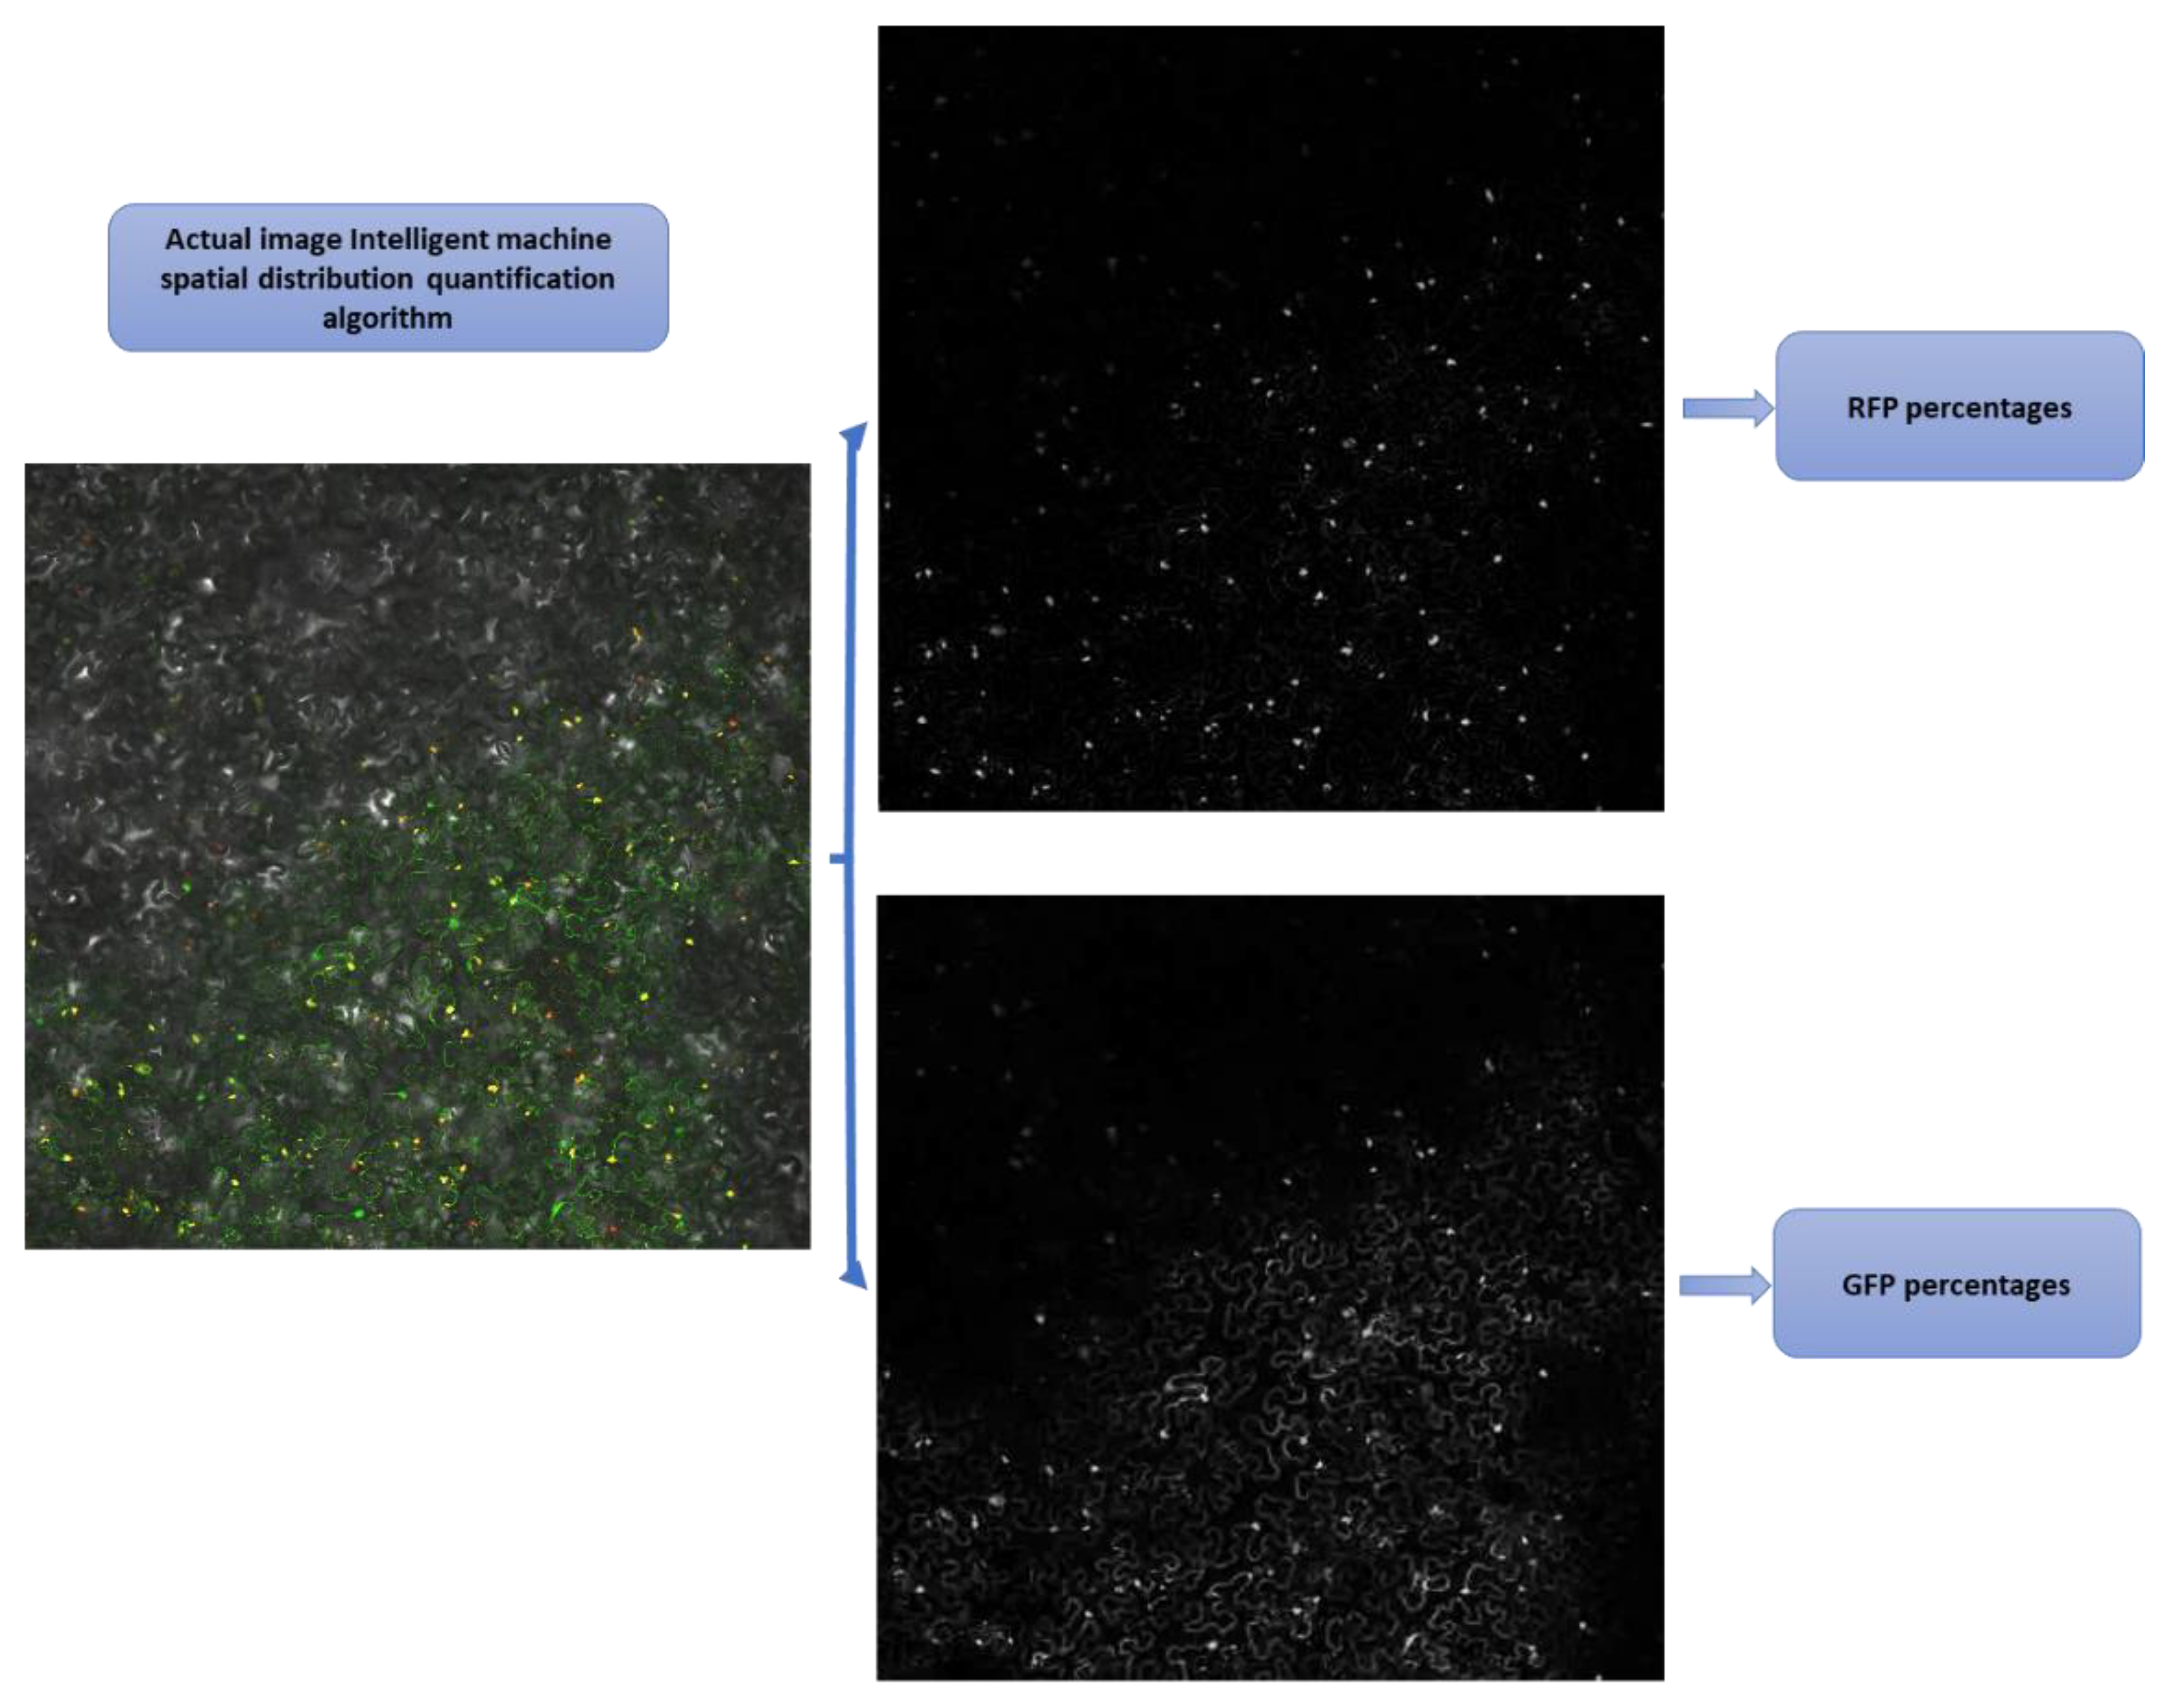
The third essential part is the actual image intelligent machine spatial distribution quantification algorithm (AIMSDQA). This subjective and objective evaluation of RFP and GFP have a reasonable correlation, as can be inferred from Figure 17. The correlation between the experts’ rates and the tested algorithm shows an ICC of 94% for RFP and GFP percentage estimation.
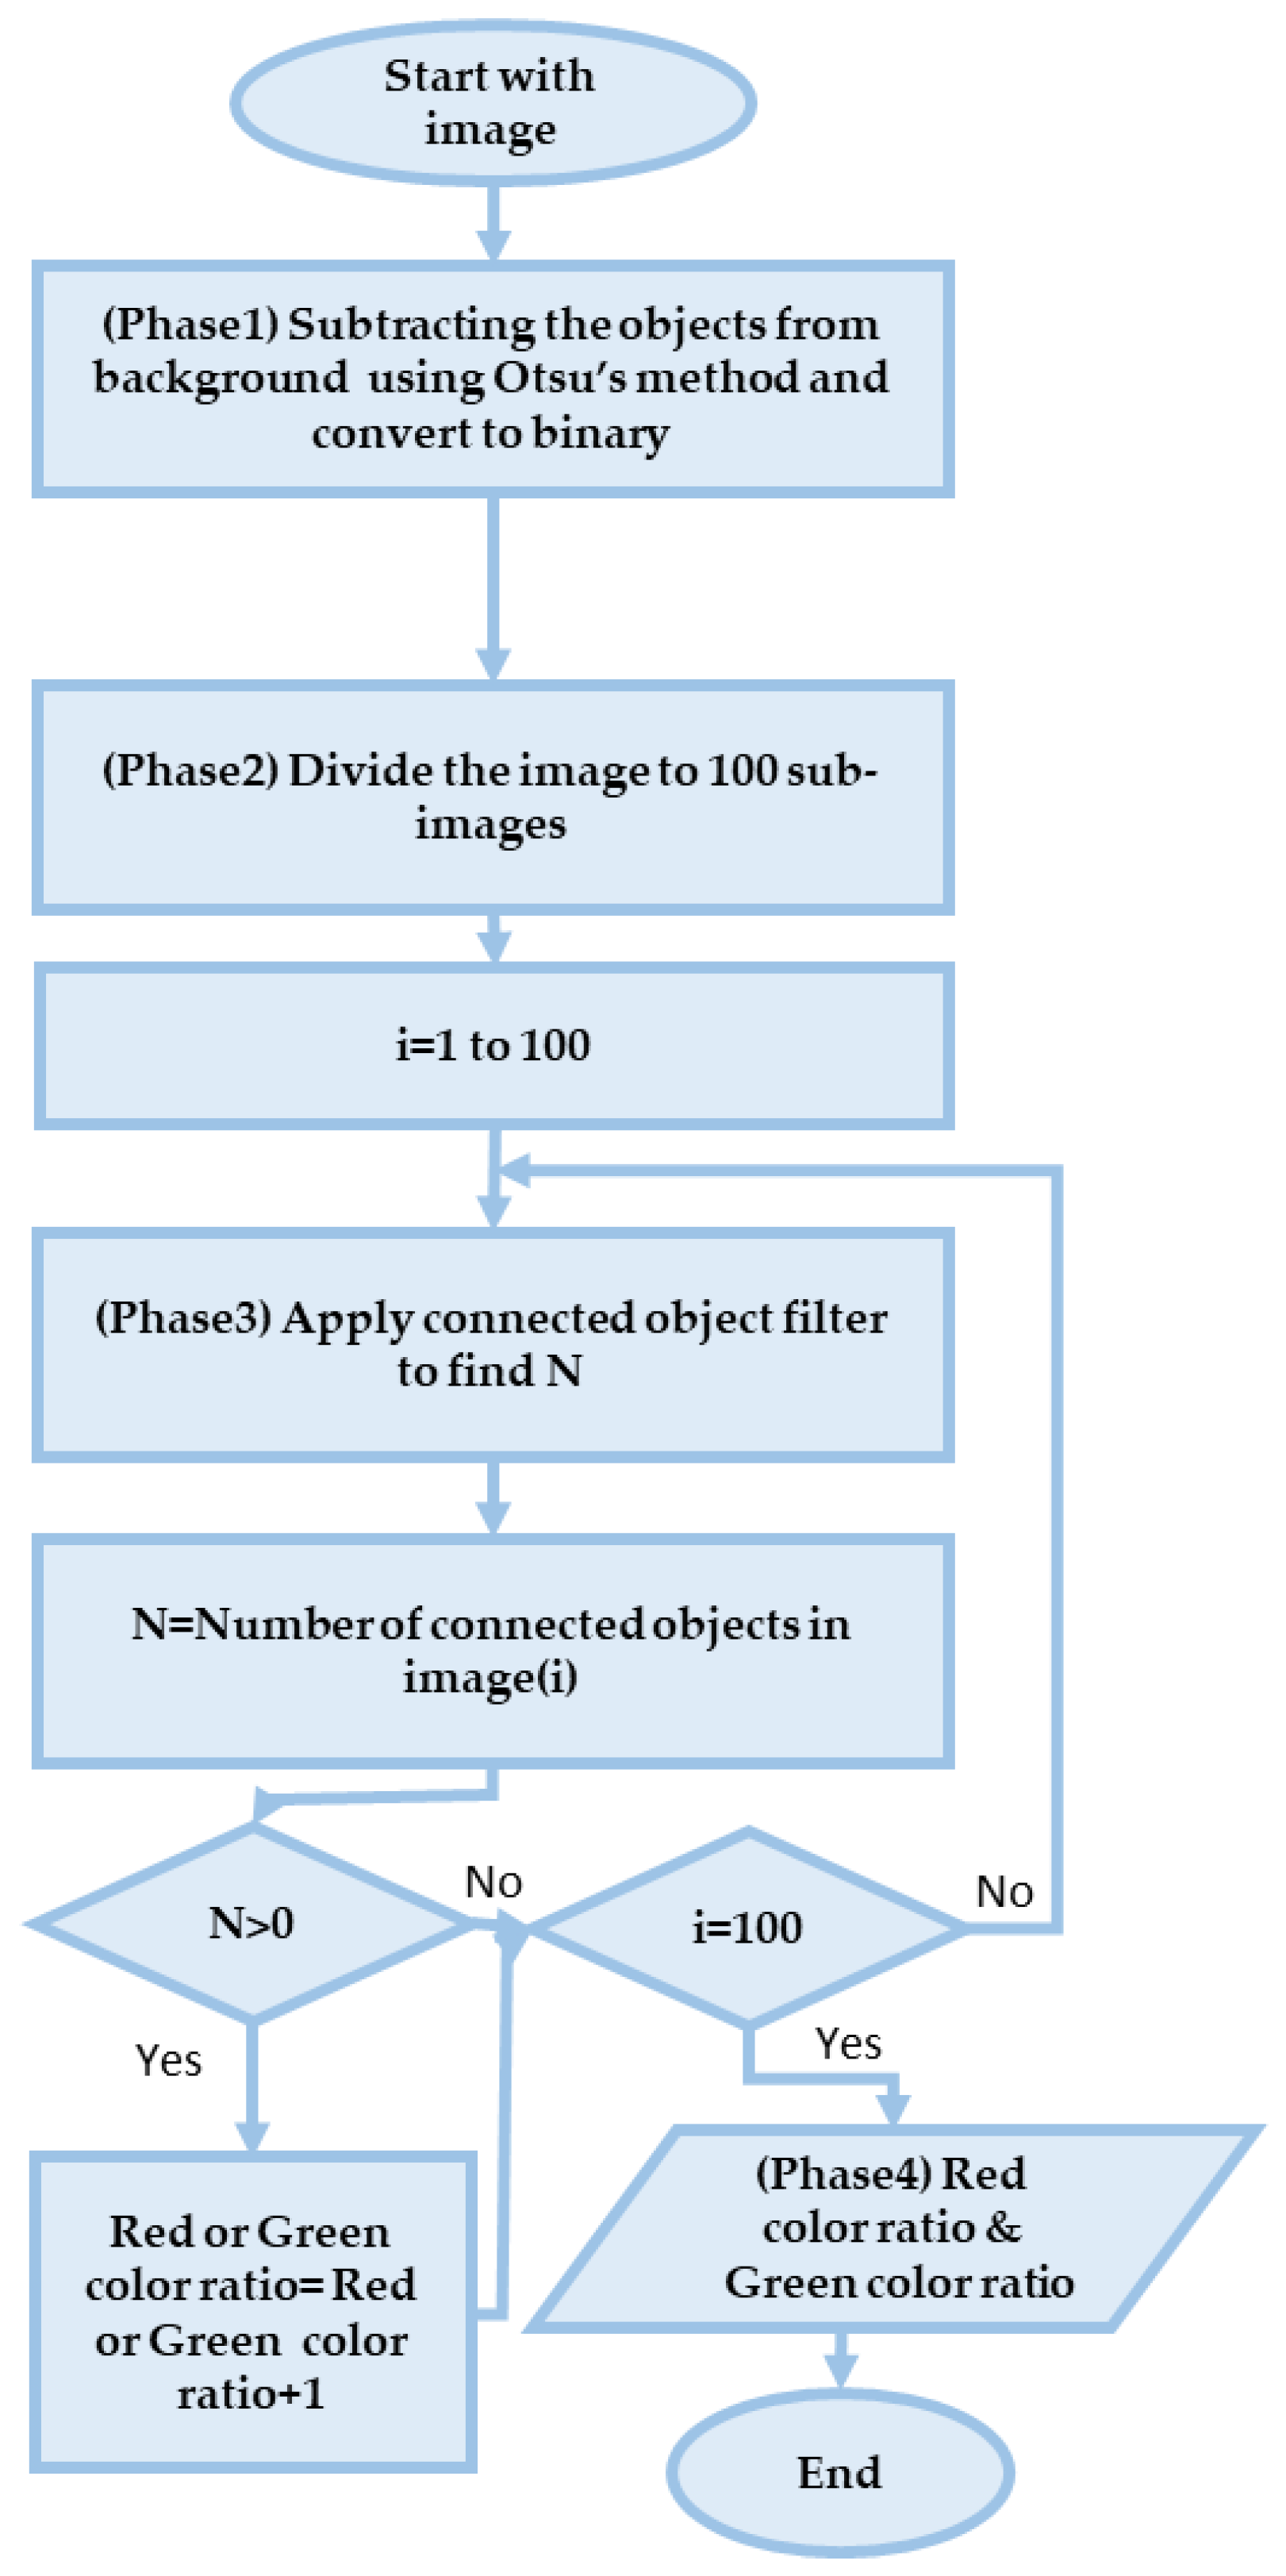
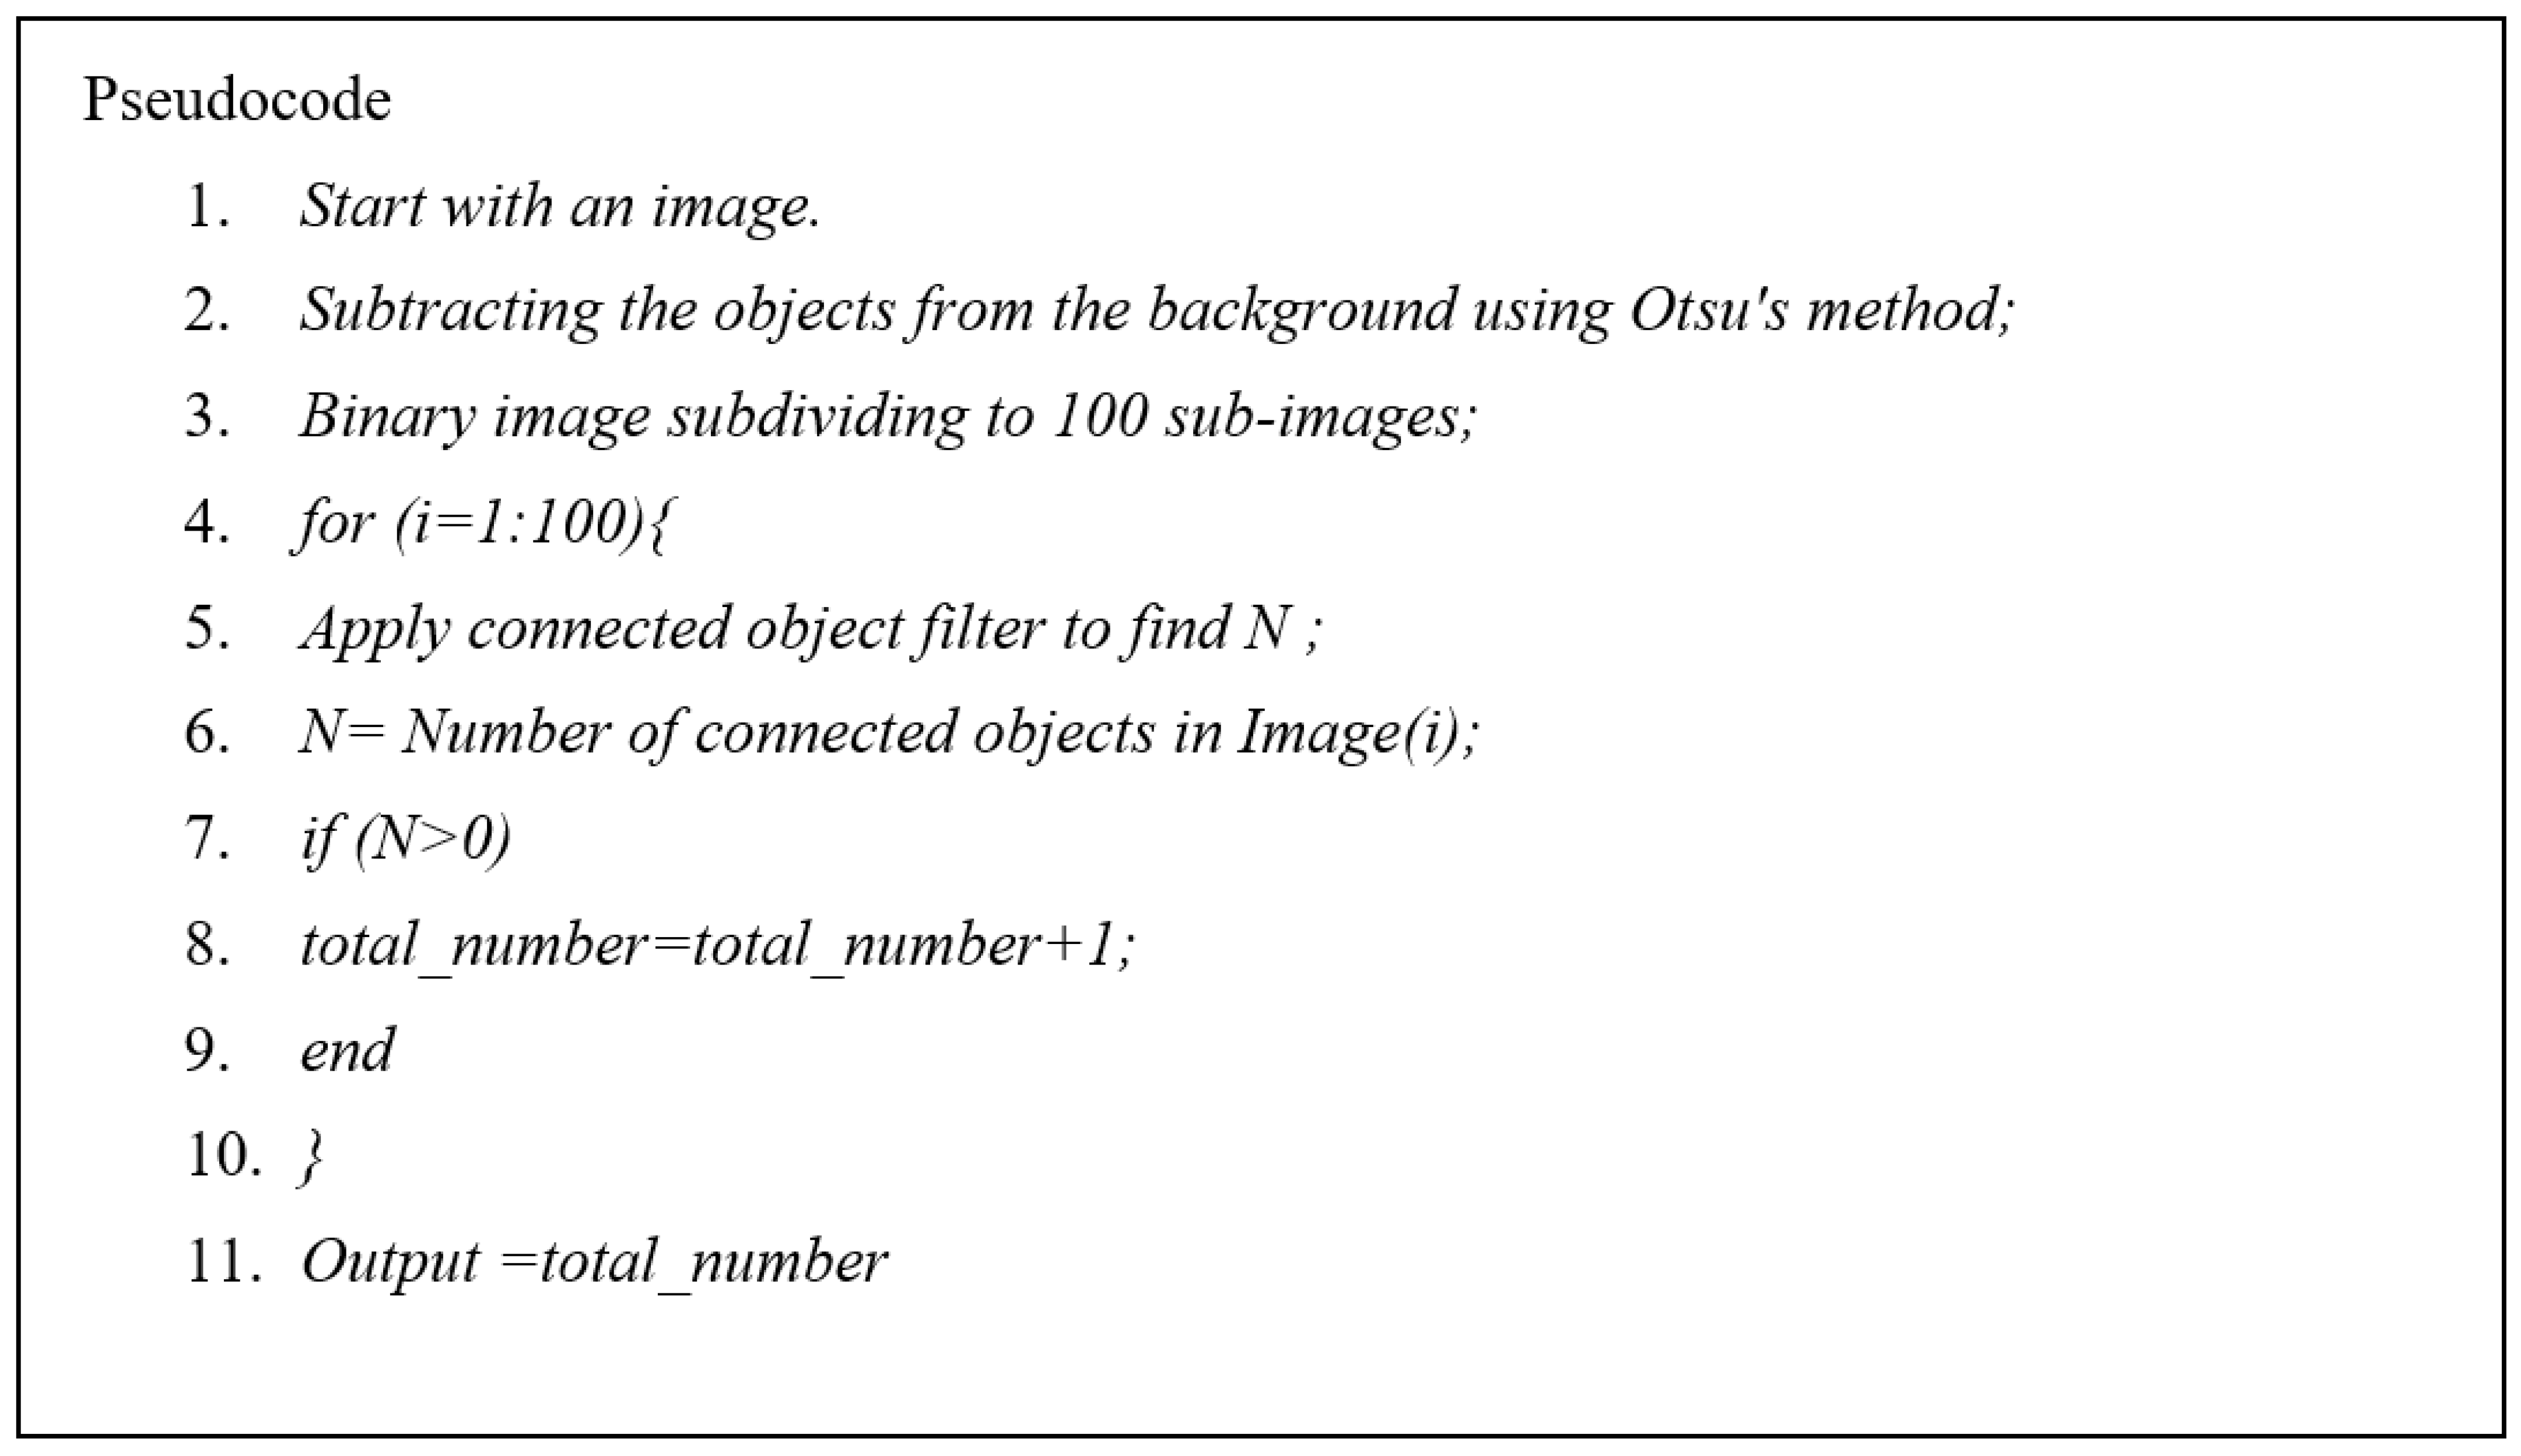
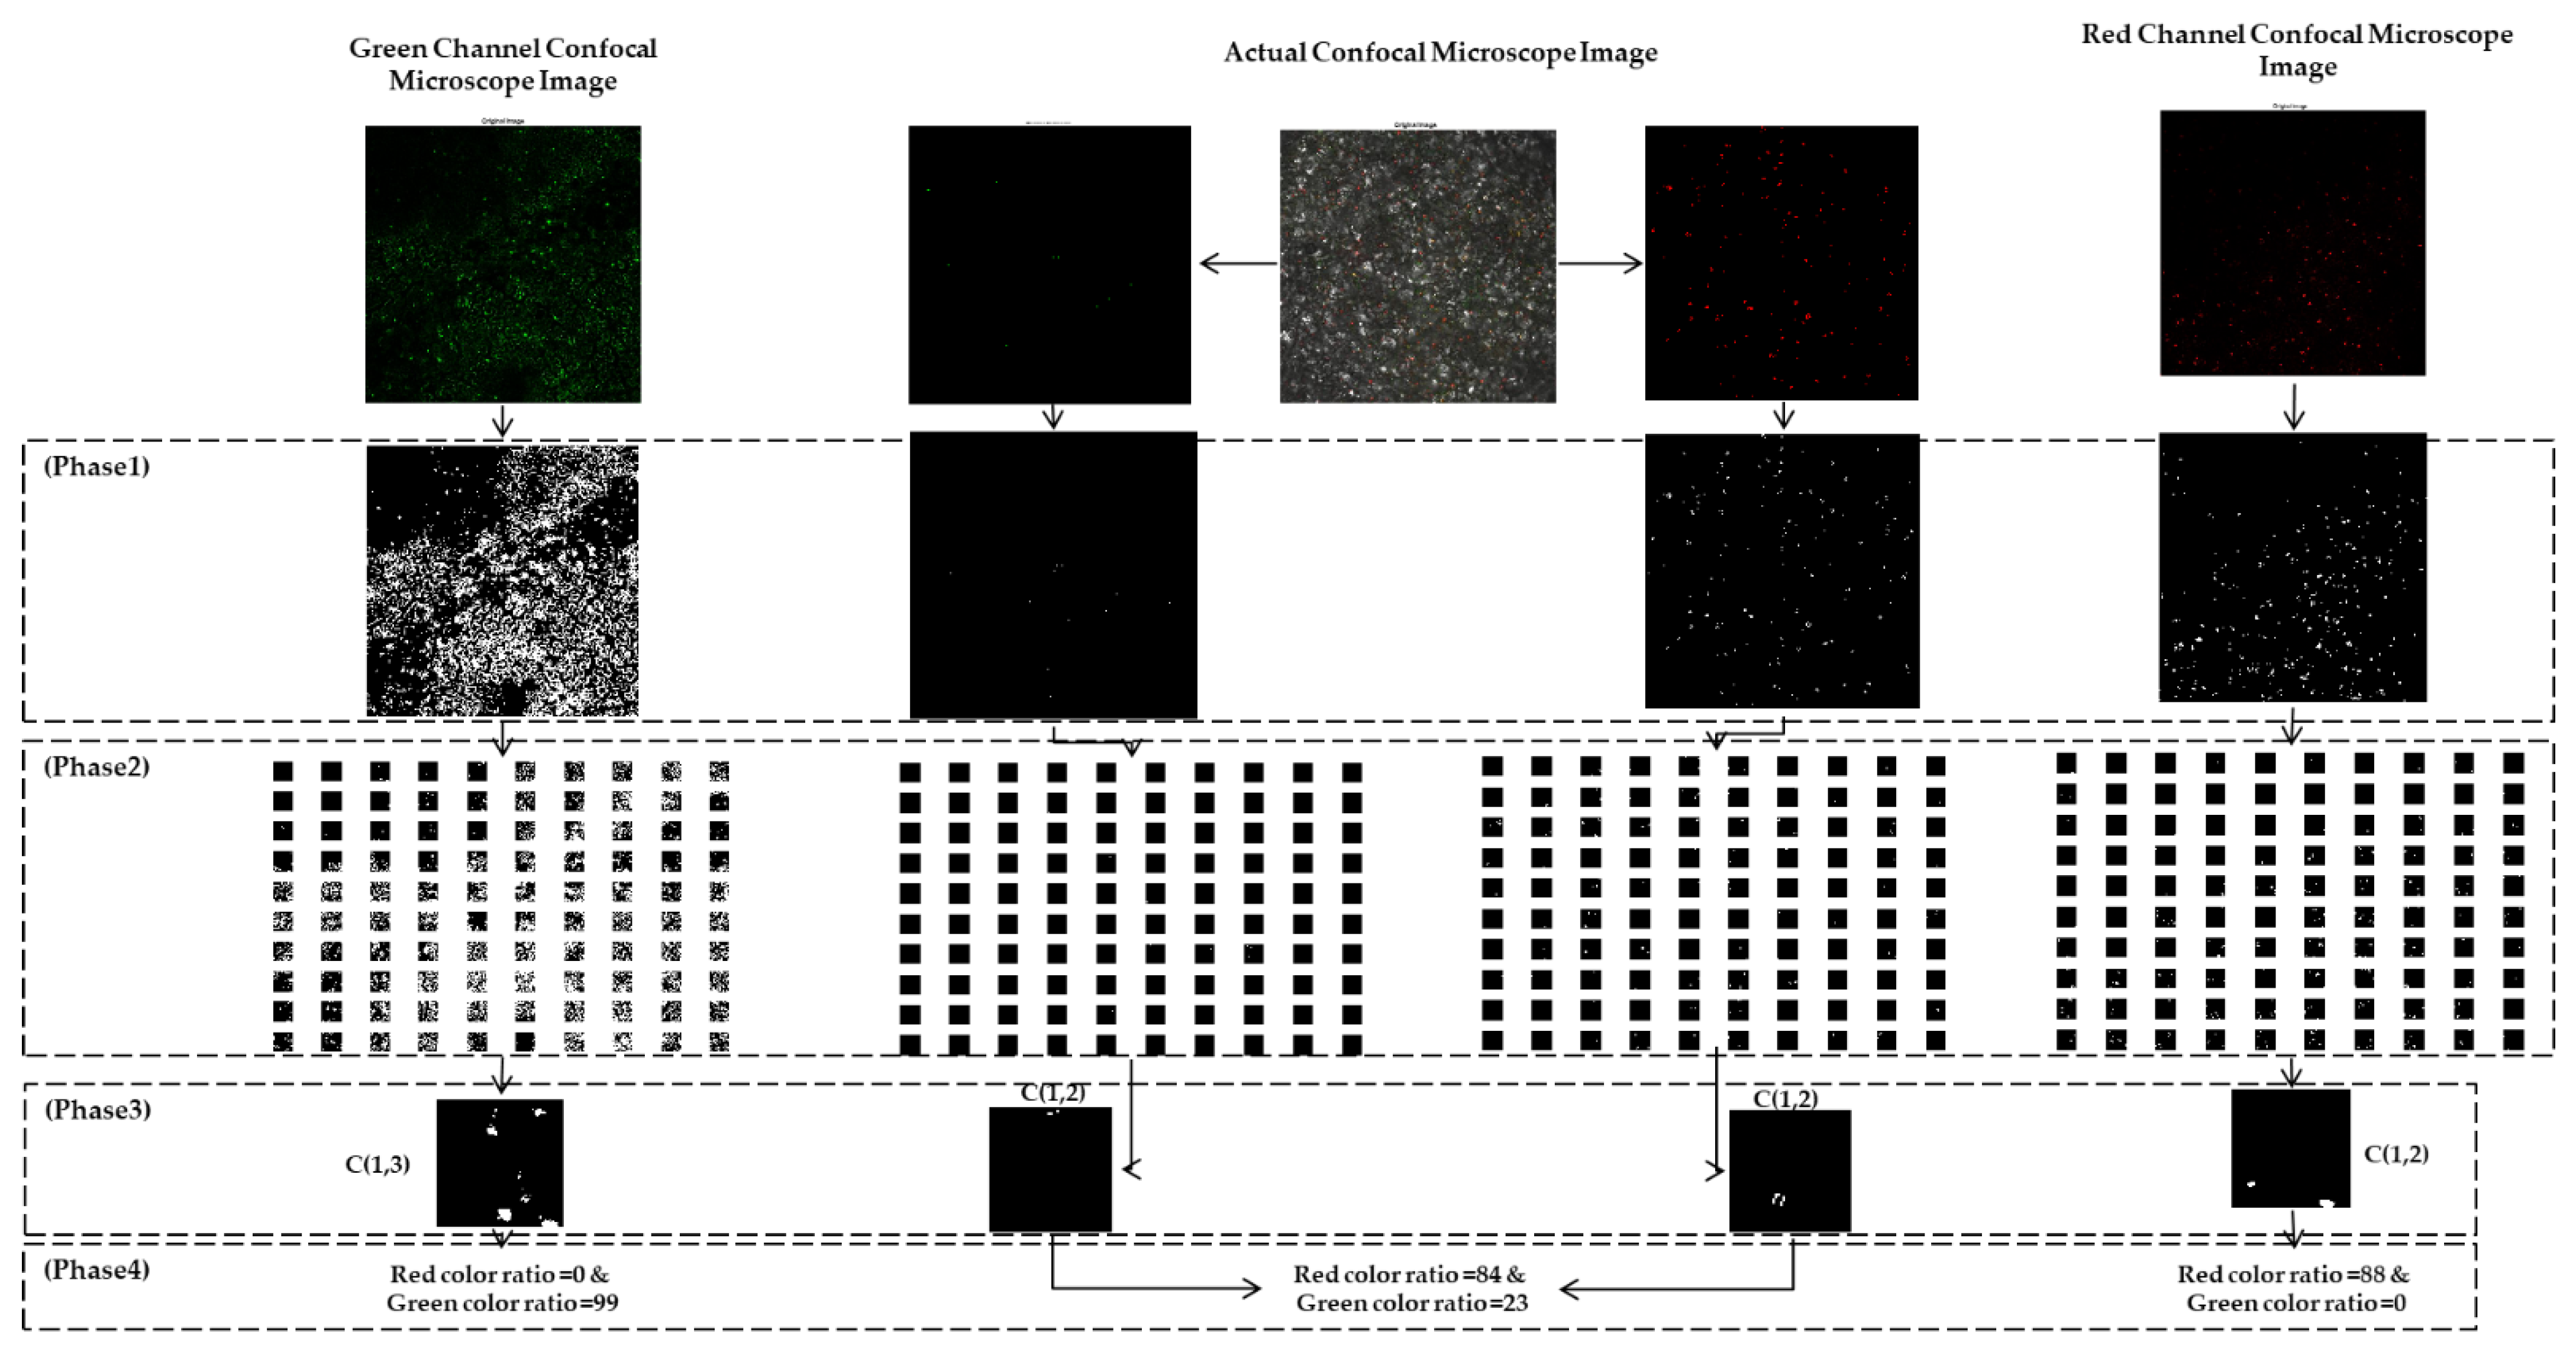
The results of AIMSDQA show greater values than the raters’ estimations in most cases. This fact leads to further investigations to discover that the rater’s naked eye can sometimes miss many details easily found by the algorithm, as in Figure 18, when the actual image has yellow spots meaning there are red and green colors in the same place, which refers to co-localization of two proteins in the same spot. This figure shows the output images for counting the RFP and GFP ratio estimation.

4. Discussion

The sample images were gathered with FCM from various experiments and several time points. More than a hundred different images were subjected to the image processing algorithm. Despite the associated drawbacks, previously, the protein expressions were found utilizing fSPT, CLSM, AUC with FDS, and FCM [20,21,22,23,24,25]. Common issues related to such methods would be fluorescent particle size limitation, operation optimization requirements, the necessity to use particle standards, dilution of the sample prior to performing the measurement, and even the effect of using the centrifuge machine could change the results [21,24,26]. In the proposed approach, there was no need for preparations that might cause issues when performing the measurements.
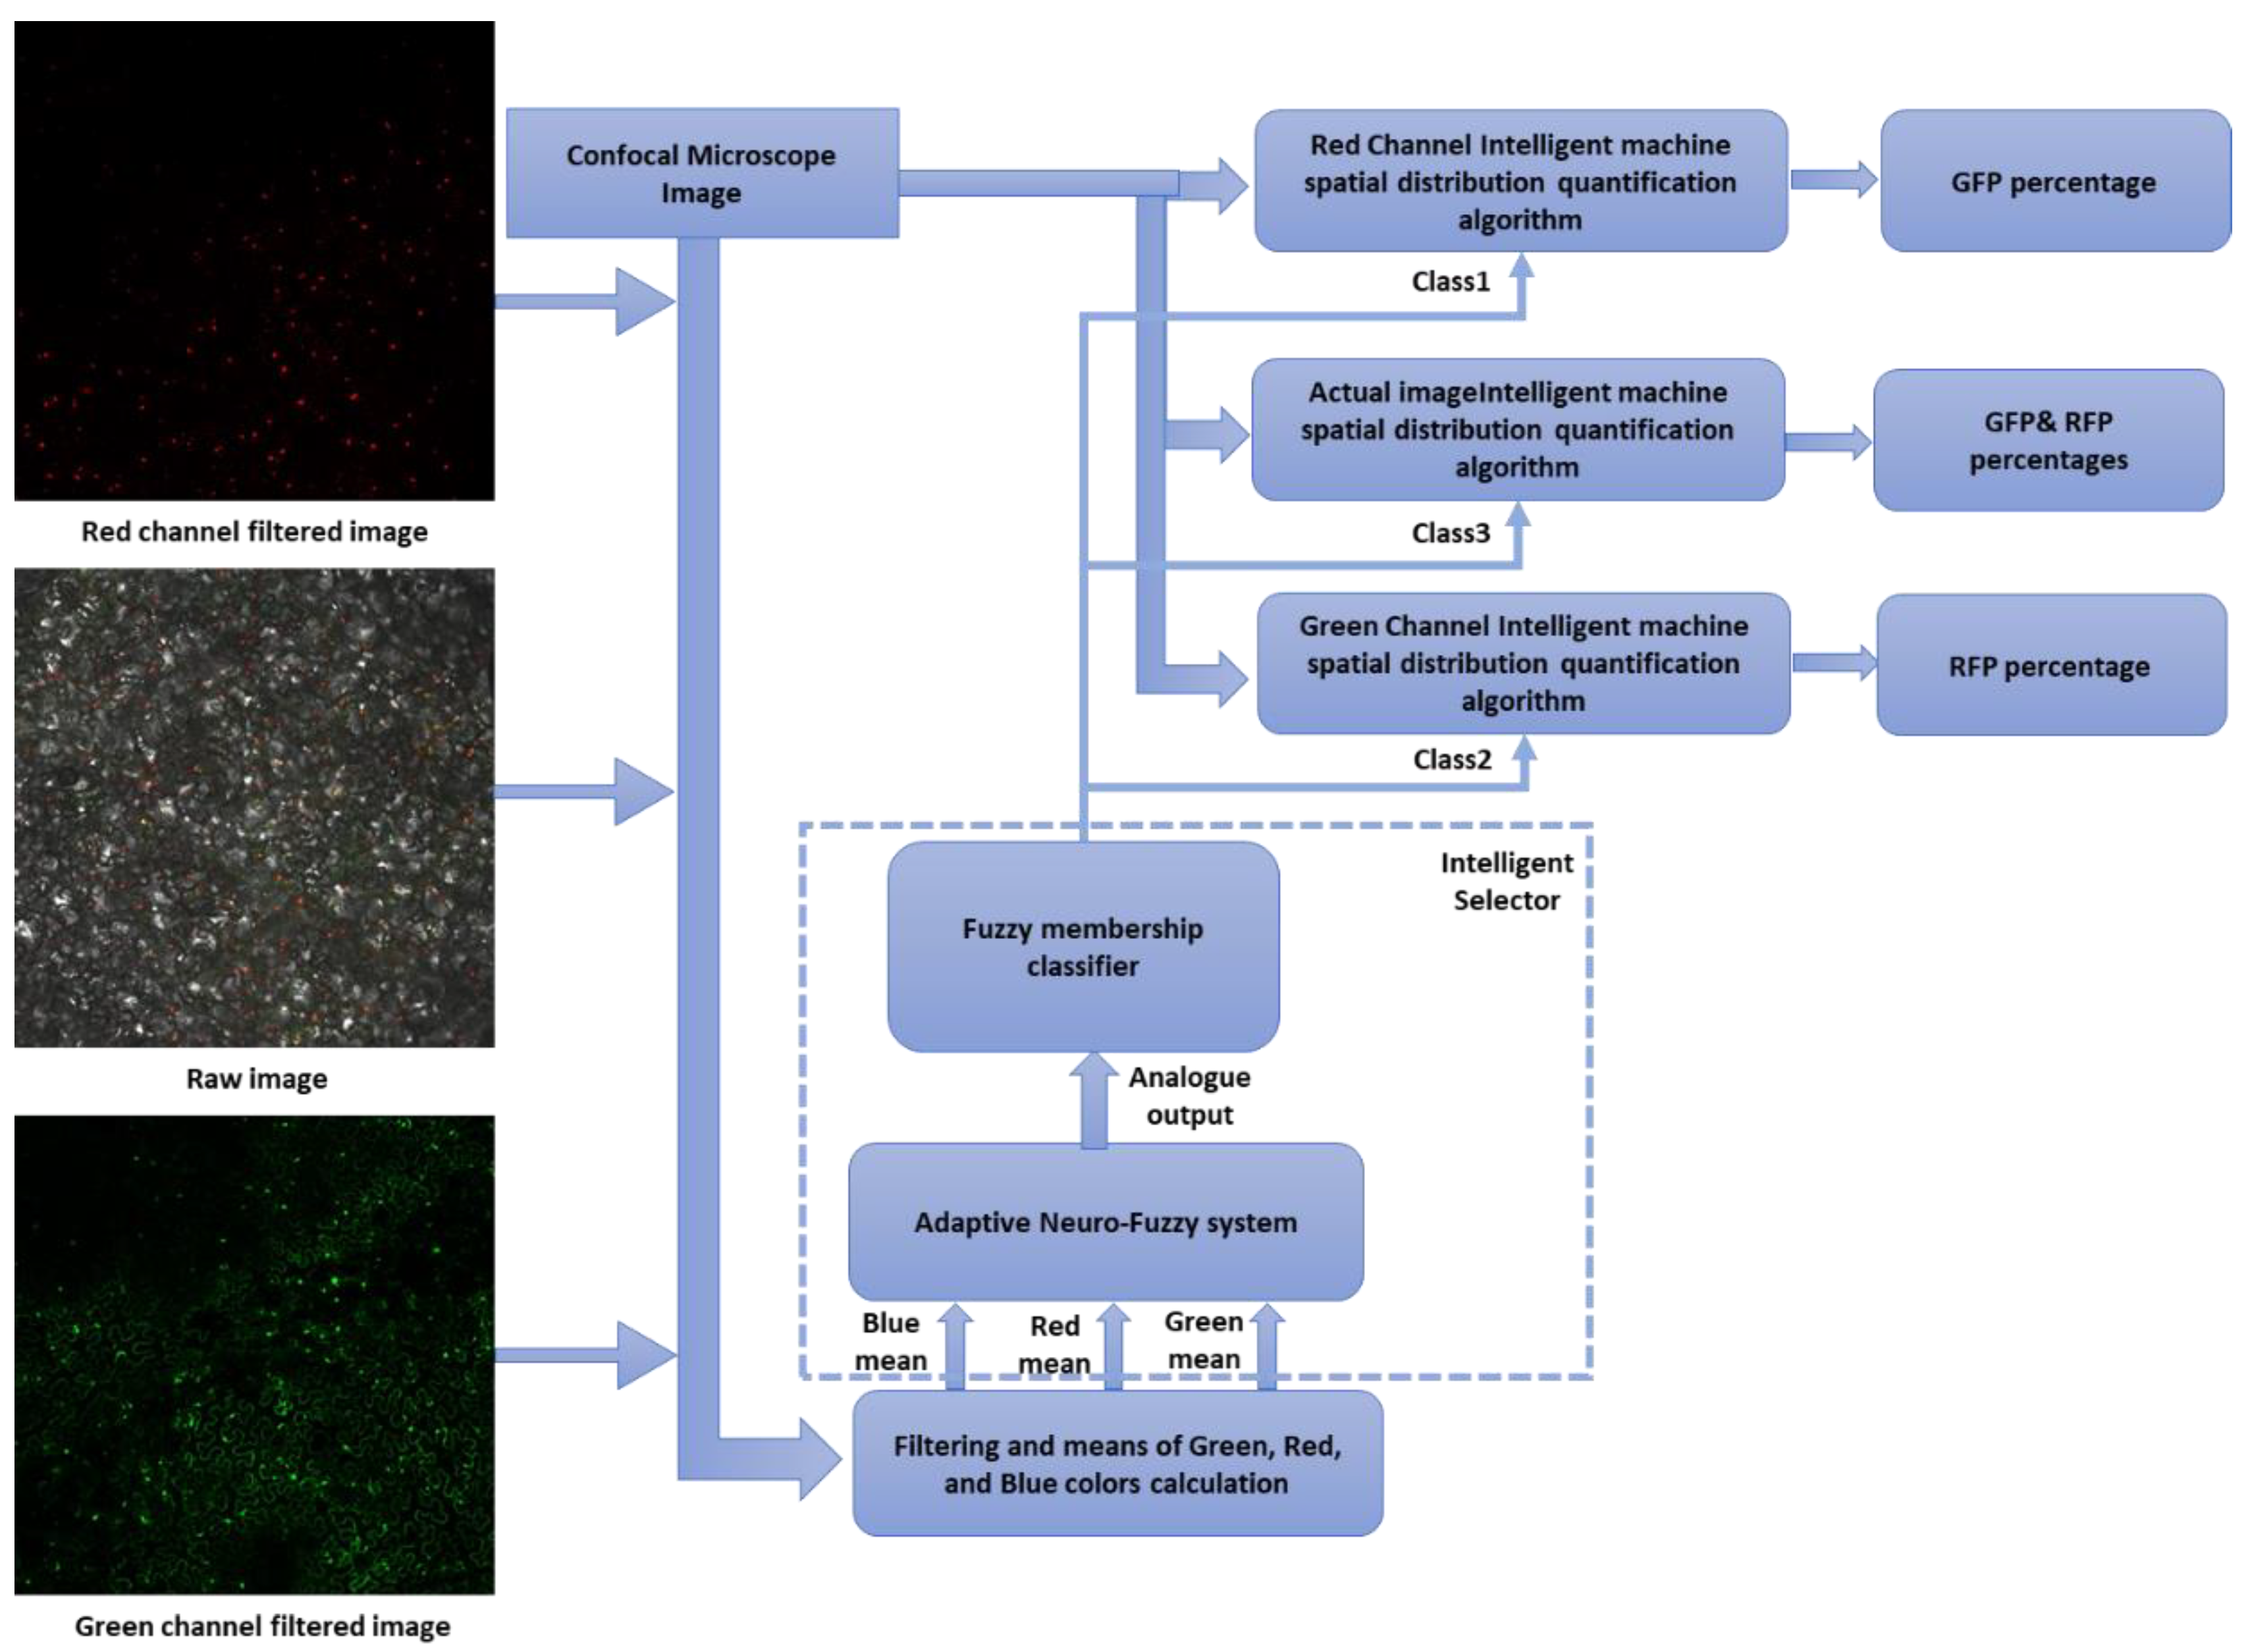
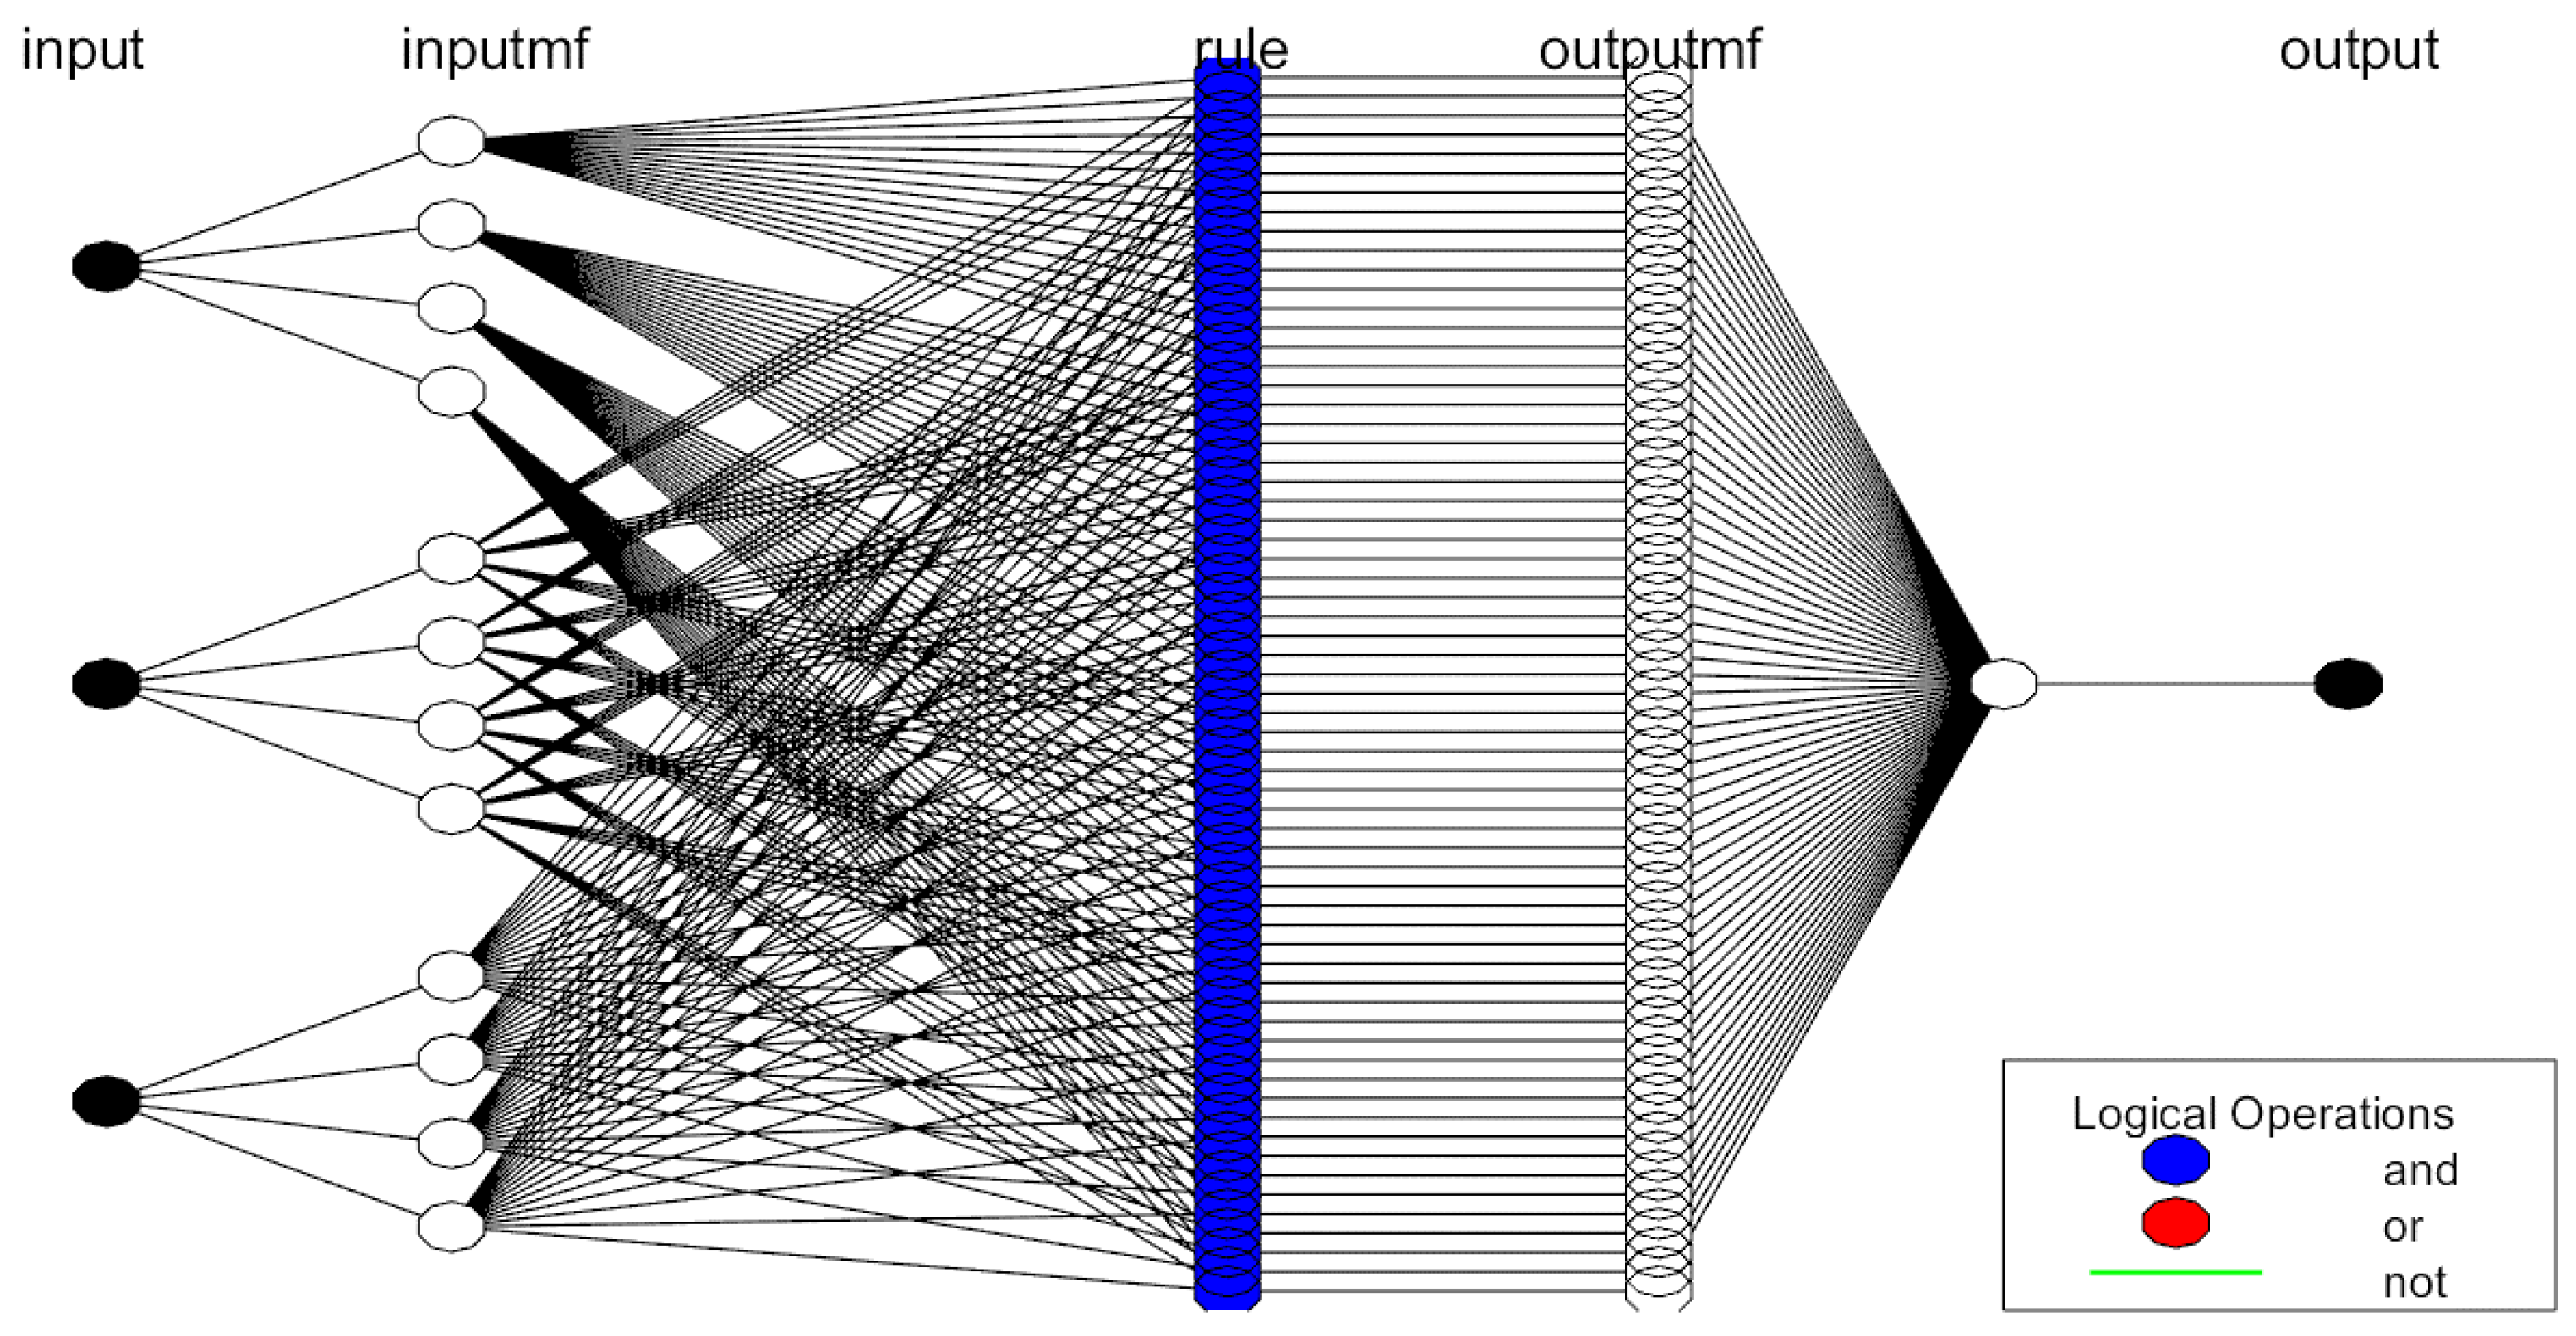
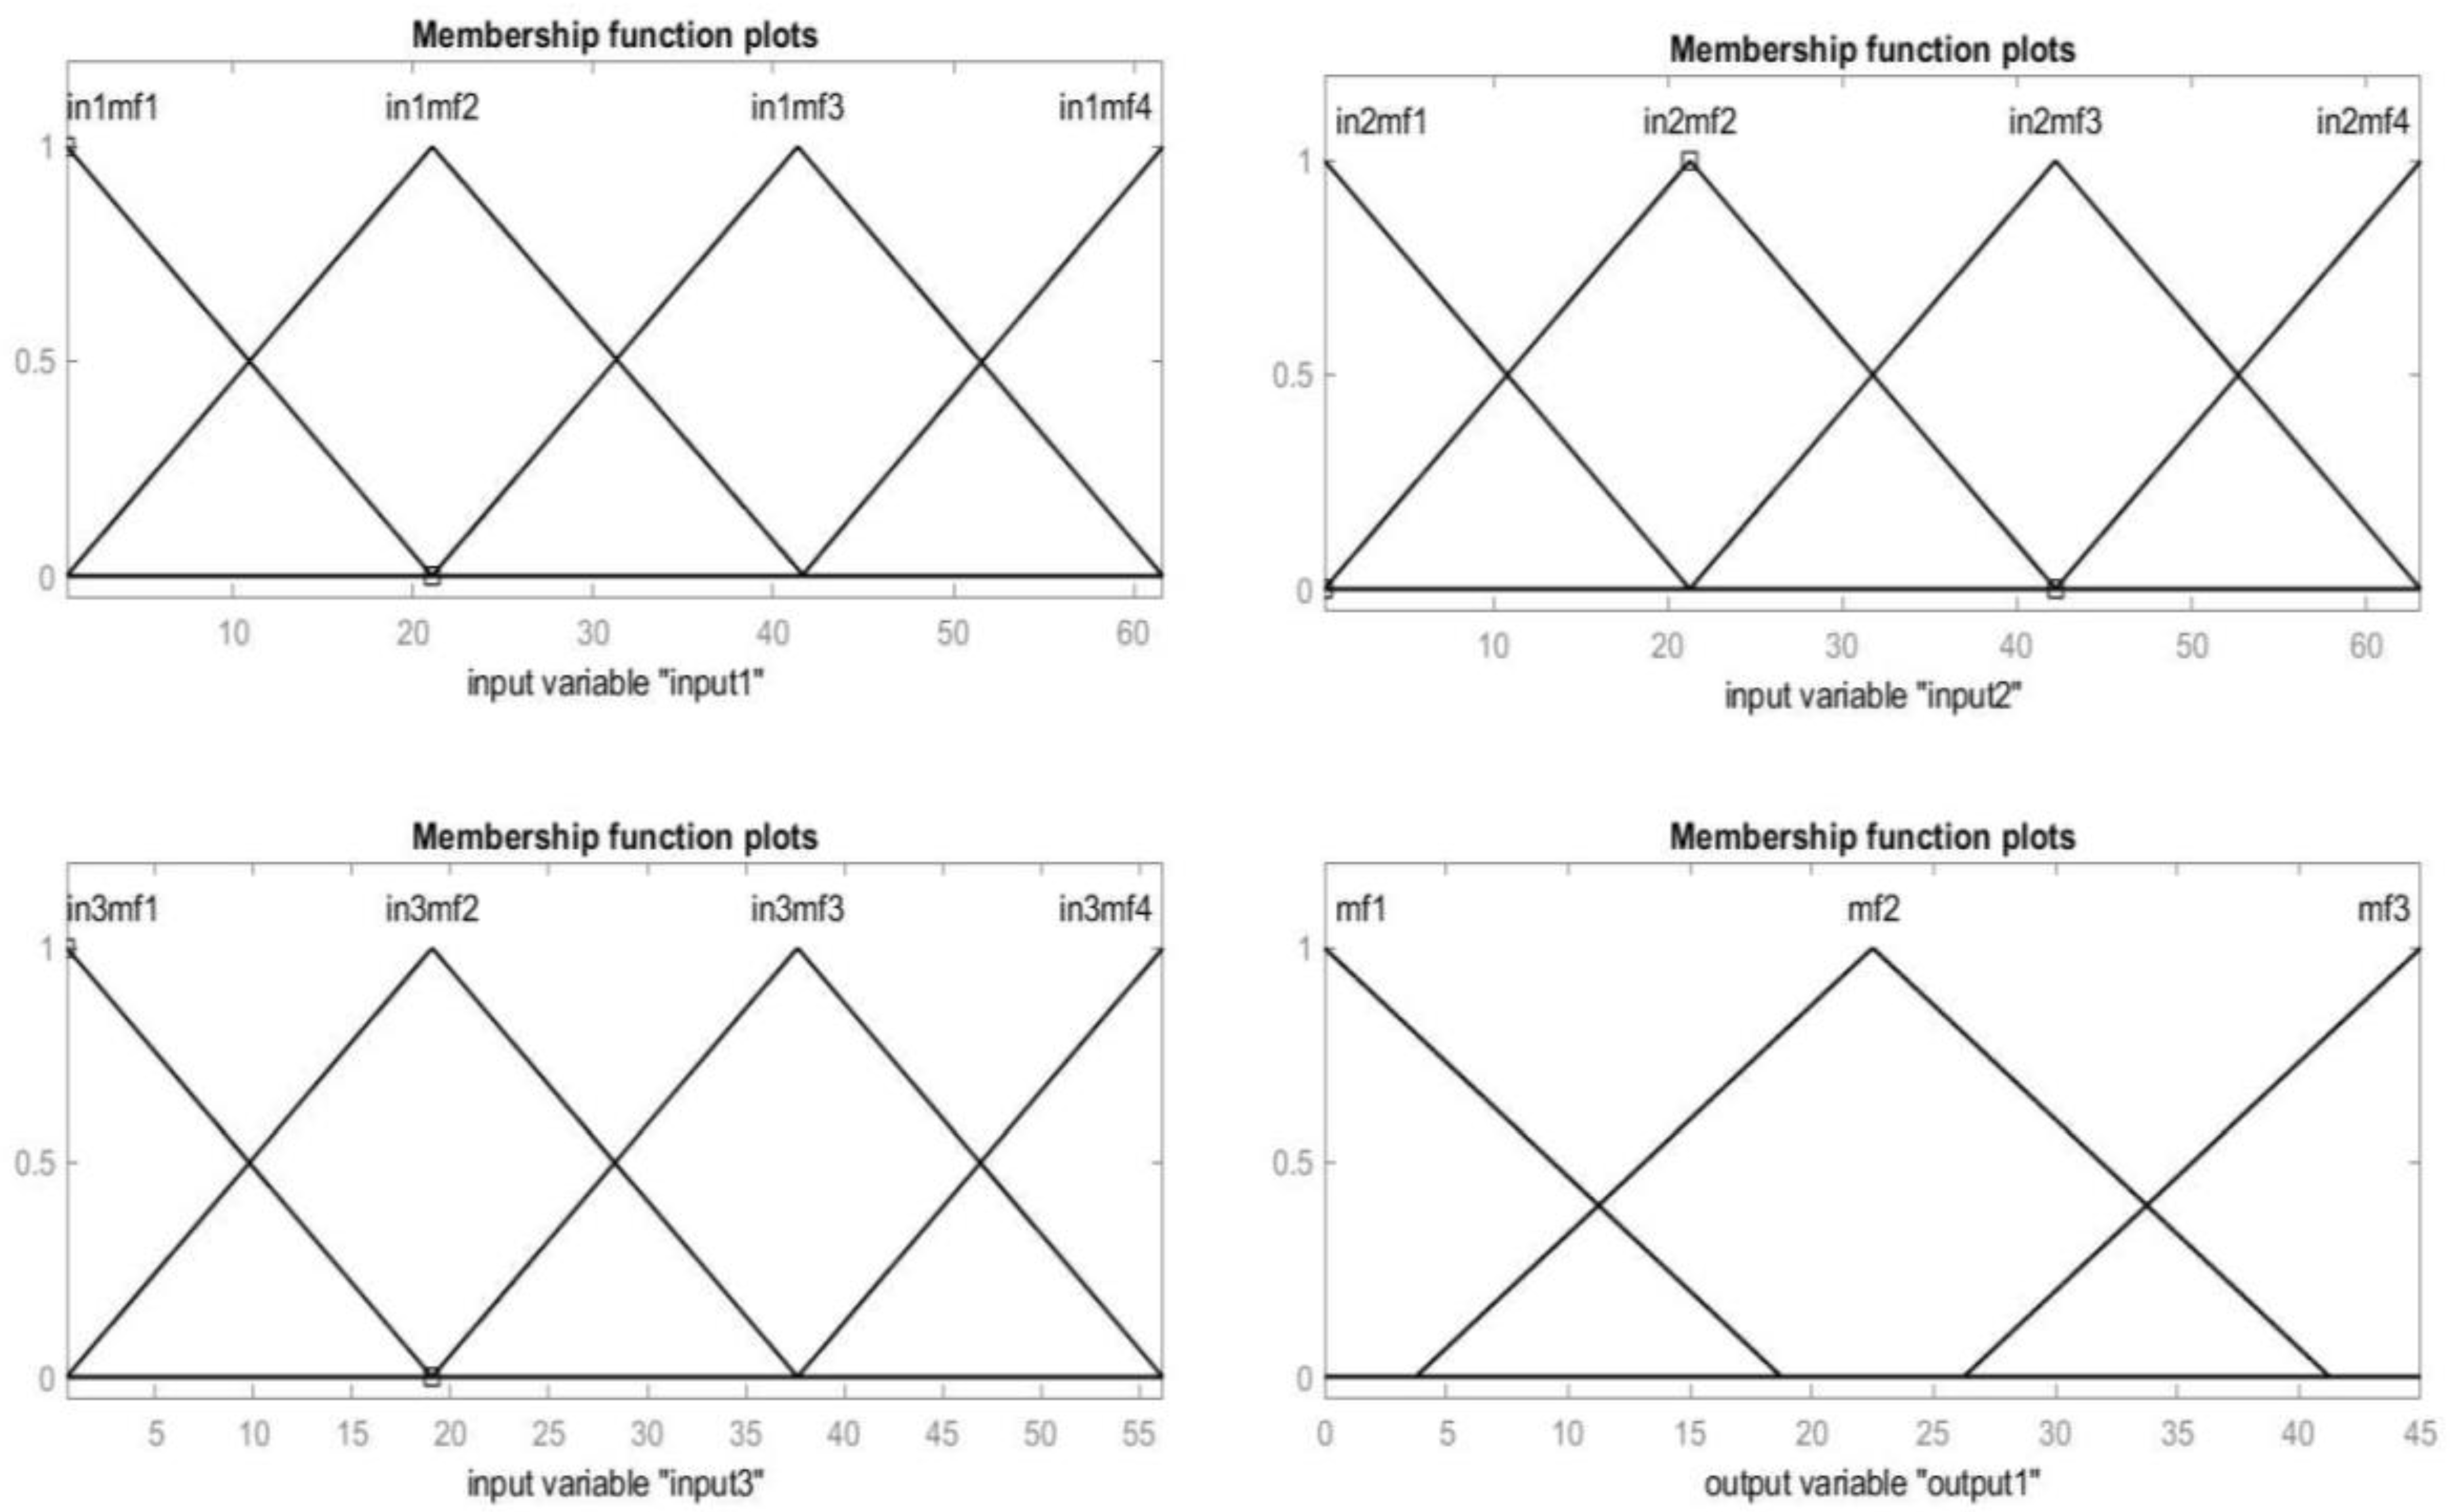
The intricacy of the automatic process of a specific confocal microscope image with a suitable algorithm inspires the design of an accurate, intelligent selector proficient at achieving smart selection. As a result, the intelligent selector was successfully designed to directly process raw confocal microscope images imported from the microscope without prior knowledge of the user parameters settings. The intelligent selector is based on a novel multiclass adaptive neuro-fuzzy classifier (MANFC) which is designed based on the collected dataset in Table 1. The selector is tested with fresh samples to find out its realistic accuracy. The designed intelligent selector approves its high performance by the test confusion matrix with 100% accuracies shown in Figure 12. The selector is trusted to activate the appropriate processing algorithm to extract the spatial distribution of red and green colors as a percentage.
Interclass correlation coefficients were used to complete an objective comparison. The method produces an extensive understanding of the correlation between AIMSDQA findings and the experts’ readings. Furthermore, it is possible to run the calculations in parallel for window individual computations; however, the related sampling and value range settings remain independent from such calculations.
In order to facilitate an objective comparison of the method, intraclass correlation coefficients were used to provide a deep thought about the correlation between the experts’ readings (subjective estimation) and IMSDQA readings to evaluate RFP and GFP ratio objectively. The intelligent machine spatial distribution quantification system proves to be highly correlated with subjective estimation, with ICC of 99% for RFP percentage estimation and 97% for GFP percentage estimation. Hence, the hypothesis of accepting the system reading is achieved. The reason for obtaining a higher correlation in REP estimation than in GEP is clarified using Figure 13 compared to Figure 14. From these figures, it is obvious that the data points value in Figure 13 of the REP correlation is clustered around zero and 90, while in Figure 14, the data points are distributed along the correlation line. The proposed algorithm is built based on three processing algorithms to obtain the RFP and GFP percentage estimation, as shown in Figure 3. Thus, further testing the system regarding these units is important to improve the general insight into any individual drawbacks. The red and green channel intelligent machine spatial distribution quantification algorithm reached an ICC of 99%. This is also proven when the tracking and correlation ability were analyzed in Figure 15 and Figure 16. These two processing units were near the subjective tracking estimations and the correlation line in the Figures. The actual image intelligent machine spatial distribution quantification algorithm achieves an ICC of 94% with almost acceptable hypotheses, which can be explained by Figure 17. The tracking and correlation are provided in Figure 17, where type dispersal around the correlation line with adequate tracking ability can be noticed. Therefore, in Figure 18, further investigation was performed with the probability of grey background in live FCM images resulting in inaccurate quantification for specific samples.
Lastly, the proposed algorithm provided a more effortless and faster methodology for quantifying and analyzing FCM images, showing high accuracy compared to the traditional analysis method. Further, this methodology does not require special sample preparations or extensive optimization of instrument settings. Apart from analyzing the spatial distribution of fluorescence in the samples, the proposed algorithm with fluorescence microscopy can also be used to analyze visible and sub-visible aggregates. The methodology offers significant advantages over other common approaches. Fluorescence sizing from 1 µm backward cannot be differentiated using a simple visual method due to the limitation of human vision, but it could be efficiently detected using the proposed method without any requirement of complex sample preparation steps. Moreover, unlike black backgrounds, when analyzing images with a grey background (actual image), it is not easy for human vision to differentiate the green or red colors from a grey background. The grey background in live FCM images may result in inaccurate quantification for particular samples. Fluorescence microscopy analysis prevents false detection of dust, air bubbles, and non-proteinaceous particles that could plague the study [27]. Overall, it can be concluded that the proposed algorithm can successfully denoise the fluorescence microscope images. The proposed methodology can be effectively used as a cheap, sustainable, and complementary technique to traditional approaches. However, the results of this work show a promising path to quantifying and analyzing FCM images sustainably and quickly. It is essential to use every effort in order to build sustainable biotechnology laboratories [28,29,30]; the current results add to the knowledge of sustainable biotechnology by providing a methodology that saves time and labor in the laboratory.

4.1. Sustainability Evaluation of the Technique Proposed

In general, designing algorithms can contribute to sustainability in a number of ways. In the proposed algorithm, this work focused on analyzing confocal microscope images. Image processing algorithms are designed to perform various tasks such as image enhancement, object recognition, and feature extraction automatically. These algorithms can process images faster and with more accuracy than humans in many cases, and they are particularly useful for tasks that require repetitive or time-consuming image analysis. However, it is important to note that algorithms are not capable of replacing human intuition, creativity, and judgment in all cases. In some situations, human input may be required to validate the results of image processing algorithms or to make decisions based on the results of the processing. With this regard, three experts evaluated the results in the obtained images (Table 2).

4.2. Sustainability with Regard to Time-Saving

Algorithms can save time in image processing by automating many tasks that would otherwise require human effort. For example, algorithms can quickly analyze a large number of images and identify patterns or features in images that may be difficult for a human to detect. This can include detecting edges and lines, identifying objects or patterns, and recognizing shapes and textures. Algorithms can also be designed to perform complex image manipulations, such as adjusting brightness and contrast, enhancing color or texture, and removing noise, much more efficiently than a human could. By automating these tasks, algorithms can significantly reduce the time required for image processing, freeing up time for more creative or high-level tasks. In the proposed algorithm, the average computation cost of the intelligent machine spatial distribution quantification system is 0.1 s to one raw confocal microscope image and provides the objective evaluation of it. The experiment is implemented on a Windows 10, 64-bit intel machine with a 2.50 GHz core i5 CPU and 8 GB RAM. This is much faster than the regular time consumed by one expert who evaluated the same amount of data in at least 3 min. Moreover, in the case of time required to analyze large amounts of data, the usual time spent by humans in the laboratory is 8 h per day. In the case of a machine, it could continue for a longer time, in some cases up to 24 h per day.

4.3. Sustainability in Labor

The proposed algorithm contributes to saving human effort in biotechnology laboratories by automating the image processing and streamlining many tasks that would otherwise require manual effort. This includes tasks such as image recognition, object detection, segmentation, and classification, which are repetitive for humans to perform and require more than one expert to check and validate the results. By using algorithms, these tasks can be accomplished much faster and with a higher degree of accuracy and consistency, freeing up human resources to focus on more strategic and creative tasks in the laboratory. Additionally, algorithms can analyze vast amounts of data and perform complex calculations, enabling them to make decisions and draw insights that would be beyond the capacity of human effort alone. Another aspect to be taken into consideration is the performance of humans. The accuracy of analysis by humans may vary depending on the time that the expert does the analysis. If the person is sick or can not perform perfectly for any reason, the evaluation of the image will not be as accurate as the healthy person.

5. Conclusions

Firstly, and most importantly, the field of biotechnology lacks image processing algorithms to analyze the huge FCM continuing outcomes. To the best of our knowledge, many published studies have an insufficient methodology to ensure accurate results of fluorescence quantification and protein co-localization. This work proposed an algorithm that can quantify the spatial distribution of fluorescence in FCM images as well as detect the co-localization of GFP/RFP labeled proteins with high accuracy in detecting GFP or RFP separately on a black or grey (live image) background. This work applied a dataset that was previously quantified using a visual quantification technique to train the proposed algorithm to classify the presence of fluorescence severity, investigating the existence of proteins alone or colocalized with other proteins.
The main contribution of this work was the identification of the fluorescence of proteins from different backgrounds of images and the discrimination of different object shapes. Additionally, the suggested use of the proposed method can help to allow more clarity in interpreting and comparing the results, aiming to enable biologists to analyze a large number of FCM images in a short time. These contributions can improve further research to give tools for biologists to utilize this method when evaluating a subject, more than simply finding a single or colocalized protein.
The limitations of this study lie mainly in the number of samples in the dataset. However, it can be speculated about these by collecting and subjectively evaluating more from the actual FCMs. For further work, the estimation ability of the actual image intelligent machine spatial distribution quantification algorithm will be improved.

Author Contributions

Conceptualization, M.A. and A.A.; methodology, A.A. and M.A.; software, A.A., O.S., and N.K.; validation, M.A., G.A., and A.A.; formal analysis, A.A. and M.A.; investigation, M.A. and A.A.; resources, M.A., O.S., and N.K.; data curation, M.A.; writing—original draft preparation, M.A. and A.A.; writing—review and editing, G.A. and M.A.; visualization, M.A.; supervision, M.A.; project administration, M.A. and A.A.; funding acquisition, O.S., N.K., and M.A. All authors have read and agreed to the published version of the manuscript.

Funding

This research received no external funding.

Institutional Review Board Statement

Not applicable.

Informed Consent Statement

Not applicable.

Data Availability Statement

Not applicable.

Conflicts of Interest

The authors declare no conflict of interest.

References

  1. Elliott, A.D. Confocal Microscopy: Principles and Modern Practices. Curr. Protoc. Cytom. 2020, 92, e68. [Google Scholar] [CrossRef] [PubMed]
  2. Wang, S.; Larina, I.V. High-Resolution Imaging Techniques in Tissue Engineering. In Monitoring and Evaluation of Biomaterials and their Performance In Vivo; Narayan, R.J., Ed.; Woodhead Publishing: Sawston, UK, 2017; pp. 151–180. ISBN 978-0-08-100603-0. [Google Scholar]
  3. Sacher, R.; Stergiou, L.; Pelkmans, L. Lessons from Genetics: Interpreting Complex Phenotypes in RNAi Screens. Curr. Opin. Cell Biol. 2008, 20, 483–489. [Google Scholar] [CrossRef] [PubMed]
  4. Sbalzarini, I.F.; Koumoutsakos, P. Feature Point Tracking and Trajectory Analysis for Video Imaging in Cell Biology. J. Struct. Biol. 2005, 151, 182–195. [Google Scholar] [CrossRef] [PubMed]
  5. Jaqaman, K.; Loerke, D.; Mettlen, M.; Kuwata, H.; Grinstein, S.; Schmid, S.L.; Danuser, G. Robust Single-Particle Tracking in Live-Cell Time-Lapse Sequences. Nat. Methods 2008, 5, 695–702. [Google Scholar] [CrossRef] [Green Version]
  6. Teske, C.A.; Schroeder, M.; Simon, R.; Hubbuch, J. Protein-Labeling Effects in Confocal Laser Scanning Microscopy. J. Phys. Chem. B 2005, 109, 13811–13817. [Google Scholar] [CrossRef] [Green Version]
  7. LaPan, P.; Zhang, J.; Pan, J.; Hill, A.; Haney, S.A. Single Cell Cytometry of Protein Function in RNAi Treated Cells and in Native Populations. BMC Cell Biol. 2008, 9, 43. [Google Scholar] [CrossRef] [Green Version]
  8. Pepperkok, R.; Ellenberg, J. High-Throughput Fluorescence Microscopy for Systems Biology. Nat. Rev. Mol. Cell Biol. 2006, 7, 690–696. [Google Scholar] [CrossRef]
  9. Adhab, M.; Schoelz, J.E. A Novel Assay Based on Confocal Microscopy to Test for Pathogen Silencing Suppressor Functions. In Plant Innate Immunity; Gassmann, W., Ed.; Methods in Molecular Biology; Springer: New York, NY, USA, 2019; Volume 1991, pp. 33–42. ISBN 978-1-4939-9457-1. [Google Scholar]
  10. Salvi, M.; Morbiducci, U.; Amadeo, F.; Santoro, R.; Angelini, F.; Chimenti, I.; Massai, D.; Messina, E.; Giacomello, A.; Pesce, M.; et al. Automated Segmentation of Fluorescence Microscopy Images for 3D Cell Detection in Human-Derived Cardiospheres. Sci. Rep. 2019, 9, 6644. [Google Scholar] [CrossRef] [Green Version]
  11. Smal, I.; Loog, M.; Niessen, W.; Meijering, E. Quantitative Comparison of Spot Detection Methods in Fluorescence Microscopy. IEEE Trans. Med. Imaging 2010, 29, 282–301. [Google Scholar] [CrossRef]
  12. Chen, T.-B.; Lu, H.H.-S.; Lee, Y.-S.; Lan, H.-J. Segmentation of CDNA Microarray Images by Kernel Density Estimation. J. Biomed. Inform. 2008, 41, 1021–1027. [Google Scholar] [CrossRef] [Green Version]
  13. Prodanov, D.; Heeroma, J.; Marani, E. Automatic Morphometry of Synaptic Boutons of Cultured Cells Using Granulometric Analysis of Digital Images. J. Neurosci. Methods 2006, 151, 168–177. [Google Scholar] [CrossRef] [PubMed]
  14. Soille, P. Morphological Image Analysis; Springer: Berlin/Heidelberg, Germany, 1999; ISBN 978-3-662-03941-0. [Google Scholar]
  15. Olivo-Marin, J.-C. Extraction of Spots in Biological Images Using Multiscale Products. Pattern Recognit. 2002, 35, 1989–1996. [Google Scholar] [CrossRef]
  16. Bertin, E.; Arnouts, S. SExtractor: Software for Source Extraction. Astron. Astrophys. Suppl. Ser. 1996, 117, 393–404. [Google Scholar] [CrossRef]
  17. Zhong, W.; Fu, X.; Zhang, M. A Muscle Synergy-Driven ANFIS Approach to Predict Continuous Knee Joint Movement. IEEE Trans. Fuzzy Syst. 2022, 30, 1553–1563. [Google Scholar] [CrossRef]
  18. Tian, H.; Wang, T.; Liu, Y.; Qiao, X.; Li, Y. Computer Vision Technology in Agricultural Automation—A Review. Inf. Process. Agric. 2020, 7, 1–19. [Google Scholar] [CrossRef]
  19. OTSU, N. A Threshold Selection Method from Gray—Scale Histograms. IEEE Trans. Syst. Man Cybern. 1979, 9, 62–66. [Google Scholar] [CrossRef] [Green Version]
  20. Filipe, V.; Poole, R.; Kutscher, M.; Forier, K.; Braeckmans, K.; Jiskoot, W. Fluorescence Single Particle Tracking for the Characterization of Submicron Protein Aggregates in Biological Fluids and Complex Formulations. Pharm. Res. 2011, 28, 1112–1120. [Google Scholar] [CrossRef] [Green Version]
  21. Filipe, V.; Poole, R.; Oladunjoye, O.; Braeckmans, K.; Jiskoot, W. Detection and Characterization of Subvisible Aggregates of Monoclonal IgG in Serum. Pharm. Res. 2012, 29, 2202–2212. [Google Scholar] [CrossRef] [Green Version]
  22. Braeckmans, K.; Buyens, K.; Bouquet, W.; Vervaet, C.; Joye, P.; Vos, F.D.; Plawinski, L.; Doeuvre, L.; Angles-Cano, E.; Sanders, N.N.; et al. Sizing Nanomatter in Biological Fluids by Fluorescence Single Particle Tracking. Nano Lett. 2010, 10, 4435–4442. [Google Scholar] [CrossRef] [Green Version]
  23. Arvinte, T.; Palais, C.; Green-Trexler, E.; Gregory, S.; Mach, H.; Narasimhan, C.; Shameem, M. Aggregation of Biopharmaceuticals in Human Plasma and Human Serum: Implications for Drug Research and Development. MAbs 2013, 5, 491–500. [Google Scholar] [CrossRef] [Green Version]
  24. Demeule, B.; Shire, S.J.; Liu, J. A Therapeutic Antibody and Its Antigen Form Different Complexes in Serum than in Phosphate-Buffered Saline: A Study by Analytical Ultracentrifugation. Anal. Biochem. 2009, 388, 279–287. [Google Scholar] [CrossRef] [PubMed]
  25. Ye, Z.; Wang, X.; Xiao, L. Single-Particle Tracking with Scattering-Based Optical Microscopy. Anal. Chem. 2019, 91, 15327–15334. [Google Scholar] [CrossRef] [PubMed] [Green Version]
  26. den Engelsman, J.; Garidel, P.; Smulders, R.; Koll, H.; Smith, B.; Bassarab, S.; Seidl, A.; Hainzl, O.; Jiskoot, W. Strategies for the Assessment of Protein Aggregates in Pharmaceutical Biotech Product Development. Pharm. Res. 2011, 28, 920–933. [Google Scholar] [CrossRef] [PubMed] [Green Version]
  27. Demeule, B.; Gurny, R.; Arvinte, T. Detection and Characterization of Protein Aggregates by Fluorescence Microscopy. Int. J. Pharm. 2007, 329, 37–45. [Google Scholar] [CrossRef] [PubMed]
  28. Al-Ani, R.A.; Sabir, L.J.; Adhab, M.A.; Hassan, A.K. Response of Some Melon Cultivars to Infection by Cucumber Mosaic Virus Under Field Conditions. Iraqi J. Agric. Sci. 2009, 40, 1–8. [Google Scholar]
  29. Alani, R.; Adhab, M.; Hamad, S. Evaluation the Efficiency of Different Techniques for Extraction and Purification of Tomato Yellow Leaf Curl Virus (TYLCV). Baghdad Sci. J. 2011, 8, 447–452. [Google Scholar]
  30. Adhab, M. Identification of The Causal Agent of Strip Leaves Symptoms on Tomato in Protective Houses. Iraqi J. Biotechnol. 2010, 9, 607–617. [Google Scholar]
Figure 1. An analysis of RFP reveals the expression of RFP in only 83 of 100 squares.
Sustainability 15 03726 g001
Figure 2. Confocal microscope images.
Sustainability 15 03726 g002
Figure 3. The main parts of the intelligent machine spatial distribution quantification system.
Sustainability 15 03726 g003
Figure 4. The average experts’ opinion is represented by the color bar where integer 1 for Class 1 (red channel filtered algorithm is activated), integer 15 for Class 2 (green channel filtered algorithm is activated), and integer 30 for Class 3 (actual image algorithm is activated). R, G, and B means are drawn for the collected 100 points (confocal microscope images).
Sustainability 15 03726 g004
Figure 5. The designed adaptive neuro-fuzzy single analog output structure with five layers: three inputs, four membership functions for every input, rules to control the operation, output membership function, and the summarized output.
Sustainability 15 03726 g005
Figure 6. Inputs and output membership functions shape and intersection values.
Sustainability 15 03726 g006
Figure 7. The intelligent machine spatial distribution quantification filtered algorithm.
Sustainability 15 03726 g007
Figure 8. Pseudo code of the intelligent machine spatial distribution quantification filtered algorithm.
Sustainability 15 03726 g008
Figure 9. The main algorithm’s four processing phases result when applied to the three types of confocal images with the modification effect of every phase.
Sustainability 15 03726 g009
Figure 10. The system output performance in tracking the training dataset labels at the end of training.
Sustainability 15 03726 g010
Figure 11. The system output performance in tracking the testing dataset.
Sustainability 15 03726 g011
Figure 12. The confusion matrix of the intelligent selector as a response to the testing dataset.
Sustainability 15 03726 g012
Figure 13. The correlation of subjective and objective evaluation of RFP ratio estimation: (Top) Using correlation line; (Bottom) actual RFP ratio estimation by every sample number on the x-axis.
Sustainability 15 03726 g013
Figure 14. The correlation of subjective and objective evaluation of GFP ratio estimation: (Top) Using correlation line; (Bottom) actual GFP ratio estimation by every sample number on x-axis.
Sustainability 15 03726 g014
Figure 15. The red channel intelligent machine spatial distribution quantification algorithm estimation correlation between the subjective and objective evaluation of RFP and GFP ratio estimation: (Top) Using correlation line; (Bottom) actual RFP and GFP ratio estimation by every sample number in x-axis.
Sustainability 15 03726 g015
Figure 16. The green channel intelligent machine spatial distribution quantification algorithm estimation correlation between the subjective and objective evaluation of RFP and GFP ratio estimation: (Top) Using correlation line; (Bottom) actual RFP and GFP ratio estimation by every sample number on x-axis.
Sustainability 15 03726 g016
Figure 17. The actual image intelligent machine spatial distribution quantification algorithm estimation correlation between the subjective and objective evaluation of RFP and GFP ratio estimation: (Top) Using correlation line; (Bottom) actual RFP and GFP ratio estimation by every sample number on x-axis.
Sustainability 15 03726 g017
Figure 18. Using actual image intelligent machine spatial distribution quantification algorithm to objectively evaluate RFP and GFP ratio in one of the complicated samples.
Sustainability 15 03726 g018
Table 1. The dataset shows the number of samples of the three types of confocal microscope images.
Red Channel Confocal Microscope ImagesActual Confocal Microscope ImageGreen Channel Confocal Microscope Images
303832
Table 2. Two samples of the collected data, with the first raw containing the three experts’ opinions about the red ratio, green ratio, and the class of the image (Pic).
Expert1Expert2Expert3
Pic No.Red_ratioGreen_ratioClass selectionRed_ratioGreen_ratioClass selection2Red_ratioGreen_ratioClass selection3
1880189018801
2990199019901
::::::::::
100950195018501
Disclaimer/Publisher’s Note: The statements, opinions and data contained in all publications are solely those of the individual author(s) and contributor(s) and not of MDPI and/or the editor(s). MDPI and/or the editor(s) disclaim responsibility for any injury to people or property resulting from any ideas, methods, instructions or products referred to in the content.

