
Comprehensive Correlation for the Prediction of the Heat Release Characteristics of Diesel/CNG Mixtures in a Single-Zone Combustion Model


Abstract
:1. Introduction
2. Materials and Methods
2.1. An Assessment of the Combustion Characteristics of Compression Ignition Engine Using a Single-Zone Thermodynamic Model
2.2. Fuel Specifications
2.3. Theoretical Background
3. Results
3.1. Engine Coherency Analysis for Identification of the Aspects and Impacts of %CNG on a Combustion Cycle
3.2. Analytical Approach for Evaluation of Factors Influencing the Heat Release
3.3. Exploration of the Indicated Parameters Associated with a Given Heat Release Pattern When D/CNG Is Used in Dual Fuel Mode
4. Validation of the Newly Derrived Equation
5. Conclusions
- (1)
- It was found that the use of the single-zone model for the detailed assessment of an unmodified ICE in dual fuel mode gives a calculation error of 29% for the establishment of the total energy losses of heat energy generated during the combustion, compared to Qtotal_corr (see Table 5). Furthermore, the difference between the calculated and experimentally established φz (duration of heat release) may exceed 307% (see Table 8), while the indicators of the diesel engine (pme, ηe, etc.) may differ by more than two times (see Table 7).
- (2)
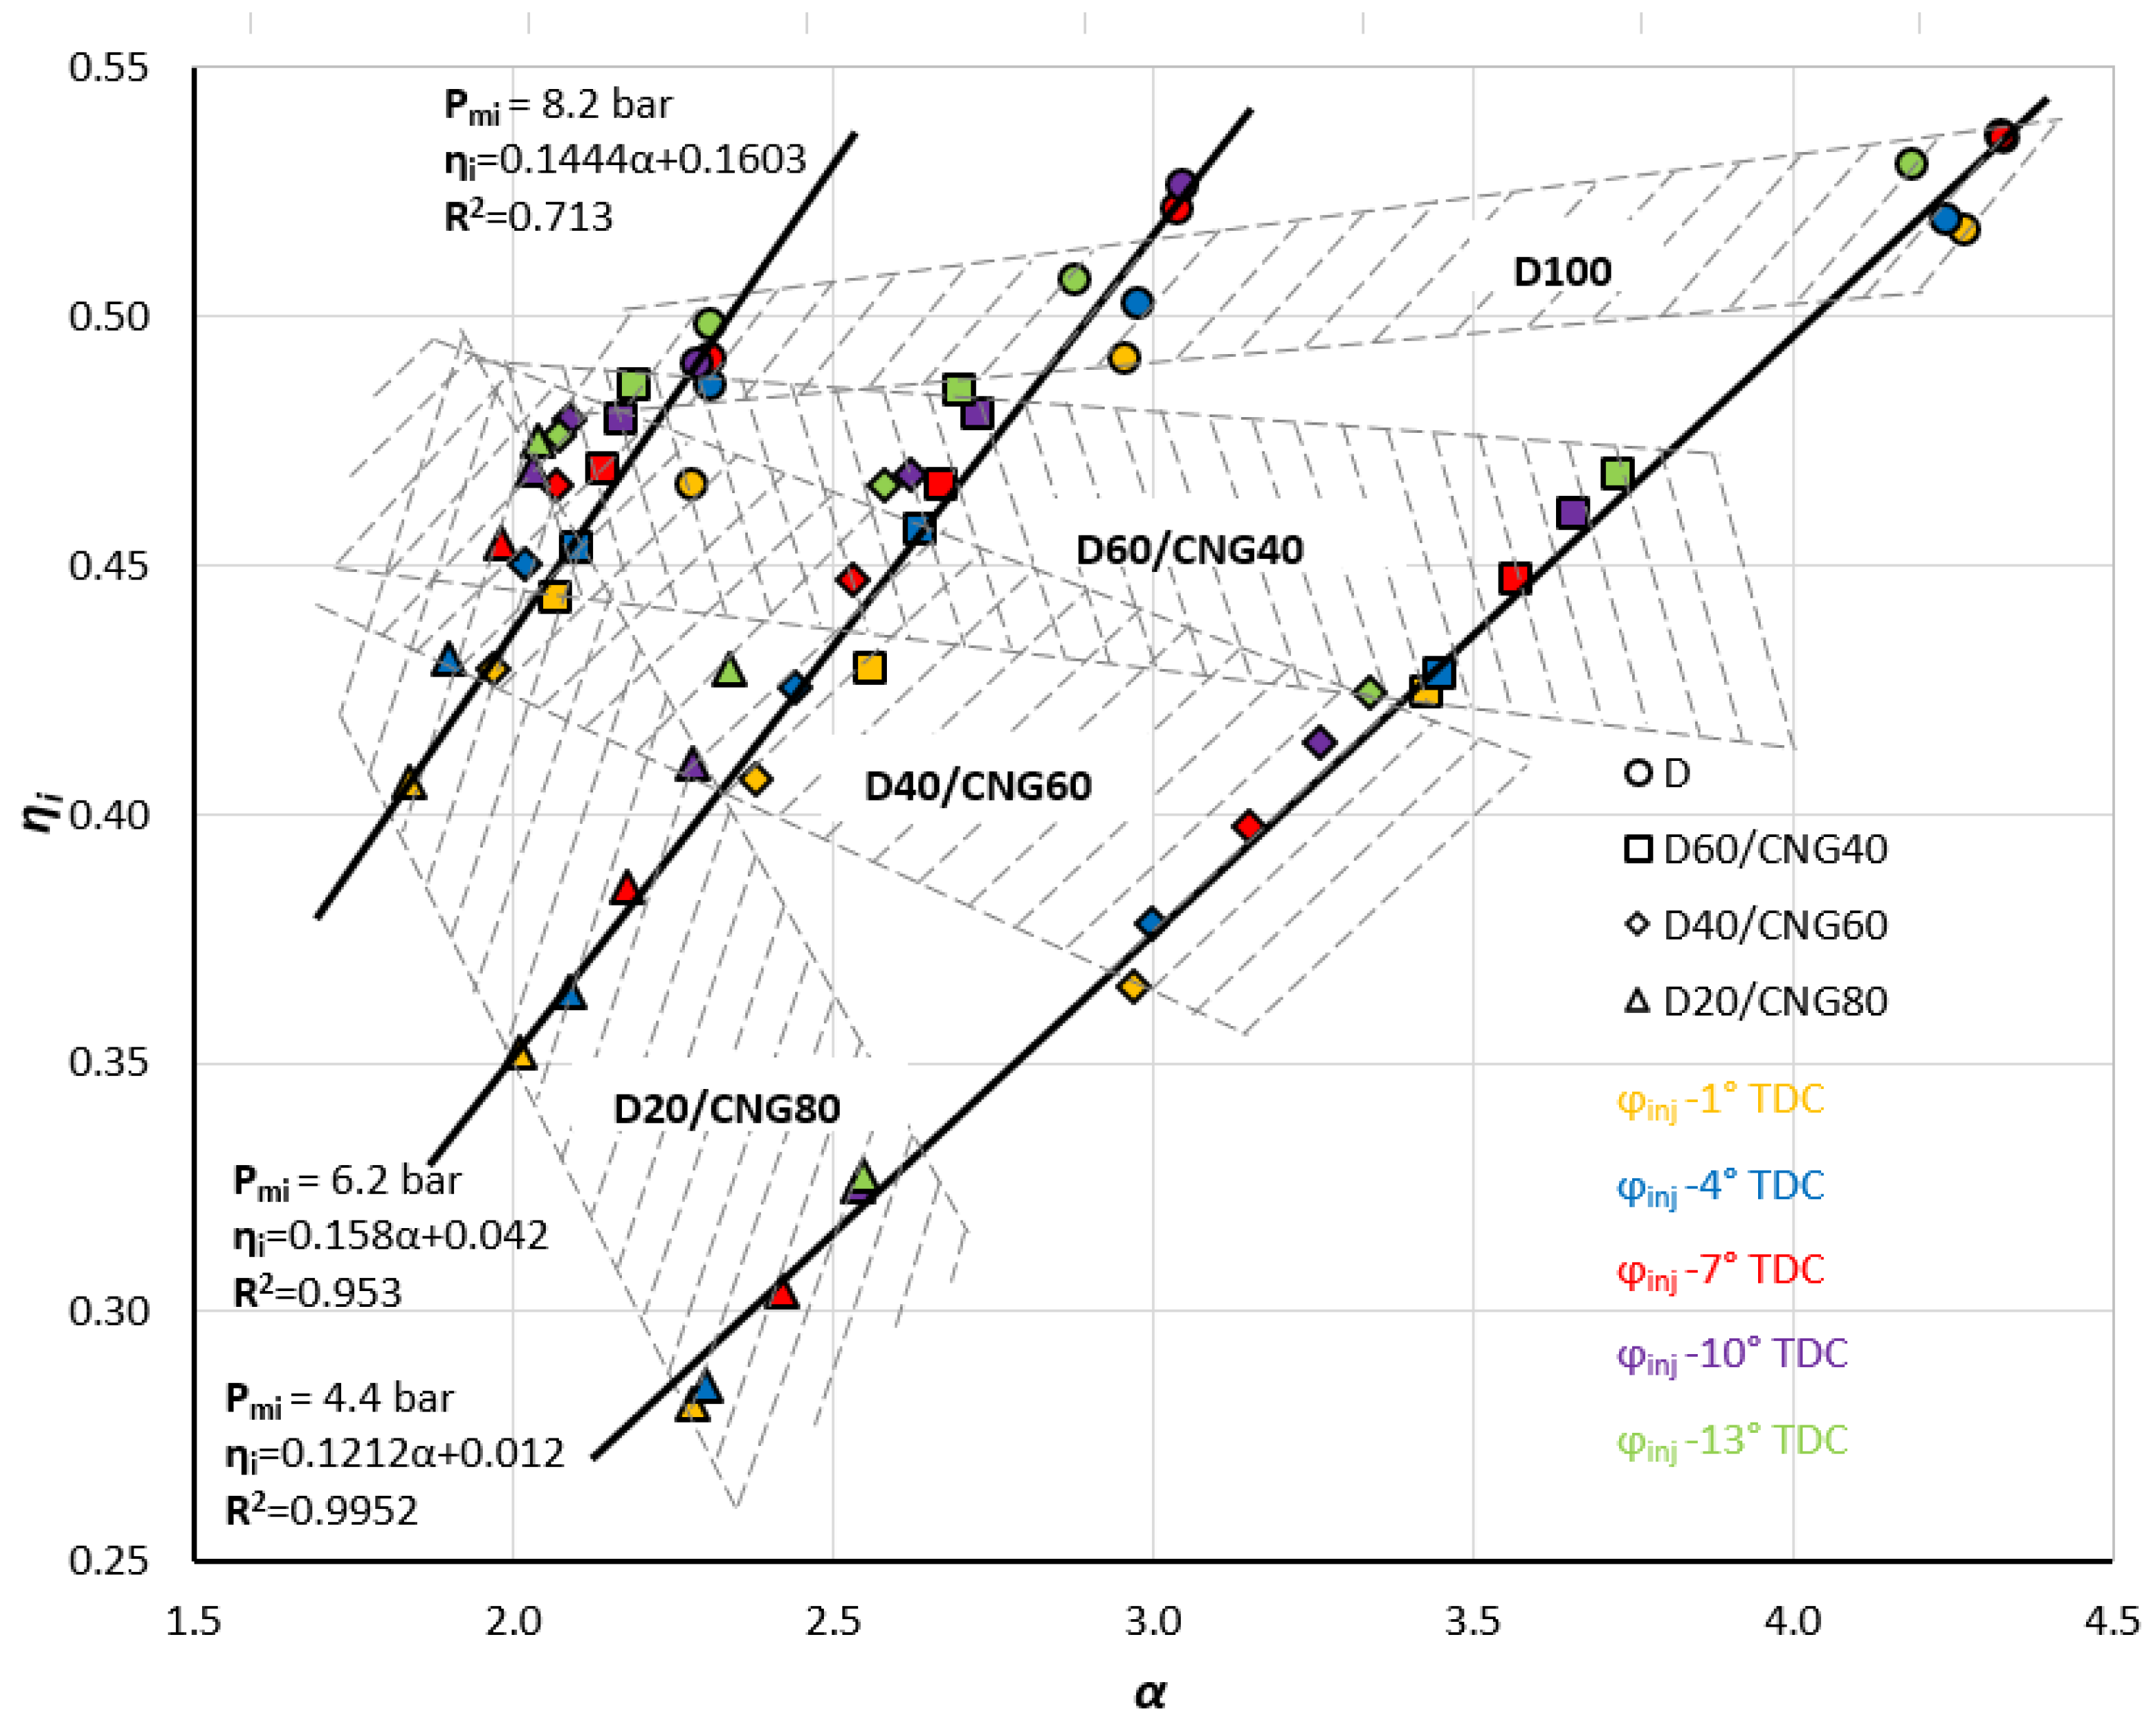
- The findings revealed that the linear increase in %CNG causes the corresponding reduction in the indicated thermal efficiency, where the variation of the excess air coefficient has the shortest range. From the process modelling point of view, these differences are attributed to the tangible change in combustion duration and shape factor m of the Vibe function, which are coupled to each other by scaling factors. The reduction in ηi/α ratio with an increase of %CNG is predetermined by the disproportionate increase in the mass fraction of natural gas entering the cylinder.
- (3)
- The results revealed that the excess air coefficient has a primary influence on the duration of the heat release since the points form clearly defined lines where the variables can be an example of a deterministic relationship defined by expression (φz/(φz0) = f(α0/α).
- (4)
- Very good agreement was obtained between the relative duration of heat release values calculated using the newly derived Woschni correlation and the original formula proposed by Lukachev. The difference varied from 5.3% at Pmi = 6.2 bar to 8.3% at Pmi = 4.4 bar. Through the model-based assessment of dual-fuel engine, it is recommended to leave the second original equation by Woschni unmodified.
Author Contributions
Funding
Informed Consent Statement
Data Availability Statement
Conflicts of Interest
Nomenclature
| Latin symbols | |
| a1, a2, a3 | Constants in equation (Table 9) |
| b1, b2, b3 | Constants in equation (Table 9) for the assessment of β—constituting part of the CNG available in a blend |
| CCR | Co-combustion ratio |
| , | Number of carbon atoms in diesel fuel and CNG, respectively |
| Input (fuel) energy | |
| Output energy | |
| Gair | Air flow rate |
| GCNG | Mass fraction of CNG entering the cylinder |
| Gf | Hourly fuel consumption |
| Hourly fuel consumption for diesel fuel and CNG consumption, respectively | |
| hex | Exhaust enthalpy |
| hs | Amount of internal energy contained in a compound (enthalpy) |
| LCNG | Stoichiometry constant for CNG |
| LD | Stoichiometry constant for diesel fuel |
| LHVCNG | Lower heating value for CNG |
| LHVD | Lower heating value for diesel fuel |
| Lower heating value for D/CNG mixture | |
| m | Form factor |
| m0 | Form factor (shape parameter) obtained at Pmi = 8.2 bar |
| mex | Mass of exhaust gases |
| minj | Mass of fuel sprayed |
| ms | Supply (intake) air mass |
| n | Crankshaft rotation speed |
| n0 | Crankshaft rotation speed at Pmi = 8.2 bar |
| p | Pressure |
| Brake power | |
| Pk | Air pressure after compression |
| Pk0 | Air pressure after compression at Pmi = 8.2 bar |
| Maximum cycle pressure (combustion pressure) | |
| Brake mean effective pressure | |
| pmi | Mean indicated pressure of a cycle |
| pmm | Average mechanical pressure exerted at a point in the fluid |
| Q | Amount of useful heat energy |
| Overall fuel consumption per cycle | |
| CNG consumptions per cycle | |
| Diesel consumptions per cycle | |
| Qex | Heat energy transferred |
| Qfr | Energy losses due to valves and fittings (friction losses) |
| Qi | Amount of heat energy generated during the combustion of the fuel charge |
| Total energy losses of heat energy generated during the combustion | |
| Qtotal_corr | Total energy losses (corrected values) of heat energy generated during the combustion |
| Qw | Heat energy transfer through the walls (losses) |
| Sl | Laminar flame speed |
| R | Gas constant |
| T | Temperature (K) |
| Air temperature after compression (K) | |
| Tu | Air temperature after compression |
| Tu0 | Air temperature after compression obtained at Pmi = 8.2 bar |
| U | Internal energy of a thermodynamic system |
| V | Volume |
| Greek symbols | |
| α | Excess air coefficient |
| α0 | Excess air coefficient obtained at Pmi = 8.2 bar |
| β | Constituting part of the CNG available in a blend |
| Indicated efficiency | |
| Efficiency of a heat engine | |
| Mechanical efficiency | |
| τ | Time |
| Relative heat release ratio | |
| Combustion time | |
| Excess fuel coefficient | |
| High reaction fuel injection time | |
| φz | Conditional combustion duration angle |
| φz0 | Conditional combustion duration angle obtained at Pmi = 8.2 bar |
| φτi | Induction period (crank angle degrees between the start of injection and the start of combustion) |
| φτi0 | Induction period (crank angle degrees between the start of injection and the start of combustion) at Pmi = 8.2 bar |
Abbreviations
| BEMP | Brake effective mean pressure |
| BTDC | Before top dead center |
| CNG | Compressed natural gas |
| CO2 | Carbon dioxide |
| D100 | Pure diesel fuel |
| degCA | Crankshaft rotation angle degrees |
| ICE | Internal combustion engine |
| LHV | Lower heating value (MJ/kg) |
| LNG | Liquefied natural gas |
Appendix A

| Parameter | Description |
|---|---|
| Displacement (cm3) | 1896 |
| Bore × stroke (mm) | 79.5 × 95.5 |
| Maximum power (kW/rpm) | 66/4000 |
| Maximum torque (Nm/rpm) | 180/2000–2500 |
| Cooling type | Water-cooled |
| Fuel supply system | Direct injection |
| Cylinders | Inline-four |
| Compression ratio | 19.5:1 |
| Aspiration | Turbocharger |

References
- Zhang, R.; Hanaoka, T. Cross-cutting scenarios and strategies for designing decarbonization pathways in the transport sector toward carbon neutrality. Nat. Commun. 2022, 13, 3629. [Google Scholar] [CrossRef] [PubMed]
- Armaroli, N.; Carraro, C.; Cazzola, P.; Cherchi, E.; Procopio, M.; Tanelli, M.; Tavoni, M.; Tilche, A.; Torsello, M. The road ahead: How to reduce emissions and energy use for Italy’s transport sector. Nat. Italy 2022. [Google Scholar] [CrossRef]
- Pan, D.; Tao, L.; Sun, K.; Golston, L.M.; Miller, D.J.; Zhu, T.; Qin, Y.; Zhang, Y.; Mauzerall, D.L.; Zondlo, M.A. Methane emissions from natural gas vehicles in China. Nat. Commun. 2020, 11, 4588. [Google Scholar] [CrossRef] [PubMed]
- Feng, R.; Hu, X.; Li, G.; Sun, Z.; Deng, B. A comparative investigation between particle oxidation catalyst (POC) and diesel particulate filter (DPF) coupling aftertreatment system on emission reduction of a non-road diesel engine. Ecotoxicol. Environ. Saf. 2022, 238, 113576. [Google Scholar] [CrossRef] [PubMed]
- European Environment Agency. Transport and Environment Report 2021 Decarbonising Road Transport—The Role of Vehicles, Fuels and Transport Demand; Publications Office of the European Union: Luxembourg, 2022. [Google Scholar] [CrossRef]
- Singh, G.; Dogra, D.; Ramana, R.; Chawla, J.; Sutar, P.S.; Sagare, V.S.; Sonawane, S.B.; Kavathekar, K.; Rairikar, S.; Thipse, S.S. Development of Dual Fuel (Diesel + CNG) Engine for Off-Road Application. SAE Tech. Pap. 2021, 26, 119. [Google Scholar] [CrossRef]
- Lebedevas, S.; Klyus, O.; Raslavičius, L.; Krause, P.; Rapalis, P. Findings on droplet breakup behavior of the preheated microalgae oil jet for efficiency improvement in diesel engines. Biomass Convers. Biorefinery 2022. [Google Scholar] [CrossRef]
- de Blas, I.; Mediavilla, M.; Capellán-Pérez, I.; Duce, C. The limits of transport decarbonization under the current growth paradigm. Energy Strat. Rev. 2020, 32, 100543. [Google Scholar] [CrossRef]
- Ammenberg, J.; Gustafsson, M.; O’Shea, R.; Gray, N.; Lyng, K.-A.; Eklund, M.; Murphy, J.D. Perspectives on Biomethane as a Transport Fuel within a Circular Economy, Energy, and Environmental System; Ammenberg, J., Murphy, J.D., Eds.; IEA Bioenergy Task 37; IEA: Paris, France, 2021; Volume 12. [Google Scholar]
- Auvinen, H.; Tuominen, A. Future transport systems: Long-term visions and socio-technical transitions. Eur. Transp. Res. Rev. 2014, 6, 343–354. [Google Scholar] [CrossRef] [Green Version]
- Wolfram, P.; Hertwich, E. Representing vehicle-technological opportunities in integrated energy modeling. Transp. Res. Part D Transp. Environ. 2019, 73, 76–86. [Google Scholar] [CrossRef]
- Firmansyah; Aziz, A.R.A.; Heikal, M.R.; Zainal, E.Z.A. Diesel/CNG Mixture Autoignition Control Using Fuel Composition and Injection Gap. Energies 2017, 10, 1639. [Google Scholar] [CrossRef] [Green Version]
- Yousefi, A.; Birouk, M.; Guo, H. An experimental and numerical study of the effect of diesel injection timing on natural gas/diesel dual-fuel combustion at low load. Fuel 2017, 203, 642–657. [Google Scholar] [CrossRef]
- Khan, M.I.; Yasmin, T.; Shakoor, A. Technical overview of compressed natural gas (CNG) as a transportation fuel. Renew. Sustain. Energy Rev. 2015, 51, 785–797. [Google Scholar] [CrossRef]
- Mohamed, E.S. Experimental study on the effect of active engine thermal management on a bi-fuel engine performance, combustion and exhaust emissions. Appl. Therm. Eng. 2016, 106, 1352–1365. [Google Scholar] [CrossRef]
- Gautam, P.S.; Vishnoi, P.K.; Gupta, V. A single zone thermodynamic simulation model for predicting the combustion and performance characteristics of a CI engine and its validation using statistical analysis. Fuel 2022, 315, 123285. [Google Scholar] [CrossRef]
- Nieman, D.E.; Dempsey, A.B.; Reitz, R.D. Heavy-Duty RCCI Operation Using Natural Gas and Diesel. SAE Int. J. Engines 2012, 5, 270–285. [Google Scholar] [CrossRef]
- Costa, M.; La Villetta, M.; Massarotti, N.; Piazzullo, D.; Rocco, V. Numerical analysis of a compression ignition engine powered in the dual-fuel mode with syngas and biodiesel. Energy 2017, 137, 969–979. [Google Scholar] [CrossRef]
- Shi, Y.; Ge, H.-W.; Reitz, R.D. Computational Optimization of Internal Combustion Engines; Springer: Berlin/Heidelberg, Germany, 2011; 485p. [Google Scholar] [CrossRef]
- Maurya, R.K.; Mishra, P. Parametric investigation on combustion and emissions characteristics of a dual fuel (natural gas port injection and diesel pilot injection) engine using 0-D SRM and 3D CFD approach. Fuel 2017, 210, 900–913. [Google Scholar] [CrossRef]
- Dong, N.P.; Tuan, N.T.; Procházka, R. Performance parameters reevaluate and predict the fuel consumption of cummin engine running on CNG-diesel duel fuel by GT-Power software. In Proceedings of the International Conference on System Science and Engineering (ICSSE), Ho Chi Minh City, Vietnam, 26–28 August 2021. [Google Scholar] [CrossRef]
- Hiroyasu, H.; Kadota, T. Models for Combustion and Formation of Nitric Oxide and Soot in Direct Injection Diesel Engines. SAE Trans. 1976, 85, 513–526. [Google Scholar] [CrossRef]
- Jonika, L.; Lebedevas, S.; Dauksys, V. Adapting a one-dimensional mathematical model to the dual fuel engine in-cylinder processes modelling. In Proceedings of the 11th Transbaltica International Scientific Conference (TRANSBALTICA)—Transportation Science and Technology, Vilnius, Lithuania, 2–3 May 2019; pp. 407–414. [Google Scholar]
- Vibe, I.I. Novoe o Rabochem Tsikle Dvigateley (The Latest on the Engine Working Cycle); Mashgiz Publ.: Moscow, Russia, 1962; 271p. (In Russian) [Google Scholar]
- Razleytcev, N.F. Modeling and Optimization of the Combustion Process in a Diesel Engines; Vyshzha shkola Publishing House: Kharkiv, Ukraine, 1980; p. 169. (In Russian) [Google Scholar]
- Stepanenko, D.; Kneba, Z. Thermodynamic modeling of combustion process of the internal combustion engines—An overview. Combust. Engines 2019, 178, 27–37. [Google Scholar] [CrossRef]
- Lebedevas, S.; Čepaitis, T. Parametric Analysis of the Combustion Cycle of a Diesel Engine for Operation on Natural Gas. Sustainability 2021, 13, 2773. [Google Scholar] [CrossRef]
- Johansson, L. Full Cycle Cylinder State Estimation in DI Engines with VVA. Master’s Thesis, Linköping University, Linköping, Sweden, 2019. [Google Scholar]
- Woschni, G. A universally applicable equation for the instantaneous heat transfer coefficient in the internal combustion engine. In National Fuels and Lubricants, Powerplants, Transportation Meetings; SAE International: Warrendale, PA, USA, 1967. [Google Scholar]
- Krieger, R.B.; Borman, G.L. The Computation of Apparent Heat Release for Internal Combustion Engines; American Society of Mechanical Engineers (ASME): New York, NY, USA, 1966. [Google Scholar]
- Rassweiler, G.M.; Withrow, L. Motion Pictures of Engine Flames Correlated with Pressure Cards. In Annual Meeting of the Society; SAE International: Warrendale, PA, USA, 1938. [Google Scholar]
- Sellnau, M.S.; Matekunas, F.A.; Battiston, P.A.; Chang, C.-F.; Lancaster, D.R. Cylinder-pressure-based engine control using pressure-ratio-management and low-cost non-intrusive cylinder pressure sensors. In SAE 2000 World Congress; SAE International: Warrendale, PA, USA, 2000. [Google Scholar]
- Lebedevas, S.; Pukalskas, S.; Daukšys, V. Mathematical modelling of indicative process parameters of dual-fuel engines with conventional fuel injection system. Transport 2020, 35, 57–67. [Google Scholar] [CrossRef] [Green Version]
- Lebedevas, S.; Pukalskas, S.; Daukšys, V.; Rimkus, A.; Melaika, M.; Jonika, L. Research on Fuel Efficiency and Emissions of Converted Diesel Engine with Conventional Fuel Injection System for Operation on Natural Gas. Energies 2019, 12, 2413. [Google Scholar] [CrossRef] [Green Version]
- Daukšys, V.; Lebedevas, S. Dvejopo kuro variklio eksergijos balanso palyginamieji tyrimai (Comparative research of the dual-fuel engine exergy balance). Energetika 2019, 65, 113–121. [Google Scholar] [CrossRef]
- Sohn, C.H.; Seol, W.-S.; Shibanov, A.A.; Pikalov, V.P. On the method for hot-fire modeling of high-frequency combustion instability in liquid rocket engines. KSME Int. J. 2004, 18, 1010–1018. [Google Scholar] [CrossRef]
- Marashi, S.S. Network Modeling Application to Laminar Flame Speed and NOx Prediction in Industrial Gas Turbines. Master’s Thesis, Linköping University, Linköping, Sweden, 2013. Available online: https://www.diva-portal.org/smash/get/diva2:784359/FULLTEXT01.pdf (accessed on 12 November 2022).
- Arpaia, F. Laminar Flame Speed Prediction for Natural Gas/Hydrogen Blends and Application to the Combustion Modeling in IC Engines. Master’s Thesis, Politechnico di Torino, Turin, Italy, 2019. Available online: https://webthesis.biblio.polito.it/10725/1/tesi.pdf (accessed on 3 November 2022).
- Wu, Y. Experimental Investigation of Laminar Flame Speeds of Kerosene Fuel and Second Generation Biofuels in Elevated Conditions of Pressure and Preheat Temperature. Chemical Physics [physics.chemph]. INSA de Rouen. English. ffNNT: 2016ISAM0011ff. fftel-01430861f. 2016. Available online: https://theses.hal.science/tel-01430861/document (accessed on 26 October 2022).
- Choi, W.; Song, H.H. Composition-considered Woschni heat transfer correlation: Findings from the analysis of over-expected engine heat losses in a solid oxide fuel cell–internal combustion engine hybrid system. Energy 2020, 203, 117851. [Google Scholar] [CrossRef]
- Brejaud, P.; Higelin, P.; Charlet, A.; Colin, G.; Chamaillard, Y. Convective Heat Transfer in a Pneumatic Hybrid Engine. Oil Gas Sci. Technol. 2011, 66, 1035–1051. [Google Scholar] [CrossRef]
- Woschni, G. Eine Methode Zur Vorausberechnung Der Änderung Des. Brenverlaufs Mittelschnellaufender Dieselmotoren Bei Geanderten Betriebsbedigungen; Springer Fachmedien Wiesbaden: Wiesbaden, Germany, 1973; pp. 106–110. [Google Scholar]
- Woschni, G. Verbrennungsmotoren; TU Munchen: Munchen, Germany, 1988; 303p. [Google Scholar]
- Merker, G.; Schwarz, C.; Stiesch, G.; Otto, F. Simulating Combustion: Simulation of Combustion and Pollutant Formation for Engine-Development; Springer: Berlin/Heidelberg, Germany, 2006; 402p. [Google Scholar]
- Pesic, R.; Davinic, A.; Taranovic, D.; Miloradovic, D.; Petkovic, S. Experimental determination of double vibe function parameters in diesel engines with biodiesel. Therm. Sci. 2010, 14, 197–208. [Google Scholar] [CrossRef]
- Yousefi, A.; Birouk, M.; Guo, H. On the Variation of the Effect of Natural Gas Fraction on Dual-Fuel Combustion of Diesel Engine Under Low-to-High Load Conditions. Front. Mech. Eng. 2020, 6, 555136. [Google Scholar] [CrossRef]
- Papagiannakis, R.; Hountalas, D. Combustion and exhaust emission characteristics of a dual fuel compression ignition engine operated with pilot Diesel fuel and natural gas. Energy Convers. Manag. 2004, 45, 2971–2987. [Google Scholar] [CrossRef]
- Woschni, G.; Anisits, F. Experimental Investigation and Mathematical Presentation of Rate of Heat Release in Diesel Engines Dependent upon Engine Operating Conditions. SAE Tech. Pap. 1974, 740086. [Google Scholar] [CrossRef]
- Finger, G. Simplified calculation of friction mean effective pressure for fast simulation of fuel consumption. SN Appl. Sci. 2022, 4, 6. [Google Scholar] [CrossRef]
- Lukachev, S.V.; Matveev, S.G.; Zubrilin, I.A.; Sigidaev, A.V. Dependence of methane laminar flame propagation speed on the pressure and initial temperature. VESTNIK Samara Univ. Aerosp. Mech. Eng. 2016, 15, 224–234. [Google Scholar] [CrossRef] [Green Version]
- Egolfopoulos, F.; Cho, P.; Law, C. Laminar flame speeds of methane-air mixtures under reduced and elevated pressures. Combust. Flame 1989, 76, 375–391. [Google Scholar] [CrossRef]
- Van Maaren, A.; Thung, D.S.; De Goey, L.R.H. Measurement of Flame Temperature and Adiabatic Burning Velocity of Methane/Air Mixtures. Combust. Sci. Technol. 1994, 96, 327–344. [Google Scholar] [CrossRef] [Green Version]
- Aung, K.T.; Tseng, L.-K.M.; Ismail, A.; Faeth, G.M. Laminar burning velocities and Markstein numbers of hydrocarbon/air flames. Combust. Flame 1995, 102, 523–525. [Google Scholar] [CrossRef]
- Hassan, M.I.; Aung, K.T.; Faeth, G.M. Properties of Laminar Premixed CO/H/Air Flames at Various Pressures. J. Propuls. Power 1997, 13, 239–245. [Google Scholar] [CrossRef]
- Rozenchan, G.; Zhu, D.L.; Law, C.K.; Tse, S.D. Outward propagation, burning velocities, and chemical effects of methane flames up to 60 atm. Proc. Combust. Inst. 2002, 29, 1461–1470. [Google Scholar] [CrossRef]
- Bosschaart, K.; de Goey, L. The laminar burning velocity of flames propagating in mixtures of hydrocarbons and air measured with the heat flux method. Combust. Flame 2004, 136, 261–269. [Google Scholar] [CrossRef]
- GRI-Mech 3.0 [Official Website]. Available online: http://combustion.berkeley.edu/gri-mech/version30/text30.html (accessed on 4 January 2023).


| Fuel Property | CNG | Diesel Fuel |
|---|---|---|
| Density (kg/m3) | 0.74 | 829.0 |
| Cetane number | - | 49 |
| Lower heating value (MJ/kg) | 51.7 | 42.8 |
| Viscosity (cSt 40 °C) | - | 1.485 |
| H/C ratio | - | 1.907 |
| Component (% vol.) | Methane: 91.97 | Carbon: 86.0 |
| Ethane: 5.75 | Hydrogen: 13.6 | |
| Propane: 1.30 | Oxygen: 0.4 | |
| Butane: 0.281 | ||
| Nitrogen: 0.562 Carbon dioxide: 0.0 |
| D100 | D60/CNG40 | D40/CNG60 | D80/CNG20 | |||||
|---|---|---|---|---|---|---|---|---|
| φinj = −1 degCA BTDC | φinj = −13 degCA BTDC | φinj = −1 degCA BTDC | φinj = −13 degCA BTDC | φinj = −1 degCA BTDC | φinj = −13 degCA BTDC | φinj = −1 degCA BTDC | φinj = −13 degCA BTDC | |
| pmi = 4.2 bar | 35.3 | 35.5 | 45.5 | 43.2 | 51.6 | 53.3 | 59.7 | 61.4 |
| pmi = 6.2 bar | 31.1 | 32.3 | 35.0 | 35.7 | 32.9 | 38.0 | 46.2 | 44.6 |
| pmi = 8.2 bar | 27.1 | 28.7 | 30.0 | 32.6 | 32.6 | 33.6 | 33.2 | 33.6 |
| D100 | D60/CNG40 | D40/CNG60 | D80/CNG20 | |||||
|---|---|---|---|---|---|---|---|---|
| φinj = −1 degCA BTDC | φinj = −13 degCA BTDC | φinj = −1 degCA BTDC | φinj = −13 degCA BTDC | φinj = −1 degCA BTDC | φinj = −13 degCA BTDC | φinj = −1 degCA BTDC | φinj = −13 degCA BTDC | |
| pmi = 4.2 bar | 27.2 | 27.9 | 22.3 | 24.6 | 19.2 | 22.3 | 14.8 | 17.2 |
| pmi = 6.2 bar | 17.8 | 18.4 | 15.5 | 17.6 | 14.8 | 16.9 | 12.8 | 15.6 |
| pmi = 8.2 bar | 12.7 | 13.5 | 12.1 | 13.3 | 11.7 | 13.0 | 12.1 | 13.0 |
| D100 | D60/CNG40 | D40/CNG60 | D80/CNG20 | |||||
|---|---|---|---|---|---|---|---|---|
| φinj = −1 degCA BTDC | φinj = −13 degCA BTDC | φinj = −1 degCA BTDC | φinj = −13 degCA BTDC | φinj = −1 degCA BTDC | φinj = −13 degCA BTDC | φinj = −1 degCA BTDC | φinj = −13 degCA BTDC | |
| pmi = 4.2 bar | 8.1 | 7.6 | 23.2 | 18.6 | 32.4 | 31.0 | 44.9 | 44.2 |
| pmi = 6.2 bar | 13.3 | 13.9 | 19.5 | 18.1 | 18.1 | 21.1 | 33.4 | 29.0 |
| pmi = 8.2 bar | 14.4 | 15.2 | 17.9 | 19.3 | 20.9 | 20.6 | 21.1 | 20.6 |
| D100 | D60/CNG40 | D40/CNG60 | D80/CNG20 | |||||
|---|---|---|---|---|---|---|---|---|
| φinj = −1 degCA BTDC | φinj = −13 degCA BTDC | φinj = −1 degCA BTDC | φinj = −13 degCA BTDC | φinj = −1 degCA BTDC | φinj = −13 degCA BTDC | φinj = −1 degCA BTDC | φinj = −13 degCA BTDC | |
| pmi = 4.2 bar | 1.10/1.01 | 0.96/0.99 | 0.92/0.98 | 0.94/0.98 | 0.84/0.99 | 0.85/0.99 | 0.75/0.97 | 0.86/0.99 |
| pmi = 6.2 bar | 1.02/1.00 | 0.99/0.99 | 0.95/0.98 | 0.96/0.99 | 0.83/0.97 | 0.91/0.98 | 0.87/0.97 | 0.87/0.98 |
| pmi = 8.2 bar | 1.01/0.99 | 0.99/1.00 | 0.87/1.00 | 0.99/1.01 | 0.98/1.01 | 0.99/1.01 | 0.93/0.99 | 0.96/1.00 |
| Pme = 8.2 bar | Pme = 6.2 bar | Pme = 4.4 bar | ||||
|---|---|---|---|---|---|---|
| Parameters | Experimental Values | Calculated Values | Experimental Values | Calculated Values | Experimental Values | Calculated Values |
| qcycl, g/cicl | 0.0169 | 0.0169 | 0.0143 | 0.0143 | 0.01255 | 0.01255 |
| pk, bar | 1.35 | 1.35 | 1.25 | 1.25 | 1.175 | 1.175 |
| Tk, K | 333 | 333 | 318 | 318 | 315 | 315 |
| pmax, bar | 100.6 | 100.0 | 79.0 | 76 | 67.3 | 66.3 |
| ηe | 0.345 | 0.345 | 0.273 | 0.276 | 0.155 | 0.157 |
| ηi | 0.475 | 0.473 | 0.433 | 0.438 | 0.330 | 0.333 |
| ηm | 0.726 | 0.730 | 0.630 | 0.630 | 0.470 | 0.470 |
| pme, bar | 5.95 | 5.96 | 3.97 | 4.05 | 1.98 | 2.00 |
| pmi, bar | 8.2 | 8.17 | 6.30 | 6.40 | 4.20 | 4.28 |
| α∑ | 2.54 | 2.43 | 2.95 | 2.79 | 3.19 | 3.08 |
| Parameters | ||||
|---|---|---|---|---|
| −1 | −1 | −1 | −13 | |
| 1.25/1.28 | 2.38/1.36 | 1.47/1.45 | 1.35/1.34 | |
| 2.93/3.0 | 2.57/2.54 | 2.30/2.28 | 2.54/2.23 | |
| 319/325 | 329/336 | 343/342 | 333/335 | |
| 0.01457 | 0.01746 | 0.01975/ | 0.01695 | |
| 50.1/70.5 | 57.8/74.1 | 64.2/62.8 | 99.7/99.5 | |
| 11/11 | 8.0/9.5 | 7/7 | −5/−5 | |
| 1.988/4.1 | 3.976/5.18 | 5.964/6.00 | 5.964/6.08 | |
| 4.194/6.25 | 6.242/7.32 | 8.204/8.14 | 8.204/8.25 | |
| 0.474/0.65 | 0.637/0.71 | 0.727/0.73 | 0.727/0.73 | |
| 0.131/0.27 | 0.218/0.293 | 0.288/0.310 | 0.366/0.35 | |
| 0.275/0.424 | 0.342/0.415 | 0.396/0.42 | 0.462/0.47 | |
| Pmi = 8.2 bar | Pmi = 6.2 bar | Pmi = 4.4 bar | ||||
|---|---|---|---|---|---|---|
| D100 | D20/CNG80 | D100 | D20/CNG80 | D100 | D20/CNG80 | |
| m | 0.58/0.58 | 0.6/0.6 | 0.55/0.57 | 0.57/0.6 | 0.52/0.54 | 0.52/0.54 |
| φz | 60/60 | 65/65 | 52/52 | 60/105 | 41/42 | 56/172 |
| Lukachev’s Formula [50] | |
|---|---|
| (27) | |
| Parameters | D20/NG80 | |||
|---|---|---|---|---|
| Equation (26) | Pmi, bar | 8.2 | 6.2 | 4.4 |
| Pk, Pa | 6,520,000 | 5,860,000 | 5,120,000 | |
| Tk, K | 1100 | 1040 | 1030 | |
| α | 1.84 | 2.01 | 2.28 | |
| α0/α | 1.00 | 0.90 | 0.80 | |
| φz/ φz0 | 1.00 | 1.55 | 2.20 | |
| Equation (27) | SL | 45.640 | 31.808 | 21.815 |
| SL−1 (ϕz) | 0.022 | 0.031 | 0.046 | |
| φ = 1/α | 0.543 | 0.498 | 0.439 | |
| φz/φz0 | 1.00 | 1.43 | 2.09 | |
Disclaimer/Publisher’s Note: The statements, opinions and data contained in all publications are solely those of the individual author(s) and contributor(s) and not of MDPI and/or the editor(s). MDPI and/or the editor(s) disclaim responsibility for any injury to people or property resulting from any ideas, methods, instructions or products referred to in the content. |
© 2023 by the authors. Licensee MDPI, Basel, Switzerland. This article is an open access article distributed under the terms and conditions of the Creative Commons Attribution (CC BY) license (https://creativecommons.org/licenses/by/4.0/).
Share and Cite
Lebedevas, S.; Raslavičius, L.; Drazdauskas, M. Comprehensive Correlation for the Prediction of the Heat Release Characteristics of Diesel/CNG Mixtures in a Single-Zone Combustion Model. Sustainability 2023, 15, 3722. https://doi.org/10.3390/su15043722
Lebedevas S, Raslavičius L, Drazdauskas M. Comprehensive Correlation for the Prediction of the Heat Release Characteristics of Diesel/CNG Mixtures in a Single-Zone Combustion Model. Sustainability. 2023; 15(4):3722. https://doi.org/10.3390/su15043722
Chicago/Turabian StyleLebedevas, Sergejus, Laurencas Raslavičius, and Martynas Drazdauskas. 2023. "Comprehensive Correlation for the Prediction of the Heat Release Characteristics of Diesel/CNG Mixtures in a Single-Zone Combustion Model" Sustainability 15, no. 4: 3722. https://doi.org/10.3390/su15043722