
The Prediction of Fire Disaster Using BIM-Based Visualization for Expediting the Management Process


1
Department of Architectural Engineering, Ajou University, Suwon 16499, Republic of Korea
2
Department of Construction Management, Dalian University of Technology, Dalian 116024, China
*
Author to whom correspondence should be addressed.
Sustainability 2023, 15(4), 3719; https://doi.org/10.3390/su15043719
Submission received: 1 January 2023
/
Revised: 14 February 2023
/
Accepted: 15 February 2023
/
Published: 17 February 2023
(This article belongs to the Section Green Building)
Abstract
:As buildings become larger and more complex, fire disaster management is of great concern. A building’s fire response and/or rescue system plays a pivotal role in minimizing fire victims and loss. To improve the current fire disaster management, it is important to link building (static) information, i.e., structural elements, fire escapes, and openings, with the fire (dynamic) information. When a building fire occurs, real-time fire information is required to be effectively linked with the on-site building information because the fire rescue teams, in most cases, are unfamiliar with the buildings. This study has proposed a Building Information Model (BIM)-based fire disaster management process which can digitally track the building data and the dynamic fire data simultaneously. To expedite this algorithm, an application program, i.e., Smart Fire Rescue Management (SFRM) has been developed using Revit™ software. A real-case project has been applied to evaluate the feasibility of the system. An expert survey has also been conducted to analyze the practical applicability. As a result, the system has been evaluated as exceptional, but it is necessary to upgrade the application from the practitioner’s viewpoint. The SFRM contributes to expediting the conventional disaster management process by enhancing the efficiency of the building fire response and/or rescue system.
1. Introduction
According to recent fire disaster statistics, fires are taking place throughout the year with an increase in the damages incurred [1,2]. In particular, building fires in densely populated areas result in significant loss of life and property damage [3]. Therefore, an efficient fire-response strategy is essential to minimize potential damage [4,5,6]. On the other hand, technological development has led to the Manhattanizing and enlargement of buildings [7,8,9]. The number of building users is increasing and interior building structures are complicated, which has caused difficulties in rescue and evacuation [10,11,12]. As a result, some research indicates the necessity of an advanced management system to tackle difficult fire-response scenarios [13,14,15]. In line with this necessity, government regulations have been established to strengthen the existing fire codes to prevent and respond to fire disasters effectively [16,17].
Furthermore, it is difficult to monitor the current status of a building and the dynamic conditions of a fire in disastrous circumstances [18,19,20]. Real-time and accurate information is required to provide the optimum solution to minimize the damage of a building fire [21,22,23]. The current information management process, however, is limited in collecting both building and fire information on a real-time basis due to a poor data structure. This undermines the performance of the existing disaster management process, which leads to inappropriate decision-making in a building fire disaster [24].
For an effective building fire response, fire rescuers are provided with the building data, such as the location of firefighting equipment, safety evacuation path, and the residents’ spatial information [25,26]. Therefore, building facility managers need to keep tracking such data and provide them to the rescuers. Nevertheless, it is difficult to manage the required information due to the large volume of the data set [27]. In the event of a building fire, a variety of information is generated and instantly distributed to facility managers, occupants, and rescuers [28,29]. Facility managers play an important role in providing relevant information to rescuers and evacuees [30,31].
On the other hand, an appropriate tool is required for unforeseeable disaster situations [32,33,34] for fire rescuers. This management tool can provide meaningful information and expedite the right decision-making during an unexpected crisis. A fire may result in several unforeseeable situations, and the effectiveness of the current fire response depends on an individual rescuer’s capacity to act properly [35,36]. It has been confirmed that the key factors for a rescuer’s capacity include firefighters’ strength, physical ability, and judgment ability. Hence, ensuring reliability in fire disaster management is challenging. To address this, there is a requirement for an information-based fire-response system that can improve the reliability of the current approach.
This study is aimed to provide an effective fire response and rescue system to overcome the limitations of the current practice. The new system enables the primary stakeholders, i.e., rescuers, evacuees, and facility managers, to cope with emergent situations in a more efficient way. In addition, this system helps them to make better decisions in responding to fire disasters. To achieve the research goal, the following steps have been followed:
- (1)
- A building fire database (DB) has been established by identifying pertinent building (or static) information related to the interior building conditions and fire (or dynamic) information related to the fire scene.
- (2)
- A 3D/Building Information Model (BIM)-linked fire-response system framework has been designed to effectively manage the DB for building fire responders.
- (3)
- An application programming interface (API) has been developed to provide a 3D/BIM-integrated visualization model to expedite the rescue process.
This study uses a reliable DB structure and integrates it into a single platform to provide an optimum solution to assist emergency responders. With more accurate information required to make a better decision, the system framework has been proposed to effectively control a building fire disaster. Using the 3D/BIM model as a single information medium, the framework has been programmed by fostering a close relationship among essential information.
2. Research Methodology
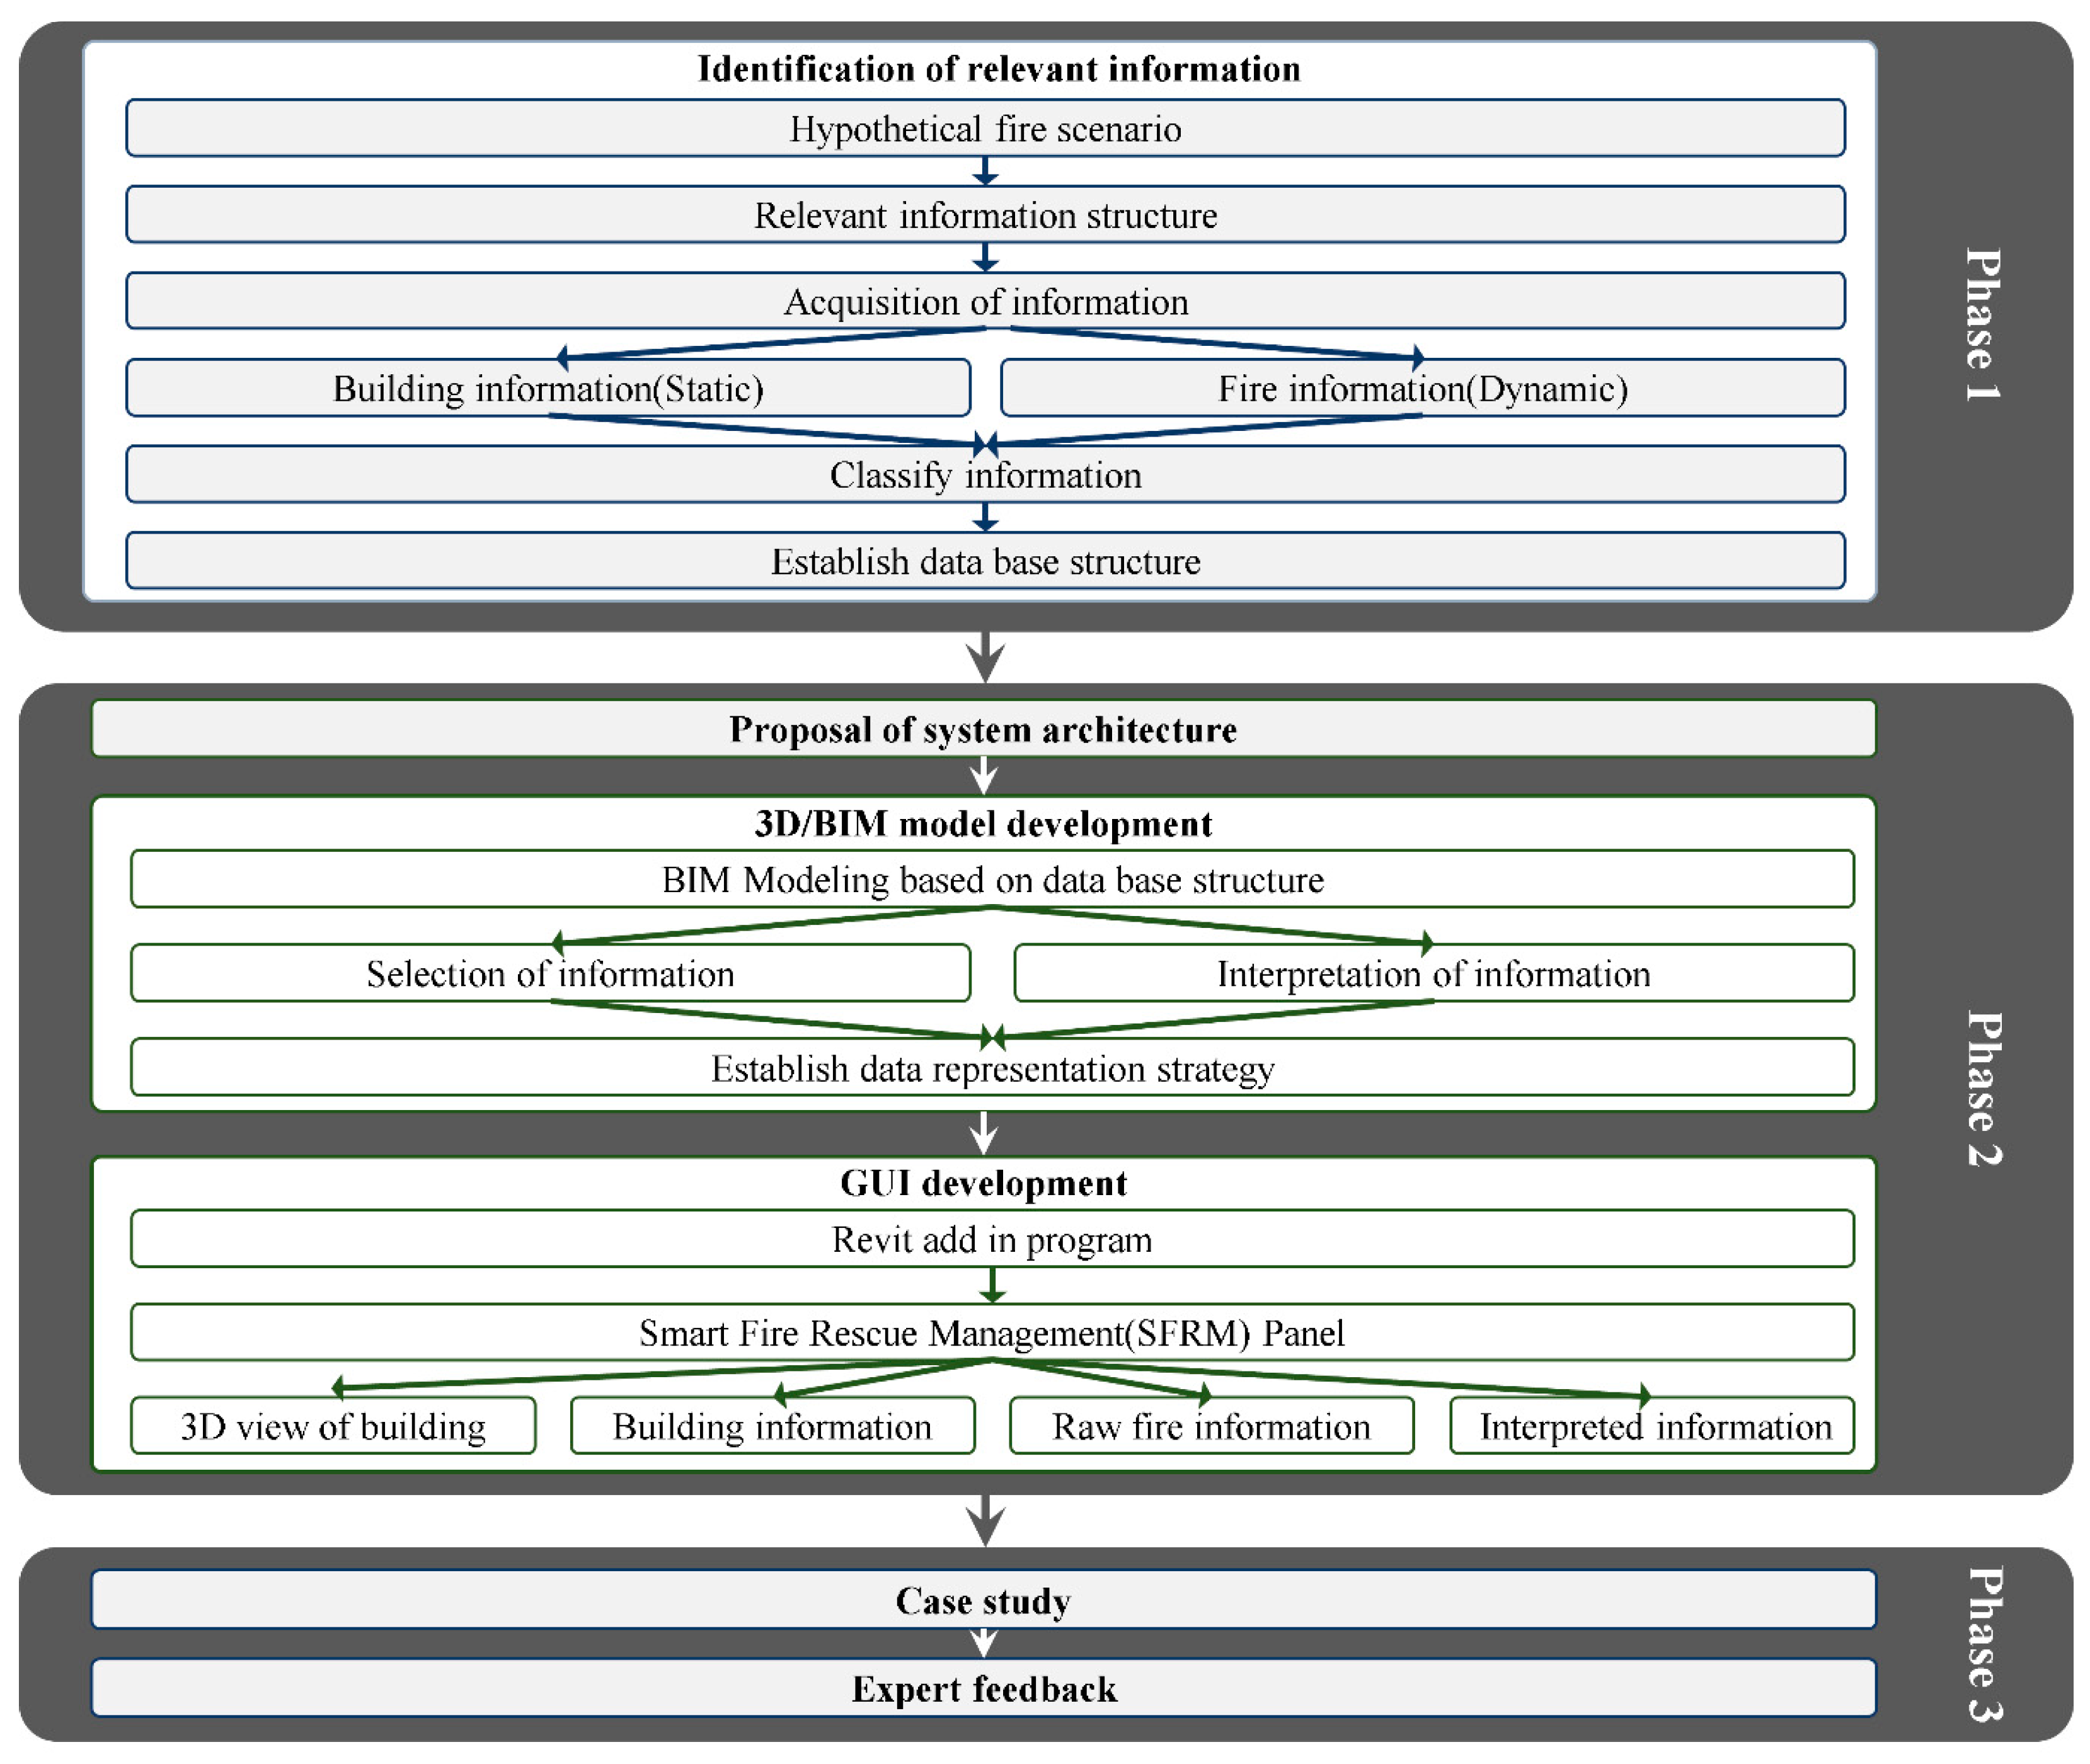
The research methodology in this study consists of three main phases as depicted in Figure 1. In Phase 1, the fire-response information has been extensively collected and categorized. Using the classified information structure, the system has been developed in Phase 2. The final stage of validation has been conducted using a real-case study in Phase 3. The details are as follows.
In Phase 1, this study effectively defined the relevant data needed for fire response and created a fire information database. The required data has been gathered by incorporating various references, such as fire reports, rescue manuals, and previous research papers. The dataset has been selected based on expert opinion and then reorganized according to the characteristics of the information. Two different types of information have been established for effective fire disaster management. One is the building information, such as girders, beams, walls, doors, and windows, which is “static.” The other is the fire information, such as smoke, temperature, and toxic air, which is “dynamic.” A database structure has been created based on the features of the different types of information to provide emergency responders with reliable and important data.
In Phase 2, a system architecture has been proposed based on the pre-determined database structure. The proposed algorithm has been developed using the database in Phase 1. An effective management strategy has been created to effectively deliver the information in the 3D/BIM model by selecting and interpreting the raw data via the system architecture. This model plays an important role in serving as both a communication tool and the main data source for the application which is validated in Phase 3. The virtual model is created as a case study as well as a graphical user interface application tool, which is termed “smart fire rescue management” (SFRM), developed to facilitate the usage of the information. In this stage, the graphical user interface (GUI) tool has been programmed via Revit™.
In Phase 3, the developed system has been evaluated and verified using a case study. A prototype was implemented in a real building project under a building fire accident to evaluate the viability of the SFRM system. The system’s validity has been thoroughly evaluated by a survey among fire rescue experts.
3. Literature Review
In this study, the authors have conducted an extensive literature review to develop the 3D/BIM-based fire-response management system. A new approach to supporting an early reaction to a fire disaster by anticipating the behavior of the fire has been proposed by a recent study [34]. Kim et al. have suggested that building information should be effectively incorporated into facility management by defining the required information, deriving relevant functions, and making spatial management the primary concern [13]. Likewise, Jung et al. have established a database structure to develop fire-based BIM libraries for the practical use of BIM [3].
Additional studies have been conducted to propose fire safety systems, such as using algorithms to predict evacuation routes [37]. The research is expanded to the BIM application not only in the design and building phases but also in the operation and maintenance phases in combining fire disaster management systems. Furthermore, an effective application of BIM has also been presented by establishing a data linkage in a cloud system, using tools in the construction industry [38]. This data linkage has identified the potential for the use of the fire-response system.
Some studies have proposed BIM model-based fire safety management. For example, Wang et al. attempted to utilize BIM with a focus on evacuation assessment, evacuation route planning, and safety training and proposed an overall system for applying BIM for fire and disaster response [21]. Lee et al. investigated and analyzed the potential of integrating fire simulation with BIM, which is needed to be considered as a management tool [39]. Wang et al. conducted research on fire information usage by identifying and converting information through fire disaster simulations [40]. In this study, a building facility management strategy has been newly presented in the event of a fire emergency by linking the 3D/BIM model with various attributes.
Currently, many studies are underway to establish a database structure that reflects the characteristics of both fire and building information. Eftekharirad has proposed a fire-response system using a database embedded in BIM [41]. In addition, Oh et al. conducted research to present a conceptual framework for a real-time disaster management system by linking BIM and sensing information [42]. The usage of a BIM-based algorithm and a modified fire dynamic simulation (FDS) have both been suggested as ways to assess the possibilities of developing a 3D/BIM-linked monitoring system [9,43]. Additionally, the study also confirmed that providing BIM-based visualization allows users to understand the possible hazards and circumstances promptly in a fire scene [43].
Although various studies are being conducted to develop new fire information management, the existing studies have several limitations. First, there is a lack of integration of building information in fire rescue management systems. Since the current fire disaster management is being provided without the facilities' information, it is difficult to simultaneously integrate the fire and building data into the system. This causes a time lag in recognizing prompt and accurate information in the circumstances of a building fire. Second, the BIM-based fire disaster management system fails to interpret the captured raw data, which prevents the fire rescuers from using the system practically. Although the purpose of the information is to support prompt rescue or evacuation activities, the current system has limitations for system users to monitor the effect of the data on entry, exit, and rescue activities.
Finally, it is plausible that the information gathering has limitations in shortening the time needed for decision-making on fire rescue. A new type of information system is required to quickly understand the impact of the raw data on fire rescue and evacuation activities. The rescuers and evacuees are in need of interpreted information that would highlight the future changes of the current status under a building fire. For the purpose of overcoming the limitations of the previous work, this study has proposed a new fire-response system. By effectively providing relevant information in a single system, the fire disaster stakeholders can easily access the system and graphically acquire relevant information in a more efficient way.
4. Results and Discussions
4.1. Phase 1: Identification of Fire Relevant Information
4.1.1. Acquisition of Information
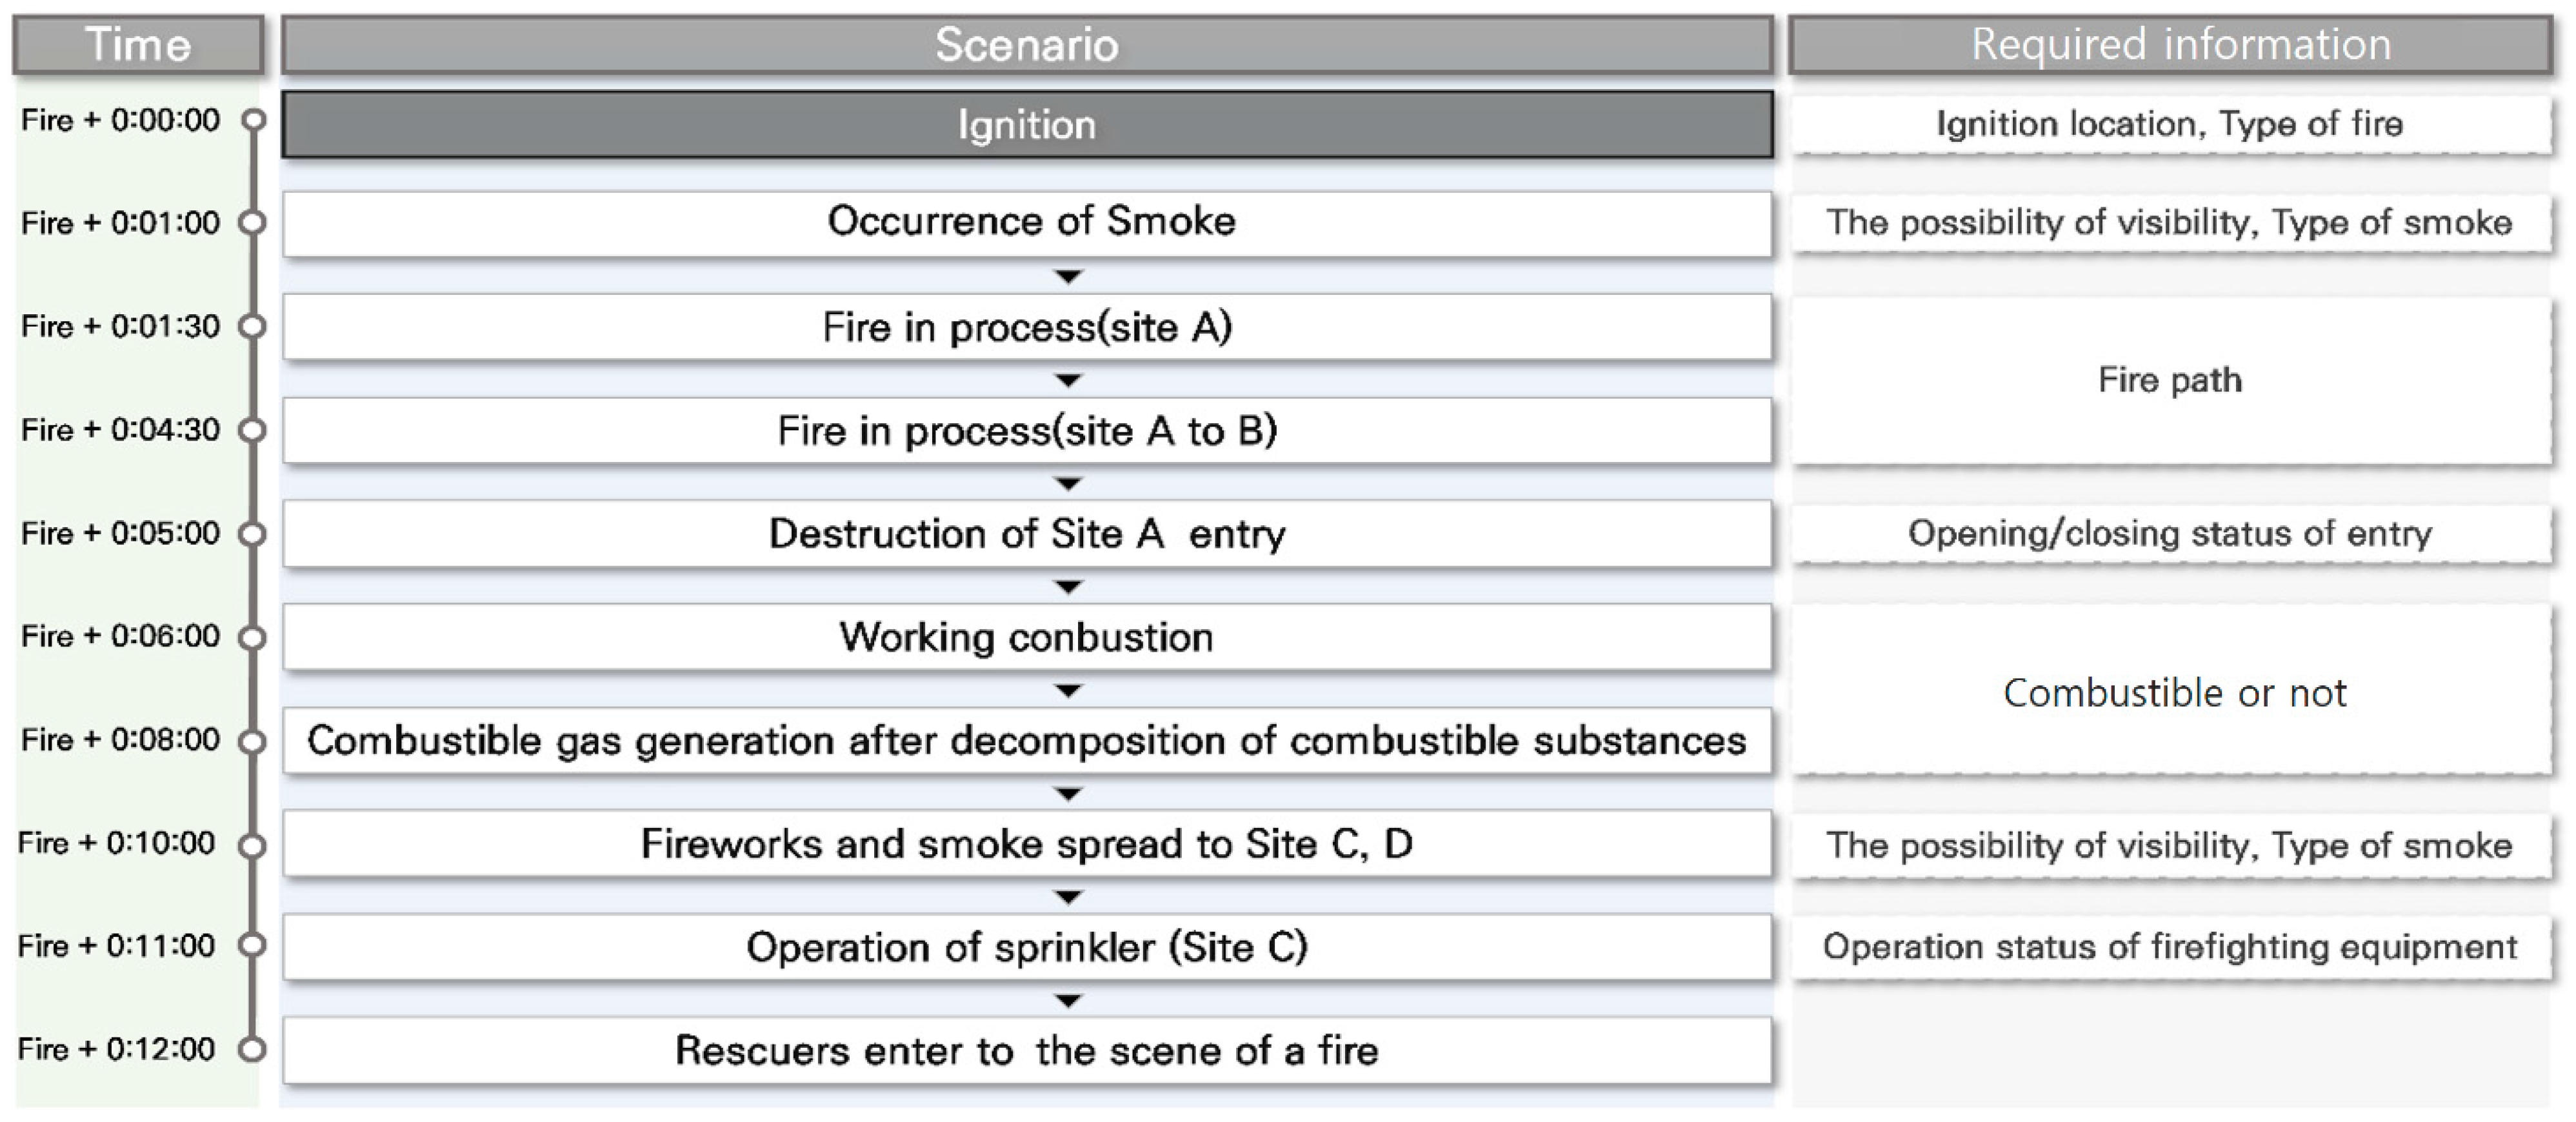
This research aims to create a novel system that improves information exchange and its utilization during the fire response. Therefore, it is critical to understand the information generated and required during the actual fire-response process. Accordingly, a hypothetical fire scenario has been generated to identify the required information, as well as the information for providers and users as shown in Figure 2.
A hypothetical scenario has been prepared based on fire manuals and previous studies. This process allows the authors to figure out how the required information changes in case of a building fire. After a fire breaks out, smoke is generated over time, and the fire flame grows in various directions inside the building. As a result, building conditions change over time, such as blocked entrances and toxic gas generation. Due to such changes, accurate information is needed for emergency response and rescue. Hence, it is necessary to capture crucial information such as combustion type, combustible gas, optimum fire rescue and escape, openings, building damages, and extinguishing equipment.
Considering that the fire information may dynamically change due to unexpected situations, appropriate and accurate information is critical to minimize the losses. In addition, to extract such information, it is necessary to provide main stakeholders with the exact locational data. For this study, the building facility manager is considered as an information provider, while the rescuers and the evacuees are regarded as information users. Without updating and delivering accurate information, the rescuers and the evacuees are prone to become exposed to outdated information. This leads to difficulties in fire response and results in much greater fire-related damages.
In a fire disaster, the fire information must be quickly provided to the users. To do this, the information required for fire response and rescue must be systematically extracted from reliable sources and classified in accordance with their type. For this study, an information structure has been generated that encompasses both “building information” and “fire information.” The former refers to the building structure systems and indoor map of the building. The latter pertains to information related to the fire, such as smoke, temperature, and indoor air condition. The information breakdown structure has been established based on fire reports, rescue manuals, and previous literature. The fire database has been compiled and the details are as follows.
4.1.2. Building (or Static) Information
Building (or static) information refers to any immovable data which is needed in rescuing and/or evacuating a building on fire. Currently, this type of data is provided in 2D drawings. It is plausible that this information is so complicated due to a large volume of data. Therefore, this building information is needed to be classified in terms of fire response. To identify the whole set of information, a variety of publications, i.e., building codes, fire-response manuals, and fire scenarios, have been reviewed and analyzed, yielding a total of 222 types of building information. These data have further been categorized according to the users, i.e., facility managers, rescuers, and evacuees. They are further classified based on their need and availability and they are stated in our previous literature [31].
Out of the whole set of information, there are a variety of different types of information that may be helpful for facility managers, rescuers, and evacuees, and these data have been grouped according to their intended use. For instance, facility managers monitor the building’s current state. This information is essential in the case of a fire. For the rescuers, fire information, risk factors, and building information are grouped to support lifesaving efforts. The evacuees require information on their location, how to evacuate safely, and the current fire status. These data are useful not only for evacuating the building but also for communicating with other users. Finally, among the emergency building details collected, some items are related to facility managers, some items to rescuers, and other items to evacuees, respectively. a portion of the dataset is provided in Table 1.
In this study, the data has been reorganized in order to facilitate the visualization using the 3D/BIM platform. The entire collection of information was carefully reviewed and a new, refined set of information was established as the final set of building information that would be beneficial for managing a building fire disaster. Table 2 shows the final set of building information which has been filtered and reorganized in terms of data characteristics.
The restructured information contains 21 items. This complete set of information has been further classified into four categories, i.e., project, building, firefighting, and evacuation. “Project” information is related to the space with a high-risk factor. “Building” information is linked with general information, such as the building’s interior structure, building materials, etc. “Firefighting” information includes the location of the fire extinguishers, maintenance data, and fire-related information. “Evacuation” information includes the evacuation equipment, routes, and facilities (e.g., outdoor stairs and evacuation elevators).
4.1.3. Fire (or Dynamic) Information
Dynamic, or fire-related, information encompasses situational data regarding a building fire incident. It is crucial for effective data sharing in the event of a fire disaster. The objective is to identify the factors that influence the “survivability” and “mobility” of both evacuees and rescuers. Through a preliminary literature review, a total of 95 items was identified as comprising the fire information dataset. Upon eliminating duplicates, a partial set of 24 items was presented, as illustrated in Table 3.
To facilitate the transfer of real-time information, the critical elements impacting rescue and evacuation have been selected from the information set. These elements pertain to dynamic circumstances encountered during a building fire. In this research, sensor-generated information is utilized to express these elements in real-time, enhancing the effectiveness of rescue and evacuation efforts.
A total of 19 factors has been selected as crucial real-time information in a building fire disaster, as listed under five subcategories in Table 4. To prevent a casualty in a building fire, it is crucial to provide meaningful information that can impact either the human body or motion. For example, fire flame, harmful substances, and interior circumstances of a building can influence the “human body” and/or “motion” under a building fire. To gather real-time data on temperature, poisonous gas concentration, and smoke concentration, sensors have been incorporated into the development of the 3D/BIM-based disaster management system. Further details are elaborated in the next section.
4.2. Phase 2: Developing a 3D/BIM-Based Visualization System
4.2.1. Overview of the System
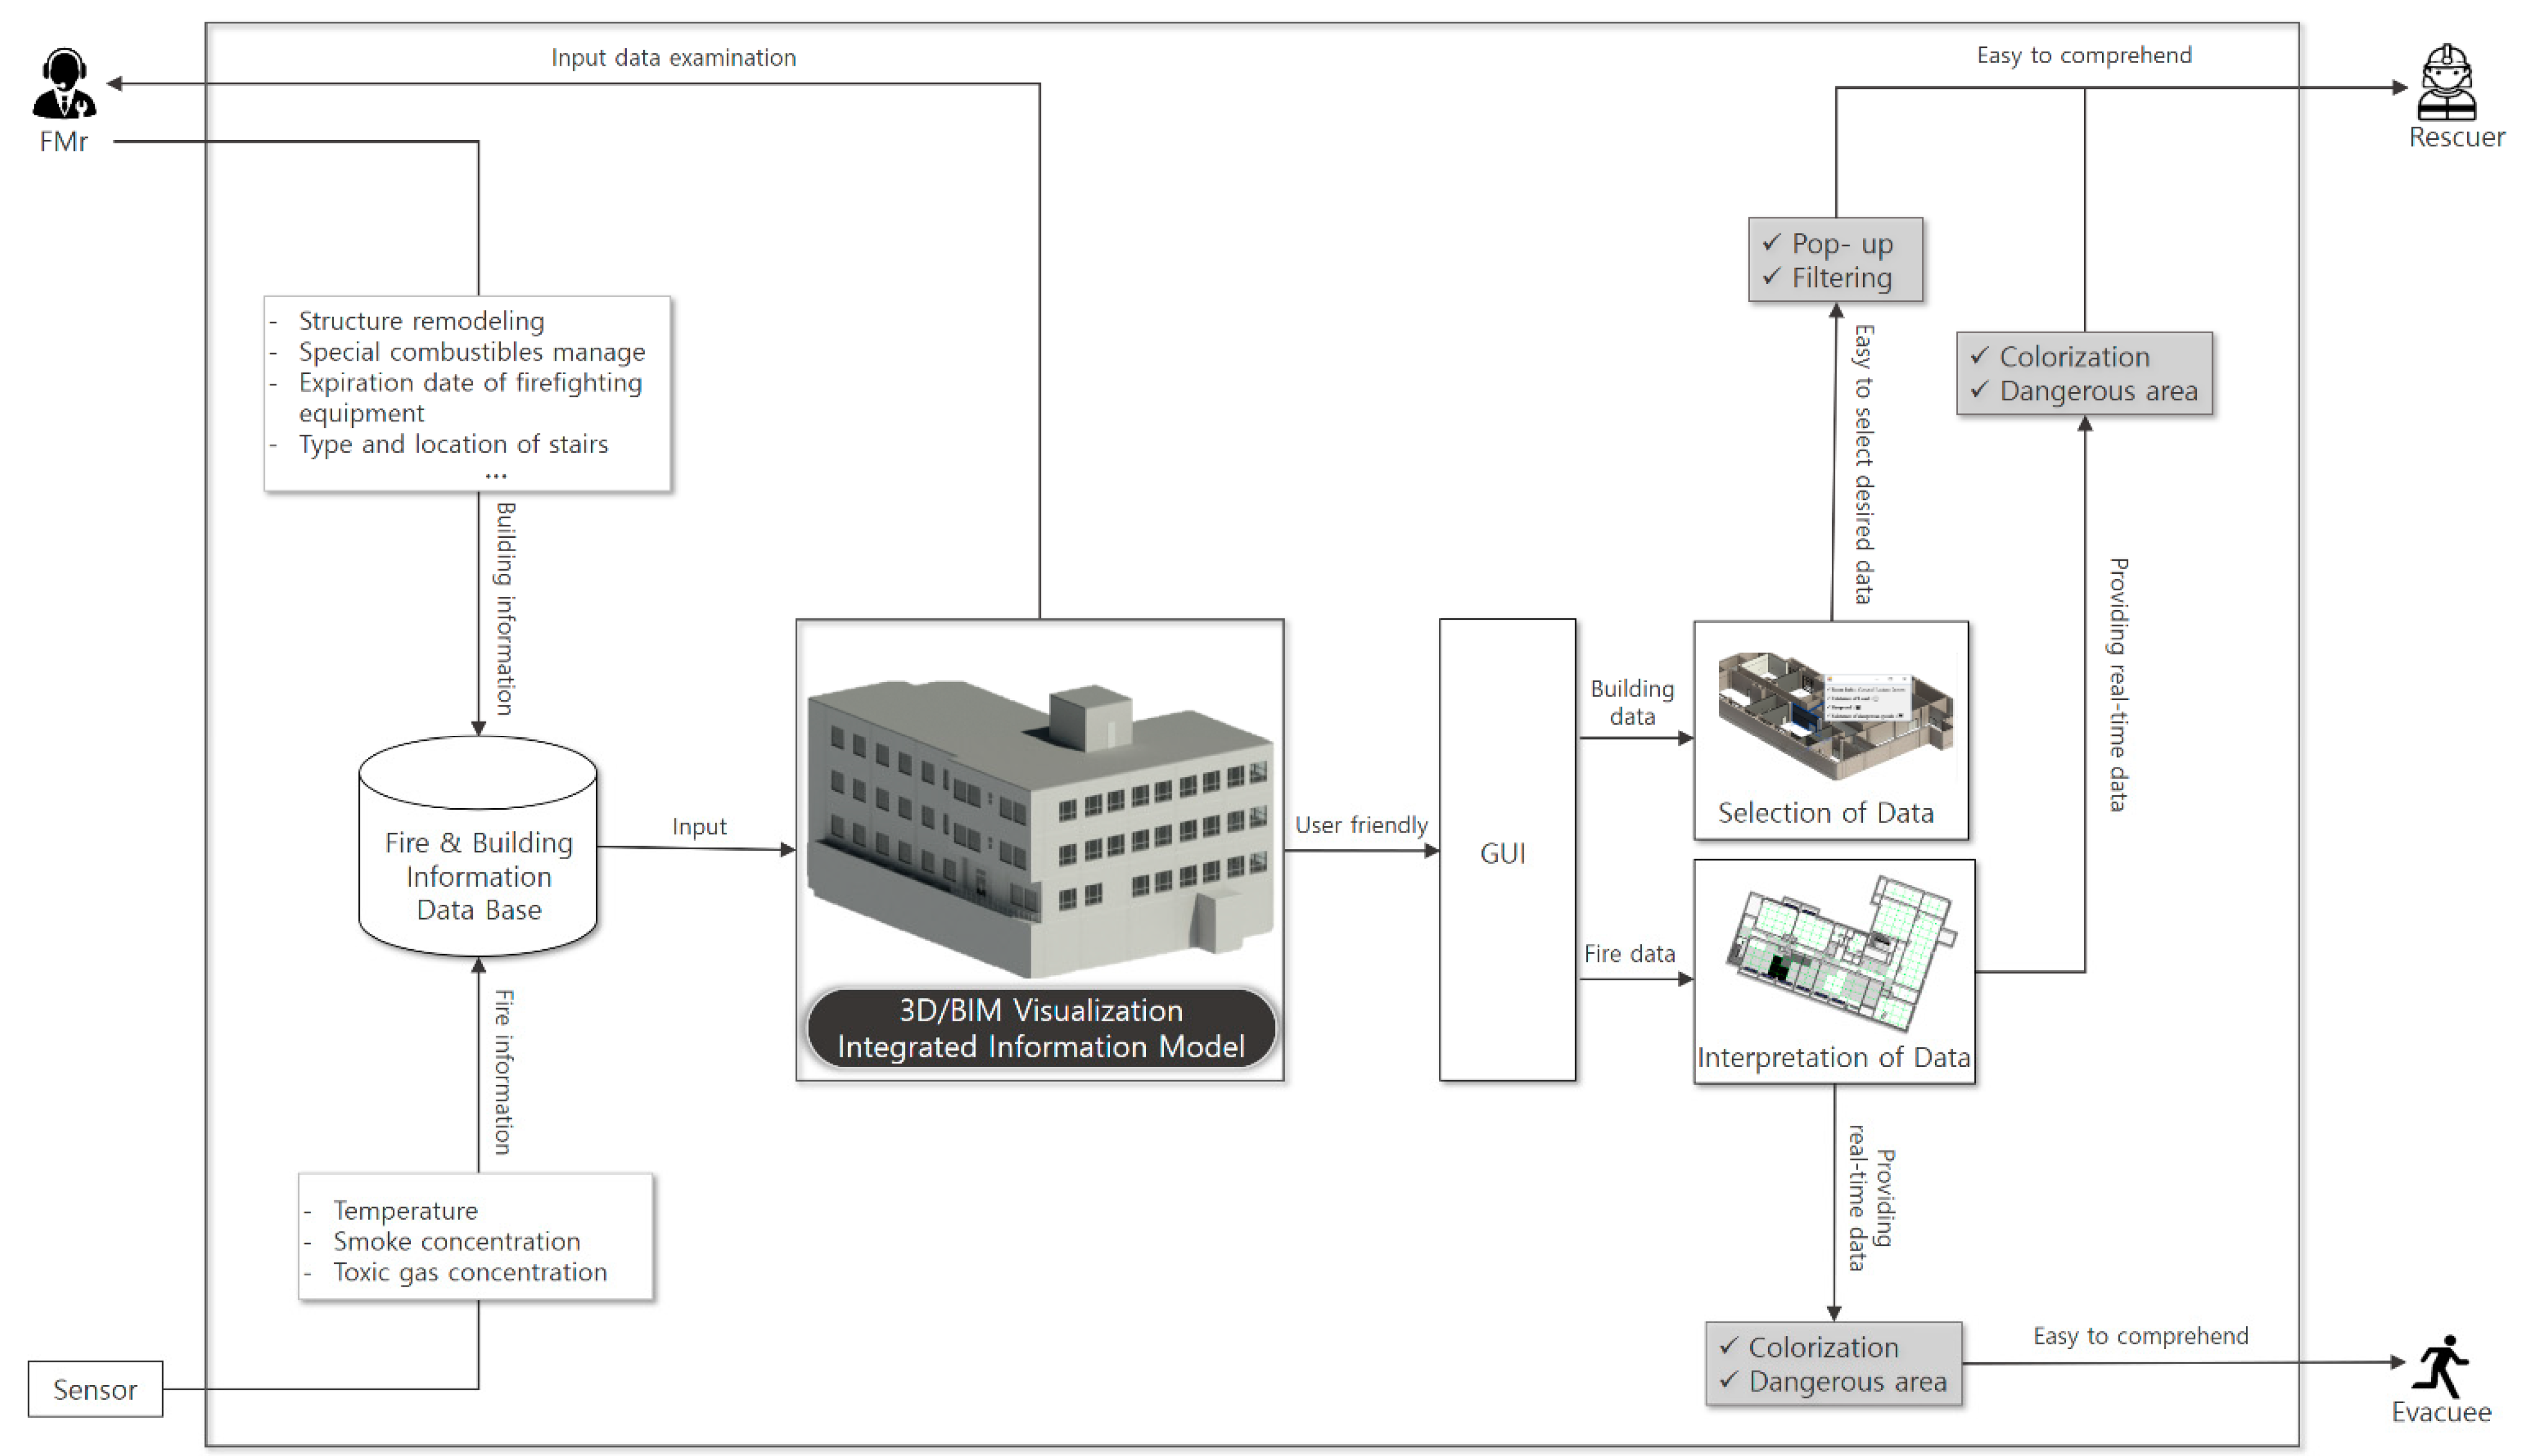
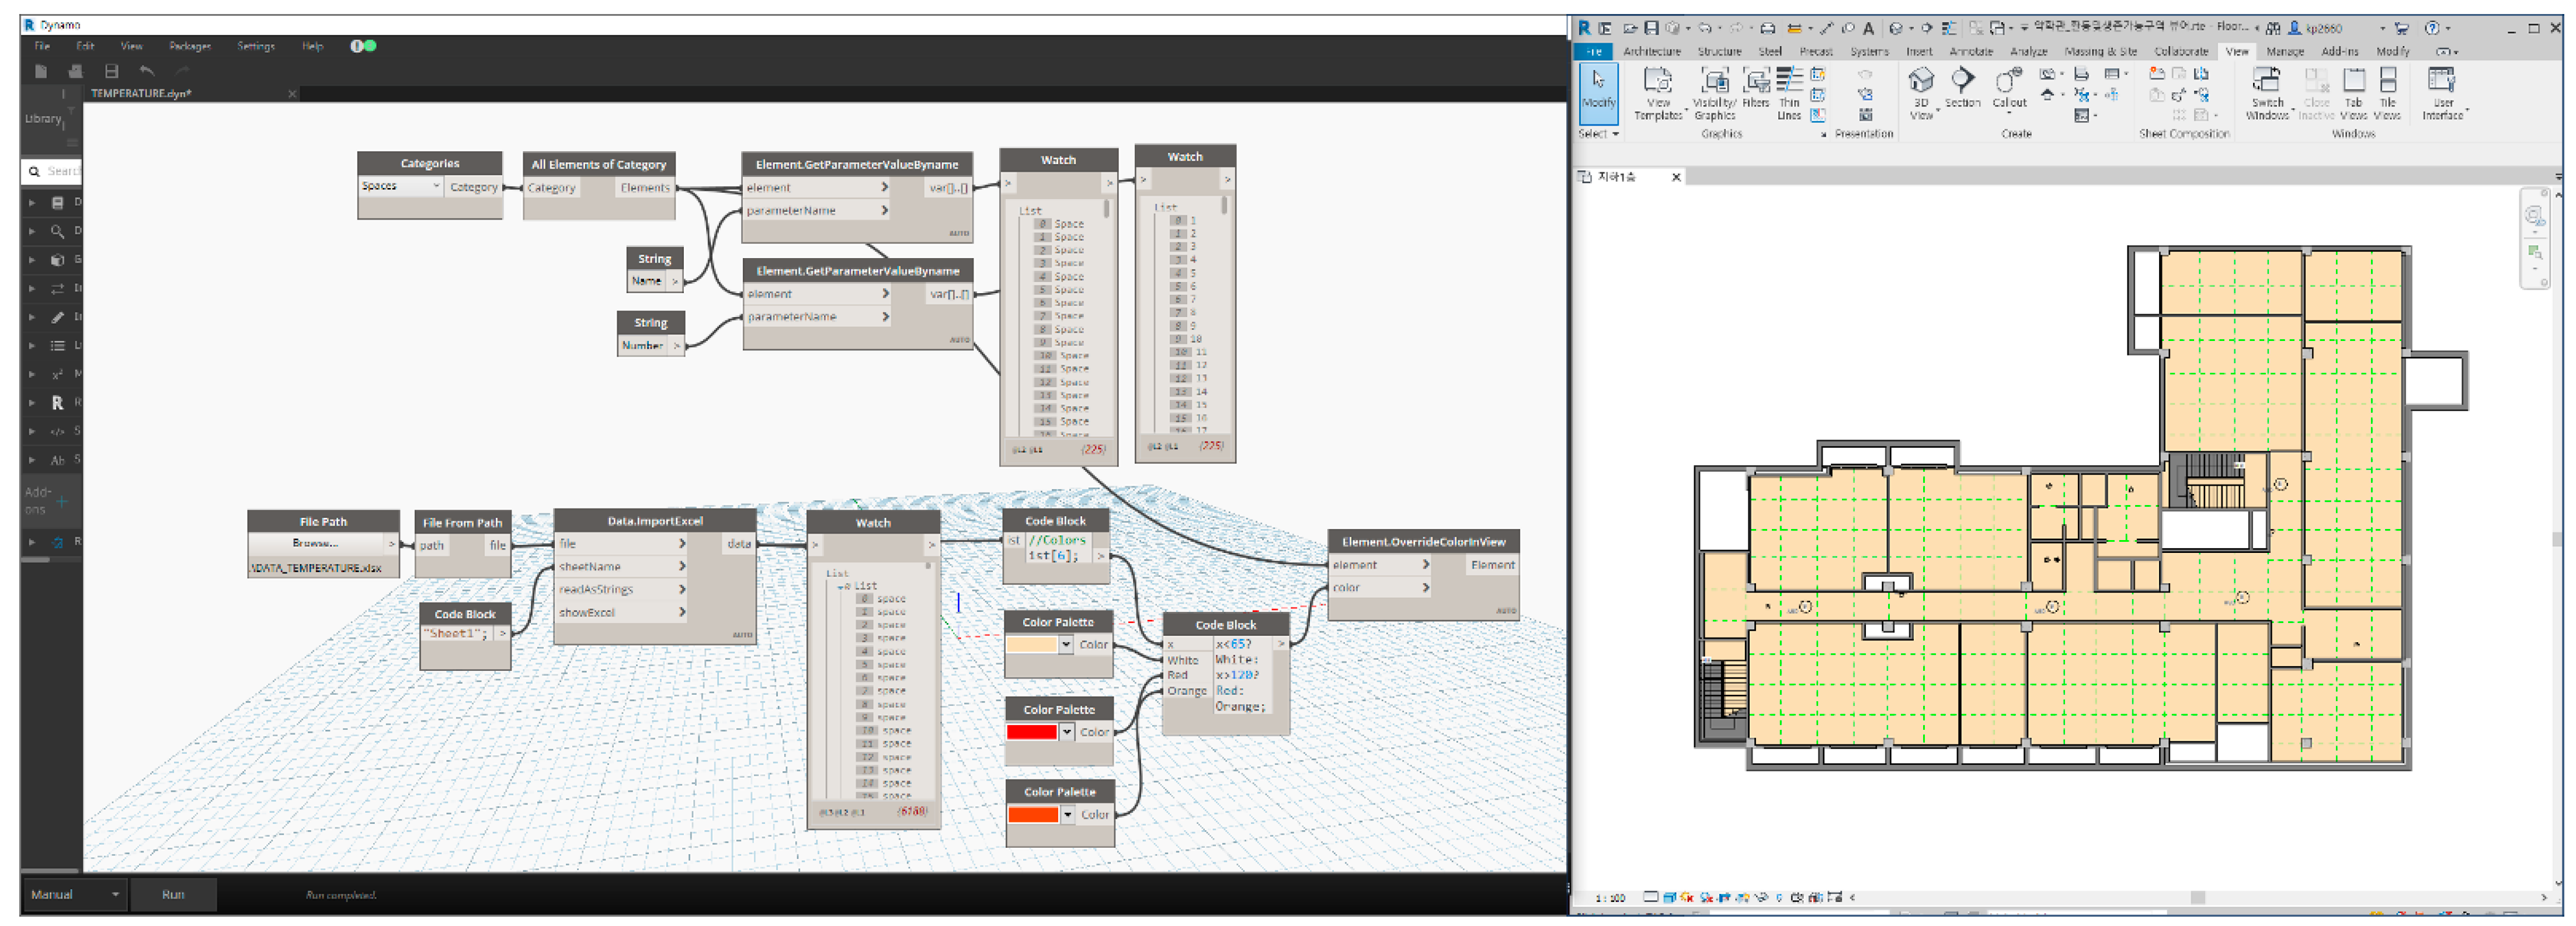
For effective fire disaster management, a system architecture has been proposed to develop a 3D/BIM-linked system by combining various building and fire information data, as shown in Figure 3. The focus of the proposed system is to establish an information-based data structure through collaboration with Revit™ software. During a fire incident, the system allows for real-time monitoring of sensor-based data, including temperature, smoke, and toxic gas levels, on a building site. Hazardous areas can be effectively identified through a quantitative analysis programmed using Dynamo™ software, which assesses the extent of impact. The primary users of the system can effectively share and deliver the information on a real-time basis by considering the derived information in the proposed system. This system was designed as a means of communication amongst the key parties involved in a fire by coming up with an effective information distribution technique.
The proposed fire disaster management system stands out in two key aspects. Firstly, it integrates building (static) and fire (dynamic) information into a fire information breakdown system, providing a more comprehensive approach compared to prior research which only focused on fire information. This enables rescuers to have a better understanding of the building and make more effective decisions on the rescue strategy. Secondly, the system includes a user-friendly visualization of the raw data, highlighting the levels that impact human health. Additionally, a BIM-based API has been developed to streamline rescue efforts, resulting in faster fire response and reduced fire rescue time.
4.2.2. 3D/BIM Model Development
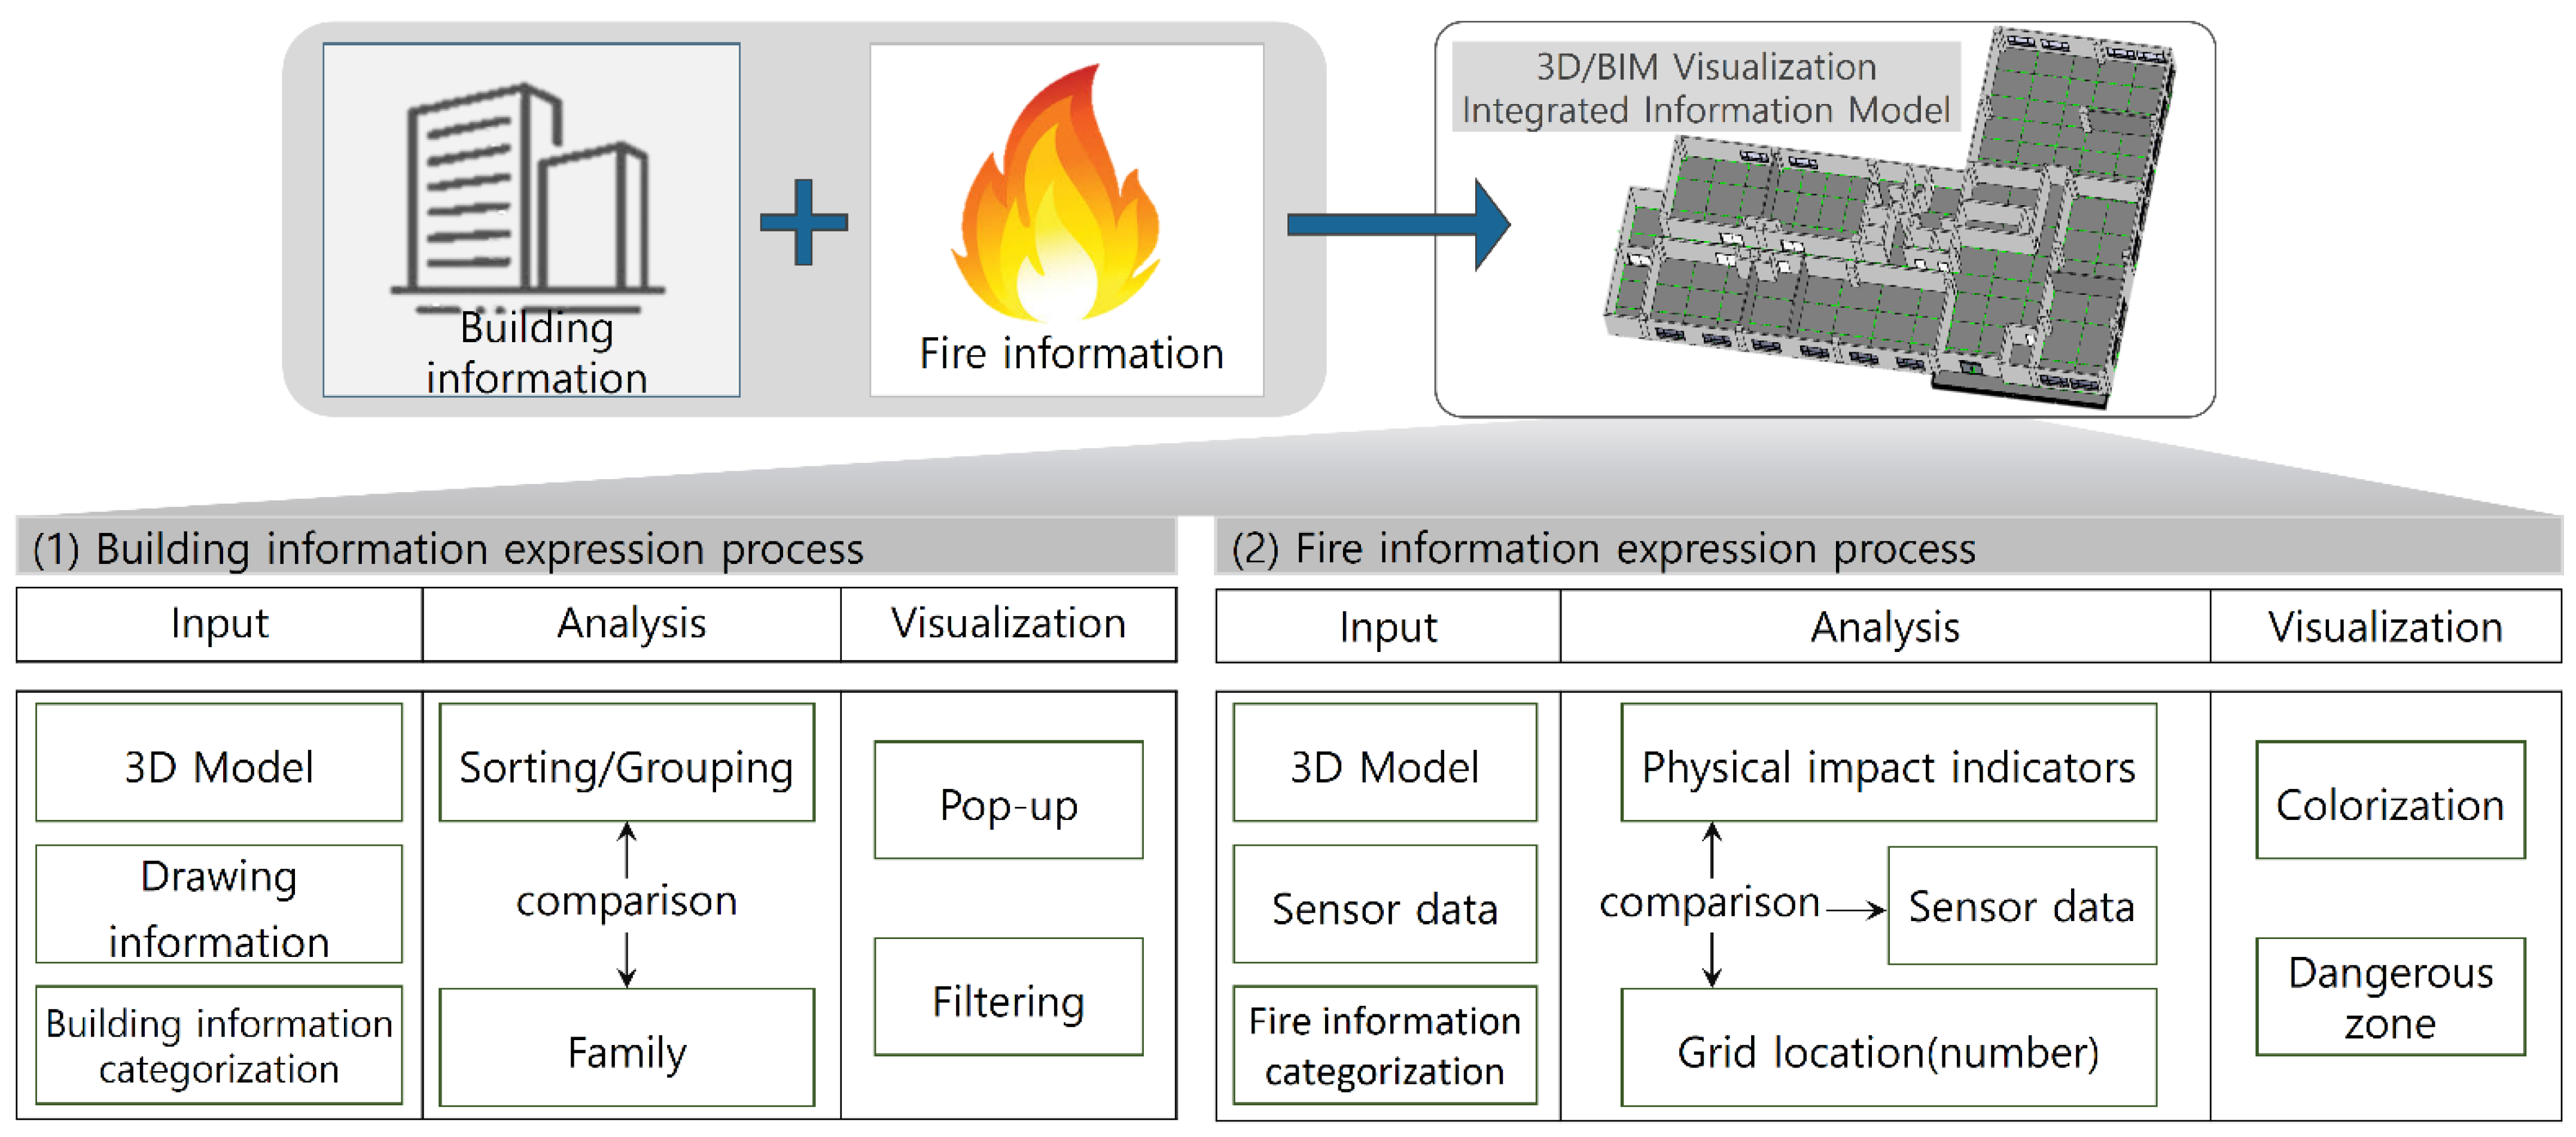
An efficient information management approach has been set up, as shown in Figure 4, to successfully integrate the database structure into the system. When dealing with building-related (static) data, the input layer relates to the 3D model, the specifics of the drawings, and the relative information categorization collected by an information-gathering system. Based on the input data, a collection of 3D model elements is compared, arranged, and categorized in accordance with their structure, material, and location inside a building. Through “pop-up” and “filtering” features, the information may then be visualized. The data obtained from the 3D model and sensors coincide with the input layer when it comes to fire (dynamic) information. Then, the sensor data is compared with the physical impact indicators and grid locations, which are then matched in the 3D model. The final information can be visualized and provided in a color-coded format. Two different types of information expression processes are listed below.
4.2.3. Building (Static) Information Expression
For building (static) information, it is crucial to efficiently keep track of the historical data and promptly detect and provide the necessary information to the users. The information expression approach is divided into the following:
- 3D modeling—This approach is focused on providing the target information in a simple form. Building (static) information is provided in a visualized format through the 3D/BIM model so that the users can view the information by choosing the option(s) or by filtering the target groups. This process can reduce the decision-making time and effort by helping rescuers or evacuees in making reasonable decisions during a fire. In addition, providing 3D-visualized information to non-experts can improve their understanding of the information and enable them to effectively recognize the optimum rescue and evacuation routes. The main visualization strategy is to select only the necessary information through filters and/or pop-ups in the 3D/BIM system. The filtering process is based on the information classification structure mentioned in Section 5. This structure allows the users to efficiently identify the building elements corresponding to the target subject, i.e., beams, columns, girders, and openings, in the entire 3D/BIM model. The pop-up function enables the users to check other important fire-related information by clicking on the corresponding object.
- Documentation—This approach is focused on providing detailed information and document management for easily updating and managing changes in the 3D/BIM model in the event of building maintenance. Outdated information can hinder firefighters from understanding the current building conditions. Updated and precise data in the 3D/BIM model help the users to effectively recognize important building information, i.e., the type and location of anti-fire facilities, the presence of combustibles, and other unique features of the building. In addition, the digital documentation format, i.e., Microsoft Excel, can increase data accessibility for non-experts who are unfamiliar with the 3D/BIM technology. The main purpose of this approach is to provide precise and detailed information to users and enhance the efficiency of document management.
4.2.4. Fire (Dynamic) Information Expression
The fire (dynamic) information is characterized as changing over time. Unlike building (static) information, fire information is linked with the situation in relation to a building fire. To provide meaningful information to the users, the data should be interpreted in terms of the seriousness of a particular position. With this information, the rescuers and/or evacuees can effectively recognize the condition of the building and the necessary anti-fire equipment. When this data is interpreted and integrated with the building information, the system users can rapidly make better decisions by reducing time wastage. For this study, the interpretation of information is limited to determining the impact of three dynamic data on the users, i.e., temperature, carbon monoxide (CO) concentration, and smoke.
This information is provided in the form of a zone (area), which is color-coded according to the degree of risk to identify the danger zones inside the building. In this study, the zone size has been determined to be 2.4 m × 2.4 m, based on the average width of the corridor of a building. To monitor the dynamic situation of a building, sensors are embedded in the center of each zone to collect data about the above-mentioned data. The risk level is then expressed by analyzing the captured raw data from the sensors. A particular zone can be allocated based on the risk level. Once the entire area of the building is expressed in terms of this level, the users can utilize it for evacuating the building and rescuing people in a fire disaster. The risk level is defined based on the literature review. Both the temperature and CO congestion are categorized in terms of exposure time, whereas the smoke congestion is categorized in terms of the physical impact. The details are provided in Table 5, Table 6 and Table 7.
Temperature and CO concentration can affect the body and potentially influence physical activity and motion. Therefore, temperature and CO concentration information are important for the survival of individuals in emergencies by affecting their ability to regulate their body temperature and by potentially causing harmful health effects. Smoke concentration can impact movability by reducing visibility and potentially causing respiratory and other health issues that make it difficult to move around in an affected area. In this study, zone accessibility has been divided into four categories: inaccessible, dangerous, cautious, and accessible. Each zone is identified by a relevant color code so that the evacuees and/or rescues can easily recognize the risk levels of a particular zone. The details are provided in Table 8 and Table 9.
The time limit for survival is used to evaluate the danger level of each zone for various survival scenarios. This information is used to determine a particular zone’s access level. The risk level is categorized into four levels, and the contents corresponding to levels A to D are as follows.
- ▪
- Level S_A: highest risk level with survival time within 15 min
- ▪
- Level S_B: high-risk level with survival time within 30 min
- ▪
- Level S_C: dangerous level when exposed for a long time
- ▪
- Level S_D: cautious level when exposed for a long time
The possibility of evacuees’ survival increases from level A to level D. These risk levels are defined by accessibility level and their corresponding colors. The movability level is evaluated based on the visibility of the movable zone. The movability is divided into four levels, A to D, with corresponding colors to indicate their access level as follows.
- ▪
- Level M_A: complete darkness and inactivity (black)
- ▪
- Level M_B: dark and difficult to distinguish (charcoal)
- ▪
- Level M_C: difficult to grasp unfamiliar structures (gray)
- ▪
- Level M_D: adjustable to darkness with time (white)
As mentioned above, the color codes are designated based on the acquired sensor data. The raw data which are collected from the embedded sensors are exported to a spreadsheet and Microsoft Excel™ by automatically classifying the risk level in terms of the level corresponding to the data based on the survival/movability indicators. The corresponding color for each level is then assigned to each zone and represented on the 3D/BIM model. The visualization process is implemented using Dynamo™, a programming software. The programming code and its corresponding 3D/BIM model for the case study are described in Section 4.3, and it can be visualized in Figure 5.
As shown in Figure 5, the raw information collected from sensors that are installed in a building is connected with the 3D/BIM model. Using the aforementioned categorization process, each zone can be assigned to a designated color in terms of the risk level. Therefore, it is expected that the system users, i.e., facility managers, rescuers, and evacuees, can efficiently identify the optimum routes via the 3D/BIM visualization. The color-coded zones can help rescuers quickly identify areas where urgent rescue is needed and minimize risk during rescue operations.
4.2.5. Application Programming Interface (API) Development
The 3D/BIM-based visualization system is developed using Revit™ software. The system is integrated as an add-in program and provides users with user-friendly access through a GUI. The GUI is based on the API of the Revit™ software and is called the Smart Fire Rescue Management (SFRM) panel. The API was developed using C++ language-based Visual Studio 2022. The process of creating the panel includes generating an application corresponding to a tab using UIControlledApplication, naming the tab as Smart Fire Rescue Management, constructing the form and name of the panel using buttons, and connecting the functions of the buttons through path designation.
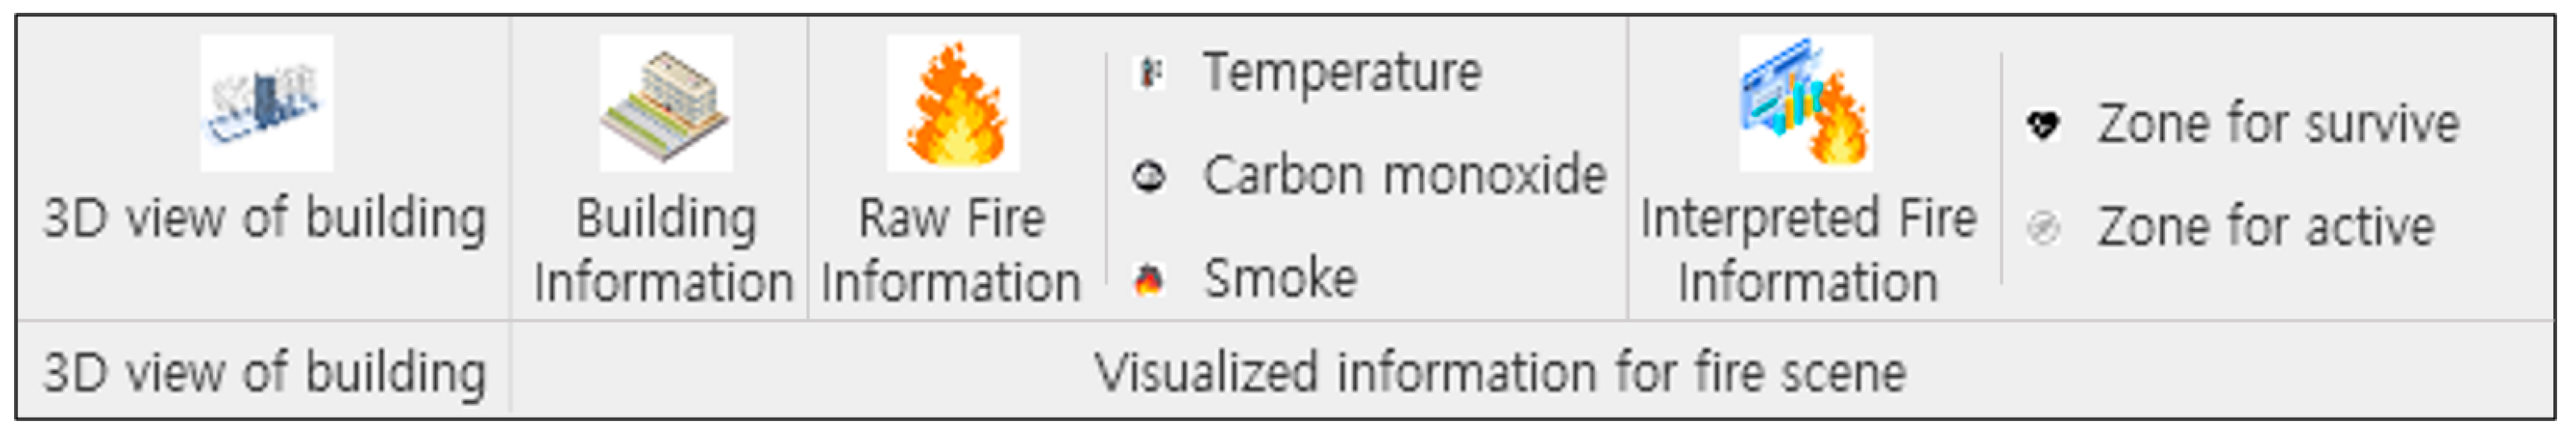
As seen in Figure 6, there are four types of information with two main categories: 3D view of the building and visualized information for the fire scene. The 3D view of the building enables the users to see the building elements in a 3D format, whilst the visualization of the fire scenes consists of three detailed information buttons: building information, raw fire information, and interpreted fire information. By simply clicking the buttons of the SFRM panel, the system users can easily acquire the necessary information which is linked with the dataset as mentioned in the previous section.
4.3. Phase 3: Case Study and Validation of SFRM
To verify the effectiveness of the developed system, a real-case study was demonstrated. This case study has effectively verified that the SFRM provides immediate and meaningful information to the system users. This demonstration was based on the system architecture which has been proposed in the previous section. To demonstrate the API program, i.e., SFRM, a 3D/BIM model for the case study has been created and the relevant sensors were embedded in the case study project.
4.3.1. Overview of Case Study
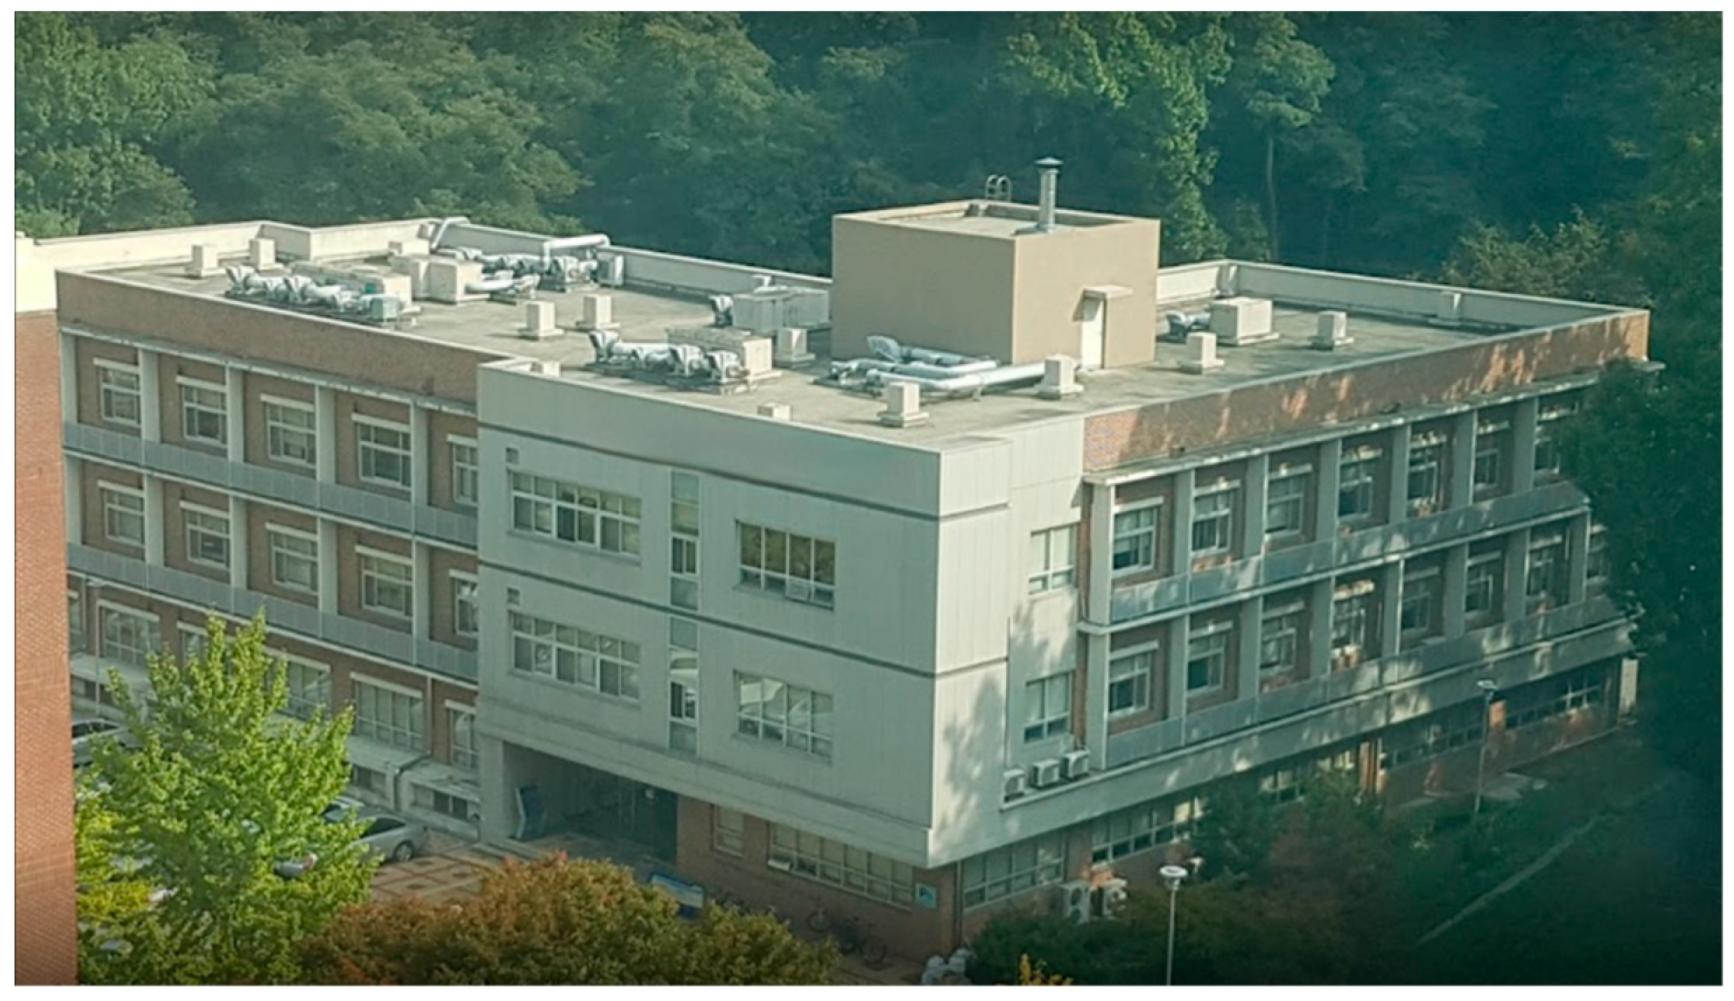
To evaluate the efficacy of the developed system, a case study has been conducted in Yachak Hall at Ajou University, Suwon in South Korea (see Figure 7).
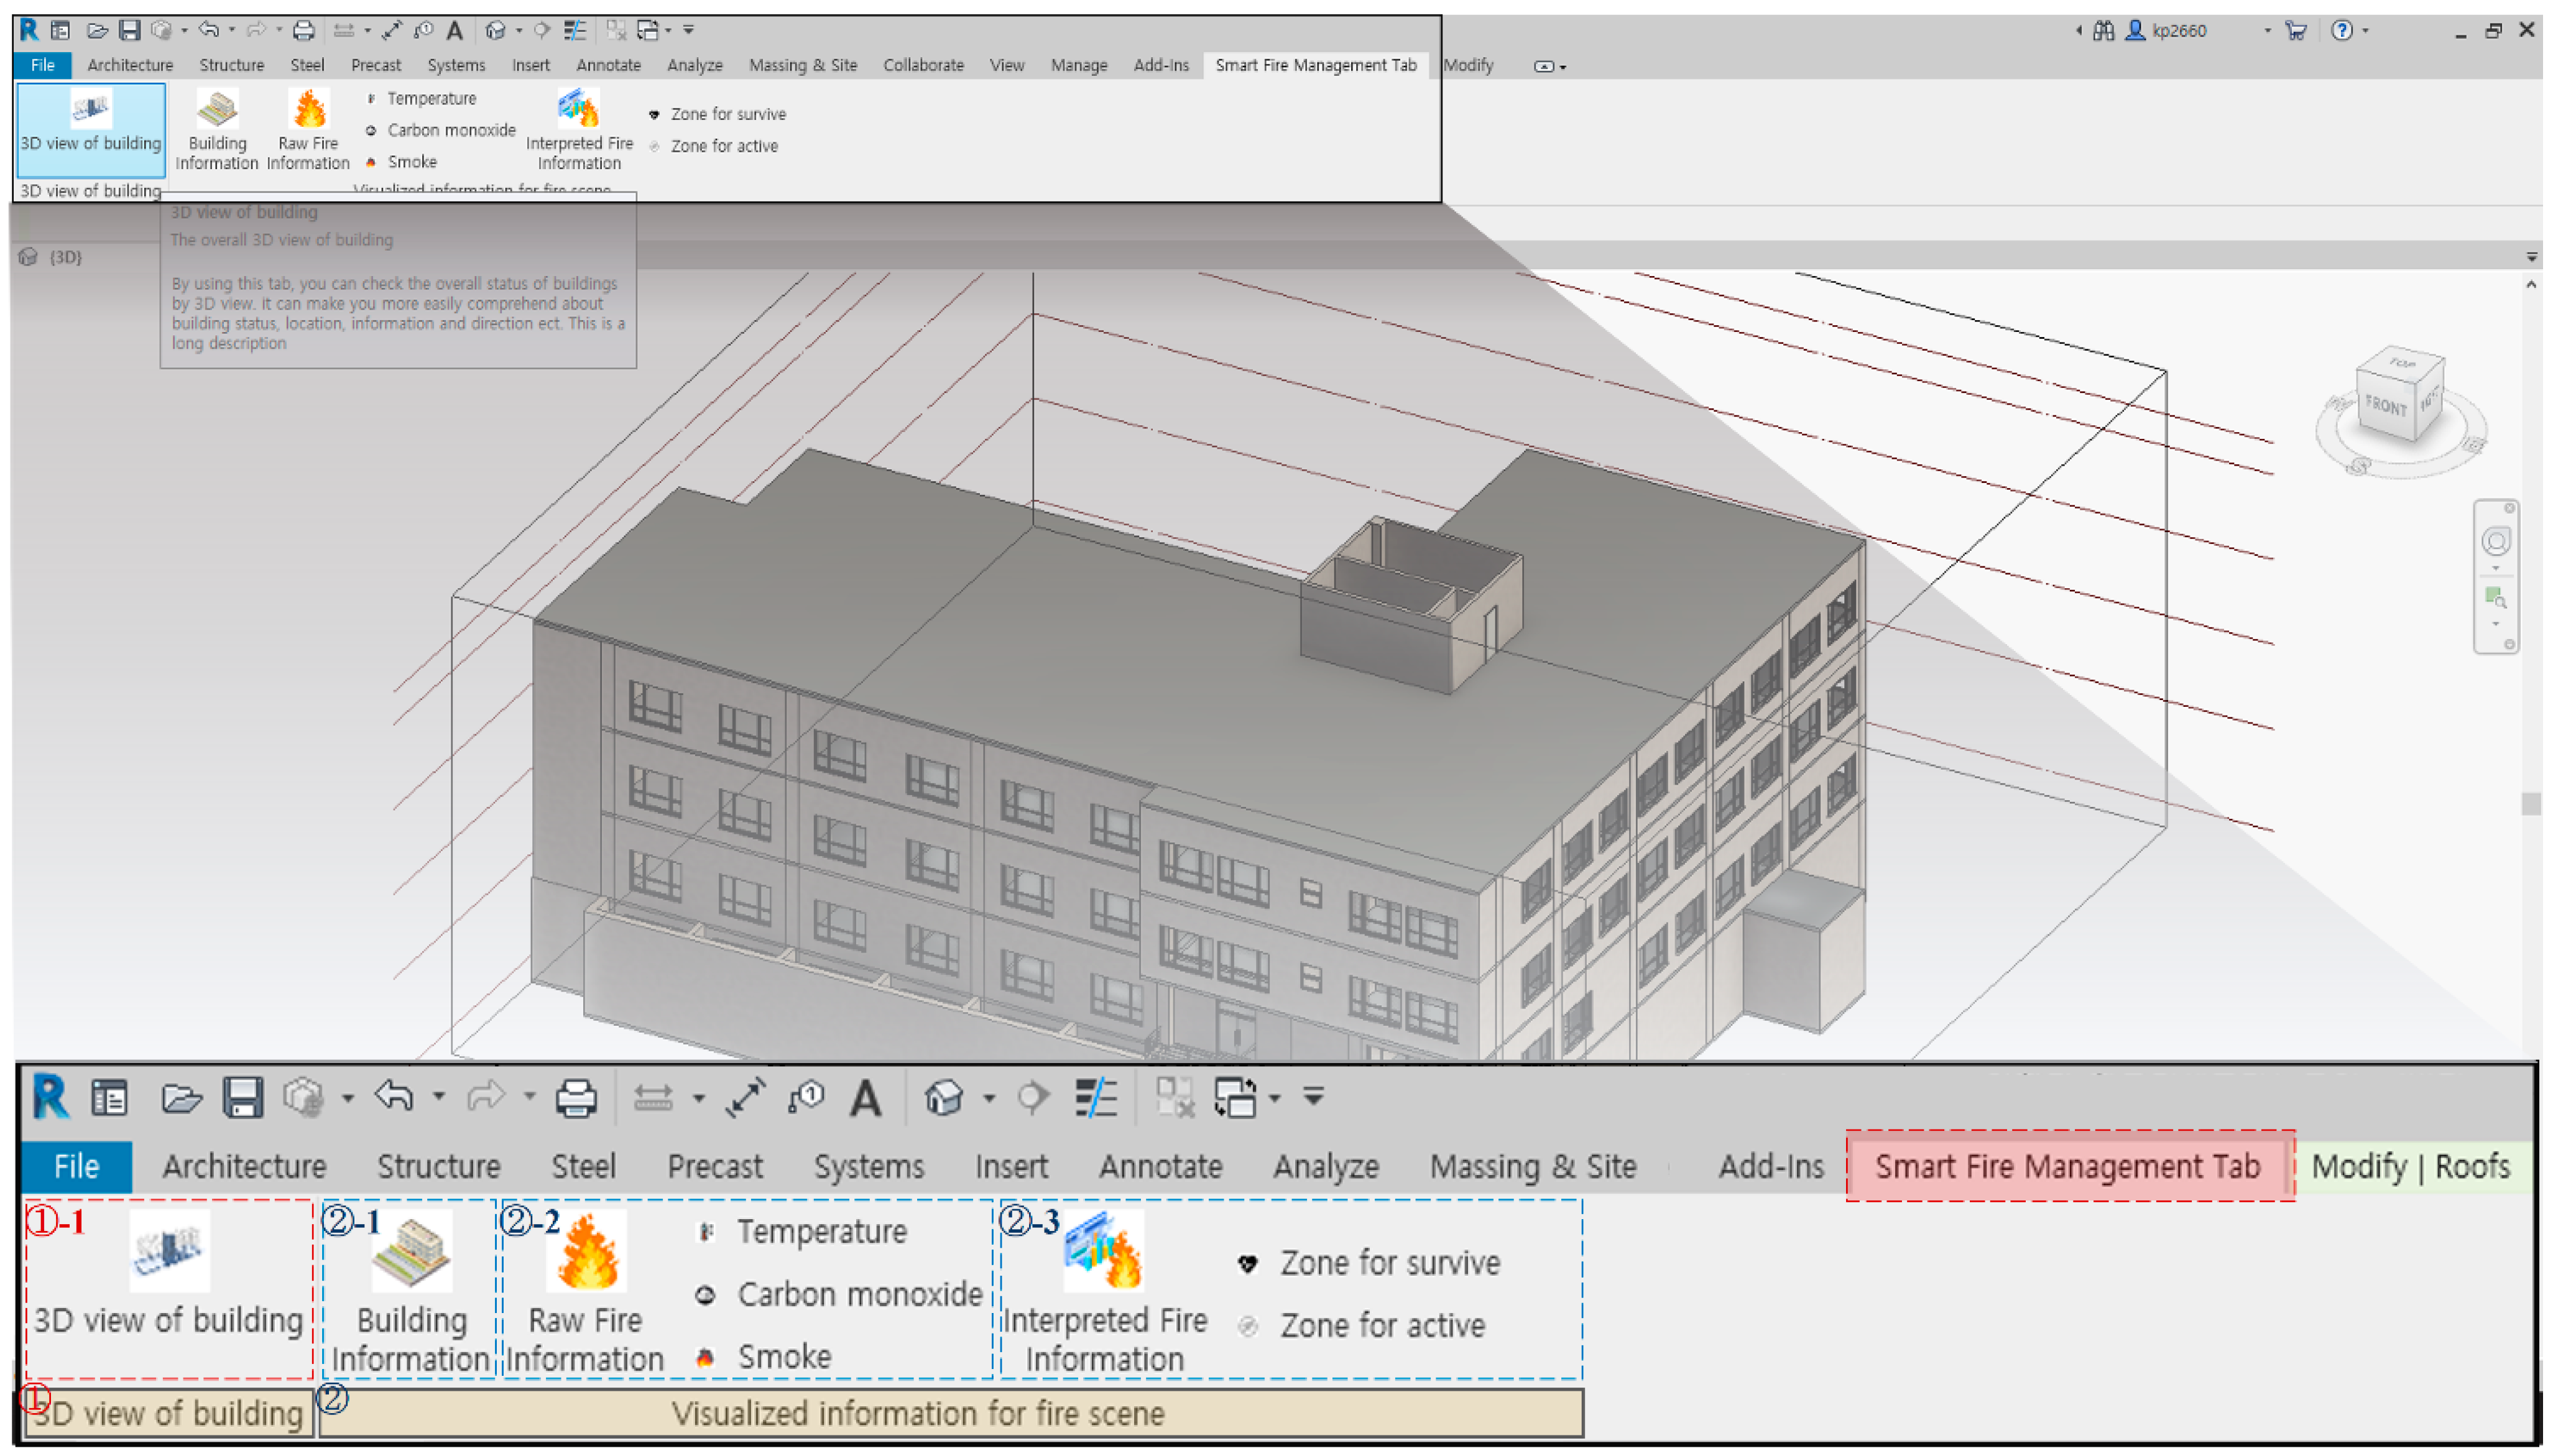
Using Revit™ software, the case study project has been digitalized into a 3D/BIM model. The SFRM system is embedded into the digital model as presented in Figure 8. As seen in Figure 8, a menu bar is newly inserted into the Revit™ software in association with a GUI. This GUI consists of four buttons under two major functions: 3D view of the building and visualized information for the fire scene. The details are elaborated in the following subsections.
As depicted in Figure 3, an information structure is employed to model both the building and fire information, which are managed in real time via the proposed system. Periodically, facility managers monitor the building's status, which involves checking the condition of structural elements, fire equipment, openings, exits, and other pertinent features. They modify the 3D/BIM model as necessary, with the aforementioned data structure connected to the building objects. If a building fire occurs, embedded sensors (temperature, smoke, and toxic gas) detect the fire information, which is represented by various color codes. The proposed system can help rescuers and evacuees respond more effectively in emergencies. For instance, rescuers can identify the most dangerous areas of the building, while evacuees can find the safest exit route.
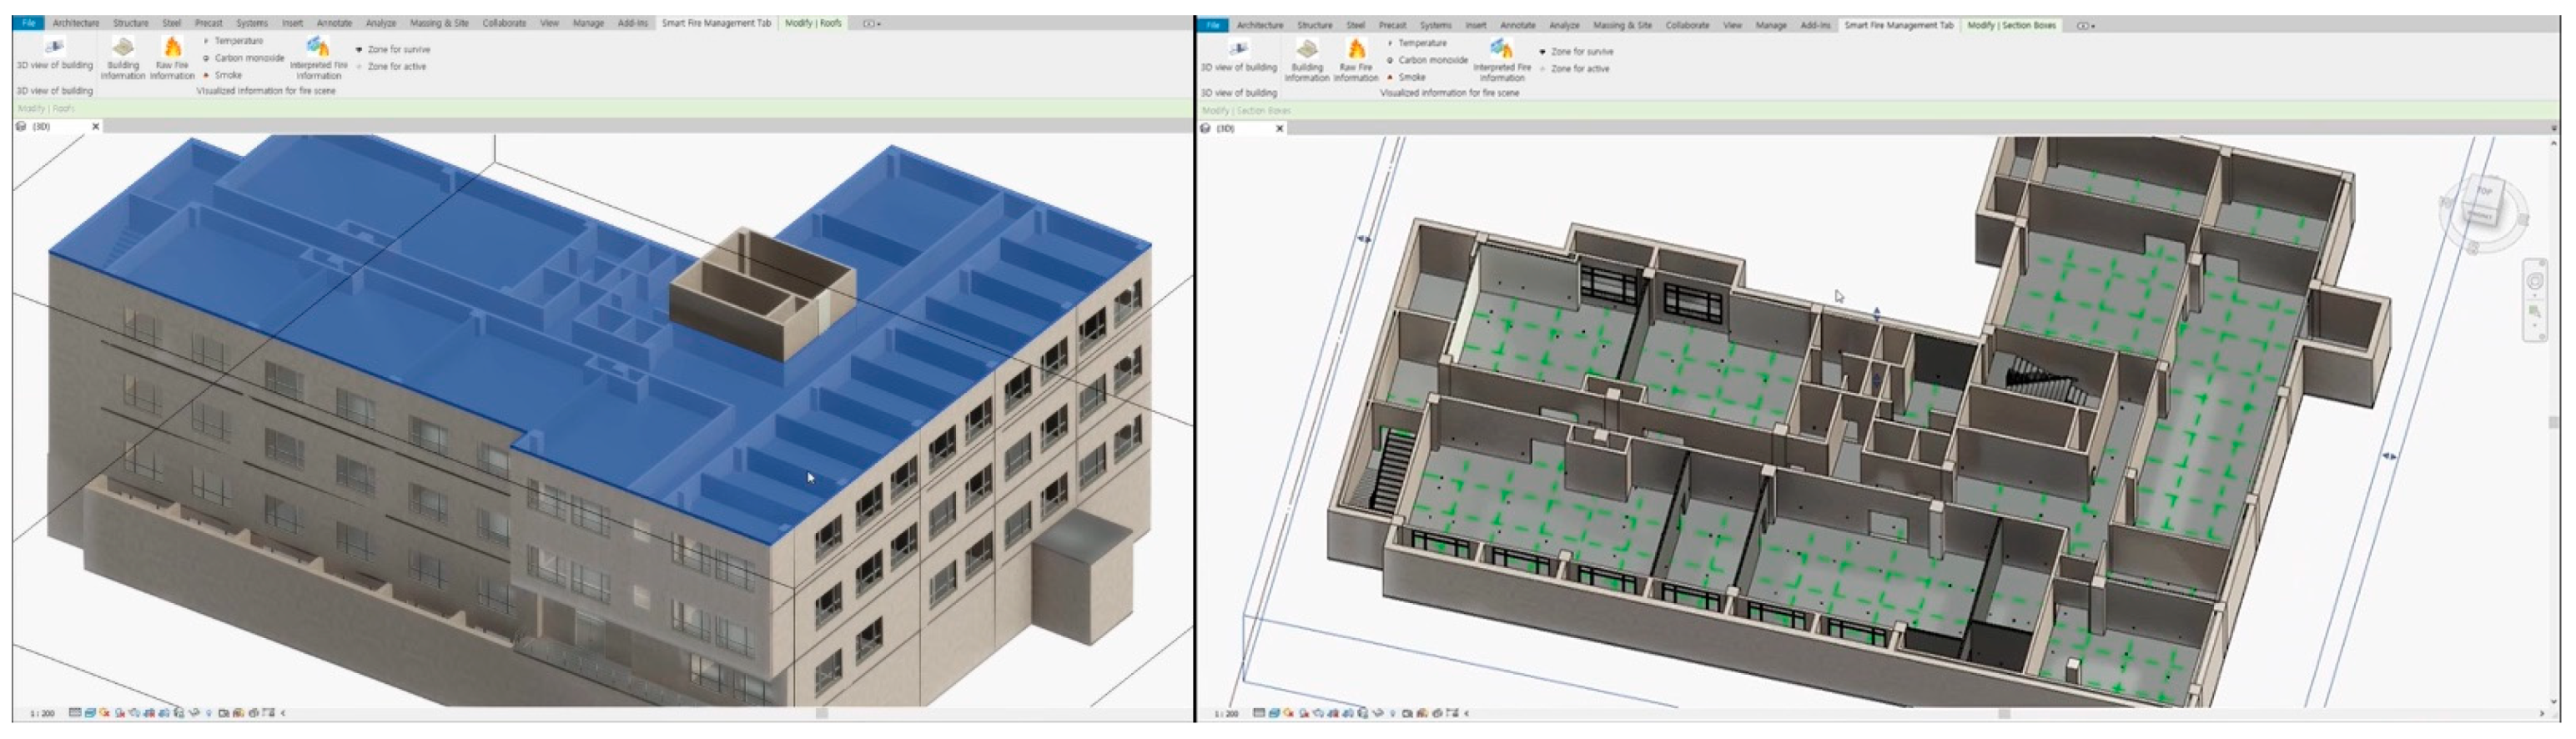
4.3.2. 3D View of the Building
The “3D view of the building” button provides the most basic information. It corresponds with the 2D-drawing information and delivers a 3D model of the entire facility. This makes it possible to enlarge and rotate the structure of the facility to check the details of the desired locations. In addition, a cross-section feature allows users to view the internal structure of each floor. This supports faster comprehension of the interior structure and effective depiction of the internal passage, entrance/exit, open spaces, and the size of the building before and after the disaster (see Figure 9).
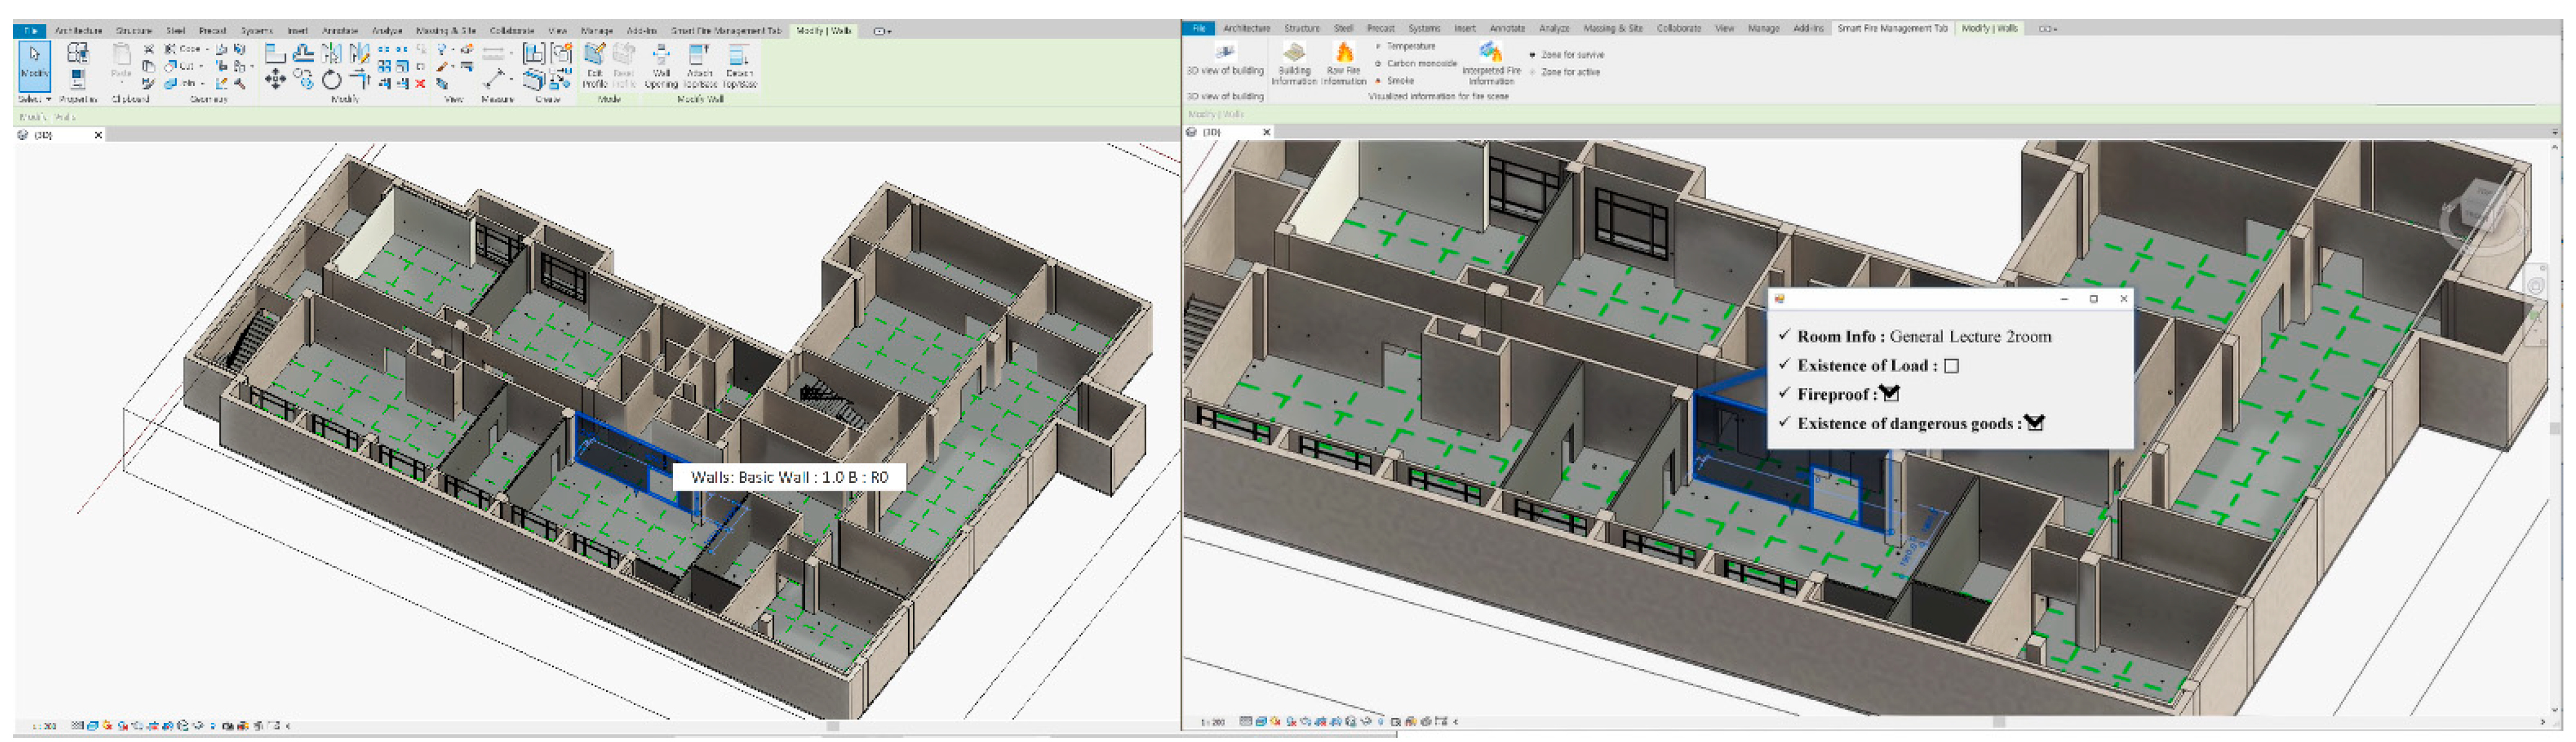
4.3.3. Generation of Building Information
Using the “Building Information” button, the system users can view the 3D building elements and their detailed information. This function of the system provides the users with crucial information in relation to the building elements. The system provides a “pop-up” menu so that the users can select a particular building element to recognize more detailed information. The pop-up menu information is related to the evacuation, rescue, and management of the building in terms of fire disasters. For example, the system user can view the latest inspection status of the firefighting equipment and the presence of any hazardous substances and materials.
In addition, the system provides information about internal structures, such as columns, walls, and slabs. When the user clicks on a 3D model, a pop-up function provides the latest updates about the building structure, fire resistance, and dangerous path information as depicted in Figure 10.
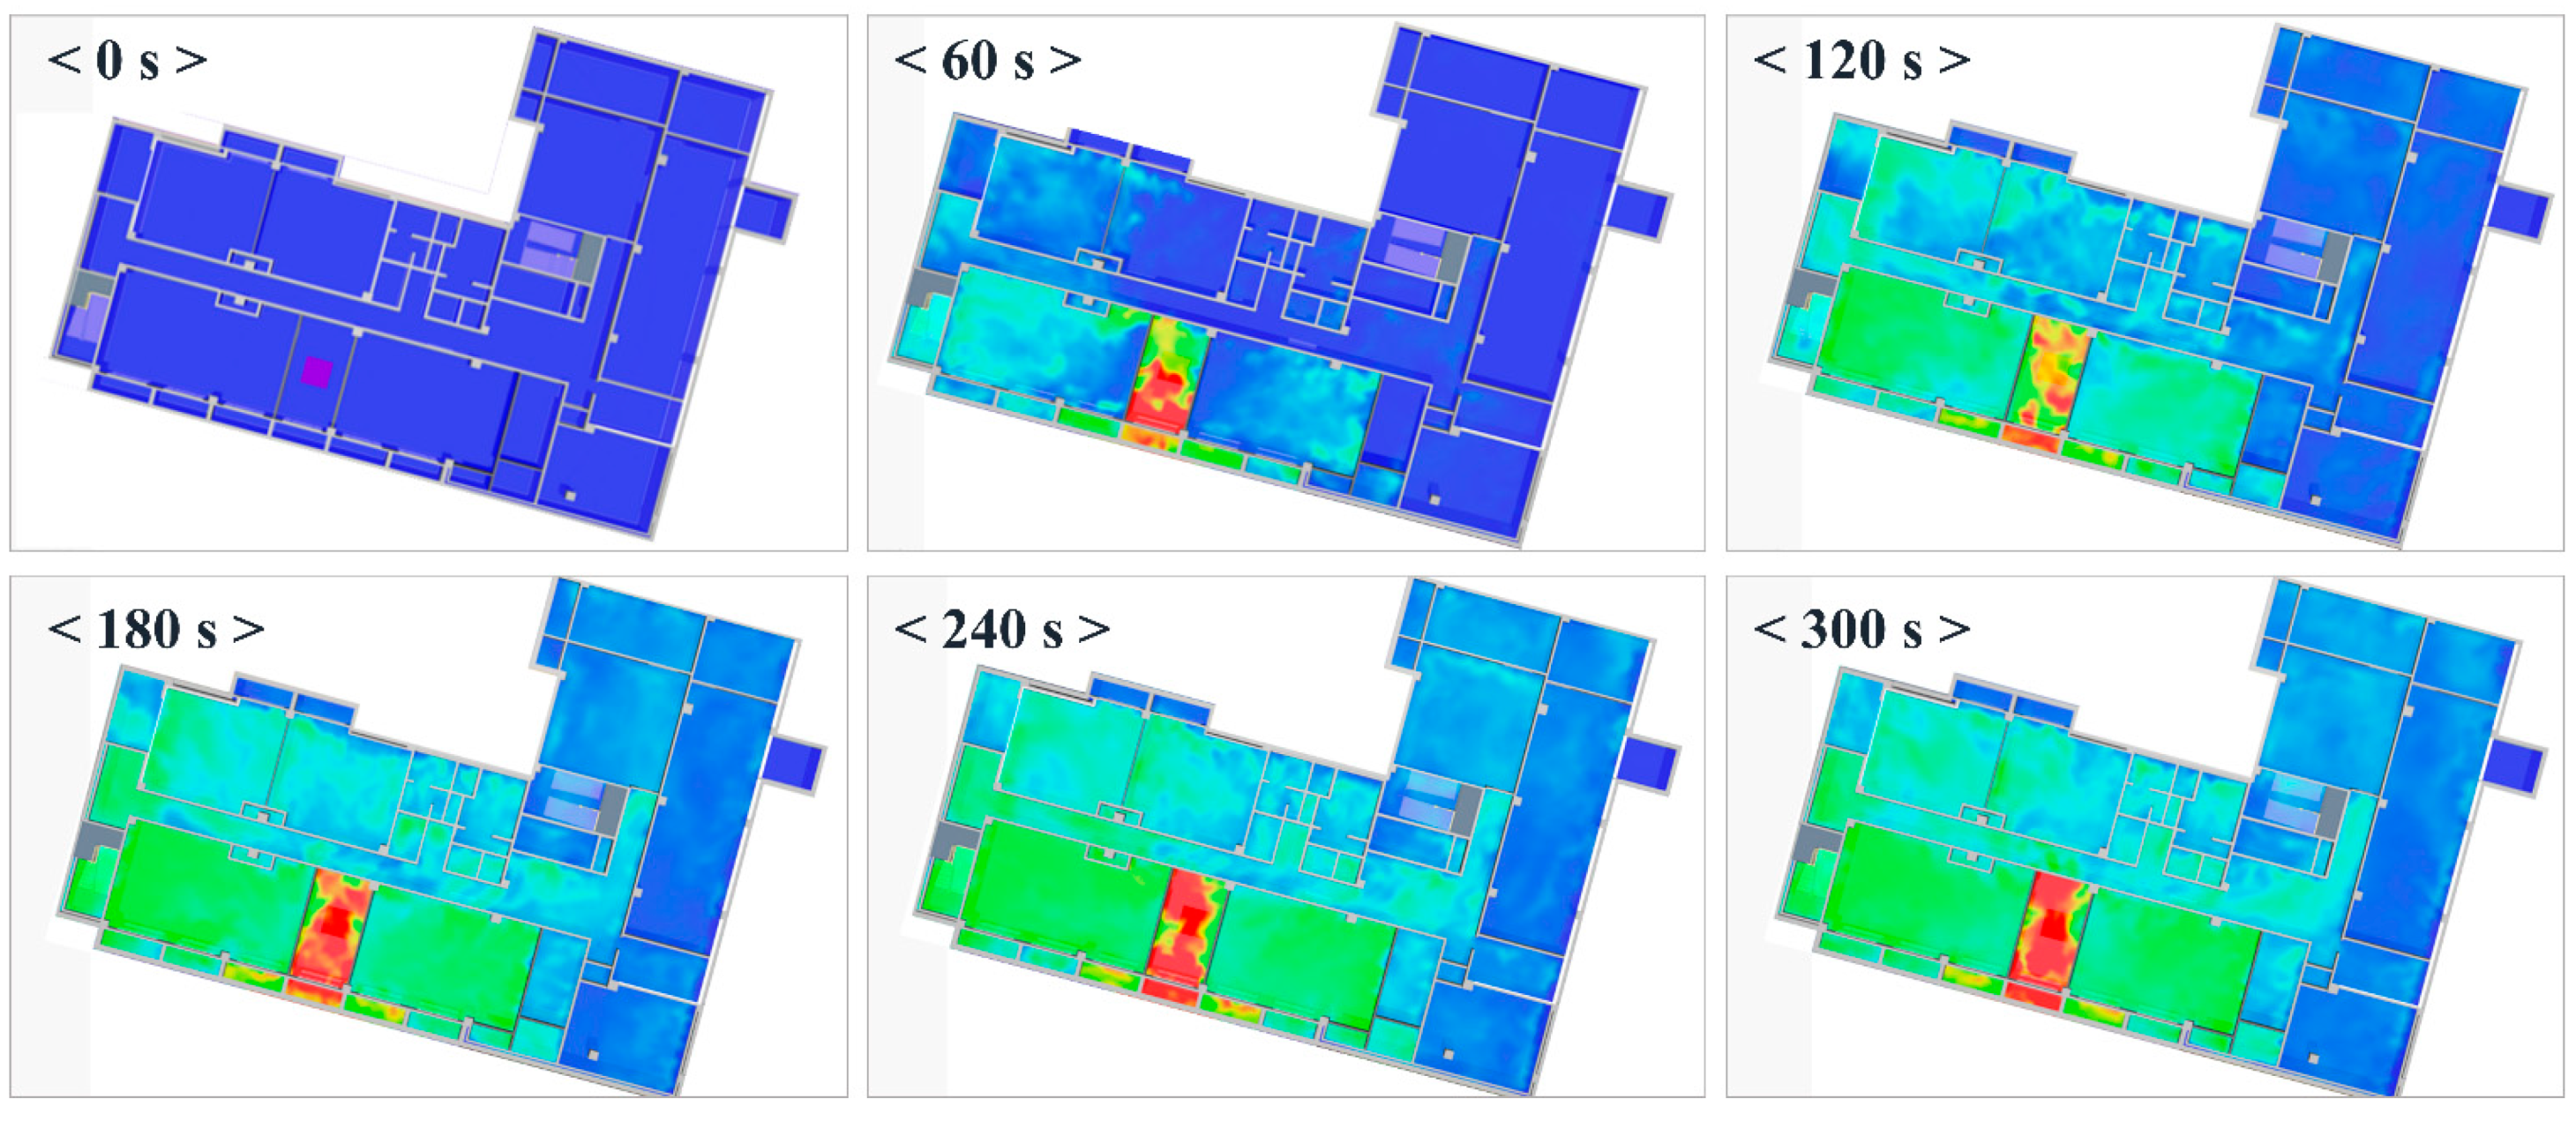
4.3.4. Generation of Fire Information
By clicking the “Raw Fire Information” button in the SFRM, the users can view the visualized information on the fire. This visual information can provide the users with the circumstances of a fire inside the facility. Thus, the users can effectively recognize the real-time situation of a fire. In the form of color gradation, the temperatures, toxic gases, and smoke are represented in the 3D/BIM model. The color blue initially represents the building, but after 60 s, the ignition point changes to red, indicating high temperature and smoke. As the fire spreads, the area around the ignition point changes to yellow and green, indicating that the temperature and smoke have decreased but the fire is still spreading. As time goes on (>120 s), the number of red, yellow, and green areas increases, indicating that the fire is spreading further. The system users can easily understand the ignition position of a fire and predict the diffusion of both the flame, toxic gas, and smoke as seen in Figure 11. The real-time information generated by clicking this button plays an important role in making a better decision in responding to the building fire.
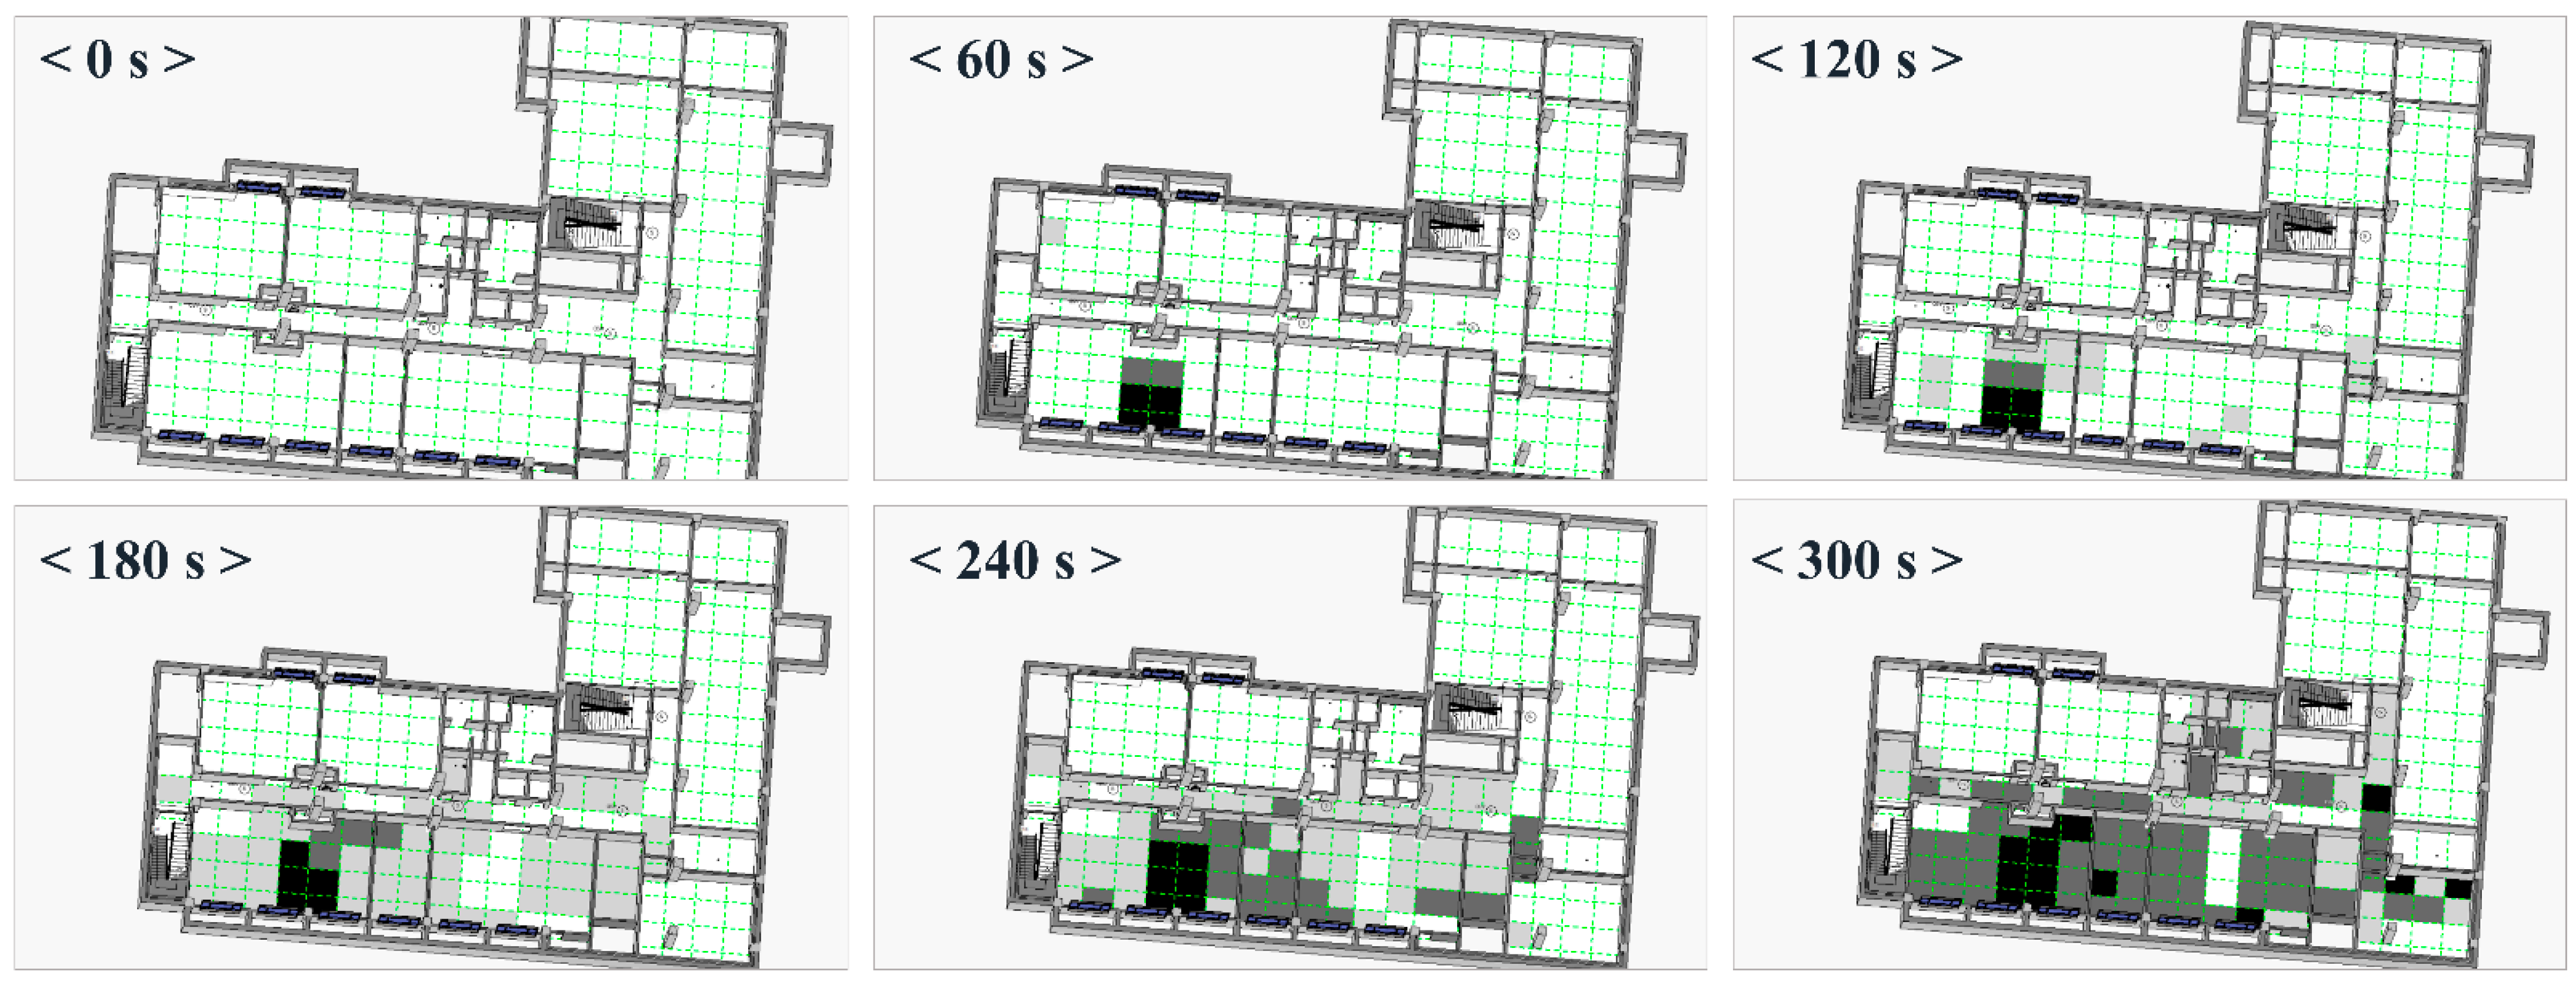
4.3.5. Interpretation of Fire Disaster Information
The “Interpreted Information” feature in the system gives users a real-time view of the impact of a fire on the survival and mobility of building evacuees. The visual representation displays the current zone’s effect on evacuees and rescuers, with darker colors signifying greater difficulty in mobility as depicted in Figure 12. Within 60 s of a fire, black areas appear where evacuees cannot move without firefighting equipment, and gray areas show where movement is challenging. Over time, by applying these color codes to the entire 3D model, users can understand the interior situation of the building in terms of survival and mobility by interpreting raw data such as temperature, toxic gas, and smoke levels. This interpretation can help rescuers predict the smoke spread and determine the need for additional firefighting equipment.
4.3.6. Expert Feedback on the System
To effectively cope with a building fire, the information in relation to a fire needs to be well-managed. When the evacuees and rescuers do not fully understand the interior situation of a building, the damages can become catastrophic. To prevent this from happening, this research has developed a new system, i.e., SFRM, which can manage and visualize the real-time situation of the building interior.
To verify the effectiveness of the system, a survey was conducted among fire-fighting practitioners and experts. Prior to completing the survey, all respondents were given a half-day session to familiarize themselves with the new system. This pre-meeting is aimed to make them better understand the algorithm of the new system. In addition, the survey questions have been developed for easy understanding and to obtain straightforward responses.
The survey questionnaire was distributed to the employees at Suwon Fire Department and Gyeonggi Disaster Department in December 2022. The survey results have been collected from 10 respondents. As seen in Table 10, the survey consists of three topics: overall evaluation, expected effects, and future improvement. Each topic contains multiple questions for a total of 10 items.
The first eight questions in the survey are answered using a 5-point Likert scale (1: strongly disagree, 2: disagree, 3: moderate, 4: agree, and 5: strongly agree). In regards to the “overall assessment” section, all five questions received positive responses from the participants. Notably, the respondents expressed strong agreement in their willingness to utilize the system (Question A5, average score: 4.8). However, they noted the need for improvement in terms of practicality in usage (Question A4, average score: 3.7). In the “expected impact” section, the respondents concurred that the system has been effective in analyzing building and fire information (Question B3, average score: 4.2).
The last two questions sought the respondents' views on the benefits and drawbacks of the system. A total of 50% of respondents cited the system's ability to simultaneously analyze building and fire information as an advantage. When asked about potential drawbacks, 80% of respondents suggested that integration with a mobile application system would enhance the system's functionality.
5. Conclusions and Recommendations
This research aims to develop an effective building fire disaster management process by addressing the shortcomings of the current practice. A hypothetical scenario has been applied to identify the essential information for the building fire, which has been used to establish a fire information database. A 3D/BIM-based fire-response system has been developed as a solution, which employs a method to represent and convey information using a predetermined system framework. The system is intended to assist emergency responders and other participants in swiftly accessing and using the information they require. The effectiveness and usability of the management system have been tested and validated using a case study application and an expert survey. The survey results indicate the system is effective in improving the current management process and is a useful tool in fire disaster management as aforementioned in the previous section.
In conclusion, the study contributes to the digitalization of data structure and provides effective fire rescue management through a visualized information system in a timely manner. The proposed system, however, has several limitations, primarily in its validation process. The future research needs to be expanded as follows.
First, the expert survey should be more extensive by increasing the number of participants. An intimate collaboration with the National Fire Agency may be needed to secure a sufficient number of respondents. An effort to publicize the research outcome to the fire rescuers can increase interest in active participation.
Second, a more realistic fire scenario-based simulation needs to be included in order to increase the reliability of the system. This study has obtained the sensor data by setting the occurrence of fire accidents at a particular location in a building site. As such, more scenarios should be incorporated to validate real situations of the system by assuming a diverse range of fire disaster situations. The simulation process should also consider different building types and ignition locations. In the application of simulation scenarios, the precision rate of the data flow can also be obtained by the system users.
Third, the system's limitations include being developed for desktop use only, which makes it difficult for rescuers to use while in motion. As such, future research should consider a mobile version to increase the accessibility of the system, which would allow for more efficient decision-making in the event of a building fire. More efforts are needed to reduce the burden of the software and ensure that it runs well on mobile devices.
Finally, further research is also required to improve the usability of the system and to incorporate it with the existing fire disaster information during the whole building lifecycle. This requires efforts to be integrated with the current disaster management and to interoperate in the existing information process. This study is expected to be more useful when it is developed not only for specific situations such as fire accidents but also in hybrid disaster situations during the whole building lifecycle.
Author Contributions
Conceptualization, H.-s.C. and S.J.; methodology, D.K. and H.-s.C.; software, D.K.; validation, D.K. and H.-s.C.; formal analysis, H.-s.C.; investigation, D.K.; resources, D.K.; data curation, D.K.; writing—original draft preparation, D.K.; writing—review and editing, H.-s.C. and S.J.; visualization, D.K. and H.-s.C.; supervision, H.-s.C.; project administration, H.-s.C.; funding acquisition, H.-s.C. All authors have read and agreed to the published version of the manuscript.
Funding
This research was supported by the Korea Agency for Infrastructure Technology Advancement (KAIA) funded by the Ministry of Land, Infrastructure and Transport (Grant No. 22ORPS-B158109-03) and the National Research Foundation (NRF) funded by the Misistry of Education (Grant No. S2020-A0403-00178).
Institutional Review Board Statement
Not applicable.
Informed Consent Statement
Not applicable.
Data Availability Statement
Not applicable.
Conflicts of Interest
The authors declare no conflict of interest.
References
- National Fire Agency. National Fire Agency Statistical Year Book; Korea National Emergency Management Agency: Seoul, Republic of Korea, 2021. [Google Scholar]
- Kobes, M.; Groenewegen, K. Consumer Fire Safety: European Statistics and Potential; Netherlands Institute for Safety: Arnhem, The Netherlands, 2009. [Google Scholar]
- Jung, S.H.; Cha, H.S.; Jiang, S. Developing a Building Fire Information Management System Based on 3D Object Visualization. Appl. Sci. 2020, 10, 772. [Google Scholar] [CrossRef] [Green Version]
- Wong, A.K.; Fong, N.K. Experimental study of video fire detection and its applications. Procedia Eng. 2014, 71, 316–327. [Google Scholar] [CrossRef] [Green Version]
- Cheng, M.Y.; Chiu, K.C.; Hsieh, Y.M.; Yang, I.T.; Chou, J.S.; Wu, Y.W. BIM integrated smart monitoring technique for building fire prevention and disaster relief. Autom. Constr. 2017, 84, 14–30. [Google Scholar] [CrossRef]
- Xin, J.; Huang, C. Fire risk analysis of residential buildings based on scenario clusters and its application in fire risk management. Fire Saf. J. 2013, 62, 72–78. [Google Scholar] [CrossRef]
- Hwang, Y.J.; Koo, W.Y.; Hwang, Y.K.; Youn, H.J. A development of fire evacuation simulation system based 3D modeling. Fire Sci. Eng. 2011, 25, 156–167. [Google Scholar]
- Zhang, L.; Wang, Y.; Shi, H.; Zhang, L. Modeling and analyzing 3D complex building interiors for effective evacuation simulations. Fire Safety J. 2012, 53, 1–12. [Google Scholar] [CrossRef]
- Ma, G.; Wu, Z. BIM-based building fire emergency management: Combining building users' behavior decisions. Autom. Constr. 2020, 109, 102975. [Google Scholar] [CrossRef]
- Weidinger, J. What is known and what remains unexplored: A review of the firefighter information technologies literature. Int. J. Disaster Risk Reduct. 2022, 78, 103115. [Google Scholar] [CrossRef]
- Brushlinsky, N.N.; Ahrens, M.; Sokolov, S.V.; Wagner, P. World Fire Statistics; International Association of Fire and Rescue Services: Paris, France, 2017. [Google Scholar]
- Weidinger, J.; Schlauderer, S.; Overhage, S. Is the frontier shifting into the right direction? A qualitative analysis of acceptance factors for novel firefighter information technologies. Inf. Syst. Front. 2018, 20, 669–692. [Google Scholar] [CrossRef]
- Kim, J.E.; Hong, C.H. A study on the application service of 3D BIM-based disaster integrated information system management for effective disaster response. J. Korea Acad.-Ind. 2018, 19, 143–150. [Google Scholar]
- Zhao, G. Taiwan super high-rise building fire disaster prevention. In China Fire Association Scientific Technology Annual Meeting & Guangdong High-rise Building Fire Safety Management Summit; Chinese Association of Fire Protection: Beijing, China, 2012. [Google Scholar]
- Matthews, S.; Sullivan, A.; Gould, J.; Hurley, R.; Ellis, P.; Larmour, J. Field evaluation of two image-based wildland fire detection systems. Fire Saf. J. 2012, 47, 54–61. [Google Scholar] [CrossRef]
- Framework Act on Firefighting Services in Korea. Available online: https://law.go.kr/LSW/lsInfoP.do?lsiSeq=181832&viewCls=engLsInfoR&urlMode=engLsInfoR#0000 (accessed on 24 January 2023).
- National Fire Codes. Available online: https://www.kfpa.or.kr/eng/publications/nfc3.php (accessed on 24 January 2023).
- Dilo, A.; Zlatanova, S. A data model for operational and situational information in emergency response. Appl. Geomat. 2011, 3, 207–218. [Google Scholar] [CrossRef] [Green Version]
- Mahbub, M.; Hossain, M.M.; Gazi, M.S.A. Cloud-Enabled IoT-based embedded system and software for intelligent indoor lighting, ventilation, early stage fire detection and prevention. Comput. Netw. 2021, 184, 107673. [Google Scholar] [CrossRef]
- Luo, Y.; Zhao, L.; Liu, P.; Huang, D. Fire smoke detection algorithm based on motion characteristic and convolutional neural networks. Multimed. Tools Appl. 2018, 77, 15075–15092. [Google Scholar] [CrossRef]
- Wang, S.H.; Wang, W.C.; Wang, K.C.; Shih, S.Y. Applying building information modeling to support fire safety management. Autom. Constr. 2015, 59, 158–167. [Google Scholar] [CrossRef]
- Li, N.; Yang, Z.; Ghahramani, A.; Becerik-Gerber, B.; Soibelman, L. Situational awareness for supporting building fire emergency response: Information needs, information sources, and implementation requirements. Fire Saf. J. 2014, 63, 17–28. [Google Scholar] [CrossRef]
- Nunavath, V.; Prinz, A.; Comes, T. Identifying first responders information needs: Supporting search and rescue operations for fire emergency response. Int. J. Inf. Syst. Crisis Response Manag. (IJISCRAM) 2016, 8, 25–46. [Google Scholar] [CrossRef] [Green Version]
- Seppänen, H.; Virrantaus, K. Shared situational awareness and information quality in disaster management. Saf. Sci. 2015, 77, 112–122. [Google Scholar] [CrossRef]
- Choi, J.; Choi, J.; Kim, I. Development of BIM-based evacuation regulation checking system for high-rise and complex buildings. Autom. Constr. 2014, 46, 38–49. [Google Scholar] [CrossRef]
- Chun, W.Y.; Lee, J.H.; Kim, H.J. Development of Training Scenario Content for On-Site Commanders through Analysis of Response Failure Factors. Fire Sci. Eng. 2021, 35, 111–117. [Google Scholar] [CrossRef]
- Lee, J.H. Study on the Improvement of Inspection-Related Regulation of Fire Protection Systems and Equipment-Focused on the Fire Administration Process. Fire Sci. Eng. 2019, 33, 188–193. [Google Scholar] [CrossRef]
- Shields, T.J.; Boyce, K.E. A study of evacuation from large retail stores. Fire Saf. J. 2000, 35, 25–49. [Google Scholar] [CrossRef]
- Cao, S.; Song, W.; Lv, W. Modeling pedestrian evacuation with guiders based on a multi-grid model. Phys. Lett. A 2016, 380, 540–547. [Google Scholar] [CrossRef]
- Wetzel, E.M.; Thabet, W.Y. The use of a BIM-based framework to support safe facility management processes. Autom. Constr. 2015, 60, 12–24. [Google Scholar] [CrossRef] [Green Version]
- Kim, D.H.; Shin, H.J.; Cha, H.S. A Method to Establish a Fire Information Visualization Structure for 3D/BIM-linked Fire Response System Development. J. Archit. Inst. Korea 2022, 38, 253–263. [Google Scholar]
- Ronchi, E.; Nilsson, D. Fire evacuation in high-rise buildings: A review of human behaviour and modelling research. Fire Sci. Rev. 2013, 2, 7. [Google Scholar] [CrossRef] [Green Version]
- Shiau, Y.C.; Tsai, Y.Y.; Hsiao, J.Y.; Chang, C.T. Development of building fire control and management system in BIM environment. Stud. Inform. Control 2013, 22, 15–24. [Google Scholar] [CrossRef]
- Sun, Q.; Turkan, Y. A BIM-based simulation framework for fire safety management and investigation of the critical factors affecting human evacuation performance. Adv. Eng. Inform. 2020, 44, 101093. [Google Scholar] [CrossRef]
- Ham, E.G.; Jeong, K.S.; Kim, W.H.; Kim, K.R.; Kim, J.H.; Joung, W.I. Analysis of Firefighting Response Problems and a Study on Response Strategies; Korean Institute of Fire Science & Engineering: Seoul, Republic of Korea, 2018. [Google Scholar]
- Um, H.; Lee, N.; Cho, H. Development of fire notice system with IoT for initial fire response. In Proceedings of the KIIT Conference, Seoul, Republic of Korea, 27–28 February 2018; pp. 111–113. [Google Scholar]
- Seo, J.; Kim, J.; Choi, J. Research on the design of course prediction system in response to the harmful smoke of high buildings fire in USN environment. Soc. Converg. Knowl. Trans. 2013, 1, 9–15. [Google Scholar]
- Patacas, J.; Dawood, N.; Kassem, M. BIM for facilities management: A framework and a common data environment using open standards. Autom. Constr. 2020, 120, 103366. [Google Scholar] [CrossRef]
- Lee, B.H.; Jin, S.H.; Kim, D.E.; Kwon, Y.J. A study on the interworking method of BIM technology and fire simulation. J. Korean Soc. Hazard Mitig. 2020, 20, 67–73. [Google Scholar] [CrossRef]
- Wang, B.; Li, H.; Rezgui, Y.; Bradley, A.; Ong, H.N. BIM based virtual environment for fire emergency evacuation. Sci. World J. 2014, 2014, 589016. [Google Scholar] [CrossRef] [PubMed]
- Eftekharirad, R. Improving Fire Emergency Mana gement Using Occupant Information and BIM-Based Simulation. Ph.D. Thesis, Concordia University, Montréal, QC, Canada, 2019. [Google Scholar]
- Oh, E.H.; Lee, S.; Shin, E.Y.; Kang, T.K.; Lee, Y.S. A framework of realtime infrastructure disaster management system based on the integration of the building information model and the sensor information model. J. Korean Soc. Hazard Mitig. 2012, 12, 7–14. [Google Scholar] [CrossRef] [Green Version]
- Chen, X.S.; Liu, C.C.; Wu, I.C. A BIM-based visualization and warning system for fire rescue. Adv. Eng. Inform. 2018, 37, 42–53. [Google Scholar] [CrossRef]
Figure 1.
Research Methodology.

Figure 2.
Hypothetical Fire Scenario.

Figure 3.
Overview of 3D/BIM-based System Architecture.

Figure 4.
Information Representation Strategy via 3D/BIM Integration Model.

Figure 5.
Dynamo™ Coding for a Case Study ((left): Dynamo™ Code, (right): Revit Model).

Figure 6.
SFRM panel menu bar.

Figure 7.
Case study project.

Figure 8.
GUI of the SFRM System.

Figure 9.
Screenshot of “3D view of the Building” ((left): Exterior View, (right): iIterior View).

Figure 10.
Screenshot of “Building information” ((left): 3D view, (right): pop-up view).

Figure 11.
Screenshots of Raw Fire Information (note: “s” denotes “second”).

Figure 12.
Screenshots of Interpreted Information (note: “s” denotes “second”).


Table 1.
Example of building information dataset (partial).
| Facility Manager | Rescuer | Evacuee |
|---|---|---|
| Emergency report status | Material | Building structure |
| Building structure | Dry area | Location of lightweight wall |
| Type of stairs | Floor area | Location of windows |
| Location of fire door and shutter | Location of roof | Location of stairs |
| Location of emergency exit | Location of outdoor stair | Evacuation zone |
| Expiration date of fire equipment | Capacity | Location of emergency exit |
| Location of fire extinguisher | Status of fire facility | Location of fire extinguisher |
| Installation status of sprinkler | Ceiling height | Location of roof |
| Facility features | Numbers of entrances | Location of fire door |
| Location of stairs | Evacuation zone | Designated evacuation path |
Table 2.
Categorization of static information.
| Project | Building | Firefighting | Evacuation |
|---|---|---|---|
| Oil reservoir | Building structure | Fire extinguisher | Elevator |
| Explosive dangerous goods | Material | Expiration date of fire equipment | Evacuation facilities |
| Fire protection section | Sprinkler | Emergency exit | |
| Special combustibles | Ceiling height | Guiding light | Guiding light |
| Floor area | Health line | Evacuation zone | |
| Usage by floor | Fire hydrant | Stairs |
Table 3.
Extraction of fire information (partial).
| Item |
|---|
| Visibility |
| The amount of smoke |
| Smoke color |
| Types of combustibles |
| Combustion direction |
| Combustion gas |
| Carbon dioxide |
| Carbon monoxide |
| Flame color |
| Flame path |
| Halogen |
| Oxygen supply |
| The size of the flame |
| Temperature |
| Number of workers |
| The inflow of air |
| Condensation effect |
| The intensity of the fire |
| Number of residents |
| Smoke type |
| Collapse |
| Falling objects |
| Ignition point |
| Location of the residents |
Table 4.
Categorization of real-time fire information.
| Category | Sub-Category | Item |
|---|---|---|
| Human Body influence | Flame | Strength of the fire |
| Flame color | ||
| Combustion direction | ||
| Ignition point | ||
| Temperature | ||
| Harmful substance | Carbon monoxide | |
| Carbon dioxide | ||
| Oxygen supply | ||
| Toxic gas | ||
| Internal situation of the building | Firefighting equipment | |
| Entrance/exit door | ||
| Atmospheric concentration | ||
| Smoke concentration | ||
| Spread of smoke | ||
| Color of smoke | ||
| Motion influence | Barrier to entry | Collapse |
| Falling objects | ||
| Resident | Number of residents | |
| Location of the residents |
Table 5.
The risk level of CO congestion.
| CO (ppm) | The Time Limit for Survival |
|---|---|
| 800 | (Fainting) Within 2 h |
| 1600 | (Death) Within 2 h |
| 3200 | (Death) Within 30 min |
| 6400 | (Death) Within 15 min |
| 12800 | (Death) Within 3 min |
Table 6.
The risk level of temperature.
| Temperature (°C) | The Time Limit for Survival |
|---|---|
| 52 | - |
| 65 | (Death) Within 1 h |
| 100 | (Death) Within 25 min |
| 120 | (Death) Within 15 min |
| 143 | (Death) Within 5 min |
Table 7.
The risk level of smoke congestion.
| Visual Distance (m) | Physical Impact |
|---|---|
| 20–30 | Difficulty in evacuating the building |
| 5 | Extreme difficulty in evacuating the building |
| 3 | Darkness |
| 1–2 | Limited visibility |
| 0.2–0.5 | A guiding light cannot be identified |
Table 8.
Composition of survival zones.
| Survival Level | Accessibility | Color-Code |
|---|---|---|
| S_A | Inaccessible | red |
| S_B | Dangerous | crimson |
| S_C | Cautious | orange |
| S_D | Accessible | yellow |
Table 9.
Composition of movable zones.
| Movability Level | Accessibility | Color-Code |
|---|---|---|
| M_A | Inaccessible | black |
| M_B | Dangerous | charcoal |
| M_C | Cautious | grey |
| M_D | Accessible | white |
Table 10.
Expert Survey Questionnaire and results.
| Category | Questions | Average Score |
|---|---|---|
| A. Overall Assessment | A1. Are you satisfied with the system in general? | 4.3 |
| A2. Is the system more useful than the current fire-response system? | 4.2 | |
| A3. Is the system beneficial when it goes through future development? | 4 | |
| A4. Is the system designed to be used in current practice? | 3.7 | |
| A5. Are you willing to use the system? | 4.8 | |
| B. Expected Impact | B1. Does the system improve the analysis of building and fire information? | 4.8 |
| B2. Does the system improve the efficiency of your work in practice? | 4 | |
| B3. Does the system facilitate sound decision-making in an emergent situation? | 4.2 | |
| C. Future Improvement | C1. Which aspect of the SFRM do you like? | n.a |
| C2. Which aspect do you think is needed to be improved? | n.a |
Disclaimer/Publisher’s Note: The statements, opinions and data contained in all publications are solely those of the individual author(s) and contributor(s) and not of MDPI and/or the editor(s). MDPI and/or the editor(s) disclaim responsibility for any injury to people or property resulting from any ideas, methods, instructions or products referred to in the content. |
© 2023 by the authors. Licensee MDPI, Basel, Switzerland. This article is an open access article distributed under the terms and conditions of the Creative Commons Attribution (CC BY) license (https://creativecommons.org/licenses/by/4.0/).
Share and Cite
MDPI and ACS Style
Kim, D.; Cha, H.-s.; Jiang, S. The Prediction of Fire Disaster Using BIM-Based Visualization for Expediting the Management Process. Sustainability 2023, 15, 3719. https://doi.org/10.3390/su15043719
AMA Style
Kim D, Cha H-s, Jiang S. The Prediction of Fire Disaster Using BIM-Based Visualization for Expediting the Management Process. Sustainability. 2023; 15(4):3719. https://doi.org/10.3390/su15043719
Chicago/Turabian StyleKim, Dahee, Hee-sung Cha, and Shaohua Jiang. 2023. "The Prediction of Fire Disaster Using BIM-Based Visualization for Expediting the Management Process" Sustainability 15, no. 4: 3719. https://doi.org/10.3390/su15043719
Note that from the first issue of 2016, this journal uses article numbers instead of page numbers. See further details here.