
Climate Comfort Due to Spatial Organization: A Major Factor of Urban Resilience in Complex Gentrification Nodes in New Urban Communities

1
Department of Architecture, UFE-Université Française d’Egypte, Misr Ismmailya Desert Road, Cairo 11837, Egypt
2
Faculty of Engineering, Ain Shams University, Cairo 11517, Egypt
*
Author to whom correspondence should be addressed.
Sustainability 2023, 15(4), 3563; https://doi.org/10.3390/su15043563
Submission received: 27 December 2022
/
Revised: 27 January 2023
/
Accepted: 30 January 2023
/
Published: 15 February 2023
(This article belongs to the Special Issue Urban Social Space and Sustainable Development)
Abstract
:Gentrification nodes act as city centers in new urban communities where people can work, meet, eat, and exchange. The spatial organization of these nodes, considered complex adaptive systems, is a crucial factor in achieving climate comfort. This paper aims to demonstrate how the spatial organization of these nodes affects their microclimate comfort and can accordingly lead to their spatial resilience. Four predominant gentrification nodes, located in New Cairo and Sheikh Zayed, were selected, playing an essential role in the Egyptian real estate market and affecting urban dynamics in both areas. We argue that their spatial organization and how it affects climate comfort play a crucial role in their urban resilience. We believe that the climate comfort they offer will help them keep attracting the same socioeconomic categories of the population despite the changes in the real estate market and the displacement of urban anchors. Moreover, the findings highlighted that climate comfort, as a component of urban resilience, can be used to acknowledge the behavior of these nodes in the urban fabric. These findings were supported by simulations, interviews with the owners, the architect, and the users’ “closed-ended” questionnaire. The results show that the spatial resilience of two of these nodes is effectively related to climate comfort and the spatial organization that corresponds to users’ needs. Moreover, the results underline that in the case of linear nodes, building massing and materials with high albedo should be considered, as in the multiaxial nodes, the aspect of ratio dimensions and orientation of the space should be well studied.
1. Introduction
1.1. Development of New Urban Communities
New urban satellite communities in Egypt have been the optimum solution to overcome the problem of rapid urbanization that invaded the Egyptian capital since the sixties and later the mid-nineties [1]. Originally, the idea of these communities came up as an all-inclusive urbanization concept. They were supposed to host all social classes of the population to evacuate the Egyptian capital and find a solution for population overgrowth [2]. Nevertheless, their development is entirely divergent from their original concept [3]. Some of these satellite communities were “gentrified” before their urbanization through the implantation of what we call “complex gentrification nodes”. “Pre-urban gentrification” is a new term, introduced in 2016 to describe an urban process through the redefinition of the “gentrification” process. It consists of adding value to the property in the master planning phase before the urbanization of new urban communities/settlements, especially in areas that were planned to host low-income and middle-class households. The added value is due to the introduction of “gentrification nodes”, or anchors, into the urban fabric, which will considerably increase specific neighborhoods’ property value before urbanization. This process took place in other new urban communities outside of Egypt, such as the case of “Le Grand Paris” in France [4].
The urban “gentrification nodes” are usually complex mega projects or anchors that would completely shift the behavior of the real estate market of these new satellite communities. The spatial organization and urban design concept of complex “gentrification nodes” affect their behavior in the urban context and whether they will continue to attract the same socioeconomic categories of the population. The objective of this paper is to demonstrate that the urban resilience of “gentrification nodes” is related to their climate comfort. We contend that spatial organization generates this resilience as it is undermined by spatial, social, climate comfort, and physical and environmental factors [5]. A research methodology that consists of case studies, users’ questionnaires, and simulation for the chosen cases was applied [1].
1.2. Urban Resilience: Spatial/Social Resilience Perspective
As the concept of resilience is still unclear, especially in urban and social sciences [5], urban and social researchers are stressing its importance in science and practice as well as its strong connection to sustainability [6]. In the context of our research, resilience refers to a gentrification node’s ability to keep its clientele’s socioeconomic class affecting its spatial identity and form. The relation between social, spatial, and urban resilience here is undeniable. More explicitly, the metamorphosis of social morphology generates a transformation of urban morphology [4]. So, sustainability is an actor of social resilience and vice versa, which is about the ability of a particular community to resist the rupture in its socioeconomic morphology. Therefore, maintaining a gentrification node’s social/spatial and urban character despite changes in the uses that this node host is the goal of spatial/social resilience. Moreover, the more resilient the gentrification node is, the more it will keep the socioeconomic morphology of its customers and thus its spatial morphology.
Originally, “resilience” was defined in Merriam Webster as “the capability of a strained body to recover its size and shape after deformation caused especially by compressive stress” and as “an ability to recover from or adjust easily to misfortune or change” [7]. In the Cambridge dictionary, “resilience” is “the ability to be happy and successful again after something difficult or bad has happened” [8]. In 2002, “social resilience” term appeared with various definitions, especially regarding communities. Sometimes, it is related to ecological resilience, especially when a social group is dependent on environmental and ecological resources [9]. Conversely, in other cases, the term was more related to social behavior. More explicitly, resilience was associated with the socioeconomic status of the population in their communities. It was linked to the domination of a particular social group or a specific class of clientele and the exclusion or marginalization of others [4].
Urban systems, however, will be considered resilient if they are robust and can adapt their uses or transform themselves to be able to subsist as capable functioning systems after disturbances or instabilities [5]. Adaption does not necessarily mean spatial or social transformation. It is about how the urban system will recognize and reorganize itself in the face of disruption while keeping its identity. The social/spatial resilience of gentrification nodes as complex urban systems plays a vital role in the sustainability of new urban communities, thus their resilience. Users tend to migrate to new places where “it is trendier” to maintain their social validation [10]. This is why new urban anchors constantly suffer from the change of their spatial identities that follows a change of the social morphology of their users [1].
1.3. Microclimate and Human Comfort
One of the most critical aspects of resilience to consider within the “gentrification nodes” is managing climate-related risks and adapting to those risks, to be specific, considering the human heat stress. Welfare and social well-being are essential for climate resilience [11] and fulfilling the “sustainable development goals” (SDGs) developed by the United Nations [12]. Open spaces and outdoor activities promote better living standards and increase the context’s land value. Thus, it is essential to consider the outdoor microclimate design and its impact on indoor well-being [11]. Historically, cities’ outdoor spaces were well-known for their well-being and moderate temperature ranges. A large percentage of green areas, well-designed plazas, houses with courtyards, and good-ventilated urban streets existed, with passive cooling design strategies to promote better microclimates for indoor and outdoor activities [13].
Designing spaces mounts a challenge [14] due to the complexity of the microclimate [15] of outdoor spaces. Environmental and artificial parameters shape microclimate and human comfort of a specific context in addition to personal and behavioral parameters [16]. A human’s comfort in outdoor spaces is governed by multiple complex parameters differently than the indoor spaces where the environment is controlled [17]. Humans experience interaction with the surrounding’s parameters, including:
- ▪
- The context parameters where buildings vary in their geometry, clusters, spacing, height, orientation, and surface roughness [18];
- ▪
- Radiative temperature, the albedo of the materials, and heat exerted [19];
- ▪
- Local context climate parameters: air temperature, humidity, relative air velocity and direction, solar radiation, and local wind character [20];
- ▪
- Different vegetation; water patterns that vary in type, size, shape, arrangement, type, and color [21]; and water elements, if they exist;
- ▪
- Metabolic rate (MET) defines the personal activity of the human sitting, running, and walking [19];
- ▪
- Clothes insulation factor (Clo) [22].
Several thermal comfort indices were developed that reflect the human energy balance and quantify the effects of the surrounding environment on the human thermal comfort in outdoor spaces. These developed indices mainly consider metrological parameters, the surface albedo of the materials of the surrounding environment [23], and human parameters [24]. Various indices were developed, including outdoor PMV, PET, UTCI, and many more [23]. PET and UTCI are widely used because mean radiant temperature (Tmrt) is integrated with the calculation formula [24]. This index is easy to interpret and read through a scaled bar range from extremes of heat to extremes of cold, which is why we will use this index in our study.
1.4. Gentrification Nodes
Urban sprawl in the Cairene capital and socioeconomic changes profoundly touch the city center’s development. In the meantime, to remain resilient, city centers must supply multifunctional spaces for users. They must provide more than the traditional functions they used to offer [6]. The supply should also comprise a reputable location with a distinguished spatial identity, social significance, and climate comfort [25,26]. Consequently, they should contain various uses with high-quality public spaces.
In this context, the gentrification process is thriving as it is no longer confined to the inner city [27]. The gentrification term—as defined by Ruth Glass, the British sociologist, to describe an urban process by which unprivileged social groups “were pushed out of their neighborhoods in London as a consequence of the development of upper-class ghettos”—has developed to explain another phenomenon of real estate speculation, especially in new urban communities initially designed to include all socioeconomic categories [1,3,28]. As a result of this phenomenon, real estate properties increase in value on paper before the urbanization of new urban communities or settlements. It happens by making decisions to change uses and activities in the master plan of a particular new urban community and introducing urban anchors or what we call a “pre-urban gentrification node”.
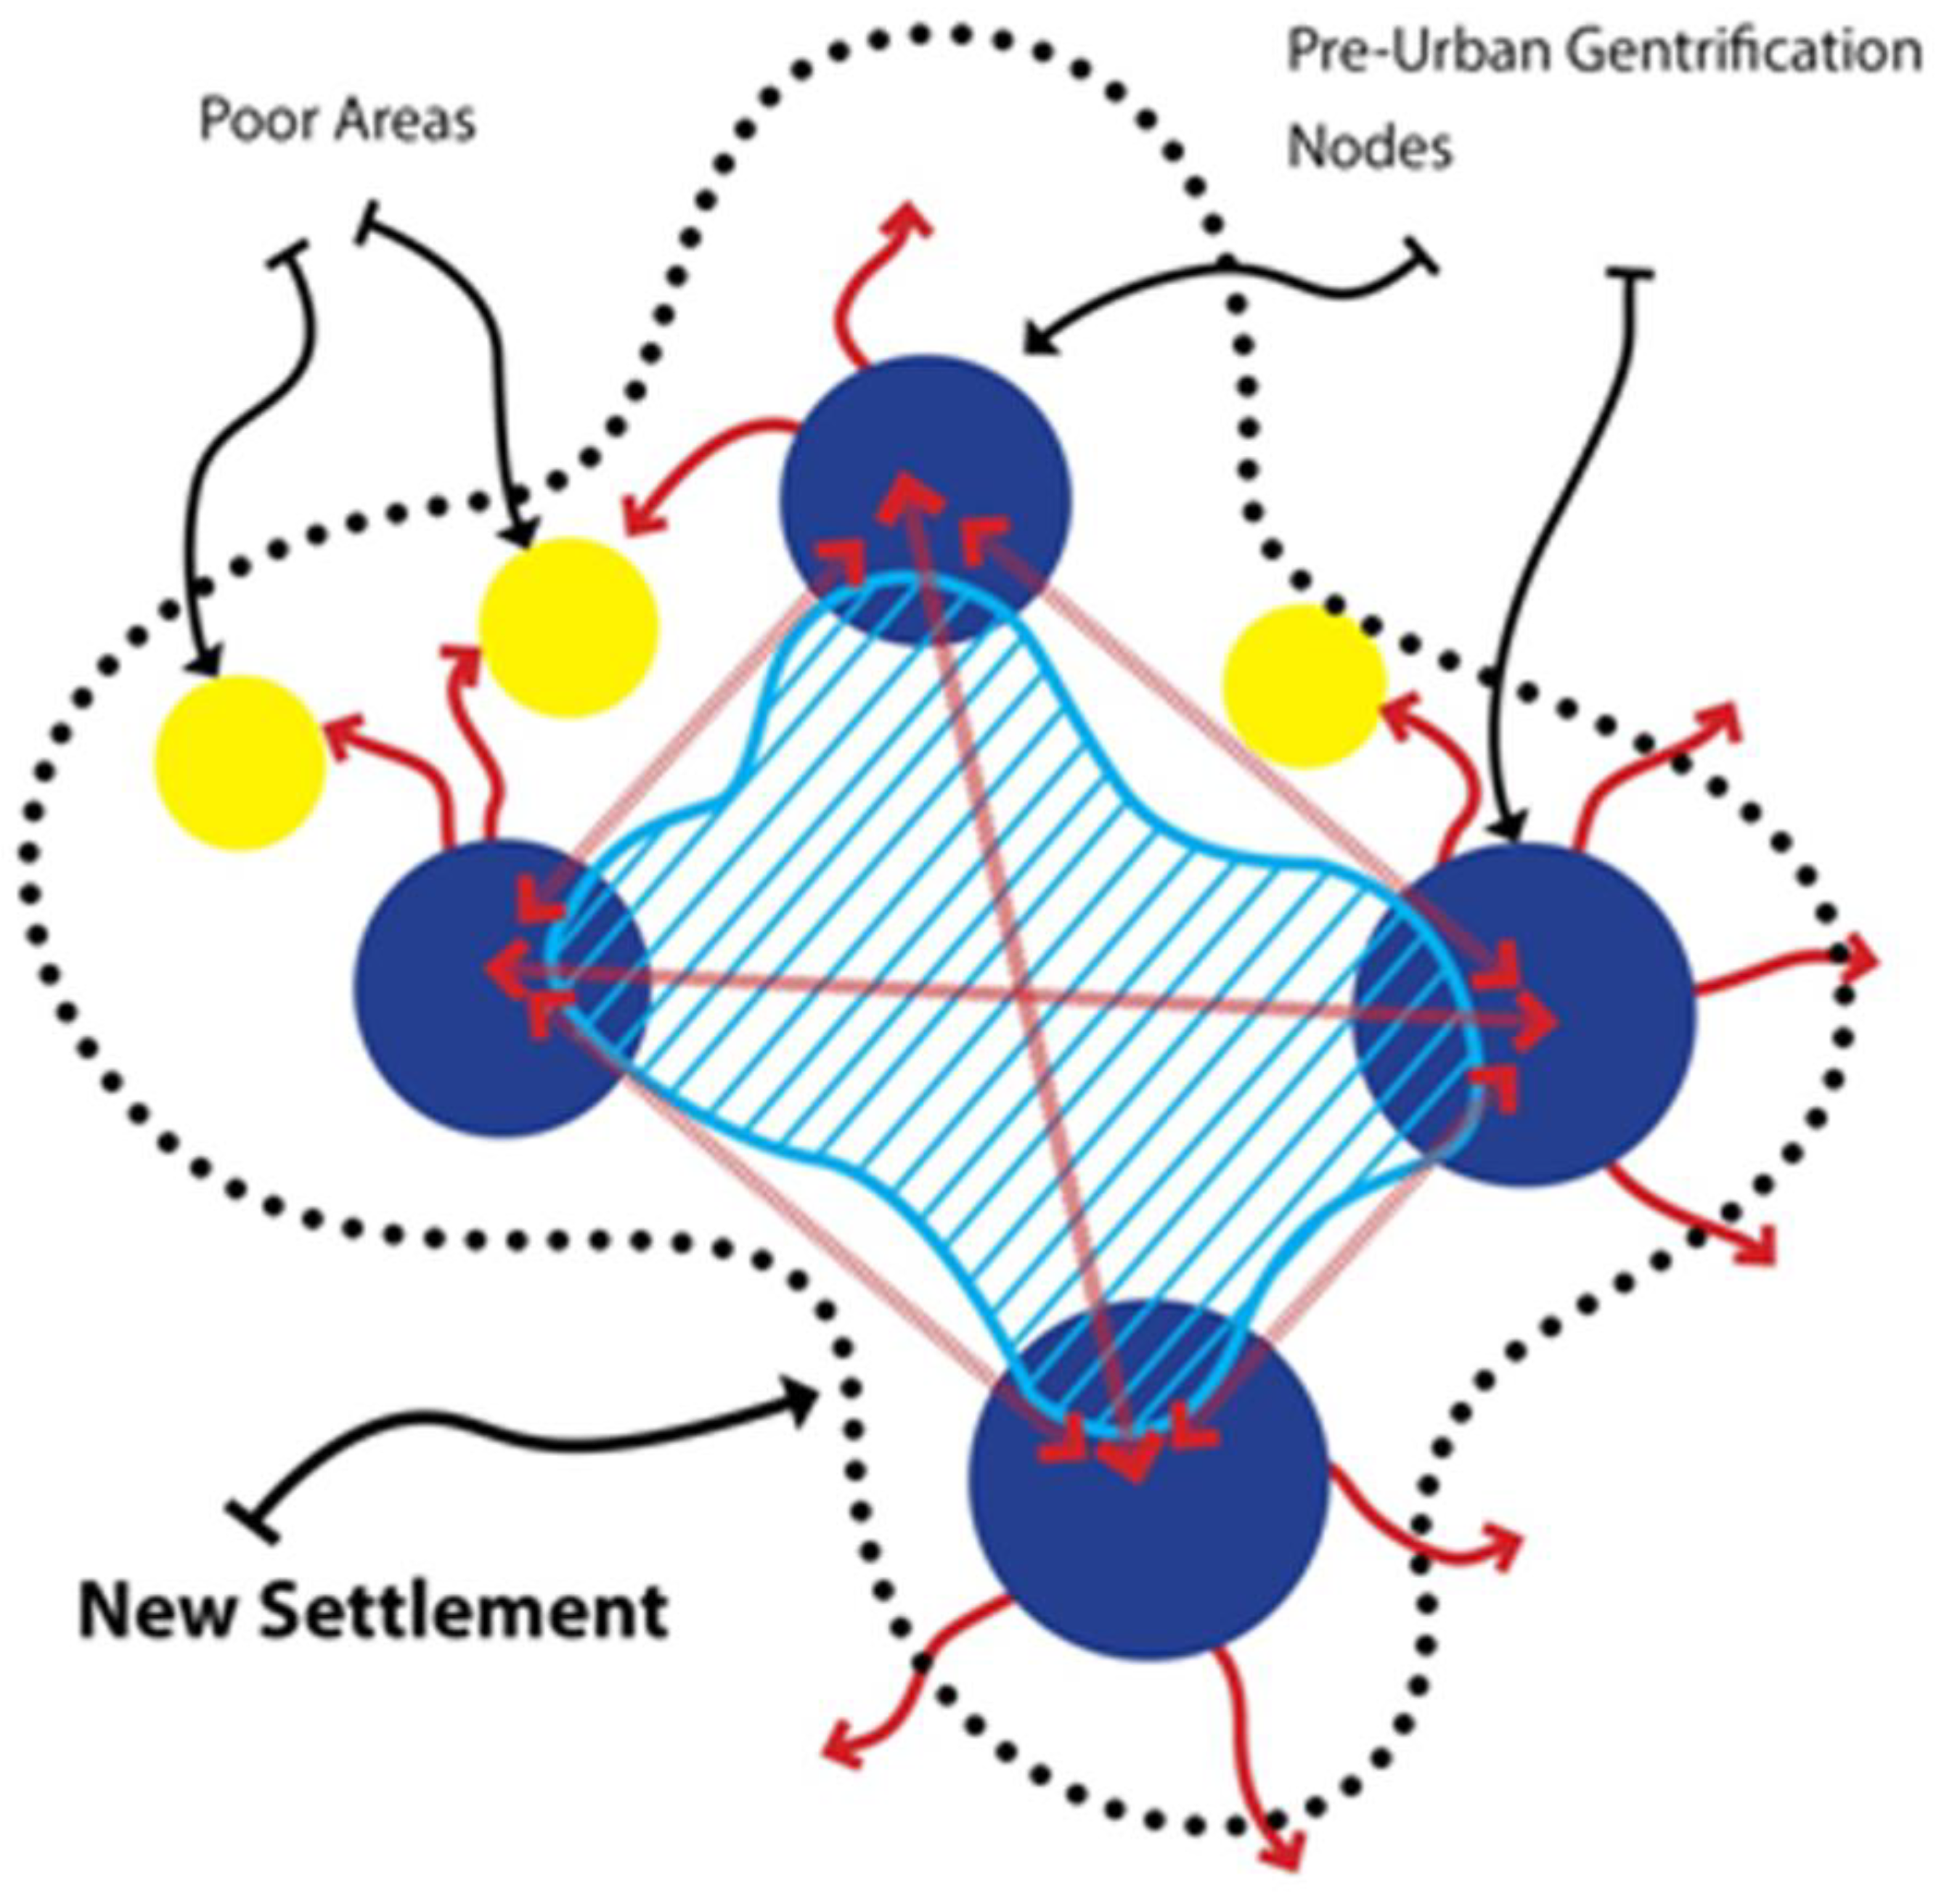
These urban anchors completely change the market dynamics while causing a pre-urban gentrification process that pushes the unprivileged socioeconomic categories toward the peripheries of new urban communities [3], as illustrated in Figure 1. This phenomenon is evident in New Cairo, Zayed City, Six of October City, and the New Administrative Capital in Egypt. These unplanned urban anchors or gentrification nodes are also integrated into new urban communities to increase the market value of different neighborhoods after urbanization. There are different types of these anchors, including high-end educational institutions, luxurious hotels and residential gated communities, retail locations, and business parks. Recently, in Zayed City and New Cairo, gentrification nodes reached other dimensions by introducing luxurious business parks with multiuse service complexes, such as “Arkan Plaza” located in Zayed City, and “WaterWay 1”, “WaterWay White”, and “5A by the WaterWay” located in New Cairo [4].
As a result, urban developers in the private sector started to regroup as many different uses as possible to attract more people to their projects. Gradually, these nodes affected their urban context with different spatial identities and social significance. Some of them act as a city within a city, such as Cairo Festival City in New Cairo. In contrast, others—especially those assimilated to multiuse retail areas—started to act as city centers (e.g., healthcare culture, offerings, education, social services, different types of housing, and logistics). Many of these nodes adopted the “third places” concept, where people who live and work around gather [29]. Moreover, the change in lifestyles and the functioning of new city centers differently, especially during and after COVID-19, make it necessary to reconsider the climate comfort of these outdoor hubs as a substantial factor in the resilience of new urban communities. As these urban anchors became a part of Cairene’s urban life, this paper attempted to study their behavior according to user’s preferences, especially concerning the climate comfort they offer because of their spatial organization.
2. Materials and Methods
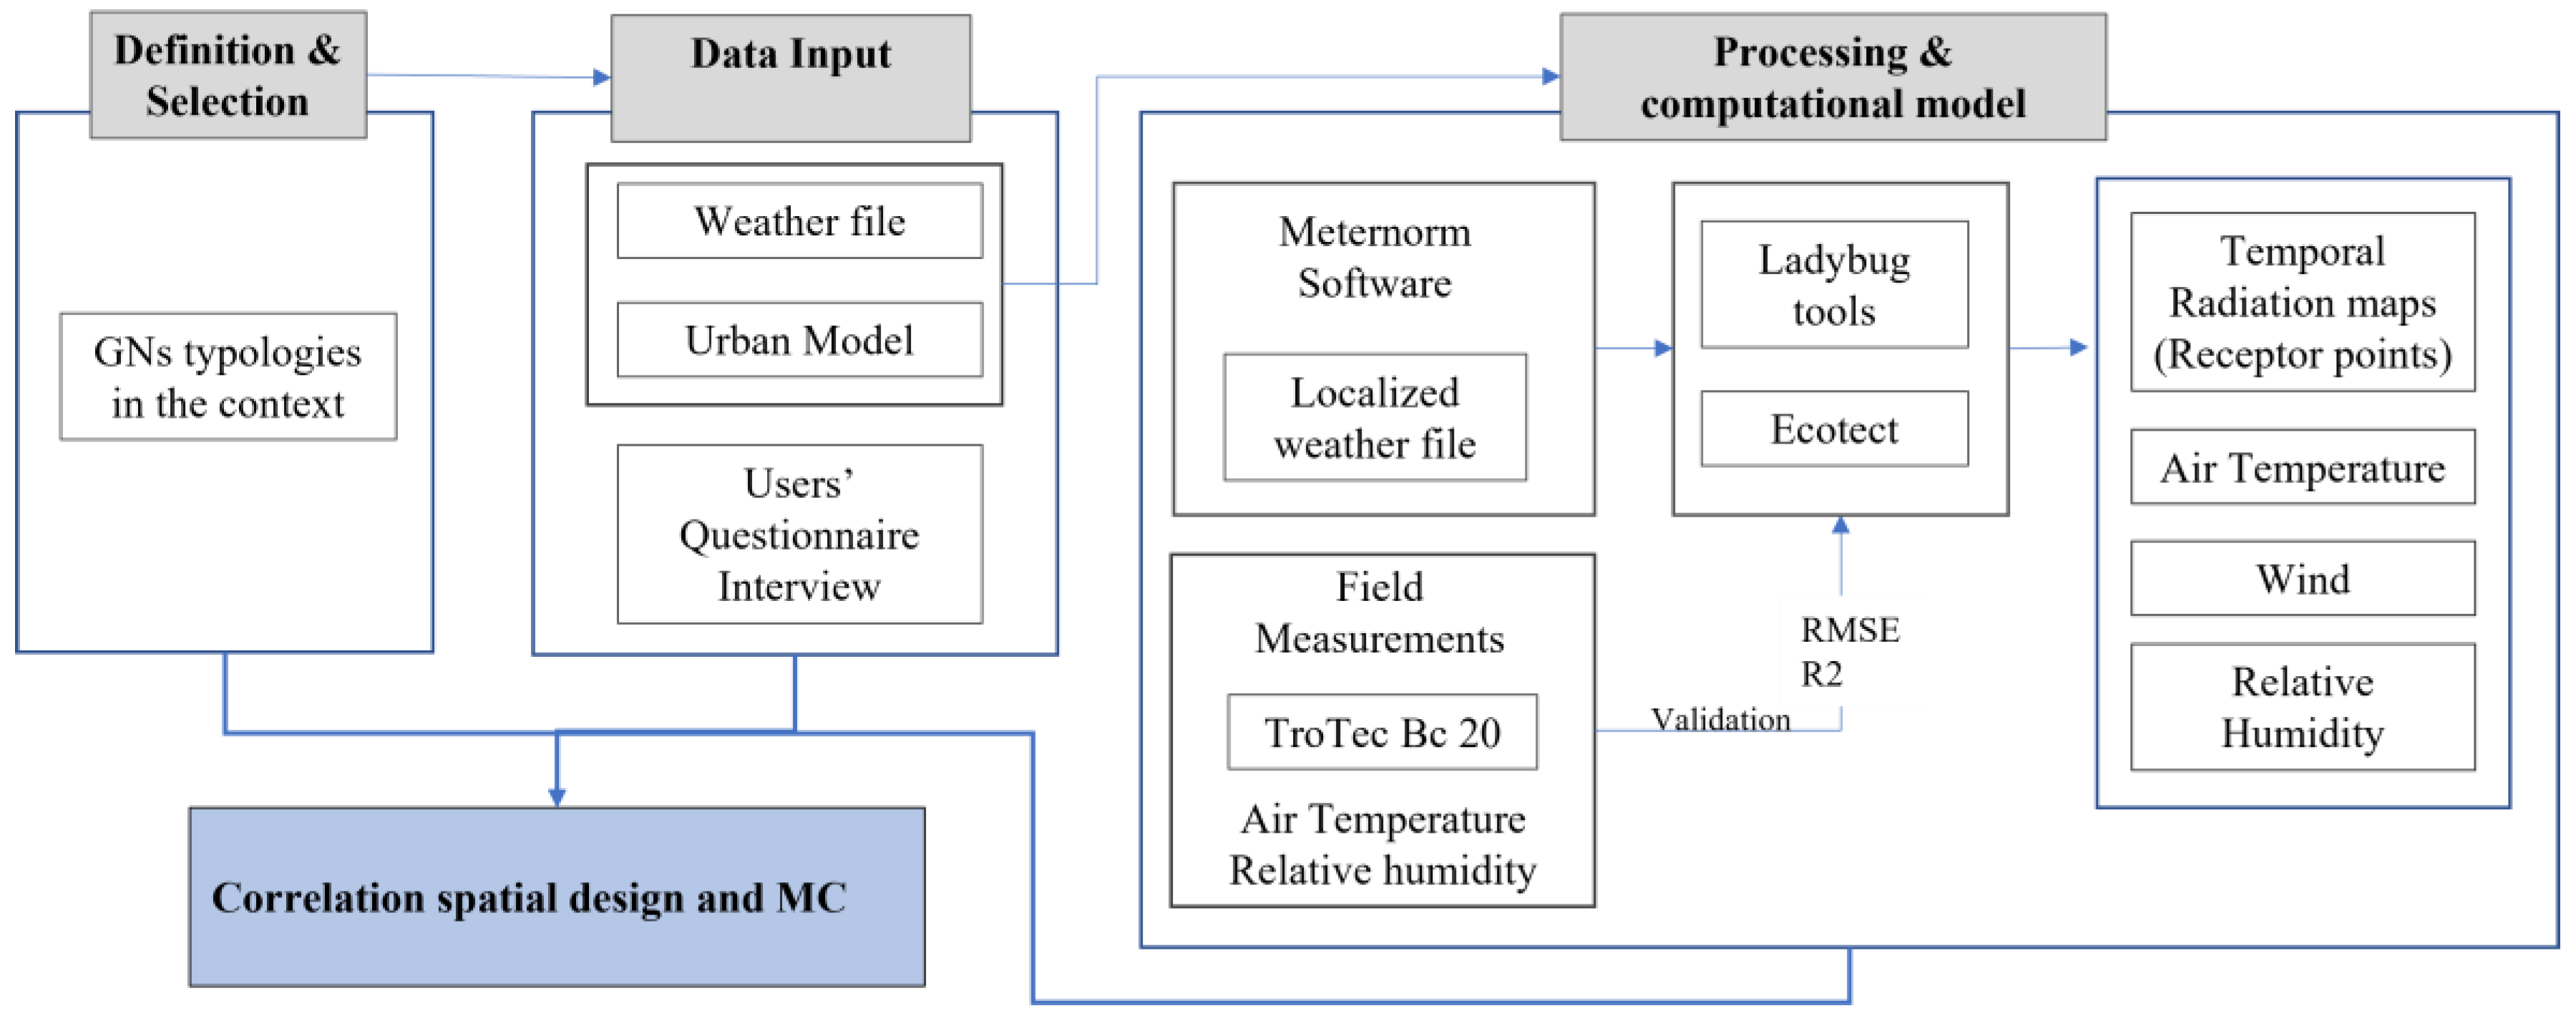
Our methodological approach intended to identify the link between climate comfort and spatial organization concept and its impact on the social/spatial resiliency of “gentrification nodes”. Thus, we developed a multi-layered investigation and analysis within the four studied cases: gentrification node types, closed-ended questionnaire, interviews, and microclimate simulation (Figure 2).
Customers’ segmentation based on behavior and income affects urban developers’ actions and architects’ intentions for investments in the real estate market in new urban communities. According to customers’ segmentation in the real estate and recreational markets in Egypt, there are three categories: A, B, and C; each one contains three subcategories. For example, A is subdivided into A+, A, A−, and so on.
According to the Architect and the two Developers of the chosen gentrification nodes, the targeted customers/users are clustered into two main categories, A and B, with their subcategories A+, A, and A− or B+, B, and B−. The mentioned clustering reflects the socioeconomic status of customers and refers correspondingly to different levels of upper and middle classes, as seen in Table 1.
2.1. Gentrification Node’s Types
In order to have a “gentrification node” where clients will be attracted, urban developers had to add multiuse retail properties to their residential projects. In Cairene new urban settlements, the implantation of “pre-urban gentrification nodes” was usually casually decided before the urbanization of these settlements without respecting the original “master plan”. However, other nodes were implanted in the urban fabric after urbanization to resuscitate certain areas. The gentrification nodes’ type can go from residential projects around golf courses and luxury hotels to business parks with diverse retail types or expensive educational and health institutions.
2.1.1. Case Choice
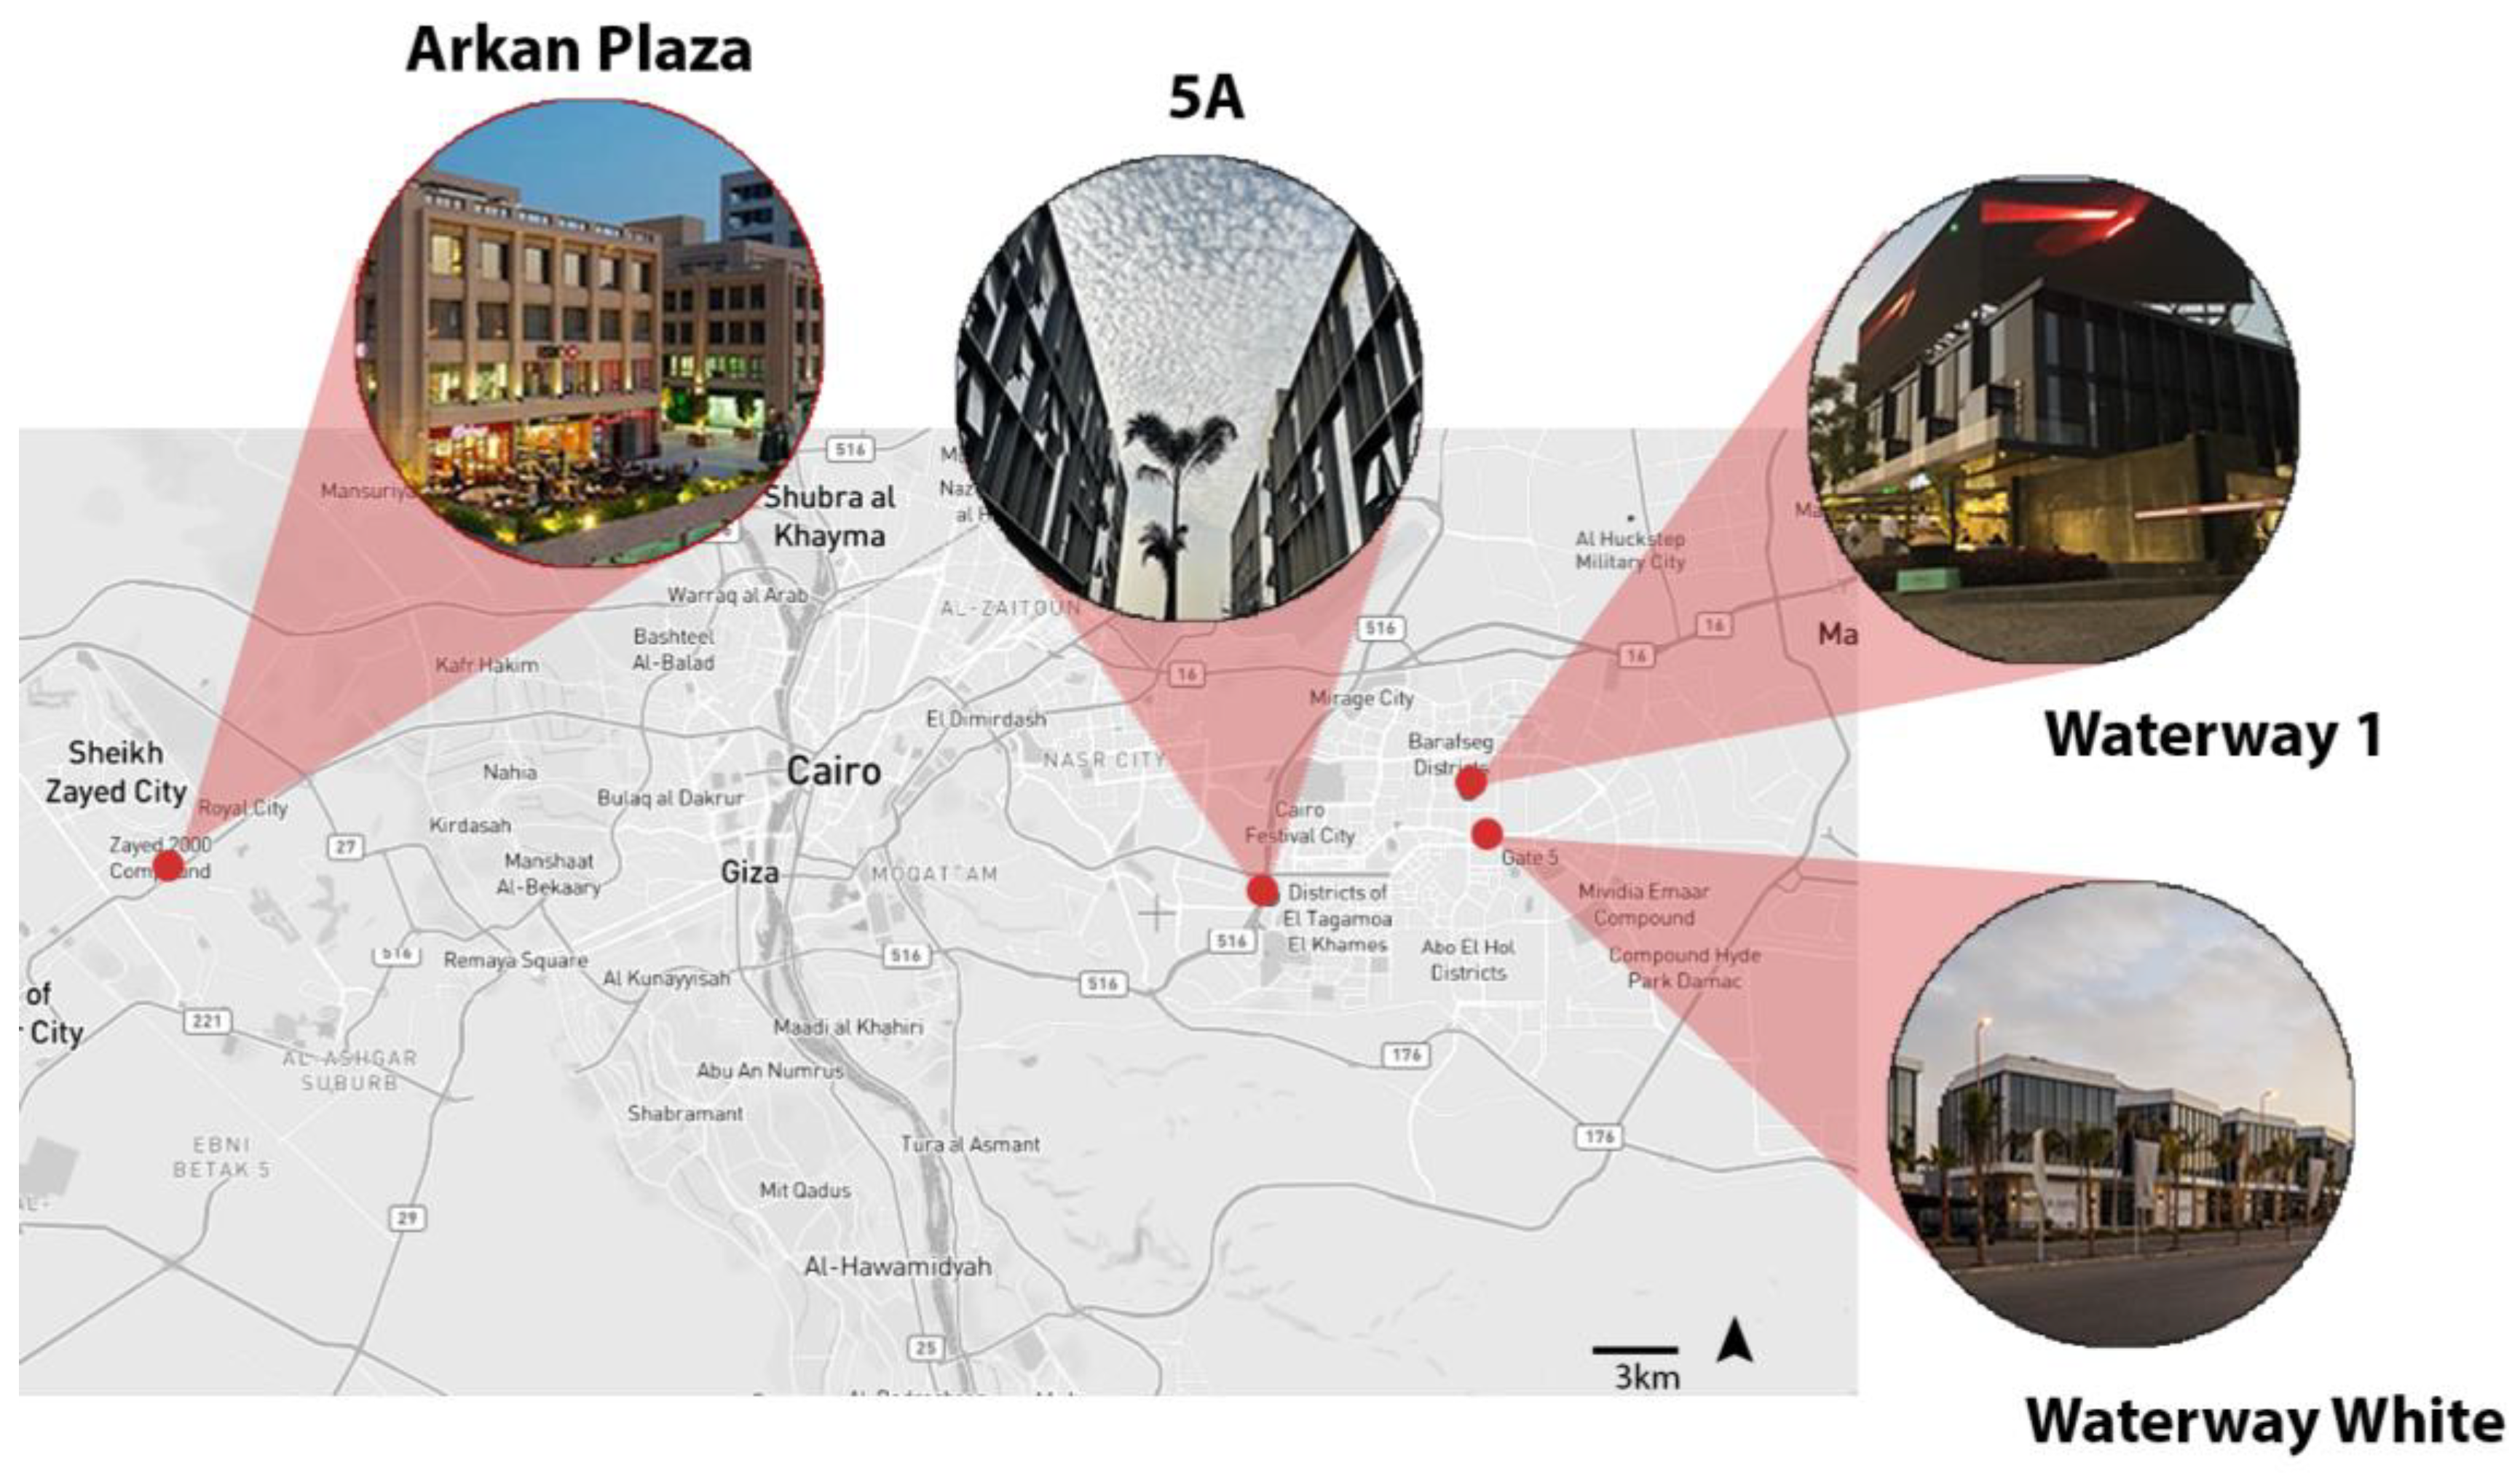
We established an initial criterion to ensure adequate elucidation of our work. It includes the selection of commercial promenades and hubs within new urban communities based on previous studies conducted by [4] in the Greater Cairo Area (GCA). The further criterion for the cases’ selection was about choosing four gentrification nodes designed by the same architect (Figure 3).
Given the importance and the role of gentrification nodes as the new city centers in new urban communities, it is discussed how these properties’ spatial/social resilience can increase the sustainability of new urban settlements. Each of these gentrification nodes includes two common ideas: First, an intention to achieve optimum climate comfort mainly related to their orientation and the height-to-width ratios, especially in the case of 5A in New Cairo and Arkan Plaza in Zayed.
Second, the use of Bio Geometry that “uses proprietary shapes, which interact with the peripheral energy fields of the body, to amplify the presence of this highly beneficial BG3 energy-quality, as well as to harmonize energy interactions with the environment” [30] which is mainly related to spatial analyses. As key properties, these complexes are of particular relevance for reorientating the market value and the spatial structure of the new settlement [4].
The type of gentrification node affects its spatial organization, especially the large-scale retail properties. Clearly, the projects were designed from the beginning as a business park with multi-services and large-scale retail areas such as 5A and Arkan Plaza, and the residential gated communities where retail properties were added later as the case of WaterWay White in new Cairo. The information in Table 1, concerning the targeted customers at the time of the creation of the chosen gentrification node and in the time being, was conducted on the basis of feedback from the architect and the owners of these nodes.
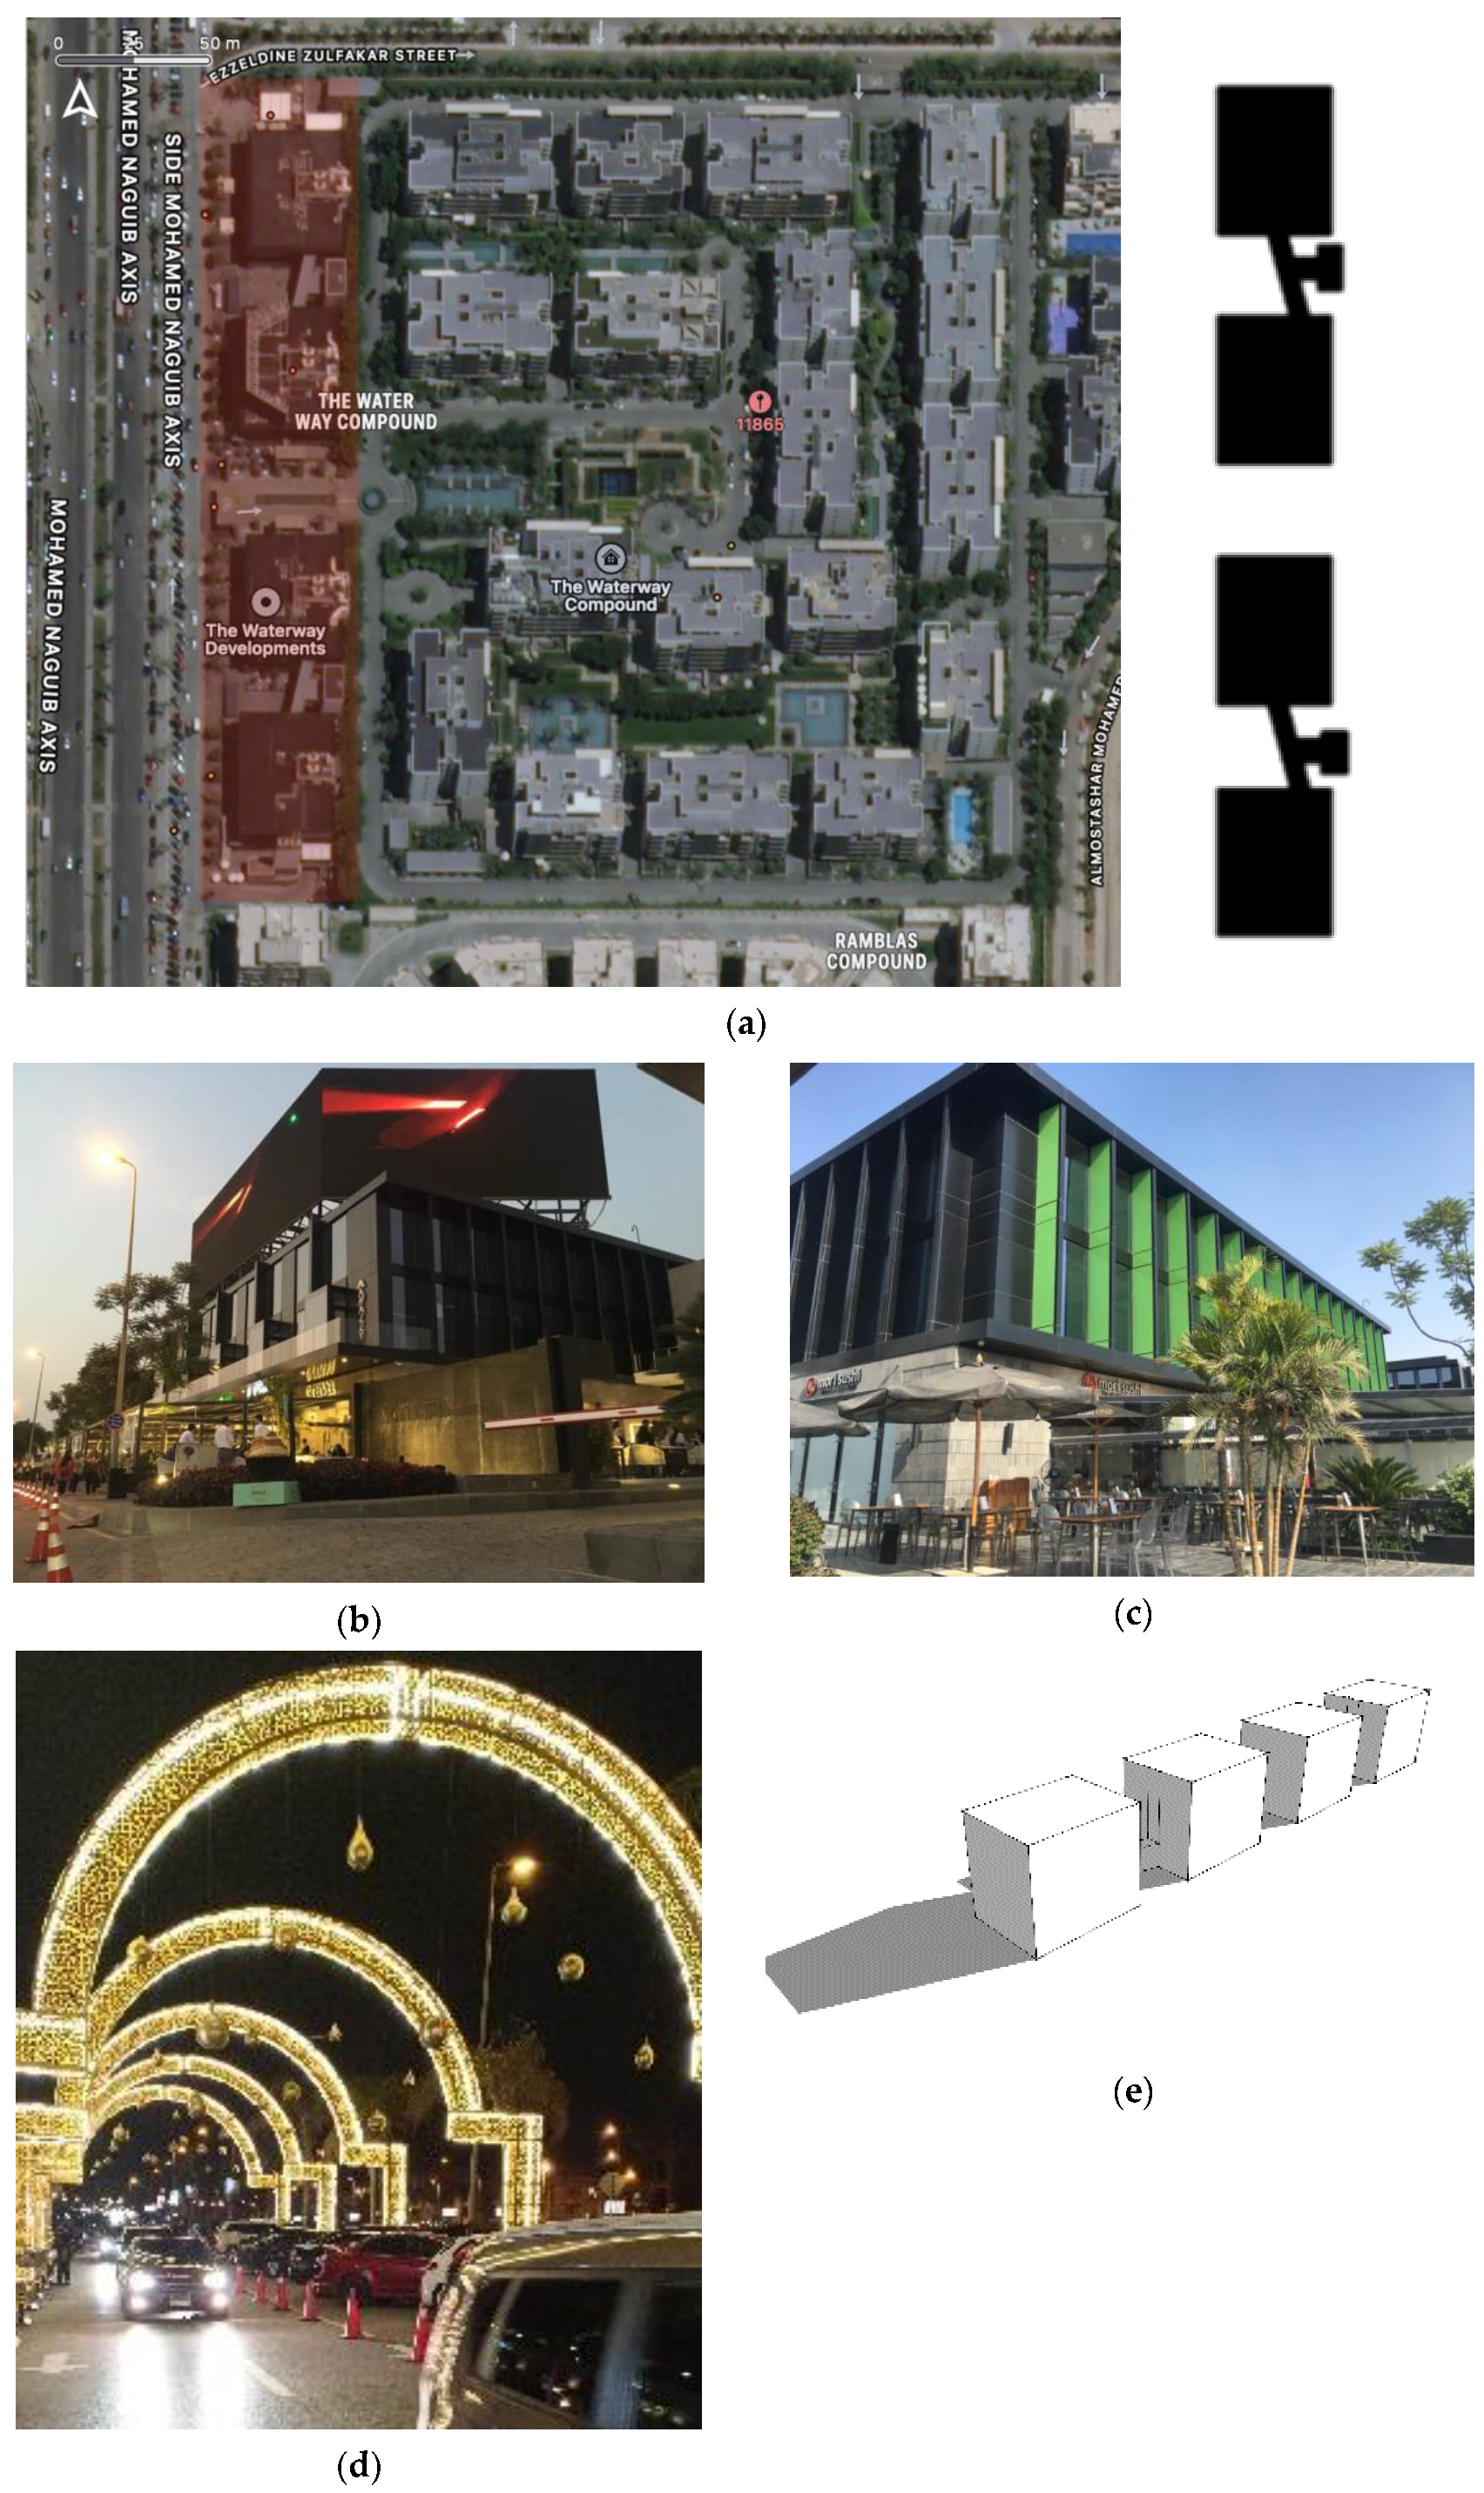
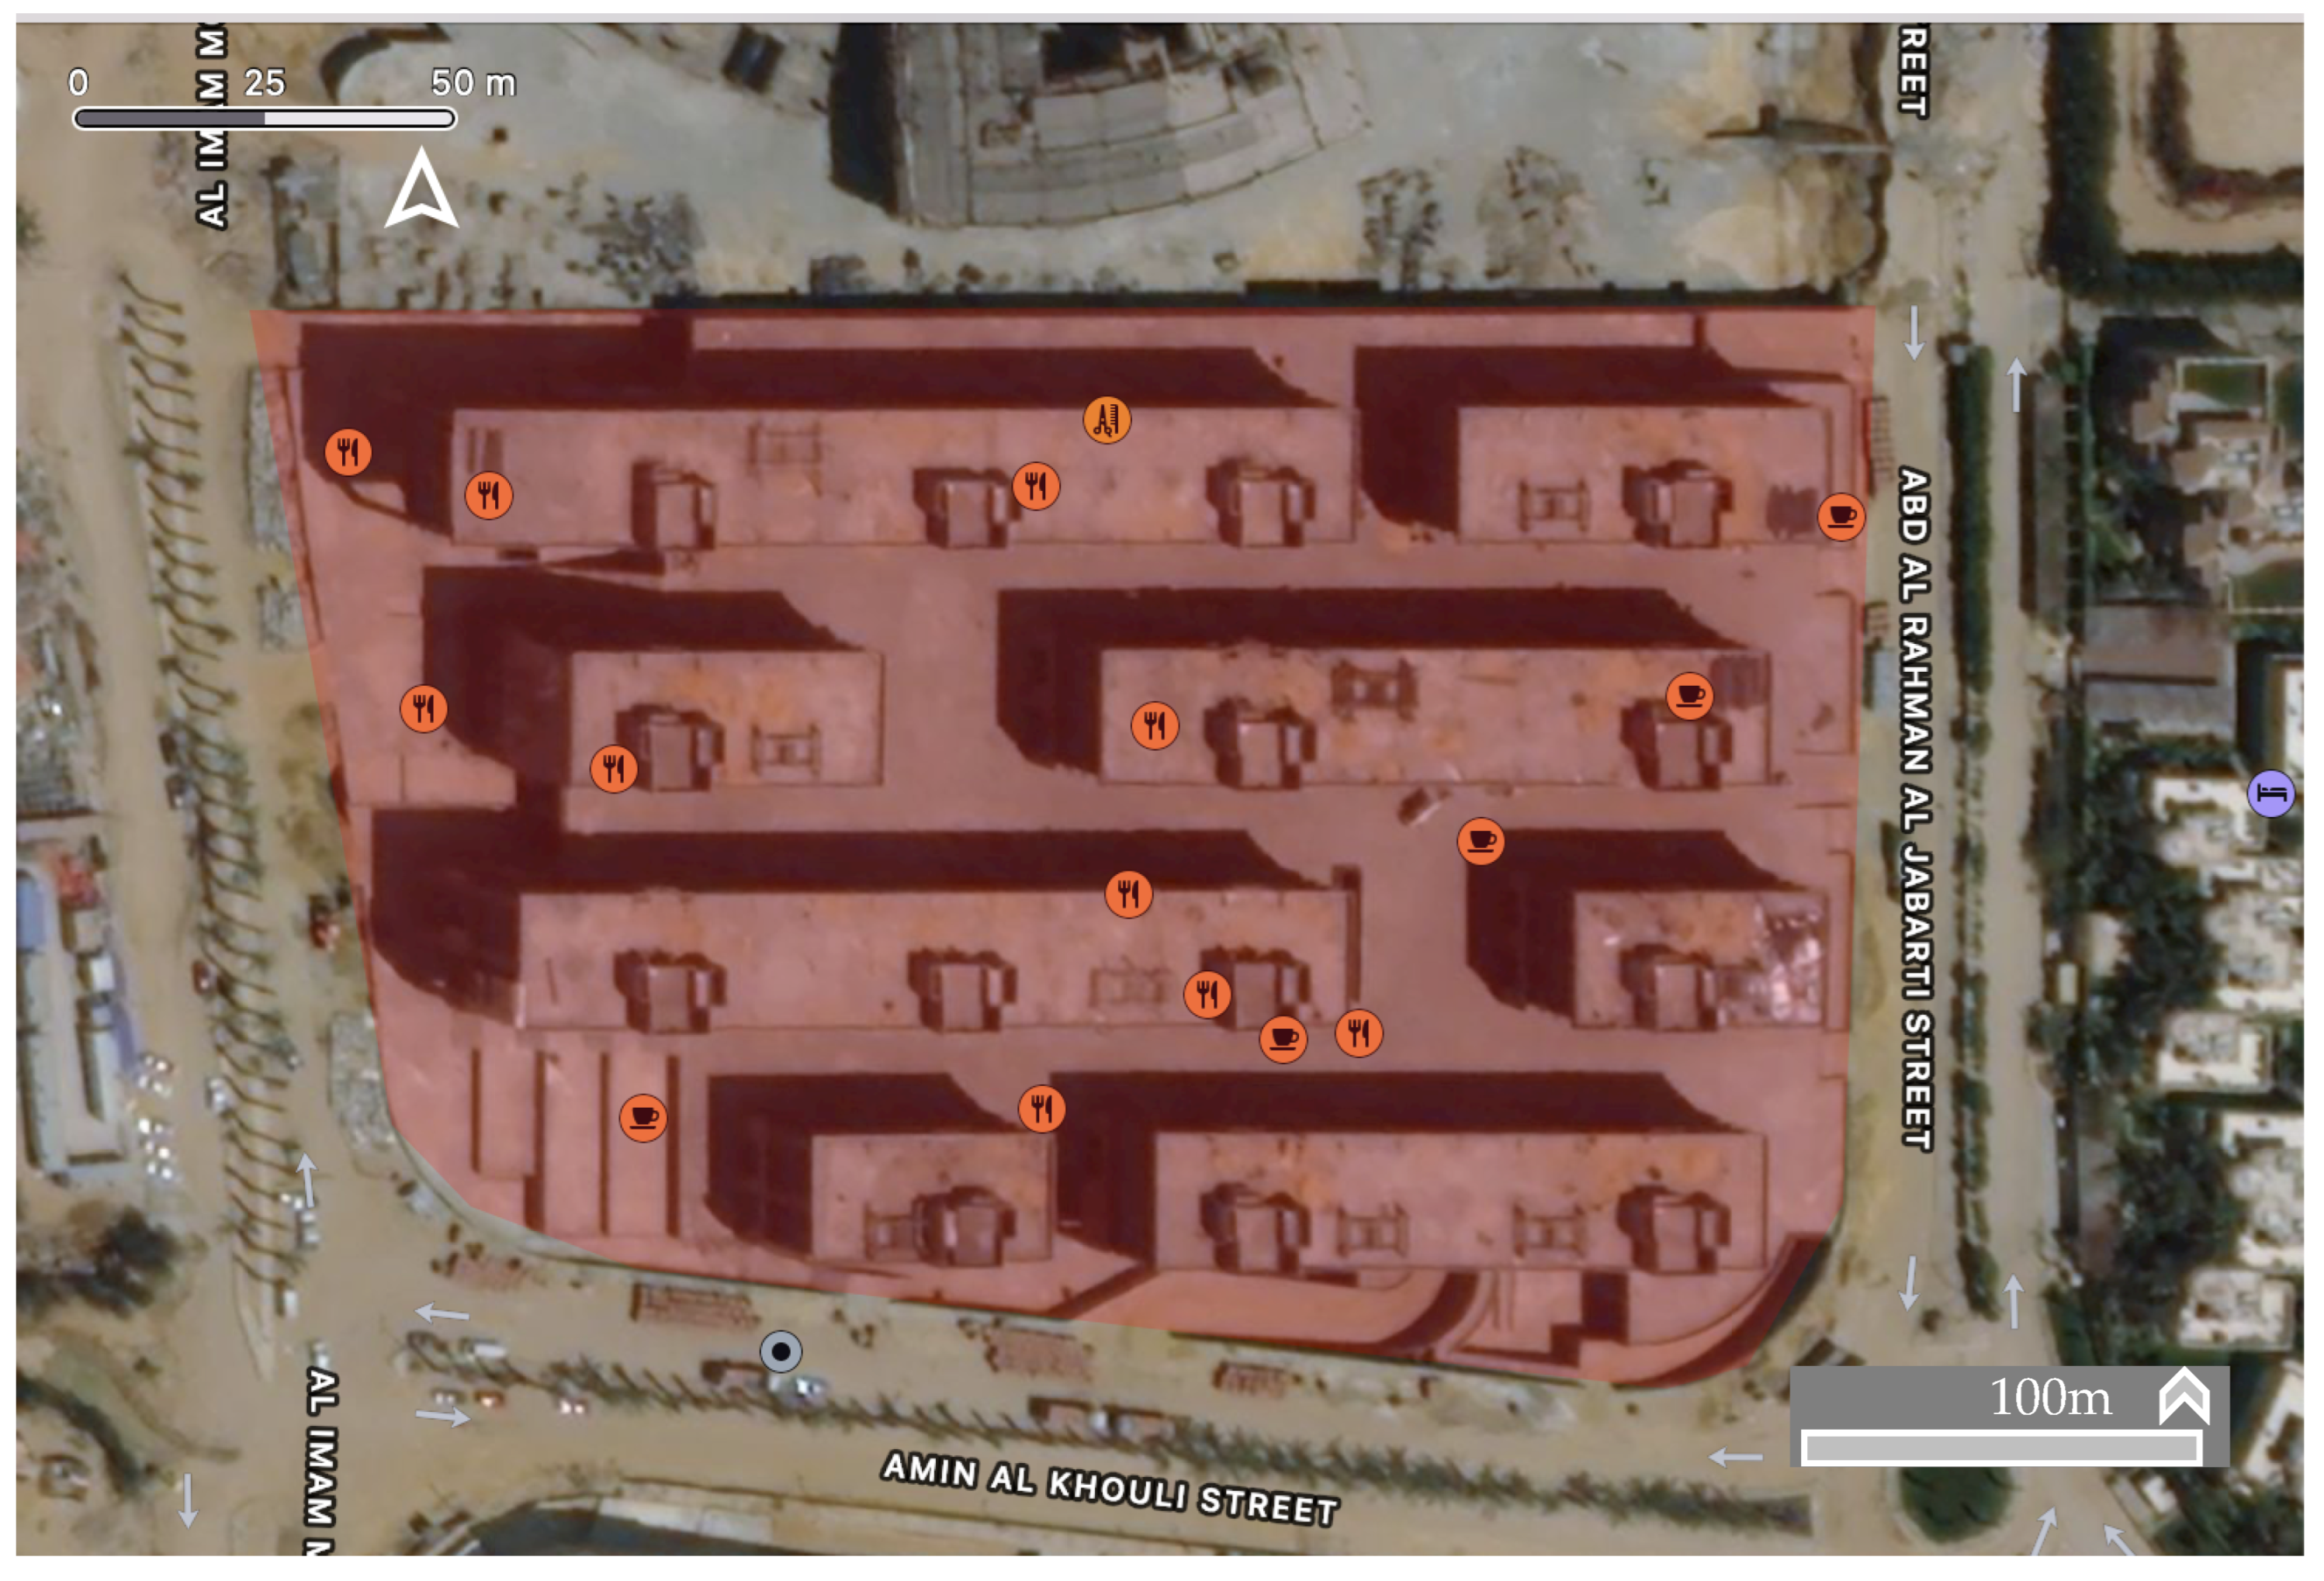
Gentrification Node 1: Waterway 1
“Waterway 1” is a residential gated compound constructed in 2012; it lies at the north-eastern part of Cairo, 30°2′29.32″ N, 31°28′32.37″ E, at Mohamed Najeeb axis in New Cairo (see Figure 3). The compound’s design offers the property owners vast green open spaces and water features. Additionally, a commercial strip linked to the compound offers an array of recreational services and amenities, which include bank branches, supermarkets, sports facilities, restaurants, and cafeterias (see Figure 4). According to the owner and the architect, the design’s approach targets upper to upper-middle social classes who wish to live in high-end apartments. The compound has a high property value and offers different services and activities. However, due to social mobility and the market pattern, the commercial strip amenities targeted mainly the upper middle social class.
The commercial strip is single-loaded building blocks of an average height of 12 m facing the west. Curtain wall cladding with spaced louvers are at the facade. Most restaurants and cafeterias are on the ground floor with outdoor terraces. Some terraces are enclosed glass terraces, and the others are open with portable shading elements, namely, umbrellas. These terraces are 5 m wide and overlook 2 m sidewalks and a stripped parking area. The pavement materials of the sidewalk and the terrace are the same; albedo = 0.5 and asphalt at the parking lot = 0.2; lined trees are arranged on the sidewalk, with a spacing of approx. 7 m from its axial center, and small flower boxes are present. Most of the tree’s canopy was removed during the mapping to add some street decorations.
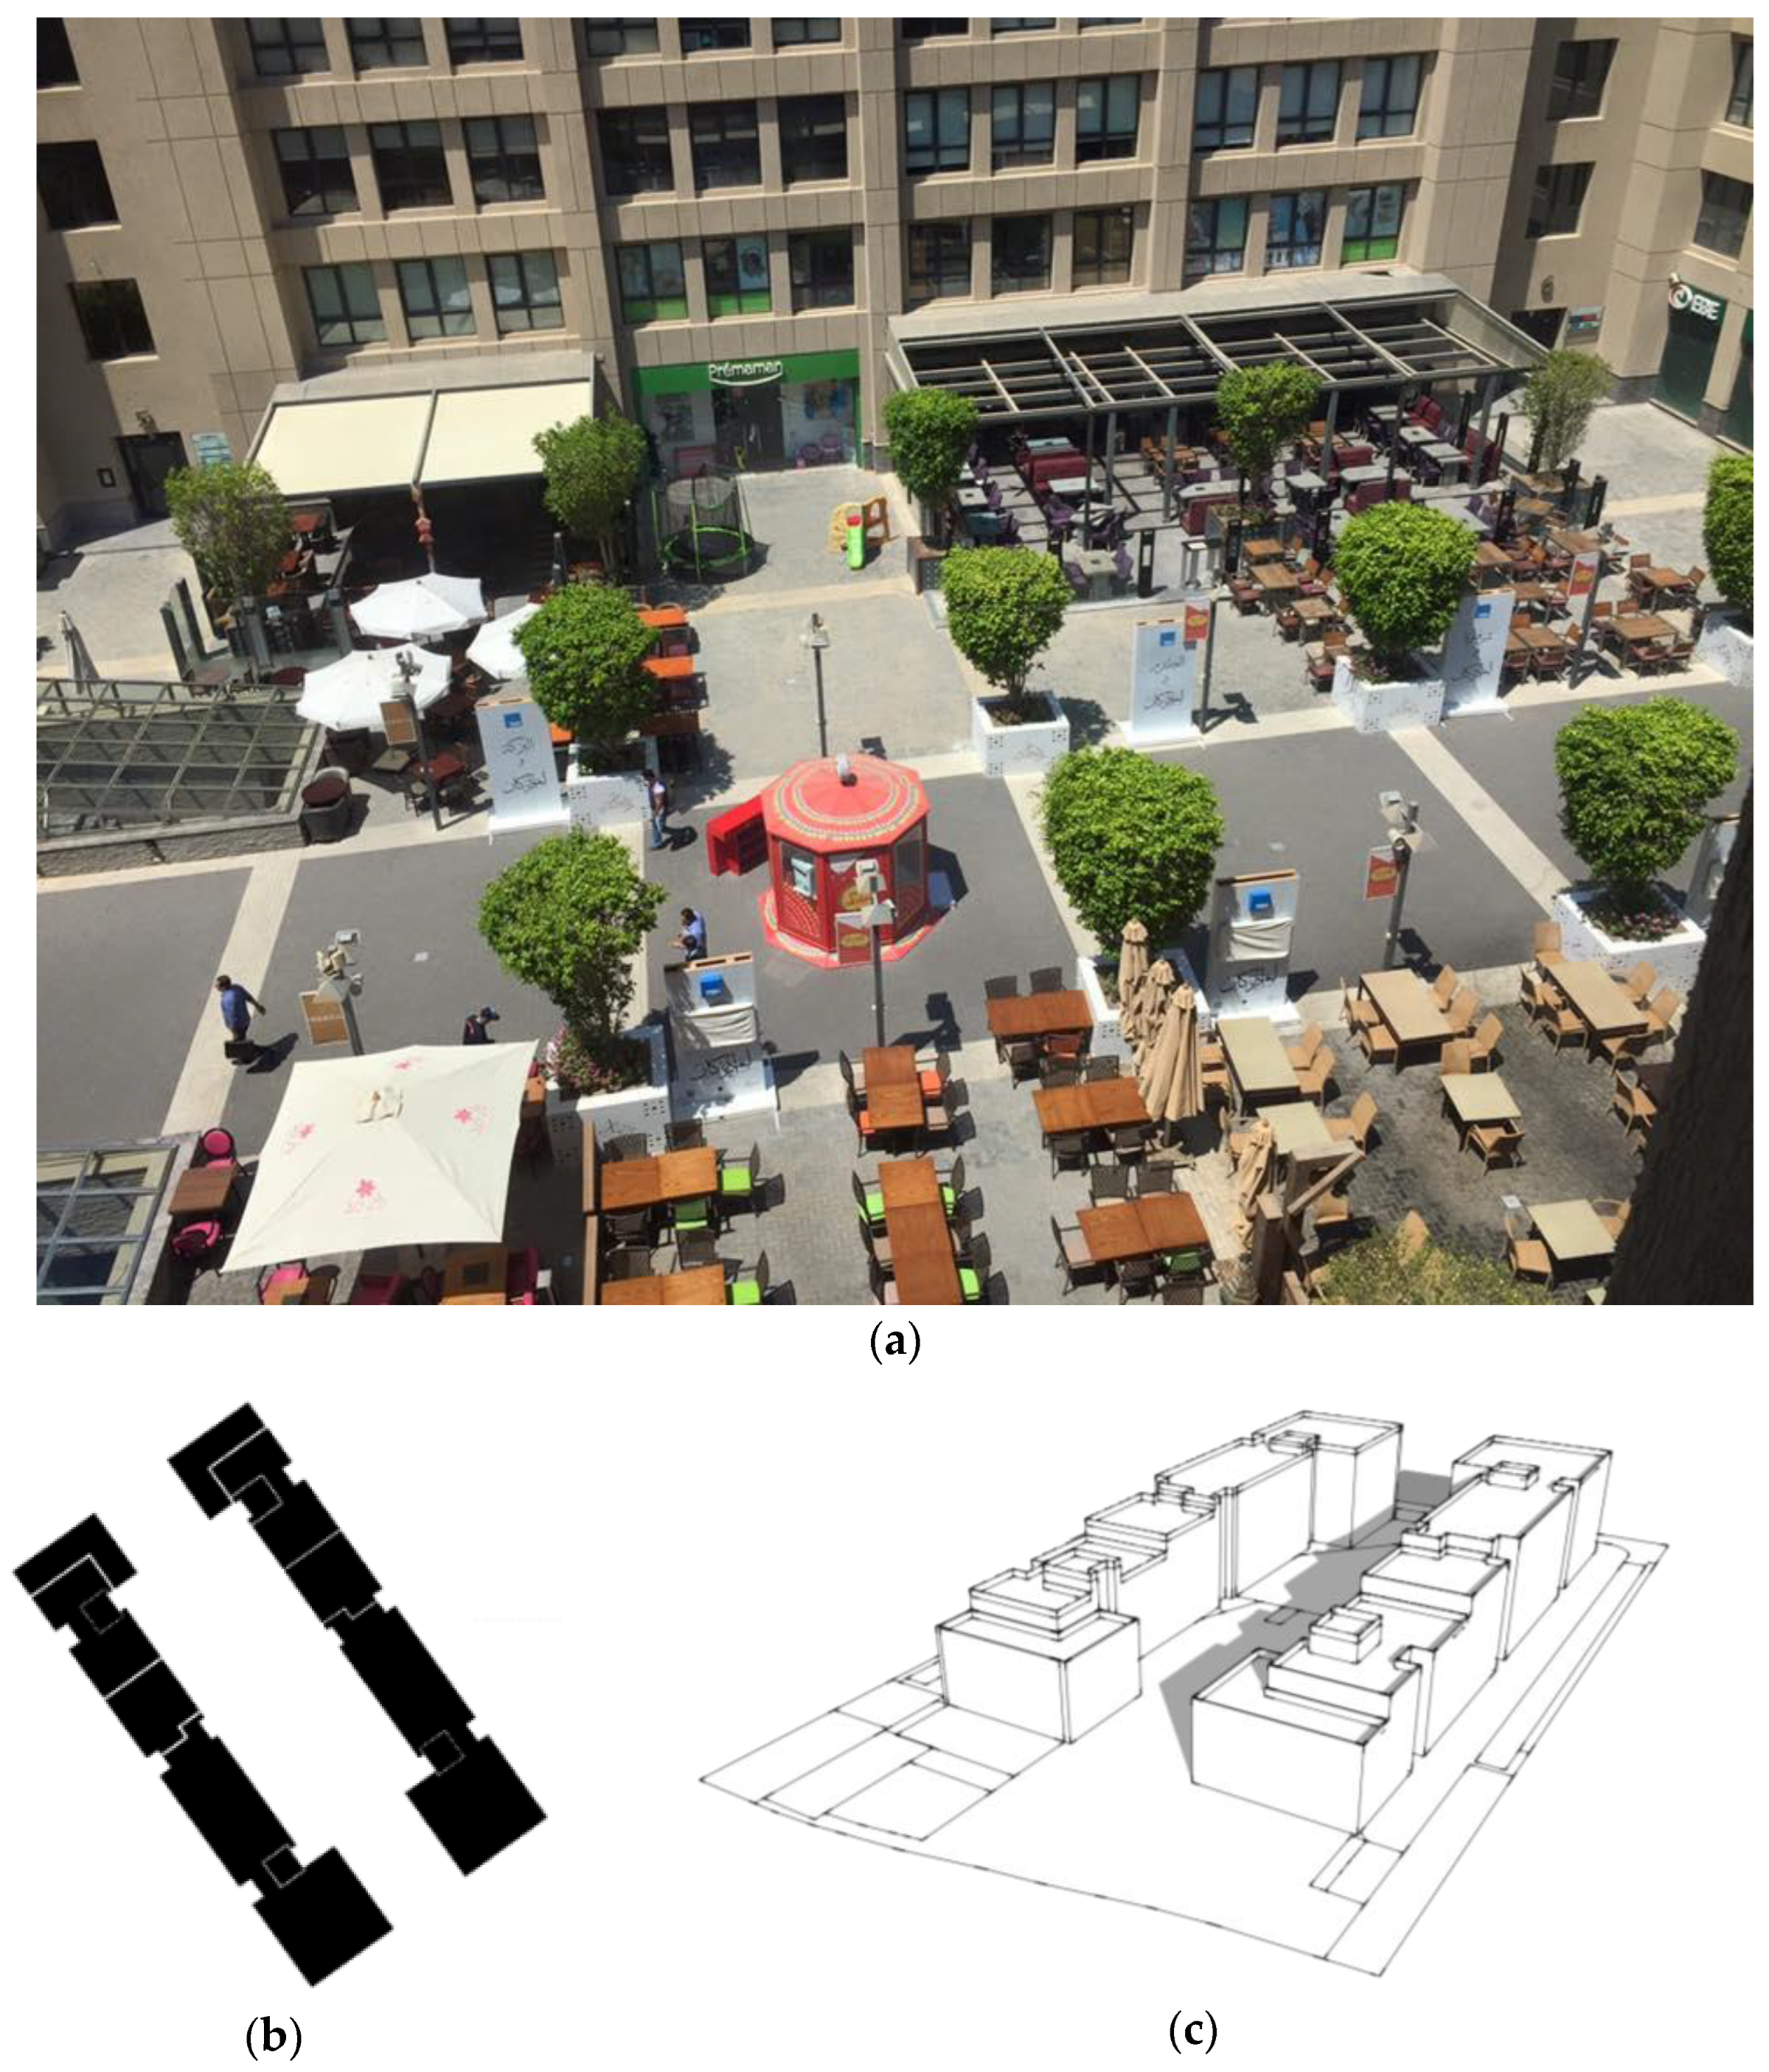
Gentrification Node 2: Arkan Plaza
Arkan Plaza is a commercial, administrative complex constructed in 2012; it lies in the western part of Cairo, 30°1′14.00″ N, 31°0′12.34″ E, ElBostan street, Sheikh Zayed City (see Figure 3). The complex is a pedestrian high street that accommodates retail, restaurants, upscale dining, a cinema, a healthcare and wellness center, and offices with no car entry. The design’s concept targets upper and upper-middle social classes, intending to sustain the same clientele over time (see Figure 5).
The design concept of the Arkan Plaza follows the “piazza concept,” which is an outdoor enclosed space overlooking different activities with approx. 40 m wide, and the building’s height cascades from 15 to 25 m. To the northwest is the direction of the enclosed space in the plaza. Retail, upscale dining, and restaurants are on the ground level with outdoor extended sitting areas on both sides of the piazza and a clear pathway in the middle by approx. 8 m. On both sides of the pathway, a row of small, round, evergreen trees exists with an axial spacing of about 15 m. Moreover, portable shading elements are present, namely, umbrellas. Pavements are the same but with different color patterns, black, grey, and white interlock (see Figure 6).
Gentrification Node 3: Waterway White
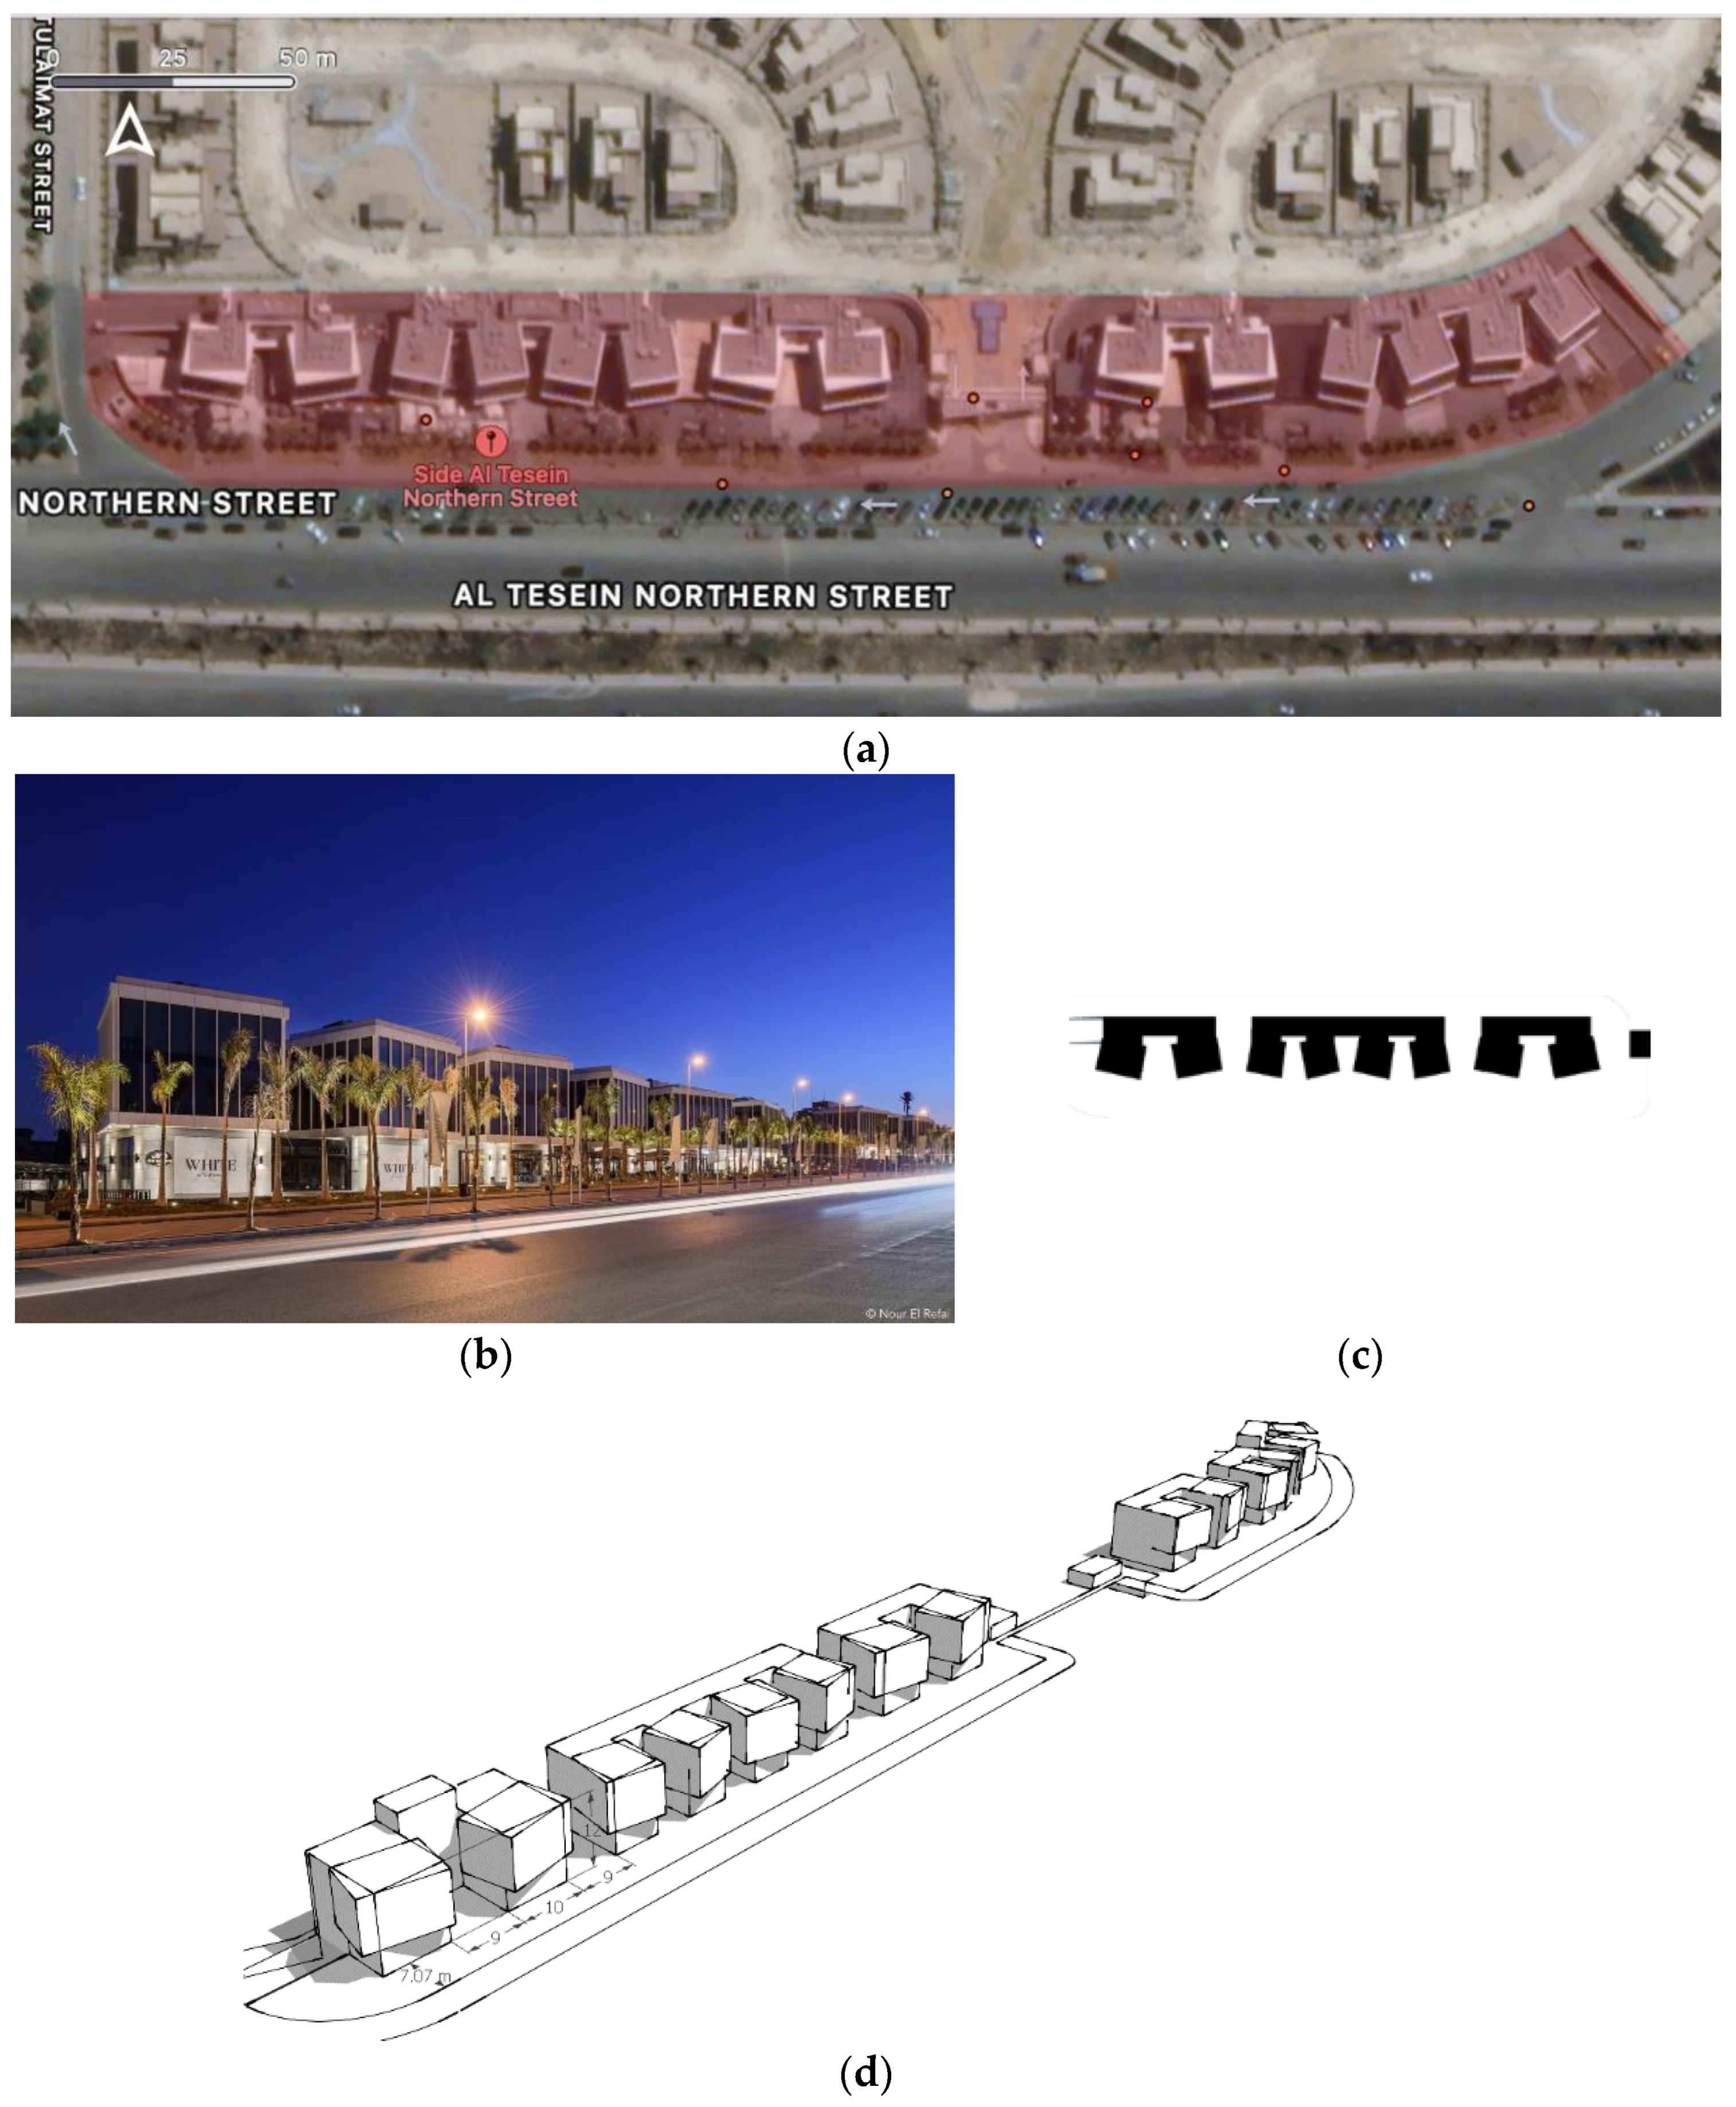
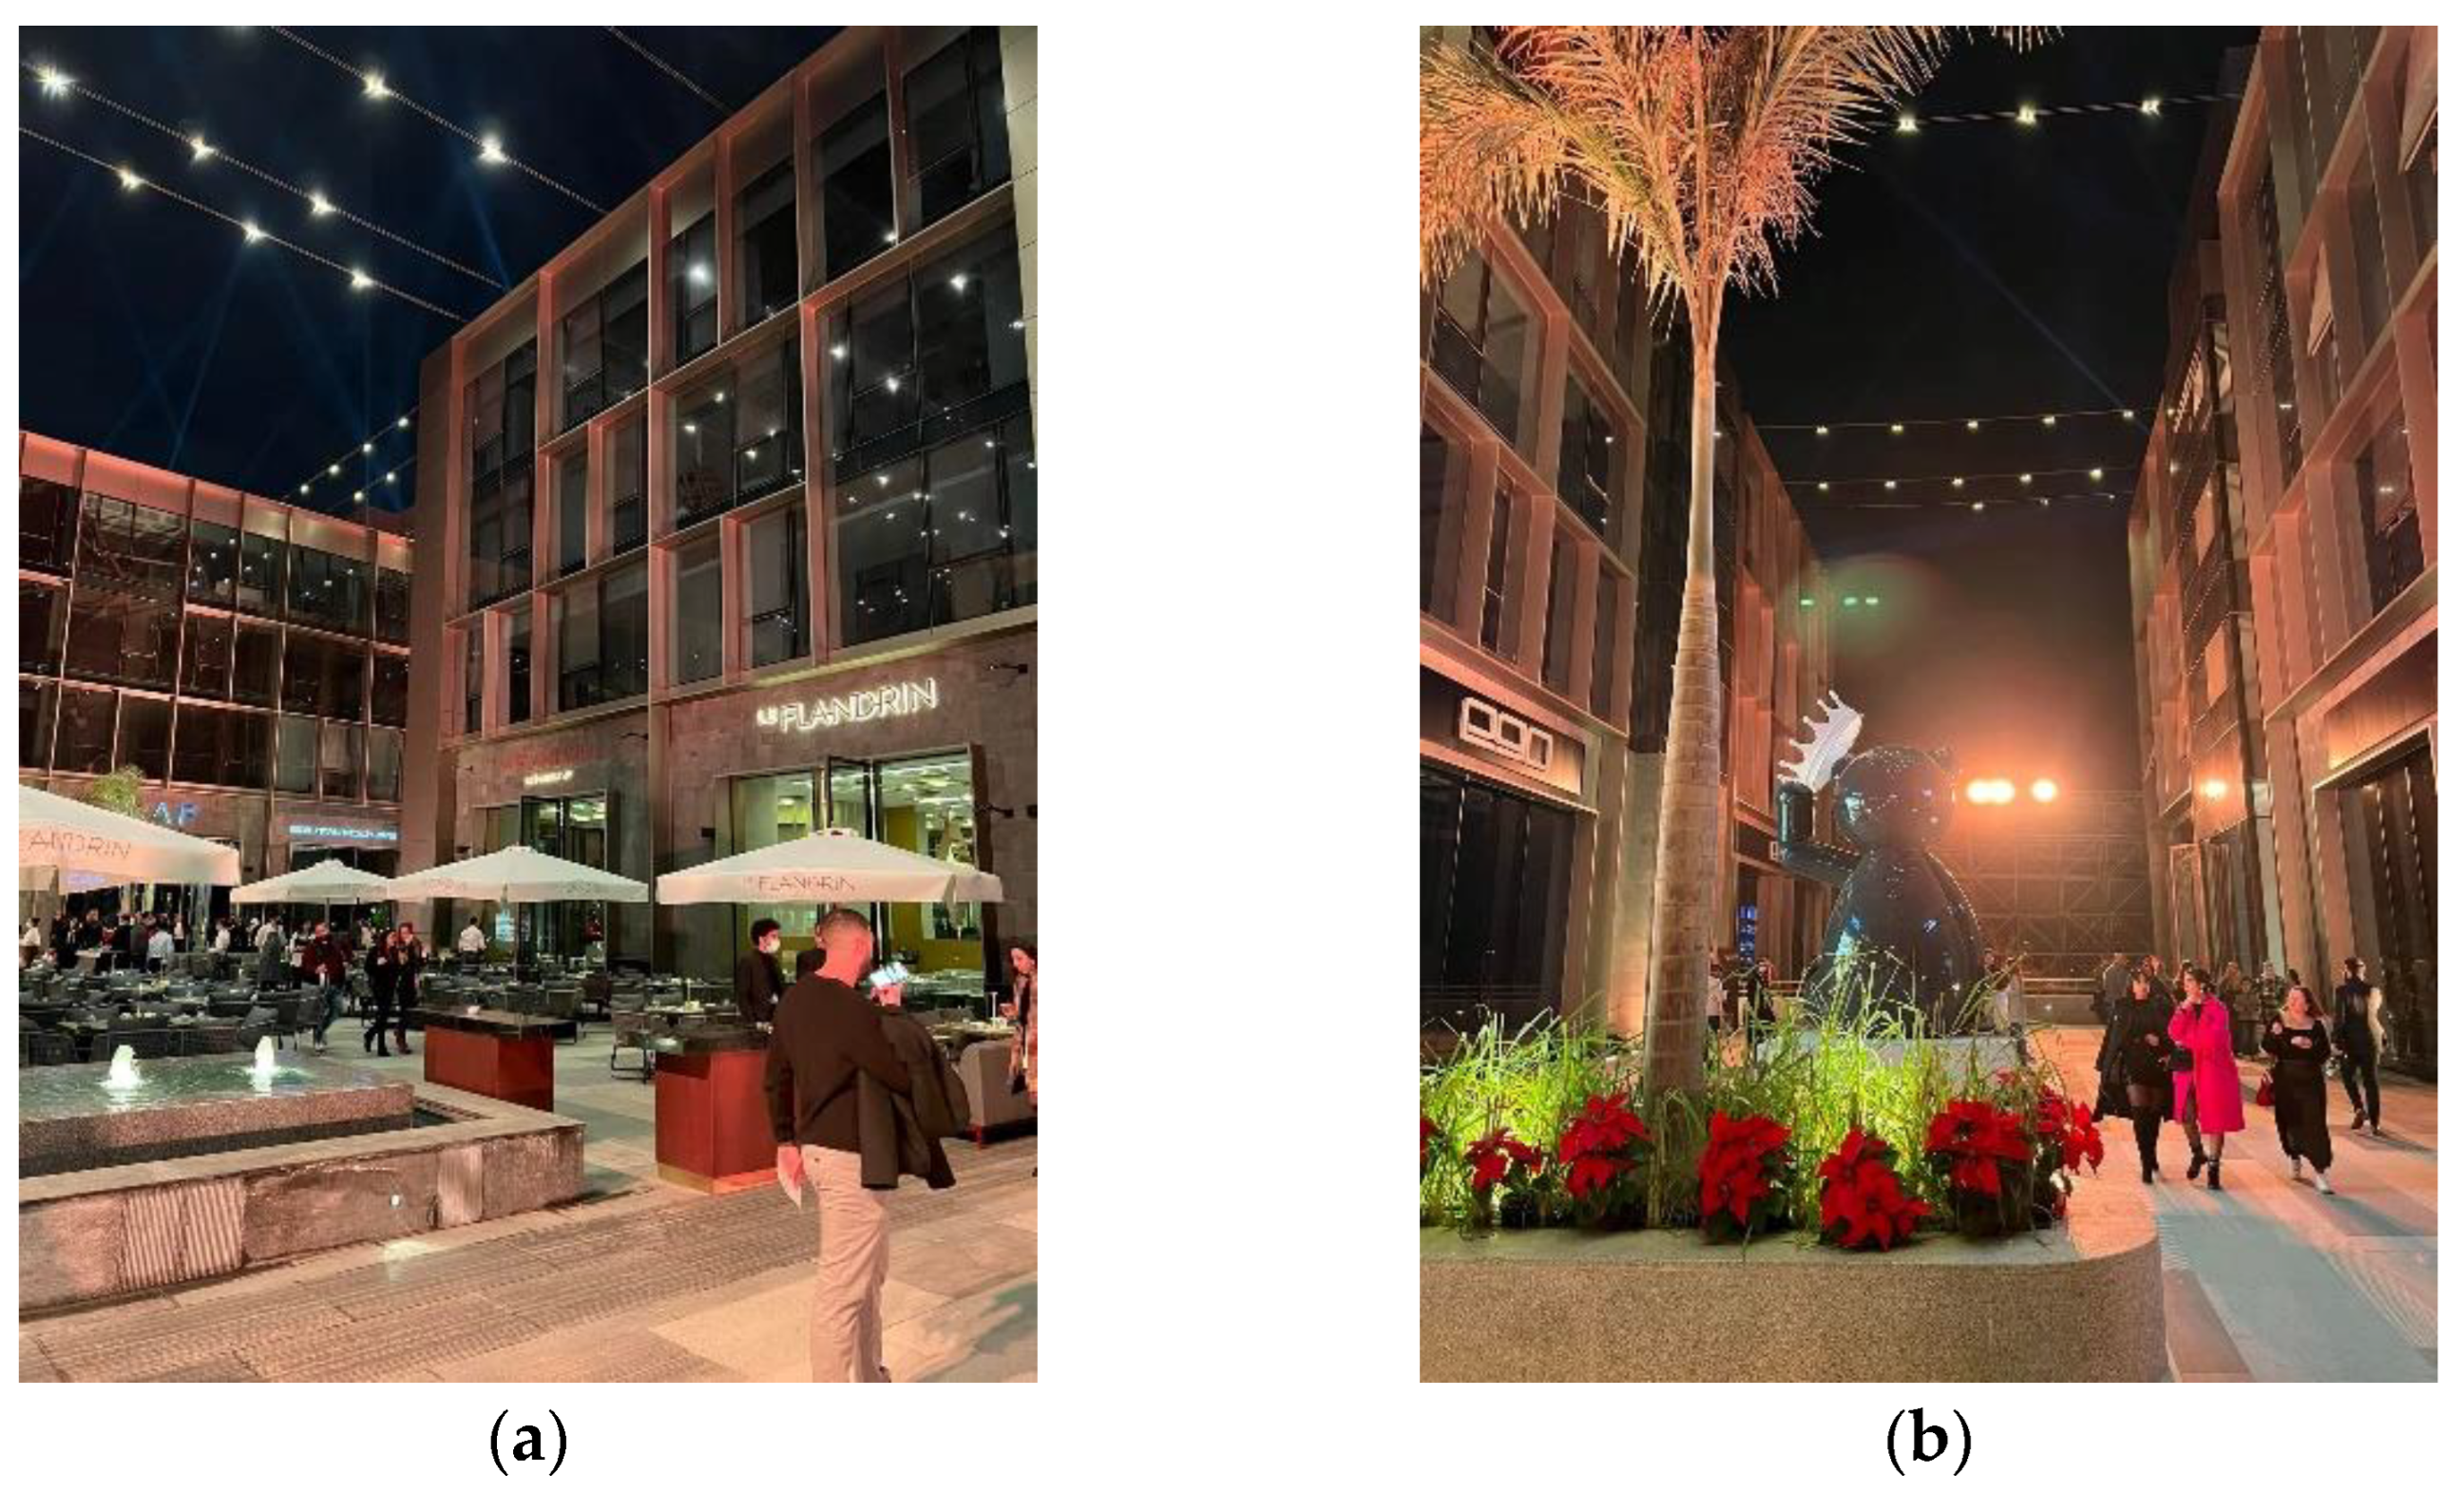
“WaterWay White” is a mixed-use strip mall attached to a residential gated compound constructed in 2018; it lies at the north-eastern part of Cairo, 30°1′45.28″ N, 31°28′59.25″ E, North Teseen axis, New Cairo (see Figure 3). The compound was constructed in two phases; phase 1 is the residential compound, then phase 2 is the strip mall, linked to the compound offering an array of recreational services and amenities, including bank branches, supermarkets, stationery, restaurant, and cafeterias. This design approach targets upper and middle social classes due to the high property value and offered service (see Figure 7).
The commercial strip comprises single-loaded building blocks of an average height of 12 m facing the south. The first- and second-floor mass orientation differs from the ground floor and is cantilevered. These floors are curtain wall-cladding with spaced louvers at the facade. Most restaurants and cafeterias are located on the ground floor with outdoor terraces 9 m wide between the buildings, 4m overlooking the sidewalks, and a stripped parking area. On the sidewalk, palms are arranged linearly. The pavement materials of the sidewalk and the terrace are the same, albedo = 0.5 and asphalt at the parking lot = 0.2.
Gentrification Node 4: 5A
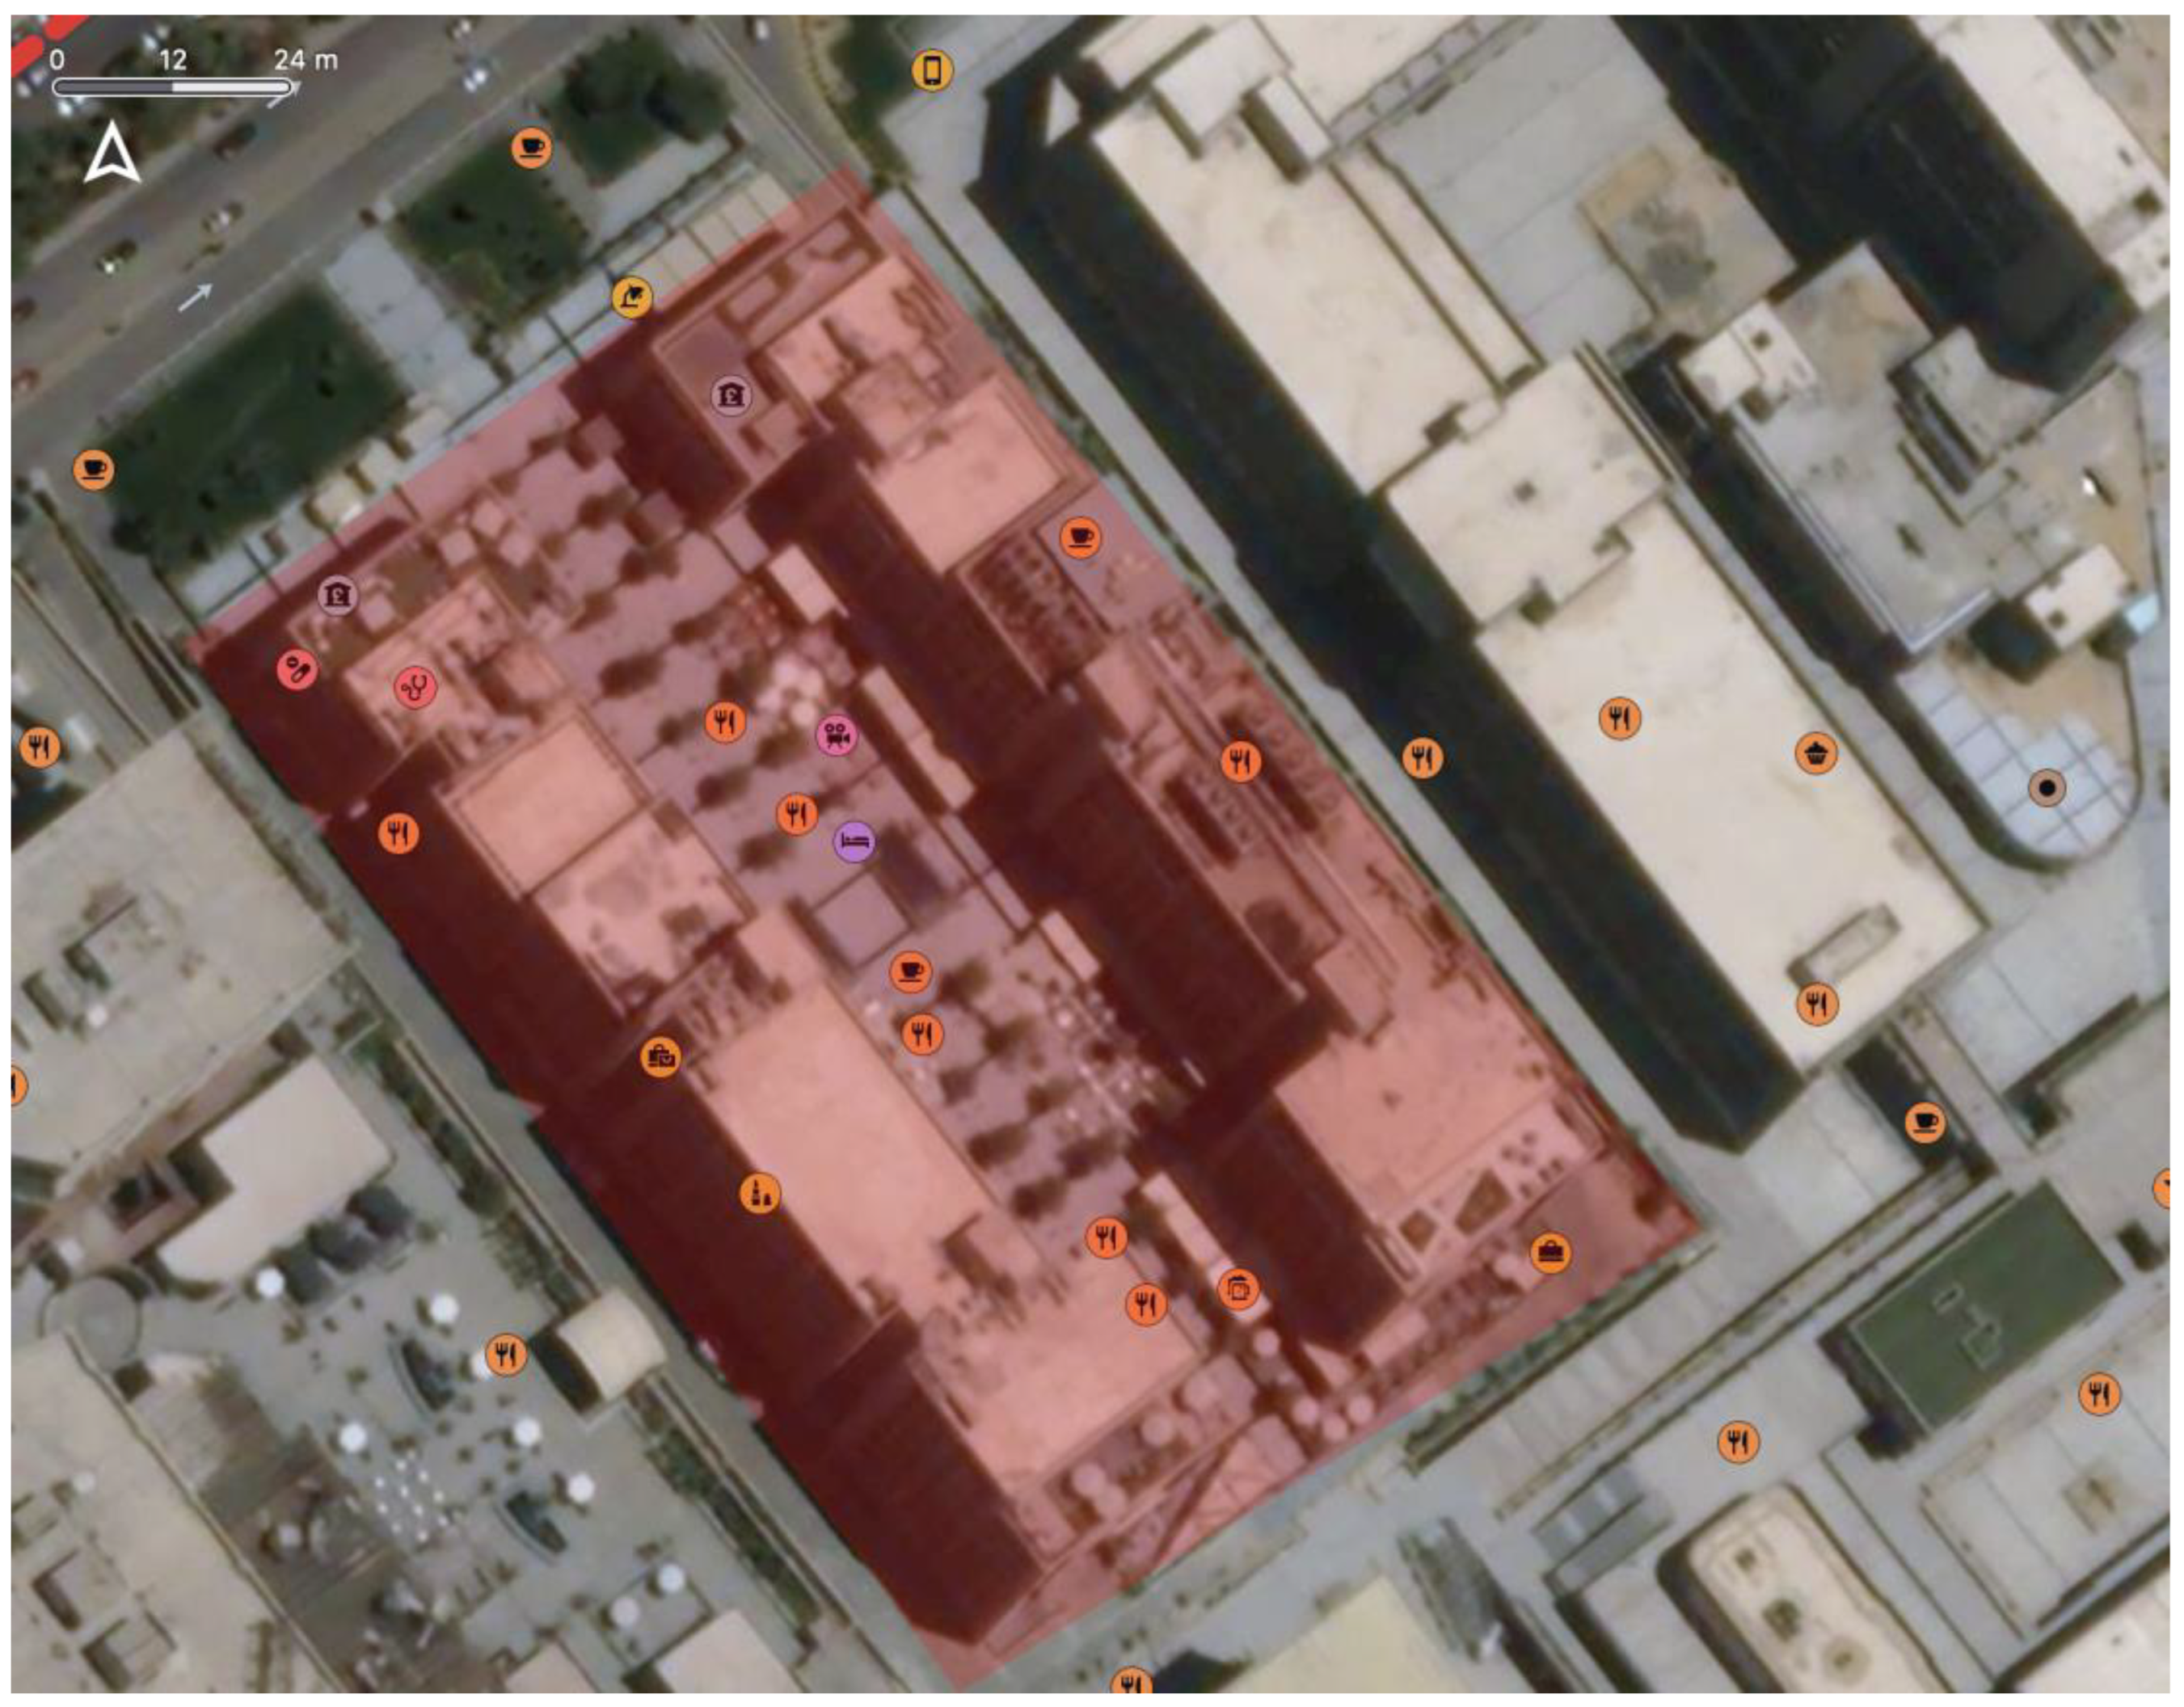
“5A” is a commercial, administrative complex and a business park constructed in 2021. It lies in the eastern part of Cairo, 30°0′31.19″ N, 31°24′11.73″ E (see Figure 3). The complex (see Figure 8) is designed to be the best luxurious destination, accommodating retail, restaurants, upscale dining, healthcare, and offices. The design’s concept targets upper social classes intending to sustain the same clientele’s socio-economic category over time.
The design concept is a multiaxial space with eight buildings, with a height of approx. 20 m, linearly arranged in the east–west direction. The spacing, namely, pathways, between buildings is approx. 13 m and serves retail, restaurants, and parking entrances/exits (Figure 9). Moreover, sitting benches are presently arrayed with palm and small shrubs (Figure 9a,b). The spacing between the buildings on the north–south axis is approx. 27 m, where restaurants and cafeterias utilize these spaces as outdoor extended sitting on both sides and portable shading elements are used.
2.2. Users’ Preferences through Questionnaire
An online closed-ended questionnaire was designed and distributed over different social media platforms to understand the users’ preferences for each of the four gentrification nodes. The designed questionnaire includes three main sections: the first requires data about the respondent, such as age, location of residency, and preferred gentrification node. The second section investigates the spatial design and space character, the attractiveness level for each node, and the activity in each G.N.; shop, eat, sit, and service provision. The last section examined the microclimate and human thermal comfort. The questionnaire investigates the morning hours from 9:00 to 12:00, the noon hours from 12:01 to 16:00, and the evening hours from 16:01 to 23:00.
The questionnaire analysis aims to clarify and outline the behavior of these gentrification nodes and the climate comfort they offer to their clientele, especially during summer. Additionally, a conversation with the owner and architect was conducted to understand the design philosophy and market strategy.
2.3. Processing and Simulation
Cairo is known for its hot arid climate (BWh) according to Köppen Climate Classification [31]. In typical summer weeks, the temperature reaches 27 °C and humidity is up to 54%, and during heat waves, the temperature increases in an unprecedented manner: 40 °C [30]. Conversely, on a typical winter week, the temperature reaches 15.5 °C with 62% relative humidity. Wind speed averaged 3.8 m/s from the north direction, which is the dominant wind flow, 4.2 m/s from the northeast and 3.5 m/s from the northwest direction. The urban form and its correlated albedo, temperature ranges, humidity, wind pattern, and radiant temperature highly influence human comfort [21]. Some research highlights that thermal discomfort is present in the context [32] due to the poor climatic design of the outdoor spaces [21,25,26,33,34].
2.3.1. Weather File Localization
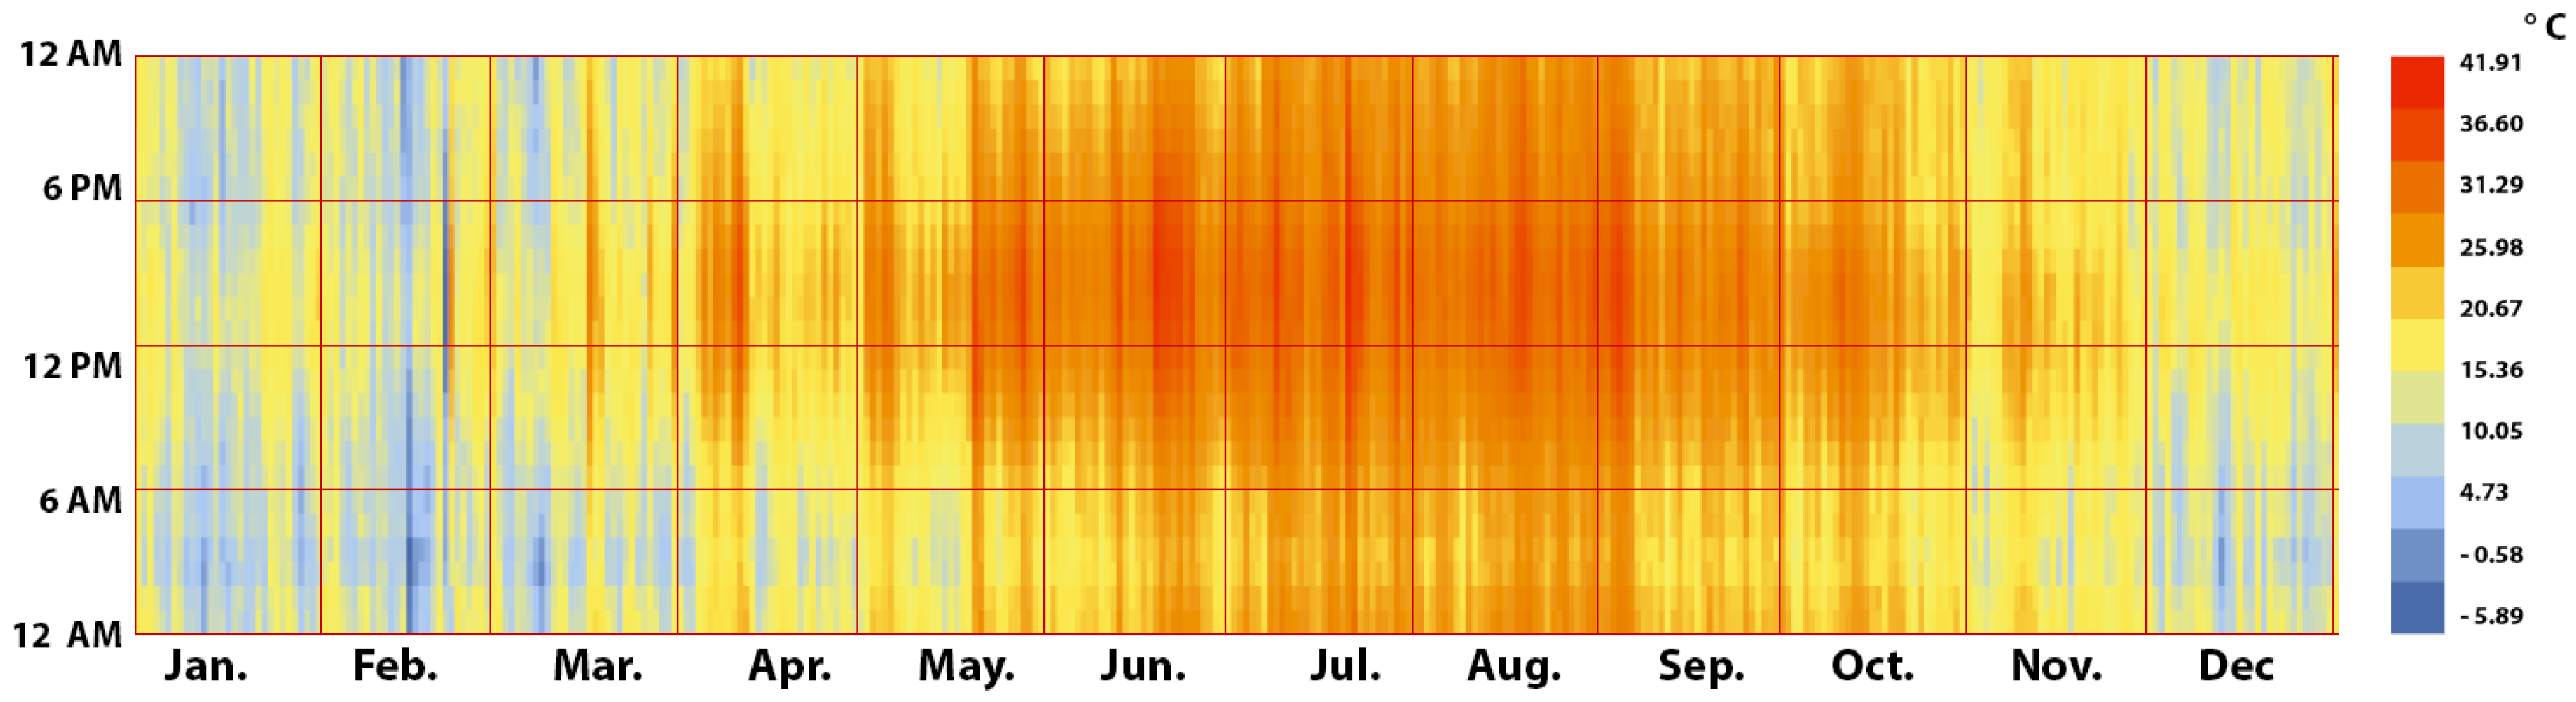
This study used different tools and techniques to model and map human comfort in the studied areas. We initially generated a local weather file for each case using the Meteonorm tool [35]. This tool generates weather data for the required location, according to WMO measurements [36], with an acceptable accuracy mentioned in a couple of research as in [26,37]. The 20th of July is the assigned day since the temperature reaches its peak, representing the typical summer day for the examined weather file (see Figure 10).
2.3.2. Ladybug Tools and Validation
We calibrated the buildings’ geometry of the built environment through the Rhinoceros 3D modeling tool [38] for the four gentrification nodes. Trees and light structure elements such as shades and louvers were excluded in the modeling process since our focus was oriented toward the spatial arrangement of the buildings and its impact on human outdoor comfort. The focus was on direct radiation and other metrological variables such as air temperature, wind, and relative humidity at specific receptor points.
Ladybug tools are a collective free, open-source computer application that supports environmental analysis and design [39]. These tools [39] were utilized since it connects and integrates different simulation engines to assess human thermal comfort and the built environment within a specified period. The simulation period is relatively limited compared to other tools, such as ENVI-met [40]. It is clear from previously undertaken research that the Ladybug tool has an acceptable accuracy; Testa et al. highlight the capacity of the tools to simulate the radiant temperature on the street level [41], Perini and her colleagues computed the human thermal comfort index UTCI through ladybug [42]. Moreover, the work conducted by Elwy et al. proved that the workflow of ladybug tools is sufficient to generate human thermal comfort levels and other outdoor microclimate parameters in a short period with minor errors [43].
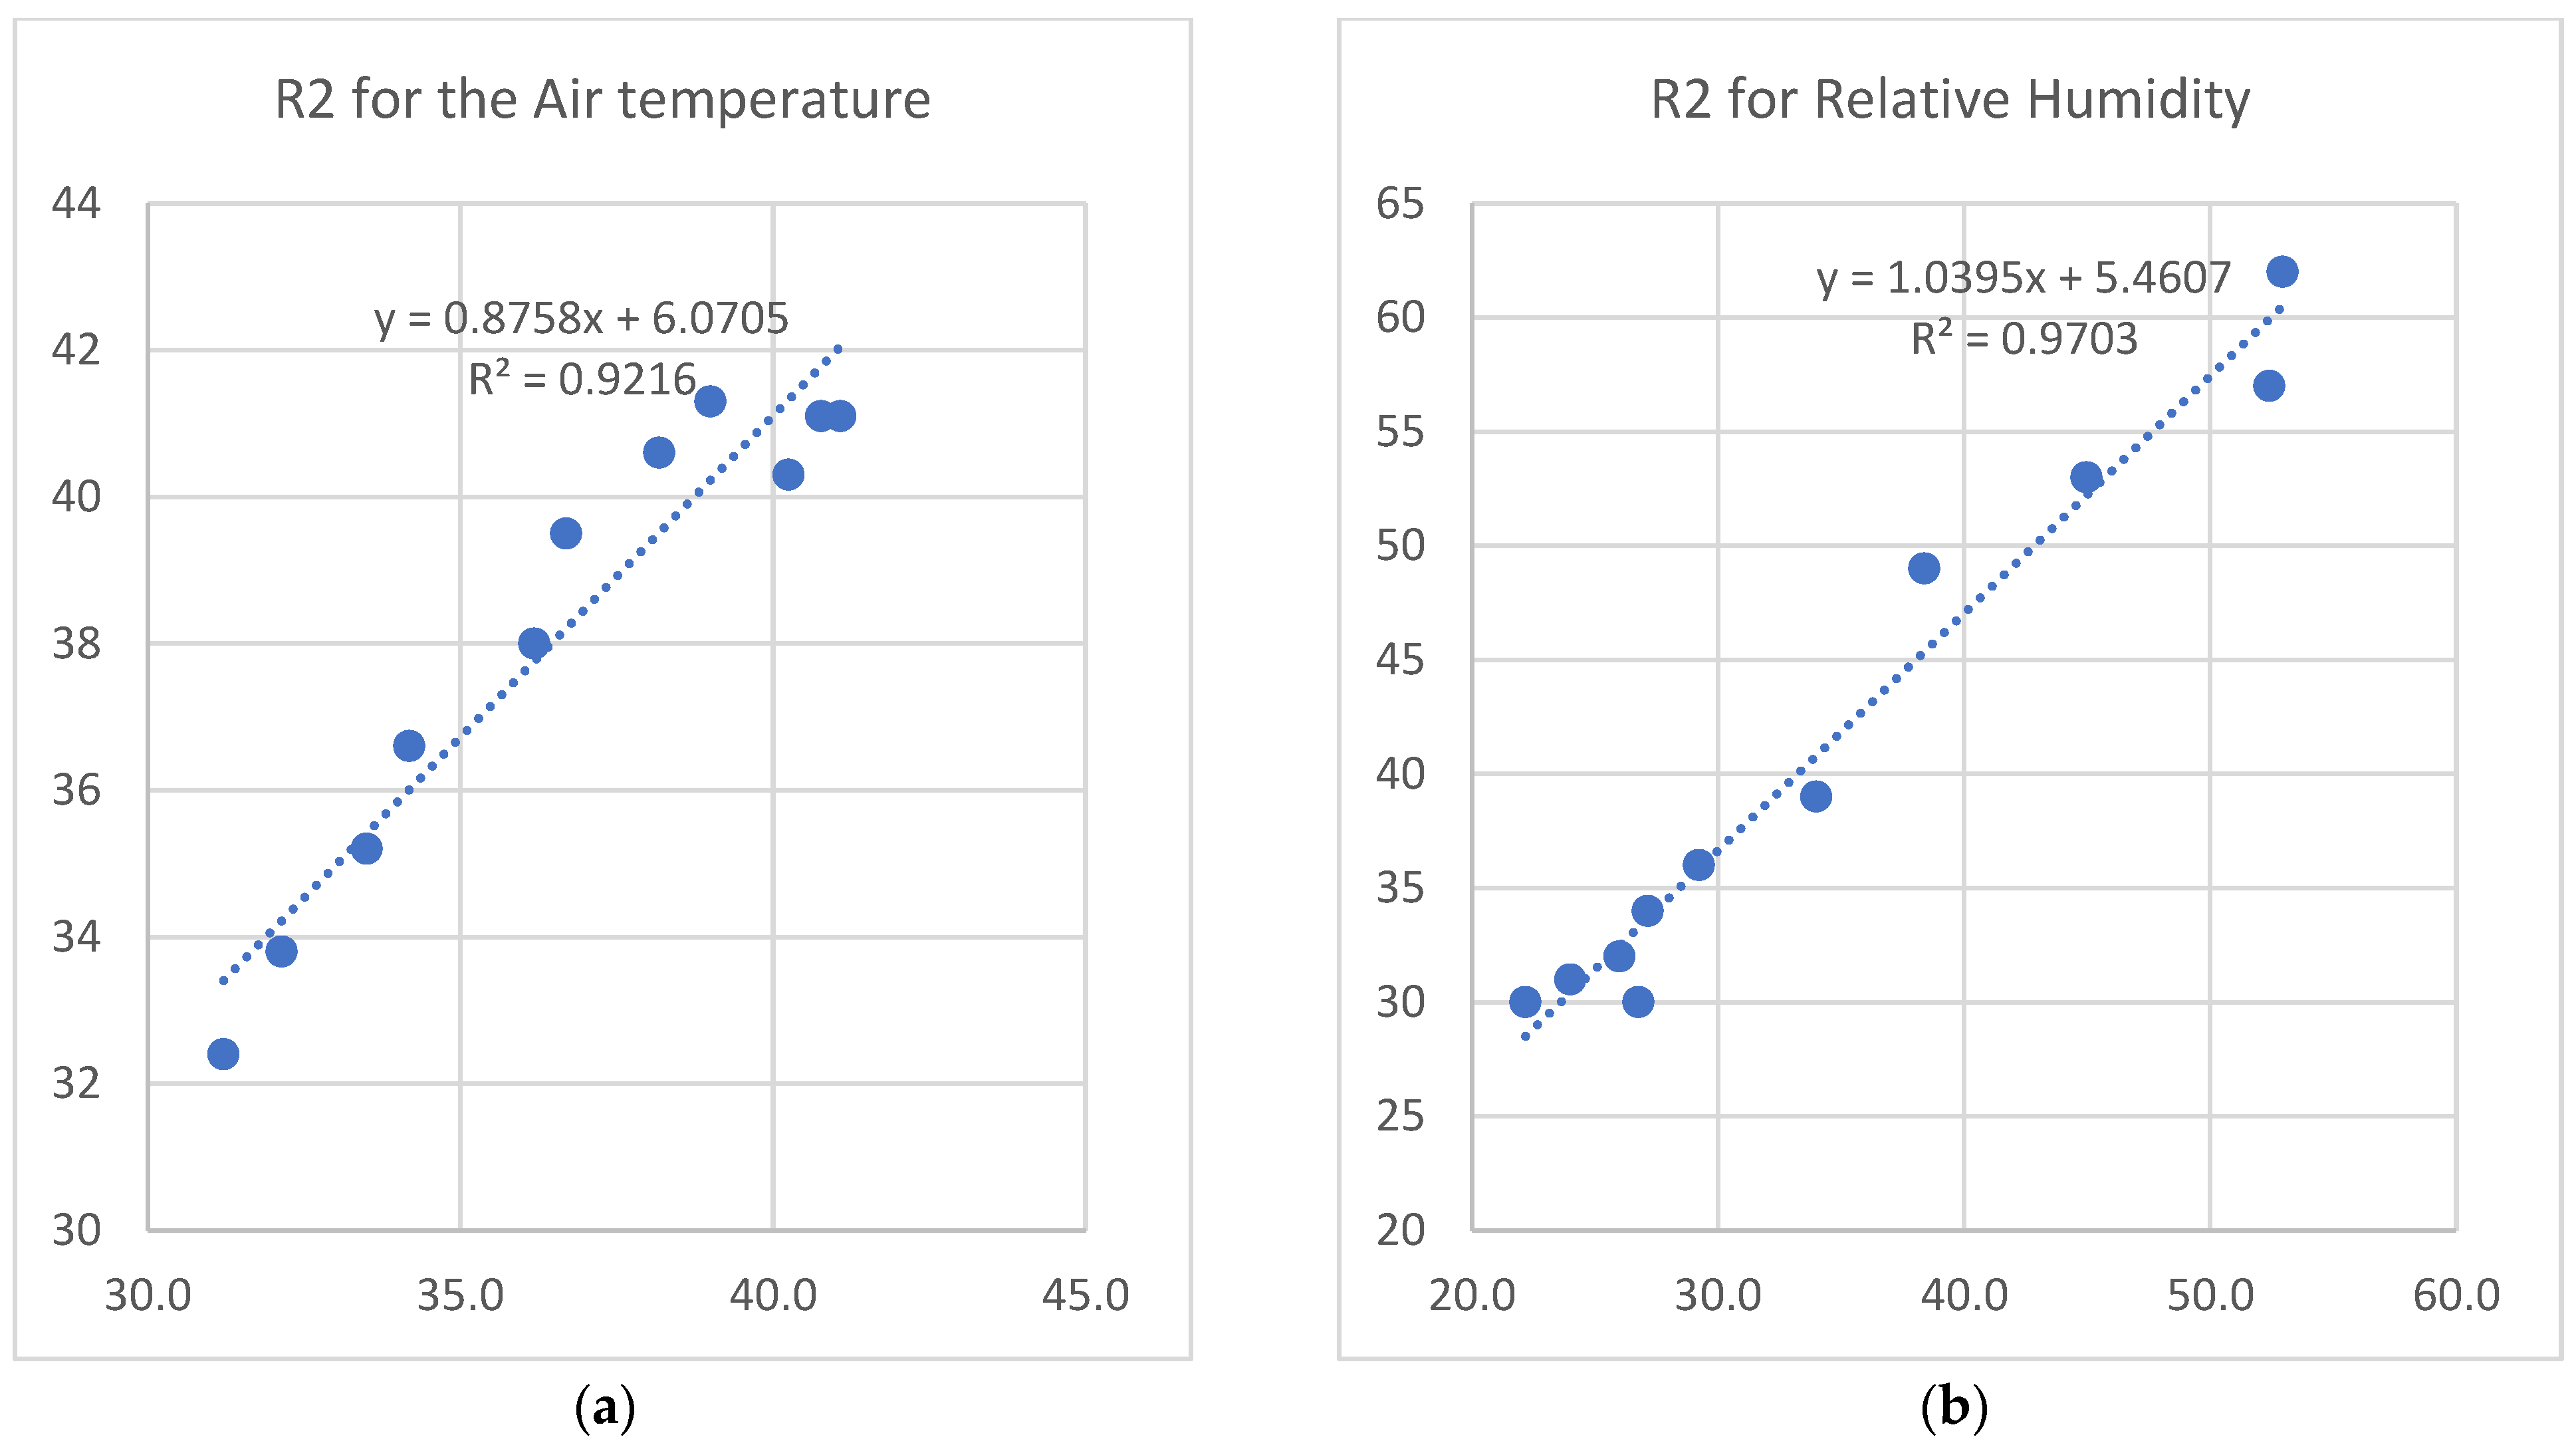
We attempted to validate the initial computational results through hourly field measurements for air temperature and relative humidity on the 28th of June. A portable TroTec Bc [40] measuring device was used to record the parameters mentioned above at 1.5m above ground level since this is the approximate human breathing level [44]. The device’s accuracy for measuring air temperature is ±1 °C, and the relative humidity is ±2% [40] (see the results in Figure 11). Pearson’s coefficient of determination (R2) [45] was calculated to statistically validate the predicted outputs and the onsite measurement. The coefficients’ desirable values are the ones close to 1. A strong correlation was obtained for the air temperature and the relative humidity, 0.92 and 0.97, respectively.
3. Results and Synthesis
As was previously mentioned, a questionnaire was conducted over different social platforms to trace the users’ preferences for the four gentrification nodes. It targeted users working there; living in the attached compound; eating at restaurants/cafes; or using other services such as supermarkets, stationery, cinemas, gyms, and banks. A total of 137 individuals responded to the questionnaire, most of whom are users coming to one of the studied gentrification nodes to get a service. The minimal response was from residents in the adjacent compounds, as in “Waterway 1” and “White”, or the people working there. Through examining the respondents’ data, it was found that almost all age groups between 18 and 65 go to the studied areas. However, the majority are between 25 and 54, since suitable services serve these age groups.
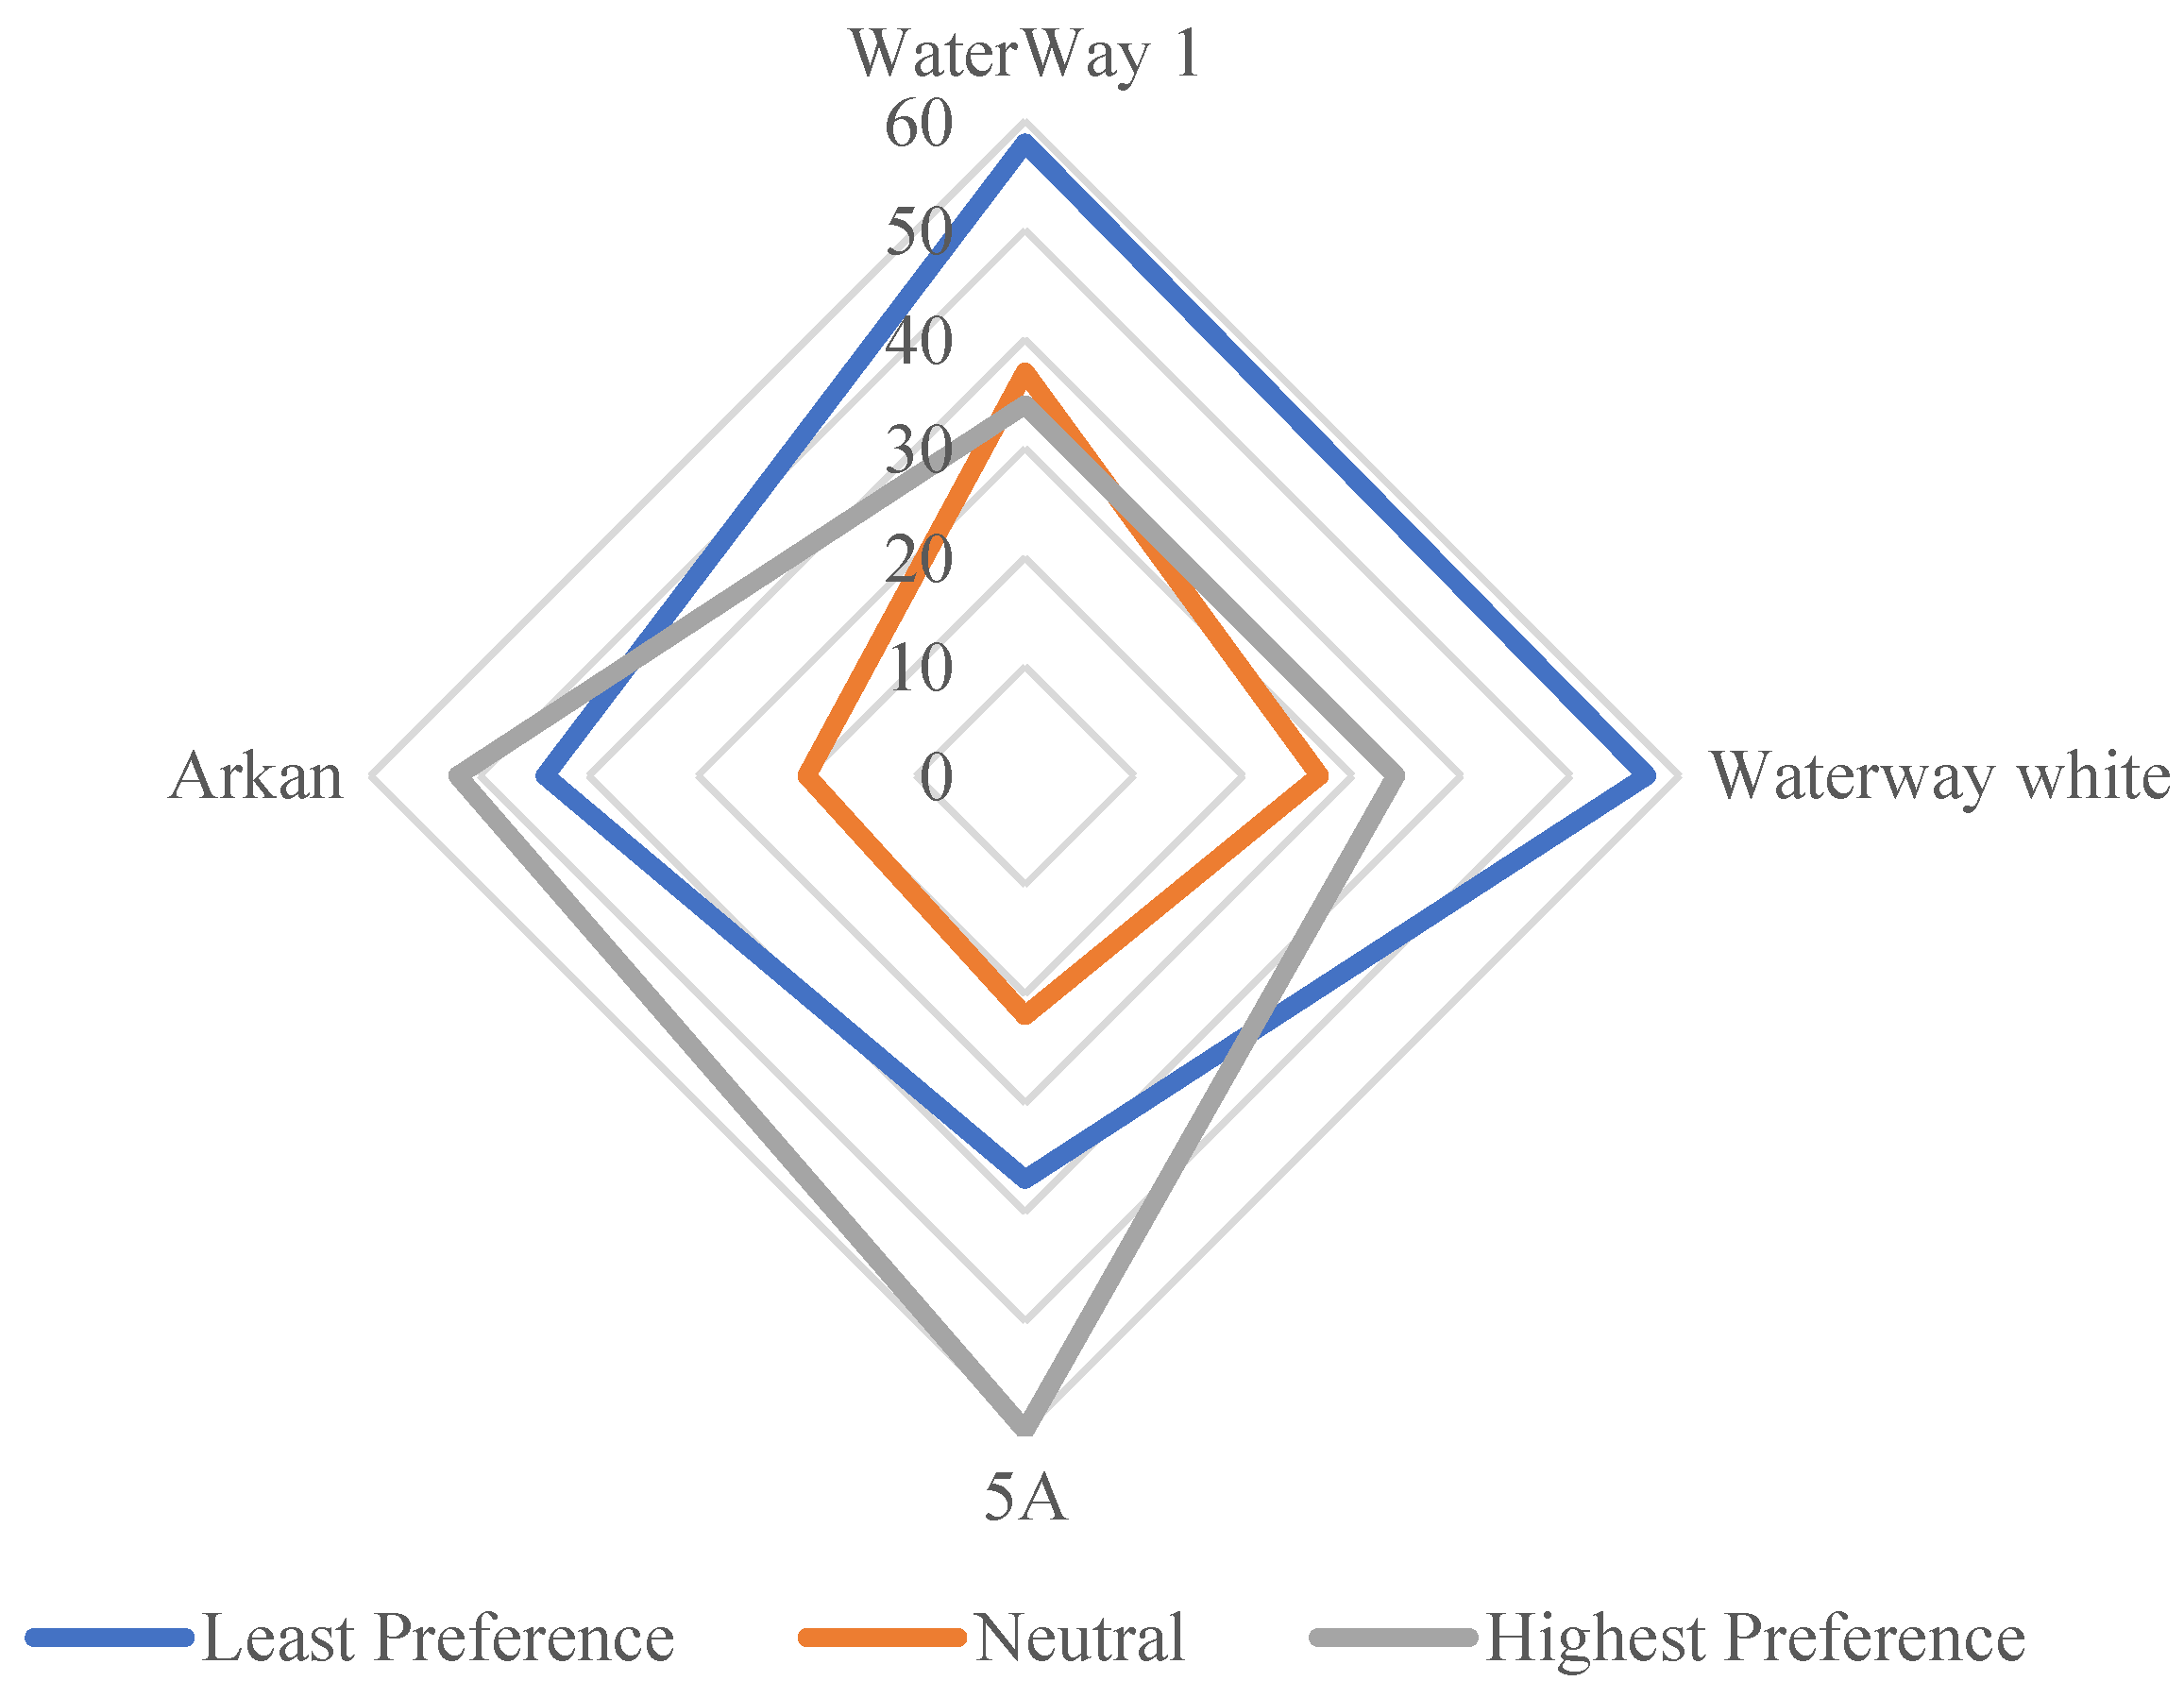
Residents’ location is pivotal in accessing these places; residents living close to the city center are the least going to these nodes, such as Zamalek, Garden City, and Maadi. These areas are relatively far, approx. 25 to 40 km away, in addition to the traffic jam. Residents in the Eastern part of Cairo, as in New Cairo, Heliopolis, and Nasr City, go to “Waterway 1,” “Waterway White,” and “5A” due to the location proximity. Conversely, residents in the Western part of Cairo, Zayed, and October go to “Arkan Plaza.” Our most intriguing finding is that “5A” and “Arkan Plaza” are the preferable nodes, while “Waterway 1” is the least preferable (as seen in Figure 12).
3.1. Activities and Spatial Preferences in GNs
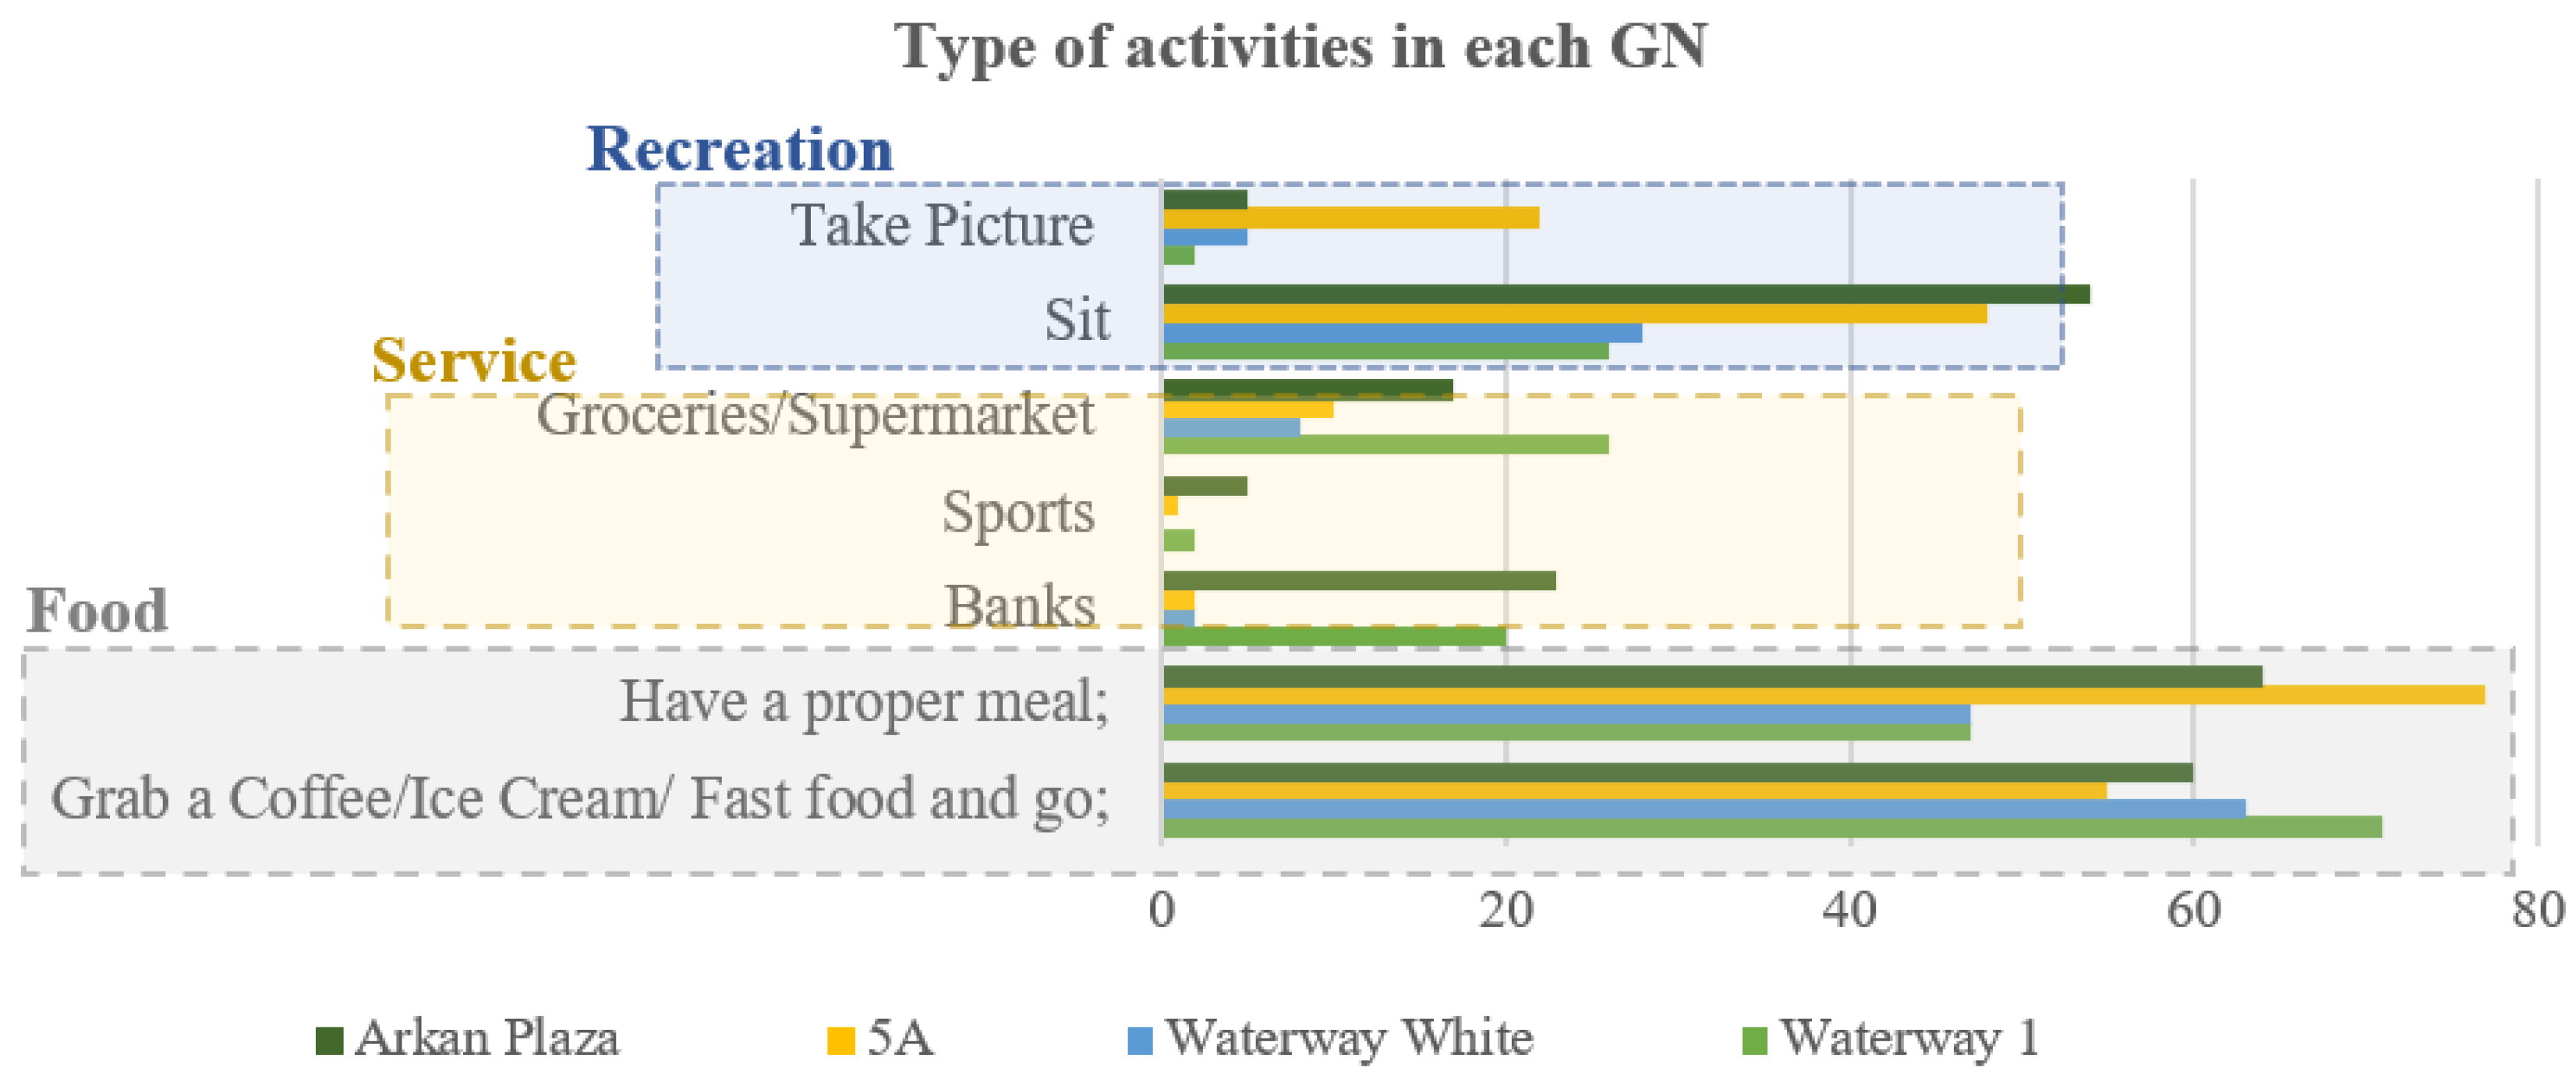
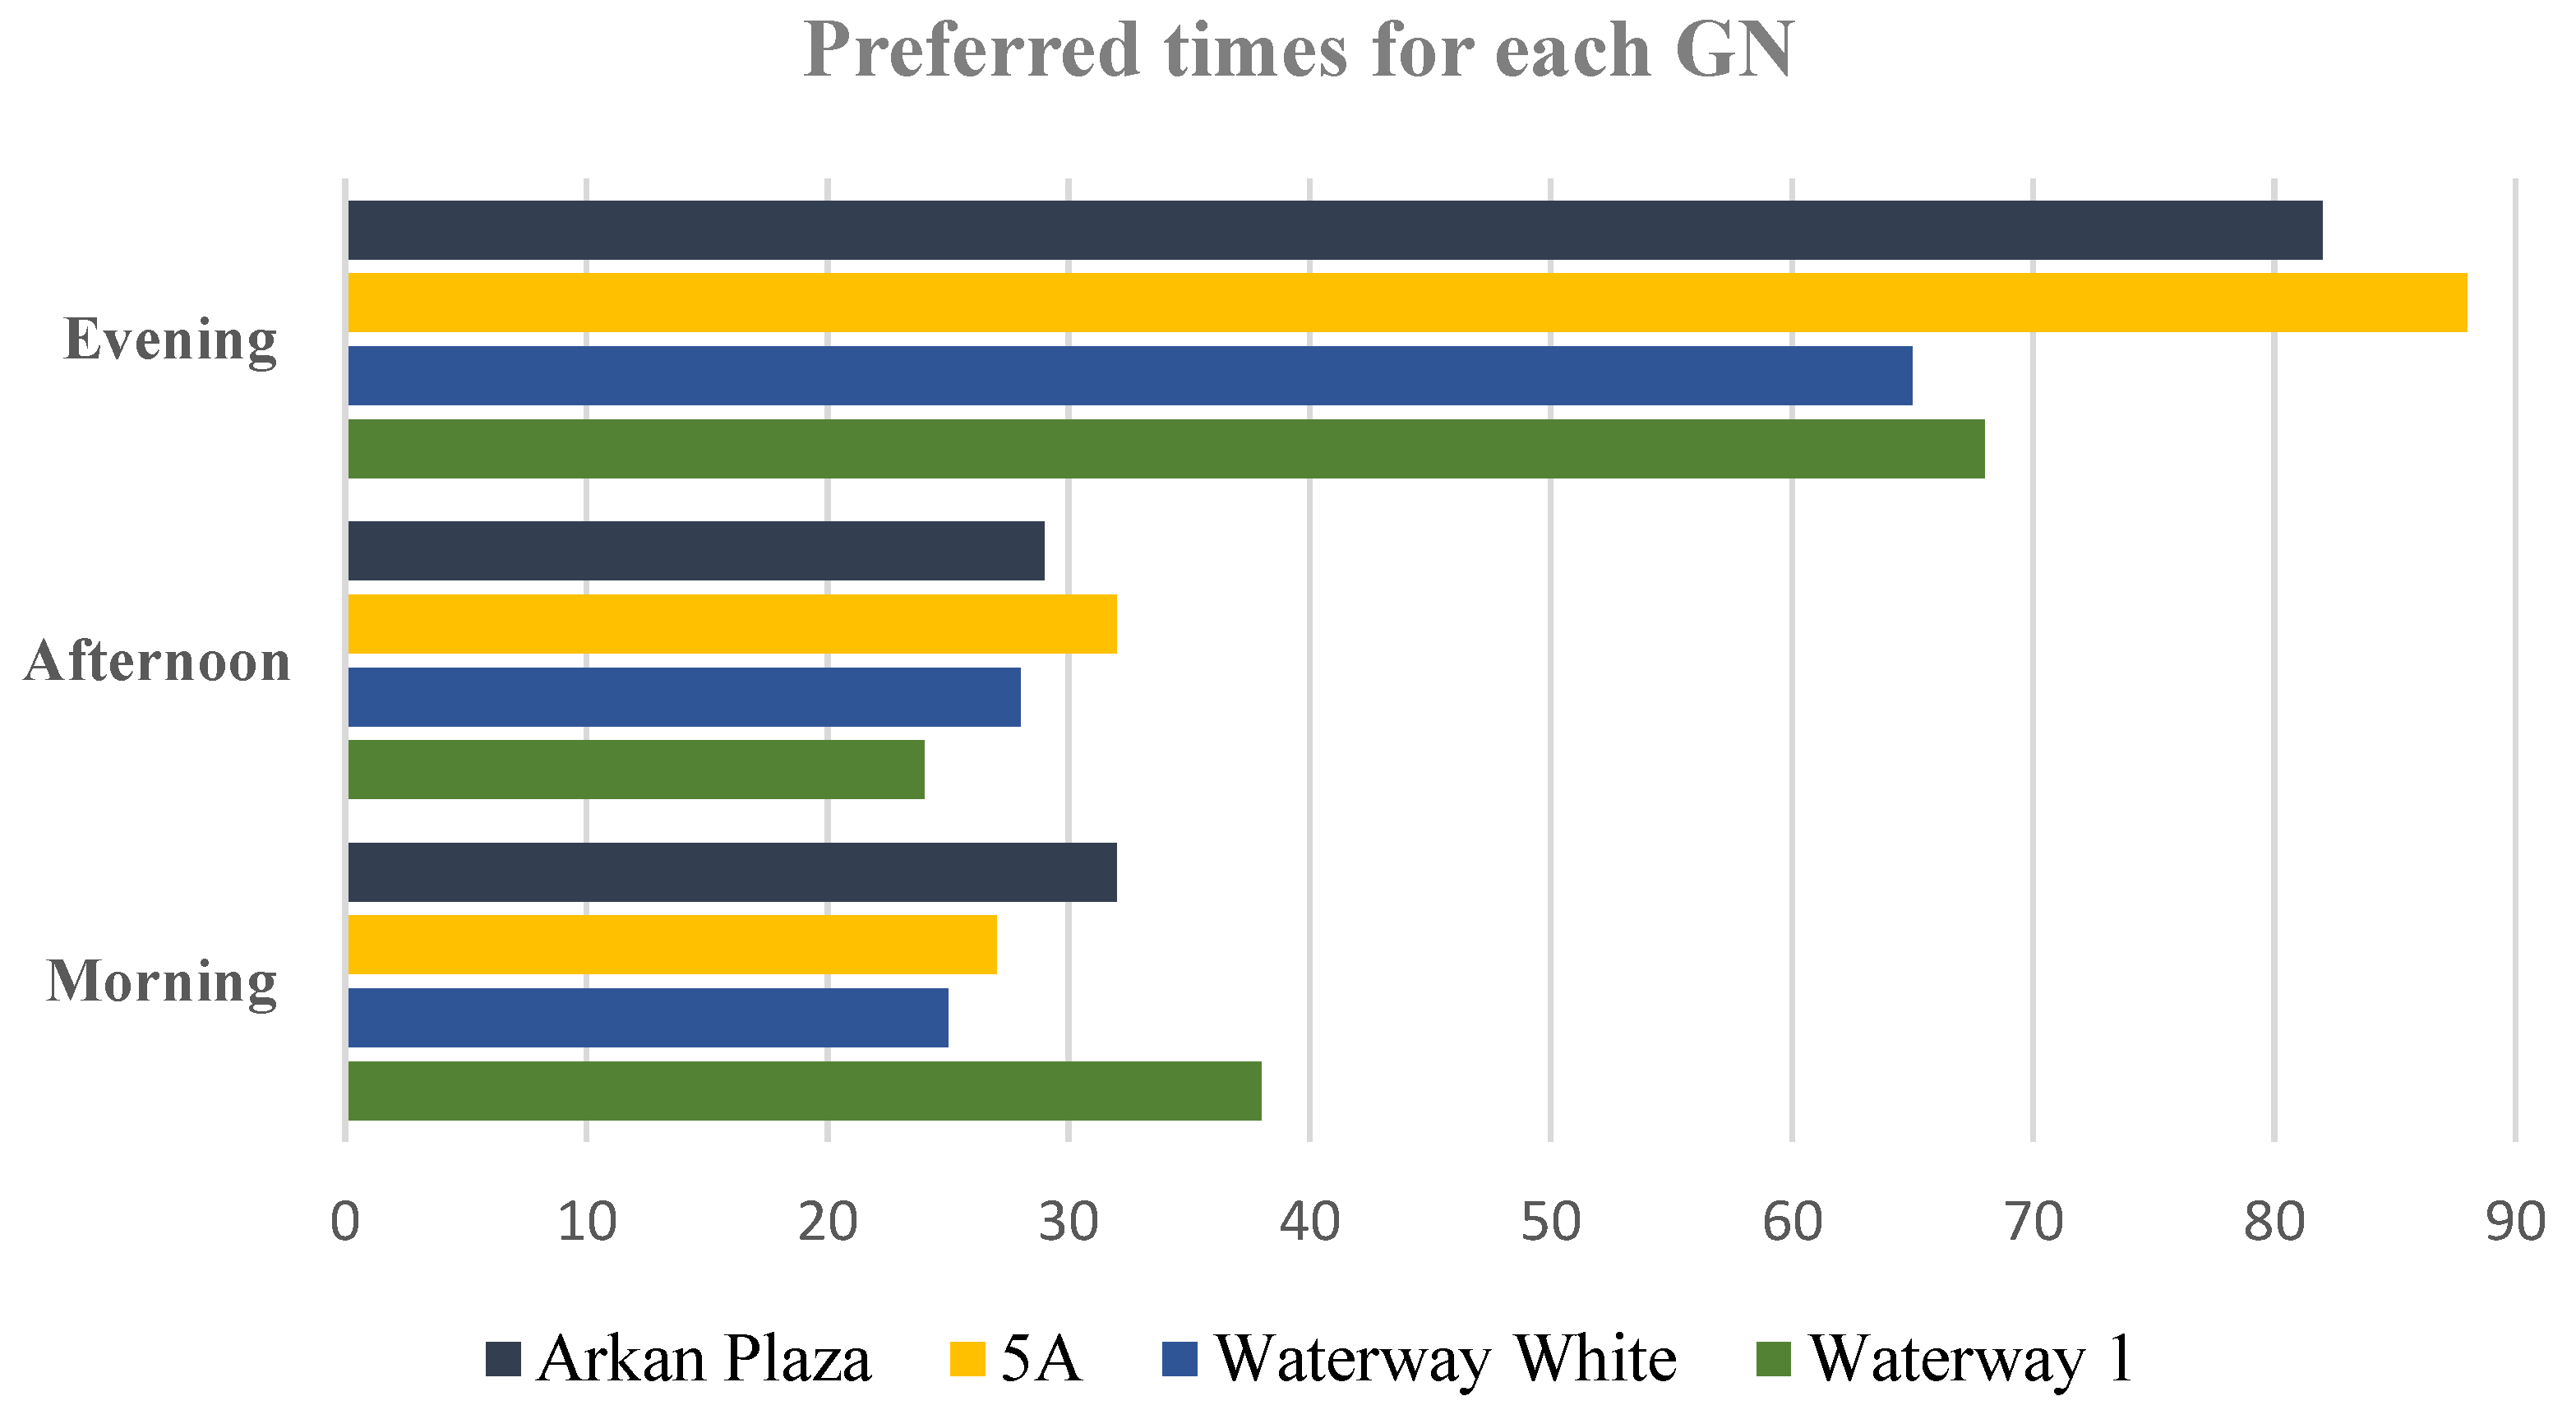
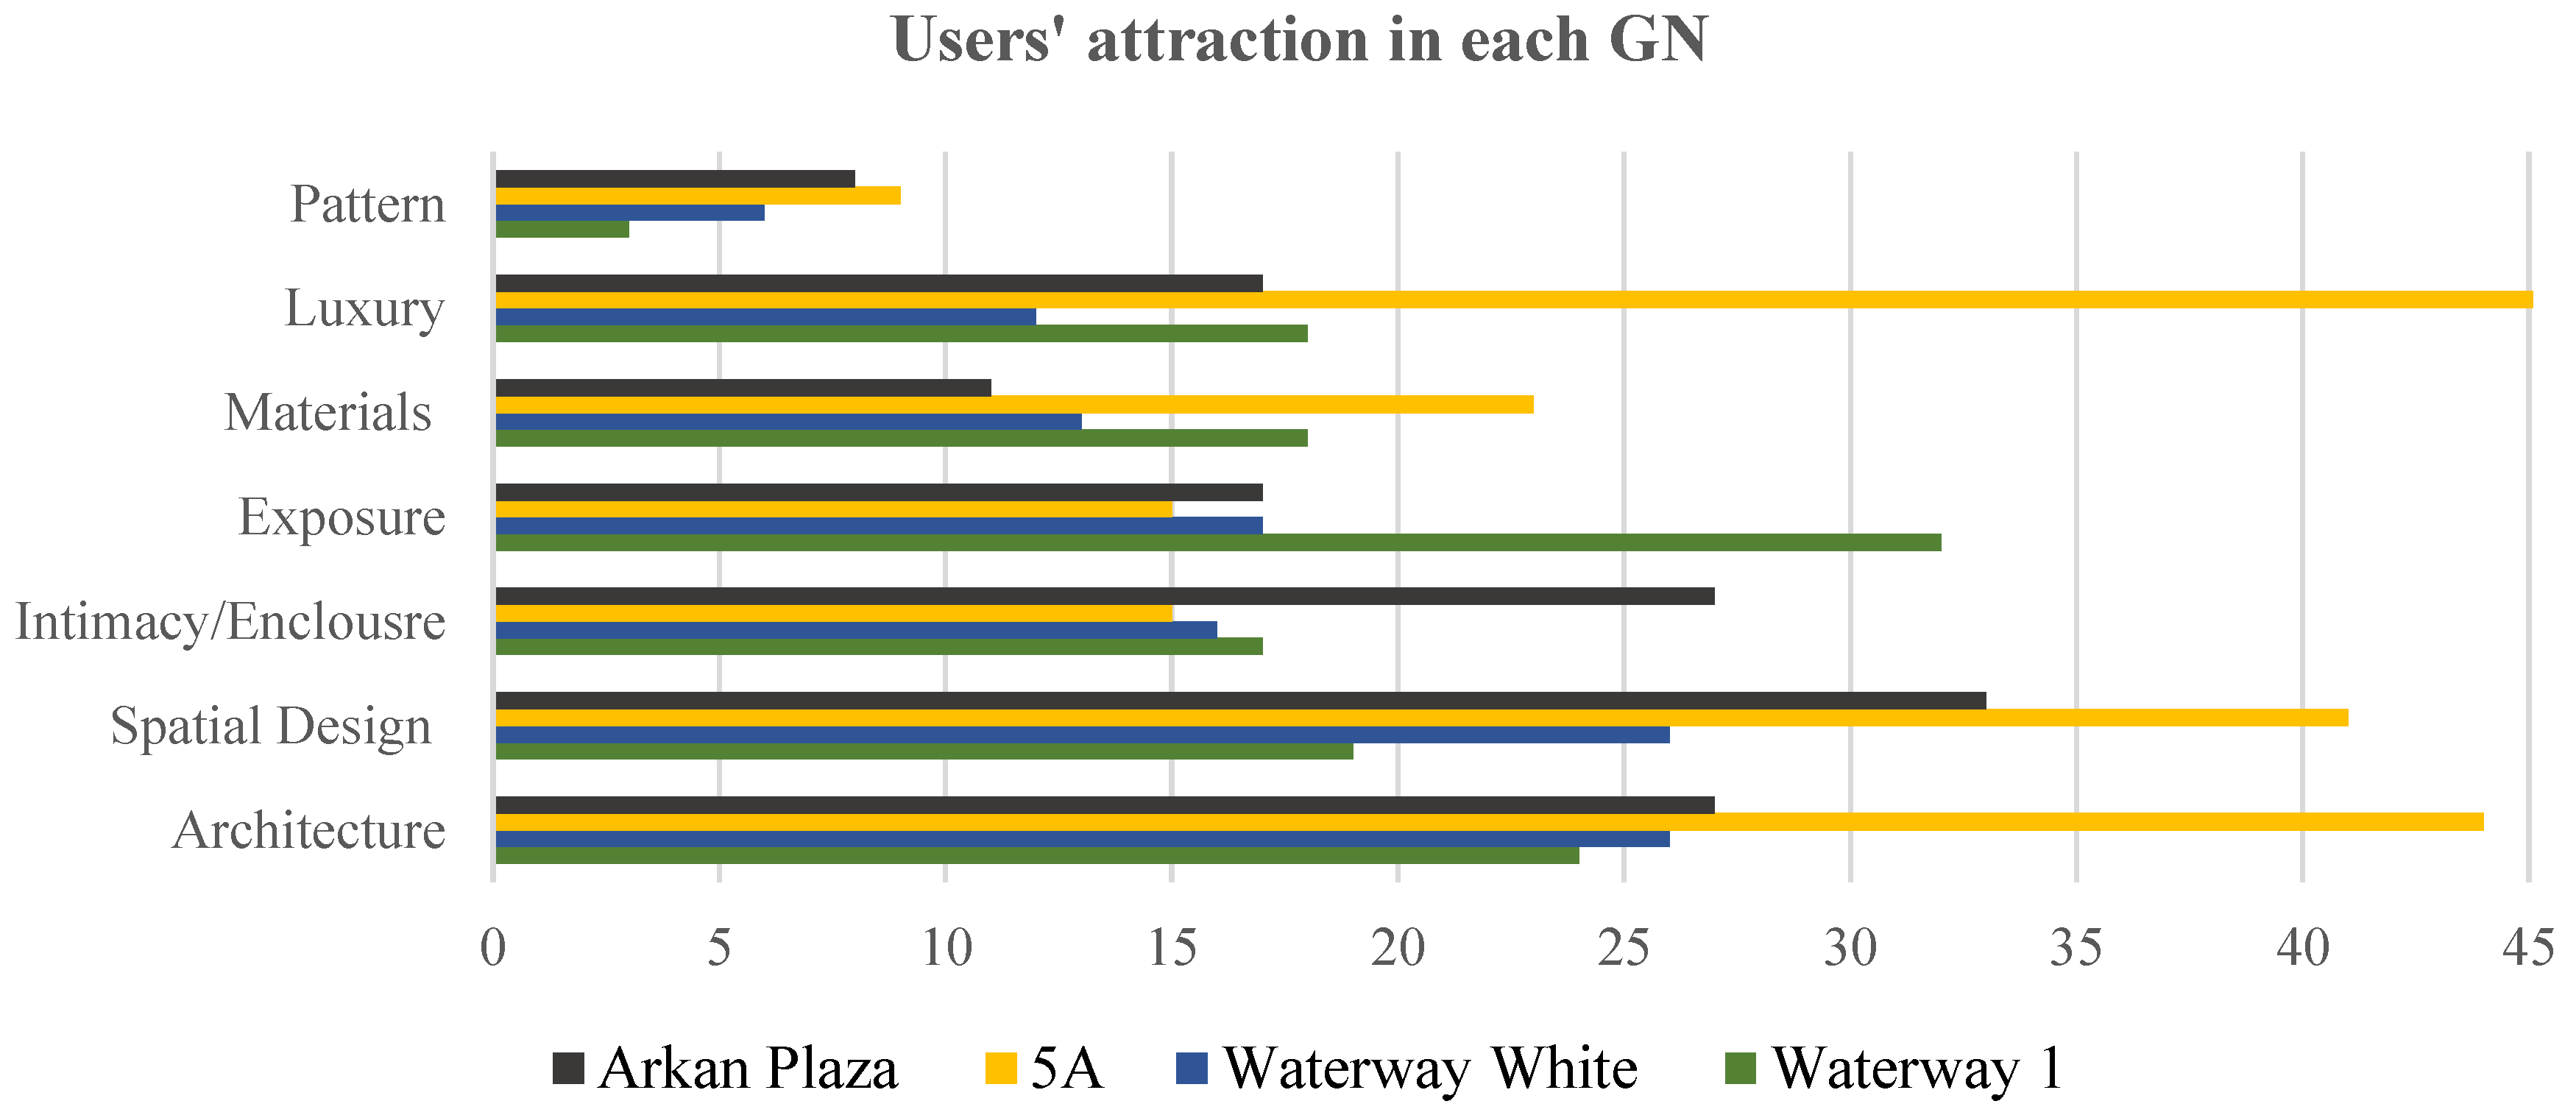
With a closer look at the type of activities respondents perform in each gentrification node “G.N.,” it was found that the majority of users—regardless of the G.N.—go to eat or to drink at restaurants, cafés, and fast-food shops (as seen in Figure 13). Moreover, service providers such as banks, supermarkets, hairdressers, gyms, cinemas, and stationery shops play a leading role in client flow. The spatial design; architectural typology; and its correlated elements such as materials, enclosure/intimacy and furniture, and microclimate design profoundly influence people’s practices within the G.N.s, whether they go to sit, eat, or take pictures, as seen in Figure 14 and Figure 15. Generally, the probability of going to the G.N. in the evening outweighs other timing since it is after working hours and the sun’s radiation is at its lowest.
3.2. Microclimate Correlation with Spatial Design
Incorporating the climatic aspect in the design of outdoor spaces is imperative since it plays a significant role in moderating and mitigating the outdoor microclimate and achieving human thermal comfort, especially in hot arid climates, as in these studied cases [25,26]. Many factors affect the microclimate of the space [46], most notably the buildings with their different arrangement [47], orientation, and height [48]. It is highly correlated with airflow and urban ventilation of the spaces [49], solar irradiance change [50], temperature ranges [25], and humidity [48].
This work focuses on the effects of solar radiation as it is the main contributor to elevating the radiant temperature, affecting the human comfort level in outdoor environments [50]. For this, the temperature ranges, solar radiation, and shade were the decisive aspects that were analyzed since they affect human thermal comfort in addition to the other microclimatic variables that support the results and main findings.
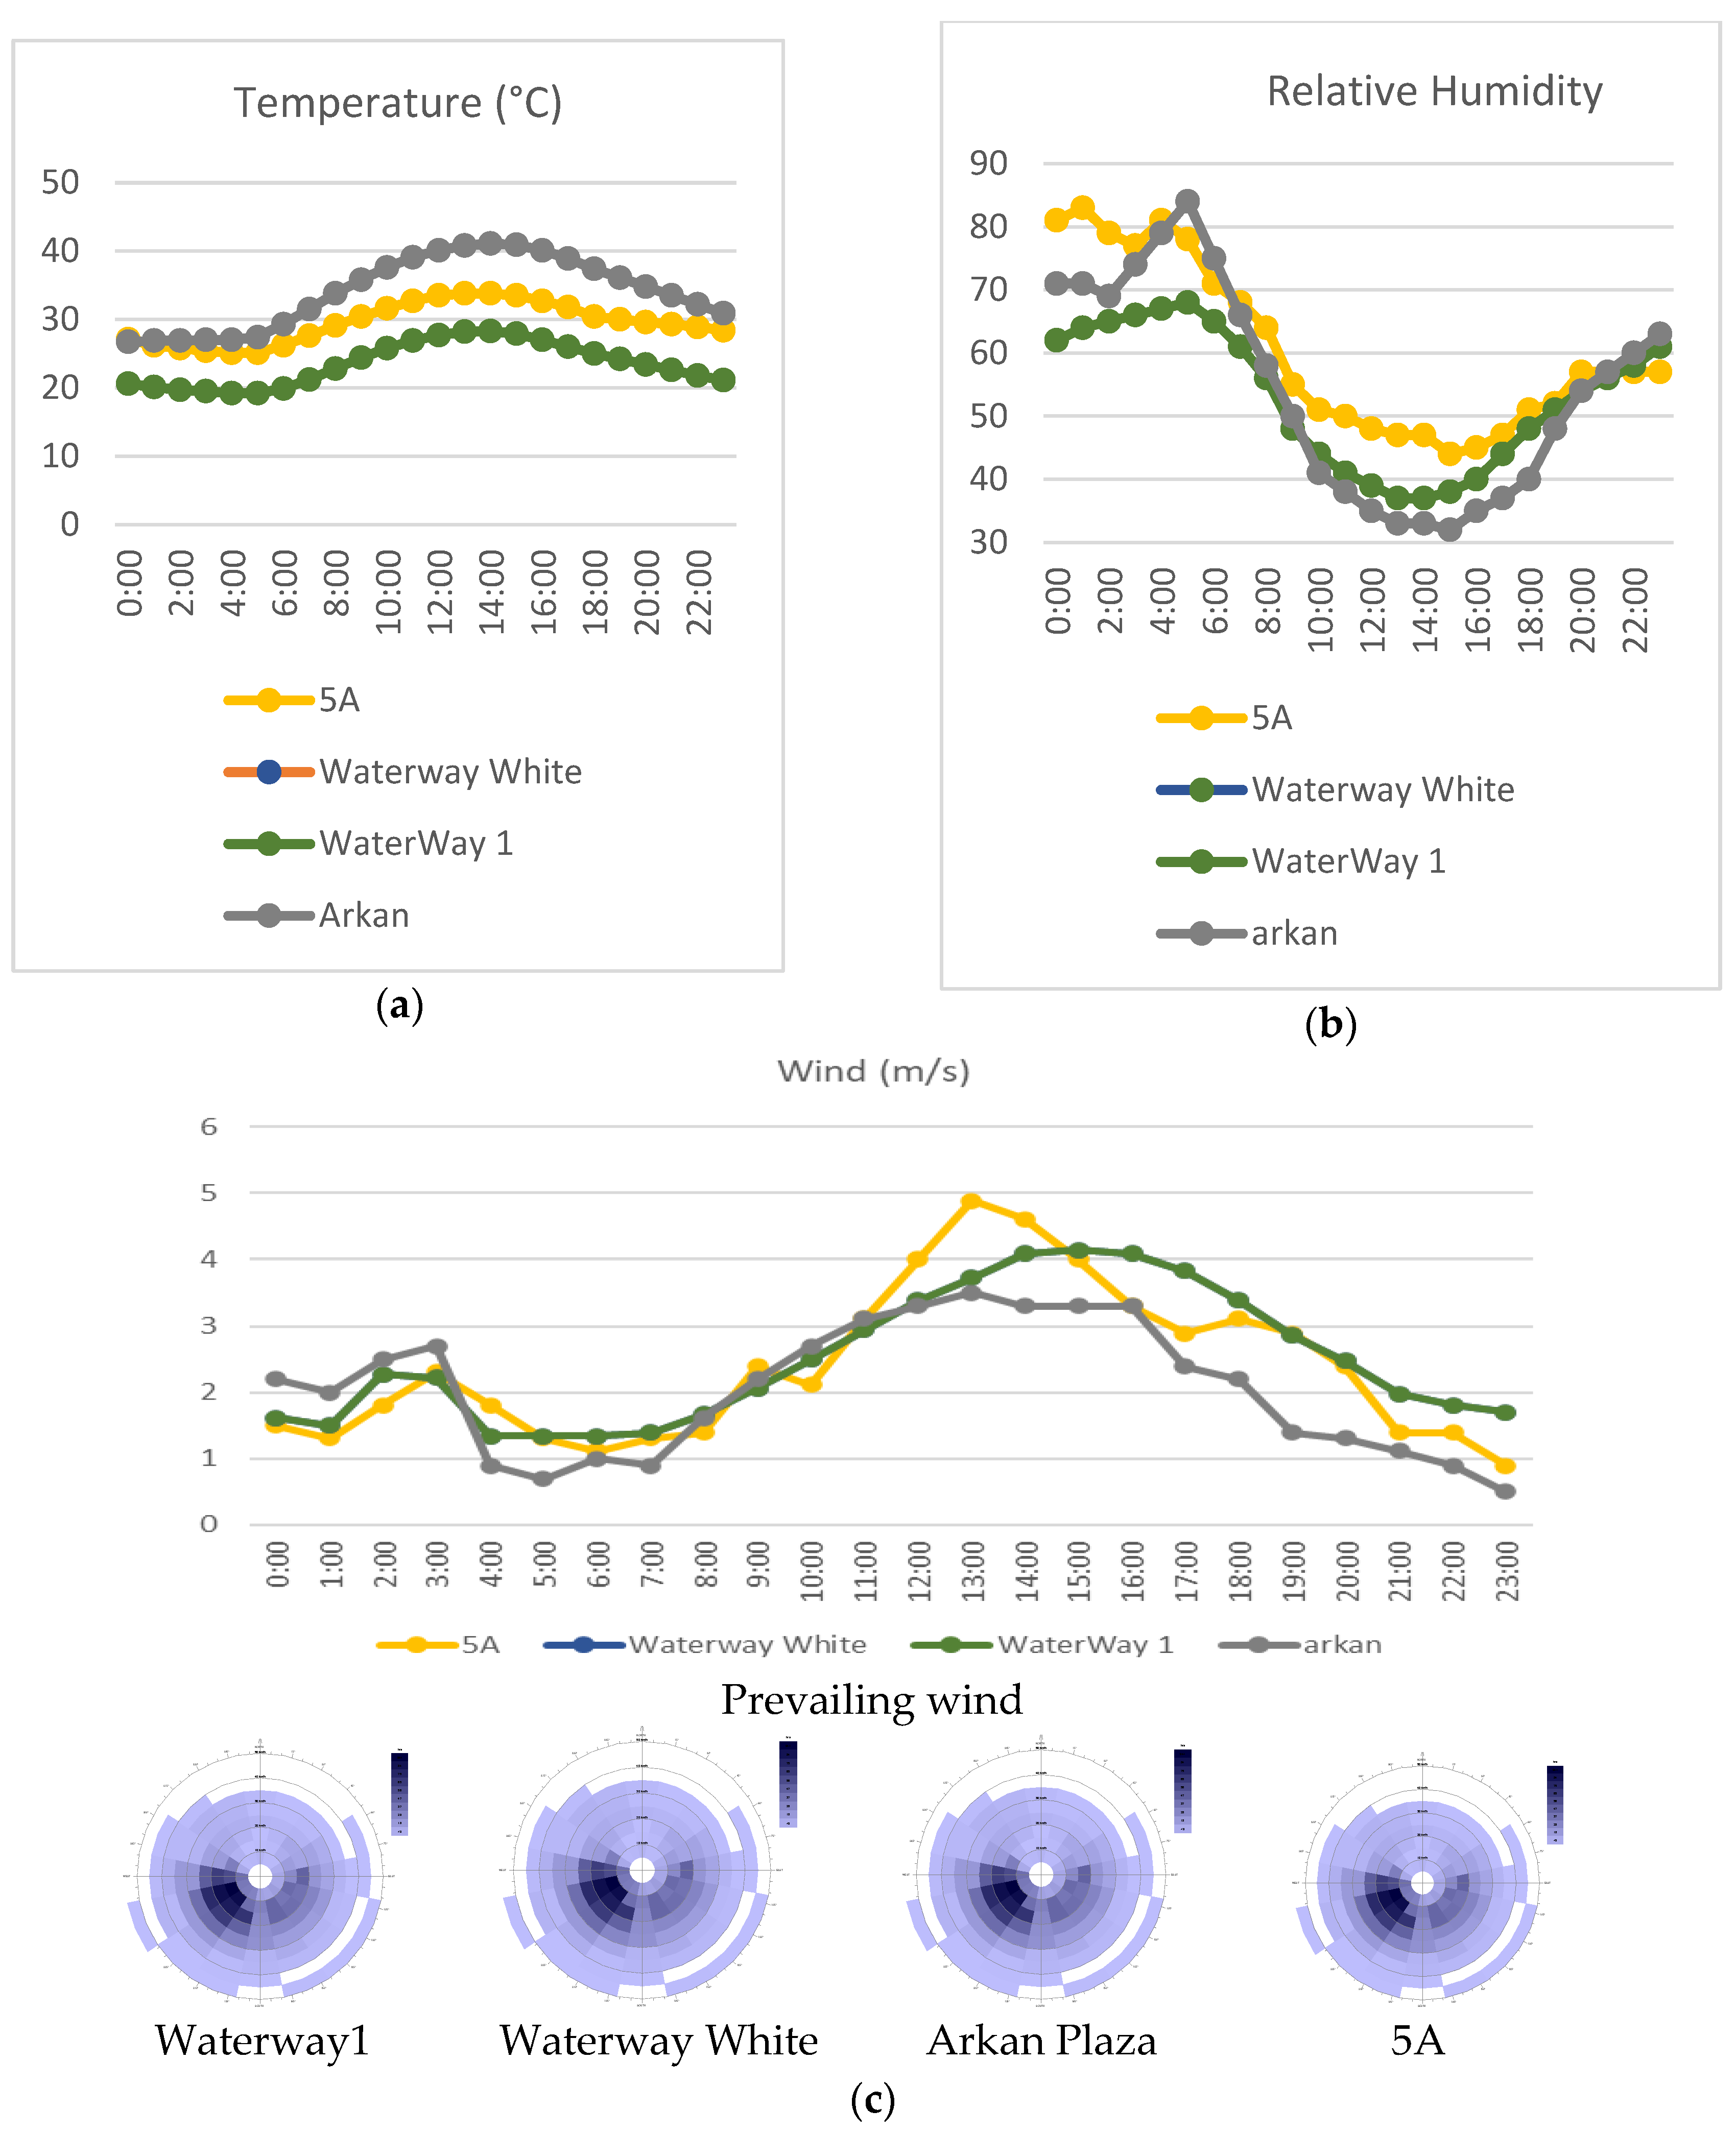
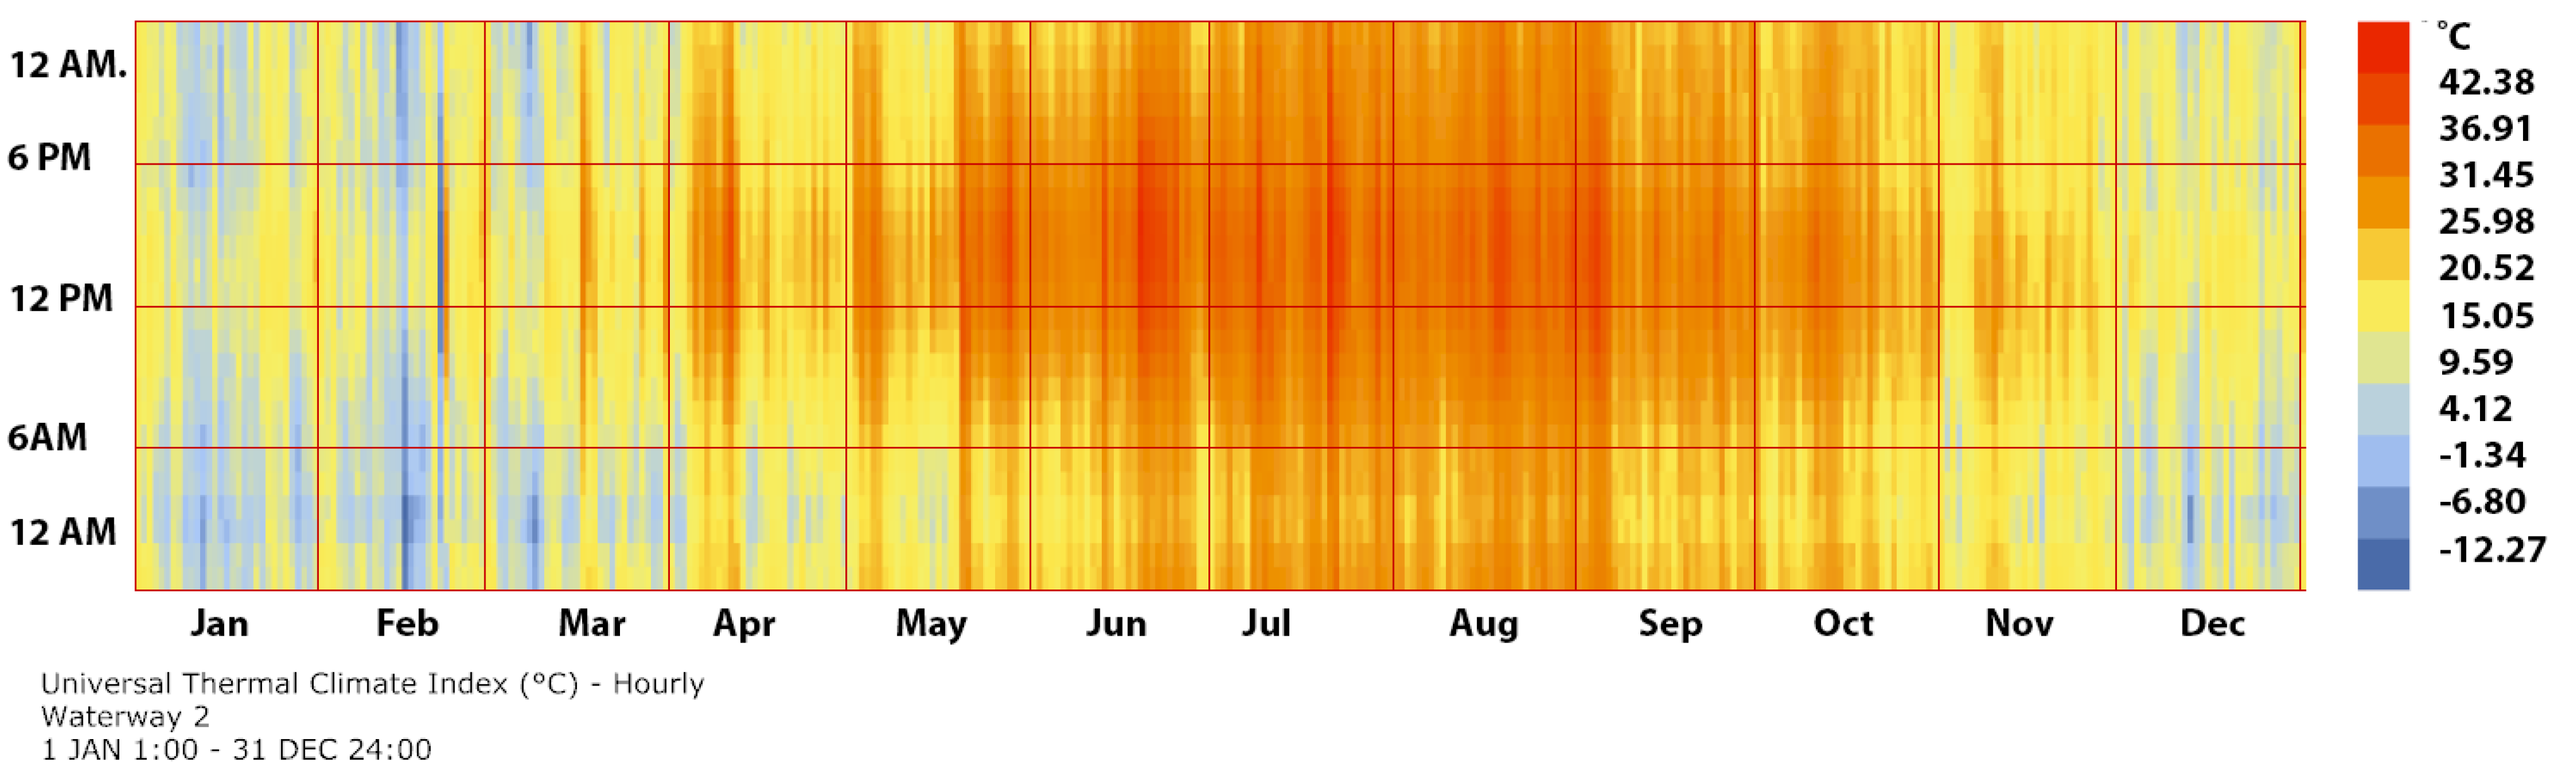
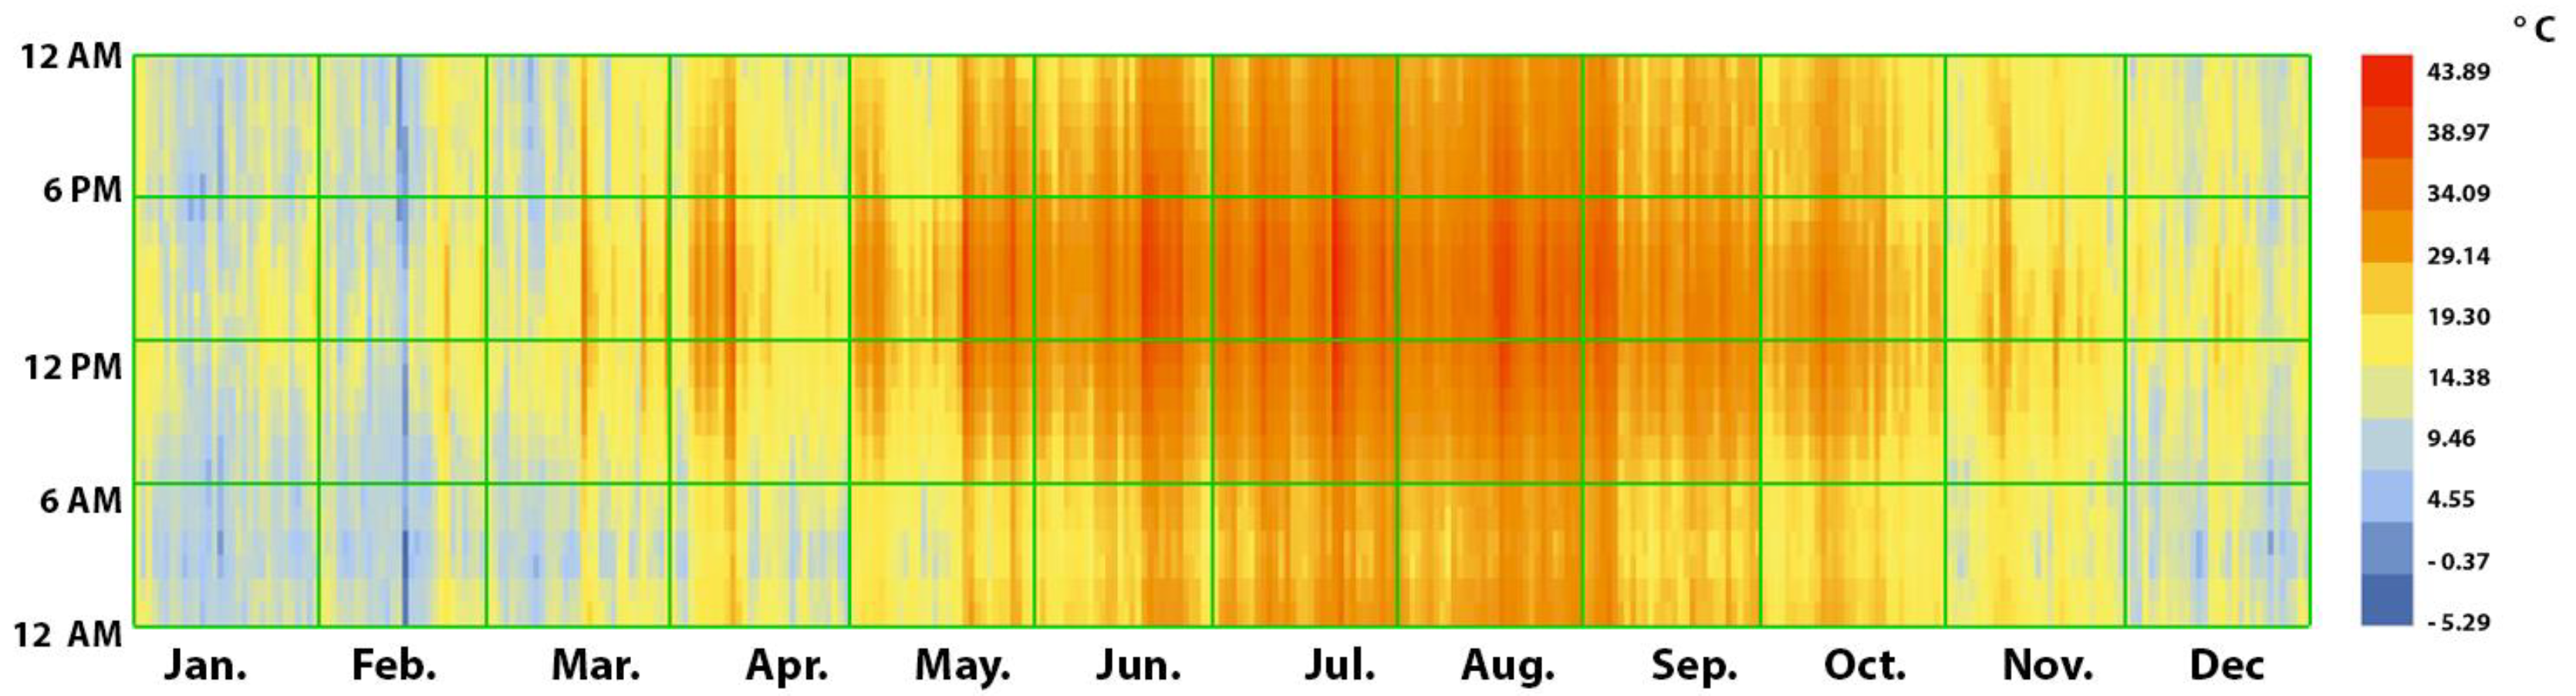
Figure 16a shows that temperature ranges along the day. Arkan Plaza recorded the highest differently than Waterway 1 and Waterway White. At midday, the temperature was recorded at 40 °C, 35 °C, and 30 °C at Arkan, 5A, and Waterway 1 and White, respectively. The temperature change was due to the location; however, 5A recorded the highest temperature record compared to Waterway 1 or Waterway White. The temperature difference was in the morning with the same magnitude of 5 °C. In this sense, different factors contributed to temperature increase, such as the albedo of the surrounding materials [51]; the intraurban fabric [52]; wind flow [26]; and radiant temperature [53]. In the evening timings, temperature ranges at 5A and Arkan were nearly the same, while the Waterway recorded the lowest at 25 °C.
The wind flow in the four Nodes is light to calm according to the Beaufort scale [54]. The prevailing wind is nearly the same in all the G.N.s (see Figure 16c). The airflow intensifies midday, reaching its peak and decreasing in the evening. A strong correlation was witnessed between the building’s orientation, prevailing wind flow, and temperature ranges [55]. In “Waterway 1,” although the building strip is oriented towards the north-south, the wind flow blows, resulting in decreased heat wave patterns. Similar to “Waterway White,” the building fronts are clustered and oriented towards the east–west direction, where the outdoor terraces are exposed to breeze wind. This setting initiates a comfortable setup; however, radiation is high. In contrast, “Arkan’s” building orientation and height permit the airflow to reach the inner space (see the case choice section).
For the landscape design, it is worth mentioning that the architect suggested different types and sizes of plants as he aimed to enhance and improve the microclimate between buildings in the project. Nevertheless, during the project’s execution, due to conflicts and logistics, the original plan is not implemented. Nevertheless, we focused on spatial design and building arrangement.
3.2.1. For G.N. 1: Waterway 1
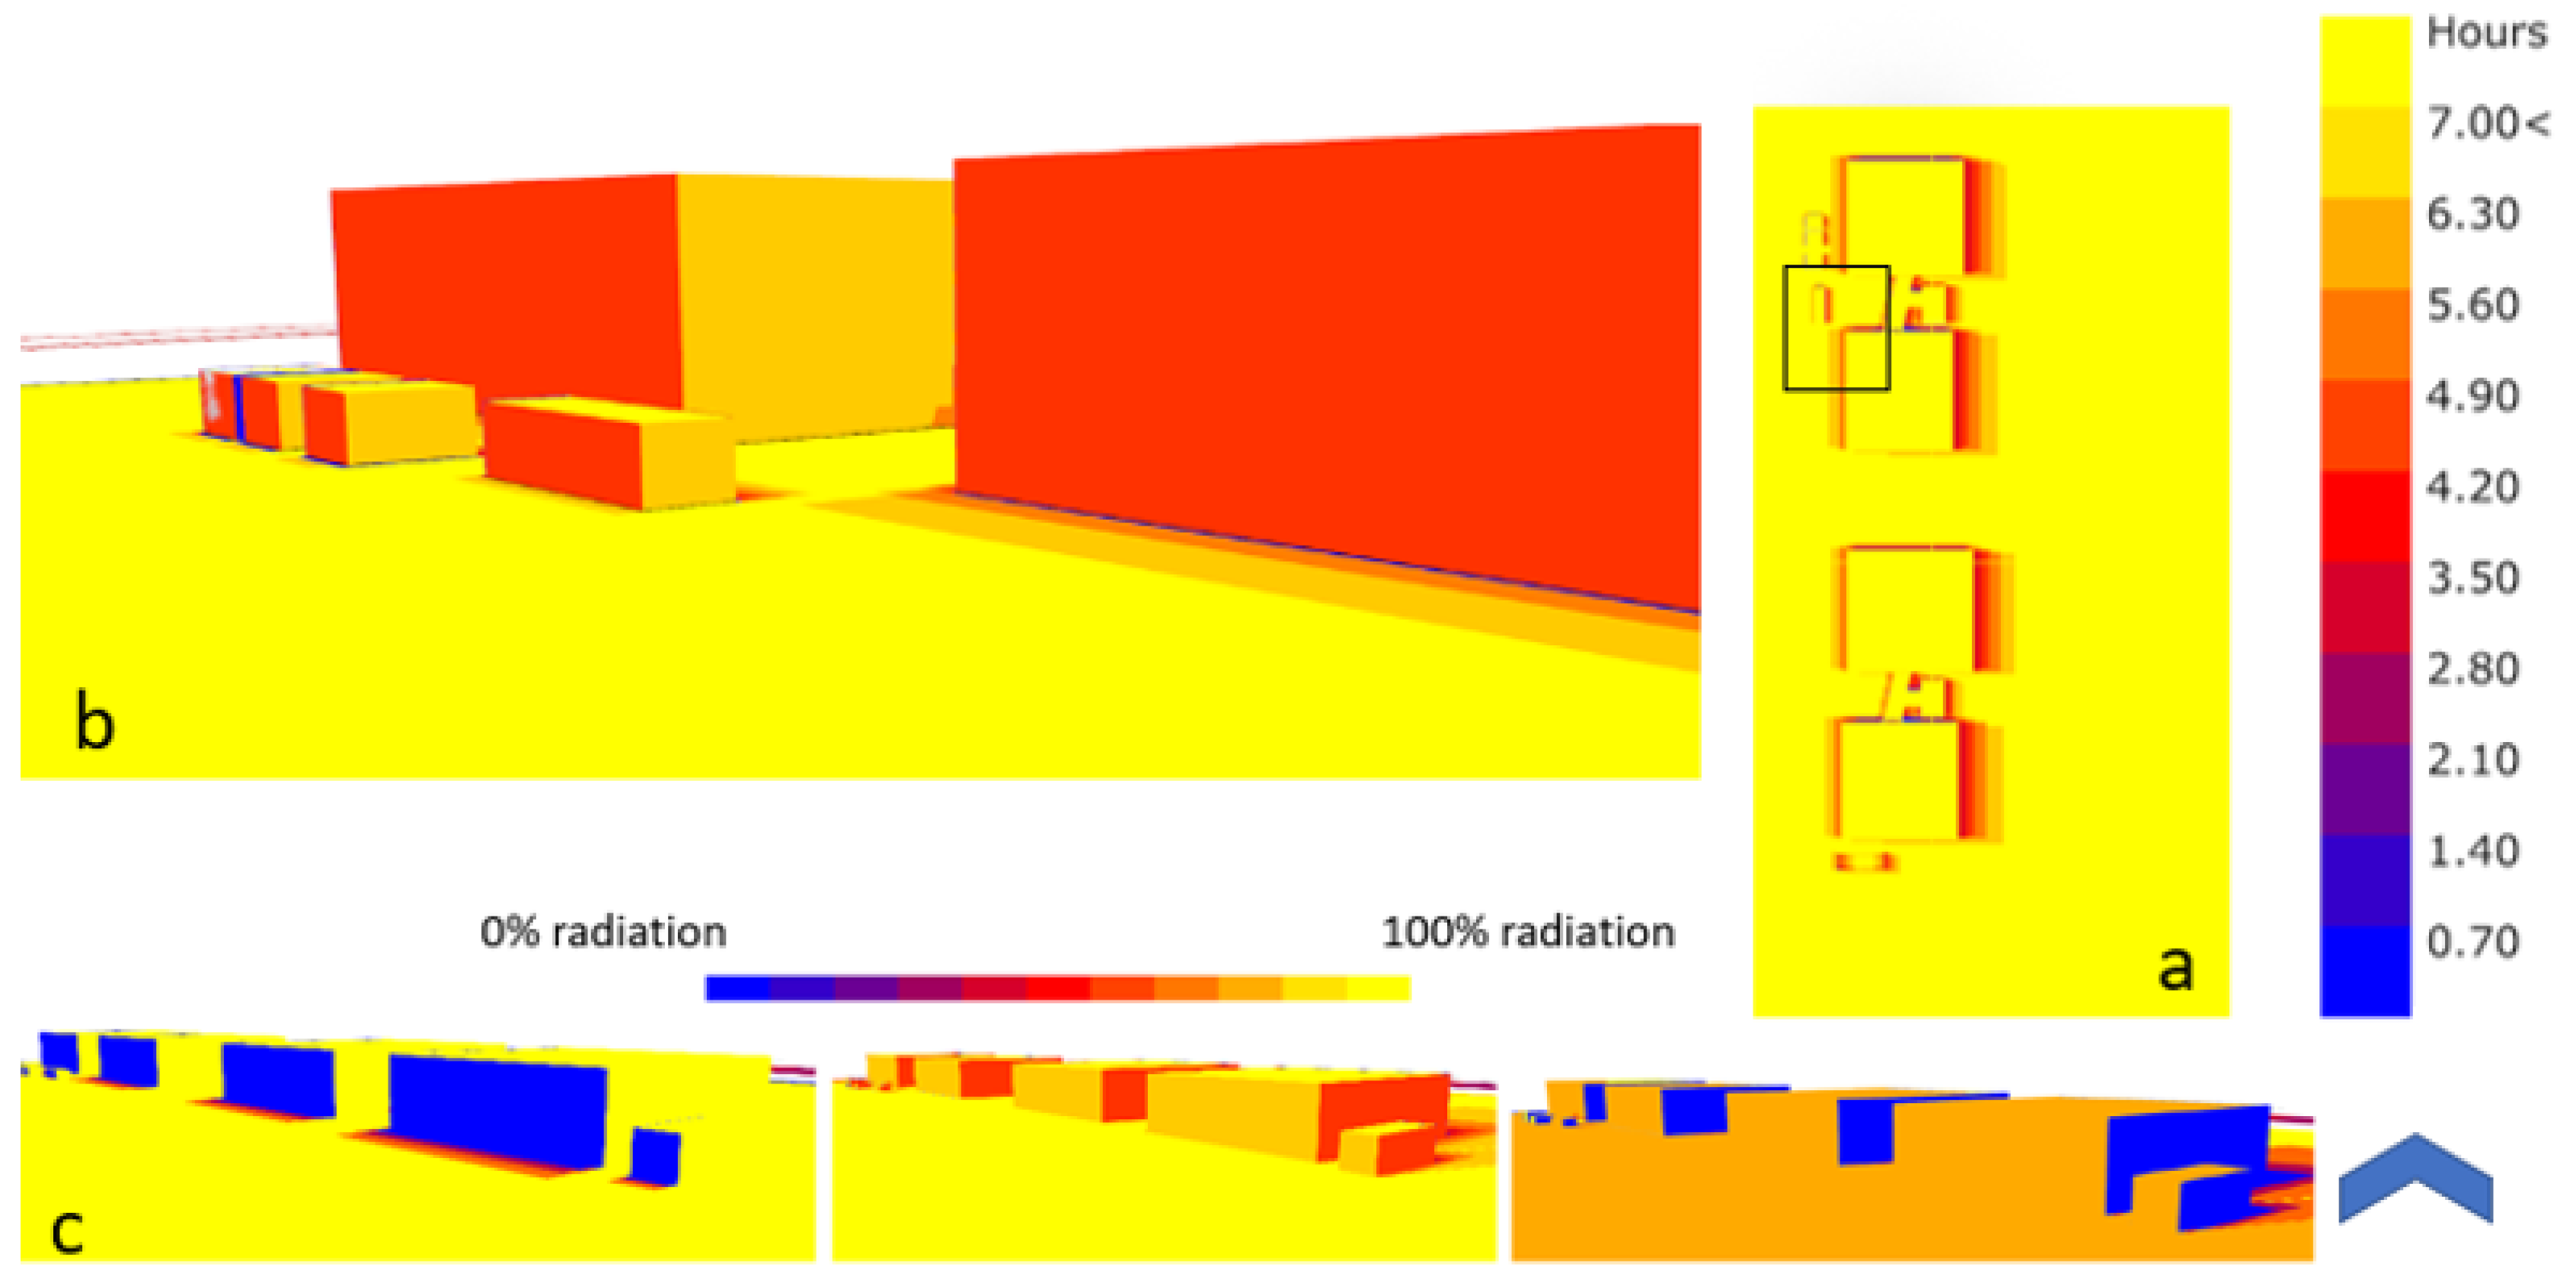
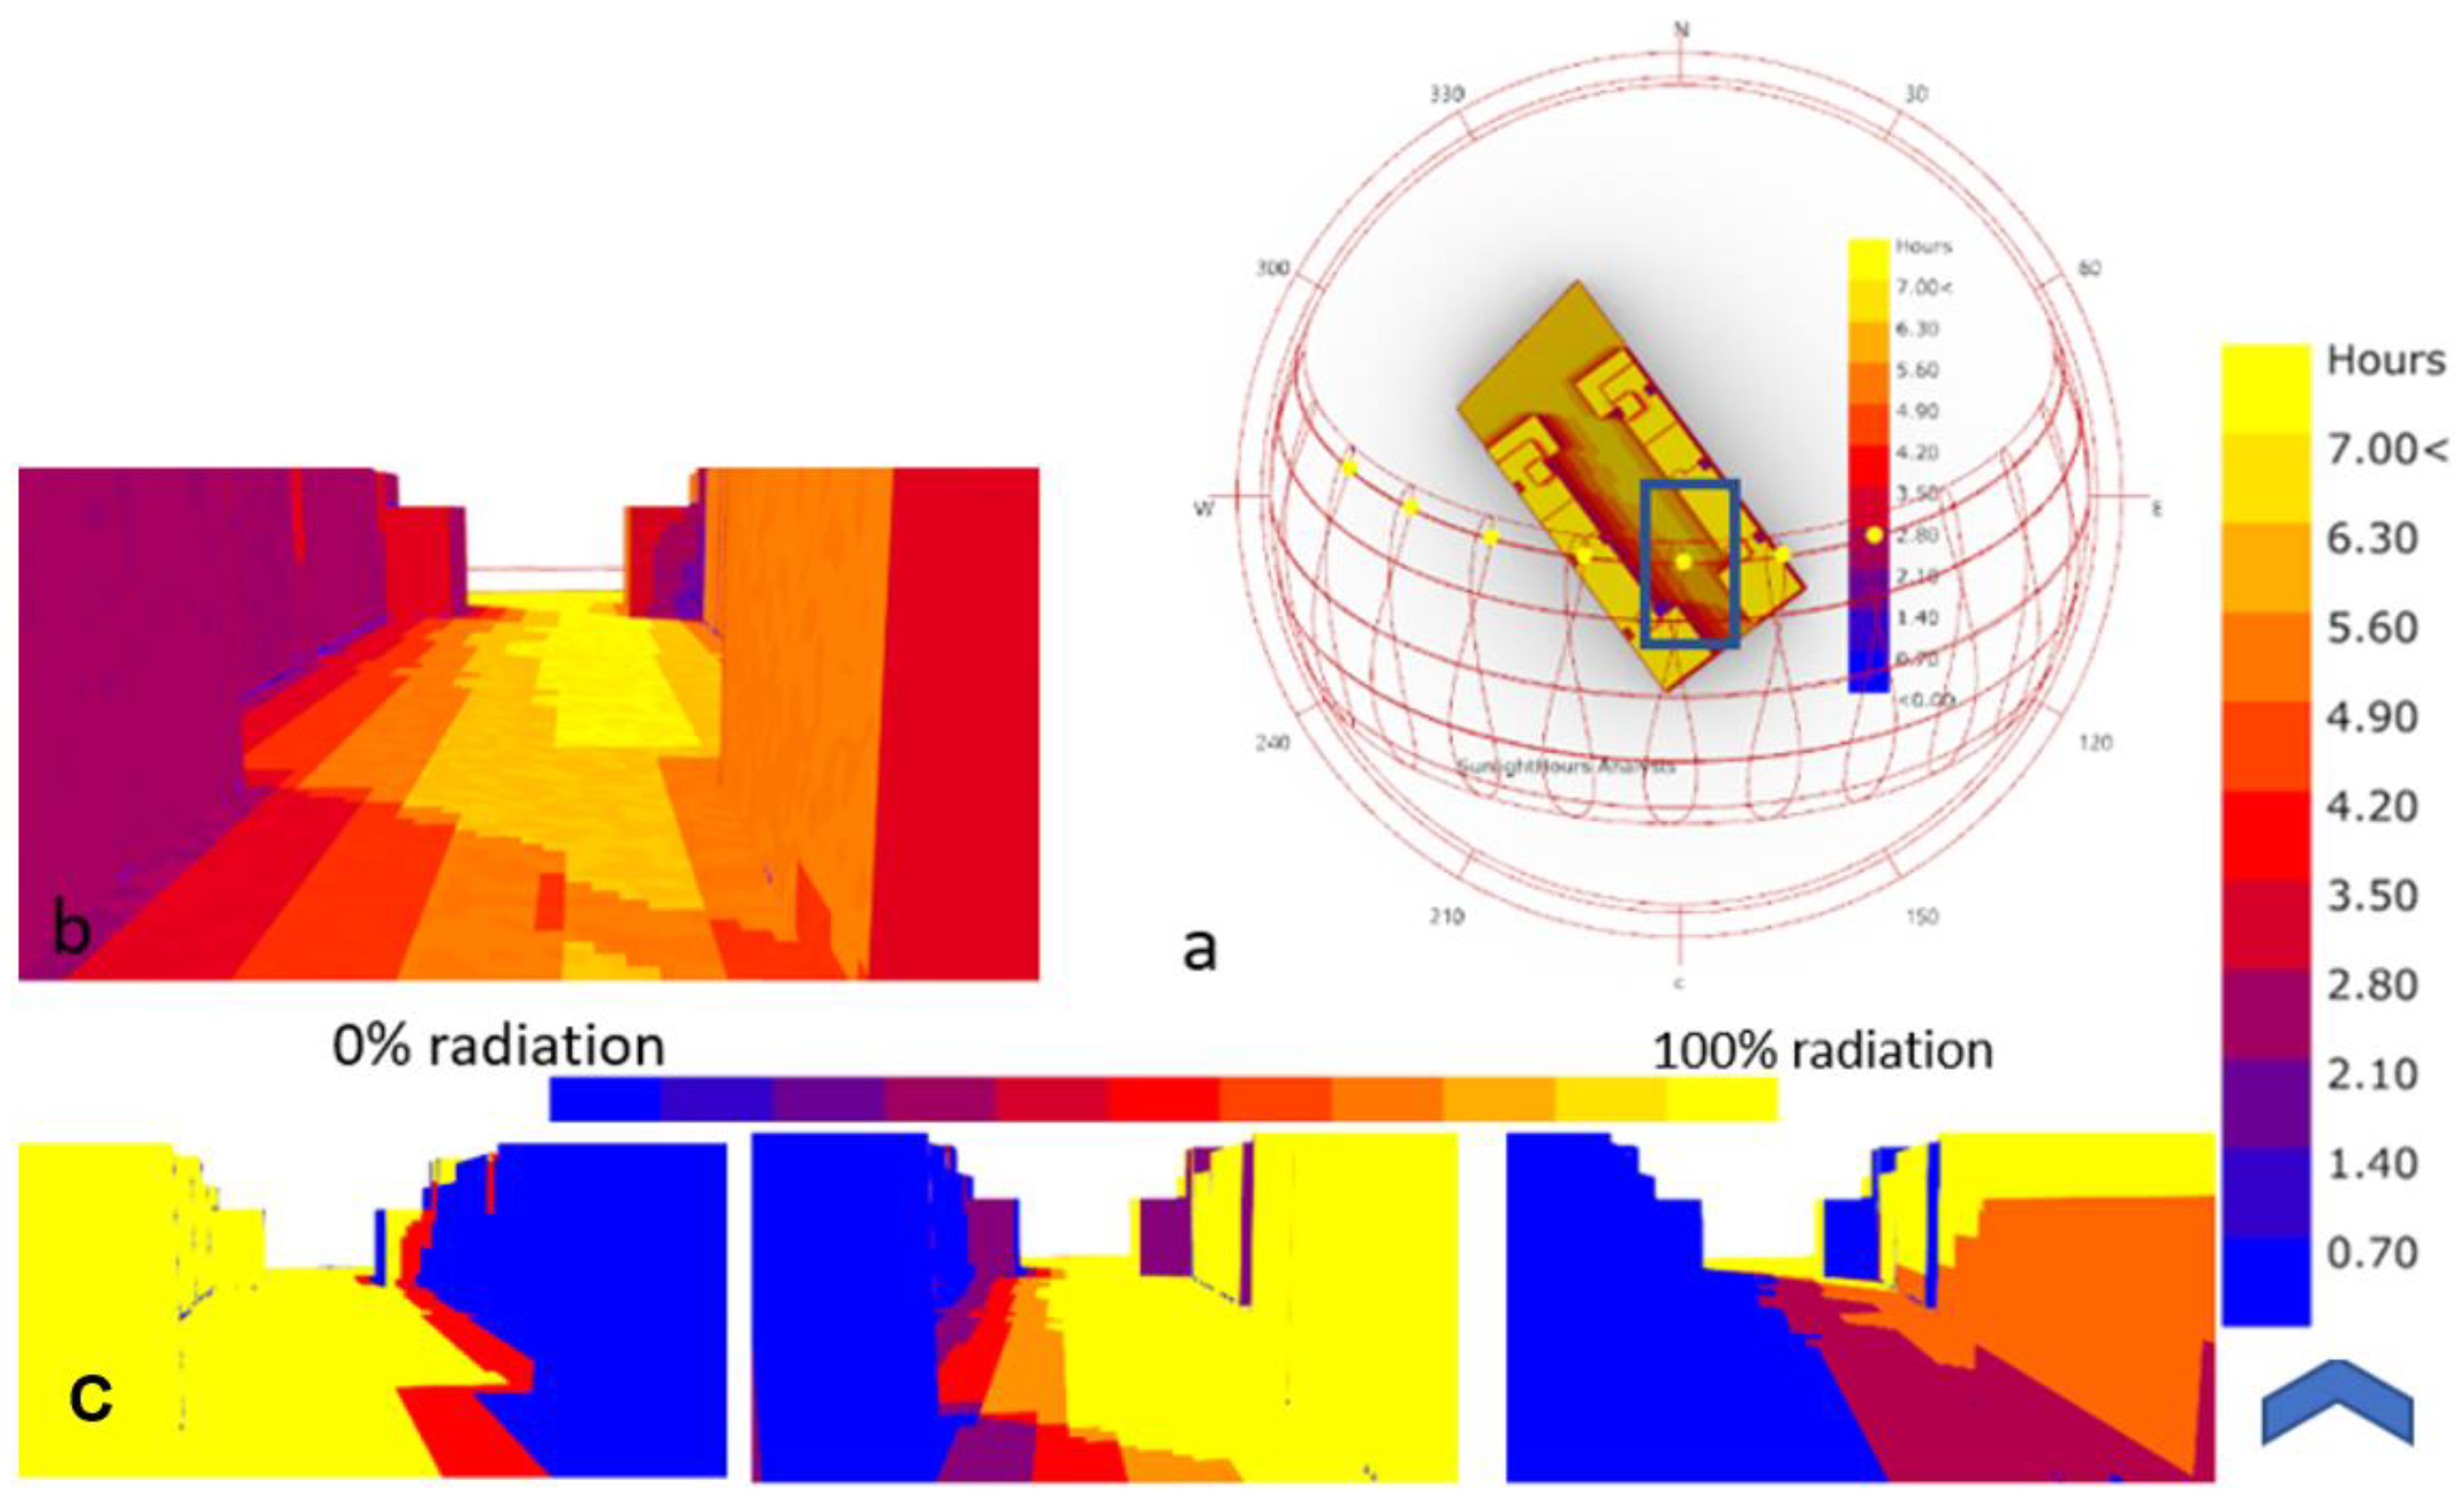
This strip mall, located in the eastern part of Cairo, is believed to be the oldest among Waterway White and 5A nodes in the New Cairo region. Most users who come to this area prefer eating fast food or sitting at a cafeteria rather than having a proper meal. The buildings are arranged on the N.S. axis, giving the highest prospect of solar radiation of magnitude 220 kWh/m2 to fall on the usable outdoor spaces and the building’s western façade, as indicated in Figure 17 and Figure 18. From the generated weather file [35] and calculation, the UTCI index indicates high thermal discomfort since users are exposed to direct radiation during the analysis period. However, the temperature ranges and the wind record were the lowest among the other nodes. Moreover, the presence of asphalt surfaces, albedo = 0.2, in the parking area contributes towards increasing the surface temperature of magnitude 2 to 3 °C. Together, these parameters are the contributing factors to high thermal discomfort. This finding is consistent with what was previously discussed by [21,25,26] in the Egyptian context.
According to the questionnaire, most users prefer to go to “Waterway 1” between 16:00 and 23:00 more than in the morning (9:00 to 12:00), and the lowest preference is at noon from 12:00 to 16:00. These findings could be interpreted unequivocally through the simulation results shown in Figure 18. A receptor area was investigated, marked in blue (Figure 18a). Its location is on the right side of the north–south facade, which typically accommodates outdoor activities, yet the side is exposed to direct radiation for almost 7 h/per day, resulting in uncomfortable climate conditions [46]. Moreover, Figure 18c simulates the percentage of the radiation falling on the façade and its adjacent space. This finding justifies why users prefer going in the morning and the evening rather than at noontime. Although the temperature and wind records are good, sun shield plays a more significant role in human comfort [56].
Even though the outdoor space has a poor microclimate, especially in the noon, users prefer to go to this place as it offers a wide variety of services and uses aimed at B clientele, which constitutes a significant segment among consumers in Egypt [57]. In such a linear strip, it is recommended to consider the albedo of the surrounding materials and fixed light structure to promote better space quality [55].
3.2.2. GN2: Waterway White
Although “Waterway White” is a linear development as “Waterway 1” and the analyzed metrological data are nearly the same, the usability of the space in “Waterway White” is more during midday (12:00 to 16:00). This is most likely caused by the buildings’ linear orientation along the east–west axis. Despite the south-facing façade and interior areas, the useable outdoor space receives the least radiation. This is due to the façade’s mass orientation, which eventually permits direct radiation to reach these areas and the direction of the predominant wind. The numbers below show this clearly, when direct radiation falls on the region for 5 h (see Figure 19).
Consequently, a higher level of human comfort may be plainly seen (Figure 19b). In the winter mornings, it is anticipated that space users would visit “Waterway 1” and “Waterway White” and feel at ease. In this context, building masses have a significant impact on shaping the microclimate [55].
As “Waterway White” offers another variety of services, users would also go during midday because of the relative thermal comfort compared to “Waterway 1.” This G.N. is also attractive because of its social resilience. Since its creation until now, Waterway White is still preserving its spatial identity and the socioeconomic status of its clientele. This may be due to the location proximity to the American University in Cairo, the offered services, and the attractiveness of its spatial organization.
3.2.3. GN3: 5A
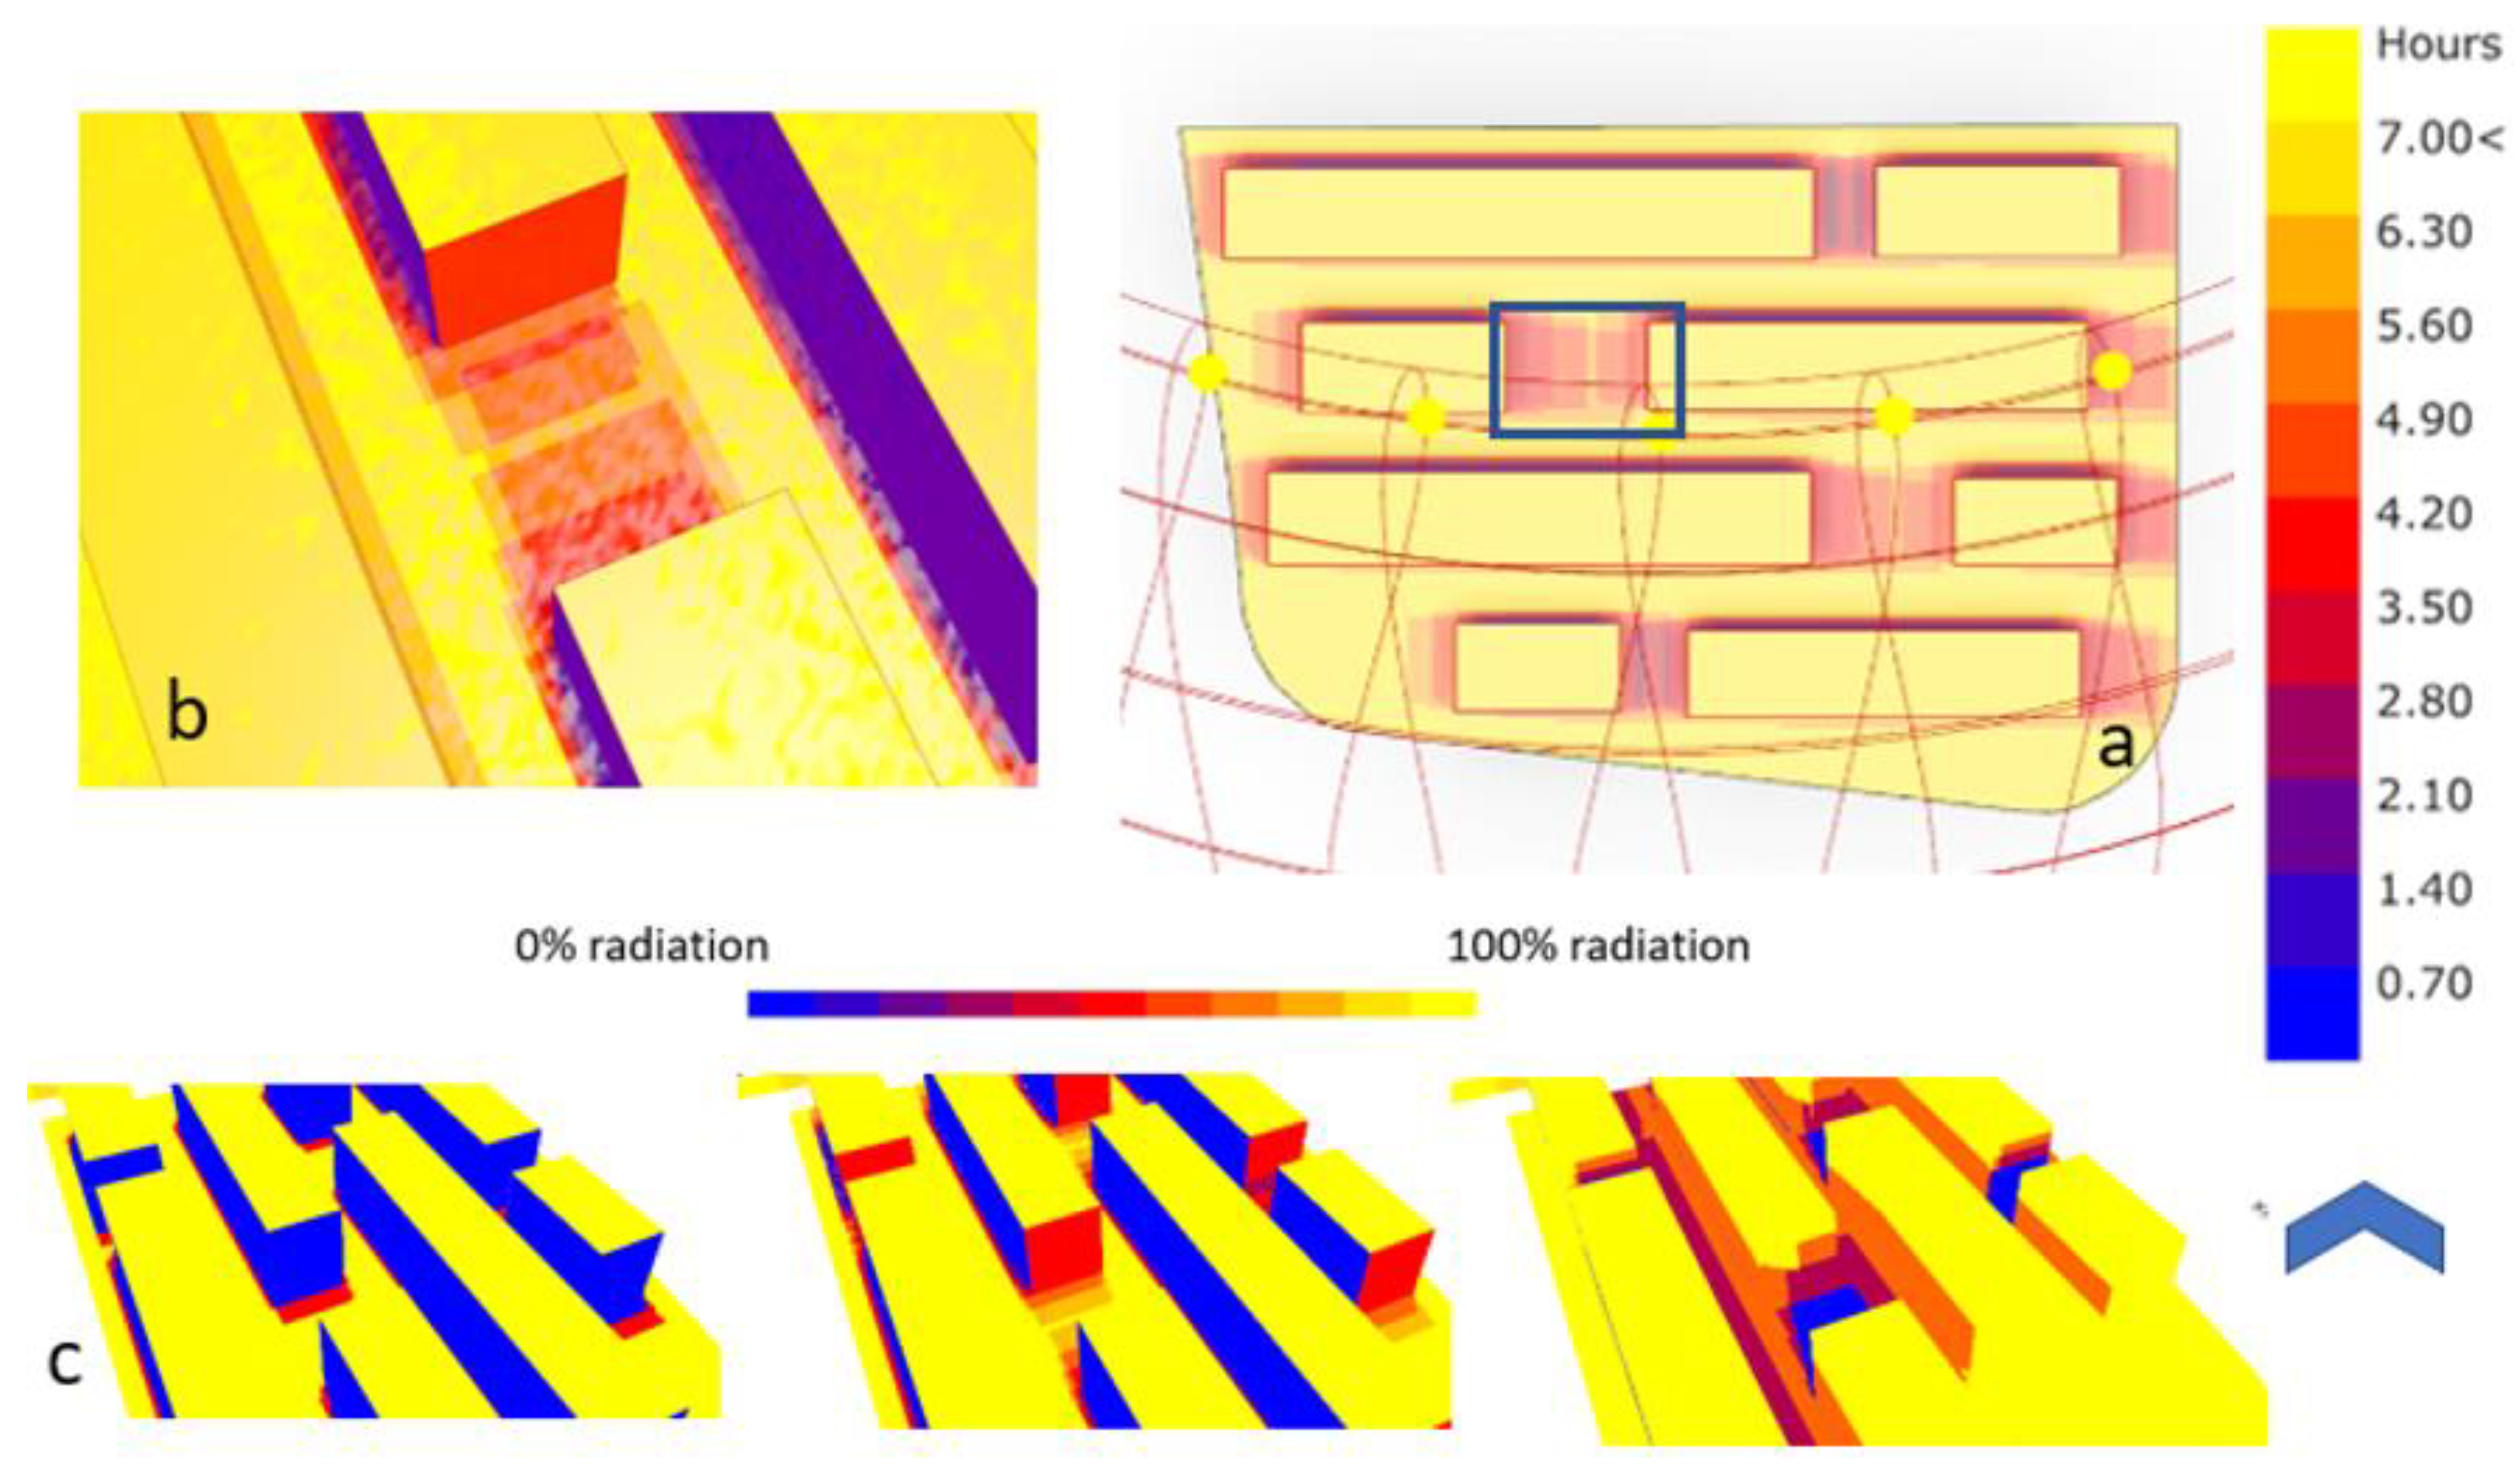
In all the studied G.N.s, it was found that 5As spatial design positively shapes the microclimate of the space to achieve better human comfort. In addition, “5A” is the preferred destination among the other nodes based on the feedback from respondents (see the previous radar analysis). However, most respondents cited the space’s positive vibes, high comfort level, and luxurious architecture and materials. These traits encourage users/occupants to sit and take a couple of photos, as mentioned previously.
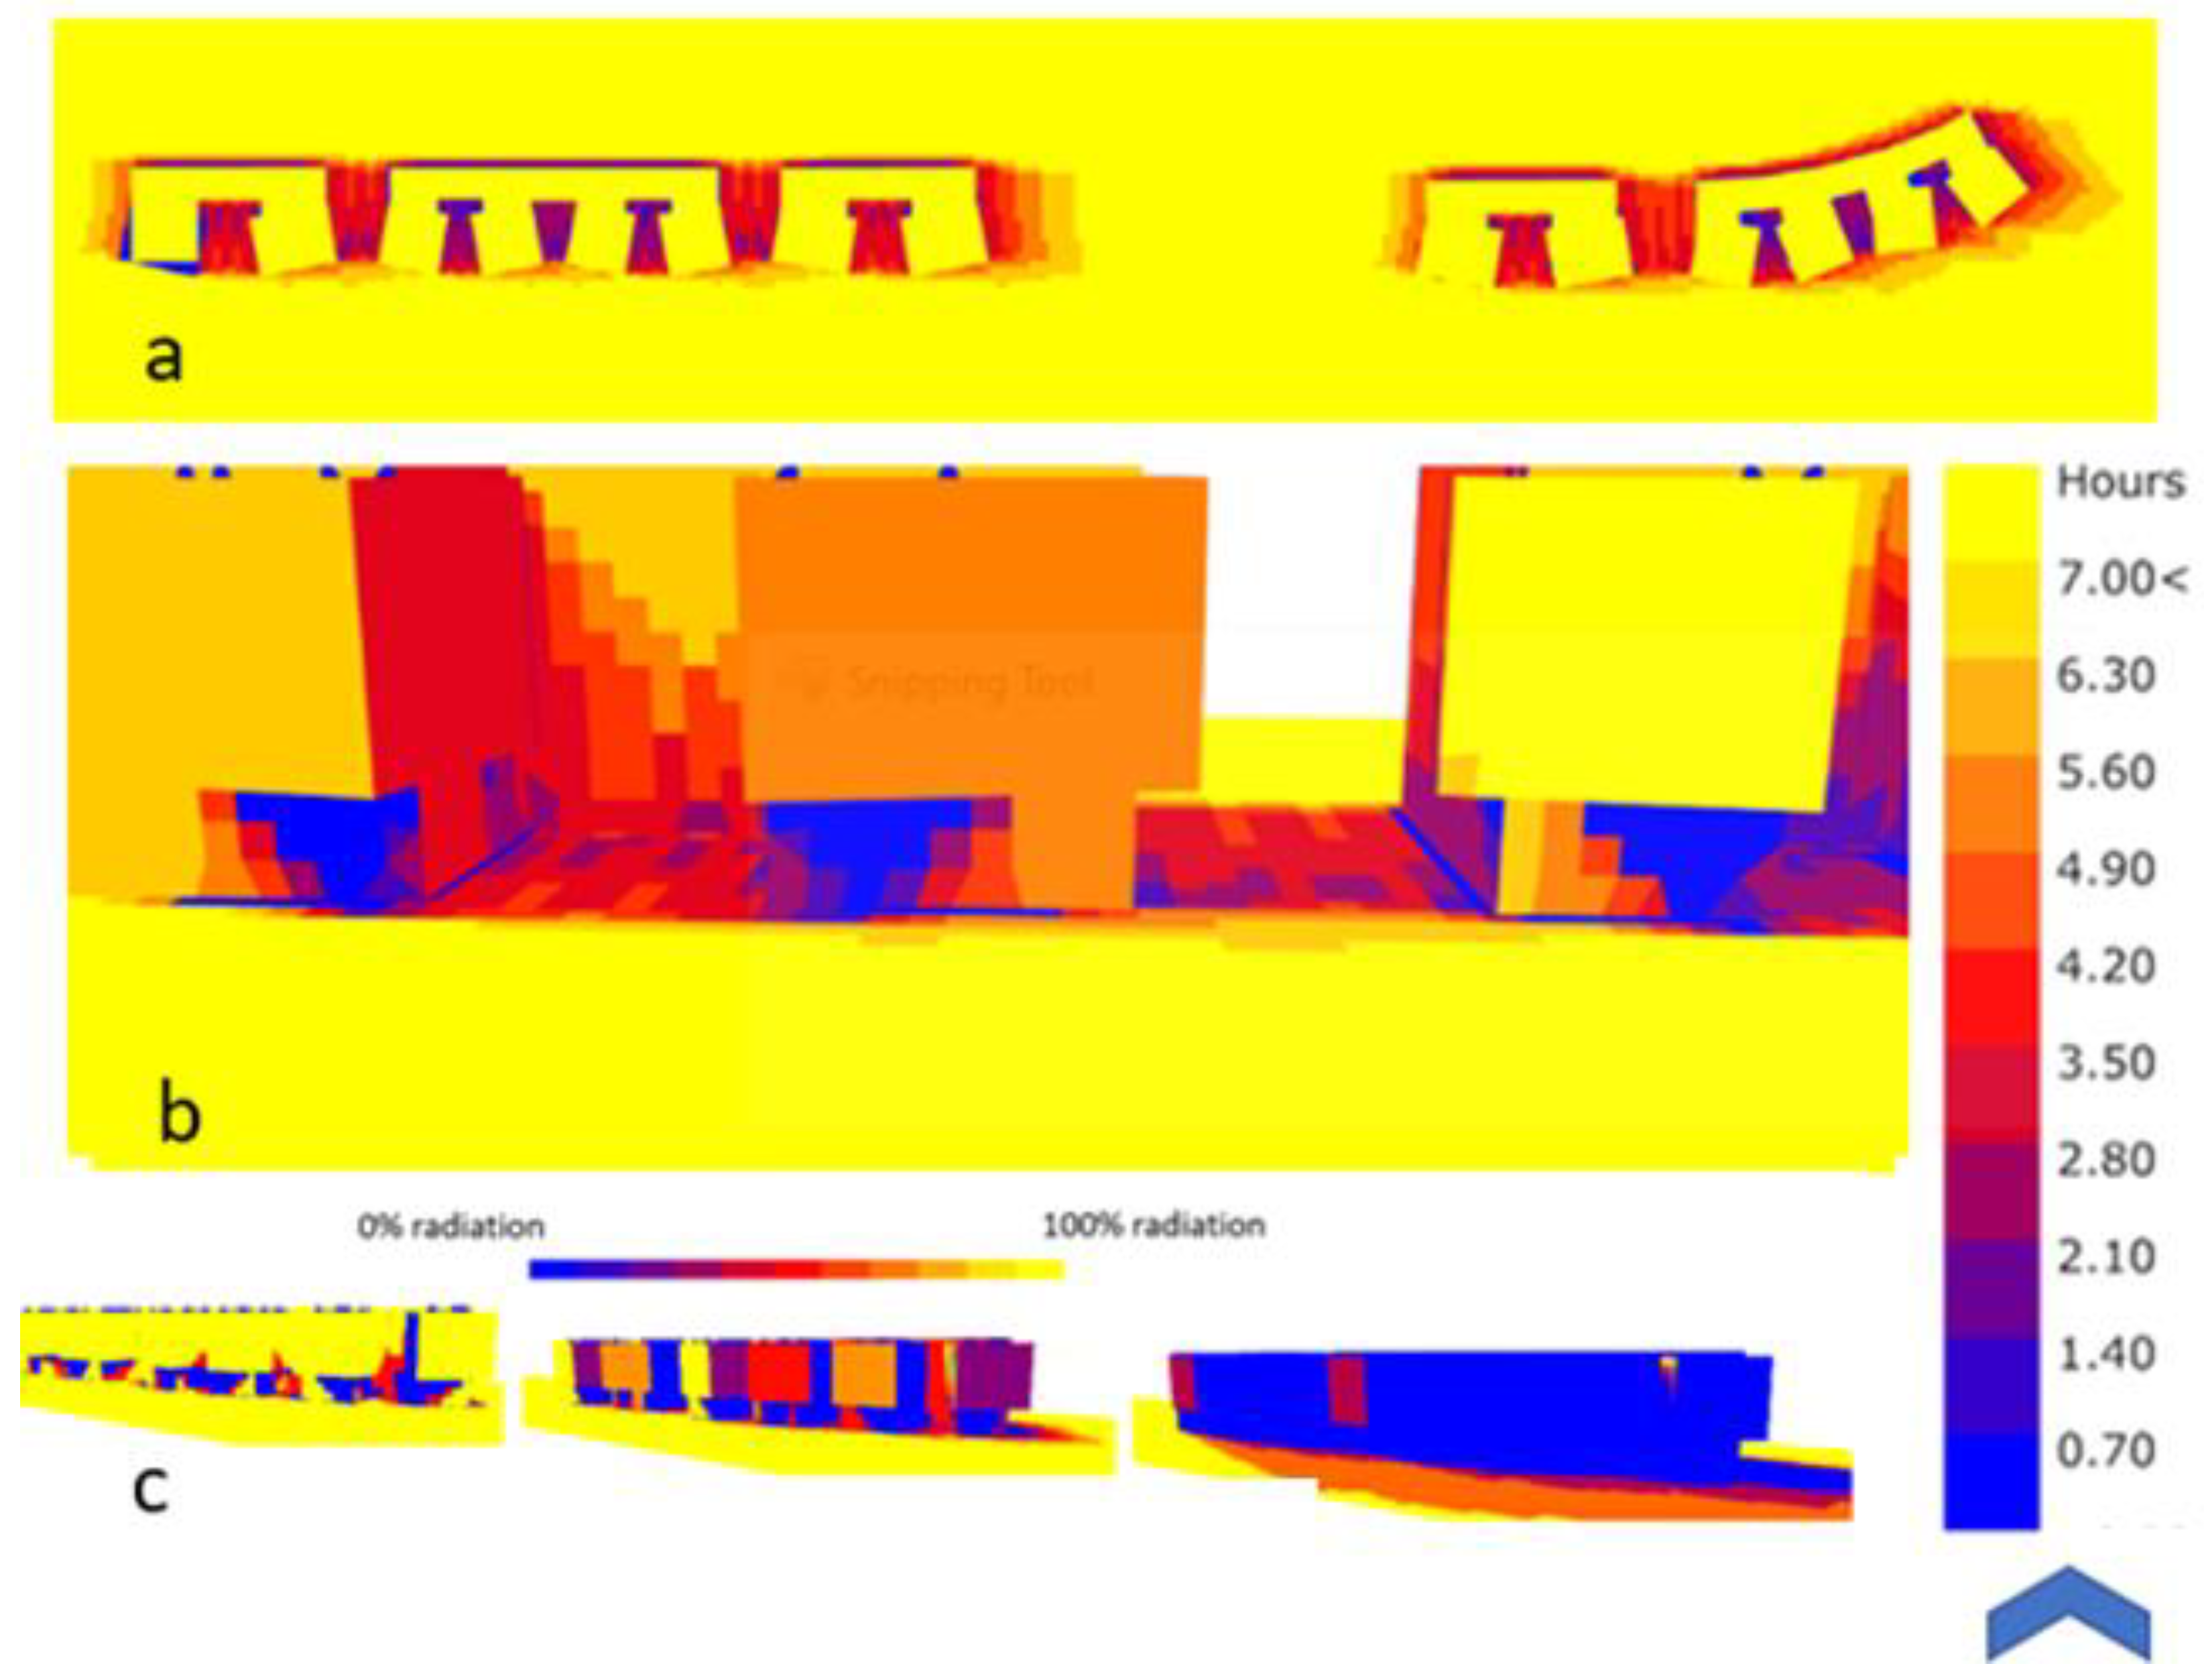
A high thermal discomfort is computed through the UTCI index using ladybug tools with the localized weather data generated by [35], See Figure 20. Additionally, according to the analyzed metrological data, air temperature registers the highest value at 38 °C with an elevated radiation range of 230 kWh/m2 in typical summer. Paths aligned in the east–west direction are exposed to direct radiation for almost 7 h. Only 2 m on the south side of the east–west paths has a lower radiation exposure time of 4 h a day, See Figure 21.
This finding prompted the authors to look closely at E.W. paths’ function and equipment (furniture). Benches and palm trees exist on this path. Therefore, it is expected that these benches will not be used during the 12:00 to 16:00 period due to high thermal due to the directly exposed sun radiance. On the other hand, in the evening, these linear WE paths accommodate users for leisure activities, sitting, and photographing at a high level of thermal comfort. This finding proves its relevance to respondents’ feedback on the questionnaire.
In contrast, the spaces between the building blocks are privileged with dynamic shade during the day. It encourages outdoor space usage with increased human thermal comfort through its spatial design and advanced degree of enclosure (see Figure 21). Temporal solar analyses were performed, and the following was concluded. In the morning time, 9:00 to 12:00, 90% of the area is exposed to direct radiation falling on the ground, and the building block shades 10%. A closer look at the outdoor space design shows that water fountains and greenery are present in the middle/central space between the building blocks. Together, these additives actively moderate the microclimate but cannot shield the radiation falling directly on the ground surfaces. Hence, horizontal shading structures (temporary/permanent) were added to achieve better thermal comfort.
In the peak time of the day, 12:00 to 16:00, 40 to 55% of the area has irradiation hours of 3.50 to 5.60 h. The remaining percentage of space has direct radiation falling on the ground, middle space. The percentage of radiation reaching the ground reaches its minimum from 16:00 to sunset, which offers a better opportunity for thermal comfort. This finding correlates strongly with the respondents to the questionnaire since the spatial design has a significant impact on human comfort. Hence, the building heights, the dimension of the space, and the orientation should be considered [55].
3.2.4. GN4: Arkan Plaza
Arkan Plaza, the oldest gentrification node, built in 2012, is believed to be the most distant among the G.N.s studied. Most users go to the space for leisure activities, service provision, and catering services, either fast food or a meal in restaurants. Human thermal discomfort records the highest, computed by the UTCI index, Figure 22. The index records a high value due to users exposed to extreme heat through direct radiation. Looking at radiation over the year, July records the highest radiation and air temperature with moderate wind flow and humidity patterns analyzed by generated localized weather data [35] (Figure 23a–c). However, the unique typology of the Arkan Plaza creates a new microclimatic character that encourages better thermal comfort.
Due to the buildings’ northwest orientation, there is room for dynamic shade throughout the day in the space. Such orientation significantly affects the radiation falling on the ground and the building’s façade affecting the space’s occupants. The building geometry does not provide shade on the main central path, which is not mandatory since it is viewed as a transitional area to reach a particular destination or node. Additionally, this path contains trees that provide little shade. However, the static space where users sit or dine is distinguished by dynamic shade patterns fostering the space’s usability. This finding aligns with the respondents’ feedback from the questionnaire.
An adequate range of shade is provided between the hours of 9:00 and 12:00, as well as from 16:00, according to the solar temporal radiation analysis that impacts the plaza’s outdoor spaces. It provides reasonable comfort for users on both sides. However, from midday 12:00 to 16:00, the east side of “Arkan Plaza” was found to receive direct radiation, discouraging users from staying outside, with them preferring to sit indoors with moderate microclimate or stay west facing, which has a lower range of radiation falling directly on the space—a range in between two to four hours along the day. It is noted that trees and light-shading elements are present, but their performance is not the subject of this investigation. This climatic finding strongly correlates with the information given by the respondents on spatial design, enclosure, and intimacy.
Despite the simplicity of the architecture and the ordinary materials used in “Arkan Plaza,” the questionnaire affirms the attractiveness of the spatial organization of this gentrification node. Users appreciate the intimacy/enclosure offered by this complex as well as its spatial design. According to the owner and the architect, “Arkan Plaza” is one of Cairo’s most socially resilient gentrification nodes. They explained that the socio-cultural status of the clientele is mostly the same since its creation.
4. Conclusions
“Gentrification nodes” act as contemporary city centers in new urban communities where people can work, meet, eat, and exchange. These nodes are complex adaptive urban systems of multiuse services, retail, and activities. Therefore, their spatial organization is crucial to their urban resilience, affecting their customers’ climate comfort. Some of them were pre-urbanely introduced to the Cairene new settlements’ urban fabric, while others were added after the urbanization of these areas. They continued to thrive, and “new ones” are constantly added to dynamize the real estate market, increase property value, and attract people to newly urbanized areas. Progressively, nodes that offer services and a plethora of activities replaced the traditional city center as they provide various services in one place. During and after the pandemic crises of COVID-19, there was an increased need for outdoor spaces where users could spend the day. In this regard, “gentrification nodes” in new urban communities appeared as the optimum solution as they offer uncovered spaces. We assumed that the climate comfort of these nodes contributes to their social and spatial resilience. Moreover, their behavior, as complex systems and regarding the climate comfort they provide, is highly related to their spatial organization and urban design concept. This behavior will ultimately affect their social and, consequently, their spatial resilience.
The research considered the behavior of four predominant “gentrification nodes” in New Cairo and Sheikh Zayed City in Egypt that play an essential role in the real estate market and affect urban dynamics. A selection criterion was carried out to include the G.N.s of the same architect (to limit the variables in the study). Within the four studied cases, we developed a multi-layered investigation that includes analysis, questionnaires, interviews, and observations. To support the authors’ hypothesis and user’s/owner’s/architect’s opinion, a microclimate simulation was performed. Moreover, it highlighted the fact that the more the “gentrification node” offers a degree of climate comfort, the more it will be socially resilient. Consequently, it will keep its spatial identity and users within the original socioeconomic category much longer, hence its urban resilience.
On the basis of the finding, we conclude that the spatial resilience of these nodes is relatively related to the climate comfort and the spatial organization that corresponds to users’ needs. Moreover, results underline that in the case of linear nodes, building massing and materials with high albedo should be considered, as in the multiaxial nodes, the aspect of ratio dimensions and orientation of the space should be well studied. Other factors, such as spatial inclusion and exposure, must also be considered.
This paper contributes to the theory of urban resilience on social and spatial dimensions, especially in new urban anchors, as discussed previously by [6]. It shed light on a new form of urban anchors, the “gentrification nodes,” that are pre-urbanely or progressively introduced in urban fabrics to dynamize urban development and the real estate market, especially in new urban communities. It considers the spatial organization of these nodes, the achieved climate comfort to this planning, and how both can affect users’ preferences for a particular space.
For future research, the degree of spatial resilience can be traced and marked according to the changes in spatial organization and identity to correspond to the new user. Moreover, an equation can be developed to find the correlation between social and spatial resilience.
Author Contributions
Conceptualization, R.A.M.; methodology, R.A.M. and W.M.E.; software, W.M.E.; validation, R.A.M. and W.M.E.; formal analysis, R.A.M. and W.M.E.; investigation, R.A.M. and W.M.E.; resources.; writing—original draft preparation, R.A.M. and W.M.E.; writing—review and editing, R.A.M. and W.M.E.; visualization, W.M.E. and R.A.M.; supervision, R.A.M. All authors have read and agreed to the published version of the manuscript.
Funding
This research received no external funding.
Institutional Review Board Statement
Not applicable.
Informed Consent Statement
Not applicable.
Data Availability Statement
Not applicable.
Conflicts of Interest
The authors declare no conflict of interest.
References
- Mahmoud, R.A. Heliopolis: The Metamorphosis of a Garden City into an Urban District (Book in French); EUE Les Editions Universitaires Européennes: Berlin, Germany, 2010. [Google Scholar]
- Fahmi, W.; Sutton, K. Greater Cairo’s housing crisis: Contested spaces from inner city areas to new communities. Cities 2008, 25, 277–297. [Google Scholar] [CrossRef]
- Mahmoud, R.A.; Rashed, R. New Cairo’s Urban Paradox: All-Inclusive Urbanism vs. Social Exclusion. In Proceedings of the ©SBE16-Cairo, Cairo, Egypt, 29 November–1 December 2016; pp. 96–109. [Google Scholar]
- Mahmoud, R.A. New Cairo’s Urban Dynamics: Redefining Gentrification as a Main Actor of Social Resilience. Procedia Environ. Sci. 2017, 37, 429–441. [Google Scholar] [CrossRef]
- Hangebruch, N.; Othengrafen, F. Resilient Inner Cities: Conditions and Examples for the Transformation of Former Department Stores in Germany. Sustainability 2022, 14, 8303. [Google Scholar] [CrossRef]
- Rao, F. Resilient forms of shopping centers amid the rise of online retailing: Towards the urban experience. Sustainability 2019, 11, 3999. [Google Scholar] [CrossRef] [Green Version]
- Merriam-Webster Resilience Definition & Meaning. 2022. Available online: https://www.merriam-webster.com/dictionary/resilience (accessed on 17 November 2022).
- Cambridge Dictionary, RESILIENCE English Meaning. 2022. Available online: https://dictionary.cambridge.org/dictionary/english/resilience (accessed on 17 November 2022).
- Folke, C.; Carpenter, S.; Elmqvist, T.; Gunderson, L.; Holling, C.S.; Walker, B. Resilience and sustainable development: Building adaptive capacity in a world of transformations. AMBIO A J. Hum. Environ. 2002, 31, 437–440. [Google Scholar] [CrossRef]
- Awad, S.H. The social life of images. Vis. Stud. 2020, 35, 28–39. [Google Scholar] [CrossRef]
- Jin, H.; Cui, P.; Wong, N.H.; Ignatius, M. Assessing the effects of urban morphology parameters on microclimate in Singapore to control the urban heat island effect. Sustainability 2018, 10, 206. [Google Scholar] [CrossRef] [Green Version]
- United Nations, Sustainable Deveopement Goals. 2020. Available online: https://www.un.org/sustainabledevelopment/sustainable-development-goals (accessed on 1 November 2020).
- Attia, S.; Duchhart, I. Bioclimatic landscape design in extremely hot and arid climates. In Proceedings of the 27th Conference of Passive and Low Energy Architecture (PLEA), Louvain-la, Belgium, 13–15 July 2011; pp. 459–464. [Google Scholar]
- Sharmin, T.; Steemers, K.; Matzarakis, A. Analysis of microclimatic diversity and outdoor thermal comfort perceptions in the tropical megacity Dhaka, Bangladesh. Build. Environ. 2015, 94, 734–750. [Google Scholar] [CrossRef]
- Abdel-aleem, M.F. Numerical assessment for urban developments on a climate change basis; A case study in New Cairo, Egypt. In Proceedings of the 2nd International Conference, Quality of Life-A Vision towards Better Future, Cairo, Egypt, 1 March 2012. [Google Scholar]
- Erell, E.; Pearlmutter, D.; Williamson, T. Urban Microclimate: Designing Spaces between Buildings; Routledge: London, UK, 2011. [Google Scholar]
- Lau, K.K.L.; Tan, Z.; Morakinyo, T.E.; Ren, C. Characteristics of Thermal Comfort in Outdoor Environments. Outdoor Therm. Comf. Urban Environ. Assess. Appl. Urban Plan. Des. 2022, 1–9. [Google Scholar] [CrossRef]
- Ali-Toudert, F.; Djenane, M.; Bensalem, R.; Mayer, H. Outdoor thermal comfort in the old desert city of Beni-Isguen, Algeria. Clim. Res. 2005, 28, 243–256. [Google Scholar] [CrossRef]
- Lee, S.; Moon, H.; Choi, Y.; Yoon, D.K. Analyzing thermal characteristics of urban streets using a thermal imaging camera: A case study on commercial streets in Seoul, Korea. Sustainability 2018, 10, 519. [Google Scholar] [CrossRef] [Green Version]
- Nübler, W.; Jendritzky, G. A model analysing the urban thermal environment in physiologically significant terms. Arch. Meteorol. Geophys. Bioklimatol. Ser. B 1981, 29, 313–326. [Google Scholar]
- El-Bardisy, W.M.; Fahmy, M.; El-Gohary, G.F. Climatic Sensitive Landscape Design: Towards a Better Microclimate through Plantation in Public Schools, Cairo, Egypt. Procedia Soc. Behav. Sci. 2016, 216, 206–216. [Google Scholar] [CrossRef] [Green Version]
- Robaa, S.M.; Hasanean, H.M. Human climates of Egypt. Int. J. Climatol. A J. R. Meteorol. Soc. 2007, 792, 781–792. [Google Scholar] [CrossRef]
- Ali-Toudert, F.; Mayer, H. Effects of Street Design on Outdoor Thermal Comfort. Landsc. Environ. Soc. 2007, 81, 45–55. [Google Scholar]
- Elnabawi, M.H.; Hamza, N.; Dudek, S. Thermal perception of outdoor urban spaces in the hot arid region of Cairo, Egypt. Sustain. Cities Soc. 2016, 22, 136–145. [Google Scholar] [CrossRef]
- Elbardisy, W.M.; Fahmy, M.; Salheen, M.A. The Impact of Street Trees on a Typical Urban Canyon in Eastern Cairo Region. Earth Environ. Sci. 2022, 1056, 8–17. [Google Scholar] [CrossRef]
- Elbardisy, W.M.; Salheen, M.A.; Fahmy, M. Solar irradiance reduction using optimized green infrastructure in arid hot regions: A case study in el-nozha district, Cairo, Egypt. Sustainability 2021, 13, 9617. [Google Scholar] [CrossRef]
- Pegler, C.; Li, H.; Pojani, D. Gentrification in Australia’s largest cities: A bird’s-eye view. Aust. Plan. 2020, 56, 191–205. [Google Scholar] [CrossRef]
- Lees, L. Gentrification and Social Mixing: Towards an Inclusive Urban Renaissance? Urban Stud. 2008, 45, 2449–2470. [Google Scholar] [CrossRef]
- Cachinho, H. Consumerscapes and the resilience assessment of urban retail systems. Cities 2014, 36, 131–144. [Google Scholar] [CrossRef] [Green Version]
- Effat, H.A.; Hassan, O.A.K. Change detection of urban heat islands and some related parameters using multi-temporal Landsat images; a case study for Cairo city, Egypt. Urban Clim. 2014, 10, 171–188. [Google Scholar] [CrossRef]
- World Maps of Köppen-Geiger Climate Classification. 2021. Available online: http://koeppen-geiger.vu-wien.ac.at/present.htm (accessed on 22 April 2021).
- Robaa, S.M. Thermal human comfort in Egypt. J. Meteorol. 2003, 28, 359–371. [Google Scholar]
- Elshater, A.; Abusaada, H.; Alfiky, A.; El-Bardisy, N.; Elmarakby, E.; Grant, S. Workers’ Satisfaction vis-à-vis Environmental and Socio-Morphological Aspects for Sustainability and Decent Work. Sustainability 2022, 14, 1699. [Google Scholar] [CrossRef]
- Elmarakby, E.; Khalifa, M.; Elshater, A.; Afifi, S. Tailored methods for mapping urban heat islands in Greater Cairo Region. Ain Shams Eng. J. 2022, 13, 101545. [Google Scholar] [CrossRef]
- Meteonorm. 2022. Available online: https://meteonorm.com/en/meteonorm-version-8 (accessed on 30 June 2021).
- ISO-ISO 9060:1990, Solar Energy—Specification and Classification of Instruments for Measuring Hemispherical Solar and Direct Solar Radiation. Available online: https://www.iso.org/standard/16629.html (accessed on 8 July 2021).
- Fahmy, M.; Mahdy, M.M.; Nikolopoulou, M. Prediction of future energy consumption reduction using GRC envelope optimization for residential buildings in Egypt. Energy Build. 2014, 70, 186–193. [Google Scholar] [CrossRef]
- Rhino-Rhinoceros 3D. Available online: https://www.rhino3d.com/ (accessed on 1 November 2022).
- Ladybug. 2022. Available online: https://www.ladybug.tools/ (accessed on 6 May 2020).
- Operating Manual for Humidity & Temperature Measuring Device BC20-TROTEC. Available online: https://uk.trotec.com/products-services/services/downloads/operating-manuals/measuring-devices/multifunction/operating-manual-for-humidity-temperature-measuring-device-bc20/ (accessed on 30 June 2021).
- Testa, P.; Ferrara, M.; Shtrepi, L.; Fabrizio, E.; Astolfi, A.; Serra, V. Modelling mean radiant temperature in outdoor environments: Contrasting the approaches of different simulation tools You may also like The impact of courtyard geometry on its mean radiant temperature Modelling mean radiant temperature in outdoor environme. J. Phys. Conf. Ser. 2021, 2069, 12186. [Google Scholar]
- Perini, K.; Chokhachian, A.; Dong, S.; Auer, T. Modeling and simulating urban outdoor comfort: Coupling ENVI-Met and TRNSYS by grasshopper. Energy Build. 2017, 152, 373–384. [Google Scholar] [CrossRef]
- Elwy, I.; Ibrahim, Y.; Fahmy, M.; Mahdy, M. Outdoor microclimatic validation for hybrid simulation workflow in hot arid climates against ENVI-met and field measurements. Energy Procedia 2018, 153, 29–34. [Google Scholar] [CrossRef]
- Martins, T.A.L.; Adolphe, L.; Bonhomme, M.; Bonneaud, F.; Faraut, S.; Ginestet, S.; Michel, C.; Guyard, W. Impact of Urban Cool Island measures on outdoor climate and pedestrian comfort: Simulations for a new district of Toulouse, France. Sustain. Cities Soc. 2016, 26, 9–26. [Google Scholar] [CrossRef]
- Haug, U.A.; Irvine, D.H. The use of correlation coefficients in test validation. High. Educ. 1987, 16, 33–36. [Google Scholar] [CrossRef]
- Obeidat, B.; Alshayeb, M.; Barri, A. The influence of courtyards’ microclimate condition on the users’ spatial behaviour: A case study in a university campus in hot dry regions. In Proceedings of the 33rd PLEA International Conference Design to Thrive 2017, Edinburgh, UK, 2–5 July 2017; Volume 3, pp. 4212–4218. [Google Scholar]
- Takebayashi, H. Thermal Environment Design of Outdoor Spaces by Examining Redevelopment Buildings Opposite Central Osaka Station. Climate 2019, 7, 143. [Google Scholar] [CrossRef] [Green Version]
- Darbani, E.S.; Rafiean, M.; Hanaee, T.; Parapari, D.M. Environmental Effects Of Urban Geometry Changes On Air Temperature And Outdoor Thermal Comfort In Arid Climate Of Mashhad (Case Study Of Pachenar And Shahed). J. Environ. Stud. 2018, 43, 561–578. [Google Scholar]
- Yin, J.; Zhan, Q.; Tayyab, M.; Zahra, A. The ventilation efficiency of urban built intensity and ventilation path identification: A case study of Wuhan. Int. J. Environ. Res. Public Health 2021, 18, 11684. [Google Scholar] [CrossRef]
- Ji, Y.; Song, J.; Shen, P. A review of studies and modelling of solar radiation on human thermal comfort in outdoor environment. Build. Environ. 2022, 214, 108891. [Google Scholar] [CrossRef]
- Zhou, W.; Li, X.; Duanmu, L.; Gao, J. Research on impact of building envelope thermal performance on urban heat island intensity. Dalian Ligong Daxue Xuebao J. Dalian Univ. Technol. 2022, 62, 485–492. [Google Scholar] [CrossRef]
- Yan, H.; Wu, F.; Nan, X.; Han, Q.; Shao, F.; Bao, Z. Influence of view factors on intra-urban air temperature and thermal comfort variability in a temperate city. Sci. Total Environ. 2022, 841, 156720. [Google Scholar] [CrossRef]
- Zheng, S.; Guldmann, J.M.; Liu, Z.; Zhao, L. Influence of trees on the outdoor thermal environment in subtropical areas: An experimental study in Guangzhou, China. Sustain. Cities Soc. 2018, 42, 482–497. [Google Scholar] [CrossRef]
- Hasse, L. Basic Atmospheric Structure and Concepts|Beaufort Wind Scale. Encycl. Atmos. Sci. Second Ed. 2015, 1–6. [Google Scholar] [CrossRef]
- Kolokotsa, D.; Lilli, K.; Gobakis, K.; Mavrigiannaki, A.; Haddad, S.; Garshasbi, S.; Mohajer, H.R.H.; Paolini, R.; Vasilakopoulou, K.; Bartesaghi, C.; et al. Analyzing the Impact of Urban Planning and Building Typologies in Urban Heat Island Mitigation. Buildings 2022, 12, 537. [Google Scholar] [CrossRef]
- Ali-Toudert, F. Dependence of Outdoor Thermal Comfort on Street Design in Hot and Dry Climate. Ph.D. Thesis, Freiburg University, Freiburg, Germany, November 2005. [Google Scholar]
- Euromonitor International, Consumer Values and Behaviour in Egypt. 2022. Available online: https://www.euromonitor.com/consumer-values-and-behaviour-in-egypt/report (accessed on 12 December 2022).
Figure 1.
Gentrification nodes and the pre-urban gentrification process in new urban communities (1).
Figure 1.
Gentrification nodes and the pre-urban gentrification process in new urban communities (1).

Figure 2.
Research design and the analytical approach (authors).

Figure 3.
The selected gentrification nodes for the same architect (author).

Figure 4.
Waterway 1: (a) the study location marked in red; satellite images generated by Apple maps and the design typology; (b,c) the outdoor terraces and the facade design; (author); (d) the linear parking lot; source, author; (e) 3D (author).
Figure 4.
Waterway 1: (a) the study location marked in red; satellite images generated by Apple maps and the design typology; (b,c) the outdoor terraces and the facade design; (author); (d) the linear parking lot; source, author; (e) 3D (author).

Figure 5.
Arkan Plaza—the study location is marked in red. Satellite images generated by apple maps.
Figure 5.
Arkan Plaza—the study location is marked in red. Satellite images generated by apple maps.

Figure 6.
(a) Arkan Plaza real-time photo (author). (b,c) The design typology and 3D (author).

Figure 7.
Waterway White: (a) the study location marked in red, satellite images generated by apple maps (b) the outdoor terraces and the facade design, (author); (c) the design typology, source: author; (d) 3D (author).
Figure 7.
Waterway White: (a) the study location marked in red, satellite images generated by apple maps (b) the outdoor terraces and the facade design, (author); (c) the design typology, source: author; (d) 3D (author).

Figure 8.
5A: the study location marked in red; satellite images generated by apple maps.

Figure 9.
(a) The space between buildings used as outdoor terraces for cafeteria and restaurants (author). (b) The east–west pathways between the buildings. The design typology (author). (c) The design typology (author). (d) 3D (author).
Figure 9.
(a) The space between buildings used as outdoor terraces for cafeteria and restaurants (author). (b) The east–west pathways between the buildings. The design typology (author). (c) The design typology (author). (d) 3D (author).


Figure 10.
The generated weather file analysis using Autodesk Ecotect tool [33] indicating the peak summer temperature ranges on July the 21st market in red border (author).
Figure 10.
The generated weather file analysis using Autodesk Ecotect tool [33] indicating the peak summer temperature ranges on July the 21st market in red border (author).

Figure 11.
The correlation between hourly measurements and predicted records: (a) air temperature; (b) relative humidity (author).
Figure 11.
The correlation between hourly measurements and predicted records: (a) air temperature; (b) relative humidity (author).

Figure 12.
Respondents’ preferences towards the gentrification nodes (author based on questionnaire findings).
Figure 12.
Respondents’ preferences towards the gentrification nodes (author based on questionnaire findings).

Figure 13.
Type of activities in each gentrification node.

Figure 14.
The preferred times for each G.N. according to the respondents.

Figure 15.
Users’ attraction in each G.N. according to the respondents.

Figure 16.
Temporal metrological data for the 4 G.N.s: (a) all-day temperature ranges; (b) relative humidity ranges; (c) wind flow and prevailing wind.
Figure 16.
Temporal metrological data for the 4 G.N.s: (a) all-day temperature ranges; (b) relative humidity ranges; (c) wind flow and prevailing wind.

Figure 17.
UTCI thermal comfort index, generated by ladybug tools [39], along the year for waterway 1. Red indicates high thermal discomfort because of Extreme heat, while blue indicates high thermal discomfort because of the extreme cool.
Figure 17.
UTCI thermal comfort index, generated by ladybug tools [39], along the year for waterway 1. Red indicates high thermal discomfort because of Extreme heat, while blue indicates high thermal discomfort because of the extreme cool.

Figure 18.
(a) Waterway 1: the solar radiation falling across the day. (b) Radiation falling on the façade across the day; the yellow color refers to areas exposed to radiation almost the whole day, while the darker the gradient to blue is the minor zones exposed to direct radiation. (c) Temporal radiation percentage falling on the façade, generated through ladybug tools; the blue color refers to the lowest exposed façade to radiation for morning, midday, and evening time (author).

Figure 19.
(a) Waterway White: the solar radiation falling across the day. (b) Radiation falling on the façade across the day; the yellow color refers to areas exposed to radiation almost the whole day, while the darker the gradient to blue is the minor zones exposed to direct radiation. (c) Temporal radiation percentage falling on the façade, generated through ladybug tools; the blue color refers to the lowest exposed façade to radiation (author).

Figure 20.
Annual UTCI index at “5A” generated by ladybug tools.

Figure 21.
(a) Waterway White: the solar radiation falling across the day. (b) Radiation falling on the façade across the day; the yellow color refers to areas exposed to radiation almost the whole day, while the darker the gradient to blue is the least zones exposed to direct radiation. (c) Temporal radiation percentage falling on the façade, generated through ladybug tools; the blue color refers to the lowest exposed façade to radiation generated through ladybug tools (author).

Figure 22.
Annual UTCI index at “Arkan” generated by ladybug tools.

Figure 23.
(a) Arkan the solar radiation falling across the day. (b) Radiation falling on the façade across the day; the yellow color refers to areas exposed to radiation almost the whole day, while the darker the gradient to blue is the least zones exposed to direct radiation. (c) Temporal radiation percentage falling on the façade, generated through ladybug tools; the blue color refers to the lowest exposed façade to radiation generated through ladybug tools (author).


Table 1.
GNs spatial organization and customers’ segmentation summary.
| Gentrification Node | Spatial Design | Service Provision | Targeted Costumers |
|---|---|---|---|
Waterway 1, 2012 30°2′29.32″ N, 31°28′32.37″ E | Strip Mall | -Strip mall -Residential units -Offices -Banks -Wellness | At the beginning: (A−/B+); Now: (B/B−) |
Arkan Plaza, 2012 30°1′14.00″ N, 31°0′12.34″ E | Piazza style | -Mixed-use complex of retail and restaurants -Business park -Banks -Healthcare -Wellness | At the beginning: (A+/B+); Now: (A+/B+) |
WaterWay White, 2018 30°1′45.28″ N, 31°28′59.25″ E | Strip Mall | -Strip mall recently added to the limits of a residential compound -Mixed-use complex of retails -Offices -Banks -Wellness | At the beginning: (A−/B+); Now: (B+/B) |
5 A, 2021 30°0′31.19″ N, 31°24′11.73″ E | Multiaxial space | -Mixed-use complex of high-end and luxurious retail and restaurants -Business park -Wellness | At the beginning: (A+/B+) Now: (A+/B+) |
According to customers’ segmentation in the real estate and recreational markets in Egypt, there are 3 categories: A, B, and C; each one contains 3 subcategories. For example, A is subdivided to A+, A, and A−, and so on. According to the architect and the two developers of the chosen gentrification nodes, the targeted customers/users are clustered into two main categories, A and B, with their subcategories A+, A, and A−, or B+, B, and B−. The mentioned clustering reflects the socioeconomic status of customers and refers correspondingly to different levels of upper and middle classes as seen in the table.
Disclaimer/Publisher’s Note: The statements, opinions and data contained in all publications are solely those of the individual author(s) and contributor(s) and not of MDPI and/or the editor(s). MDPI and/or the editor(s) disclaim responsibility for any injury to people or property resulting from any ideas, methods, instructions or products referred to in the content. |
© 2023 by the authors. Licensee MDPI, Basel, Switzerland. This article is an open access article distributed under the terms and conditions of the Creative Commons Attribution (CC BY) license (https://creativecommons.org/licenses/by/4.0/).
Share and Cite
MDPI and ACS Style
Mahmoud, R.A.; Elbardisy, W.M. Climate Comfort Due to Spatial Organization: A Major Factor of Urban Resilience in Complex Gentrification Nodes in New Urban Communities. Sustainability 2023, 15, 3563. https://doi.org/10.3390/su15043563
AMA Style
Mahmoud RA, Elbardisy WM. Climate Comfort Due to Spatial Organization: A Major Factor of Urban Resilience in Complex Gentrification Nodes in New Urban Communities. Sustainability. 2023; 15(4):3563. https://doi.org/10.3390/su15043563
Chicago/Turabian StyleMahmoud, Randa A., and Wesam M. Elbardisy. 2023. "Climate Comfort Due to Spatial Organization: A Major Factor of Urban Resilience in Complex Gentrification Nodes in New Urban Communities" Sustainability 15, no. 4: 3563. https://doi.org/10.3390/su15043563
Note that from the first issue of 2016, this journal uses article numbers instead of page numbers. See further details here.