


Role of Smart Farm as a Tool for Sustainable Economic Growth of Korean Agriculture: Using Input–Output Analysis

Division of AI Convergence, Sahmyook University, Seoul 01795, Republic of Korea
*
Author to whom correspondence should be addressed.
Sustainability 2023, 15(4), 3450; https://doi.org/10.3390/su15043450
Submission received: 17 January 2023
/
Revised: 7 February 2023
/
Accepted: 9 February 2023
/
Published: 13 February 2023
(This article belongs to the Special Issue Artificial Intelligence (AI) for the Sustainable Economics and Business)
Abstract
:This study focused on smart farms in Korea to confirm that the fourth industrial revolution technology is a tool that can be used for sustainable economic development in agriculture. This study used the input–output table, which included the production-inducing effects of the demand inducement model, value-added inducing effects, supply shortage effects of the supply inducement model, and the interlinkage effect. These methods were used to compare the impact of smart farm machinery on agriculture and the impact of smart farms on the Korean economy compared to conventional agriculture, thereby confirming the extent of the effect of fourth industrial revolution technology on agriculture. This study was conducted to determine whether this agricultural sector could lead to sustainable economic development. The analysis revealed that the production-inducing effects of smart farms showed a greater ripple effect than those of the agricultural sector. However, both value-added inducing effects and supply shortage effects showed a larger ripple effect in the agricultural sector. Considering only the indirect effect, the smart farms were found to evenly affect secondary and tertiary industries. In the case of value-added inducing and supply shortage effects, agriculture was found to have a greater impact on the secondary industry, whereas smart agri-machines and farms had a greater impact on the tertiary industry. Moreover, according to the interlinkage effect, agriculture was classified as a raw industry with final demand, and smart farms as a manufacturing industry with intermediate demand. These results have several implications. For the fourth industrial revolution technology to lead sustainable economic growth in agriculture, continuous creation of new value by developing various types of business models linked to other industries in consideration of the industrial characteristics of smart farms and agri-machines is necessary. In addition, to fully demonstrate the economic effects of smart farms, continuous management and support are required so that smart technologies can be strategically utilized in the agricultural sector.
1. Introduction
In the case of agriculture, various technologies related to the fourth industrial revolution have been grafted into labor-intensive industries that relied only on the experience and intuition of farmers in the past. Convergence, such as growth management through data, mobile distribution systems in the distribution field, traceability, and quality monitoring in the consumption field, is occurring [1]. Consequently, in the agricultural sector, effects such as reduction in labor and expenses, increase in production per unit area, quality improvement, and prevention of livestock diseases are expected in the production sector, and logistics reduction and supply and demand stability are expected in the consumption sector. Safe agricultural products are expected to be available for consumption to all the citizens. In addition, spraying fertilizers and pesticides in the right place is expected to have a positive effect on the environment [2]. As the fourth industrial revolution technology is applied to agriculture-related fields, agriculture is attracting attention as a new industry. This phenomenon can be confirmed by the status of global agricultural startup investments. The investment, which was only $10.05 billion in 2017, has grown by more than 9.8% annually to $14.08 billion in 2021 and is expected to grow to $22 billion by 2025 [3].
Korea’s agriculture grew to maturity as early as the early 2000s but has recently experienced difficulties due to income from farming households, lower farmers’ wages, decrease in and aging of the farming population, and climate change. The crop and harvest of agricultural products are not constant, and the price fluctuates continuously, therefore, the consumers continue to face difficulties. Agricultural production also grew continuously from KRW 32 trillion in 2001 to KRW 44 trillion in 2012 and increased to KRW 44 trillion won from 2012 to 2016 [2]. The average agricultural income per household has been stagnant at KRW 11.3 million for 15 years (2001–2015), and the farm household population decreased significantly from 4 million in 2000 to 2.6 million in 2015 [2]. To overcome this, the Korean government has been promoting ICT convergence projects in the agricultural sector since 2014, which include the development and dissemination of Korean-style smart farm models, R&D support projects to upgrade agriculture, response to aging farmers, and fostering of young farmers [4]. Despite these efforts, the number of farm households and farm household population are steadily declining every year, and the proportion of the aged farm household population representing the population aged 65 or older reached 46.6% as of 2019 [2,5].
Thus, the key technologies of the fourth industrial revolution are expected to have a positive impact by advancing digital transformation in the agricultural sector. As this expectation is reflected in the research field, smart farm-related research is being conducted in various fields. In particular, many studies suggest a smart farm model that can optimize the profitability and productivity of crop farms or livestock farms by developing systems and robots that can manage multiple sensors using IoT and artificial intelligence, technologies related to the fourth industrial revolution [6,7,8,9,10,11,12,13].
Social science-related studies have been conducted on agricultural production systems, value chains, food systems, agricultural decision-making systems, and studies related to standardization and educational activities [14,15,16,17]. Mohamed et al., (2021) emphasized that real-time analysis and soil property mapping technology are needed along with the existing smart farm technology to find the right decision-making support system in the agricultural sector, and active government support should be provided in the case of developing countries [14]. Klerkx et al., (2019) conducted research related to digital agriculture and smart farms, which included: (1) acceptance and use of digital technology in agriculture; (2) the impact of digitalization on farmers; (3) ownership and ethical issues; (4) digitization, agricultural knowledge, and innovation systems; and (5) digitized agricultural production systems and value chain management, and suggested future research directions [15]. Through a study of individual training conditions to achieve digital transformation in the agricultural sector, Trukhachev et al., (2019) found that digital transformation has not yet been achieved in the agricultural sector, and standardized educational activities for each sector of agriculture are needed to achieve this [16]. Musa and Basir (2021) argued that to implement a sustainable agri-food system in Southeast Asia, the government should take the lead and promote STEM-oriented (science, technology, engineering & mathematics) learning to equip the local labor force [17].
Several studies have been conducted on smart farms. However, most studies are focused on system development, and the majority of studies in the social sciences are qualitative. The ultimate purpose of these studies was to improve the productivity and efficient growth of the agricultural sector by building a smart farm in the form of digital transformation. This eventually leads to sustainable economic growth in the agricultural sector; however, no previous studies have been conducted on this aspect.
This study aims to answer the following question: can smart farms lead to sustainable economic growth in agriculture? Therefore, this study includes an industrial definition of smart farms, including agriculture, information, and communication technology, and agri-machines, which are components of smart farms. Here, agriculture comprises all agriculture, livestock and fisheries that can evolve into smart farms and become a comparison target industry to assess the sustainable economic growth of smart farms.
The analysis method uses the demand inducement model, supply inducement model, and interlinkage effect among the input–output analysis methods to examine the impact of smart farms on the national economy and diagnose the role of industry and the possibility of agriculture as a model for sustainable economic growth and to compare the economic ripple effects of agriculture. In addition, by examining the economic effect of the smart agri-machines and agricultural infrastructure of the fourth industrial revolution technology on agriculture, it will be possible to find ways to develop smart farms.
This approach can compare and analyze the impact of agriculture and smart farms on other industries and the overall Korean economy in terms of industry, unlike existing studies that focus on the productivity and efficiency of individual units. Specifically, each production inducement, added value inducement, supply shortage effect can be compared, and the industrial characteristics of each industry can also be confirmed. Accordingly, it is possible to discuss what role smart technology can play for the sustainable development of agriculture.
This study investigates the fourth industrial revolution, sustainable economic growth, agriculture and ICT convergence, smart farms, and related studies through a literature review in Chapter II. Next, in Chapter III, the research methodology explains the input–output analysis methodology, analysis model used in this study, industry classification criteria, and the research process. In Chapter IV, the results of the study present the results of the economic ripple effects of agriculture, smart agri-machines, and smart farms, and their comparative results are discussed. Finally, in the conclusion, an evaluation of whether smart farms can lead to sustainable economic growth in agriculture and smart farm development plans is presented.
2. Sustainable Economic Growth & Smart Farm
2.1. Fourth Industrial Revolution Technologies and Sustainable Economic Growth
The fourth industrial revolution was defined as a new era of industries that mankind has never experienced before, as the boundaries between the digital, physical, and biological domains disappear, and the convergence between these technologies takes place [18]. This is due to the rapid development of information and communication technology, which is the core technology of the fourth industrial revolution, such as artificial intelligence, robots, the internet of things (IoT), autonomous vehicles and 3D technologies. Three-dimensional printing, nanotechnology and biotechnology can connect billions of people to the internet to create more efficient businesses and organizations, preserve the natural environment, manage finances, enhance human dialogue and resolve conflicts [18].
In addition, the impact of the fourth industrial revolution technology on supply in terms of the industrial sector is expected to grow the economy while creating new markets by improving the efficiency and productivity of the global supply chain in the long term by lowering transportation and communication costs. On the demand side, market transparency, improved customer participation, and new patterns of customer behavior are emerging; therefore, companies must design suitable products and services. Typical examples are the sharing economy and on-demand services [18,19].
This fourth industrial revolution technology is characterized by high-level information, communication-based technology, and general-purpose technology. Unlike previous technologies, it has a different level of speed, scope and systemic impact as it affects production, management and government at every industrial and national level [18]. Accordingly, it is expected to contribute to the improvement of human welfare and sustainable global economic growth, based on its efficiency and productivity in the industrial economy [18,19,20].
As the fourth industrial revolution technology is expected to be used as a major tool for sustainable development, many studies have applied it to each industry to predict innovation through efficiency and productivity improvements [21,22,23,24,25,26,27]. A representative example is Industry 4.0, which is sometimes used as a synonym for the fourth industrial revolution.
This is the concept of combining IT systems with traditional industries, such as manufacturing, to network production facilities and evolve them into a smart factory with an intelligent production system, which may significantly improve efficiency and productivity [28]. Based on this perspective, studies are being conducted to suggest the importance of the supply chain management system, a proposal of a system using the fourth industrial revolution technology, and the innovation method used [20,23,24,25,26].
Accordingly, studies on the impact of the fourth industrial revolution on the service sector and the evolution of traditional manufacturing-oriented industries due to the fourth industrial revolution technologies can be conducted. Shin and Choi (2019) argue that the fintech industry, where the fourth industrial revolution technology is applied to finance, can play a role as a platform that can lead to the sustainable growth of the Korean economy [21]. Kim, Jung, and Choi (2016) analyzed the impact of smart cities on the Korean economy and provided an economic perspective for developing a sustainable city [22]. As such, the technology that leads the fourth industrial revolution is cited as a major factor leading to positive changes in the entire industry, as well as corporate sales increases through process innovation and productivity improvement.
The impact of the fourth industrial revolution on the economy is naturally related to the theme of sustainable development. In the field of business and economics, companies and industries create profits by maintaining competitiveness, which eventually leads to sustainable economic growth [21].
2.2. Agriculture, ICT Convergence, and Smart Farm
Technology leading the fourth industrial revolution has the characteristics of a general-purpose technology that can be applied to any industry, regardless of the first–third industries. These characteristics have also been applied in agriculture, resulting in the concept of smart farms. A smart farm can remotely and automatically control the growth environment of crops and livestock by applying information and communication technology to greenhouses, barns and orchards. It is accepted as a grafting science technology and ICT throughout the agricultural value chain for optimizing the growing environment [1,2].
The concept of smart farms dates back to the early 1980s, when digital technologies began to be applied to agriculture and precision agriculture was the starting point [29]. Precision agriculture began to improve agricultural productivity using data related to crop cultivation. Since then, with the development of information and communication technology, a decision-making system has been established in the existing system to achieve optimal growth and management efficiency in agriculture based on crop and weather data using satellites and GPS [29,30]. Recently, the fourth industrial revolution technology, such as sensing and monitoring technology, as well as robots combined with artificial intelligence, have been combined with existing systems and agri-machines and applied to the first industry as a whole, expanding to the concept of smart farms. Accordingly, smart farms are expected to be able to expand and transform into a new type of business by affecting the efficiency and productivity of the growth process and overall value chain of agriculture, forestry, livestock and fisheries [2].
The emergence of smart farms and changes in the primary industry have led to smart farm-related research in various academic fields. Smart farm-related research using IoT technology connects various sensors and cloud services and applies them to various agricultural and livestock fields, and pest prevention and management [6,7,10,31,32]. Previous studies have proposed a system model to improve the convenience and productivity of the work process by remote management using devices such as smartphones during the growth process [6,7,10,31,32]. In addition, a study proposed a system that can improve efficiency and productivity by applying various types of environmental information necessary for growth and data necessary for production, distribution and sales to not only production but also distribution processes [11]. In addition, by applying artificial intelligence and big data technology to existing expert systems or robots, we propose a model that can improve profitability by improving the decision-making power required in the growth process and enabling precise work [7,9,13,14].
In the case of studies approaching smart farm from a different perspective, Kernecker et al., (2020) conducted research that contributes to improving farmers’ access to smart farm technology through a study on experiences and expectations of smart farm technology [33]. Yarashynskaya & Prus (2022) presented socioeconomic, agricultural technology, finance, technology and information factors as the main adoption factors in a case study on precision agriculture adoption factors [34]. and Tataridas et al., (2022) argued that new technologies and precision agriculture play an important role in the framework for sustainable crop and weed management in the EU Green Deal era [35].
In this manner, the fourth industrial revolution technology is applied to agriculture, livestock, and fisheries to enhance convenience, efficiency, productivity and profitability in the growth process as well as to pursue efficiency in farm management. These newly proposed smart farms can be said to be in line with sustainable economic growth.
2.3. Previous Studies Using Input–Output Analysis
This study aims to answer the question: can a smart farm, which includes agriculture, livestock, fishery and smart infrastructure lead to sustainable economic growth of existing agriculture? To this end, this study seeks to find an answer by using the demand and supply inducement models of input–output analysis and the industrial chain model.
Input–output analysis has been used to analyze the impact of a country’s major infrastructure or new industries on the national economy and to propose policies based on the results. For example, Wydra (2011) analyzed the direct and indirect effects of biotechnology on the production and employment using input–output analysis, and confirmed that the indirect effect was greater than the direct effect [36]. Policy proposals, such as the necessity of fostering the biotechnology industry, were made by discovering the economic characteristics that have a greater impact on the industry. Shin (2018) conducted an input–output analysis on the new convergence industry concept of agriculture called the sixth industrialization, and found that the tourism-oriented sixth industry had a higher effect than other types in production-inducing effects, and the distribution-oriented sixth industry had value, showing a greater effect than other types in value-added inducing and supply shortage effects [37]. Through such analysis, policy implications are provided by presenting the economic characteristics of industries to foster new types of industries and economic growth.
In particular, with the digital revolution since 2000, research on the ICT industry-related economic effects has been conducted using input–output analysis, and based on the characteristics and economic effects of the IT hardware, software and service industries, the ICT and other industries have been studied. Policies have been proposed for the relationship between Korea and the growth of the national economy [21,37,38,39,40,41,42]. Since 2010, Kim et al., (2017), Kim et al., (2016), Jun et al., (2018), and Shin and Choi (2019) have conducted research on new converged industries (U-healthcare, smart city, smart port, and ICT, respectively). As research on the economic characteristics and effects of each industry was conducted, policies were proposed for national economic growth [21,37,40,41,42,43].
The input–output analysis has analyzed the economic effects of new industries that have emerged as a result of the convergence of several industries and has made policy recommendations. Among them, Shin and Choi (2019) used input–output analysis as a methodology to answer whether the fintech industry can play a role as a platform industry for the national economy [21]. The possibility was suggested that fintech can play a role as a platform industry in the national economy by analyzing and comparing classification and detailed fintech classification. This is possible because input–output analysis can analyze the sum of economic ripple effects, such as production, added-value and supply shortage effects of the target industry on the overall national economy, and the impact on each industry and the economic effect of the industry itself.
Therefore, this study also analyzes existing agriculture, smart agri-machines, and smart farms using input–output analysis to determine whether smart farms can be an alternative to sustainable agricultural economic growth.
3. Data and Methodologies
This study analyzes the forward and backward effects of each research target industry using input–output analysis methodologies targeting agriculture, smart farms and smart agri-machines to determine whether smart farms lead to sustainable economic growth in agriculture. The linkage effect, production-inducing effect of the demand-inducement model, value-added inducing effect and supply shortage effect of the supply inducement model were analyzed. In addition, this study used an exogenous specification to calculate the effect of the analyzed target industry on other industries and the economic effect of the analyzed target itself. Here, the effect of externalization on the output of the sector to be analyzed, rather than on aggregate demand, and the effect that the output induces on other industries, can be seen more clearly [44]. To help understand this, the next section presents the input–output table used for this and the methodology for each model.
3.1. Input–Output Table
The input–output table is a comprehensive statistical table that records inter-industry transaction relations of goods and services produced in a country for a certain period of time [42]. Input–output analysis is advantageous in analyzing the specific economic structure, as it can analyze the relationship between industries that macroscopic analysis cannot interpret [45]. In addition, input–output analysis is a linear cross-sectoral model for determining output and shows how a change in the level of production in one sector creates a continuous demand for the output of another sector. As this model has the characteristics of a general equilibrium model with an emphasis on the relationship between sales and purchases of inputs, it has been recognized as a useful method for analyzing and predicting the overall economic impact [45].
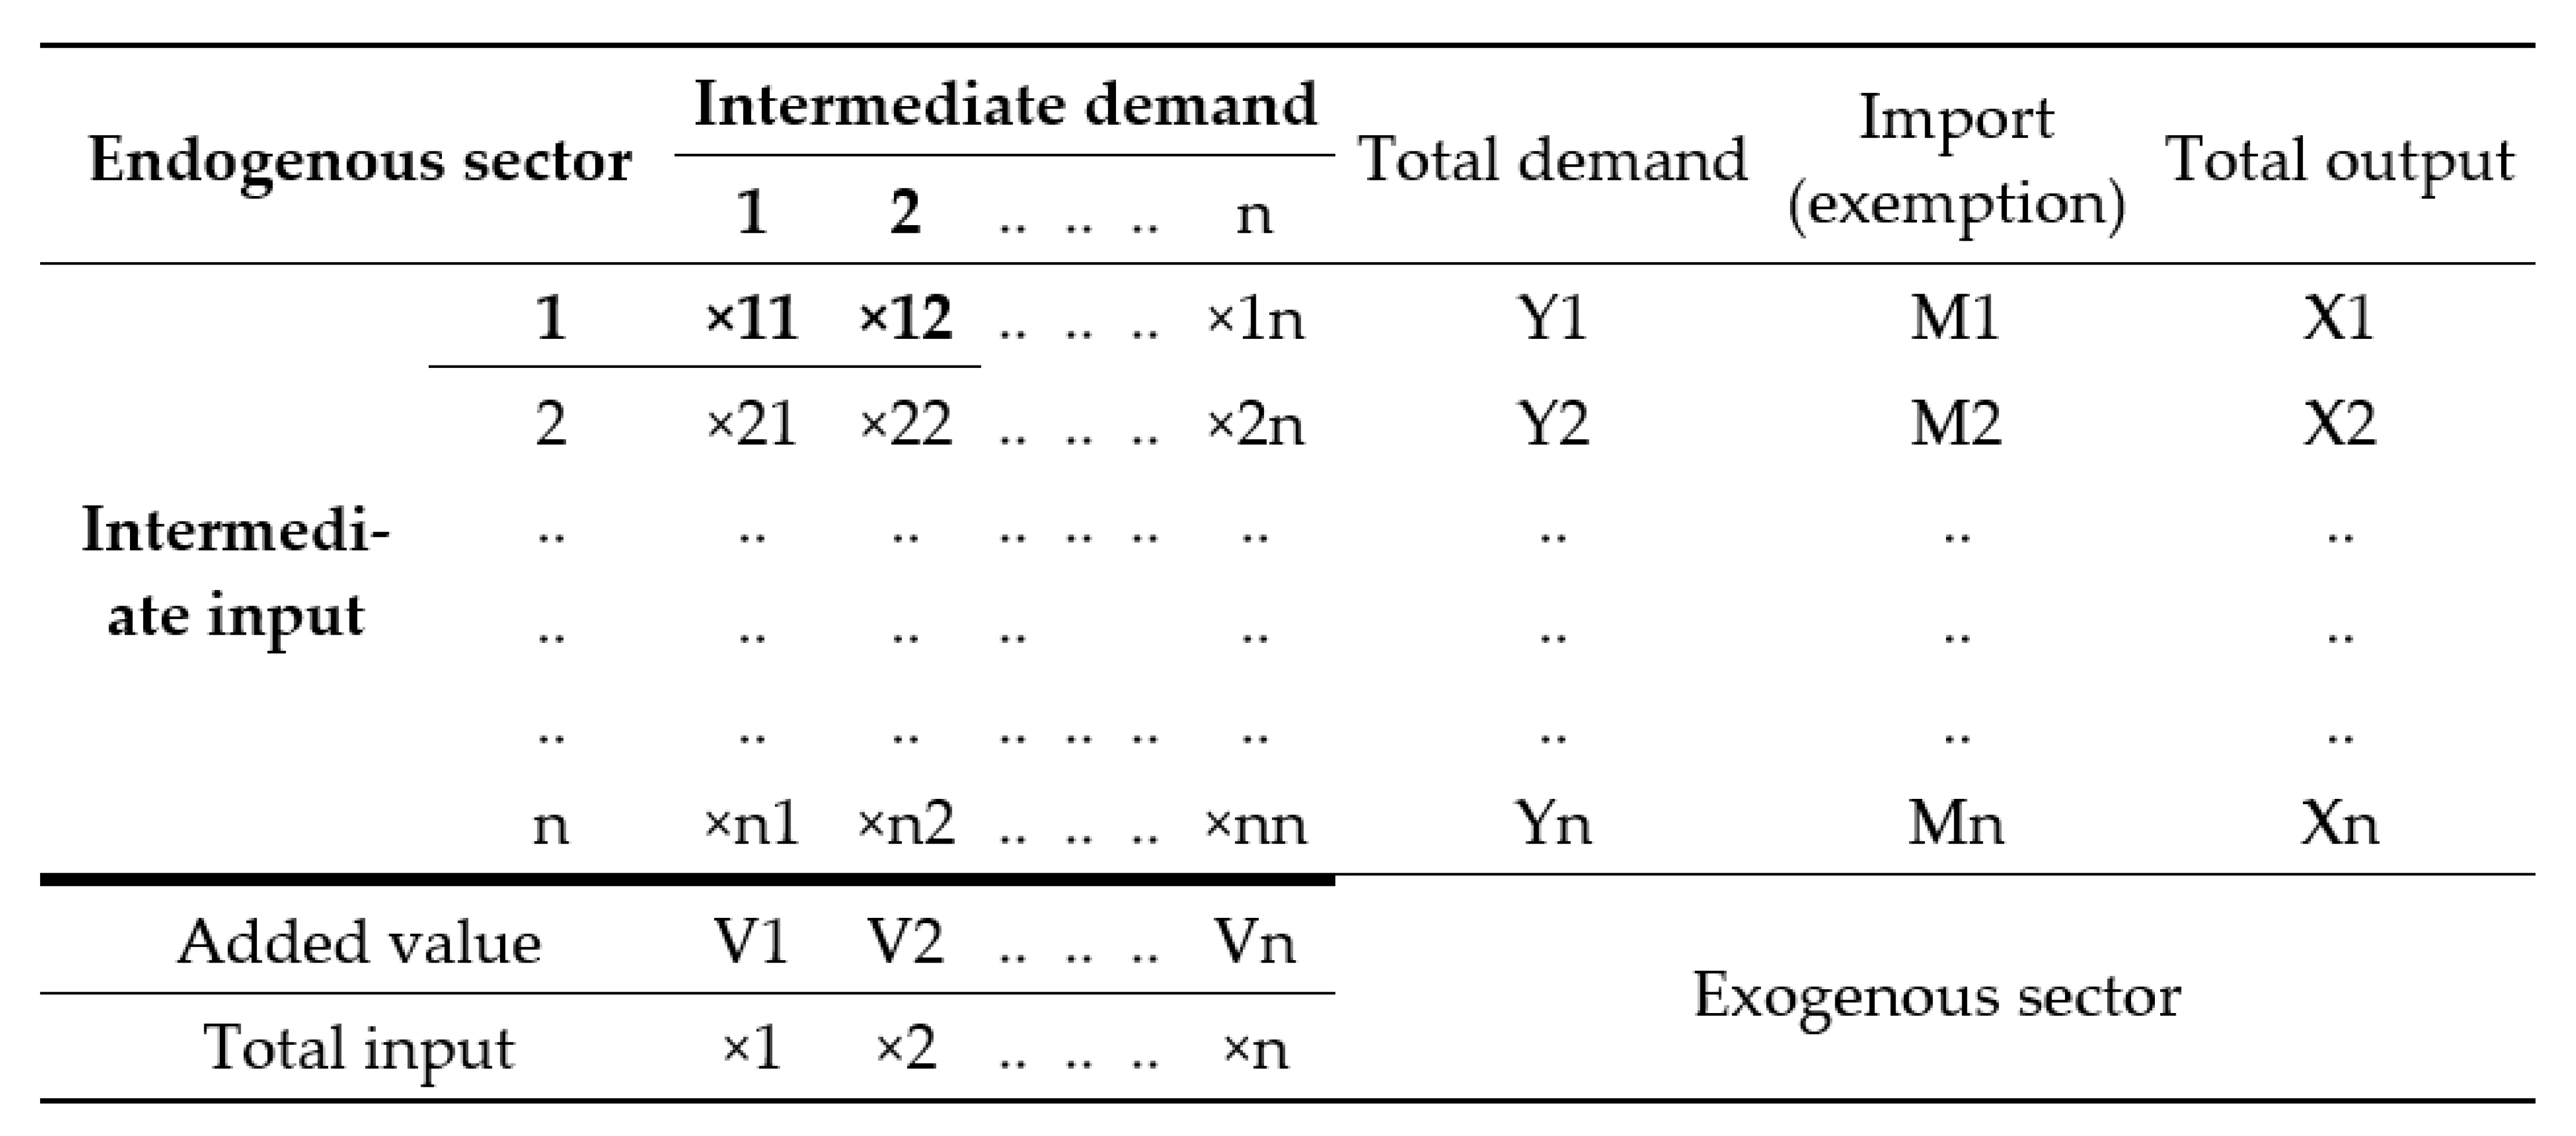
Figure 1 shows the basic structure of the input–output table. As shown in the figure, the structure of the input–output table is largely divided into endogenous and exogenous components. Here, the endogenous sector is the most important part that records intermediate demand and input, which means mutual transactions between industries (marked with a thick line). The most difficult and important part of creating an input–output table is the part indicated with a bold line. The exogenous sector is the part where the value is determined outside the model, regardless of the endogenous sector, and final demand and added-value are recorded.
In an input–output table with this structure, the vertical and horizontal directions have different meanings. The vertical direction corresponds to the input structure, which consists of the production cost spent by each industrial sector for the production of the product. The total input is calculated by adding the intermediate input and added-value. The horizontal direction is the distribution structure, indicating how much of each industry sector’s output is sold to each sector in the form of intermediate or final demand. The sum of intermediate and final demands is the total output by subtracting imports. Because the input–output table is based on the Leontief production function, the total input and output have the same value [46].
3.2. Input–Output Analysis
3.2.1. Demand-Inducement Model
Analysis of production and value-added inducing effects can be carried out using the demand-inducement model. Here, production and value-added inducing effects refer to the amount of production and value-added inducement that affects the analyzed and other industries when a KRW 1 investment is made in the analyzed industry. Equations required for this are shown in Equations (1)–(4) below. In Equation (1), the input coefficient (αij) is obtained by dividing the intermediate input amount (Xij) of raw materials that each industrial sector purchases from other industrial sectors to produce goods and services by the total input amount (Xi). If this is expressed in the same arrangement as the endogenous section of the input–output table, it becomes an input coefficient table (A). To calculate the ripple effect of each analysis target, the input factor (αij) is calculated using the input–output table reclassified from the input–output table for each target industry. The expression is the same as in Equation (1):
ij inter-industry input coefficient
- : i sector’s total input
- : Inputs of i used in sector j
The production inducement coefficient is calculated using Equation (2) after converting the analyzed target industry into an exogenous variable.
Production inducing coefficient =
- : row vector of the input factor of the reclassified industry
- : diagonal matrix
- : () matrix.
The value-added coefficient is the sum of the added value of each industrial sector on the input–output table divided by the total output, and the formula is as shown in Equation (3).
j sector’s value-added coefficient
- : j sector’s total value added.
The value-added induction coefficient is the national economic net value obtained from the analyzed target industry, and the value-added attribution part of the production-inducing effect is measured through the added value coefficient. Therefore, the value-added inducement coefficient is calculated by multiplying the value-added coefficient by the production inducement coefficient, as shown in Equation (4).
Value-added induction coefficient =
- : value-added coefficient’s diagonal matrix
- : production-inducing coefficient.
3.2.2. Supply-Inducement Model
The supply shortage effect, which is a supply inducement model method, indicates how much production will decrease in other industries when the production of the analyzed industry is not achieved. To calculate these supply shortage effects, a calculation coefficient table was first created. The expressions for this are (5)–(6). In Equation (5), the output coefficient (Rij) was obtained by dividing the intermediate input amount of raw materials purchased from other sectors by each industry for the production of goods and services in that sector by the total output. If this is arranged in the same form as the endogenous section of the input–output table, it becomes a calculation coefficient table.
ij inter industry output coefficient
- : i sector’s total output
- : Input of i used in sector j.
After externalizing the analyzed industry, the supply disruption coefficient was calculated using the following basic model Equation (6).
Supply Shortage coefficient =
- : output coefficient column vector of the analyzed industry
- : diagonal matrix
- : output coefficient matrix.
3.2.3. Industry Linkage Effect
The industry linkage effect consists of both forward and backward linkage effects. The forward linkage effect (FLi), also called the sensitivity coefficient, is the number of units that refers to the percentage of the entire industry average. The formula for analyzing this is the same as Equation (7), which is the value obtained by dividing the sum of the rows of the production inducement coefficient (αij) matrix by the entire industry average of the sum of the rows of the production inducement coefficient matrix.
The backward linkage effect (BLi), also called the influence coefficient, is the ratio of the industry-specific inducement coefficient to the average production inducement coefficient (αij) of all industries. It is expressed as the value divided by the average value. The expression for this is as in Equation (8).
3.3. Industry Classification and Re-Definition
Next, to carry out this study, agriculture, smart agri-machines and smart farms were reclassified and defined based on the input–output table. The data used for this purpose were from the 2019 Input–Output table issued by the Bank of Korea.
Table 1 reclassifies and defines the analysis target agriculture, smart agri-machines, and smart farms according to the industry classification on the Input–Output table. Here, agriculture included sectors corresponding to agriculture, forestry, livestock and fisheries, excluding the manufacturing using them, and five sectors based on the middle classification fall under this category. Smart agri-machines were largely composed of smart sector and agriculture-related machines. Firstly, 7 smart hardware, and 2 software & service sectors were classified into the smart sector according to the classification criteria used in previous studies, and game-related software was excluded from the software sector [21,40]. Agri-machines were the subjects to which smart technology was applied, and included general agriculture machinery and agri-machines. Smart farm research was conducted by classifying both agriculture and smart agri-machines as described above into one industry.
As shown in Table 1, agriculture, smart agri-machines and smart farm industries were reclassified and defined as analyzed industries. This study analyzed the economic ripple effect of the industry itself, which corresponded to the direct effect, and the economic ripple effect on other industries, which corresponded to the indirect effect, focusing on each industry. As shown in Table 2, the industries were classified into 30 industrial sectors, and the three analyzed industries are located at the end.
When analyzing the economic ripple effect on other industrial sectors, if agriculture was the analyzed industry, the other industry sectors were divided into 30 and smart agri-machines. If smart agri-machines were the target industry for analysis, the other industries were divided into 30 and agriculture. Similarly, if smart farm was the target industry for analysis, the other industrial sectors were divided into agriculture, smart agri-machines, and 30 industrial sectors.
3.4. Research Procedure
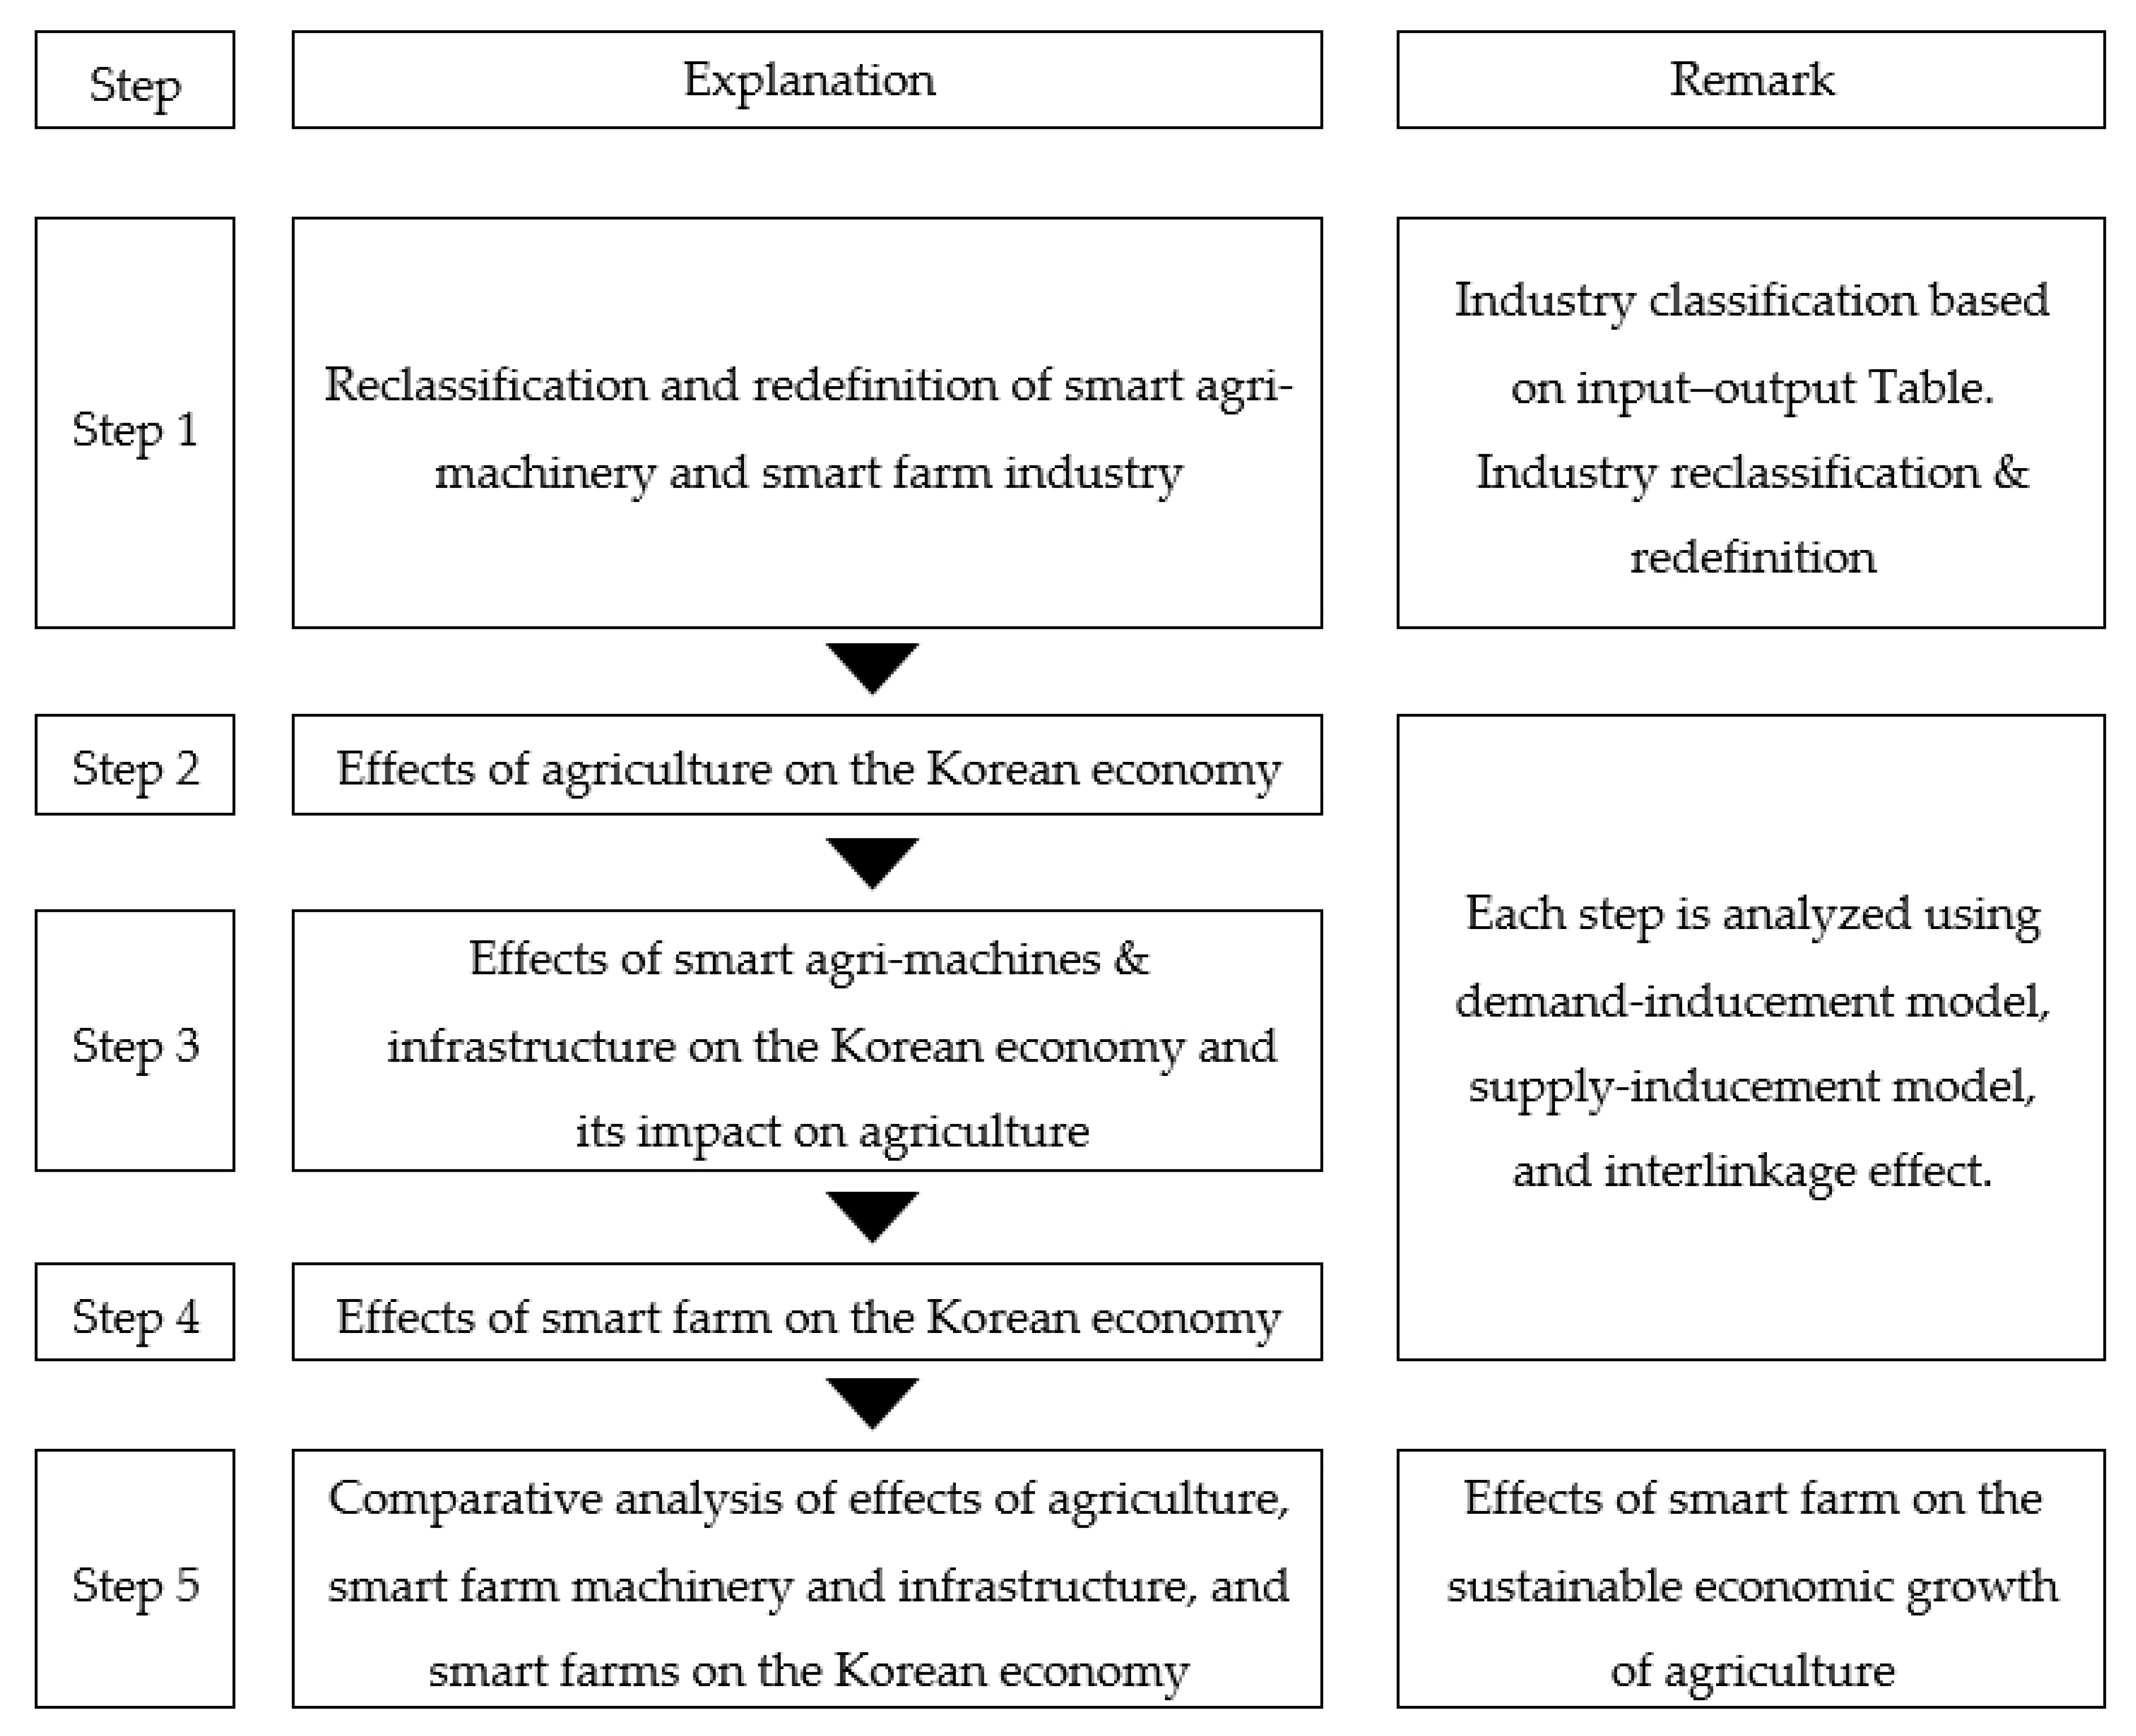
This study uses the demand inducement, supply inducement, and industrial chain models of input-output analysis to determine whether smart farms lead to sustainable economic growth in agriculture. Next, we examined the detailed steps and meaning of each step. In Figure 2, Step 1 is the process of redefining the analysis target through industry classification. Because this study uses the input–output table, agriculture, smart agri-machines, and smart farms were each reclassified based on the industry classification of the input–output table.
Steps 2–4 analyze the economic ripple effect on the subject. Step 2 is the first step in the analysis process, and analyzes the economic ripple effects of agriculture. This process is used as a criterion to judge sustainable economic growth. Step 3 analyzes the economic ripple effect of smart agri-machines and their impact on agriculture. This course examines the economic role of agriculture-related smart technology and the fourth industrial revolution technology by examining the impact of major smart farm technologies on the national economy and agriculture. Step 4 analyzes the economic ripple effect of the smart farm created by combining agriculture and smart agri-machines. These results are the main comparators of phase 2 agriculture.
Step 5 compares and analyzes the results obtained through the input–output analysis’s demand-inducement model, supply-inducement model, and interlinkage effect from Steps 2–4. In this process, the criteria by which sustainable economic growth can be assessed are production-inducing, value-added inducing, and supply shortage effects [21]. In addition, by comparing the direct and indirect ripple effects of the analyzed industries, the ratio of impacts by industry, interlinkage effect, economic role and characteristics of existing agriculture and smart farms are identified, and future development plans are sought.
4. Empirical Evaluation and Results
In this section, the results of the demand-inducement and supply-inducement models are presented. Subsequently, the results of the interlinkage effect are presented for a comparison between the analyzed industries. In addition, the results will be summarized and presented in order to differentiate the economic effect between each subject of analysis and define the economic role of smart farms for sustainable growth of agriculture.
4.1. Results of the Economic Ripple Effect of Agriculture Industry
Table 3 analyzes the production-inducing effects of agriculture on each industry, value-added-inducing effects and supply shortage effects. First, it is the result of production-inducing effects in the demand-induction model. Production-inducing effects refer to the effect on the production of other industries when the input or output of KRW 1 occurs in the analyzed industry. The economic ripple effect of agriculture on other industries in the Korean economy was KRW 1.051; the economic effect of agriculture itself was KRW 1.145; and the total economic effect was KRW 2.196. The industries with the largest production-inducing effect by agriculture were food and beverage (KRW 0.214), chemicals (KRW 0.146), and wholesale and retail trade services (KRW 0.08). Smart agri-machines ranked fifth among the 31 categories with KRW 0.059.
Value-added-inducing effects represent the added value induced in other industries according to the input and output of KRW 1 in the analyzed industry. The value-added-inducing effect of agriculture on other industries was KRW 0.386, and its own value-added-inducing effect was KRW 0.510, totaling KRW 0.896. By industry, food and beverage was KRW 0.055, wholesale and retail trade services were KRW 0.042 and chemicals were KRW 0.040. The impact on smart agri-machines was also KRW 0.024, which ranked seventh among the 31 categories.
Supply shortage effects indicate how much production of other industries will decrease when the production or supply of the analyzed industry is not achieved. Agriculture had a total of KRW 1.975 in supply shortage effects, and the industry most affected by agriculture was food and beverage (KRW 0.766), accounting for approximately 38.8% of the total supply shortage effects. Accommodation and food services were KRW 0.439, accounting for approximately 22.2% of the total supply shortage effects. Next, the impact on smart agri-machines was KRW 0.078, and chemicals was KRW 0.077, but it accounted for a lower share than the top two industries.
4.2. Results of the Economic Ripple Effect of Smart Agri-Machines Industry
Table 4 shows the results of the second-stage analysis of the impact of smart agri-machines on the Korean economy and agriculture. First, looking at the production-inducing effects of smart agri-machines, the effect on other industries was KRW 0.748, and the effect on the industry itself was KRW 1.468, totaling KRW 2.216. Among them, the industries with the greatest influence were chemicals (KRW 0.104), primary metal products (KRW 0.085), and wholesale and retail trade services (KRW 0.063).
Regarding the value-added inducing effects, the effect of smart agri-machines on other industries was KRW 0.290, and the impact on its own industry was KRW 0.403, totaling KRW 0.693. Impact on wholesale and retail trade services was KRW 0.033; professional, scientific, and technical services was KRW 0.031; and chemicals was KRW 0.028.
Supply shortage effects totaled KRW 0.547, and the industries most affected were transportation equipment (KRW 0.080); professional, scientific, and technical services (KRW 0.058); construction (KRW 0.054); and wholesale and retail trade services (KRW 0.037).
When examining the impact of smart agri-machines on agriculture, the production-inducing effect was KRW 0.006, ranking 21st out of 31 industries, and the value-added effect was KRW 0.003, ranking 18th, indicating that smart agri-machines did not have a significant impact on agriculture. In addition, the supply shortage effect was KRW 0.005, ranked 26th, indicating that the impact of smart agri-machines on agriculture was insignificant.
4.3. Results of the Economic Ripple Effect of Smart Farm Industry
Table 5 shows the production-inducing, value-added-inducing and supply shortage effects of smart farms on the Korean economy. Here, a smart farm, as defined in the table above, is an industry that includes general machinery and agri-machines related to agriculture, computers related to the smart industry, electrical equipment, and information and communication services.
The production-inducing effect of the smart farm industry on other industries was KRW 0.763, and that of its own industry was KRW 1.448, totaling KRW 2.211. Among them, the industries in which smart farms had the greatest impact were chemicals (KRW 0.107); primary metal products (KRW 0.079); wholesale and retail trade services (KRW 0.064); and professional, scientific, and technical services (KRW 0.061).
Regarding value-added-inducing effects, the effect on other industries was KRW 0.293, and the effect on the industry itself was KRW 0.413, totaling KRW 0.706. The impact on technical services were KRW 0.031, followed by chemicals at KRW 0.029. As for the supply shortage effects, the reduction in production in other industries was 0.659 yuan owing to the 1 yuan supply disruption of smart farms. Of these, the industries most affected were food and beverage at KRW 0.077; transportation equipment at KRW 0.076; and professional, scientific, and technical services at KRW 0.058.
4.4. Results of Interlinkage Effect
The interlinkage effect is divided into forward and backward effects. Here, the forward linkage effect identifies the output of the industry to be analyzed as a raw material for other industrial production. In contrast to the forward chain effect, the backward linkage considers the output of the analyzed industry as the final product and the product of other industries as the raw material. The forward and backward chain effect coefficients were evaluated as high or low, based on an average value of 1.
The forward and backward linkage effects can be classified into four types. First, if the coefficients of each of the forward and backward linkage effects are high, it is a medium-demand manufacturing type. Second, if the backward linkage effect is low and the forward linkage effect is high, it is a medium-demand primitive industry type. Third, if the forward chain effect is low and the backward linkage effect is high, the final demand manufacturing type. Fourth, if both the forward linkage effect and the backward linkage effect are low, it is called the final demand type of primitive industry [44].
Agriculture is classified as a final demand-oriented primitive industry, in which both forward and backward effects have a value of ≤1. The smart agri-machines and smart farm industries are classified as medium-demand manufacturing types with forward and backward chain effects >1. The forward chain effect of both smart agri-machines and the smart sector shows the highest value among the classified sectors, and the backward chain effect has a value slightly >1, with smart agri-machines ranked 16th out of 31 sectors and smart farms 30th. It was ranked 16th among the categories (Table 6).
4.5. Results Summary and Comparative Analysis
The following is a comparison of the direct and indirect production-inducing effects of the analyzed agriculture, smart agri-machines and smart farms, and the impacts of industry (Table 7). First, considering how much effect it has on the industry itself, agriculture was 1.145, smart agri-machines were 1.468, smart farms were 1.448, and smart agri-machines and smart farms appeared higher than agriculture. The production-inducing effects of smart farms including agriculture and smart agri-machines were confirmed to be higher than the production effects of agriculture itself, regardless of the productivity of agricultural products. This implies that when agriculture is converted to smart farms, it has a positive impact on the production of the entire agricultural market.
On the other hand, considering the effect on other industries by the analyzed industry, in the case of agriculture, only minerals (excluding agriculture) accounted for 5.19% of the total effect. The secondary industry showed the highest rate (58.41%) of the total production-inducing effects, and the tertiary industry accounted for 36.40%. The production-inducing effects of the smart agri-machines industry accounted for 6.99% of the total production-inducing effects of the primary industry, followed by 49.58% in the secondary industry, and 43.44% in the tertiary industry. Finally, smart farms affected 6.16% of minerals in the primary industry, 50.62% in the secondary industry, and 43.21% in the tertiary industry.
To summarize, the share of agriculture in the secondary industry and smart farms in the tertiary industry increased slightly compared to agriculture due to the influence of smart agri-machines. In addition, as the sum of the direct and indirect effects, agriculture was the highest at KRW 2.196, followed by smart agri-machines at KRW 2.216, and smart farms at KRW 2.211. In the case of agriculture, the effect on other industries was 47.85%, which was higher than that of smart agri-machines and farms.
The following is a comparative analysis of the value-added-inducing effects (Table 8): agriculture had the highest direct and indirect effects at KRW 0.896, followed by smart farms at KRW 0.706, and smart agri-machines at KRW 0.693. Among the total value-added-inducing effects, the proportion of direct and indirect effects was in the early 40% range for all three industries analyzed, and the direct effect was in the mid-to-high 50% range. However, when considering the effects of industry, the pattern was somewhat different. In the case of agriculture, 6.67% of the primary industry (minerals), 45.85% of the secondary industry, and 47.48% of the tertiary industry were found to have a greater impact on the service industry, unlike the production-inducing effects. Smart farms accounted for 7.57% of the primary industry (minerals), 37.90% of the secondary industry, and 54.53% of the tertiary industry, and that its value-added effect on the service industry accounted for a larger proportion than that of agriculture.
Lastly, the supply shortage effect was KRW 1.975 in the case of agriculture, which showed a much higher effect than other smart agri-machines and farms. In the case of agriculture, the primary industry (minerals) accounted for 0.04%, the secondary industry accounted for 56.43%, and the tertiary industry accounted for 43.53%, which had a greater impact on manufacturing. On the other hand, smart agricultural machinery and smart farms have had a greater impact on the tertiary industry. In the case of smart agri-machines accounted for 0.93% for the primary industry, 40.91% for the secondary industry, and 58.16% for the tertiary industry, smart farms accounted for 0.09% of the primary industry (minerals), 44.57% of the secondary industry, and 55.35% of the tertiary industry (Table 9).
5. Conclusions
This study focused on smart farms in Korea to confirm that the fourth industrial revolution technology is a tool that can pursue sustainable economic development in agriculture. The method used in the analysis was the input–output table, among which the production-inducing effects of the demand-inducement model, value-added-inducing effects, supply shortage effects of the supply-inducement model and the interlinkage effect that can determine the characteristics of the industry were used. This study used this method to compare the impact of smart farm machinery on agriculture and the impact of smart farms on the Korean economy compared to conventional agriculture, thereby confirming the extent of effect of fourth industrial revolution technology on agriculture. We wanted to determine whether this agricultural sector could lead to sustainable economic development.
The analysis revealed that the production-inducing effects of smart farms showed a greater ripple effect than those of the agricultural sector. However, both value-added-inducing and supply shortage effects showed a larger ripple effect in the agricultural sector. Among these results, considering only the indirect effect, smart farms were found to evenly affect the secondary and tertiary industries rather than agriculture. In the case of value-added-inducing and supply shortage effects, agriculture was found to have a greater impact on the secondary industry, whereas smart agri-machines and farms had a greater impact on the tertiary industry. In addition, according to the interlinkage effect, agriculture was classified as a raw industry with final demand, and smart farms as a manufacturing industry with intermediate demand.
These results confirm the possibility of the fourth industrial revolution technology being a tool that can be used for sustainable economic growth in agriculture. Based on the results of this study, the following points and implications are presented for smart farms to become a model for sustainable economic growth in agriculture.
First, smart farms and agri-machines, which represent the industrial characteristics of the medium-demand manufacturing type, must create various business models linked to other industries. Among the economic characteristics of an industry, an intermediate demand manufacturing industry means that the industry is provided as a raw material for other industries. In other words, smart farms and agri-machine industries can be used in various industries. To improve the level of economic ripple effects of smart farms and agri-machines by utilizing these characteristics and to secure the sustainability of the industry, it is necessary to constantly attempt to create value by developing new types of business models linked to other industries.
Next, for smart farms to fully exert their economic effects, continuous management and support are required to achieve strategic utilization. The indices of indirect production-inducing, value-added-inducing, and supply shortage effects, which represent the economic ripple effects of smart farms, were lower than those of conventional agriculture. This can be interpreted as a situation in which the effects of the fourth industrial revolution technologies examined in the literature are not fully expressed. For the fourth industrial revolution technology to show a sufficient effect in the agricultural sector, strategic utilization of ICT-based fourth industrial revolution technology specialized in the agricultural sector is necessary. Just as the information system management area has received attention and its influence has been proven in the field of business administration and various social sciences, the agricultural field also needs research, support, and continuous management in various forms. To this end, not only technical resources but also the operation and execution of smart farms and training of human resources who can plan must be conducted simultaneously.
In addition, this study provides the following implications from a practical point of view. First, it can be usefully used when establishing support policies for smart farm technology for government-level farmhouses. Second, companies in the field of smart farm technology can use it as data to quantitatively grasp the level of economic ripple effects of smart farms in Korea. Lastly, agriculture-related companies or the subject of smart farm introduction will be able to use it as important data when checking the future direction of agriculture and thinking about what to prepare for smart farm to achieve results.
By analyzing the economic ripple effect of smart farms, this study explored whether the fourth industrial revolution technology could be applied to agriculture to achieve sustainable economic growth. This approach is meaningful because it judges sustainability by comparing the economic approaches of smart farms and agriculture. However, the following limitations and topics for further research remain.
First, it was analyzed using the 2019 Korean Input–Output table. It has been six years since the basis for the promotion of smart farm supply and R&D was prepared, and the entire plan of the ‘Agriculture, Forestry, and Food Science and Technology Fostering Mid- to Long-term Plan’ for 2013–2022 has not been completed. Accordingly, this can be seen as a time when smart farms have not achieved the economically mature stage. The results of this study confirm the possibility of sustainable economic growth. Therefore, when the supply of smart farms is expanded to include various types of agriculture in the future, analysis of their difference from the results of this study and their causes will be necessary.
In addition, since this study analyzed various stages ranging from agriculture, smart agri-machines and smart farms to achieve the research purpose, Korea has a high level of information and communication technology utilization and promotes the spread and R&D of smart farms as a policy. However, there is a need to conduct research targeting several countries because there are differences in the utilization of information and communication technology by country and there are differences in agricultural industrial scale and manpower. Subsequently, a more generalized result can be obtained by comparatively analyzing the economic effects of each country.
Finally, it is necessary to conduct research on the business side to create value for smart farms. For the fourth industrial revolution technology to be applied to any industry and create value, managerial aspects must be considered. Only when these studies are conducted and applied can the effects of the fourth industrial revolution technology be obtained, and economically sustainable growth can be achieved.
Author Contributions
Conceptualization, Y.J.S.; methodology, Y.J.S.; software, S.-W.C.; validation, Y.J.S.; formal analysis, S.-W.C.; investigation, S.-W.C.; resources and data curation, S.-W.C.; writing—original draft preparation, Y.J.S.; writing—review and editing, S.-W.C.; supervision, Y.J.S.; project administration, S.-W.C. All authors have read and agreed to the published version of the manuscript.
Funding
This paper was supported by the Academic Research Fund of Dr. Myung Ki (MIKE) Hong in 2021.
Institutional Review Board Statement
Not applicable.
Informed Consent Statement
Not applicable.
Data Availability Statement
Not applicable.
Conflicts of Interest
The authors declare no conflict of interest.
References
- Park, G.M. Trends in Digital Transformation in Agriculture, SPRI. 2016. Available online: https://spri.kr/posts/view/21657?code=industry_trend (accessed on 28 April 2020).
- ISTANS Smart Farm Emerging as a High Value-Added Industry, ISTANS Insight, 2018 No.2. 2018. Available online: https://www.istans.or.kr›website›reindex›ISTANS_2018100100450817 (accessed on 28 April 2020).
- S&T GPS. Smart Farm Recent Trends and Implications, Issue Analysis Vol.200. S&T GPS. 2021. Available online: https://now.k2base.re.kr/portal/issue/ovseaIssued/view.do?poliIsueId=ISUE_000000000000993&menuNo=200046&pageIndex= (accessed on 26 December 2022).
- Chang, Y.J.; Kim, T.W. Smart Farm Diffusion and Distribution Project Status and Challenges-Focusing on ICT Convergence Projects in Agriculture-, IoT and Agriculture Data Analysis for Smart Farm, 2019, No.95. Available online: https://www.nars.go.kr/brdView.do?brd_Seq=26831&currtPg=1&cmsCd=CM0155&category=b3&src=&srcTemp=&pageSize=10 (accessed on 28 April 2020).
- MAFRA (Ministry of Agriculture, Food and Rural Affairs). Smart Farm Spread Plan. Available online: https://www.mafra.go.kr/mafra/2871/subview.do (accessed on 27 December 2022).
- Muangprathub, J.; Boonnam, N.; Kajornkasirat, S.; Lekbangpong, N.; Wanichsombat, A.; Nillaor, P. IoT and agriculture data analysis for smart farm. Comput. Electron. Agric. 2019, 156, 467–474. [Google Scholar] [CrossRef]
- Chen, J.I.Z.; Hengjinda, P. Applying AI Technology to the Operation of Smart Farm Robot. Sens. Mater. 2019, 31, 1777–1788. [Google Scholar] [CrossRef]
- Lim, L.J.; Sambas, H.; MarcusGoh, N.C.; Kawada, T.; JosephNg, P.S. ScareDuino: Smart-farming with IoT. Int. J. Sci. Eng. Technol. 2017, 6, 207–210. [Google Scholar] [CrossRef]
- Kang, M.; Wang, F.Y. From parallel plants to smart plants: Intelligent control and management for plant growth. IEEE/CAA J. Autom. Sin. 2017, 4, 161–166. [Google Scholar] [CrossRef]
- Abbas, A.; Jilani, M.T.; Khan, M.K. Comparative Analysis of Wireless Technologies for Internet-of-Things Based Smart Farm. Sci. Int. 2017, 29, 373–378. [Google Scholar]
- Kim, S.; Lee, M.; Shin, C. IoT-based strawberry disease prediction system for smart farming. Sensors 2018, 18, 4051. [Google Scholar] [CrossRef]
- Pitakphongmetha, J.; Boonnam, N.; Wongkoon, S.; Horanont, T.; Somkiadcharoen, D.; Prapakornpilai, J. Internet of things for planting in smart farm hydroponics style. In Proceedings of the 2016 International Computer Science and Engineering Conference (ICSEC), Chiang Mai, Thailand, 14–17 December 2016; pp. 1–5. [Google Scholar]
- Balducci, F.; Impedovo, D.; Pirlo, G. Machine learning applications on agricultural datasets for smart farm enhancement. Machines 2018, 6, 38. [Google Scholar] [CrossRef]
- Mohamed, E.S.; Belal, A.A.; Abd-Elmabod, S.K.; El-Shirbeny, M.A.; Gad, A.; Zahran, M.B. Smart farming for improving agricultural management. Egypt. J. Remote Sens. Space Sci. 2021, 24, 971–981. [Google Scholar] [CrossRef]
- Klerkx, L.; Jakku, E.; Labarthe, P. A review of social science on digital agriculture, smart farming and agriculture 4.0: New contributions and a future research agenda. NJAS-Wagening. J. Life Sci. 2019, 90, 100315. [Google Scholar] [CrossRef]
- Trukhachev, V.; Bobrishev, A.; Khokhlova, E.; Ivashova, V.; Fedisko, O. Personnel training for the agricultural sector in terms of digital transformation of the economy: Trends, prospects and limitations. Int. J. Civ. Eng. Technol. 2019, 10, 2145–2155. [Google Scholar]
- Musa, S.F.P.D.; Basir, K.H. Smart farming: Towards a sustainable agri-food system. Br. Food J. 2021, 123, 3085–3099. [Google Scholar] [CrossRef]
- Schwab, K. The Fourth Industrial Revolution; Currency. 2017. Available online: https://www.weforum.org/about/the-fourth-industrial-revolution-by-klaus-schwab (accessed on 16 January 2023).
- Yeung, K. Recommendation of the Council on Artificial Intelligence (OECD). Int. Leg. Mater. 2020, 59, 27–34. [Google Scholar] [CrossRef]
- Rüßmann, M.; Lorenz, M.; Gerbert, P.; Waldner, M.; Justus, J.; Engel, P.; Harnisch, M. Industry 4.0: The future of productivity and growth in manufacturing industries. Boston Consult. Group 2015, 9, 54–89. [Google Scholar]
- Shin, Y.J.; Choi, Y. Feasibility of the Fintech Industry as an Innovation Platform for Sustainable Economic Growth in Korea. Sustainability 2019, 11, 5351. [Google Scholar] [CrossRef]
- Kim, K.; Jung, J.K.; Choi, J. Impact of the smart city industry on the Korean national economy: Input-output analysis. Sustainability 2016, 8, 649. [Google Scholar] [CrossRef]
- Tjahjono, B.; Esplugues, C.; Ares, E.; Pelaez, G. What does industry 4.0 mean to supply chain? Procedia Manuf. 2017, 13, 1175–1182. [Google Scholar] [CrossRef]
- Pfohl, H.C.; Yahsi, B.; Kurnaz, T. The impact of Industry 4.0 on the Supply Chain. In Innovations and Strategies for Logistics and Supply Chains: Technologies, Business Models and Risk Management, Proceedings of the Hamburg International Conference of Logistics (HICL); Epubli GmbH: Berlin, Germany, 2015; Volume 20, pp. 31–58. [Google Scholar]
- Ivanov, D.; Dolgui, A.; Sokolov, B. The impact of digital technology and Industry 4.0 on the ripple effect and supply chain risk analytics. Int. J. Prod. Res. 2019, 57, 829–846. [Google Scholar] [CrossRef]
- Topleva, S. Industry 4.0: Transforming Economy Through Value Added. Asian J. Econ. Model. 2018, 6, 37–46. [Google Scholar] [CrossRef]
- Prause, G. Sustainable business models and structures for Industry 4.0. J. Secur. Sustain. Issues 2015, 5, 159–169. [Google Scholar] [CrossRef]
- Lasi, H.; Fettke, P.; Kemper, H.G.; Feld, T.; Hoffmann, M. Industry 4.0. Bus. Inf. Syst. Eng. 2014, 6, 239–242. [Google Scholar] [CrossRef]
- Mahfuz, S.; Mun, H.S.; Dilawar, M.A.; Yang, C.J. Applications of Smart Technology as a Sustainable Strategy in Modern Swine Farming. Sustainability 2022, 14, 2607. [Google Scholar] [CrossRef]
- Zhang, N.; Wang, M.; Wang, N. Precision agriculture—A worldwide overview. Comput. Electron. Agric. 2002, 36, 113–132. [Google Scholar] [CrossRef]
- Richard, B.; Qi, A.; Fitt, B.D. Control of crop diseases through Integrated Crop Management to deliver climate-smart farming systems for low-and high-input crop production. Plant Pathol. 2022, 71, 187–206. [Google Scholar] [CrossRef]
- Rakhra, M.; Sanober, S.; Quadri, N.N.; Verma, N.; Ray, S.; Asenso, E. Implementing Machine Learning for Smart Farming to Forecast Farmers’ Interest in Hiring Equipment. J. Food Qual. 2022, 2022, 4721547. [Google Scholar] [CrossRef]
- Kernecker, M.; Knierim, A.; Wurbs, A.; Kraus, T.; Borges, F. Experience versus expectation: Farmers’ perceptions of smart farming technologies for cropping systems across Europe. Precis. Agric. 2020, 21, 34–50. [Google Scholar] [CrossRef]
- Yarashynskaya, A.; Prus, P. Precision Agriculture Implementation Factors and Adoption Potential: The Case Study of Polish Agriculture. Agronomy 2022, 12, 2226. [Google Scholar] [CrossRef]
- Tataridas, A.; Kanatas, P.; Chatzigeorgiou, A.; Zannopoulos, S.; Travlos, I. Sustainable Crop and Weed Management in the Era of the EU Green Deal: A Survival Guide. Agronomy 2022, 12, 589. [Google Scholar] [CrossRef]
- Wydra, S. Production and employment impacts of biotechnology—Input–output analysis for Germany. Technol. Forecast. Soc. Change 2011, 78, 1200–1209. [Google Scholar] [CrossRef]
- Shin, Y.J. A Study on Effects of 6 th Industry types on the Korean Economy. J. Korea Converg. Soc. 2018, 9, 325–338. [Google Scholar]
- Shin, Y.J.; Choi, S.W. Effects of the IT service industry on Korean economy: Using inter industry analysis. Int. J. Adv. Comput. Technol. 2013, 5, 360–372. [Google Scholar]
- Shin, Y.J.; Yim, M.S. The Role of the IT Industry in the Korean economy: An inter-industry analysis. Int. J. Appl. Eng. Res. 2015, 10, 123–134. [Google Scholar]
- Kim, Y.J.; Kim, C.Y.; Shin, Y.J. The effects of ubiquitous healthcare service on the south Korean Economy: Using input–output analysis. Inform. Syst. Front. 2017, 19, 1149–1160. [Google Scholar] [CrossRef]
- Xing, W.; Ye, X.; Kui, L. Measuring convergence of China’s ICT industry: An input–output analysis. Telecommun. Policy 2011, 35, 301–313. [Google Scholar] [CrossRef]
- Rohman, I.K. The globalization and stagnation of the ICT sectors in European countries: An input-output analysis. Telecommun. Policy 2013, 37, 387–399. [Google Scholar] [CrossRef]
- Jun, W.K.; Lee, M.K.; Choi, J.Y. Impact of the smart port industry on the Korean national economy using input-output analysis. Transp. Res. Part A Policy Pract. 2018, 118, 480–493. [Google Scholar] [CrossRef]
- Yoo, S.H.; Yoo, T.H. The role of the nuclear power generation in the Korean national economy: An input–output analysis. Prog. Nucl. Energy 2009, 51, 86–92. [Google Scholar] [CrossRef]
- Miller, R.E.; Blair, P.D. Input-Output Analysis: Foundations and Extensions; Cambridge University Press: Cambridge, UK, 2009. [Google Scholar]
- The Bank of Korea. Input-Output Statistics; The Bank of Korea: Seoul, Republic of Korea, 2014. [Google Scholar]
Figure 1.
Input–Output Table Structure.

Figure 2.
Research Procedure.


Table 1.
Classification and redefinition of agriculture, smart equipment, and smart farm industry sector.
Table 1.
Classification and redefinition of agriculture, smart equipment, and smart farm industry sector.
| Classification | Industry Sector | Remark | ||||
|---|---|---|---|---|---|---|
| Smart Farm | Farm | A | 01 | Crops | ||
| 02 | Livestock | |||||
| 03 | Forest products | |||||
| 04 | Seafood | |||||
| 05 | Agriculture, forestry, and fishing services | |||||
| Smart equipment | Smart HW | C09 | 31 | Semiconductor | ||
| 32 | Electronic display | |||||
| 33 | Other electronic parts | |||||
| 34 | Computers and peripherals | |||||
| 35 | Communication, broadcasting, video, and audio equipment | |||||
| 36 | Precision instrument | |||||
| C10 | 37 | Electrical equipment | ||||
| Farm Equipment | C11 | 38 | General purpose machines | |||
| 39 | Special purpose machines | 3911 Agricultural machinery only | ||||
| Smart SW & Service | J | 61 | Information service | 6211 Excluding game software publishing | ||
| 62 | Software development supply and other IT services | |||||
Table 2.
Industry Sectors.
| Sector | Sector | Sector | |||
|---|---|---|---|---|---|
| B | Minerals | C13 | Other manufacturing products | M | Professional, scientific, and technical services |
| C01 | Food and beverage | C14 | Manufacturing and industrial equipment repairs | N | Business services |
| C02 | Textiles and leather products | D | Electricity, gas, and steam | O | Public administration, defense, and social security |
| C03 | Wood and paper and printing | E | Water, waste disposal, and recycling services | P | Education services |
| C04 | Coal and petroleum products | F | Construction | Q | Health and social services |
| C05 | Chemicals | G | Wholesale and retail trade services | R | Arts, sports, and leisure services |
| C06 | Nonmetallic mineral products | H | Transportation services | S | Other services |
| C07 | Primary metal products | I | Accommodation and food services | T | Others |
| C08 | Fabricated metal products | J | (ICT)/broadcasting and newspaper and publishing | Agriculture | |
| C11 | Machinery and equipment | K | Finance/insurance/banking | Smart agri-machines | |
| C12 | Transportation equipment | L | Real estate services | Smart farm | |
Table 3.
Results of different effects of Agriculture industry.
| Sector | Production Inducing Effects | Value Added Inducing Effects | Supply Shortage Effects | ||||
|---|---|---|---|---|---|---|---|
| Effects | Ranking | Effects | Ranking | Effects | Ranking | ||
| B | Minerals | 0.055 | 8 | 0.026 | 5 | 0.001 | 31 |
| C01 | Food and beverage | 0.214 | 1 | 0.055 | 1 | 0.766 | 1 |
| C02 | Textiles and leather products | 0.021 | 15 | 0.004 | 18 | 0.034 | 10 |
| C03 | Wood and paper and printing | 0.031 | 11 | 0.010 | 14 | 0.026 | 12 |
| C04 | Coal and petroleum products | 0.060 | 4 | 0.015 | 10 | 0.020 | 18 |
| C05 | Chemicals | 0.146 | 2 | 0.040 | 3 | 0.077 | 4 |
| C06 | Nonmetallic mineral products | 0.005 | 24 | 0.001 | 26 | 0.007 | 25 |
| C07 | Primary metal products | 0.016 | 16 | 0.003 | 21 | 0.024 | 15 |
| C08 | Fabricated metal products | 0.014 | 19 | 0.005 | 16 | 0.016 | 21 |
| C11 | Machinery and equipment | 0.003 | 28 | 0.001 | 27 | 0.005 | 27 |
| C12 | Transportation equipment | 0.015 | 17 | 0.003 | 20 | 0.036 | 9 |
| C13 | Other manufacturing products | 0.002 | 29 | 0.001 | 29 | 0.006 | 26 |
| C14 | Manufacturing and industrial equipment repairs | 0.028 | 13 | 0.015 | 11 | 0.018 | 19 |
| D | Electricity, gas, and steam | 0.036 | 10 | 0.010 | 15 | 0.014 | 23 |
| E | Water, waste disposal, and recycling services | 0.006 | 22 | 0.003 | 19 | 0.004 | 29 |
| F | Construction | 0.003 | 27 | 0.001 | 25 | 0.040 | 8 |
| G | Wholesale and retail trade services | 0.080 | 3 | 0.042 | 2 | 0.068 | 5 |
| H | Transportation services | 0.057 | 6 | 0.021 | 8 | 0.026 | 13 |
| I | Accommodation and food services | 0.030 | 12 | 0.010 | 13 | 0.439 | 2 |
| J | Broadcasting and newspaper and publishing | 0.002 | 30 | 0.001 | 28 | 0.004 | 28 |
| K | Finance/insurance/banking | 0.043 | 9 | 0.025 | 6 | 0.025 | 14 |
| L | Real estate services | 0.014 | 18 | 0.011 | 12 | 0.013 | 24 |
| M | Professional, scientific, and technical services | 0.057 | 7 | 0.029 | 4 | 0.056 | 7 |
| N | Business services | 0.026 | 14 | 0.017 | 9 | 0.016 | 22 |
| O | Public administration, defense, and social security | 0.006 | 21 | 0.005 | 17 | 0.023 | 16 |
| P | Education services | 0.001 | 31 | 0.000 | 30 | 0.029 | 11 |
| Q | Health and social services | 0.004 | 25 | 0.002 | 23 | 0.062 | 6 |
| R | Arts, sports, and leisure services | 0.004 | 26 | 0.002 | 24 | 0.023 | 17 |
| S | Other services | 0.006 | 23 | 0.003 | 22 | 0.018 | 20 |
| T | Others | 0.007 | 20 | 0.000 | 31 | 0.002 | 30 |
| Smart Agri-machines | 0.059 | 5 | 0.024 | 7 | 0.078 | 3 | |
| Agriculture (Indirect Effect) | 1.051 | 0.386 | |||||
| Direct Effect | 1.145 | 0.510 | |||||
| Total Effect | 2.196 | 0.896 | 1.975 | ||||
Table 4.
Results of different effects of Smart Agri-machines.
| Sector | Production-Inducing Effects | Value-Added-Inducing Effects | Supply Shortage Effects | ||||
|---|---|---|---|---|---|---|---|
| Effects | Ranking | Effects | Ranking | Effects | Ranking | ||
| B | Minerals | 0.046 | 6 | 0.022 | 4 | 0.001 | 31 |
| C01 | Food and beverage | 0.012 | 17 | 0.003 | 19 | 0.012 | 17 |
| C02 | Textiles and leather products | 0.009 | 20 | 0.002 | 24 | 0.009 | 22 |
| C03 | Wood and paper and printing | 0.013 | 16 | 0.004 | 15 | 0.005 | 25 |
| C04 | Coal and petroleum products | 0.031 | 9 | 0.008 | 14 | 0.017 | 10 |
| C05 | Chemicals | 0.104 | 1 | 0.028 | 3 | 0.031 | 5 |
| C06 | Nonmetallic mineral products | 0.013 | 15 | 0.004 | 16 | 0.005 | 24 |
| C07 | Primary metal products | 0.085 | 2 | 0.016 | 9 | 0.019 | 8 |
| C08 | Fabricated metal products | 0.042 | 7 | 0.015 | 10 | 0.015 | 14 |
| C11 | Machinery and equipment | 0.011 | 18 | 0.004 | 17 | 0.015 | 13 |
| C12 | Transportation equipment | 0.011 | 19 | 0.002 | 22 | 0.080 | 1 |
| C13 | Other manufacturing products | 0.002 | 28 | 0.001 | 29 | 0.003 | 29 |
| C14 | Manufacturing and industrial equipment repairs | 0.039 | 8 | 0.020 | 5 | 0.013 | 16 |
| D | Electricity, gas, and steam | 0.029 | 11 | 0.008 | 13 | 0.015 | 12 |
| E | Water, waste disposal, and recycling services | 0.005 | 23 | 0.003 | 20 | 0.004 | 27 |
| F | Construction | 0.003 | 26 | 0.001 | 27 | 0.054 | 3 |
| G | Wholesale and retail trade services | 0.063 | 3 | 0.033 | 1 | 0.037 | 4 |
| H | Transportation services | 0.050 | 5 | 0.018 | 7 | 0.021 | 7 |
| I | Accommodation and food services | 0.023 | 13 | 0.008 | 12 | 0.018 | 9 |
| J | Broadcasting and newspaper and publishing | 0.004 | 24 | 0.002 | 25 | 0.003 | 28 |
| K | Finance/insurance/banking | 0.027 | 12 | 0.016 | 8 | 0.026 | 6 |
| L | Real estate services | 0.014 | 14 | 0.010 | 11 | 0.012 | 19 |
| M | Professional, scientific, and technical services | 0.061 | 4 | 0.031 | 2 | 0.058 | 2 |
| N | Business services | 0.030 | 10 | 0.020 | 6 | 0.009 | 21 |
| O | Public administration, defense, and social security | 0.001 | 30 | 0.001 | 28 | 0.012 | 18 |
| P | Education services | 0.001 | 31 | 0.001 | 30 | 0.011 | 20 |
| Q | Health and social services | 0.002 | 27 | 0.001 | 26 | 0.017 | 11 |
| R | Arts, sports, and leisure services | 0.004 | 25 | 0.002 | 23 | 0.006 | 23 |
| S | Other services | 0.005 | 22 | 0.002 | 21 | 0.013 | 15 |
| T | Others | 0.002 | 29 | 0.000 | 31 | 0.001 | 30 |
| Agriculture | 0.006 | 21 | 0.003 | 18 | 0.005 | 26 | |
| Smart Agri-machines (Indirect Effect) | 0.748 | 0.290 | |||||
| Direct Effect | 1.468 | 0.403 | |||||
| Total Effect | 2.216 | 0.693 | 0.547 | ||||
Table 5.
Results of different effects of Smart farm.
| Sector | Production-Inducing Effects | Value-Added-Inducing Effects | Supply Shortage Effects | ||||
|---|---|---|---|---|---|---|---|
| Effects | Ranking | Effects | Ranking | Effects | Ranking | ||
| B | Minerals | 0.047 | 6 | 0.022 | 4 | 0.001 | 30 |
| C01 | Food and beverage | 0.029 | 13 | 0.007 | 15 | 0.077 | 1 |
| C02 | Textiles and leather products | 0.010 | 20 | 0.002 | 23 | 0.011 | 21 |
| C03 | Wood and paper and printing | 0.014 | 15 | 0.005 | 16 | 0.007 | 24 |
| C04 | Coal and petroleum products | 0.034 | 9 | 0.008 | 12 | 0.018 | 12 |
| C05 | Chemicals | 0.107 | 1 | 0.029 | 3 | 0.035 | 7 |
| C06 | Nonmetallic mineral products | 0.013 | 17 | 0.004 | 17 | 0.005 | 25 |
| C07 | Primary metal products | 0.079 | 2 | 0.015 | 9 | 0.020 | 11 |
| C08 | Fabricated metal products | 0.040 | 7 | 0.014 | 10 | 0.015 | 14 |
| C11 | Machinery and equipment | 0.010 | 19 | 0.004 | 18 | 0.014 | 15 |
| C12 | Transportation equipment | 0.011 | 18 | 0.002 | 20 | 0.076 | 2 |
| C13 | Other manufacturing products | 0.002 | 28 | 0.001 | 28 | 0.003 | 27 |
| C14 | Manufacturing and industrial equipment repairs | 0.038 | 8 | 0.020 | 5 | 0.013 | 17 |
| D | Electricity, gas, and steam | 0.030 | 10 | 0.008 | 14 | 0.015 | 13 |
| E | Water, waste disposal, and recycling services | 0.005 | 22 | 0.003 | 19 | 0.004 | 26 |
| F | Construction | 0.003 | 25 | 0.001 | 27 | 0.053 | 5 |
| G | Wholesale and retail trade services | 0.064 | 3 | 0.034 | 1 | 0.040 | 6 |
| H | Transportation services | 0.051 | 5 | 0.018 | 7 | 0.021 | 9 |
| I | Accommodation and food services | 0.024 | 14 | 0.008 | 13 | 0.055 | 4 |
| J | Broadcasting and newspaper and publishing | 0.004 | 23 | 0.001 | 24 | 0.003 | 28 |
| K | Finance/insurance/banking | 0.029 | 12 | 0.017 | 8 | 0.026 | 8 |
| L | Real estate services | 0.014 | 16 | 0.010 | 11 | 0.012 | 20 |
| M | Professional, scientific, and technical services | 0.061 | 4 | 0.031 | 2 | 0.058 | 3 |
| N | Business services | 0.029 | 11 | 0.020 | 6 | 0.010 | 22 |
| O | Public administration, defense, and social security | 0.002 | 29 | 0.001 | 25 | 0.013 | 19 |
| P | Education services | 0.001 | 30 | 0.001 | 29 | 0.013 | 18 |
| Q | Health and social services | 0.002 | 27 | 0.001 | 26 | 0.021 | 10 |
| R | Arts, sports, and leisure services | 0.004 | 24 | 0.002 | 22 | 0.007 | 23 |
| S | Other services | 0.005 | 21 | 0.002 | 21 | 0.013 | 16 |
| T | Others | 0.002 | 26 | 0.000 | 30 | 0.001 | 29 |
| Smart-Farm (Indirect Effect) | 0.763 | 0.293 | |||||
| Direct Effect | 1.448 | 0.413 | |||||
| Total Effect | 2.211 | 0.706 | 0.659 | ||||
Table 6.
Results of Interlinkage effects.
| Sector | Forward Linkage | Ranking | Backward Linkage | Ranking |
|---|---|---|---|---|
| Effects | Ranking | Effects | Ranking | |
| Agriculture | 0.873 | 18/31 | 0.927 | 21/31 |
| Smart agri-machines | 2.247 | 1/31 | 1.027 | 16/31 |
| Smart farm | 2.657 | 1/30 | 1.013 | 16/30 |
Table 7.
Comparison of production-inducing effects.
| Division | Production-Inducing Effects | |||||
|---|---|---|---|---|---|---|
| Agriculture | Smart Agri-Machines | Smart Farm | ||||
| Effects | Rate | Effects | Rate | Effects | Rate | |
| Indirect effects | 1.051 | 47.85% | 0.748 | 33.75% | 0.763 | 34.53% |
| Direct effect | 1.145 | 52.15% | 1.468 | 66.25% | 1.448 | 65.47% |
| Total effect | 2.196 | 100.00% | 2.216 | 100.00% | 2.211 | 100.00% |
| Primary industry | 0.055 | 5.19% | 0.052 | 6.99% | 0.047 | 6.16% |
| Secondary industry | 0.614 | 58.41% | 0.371 | 49.58% | 0.386 | 50.62% |
| Tertiary industry | 0.383 | 36.40% | 0.325 | 43.44% | 0.330 | 43.21% |
| Indirect effects | 1.051 | 100.00% | 0.748 | 100.00% | 0.763 | 100.00% |
Table 8.
Comparison of value-added-inducing effects.
| Division | Value Added Inducing Effects | |||||
|---|---|---|---|---|---|---|
| Agriculture | Smart Agri-Machines | Smart Farm | ||||
| Effects | Ranking | Effects | Ranking | Effects | Ranking | |
| Indirect effects | 0.386 | 43.06% | 0.290 | 41.86% | 0.293 | 41.56% |
| Direct effects | 0.510 | 56.94% | 0.403 | 58.14% | 0.413 | 58.44% |
| Total effects | 0.896 | 100.00% | 0.693 | 100.00% | 0.706 | 100.00% |
| Primary industry | 0.026 | 6.67% | 0.025 | 8.59% | 0.022 | 7.57% |
| Secondary industry | 0.177 | 45.85% | 0.107 | 37.00% | 0.111 | 37.90% |
| Tertiary industry | 0.183 | 47.48% | 0.158 | 54.41% | 0.160 | 54.53% |
| Indirect effect | 0.386 | 100.00% | 0.290 | 100.00% | 0.293 | 100.00% |
Table 9.
Comparison of supply shortage effects.
| Supply Shortage Effects | ||||||
|---|---|---|---|---|---|---|
| Division | Agriculture | Smart Agri-Machines | Smart Farm | |||
| Effects | Ranking | Effects | Ranking | Effects | Ranking | |
| Primary industry | 0.001 | 0.04% | 0.005 | 0.93% | 0.001 | 0.09% |
| Secondary industry | 1.115 | 56.43% | 0.224 | 40.91% | 0.293 | 44.57% |
| Tertiary industry | 0.860 | 43.53% | 0.318 | 58.16% | 0.364 | 55.35% |
| Total effects | 1.975 | 100.00% | 0.547 | 100.00% | 0.659 | 100.00% |
Disclaimer/Publisher’s Note: The statements, opinions and data contained in all publications are solely those of the individual author(s) and contributor(s) and not of MDPI and/or the editor(s). MDPI and/or the editor(s) disclaim responsibility for any injury to people or property resulting from any ideas, methods, instructions or products referred to in the content. |
© 2023 by the authors. Licensee MDPI, Basel, Switzerland. This article is an open access article distributed under the terms and conditions of the Creative Commons Attribution (CC BY) license (https://creativecommons.org/licenses/by/4.0/).
Share and Cite
MDPI and ACS Style
Choi, S.-W.; Shin, Y.J. Role of Smart Farm as a Tool for Sustainable Economic Growth of Korean Agriculture: Using Input–Output Analysis. Sustainability 2023, 15, 3450. https://doi.org/10.3390/su15043450
AMA Style
Choi S-W, Shin YJ. Role of Smart Farm as a Tool for Sustainable Economic Growth of Korean Agriculture: Using Input–Output Analysis. Sustainability. 2023; 15(4):3450. https://doi.org/10.3390/su15043450
Chicago/Turabian StyleChoi, Sung-Wook, and Yong Jae Shin. 2023. "Role of Smart Farm as a Tool for Sustainable Economic Growth of Korean Agriculture: Using Input–Output Analysis" Sustainability 15, no. 4: 3450. https://doi.org/10.3390/su15043450
Note that from the first issue of 2016, this journal uses article numbers instead of page numbers. See further details here.