

Prediction and Analysis of Vertical Additional Force of Shaft Wall in Topsoil Containing Multiple Aquifers during Drainage
1
State Key Laboratory for Geomechanics and Deep Underground Engineering, School of Mechanics and Civil Engineering, China University of Mining and Technology, Xuzhou 221116, China
2
Shandong Xin Julong Energy Co., Ltd., Heze 274000, China
*
Author to whom correspondence should be addressed.
Sustainability 2023, 15(4), 2877; https://doi.org/10.3390/su15042877
Submission received: 18 November 2022
/
Revised: 2 February 2023
/
Accepted: 2 February 2023
/
Published: 5 February 2023
Abstract
:Studying the additional force in topsoil containing multiple aquifers can have a significant impact on predicting shaft wall fracture and guaranteeing shaft safety, as the aquifer number increases as drainage occurs. In this study, a numerical model calculating the effect of drainage on additional force in topsoil, containing multiple aquifers, was established on the basis of several practical engineering cases. The changes in the stress displacement of the shaft wall was analyzed during three different stages of shaft construction using typical parameters, and the effects of the various factors on the additional force variation under different water level gap conditions, depending on whether the drainage was synchronized or unsynchronized, were studied. The results indicate that the increment in the additional force, with an increasing water level gap in the central aquifer, is obviously larger than that in the bottom aquifer, and the difference in the maximum additional force between these two aquifers is approximately 0.6 MPa. The increasing number of central aquifers results in a higher increment in this force, which reaches 12 MPa with an increasing number of central aquifers. Meanwhile, a threshold value (about 0.6~0.7 H) exists for the depth of a central aquifer in terms of its effect on the additional force.
1. Introduction
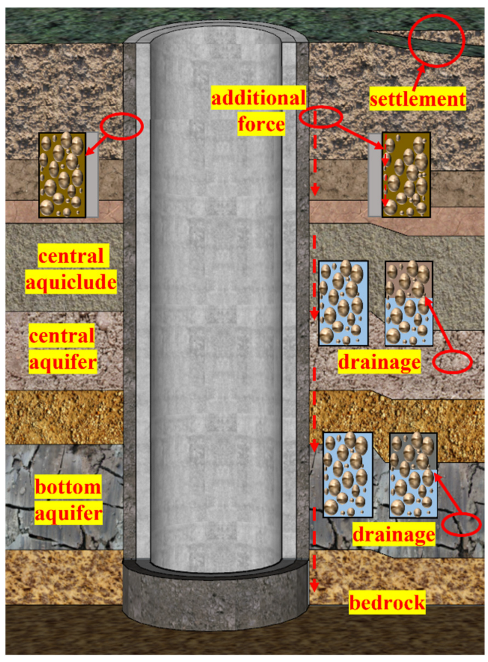
The depth of the shaft continues to increase with the demand of coal resources, and the fracture disasters in vertical shafts, induced by the complex stress, are becoming increasingly frequent, which affect the operation of the entire mine and threaten the safety of personnel [1,2,3,4]. The stresses mainly consist of the vertical stress and the horizontal stress. The horizontal stress can be divided into the lateral pressure from the surrounding stratum, pore water and the horizontal additional force. The lateral pressure has been taken into account and reflected in the designed parameters, and the horizontal additional force generally occurs only in very special cases, such as asymmetric settlement of the topsoil around the shaft; thus, the horizontal stress is not generally considered to be the main cause of shaft wall fracture as the horizontal pressure can be calculated and predicted. The vertical stress mainly consists of the gravity generated by itself and its appendages, which can be calculated directly, and the constantly changing vertical additional forces induced by the long-term slow drainage settlement. The vertical additional force, which is usually induced by the drainage settlement, is recognized as the most important reason for making the shaft fracture, based on a series of studies [5,6,7]. The failure mechanism involves the consolidation settlement of the topsoil during drainage, which enhances the friction force of the shaft wall due to the huge modulus difference between these two materials, while the synchronization or asynchronization of multiple aquifers accelerates the rate of settlement and increases its total level, thus posing a greater threat to the shaft wall, as shown in Figure 1 [8]. Therefore, understanding the additional force caused by the drainage settlement of topsoil containing multiple aquifers is necessary in order to guarantee the safety of the shaft during deep coal resource mining.
A collection of the theoretical analyses of additional forces, when drainage settlement occurs in a single aquifer, in topsoil has been studied. Based on simulation experiments and actual engineering monitoring studies, Cui [9] concluded that the vertical additional force generated by mining activities or artificial drainage is the main reason for shaft wall fractures. Huang et al. [10] studied the variation in vertical additional forces acting on the shaft wall during alluvial drainage using large-scale vertical shaft simulation experiments. They found that the vertical additional forces increase linearly with increasing aquifer depressurization and proposed that the vertical retractable shaft structure should be used to prevent shaft wall fractures caused by alluvial drainage. Yang [11,12] studied the stress states and failure modes of shaft walls under various load magnitudes and found that the additional force is the most important reason for rupture hazards in shaft walls. In addition, Liu et al. [13] simulated the whole fracturing process of a shaft wall and studied the relationships between the additional force and parameters. Li et al. [14] analyzed the interaction of these two materials based on previous studies, under drainage conditions, and concluded that water loss from the bottom aquifer potentially leads to non-mining-related shaft wall fractures, and that the additional force increases with an increasing water level gap.
Subsequently, a series of numerical simulation studies were carried out in order to investigate the effect of different related parameters on the variation law of additional force, based on these theoretical studies. Liu [15] developed a simulation method of reinforced concrete shaft walls based on elastoplastic theory and ANSYS software (Canonsburg, PA, USA) analysis, and then analyzed and confirmed that the additional force plays a dominant role in shaft wall fractures in deep topsoil. In addition, Ding [16] predicted reinforced concrete shaft wall fractures under complex loading conditions, based on the combined effects of the self-weight, horizontal load and vertical additional force, and then analyzed the dynamic processes of the stress, strain and displacement for the shaft wall structure. Shen [17] analyzed the vertical additional force patterns over time, under the combined effects of the horizontal load and self-weight, using a detached shaft model, and simulated the whole process from the beginning of drainage in the aquifer surrounding the shaft until shaft fracturing occurred. Based on a numerical simulation method, Hou et al. [18] found that reducing the permeability coefficient helped to reduce this force.
In addition, a number of scholars have performed numerical simulation studies according to actual shaft and geological conditions in different coal mines. Mu [19] analyzed the stratum settlement and additional force modes when the settlement, induced by drainage, occurred in upper and lower aquifers, utilizing the geological data from the Qianyingzi Coal Mine. Wu [20] analyzed the range of variations of the additional force and the settlement amount of the stratum, under different drainage depths, and predicted the safety state of an auxiliary shaft. Guo [21] also studied the deflection patterns of a vertical shaft, under unilateral drainage conditions, and the horizontal displacement and settlement deformation patterns of the stratum surrounding the shaft, based on geological and hydrogeological engineering data from the Guotun Coal Mine.
The depth of shafts continues to deepen with the ongoing demand for resources, while the strata crossed during the construction of the shaft become more and more complex, and the geological conditions change from a single bottom aquifer to multiple aquifers. However, most numerical simulations have focused on the effects of the additional force induced by the change of the bottom aquifer on the shaft. The previous calculation model for the behavior of additional force resulting from a single bottom aquifer cannot predict the behavior of the additional force related to the presence of a central aquifer. Meanwhile, the connection between the additional force and various parameters under the drainage conditions of multiple aquifers is not clear. Hence, in this paper, a numerical model of a shaft under a different drainage settlement was established and the change in stress, the displacement of the shaft wall during the initial state of the stratum, the equilibrium state of the shaft and stratum and the drainage state of the stratum were analyzed using typical parameters. Meanwhile, in order to increase the reliability and comprehensiveness of this numerical study, the influence of various influencing factors on the development laws of additional force under synchronized water level gap conditions is studied. To further study the effect of the main factors, including the water level gaps in different aquifers, on the changing patterns of additional force, another calculation of these two aquifers was studied under unsynchronized water level gap conditions.
2. Numerical Model and Methodology
In this study, the variation law of the additional force acting on a reinforced concrete shaft wall, surrounded by topsoil containing multiple aquifers, was studied using ANSYS software, based on the following theories: the vertical additional force theory, the reinforced concrete elastoplastic theory and the effects of the vertical load and horizontal load on the shaft wall.
2.1. Constitutive Relation and Failure Criteria
2.1.1. Elastic–Plastic Constitutive Relation
Fractured Drucker–Prager (DP) material, composed of elastoplastic concrete, was used to simulate the material of the reinforced concrete. Three parameters of the DP material, namely, the cohesion, the internal friction angle and the expansion angle, are set in the numerical simulation [22].
2.1.2. Failure Criteria
The failure criteria of concrete [23,24,25] is used to determine whether concrete fracturing occurs. The strength of concrete σij under complex and variable stresses can be expressed as:
where the values of kn are determined by strength tests applied to the material.
The reinforced concrete shaft wall is under three-dimensional stress. The horizontal load and vertical additional force are constantly changing. The “five-parameter failure criteria” was chosen to evaluate the strength of concrete under multidirectional stresses [26].
2.2. Stress Analysis
2.2.1. Horizontal Load and Self-Weight Stress
The horizontal stratum stress is calculated by using the “heavy liquid formula” [27,28] in which the influence of pore pressure and water pressure has been taken into account. The horizontal stress of the stratum at the ground surface is assumed to be 0, and the distribution of the horizontal stress along the shaft wall, from the ground surface to the bottom of the topsoil, presents a triangular shape in this numerical simulation [29]:
where P is the horizontal stratum stress, MPa; K is the combined coefficient value of the horizontal load in the design theory, with a value of 0.013; G is the self-weight stress, MPa; γ is the average gravitational force acting on the shaft wall, kN/m3; H is the stratum depth of the calculation point, m.
2.2.2. Vertical Additional Force
(1) The equation for the additional force with the water level gap of aquifers.
An empirical formula is used to describe the evolution patterns of the additional force with time, as shown in Equation (4), when other parameters are constant, which was derived by the scholars in our subject group through a series of theoretical analysis, specimen testing, large-scale physical simulation tests and numerical simulation tests [7,30,31]:
where ƒn is the vertical additional force, kPa; a and b are regression coefficients, while a can be negligible; τ is time, month.
(2) Relationship between the growth rate b of the additional force and the depth and properties of the sediment.
The growth rates of additional force are distinct for different properties of sediment layers (clay, sandy clay, clayey sand and sand) under the same conditions, based on the experimental data, and this rate increases as the shaft depth increases. The relationships between the growth rate, sediment properties and shaft depth are shown in Table 1, which are mainly referenced from the studied of Yang and Cui [7,30,31].
2.3. Numerical Model
2.3.1. Basic Assumption
The assumptions in this study are shown below: (1) The finite element model is built as an axisymmetric model, and the shaft wall thickness is constant. (2) The shaft and its surrounding stratum are considered uniform isotropic bodies. (3) The vertical consolidation settlement is considered, and the horizontal offset of the shaft is ignored in the finite element analysis. (4) The strength of steel rebar is represented by increasing the strength of the concrete shaft wall [32].
2.3.2. Calculation Scheme
Parameter Values
The following factors affect the variation of the vertical additional force generated by drainage. The parameter equation of the additional force that influences the drainage settlement in strata, with multiple aquifers, is derived from the theoretical analysis:
where r0 is the inner radius, m; r1 is the outer radius, m; H is the topsoil thickness, m; hd is the bottom aquifer thickness, m; hi is the central aquifer thickness, m; hv1 is height of the water level gap at the bottom aquifer, m; hv2 is the height of water level gap at the central aquifer, m; z is the central aquifer location, m; i is the number of central aquifers.
Scheme Design
In this study, the ANSYS software was used for the numerical simulation study, and two kinds of calculation schemes are shown, as follows:
(1) Calculation scheme for selecting a typical parameter value.
The stress and displacement were studied in the initial state of the stratum, the equilibrium state and the drainage state of the stratum when all the above parameters were assigned values typical for this type of numerical calculation.
(2) Calculation scheme for changing each single parameter.
(1) The evolution patterns of the additional force under the synchronized water level gap of different aquifers are studied when each parameter varies individually, and other parameters are set to typical values.
(2) The evolution patterns of the additional force under the unsynchronized water level gap of different aquifers are assessed when the water level gap varies from 0~100 m, and the other parameters are set to typical values.
2.3.3. Calculation Model
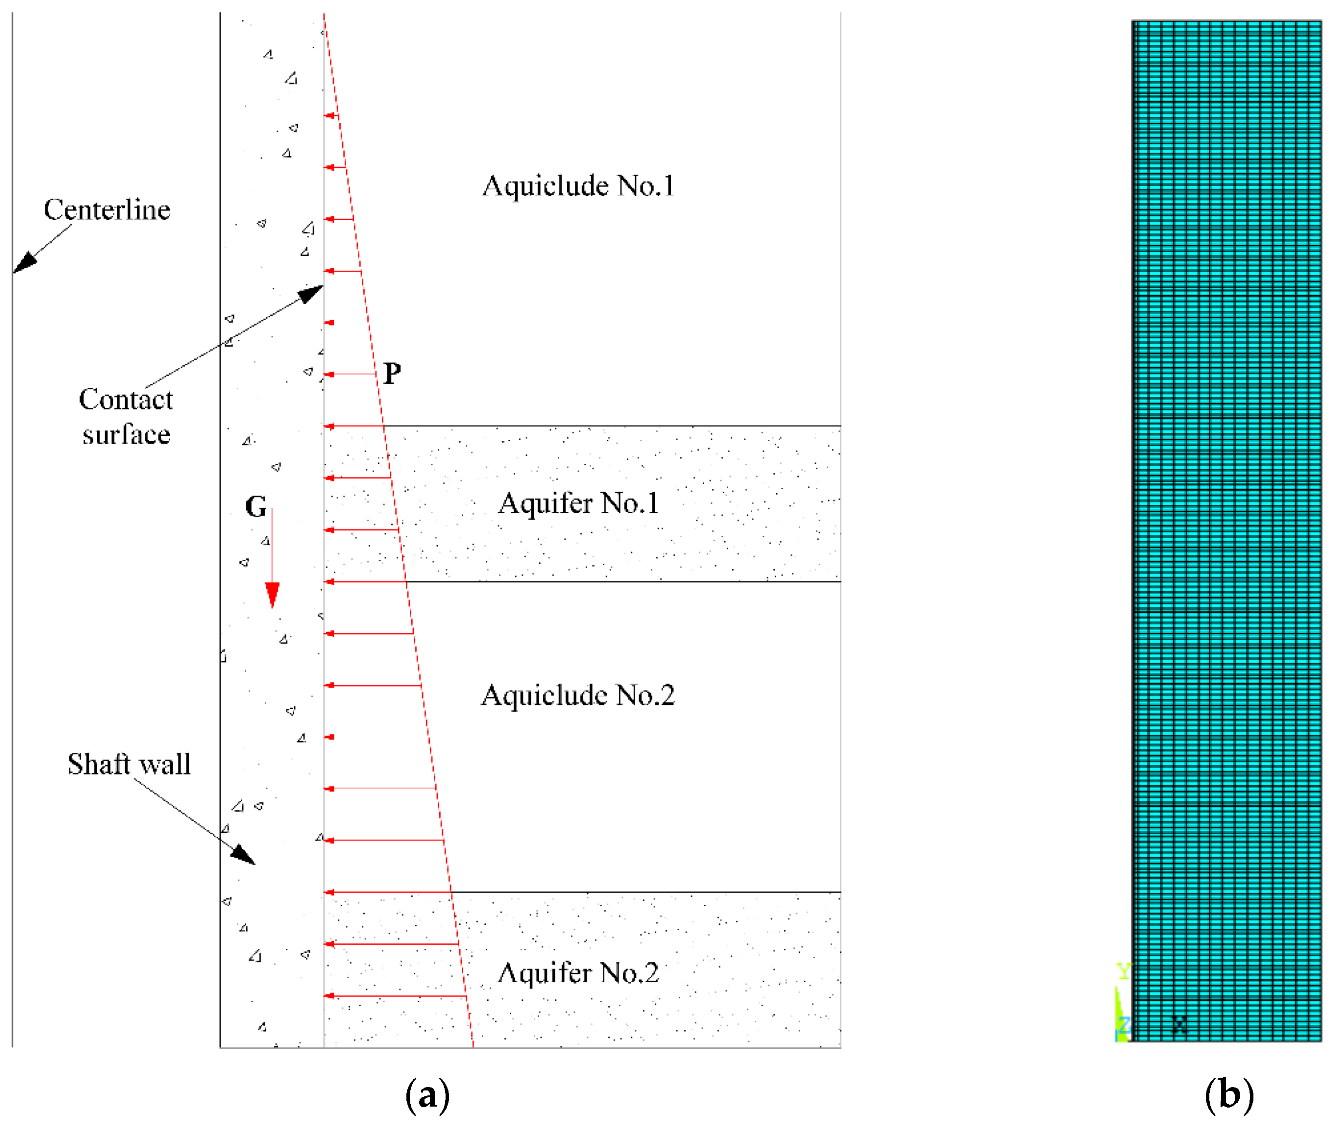
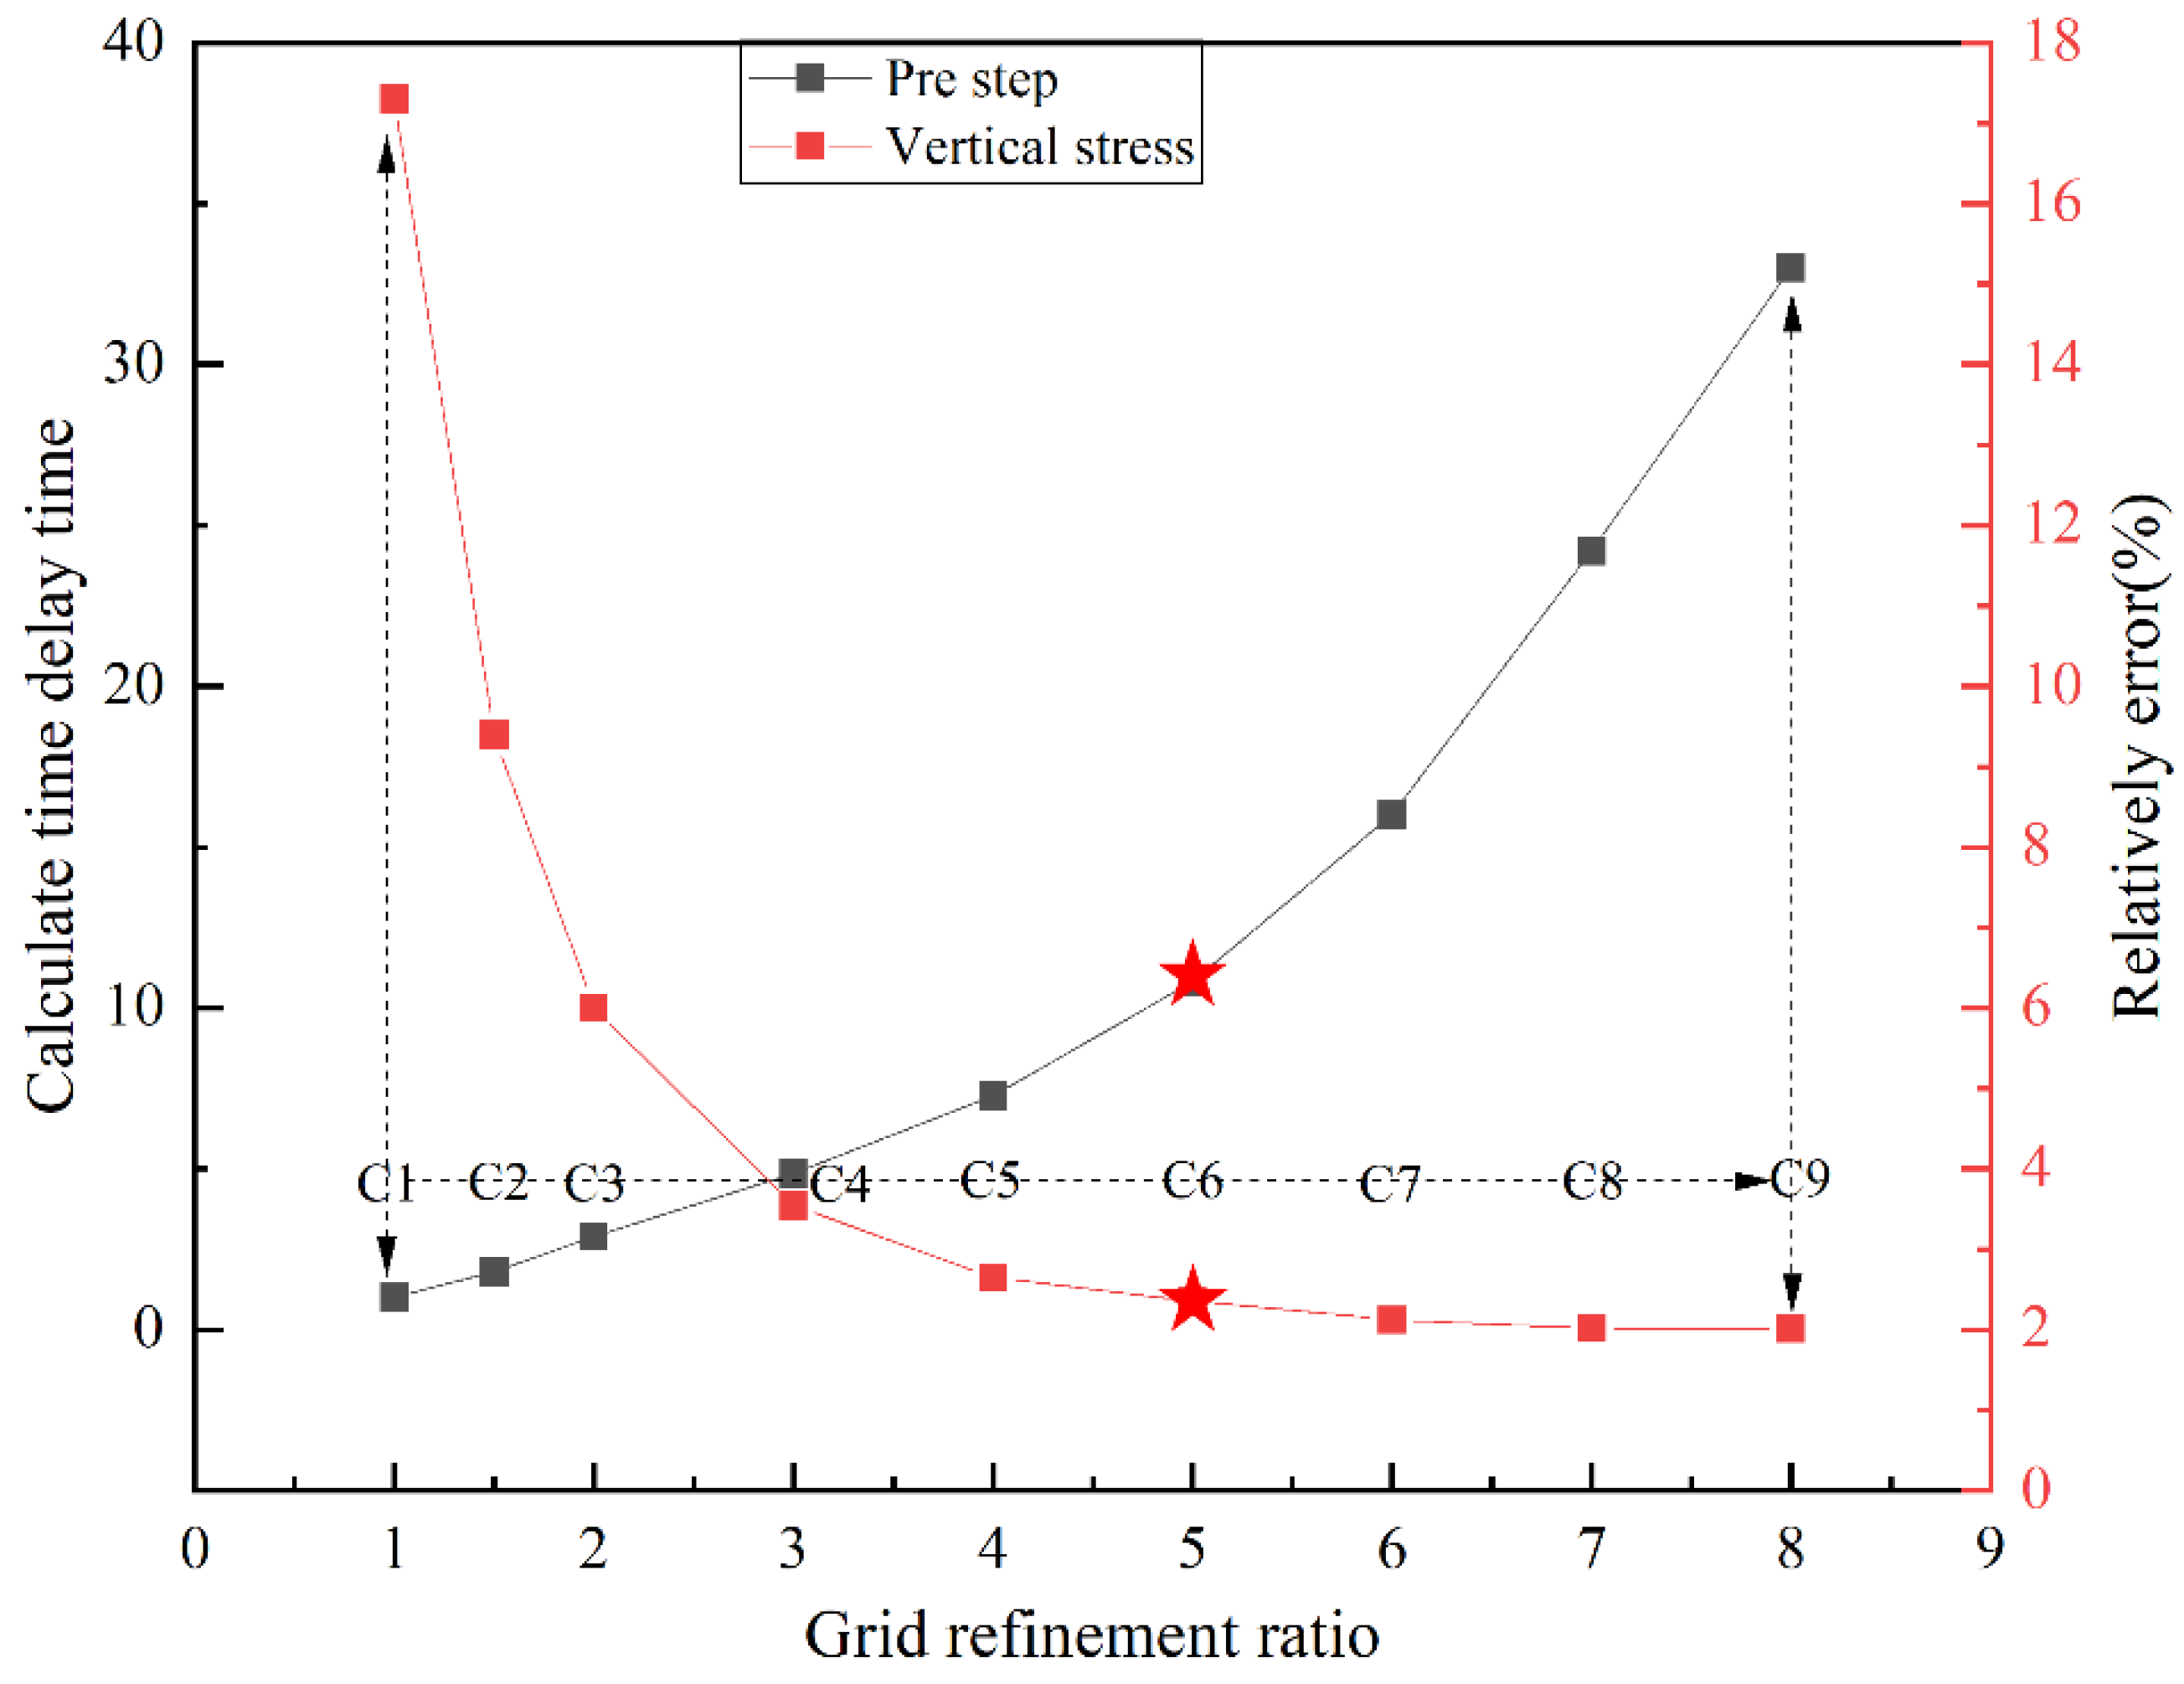
In this model, a two-dimensional planar unit PLANE 82 is used to simulate the shaft wall. A contact unit module between the stratum and shaft wall is used to simulate friction conditions. In order to reduce the effect of interface on the calculation results, the simulation model was demarcated and modified based on sufficient field data and a series of model calculations. Half of the shaft model is taken to simplify the calculation based on the axisymmetric characteristic, and the topsoil is simplified into two aquicludes and two aquifers. Figure 2 shows the simplified computational model and the finite element model. Furthermore, the maximum vertical stress on the shaft wall (all factors were selected as the typical value) were simulated, and the calculated time delay ratio and relative error were selected as evaluation factors for the grid sensitivity test, as presented in Figure 3; the mesh C6 was selected for the calculation model by considering the combination effect of calculation time and relatively error, while this error was acceptable from the perspective of numerical calculation.
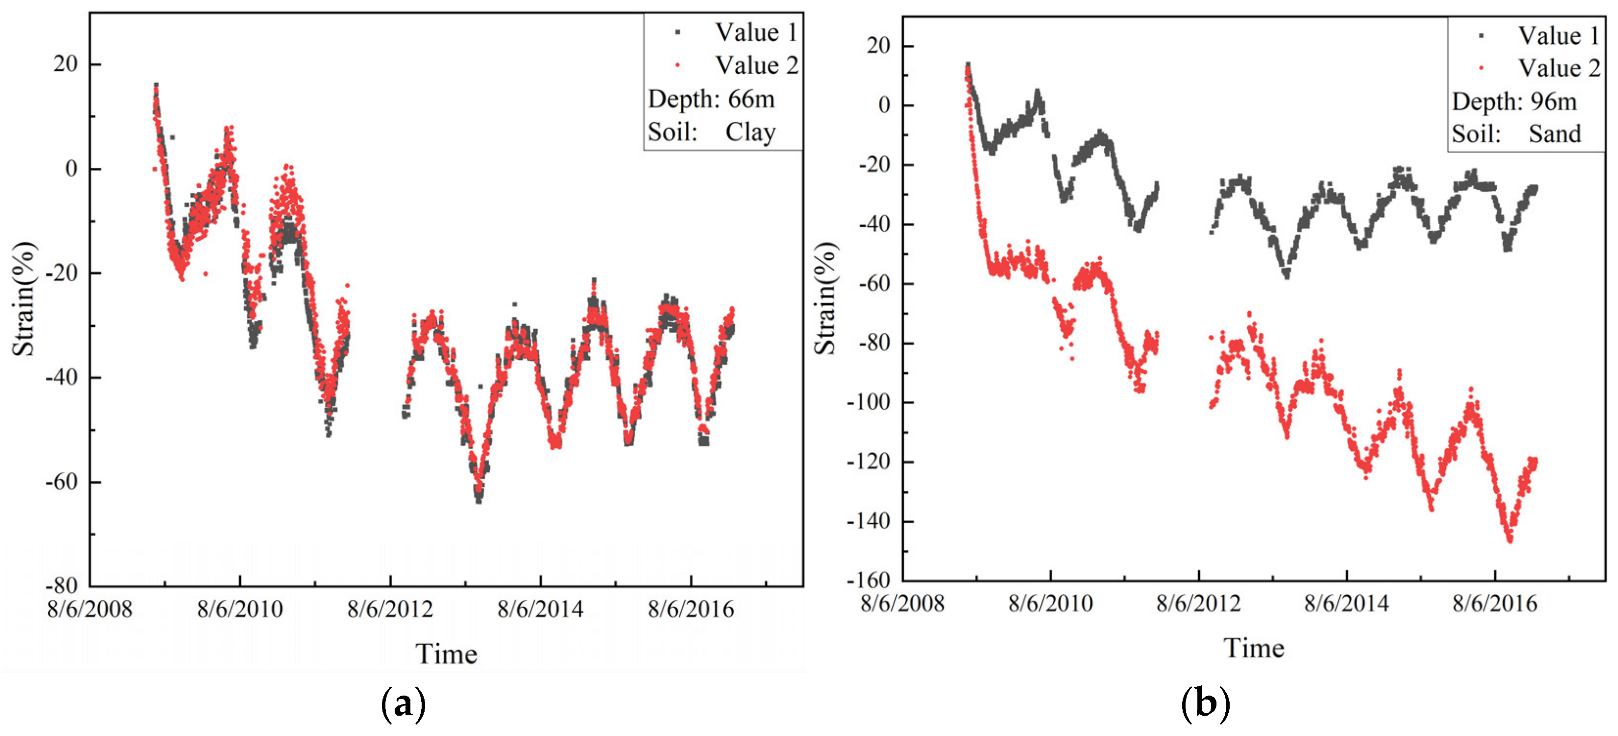
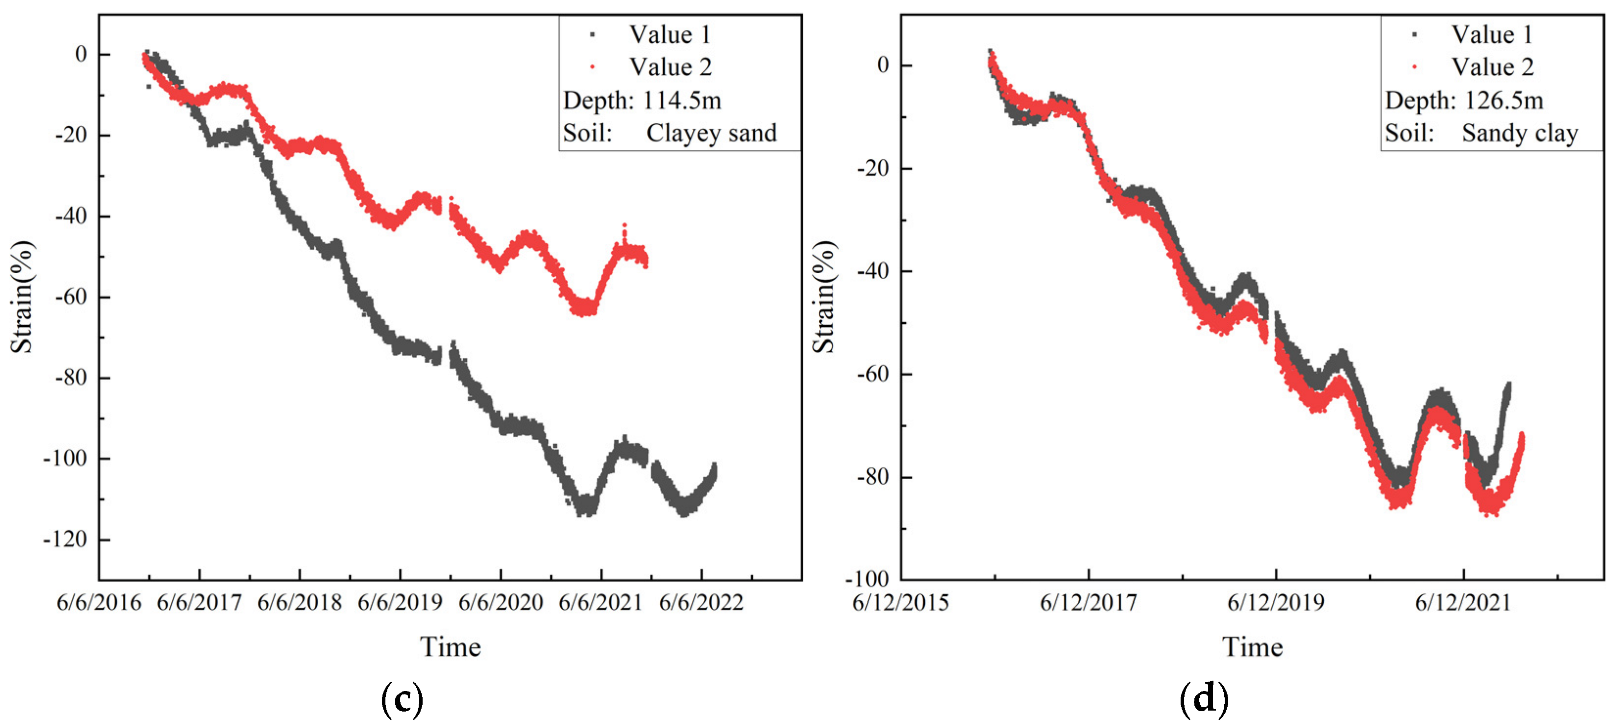
The field strain data of the three shafts, in the Dongtan Coal Mine, during their service time were tested, collected and analyzed (as shown in Figure 4) to verify the reliability of the numerical model in this study. The regression coefficient of b, with different types of soil in different depth locations, which are the most important parameters for the additional force, was inversely calculated according to strain data and compared with that in the theoretical parameter in this study.
The basic geology conditions of the surrounding topsoil and geometric dimensions of these three shafts (located in the Shandong Province, P.R. China) are shown in Table 4. The selected data were from the depth of 114.5 m (clayey sand) and 126.5 m (sandy clay) in the west ventilation shaft, and of 66 m (clay) and 96 m (sand) in the north ventilation shaft. The comparison between these two coefficients of b in the field data, and the theoretical parameter, is shown in Table 5; it can be found that these two coefficients are nearly consistent with different types of soil in different depth locations.
3. Numerical Calculation Analysis
3.1. Numerical Results Analysis of the Typical Model
3.1.1. Initial State of the Stratum
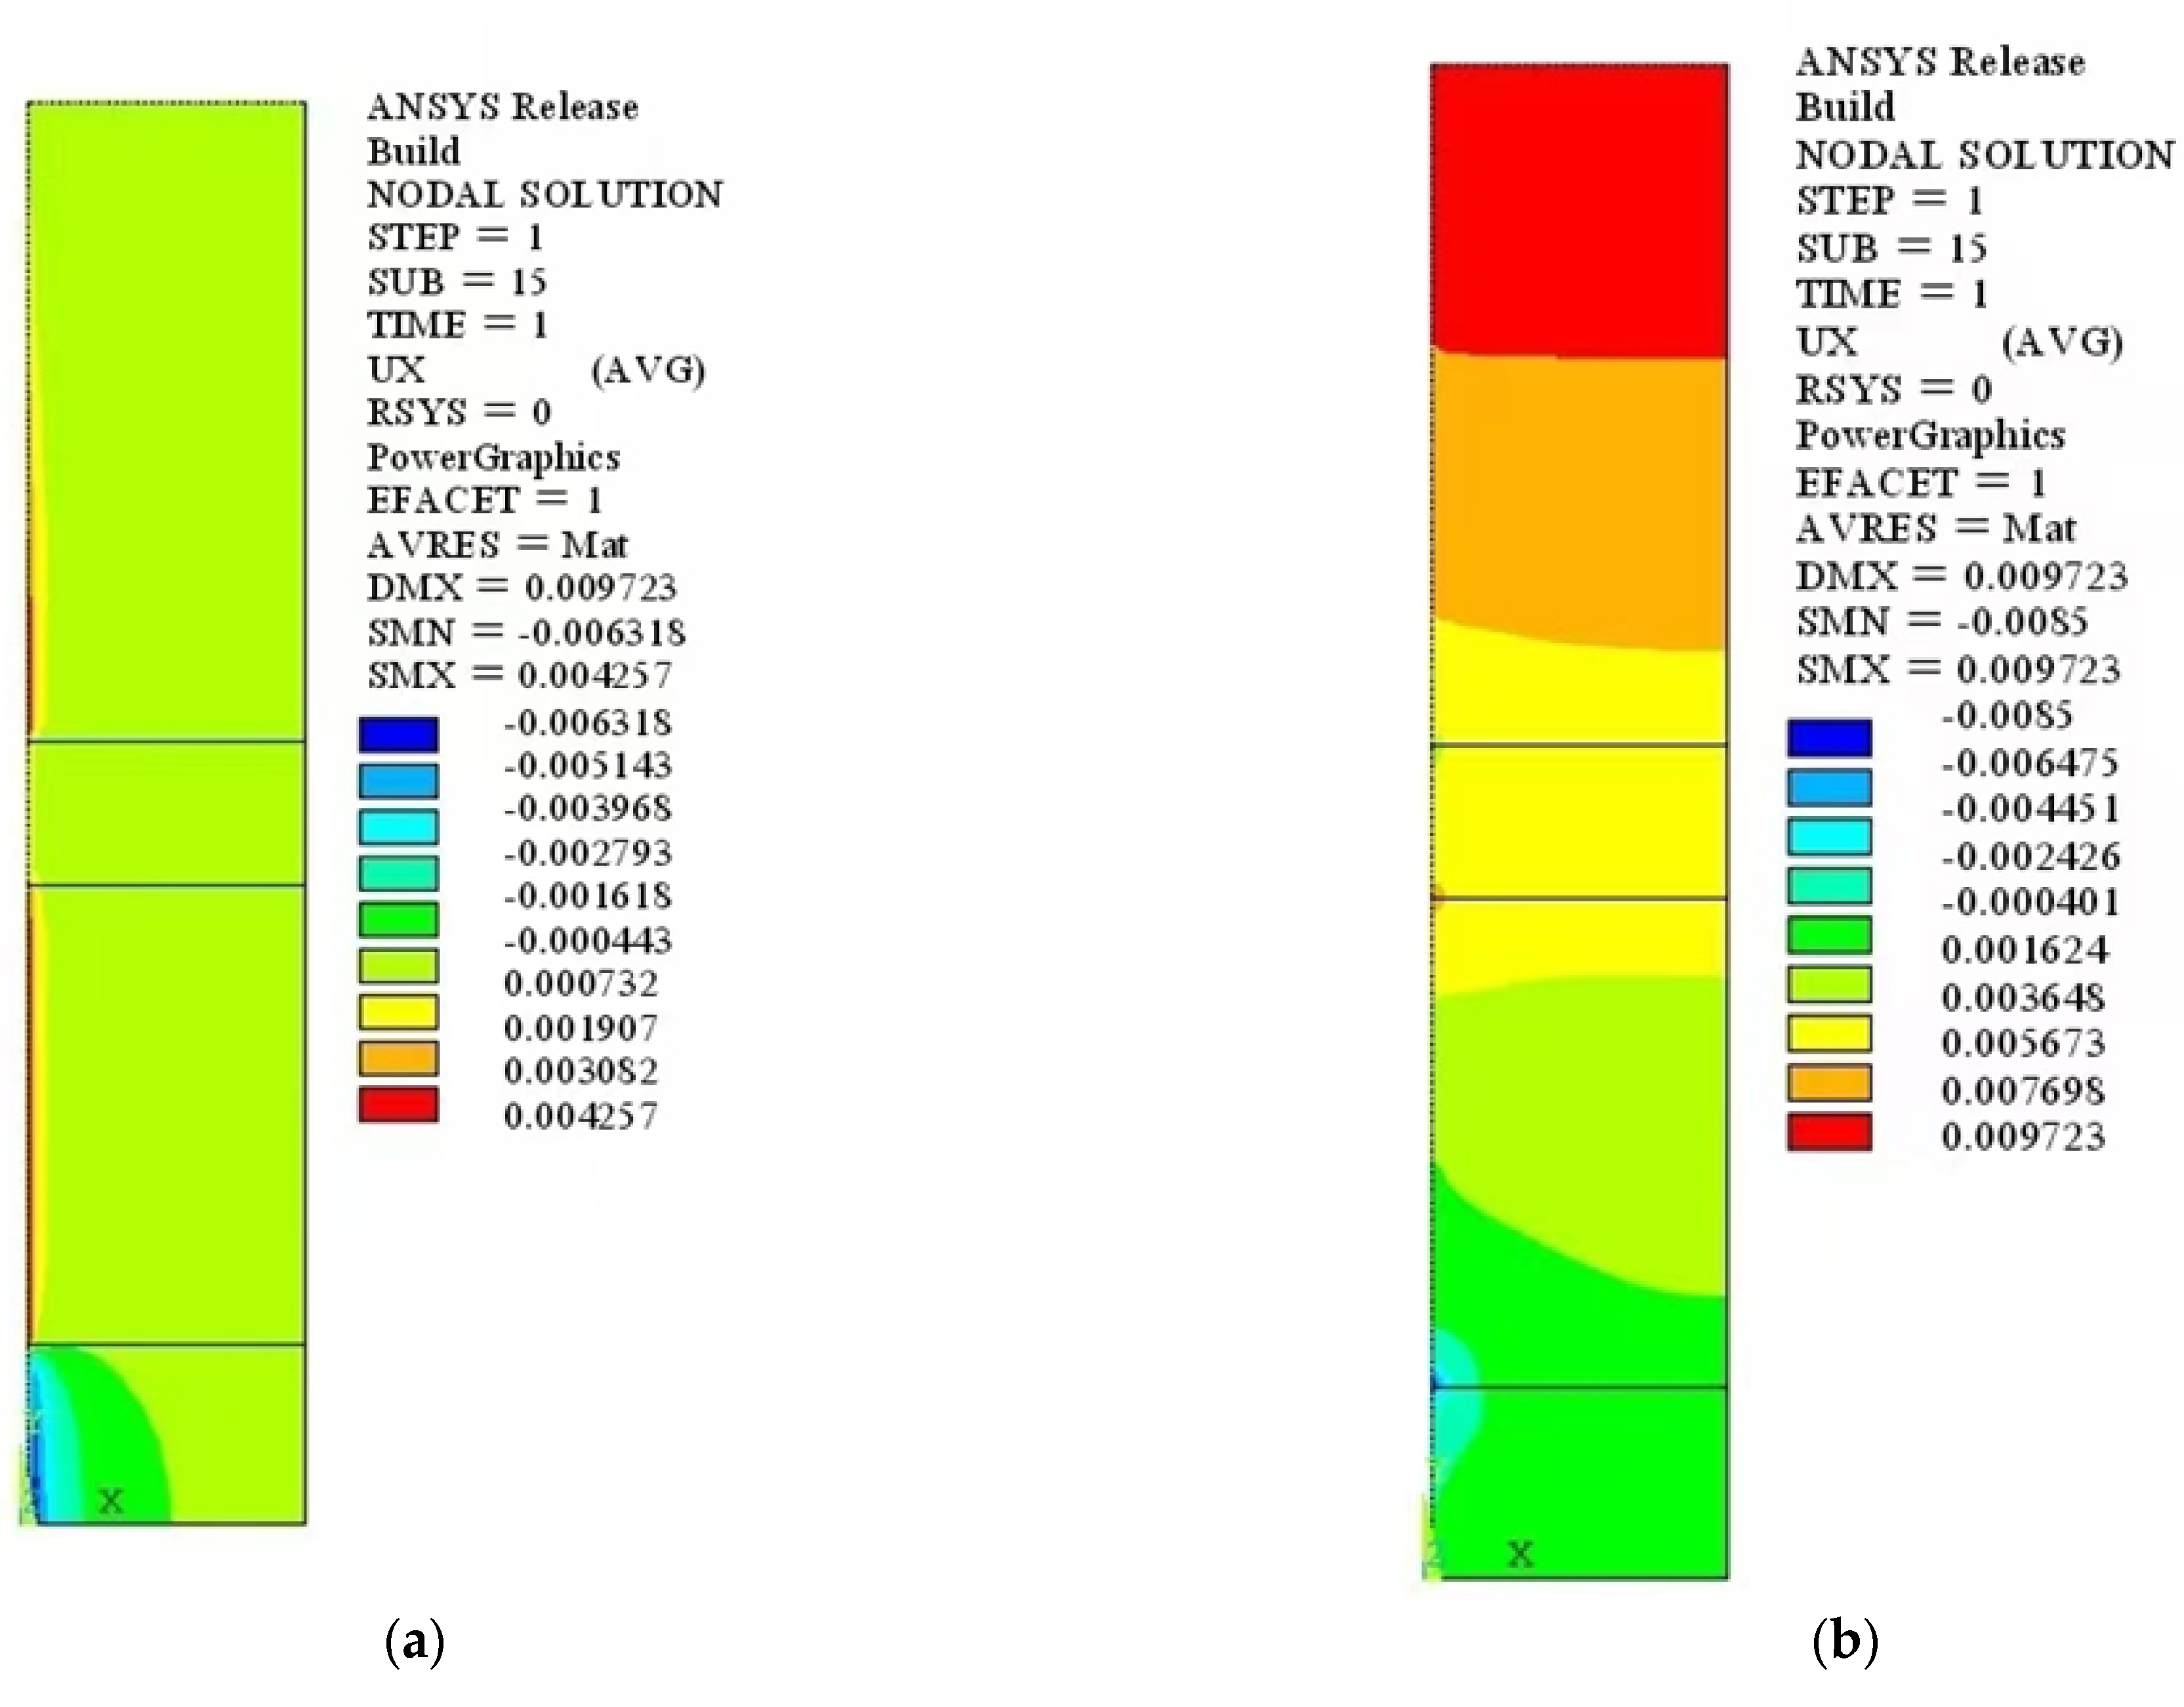
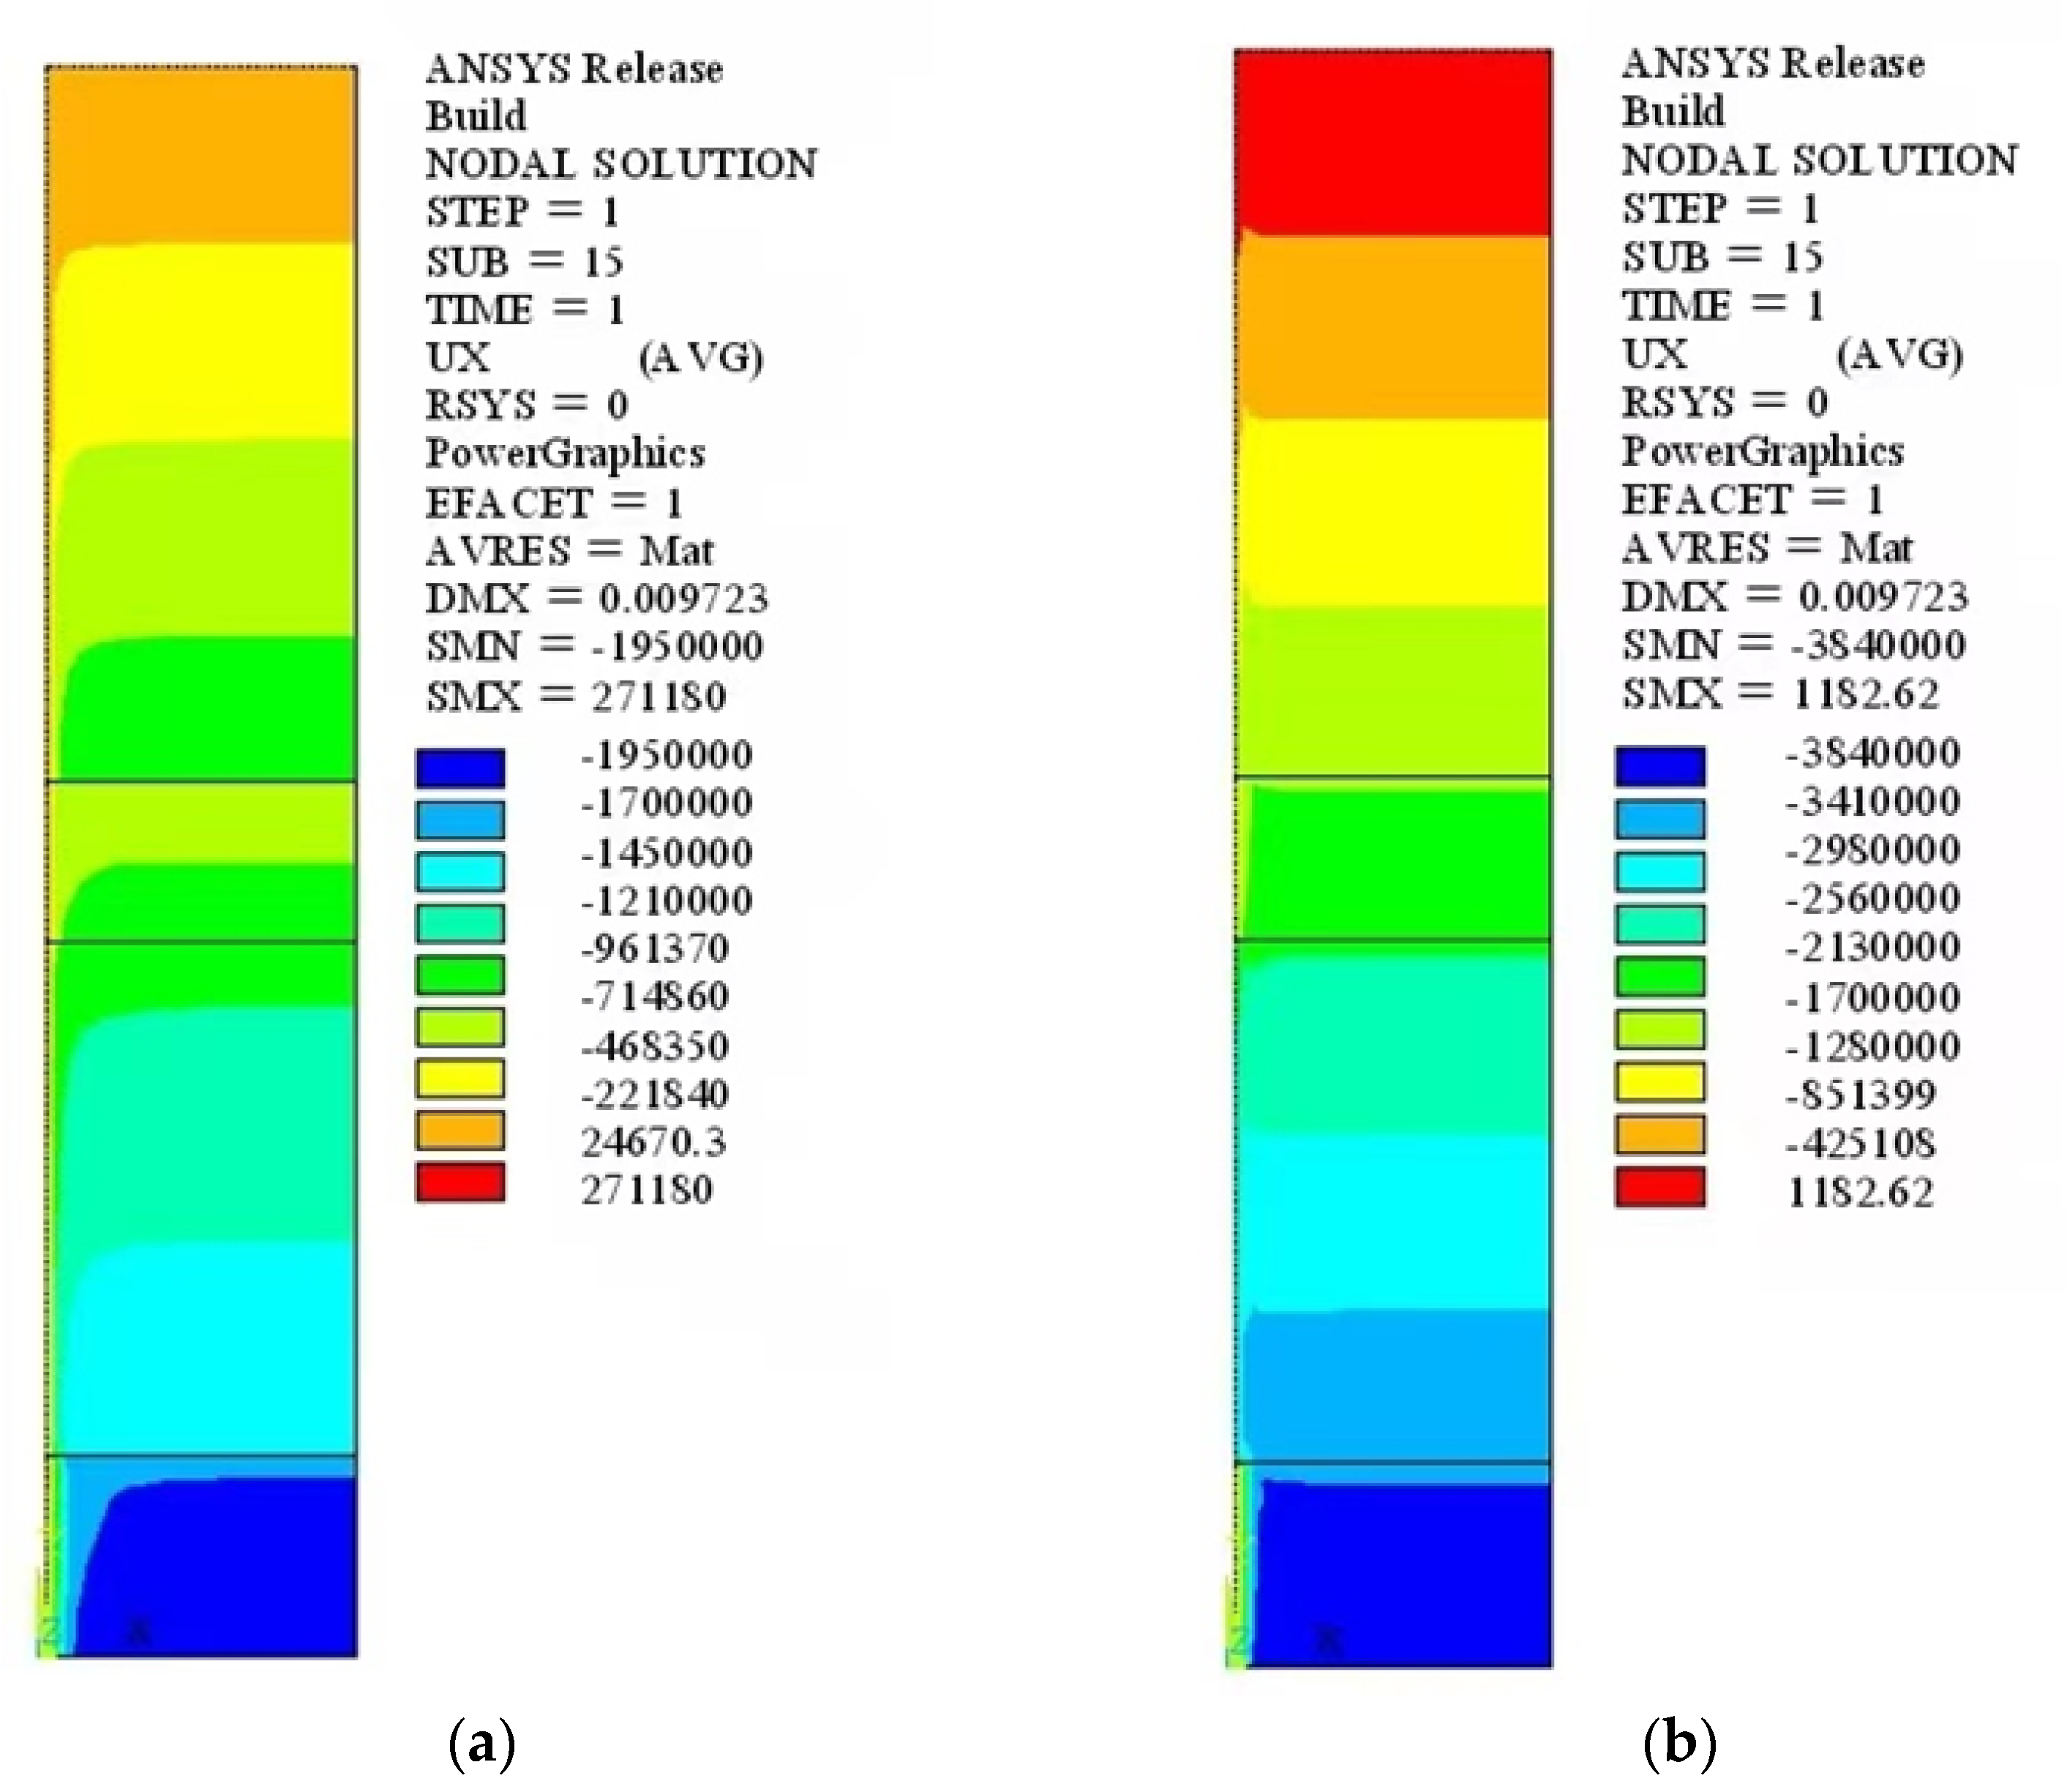
The initial force of the stratum consists of two parts: the self-weight and the lateral pressure, before the shaft construction, in the initial state of the stratum. Table 6 shows the typical values of the parameters. The displacement and stress contour diagrams of the stratum in the initial state are shown in Figure 5 and Figure 6.
According to Figure 5 and Figure 6, vertical displacement appears due to the self-weight of the stratum, and the maximum vertical displacement reaches approximately 9.723 mm. The lateral pressure progressively decreases with depth and ranges from 0.27 MPa to 1.95 MPa, while the vertical stress of the stratum shows a layer-stripe distribution, and the maximum stress value is approximately 3.84 MPa. This phenomenon is essentially consistent with the theoretical results of the sediment lateral pressure, thereby verifying the reliability of the calculation model to some extent [27,28].
3.1.2. The Equilibrium State
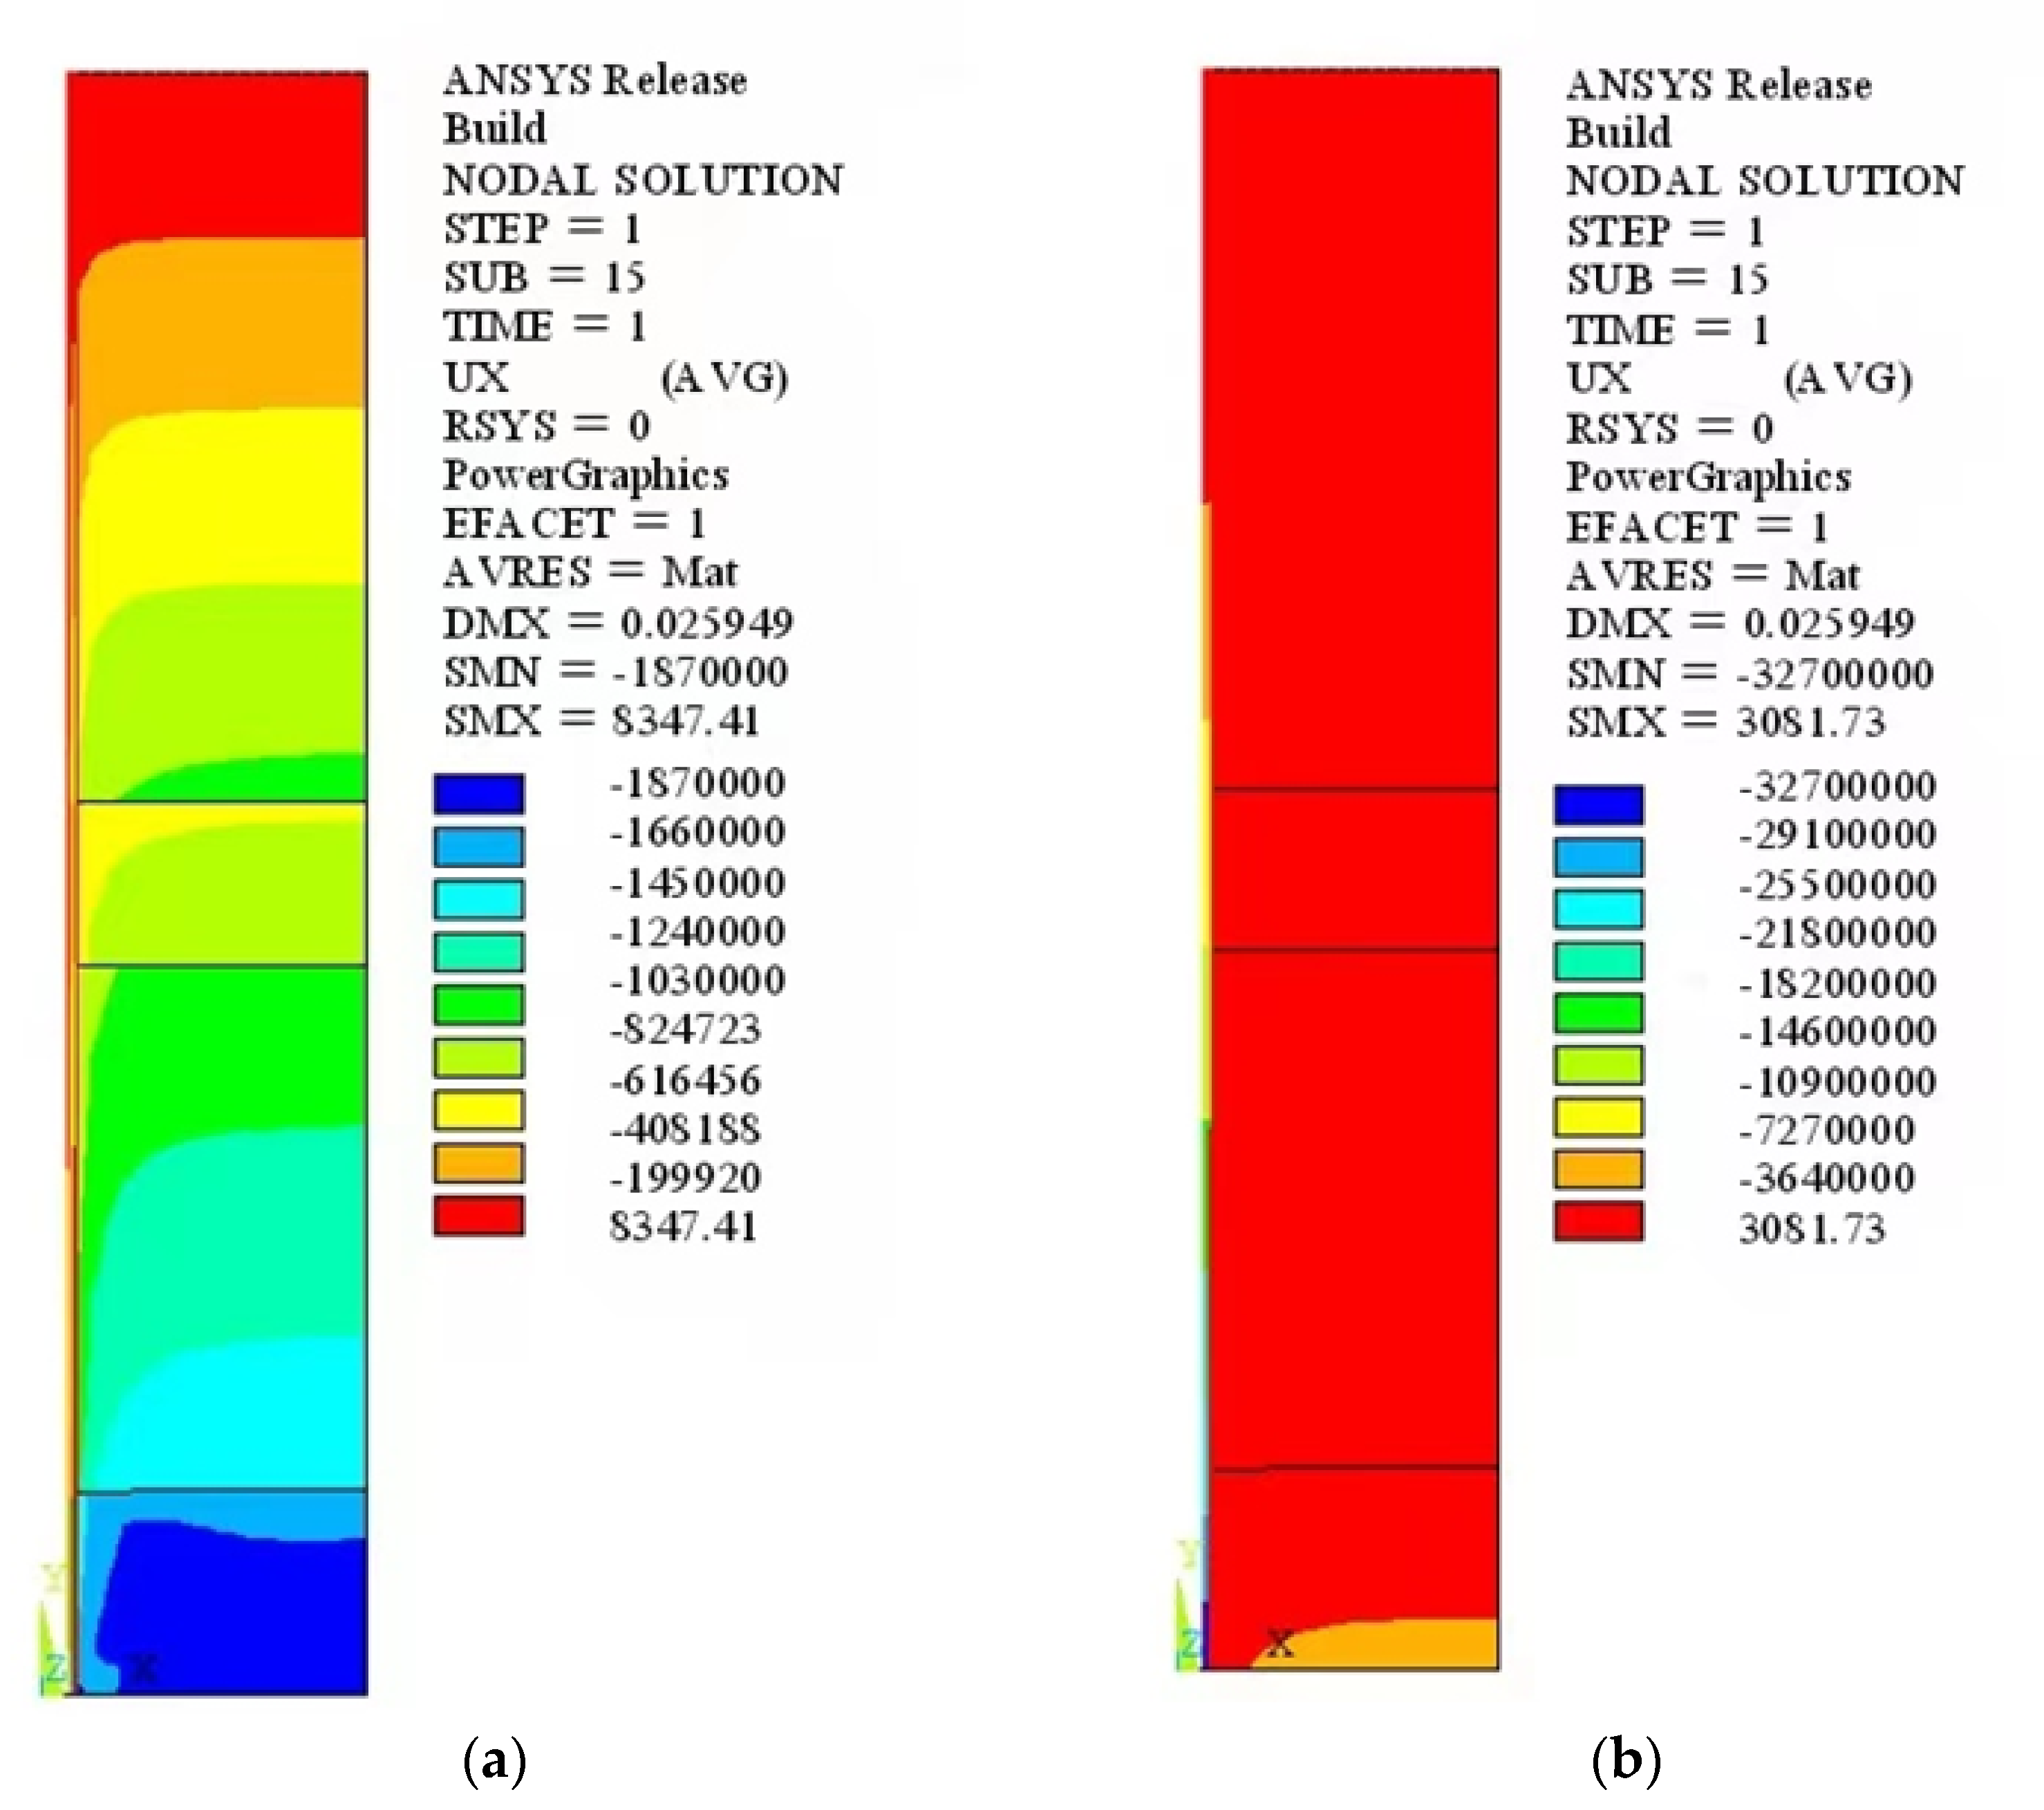
The equilibrium state is set without considering the effects of sediment excavation and concrete pouring on the shaft wall. The initial displacement and initial stress in the equilibrium state, when the completed shaft has been built, are shown in Figure 7 and Figure 8.
It can be seen in Figure 8b that the stresses in both directions of the shaft wall appear due to its own self-weight and the lateral pressure of stratum in the equilibrium state of the shaft wall and stratum; the distribution of these two stresses shows the layer-stripe distribution. The vertical stress and horizontal pressure of the shaft wall both progressively increase from the surface to the bottom. The appearance of the shaft wall shows less effect on the lateral pressure of the surrounding stratum. The horizontal displacement increases along the depth of the stratum, as evidenced by the displacement contour in Figure 7. The maximum vertical displacement difference between these two materials is 12 mm. The main reason for this phenomenon may be that the large compression modulus difference of these two materials induces asynchronous settlement.
3.1.3. Drainage State of Stratum
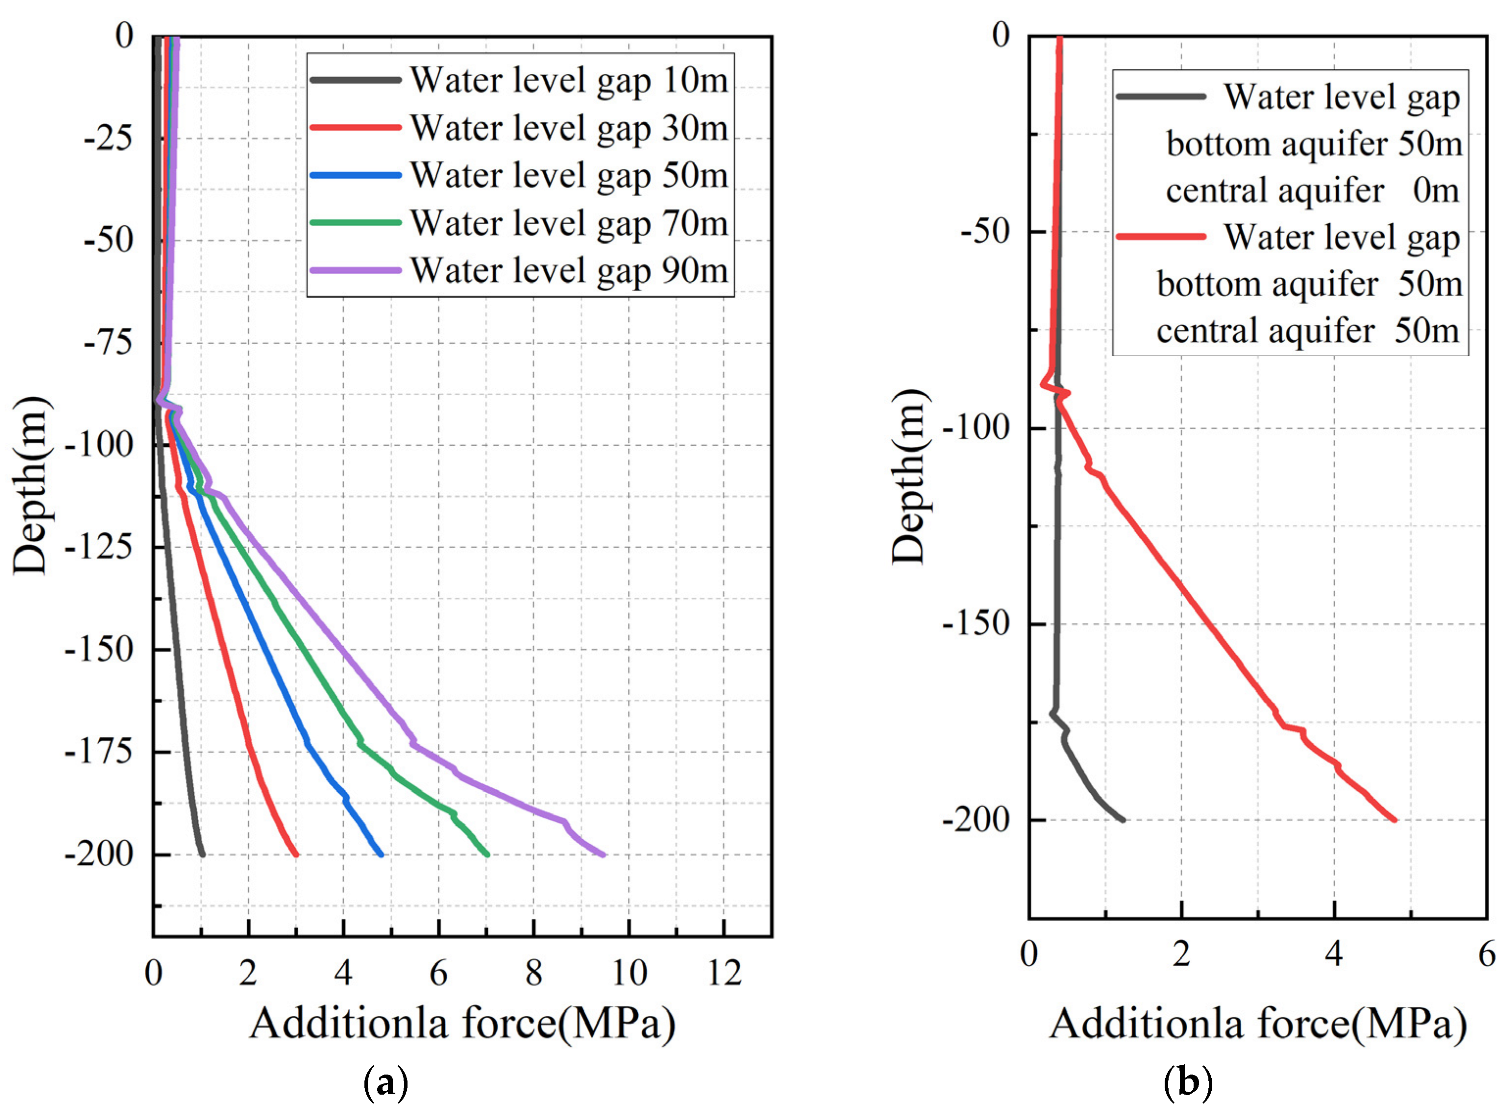
The evolution patterns of the additional force are studied when the central and bottom aquifers undergo drainage settlement and the water level gap values range from 10 m to 90 m. The distribution relationships of this force, with depth under different drainage settlement conditions (the synchronous and asynchronous drainage of the central and bottom aquifers), are shown in Figure 9.
The shaft depth with different patterns of increasing additional force is divided into two sections: the stratum part above the central aquifer and the stratum part below the central aquifer, as shown in Figure 9a. It can be observed that the additional force is relatively small and the increase rate of the additional force value in the corresponding stratum, with increasing water level gap, is not obvious when the thickness of the topsoil does not exceed 100 m. However, the additional force shows a trend of rapid growth as the thickness of the topsoil exceeds 100 m, and the influence of the water level gap on this force also increases. This phenomenon appears in both the unsynchronized and synchronized drainage settlement conditions. The additional force is 9.4 MPa when the water level gap is 90 m, while this value is approximately 1 MPa when the water level gap is 10 m for a shaft depth of 200 m. This result indicates that the water level gap has a significant impact on the increase in additional force when the shaft depth exceeds a threshold value. The possible reason for this phenomenon is that the additional force will affect the aquicludes below these two types of aquifers, once the drainage in the central aquifer starts to appear, while the impact of the additional force of the two aquifers increases when the water level gap increases.
In Figure 9b, when the stratum is above the central aquifer, the same phenomenon appears under both unsynchronized and synchronized drainage settlement conditions. However, unlike the changes in the additional force in the synchronized drainage settlement condition, the additional force in the bottom aquifer changes slowly, with increasing depth, when drainage does not occur in the central aquifer. The influential part of drainage of the bottom aquifer may be mainly concentrated near the upper part of the bottom aquifer, while the occurrence of drainage in the central aquifer not only strengthens the additional force, but also increases the influential area.
3.2. Numerical Results Analysis of the Single-Factor Scheme
3.2.1. Synchronized Water Level Gap in Different Aquifers
- (1)
- Topsoil thickness.
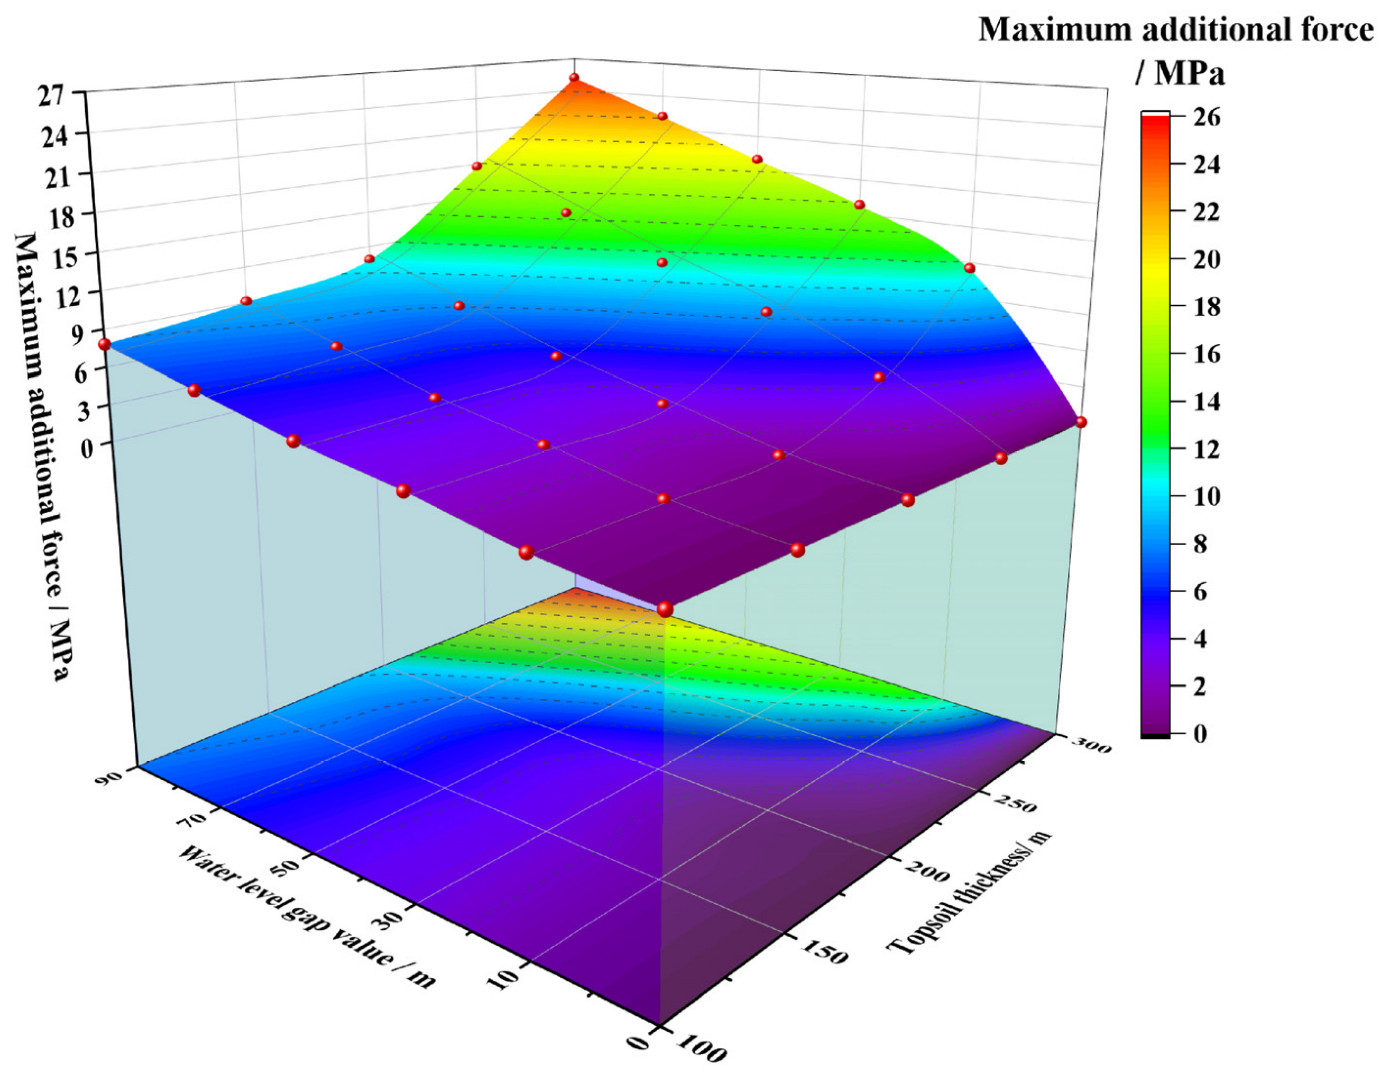
The relationships curves of the topsoil thickness and additional force with different water level gap values are shown in Figure 10. The additional force grows when the topsoil shows an increased trend under different water level gap conditions. For instance, this force ranges from 4.13 MPa to 5.28 MPa, with a water level gap of 50 m, when the topsoil thickness ranges from 100 m to 200 m, while this value increases to 18.87 MPa when the thickness reaches 300 m. This phenomenon indicates that the appearance of drainage has a large impact on the subject of the additional force. The maximum additional force reaches 25.19 MPa when the topsoil thickness is 300 m under a water level gap of 90 m. This phenomenon may be because the occurrence of drainage reduces the water pressure and enhances the effective stress of the overlying sediment, which results in the settlement and causes the additional force. The whole settlement amount increases and then induces a larger additional force as the topsoil thickness increases. To further illustrate the effects of the range in topsoil thickness and water level gap on this force, the proportional relationships of the maximum additional force with an increasing water level gap and topsoil thickness are calculated and shown in Figure 11.
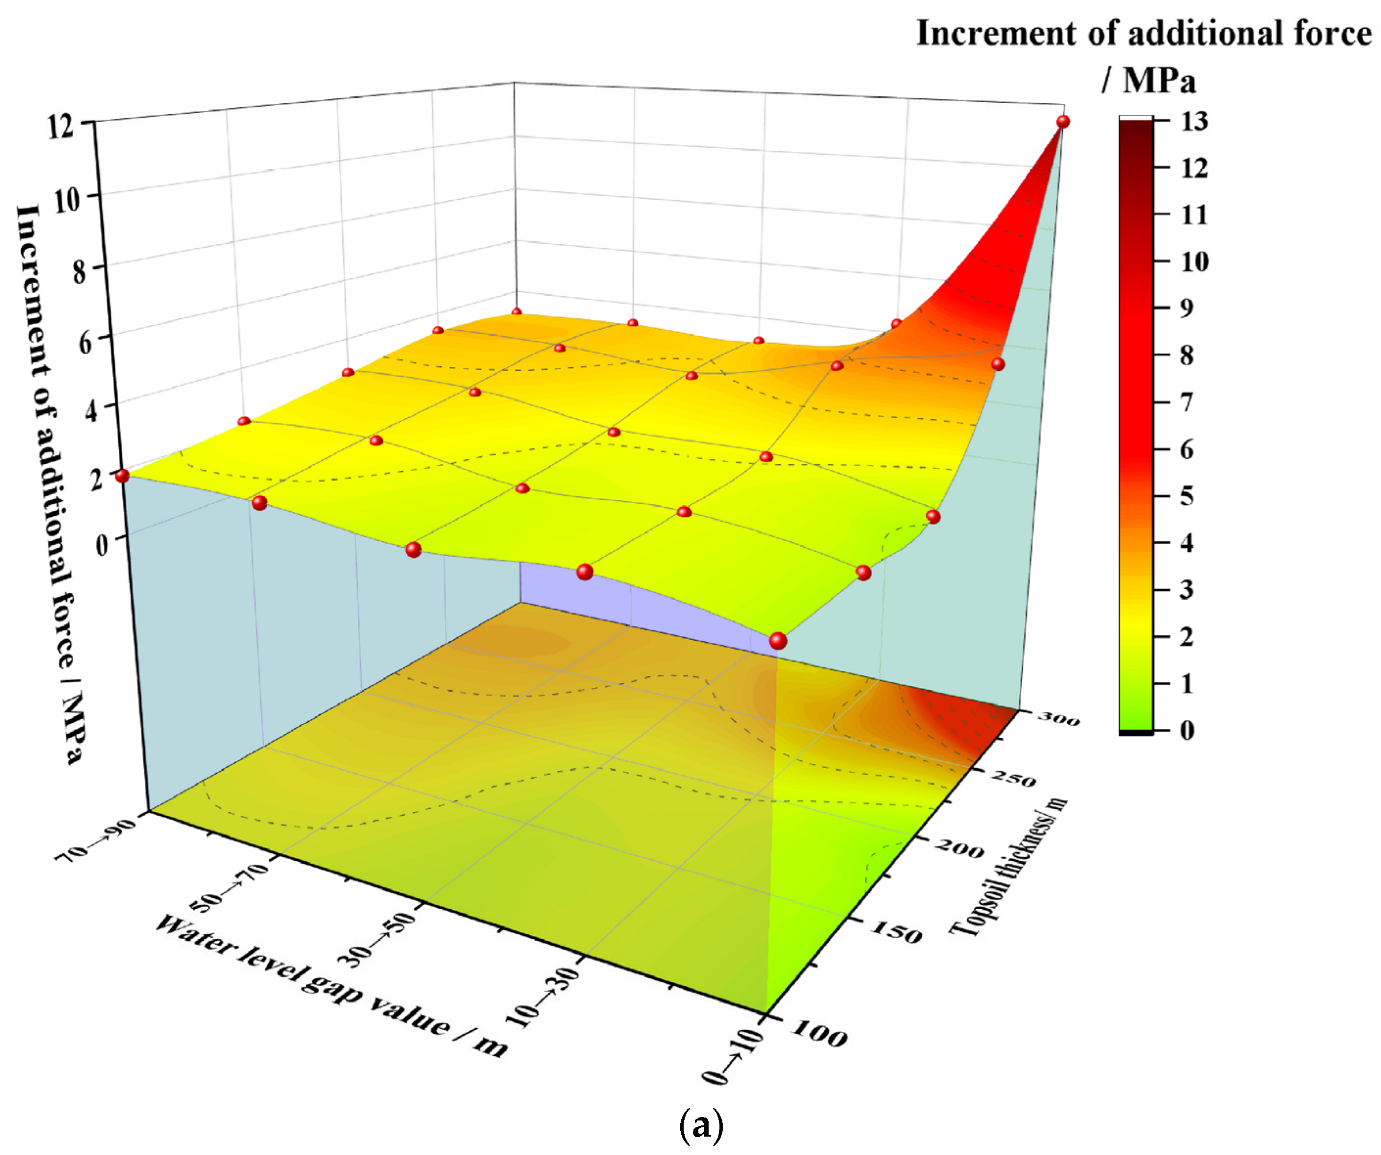
Based on the above figures, it can be observed that the increment of the maximum additional force of the shaft nearly remains at 2 MPa under different water level gaps in the aquifer, when the topsoil thickness is below 200 m, which shows that this force almost presents a linear increase when the water level gap grows. However, the increment of increase in the maximum additional force increases abruptly, with a water level gap value of 0~10 m when the topsoil thickness ranges from 200 m to 300 m. For example, when the water level gap ranges from the 0 condition to 10 m condition, the increment would be 1 MPa with a topsoil thickness of 100 m, but this value will increase to 11.47 MPa when the topsoil thickness reaches 300 m, as shown in Figure 11a. One probable reason is that the influence of the drainage on this force is more obvious in the initial stage when the thickness of the topsoil exceeds a certain value; however, the sediment settlement becomes more serious with continuous drainage and the additional force value between the shaft and the surrounding stratum changes more significantly.
The increment of increase in the maximum additional force progressively rises, with the increasing thickness of the topsoil, when the water level gap is constant. The values are relatively similar when the thickness of the topsoil is 200 m, which indicates that the additional force values generated by different water level gaps in shallow topsoil are closer and less hazardous than those in deep sediment. The increment of increase in the maximum additional force increases abruptly when the thickness of the topsoil surrounding the shaft changes from 200 m to 300 m. For example, the increment value ranges from 0.06 MPa to 3.42 MPa when the increase in the thickness of the topsoil changes from 150–200 m to 200–250 m, with a water level gap of 10 m. This phenomenon shows that the increasing trend of the additional force shows an obvious increase in the transition from the shallow topsoil part to the deep sediment part, indicating that the vertical additional force should be reduced by adding shrinkable layers to avoid shaft wall fracture, especially in deep sediment.
- (2)
- Shaft wall thickness.
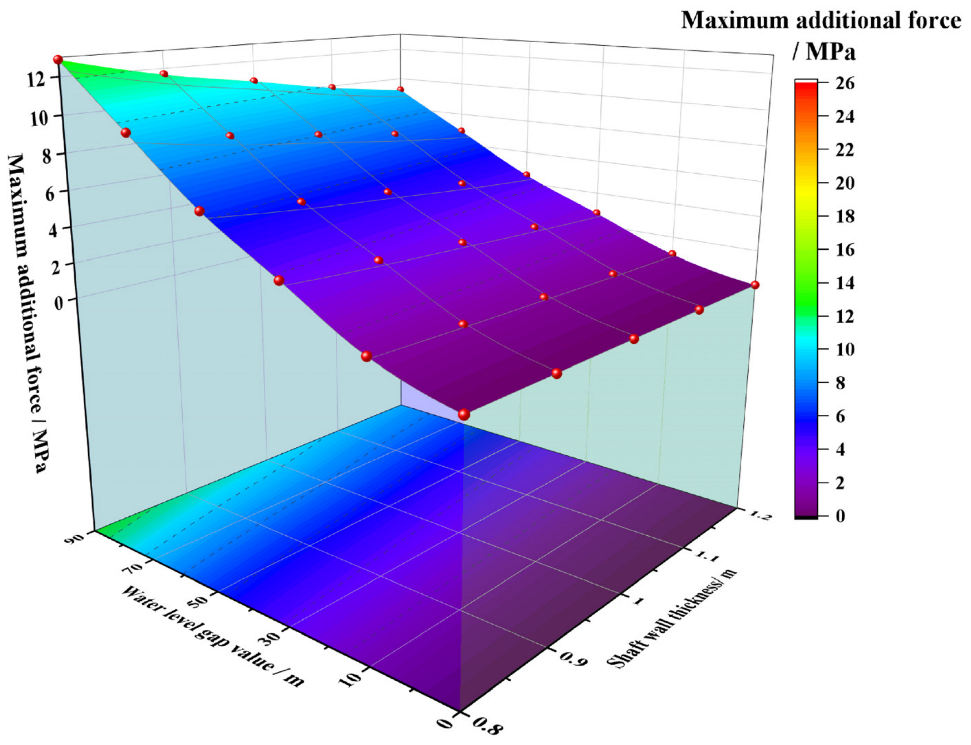
The relationships between the maximum additional force and shaft wall thickness under different water level gap conditions are shown in Figure 12. From Figure 12, it can be observed that the maximum additional force decreases with increasing shaft wall thickness under different water level gap conditions, while the difference in growth amplitude is relatively smaller than that induced by the increase in topsoil thickness. This phenomenon shows that the increasing shaft wall thickness can reduce the additional force by enhancing the shaft wall’s resistance to deformation, and the increasing thickness enlarges the cross-sectional area, which reduces the additional force when the overall deformation of the topsoil is constant. The maximum additional force also increases with the increasing water level gap under different shaft wall thicknesses, while the magnitude of the increase is relatively constant.
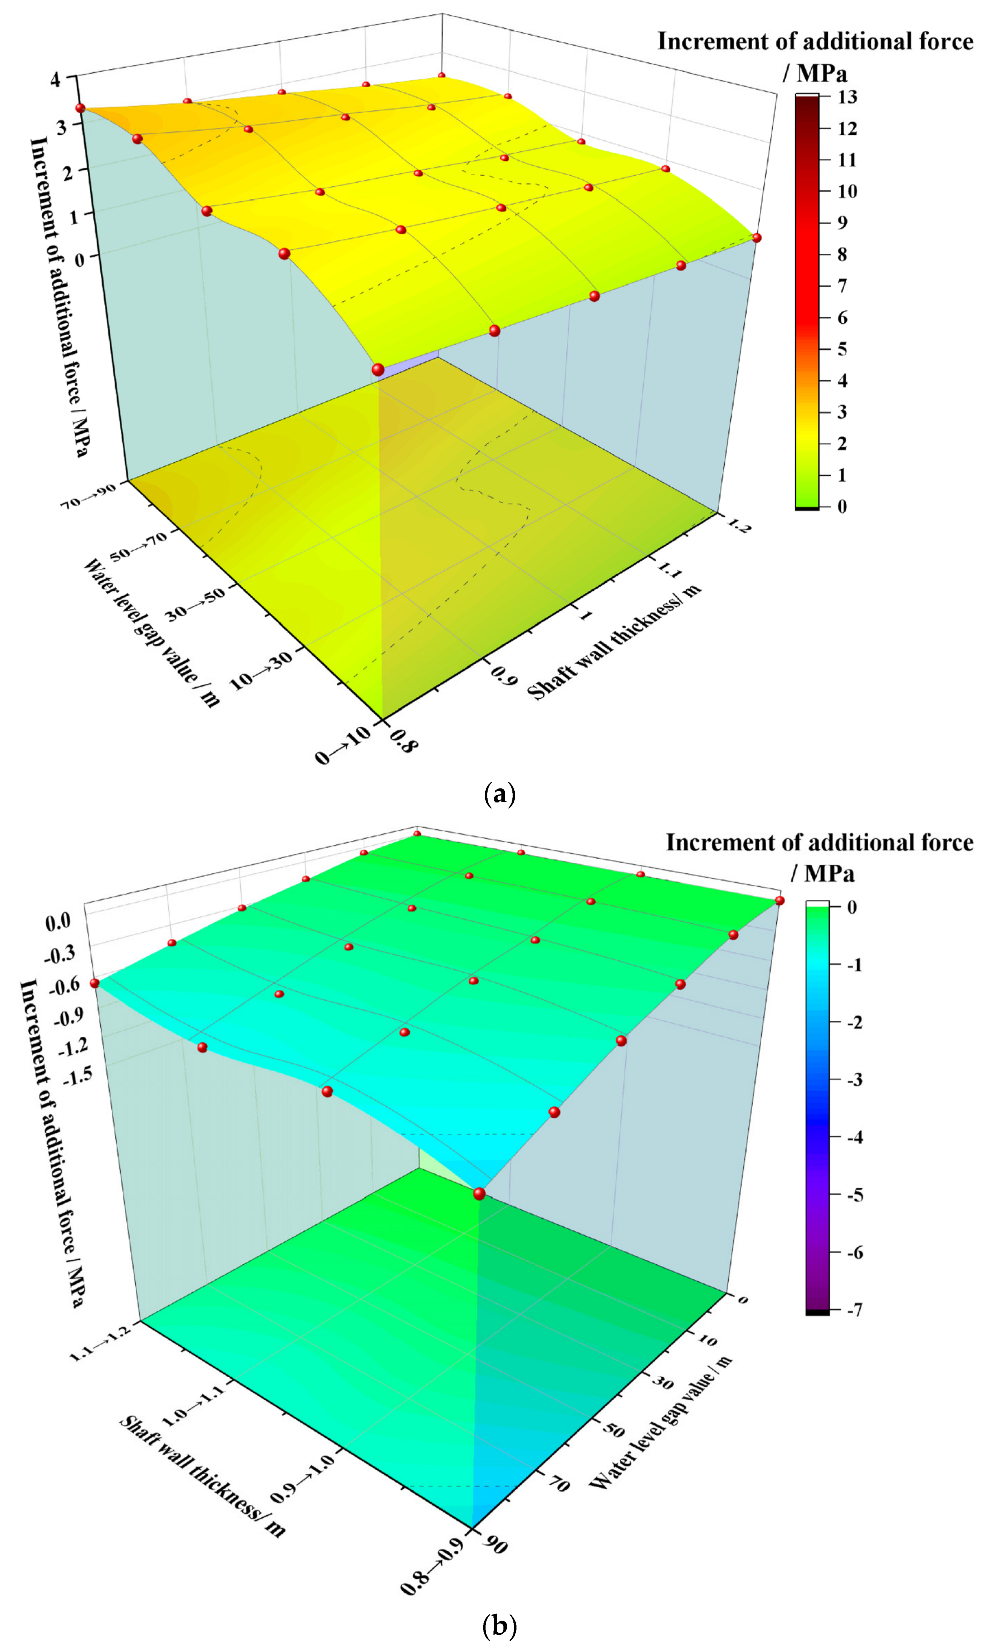
The relationships between the maximum additional force, the water level gap and the shaft wall thickness are calculated and shown in Figure 13, where it can also be seen that the increment of the increase in maximum additional force continuously grows when the water level gap shows an increasing trend, while the increment magnitude of this force decreases. This phenomenon can be proven by the fact that the increment amplitudes with water level gap values of 70~90 m and 10~30 m are 3.31 MPa and 2.48 MPa when the shaft wall thickness remains at 0.8 m, while these two values are 2.37 MPa and 1.78 MPa when this thickness ranges to 1.2 m. Increasing the thickness can reduce the additional force and enhance the bearing capacity of the shaft and effectively prevent shaft wall fractures. However, the reduction in the maximum additional force also decreases with increasing thickness of the shaft wall; for example, the reduction in the maximum additional force is approximately 0.66 MPa, for a water level gap of 90 m, when the thickness of the shaft increases from 1.1 m to 1.2 m. Hence, the shaft safety produced by increasing the wall thickness does not match its construction cost, so it is necessary to design the wall thickness reasonably by considering the actual shaft situation and economic benefits.
- (3)
- Bottom aquifer thickness.
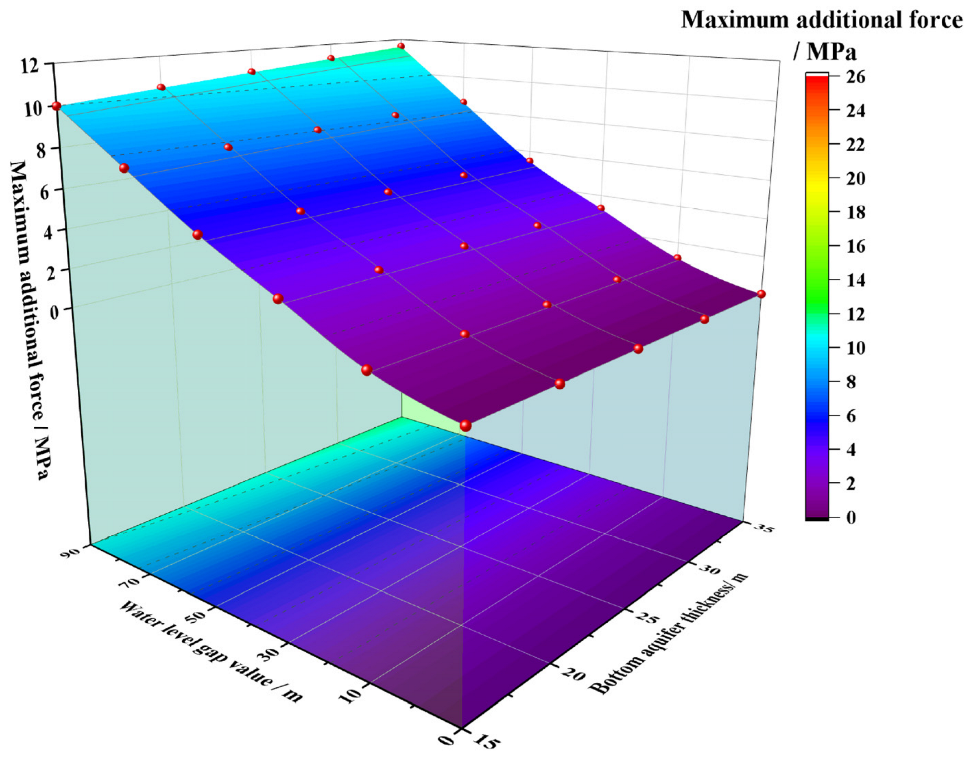
The additional force shows an increasing trend under different water level gap conditions as the bottom aquifer thickness shows an increase trend, as shown in Figure 14. The additional force changes from 1.09 MPa to 1.13 Mpa, with a water level gap of 10 m, as the thickness changes from 15 m to 35 m, and this force increases from 9.98 MPa to 11.58 MPa with a water level gap of 90 m. This phenomenon shows that, when the drainage settlement tends to increase significantly when the water level gap decreases (the water level loss), the effect of this settlement on the frictional force will also strengthen and then enhance the additional force.
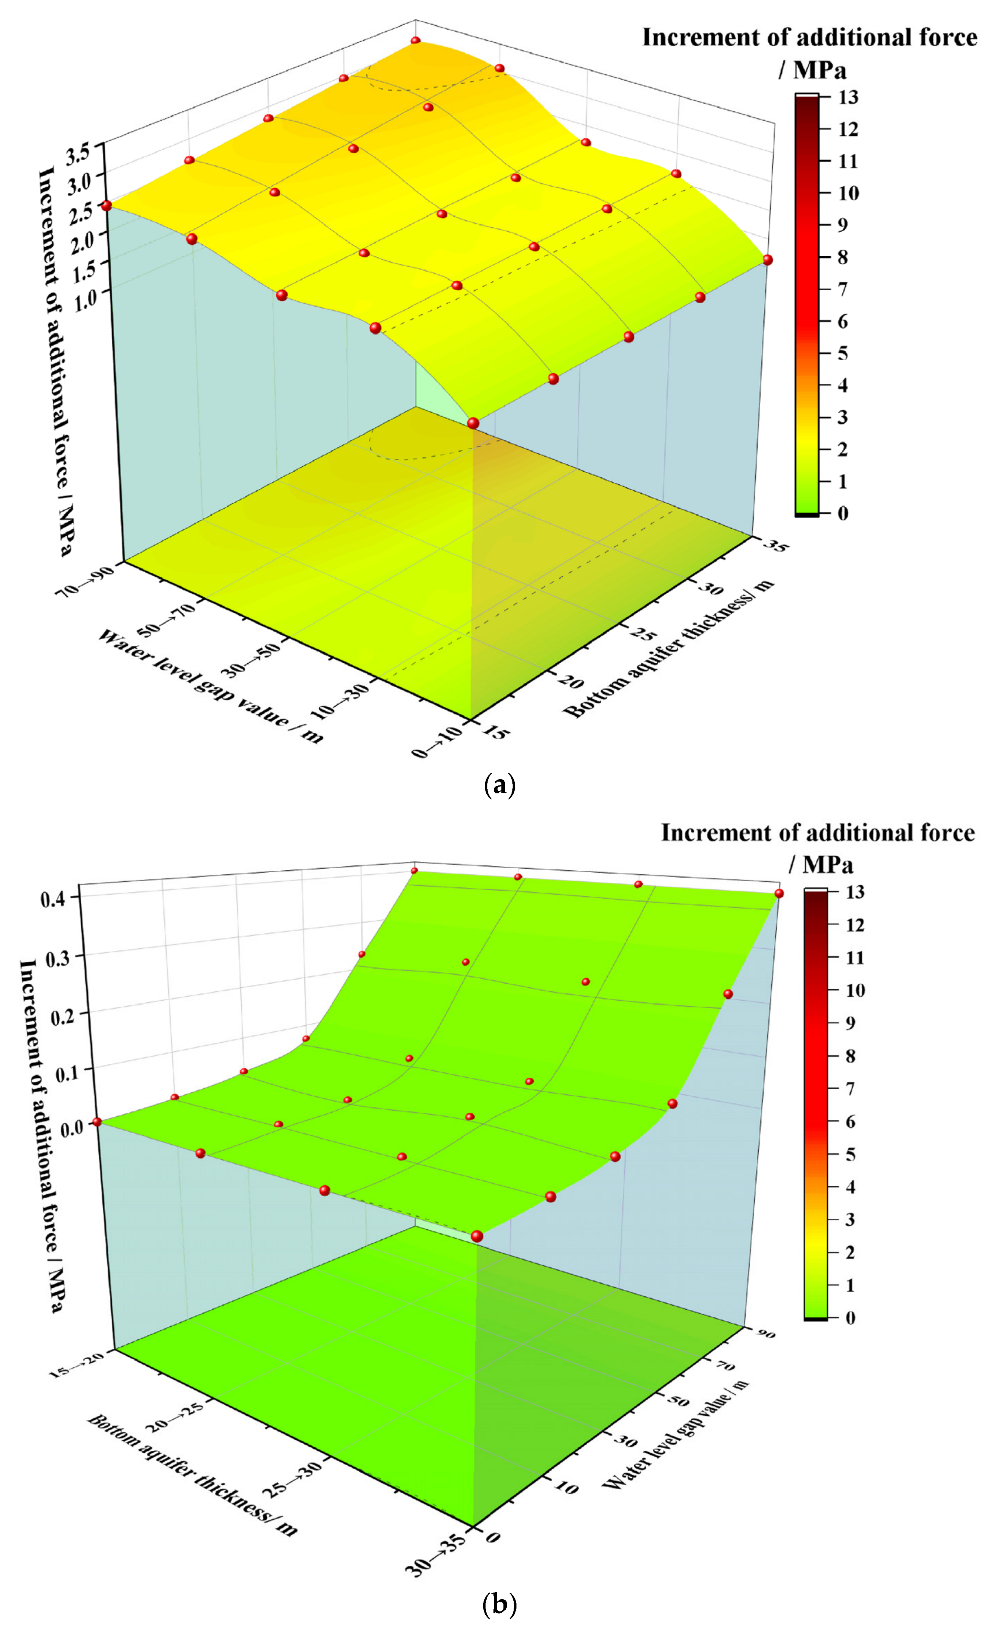
The increment of this force also grows constantly as the water level gap shows an increase trend, as shown in Figure 15. For instance, the increment of the additional force increases from 1.09 MPa to 2.44 Mpa, with a bottom aquifer of 15 m, when the water level gap increases from 0 m to 90 m, while this value increases from 1.13 MPa to 3.1 MPa with a bottom aquifer of 35 m. Interestingly, the thickness of the bottom aquifer shows little effect on the increment of the additional force when the water level gap ranges from 0 m to 90 m. These results show that the drainage settlement of the bottom aquifer should be considered, while water level gaps show a greater effect on the increment of the additional force.
- (4)
- Effect of the number of central aquifers.
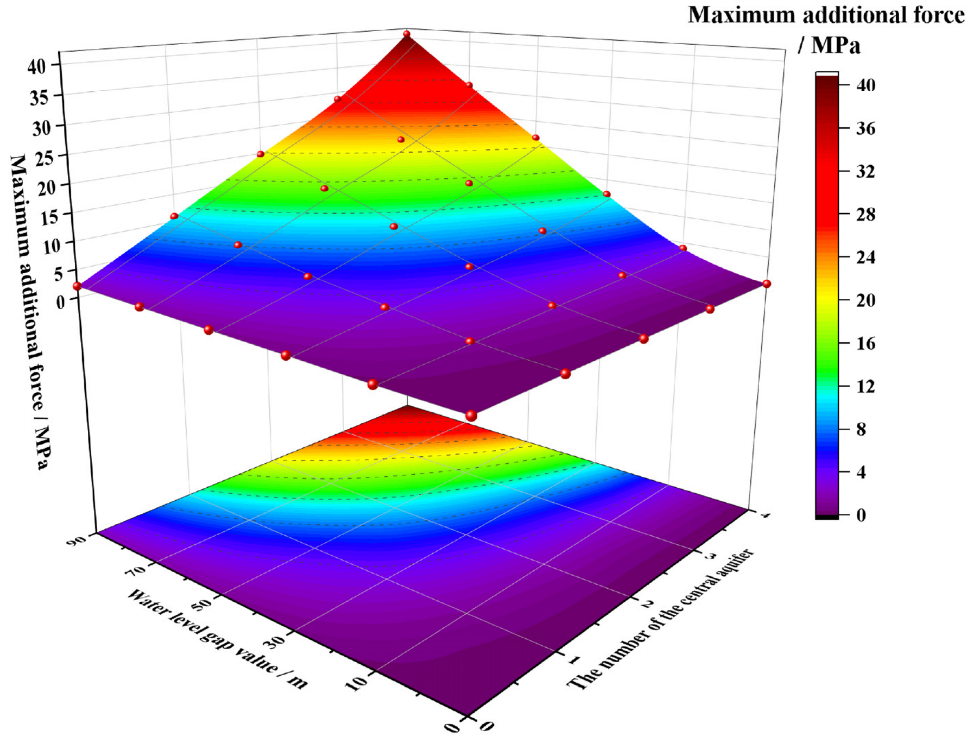
Figure 16 demonstrates that this force shows a clear trend towards increasing, with a growing number of central aquifers, under different water level gap conditions, while the difference in growth amplitude is relatively higher than that induced by other parameters. For instance, this force changes from 1.5 MPa to 31 MPa, with a water level gap of 70 m, when the number of central aquifers increases from 0 to 4, while it increases from 2 MPa to 41 MPa when the water level gap is 90 m. The increment of the additional force reaches 9 MPa, and even 12 MPa, with an increasing number of central aquifers. The possible reason may be that the water level gap value generated by water loss in the central aquifer increases with an increasing number of central aquifers, and then, the vertical additional force value increases at a high rate. The change in the number of central aquifers exerts relatively large effects on the maximum additional force, which shows the important role of the central aquifers in the study of additional force.
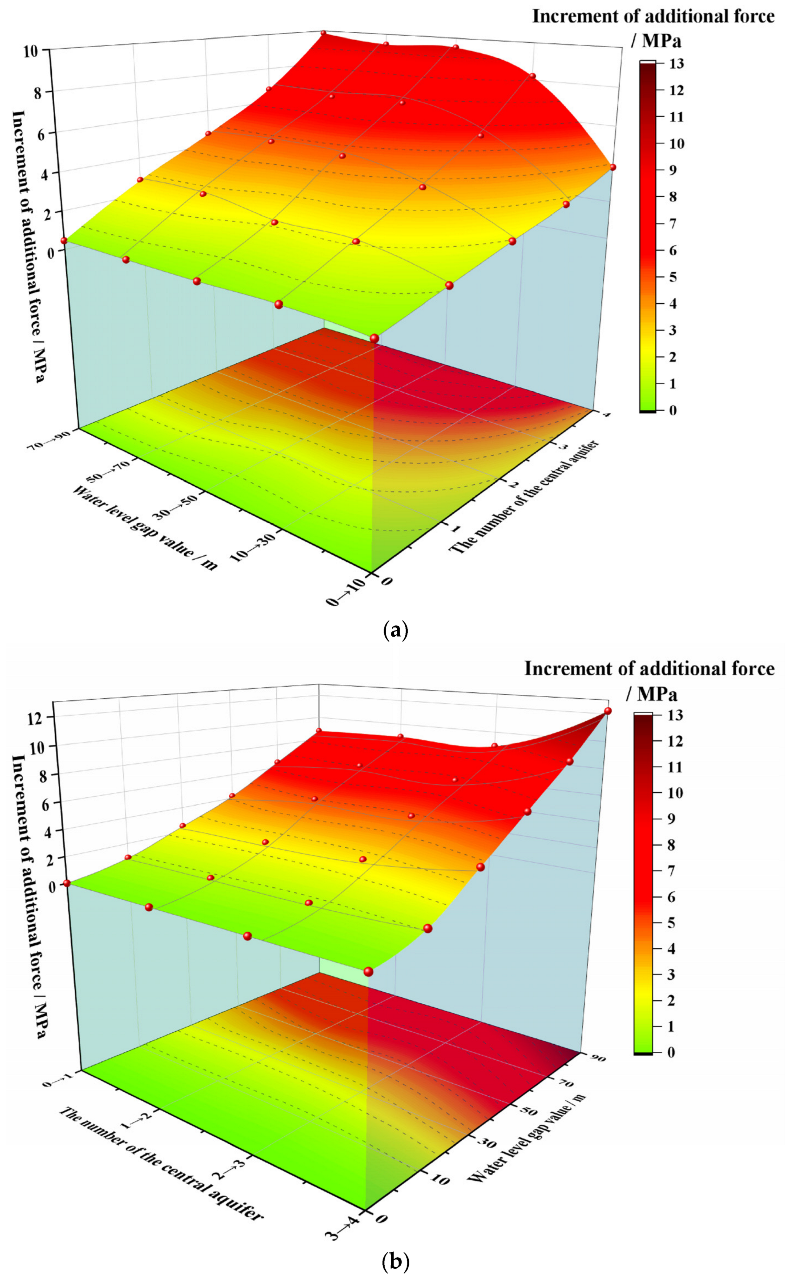
According to the results in Figure 17, the increment in this force is enhanced constantly as the water level gap increases when the number of central aquifers is held constant, while this value is greater when the number of central aquifers increases. With the water level gap value changing from 0 m to 90 m, this increment would range from 0.25 MPa to 0.46 MPa, with the central aquifer number of 0, and the increment in the additional force increases from 3.85 MPa to 9.85 MPa when the number of central aquifers is 4. The appearance of the central aquifer would significantly affect this force value, and it is important to pay attention to the drainage settlement of topsoil containing multiple aquifers. Moreover, the increment in the additional force shows a constant growth, with an increasing number of central aquifers, when the water level gap is constant.
- (5)
- Central aquifer thickness.
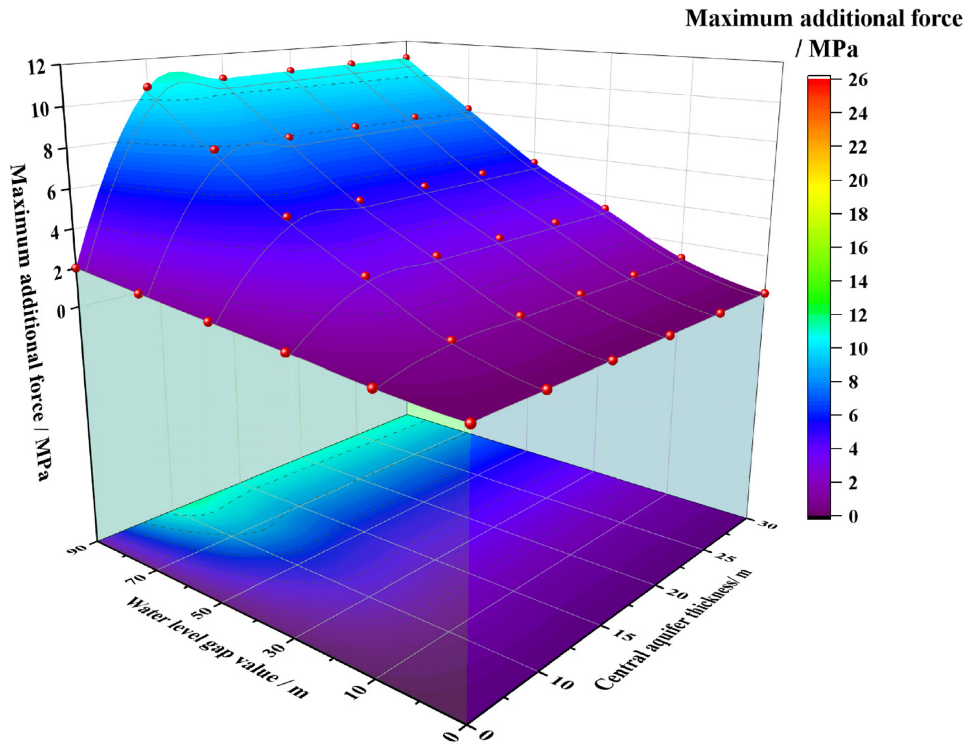
Relationships between this force and the central aquifer thickness, under different water level gap conditions, are shown in Figure 18. The maximum additional force increases with an increasing water level gap, as shown in Figure 18. With the water level gap value changing from 0 m to 90 m, this force would range from 0 MPa to 2.02 Mpa, with a central aquifer thickness of 0 m, and the force would range from 0 to 10.57 MPa when the thickness changes to 10 m. In addition, the maximum additional force increases slightly, with further increases in the central aquifer thickness. The appearance of this central aquifer leads to the more obvious settlement of topsoil and then enhances the additional force value.
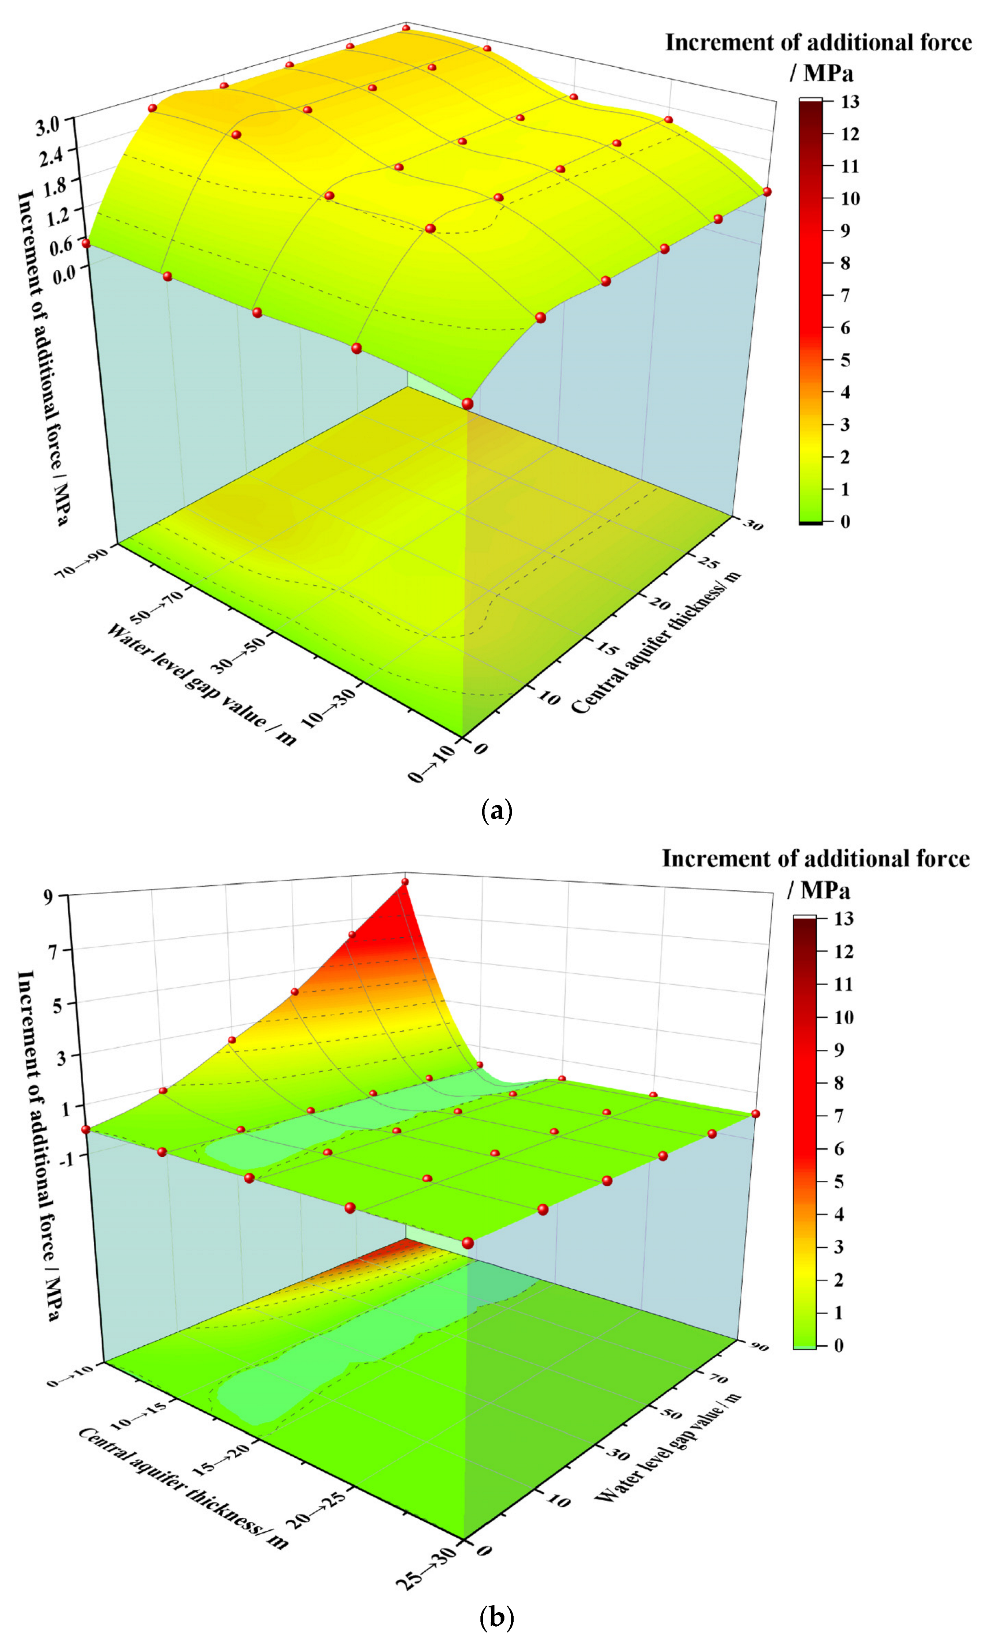
The increment in this force shows a relatively slower growth rate as the water level gap grows when the central aquifer thickness is constant, as shown in Figure 19a. The maximum additional force shows an increment of less than 3 MPa when the water level gap changes 20 m. Moreover, the variance in the additional force would obviously be influenced by the appearance of the central aquifer instead of the increase in the central aquifer thickness. In Figure 18, the maximum additional force ranges from 2.02 MPa to 10.99 Mpa, with a water level gap of 90 m, when the thickness changes from 0 m to a value of 10 m; however, the maximum additional force remains nearly 11 MPa when the central aquifer thickness continues to rise to 30 m. The increment in the additional force decreases to nearly 0 Mpa, with an increasing water level gap, when the thickness exceeds 30 m, as shown in Figure 19b. These results are similar to those of the force of the bottom aquifer thickness.
- (6)
- Location of the central aquifer.
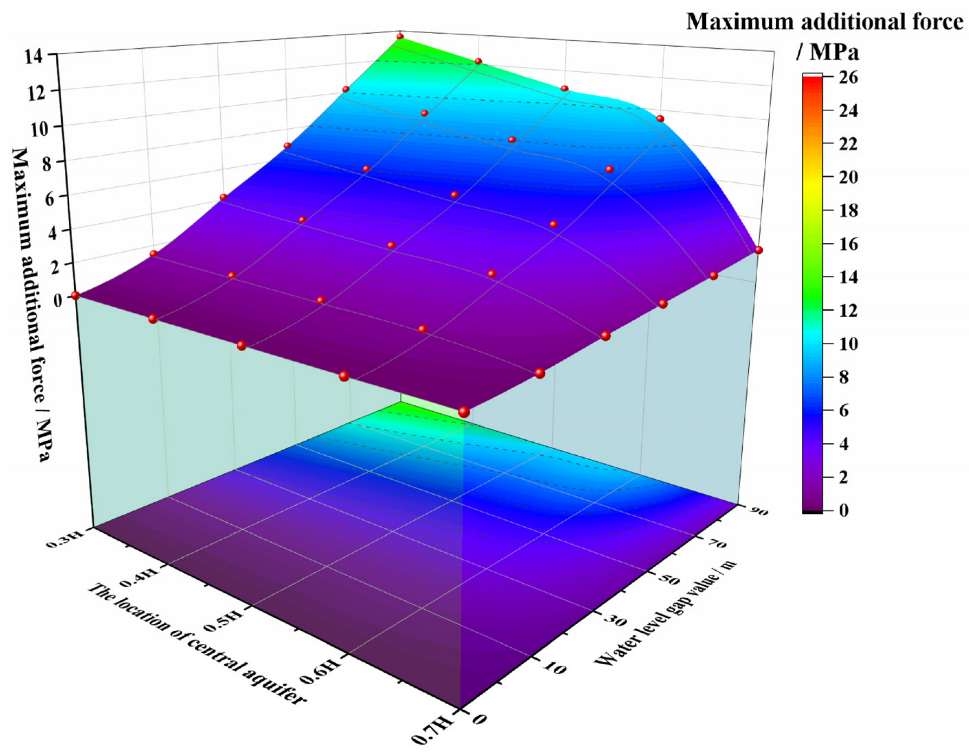
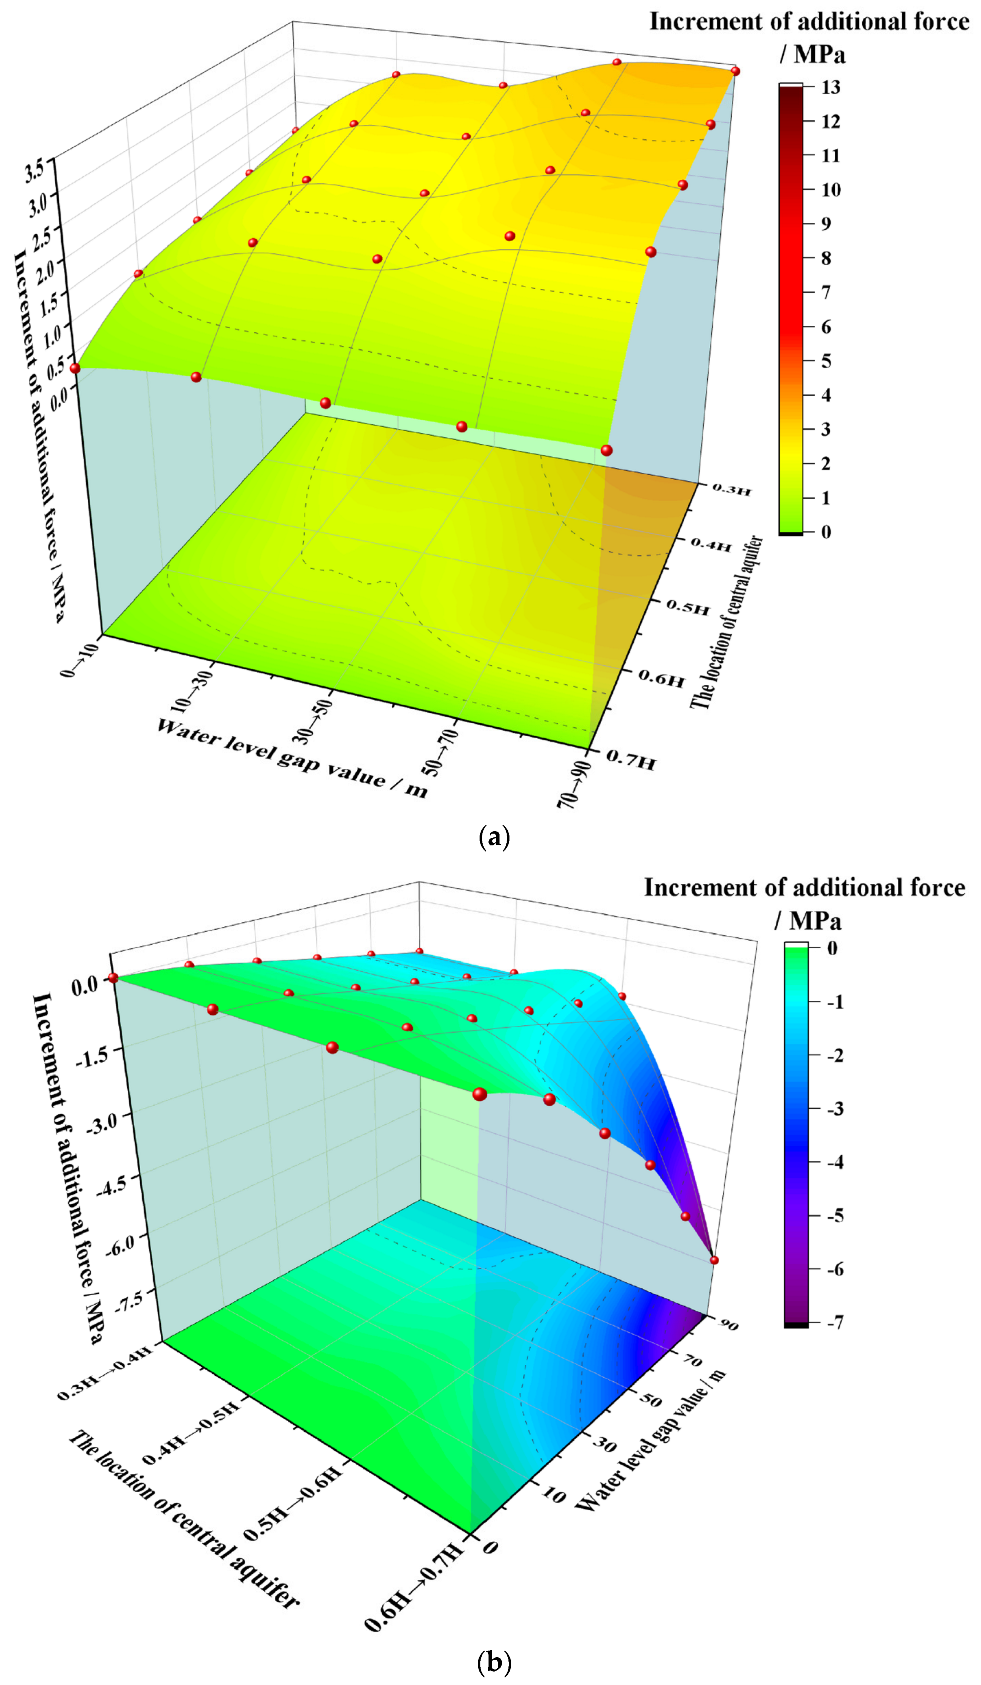
According to Figure 20, the additional force on the shaft also shows a relatively obvious increase when the height of the central aquifer grows under different water level gap conditions. This force changes from 2.04 MPa to 13.56 Mpa, with a water level gap of 90 m, as this location increases from 0.7 H to 0.3 H. Moreover, the maximum additional force of the shaft grows with an enlarging water level gap under different locations of central aquifer conditions. For instance, this force would change from 0 to 2.04 Mpa, with a central aquifer of 0.7 H, as the water level gap ranges from the 0 m condition to the 90 m condition, and the force would change to 10.78 MPa if the location was 0.5 H. In addition, the relationships between the increment in the additional force with an increasing water level gap and the location are calculated to further illustrate the influence law of these parameters on the additional force (as shown in Figure 21).
This force also presents a constant increase trend with the increasing water level gap, as shown in Figure 21a. The increment in the additional force decreases constantly, with the decreasing height of the central aquifer, when the water level gap is constant. For example, the increment in the additional force decreases from −1.39 MPa to −7.38 MPa, with a water level gap of 90 m, when the location decreases from 0.3 H to 0.7 H, as shown in Figure 21b. Therefore, measuring and acquiring the location is important for predicting the range of this force. Furthermore, the increment in the additional force changes from 0.95 MPa to 2.49 MPa when the location is 0.6H, and when the water level gap changes from 0 m to 90 m. In contrast, the increment decreases abruptly when the location is 0.7 H, and only ranges from 0.26 MPa to 0.46 MPa due to the consistent water level gap increase, as shown in Figure 21a. This phenomenon may be because the additional force is mutually neutralized when the central aquifer is located at a greater depth, which means that a threshold value exists for the depth of the central aquifer in terms of its effect on the additional force.
3.2.2. Unsynchronized Water Level Gaps in Different Aquifers
In this section, the water level gap of these two aquifers is unsynchronized. The variations in the maximum additional force value are analyzed by considering different drainage settlement cases of the aquifers. The calculation model is established based on the typical calculation parameters. The numerical calculation parameters are shown in Table 7.
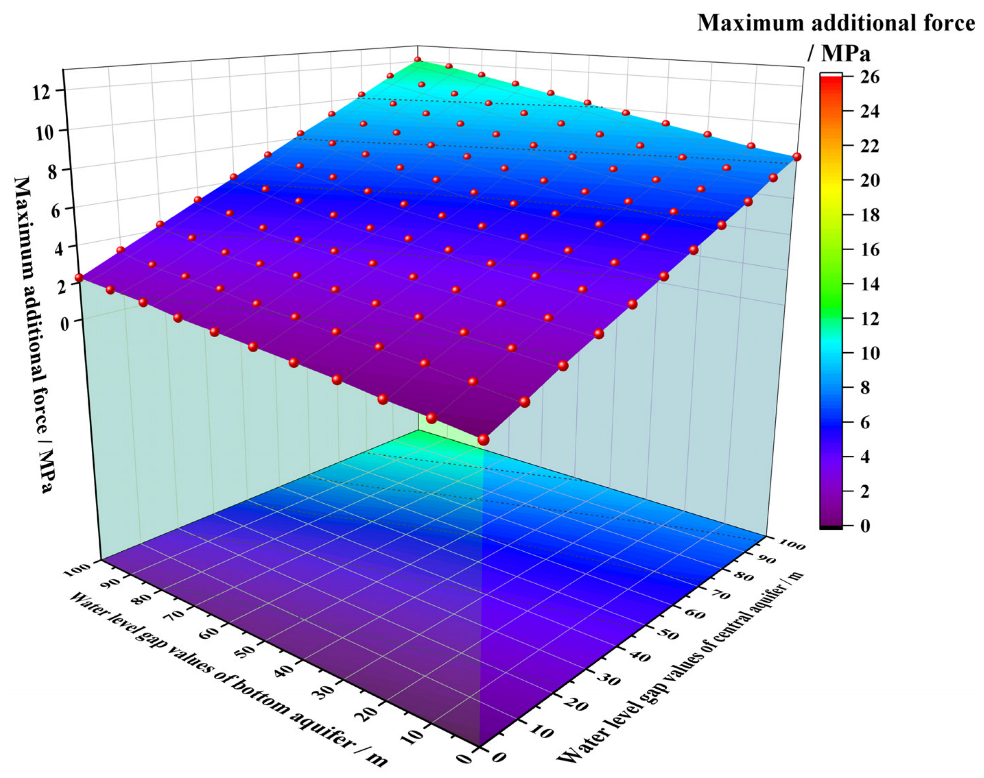
Figure 22 presents the three-dimensional contours of the additional force vs. drainage variations in the central and bottom aquifers. The maximum additional force value shows a nearly linear growth with the increasing water level gaps of the central and bottom aquifers. The increment in the maximum additional force, with an increasing water level gap in the central aquifer, is approximately 0.78~1.1 MPa, while that for the bottom aquifer is approximately 0.18~0.5 MPa, when the water level gap of the central aquifer is constant. The increment in the additional force, with an increasing water level gap in the central aquifer, is obviously larger than that in the bottom aquifer, and the effect of drainage settlement in the central aquifer is crucial for the shaft.
4. Conclusions
A numerical model simulating the additional force was established; the stress displacement of the shaft wall was analyzed during three different stages of shaft construction, and the influence law of different factors on the vertical additional force with different water level gap conditions were obtained and discussed.
(1) The influence of the central aquifer is more pronounced than the role of the bottom aquifer, on the additional force in topsoil, due to the fact that the drainage of the bottom aquifer is mainly concentrated near the upper part of the bottom aquifer, while drainage in the central aquifer not only strengthens the additional force, but also increases the influential area. For example, the additional force is about 4.8 MPa in synchronized drainage conditions, while this value is only approximately 1.3 MPa when the drainage of the central aquifer does not occur with the water level gap of 50 m. In addition, the maximum additional force shows a proportional relationship with the water level gap, in the bottom and central aquifers, when the drainage is unsynchronized.
(2) The increasing trend of the additional force shows an obvious increase with the transition from the shallow topsoil to the deep topsoil, which may be due to fact that the continuous drainage settlement of deep topsoil is more obvious when the topsoil thickness exceeds a threshold. Moreover, the additional force value progressively decreases with the increasing thickness of the shaft wall and continues to decline, which indicates that the increasing thickness of the shaft wall greatly reduces the impact of the additional force; however, this effect gradually diminishes with higher construction costs.
(3) The increasing number of central aquifers results in a higher increment in this force, which may even reach 12 MPa, with an increasing number of central aquifers, due to the huge influence of the central aquifer in the drainage settlement of topsoil. Increases in the thickness and location of different aquifers all enhance the additional force, and the increase of the water level gap is able to magnify these effects due to the increase in drainage settlement.
The relationships between a series of factors and additional force on the shaft can provide guidance for the construction of shafts regarding factors, such as the construction depth of shaft, the water level gap, etc. This paper provides theoretical support for predicting shaft wall breakage and guaranteeing shaft safety in the topsoil containing multiple aquifers.
Author Contributions
Conceptualization, T.H. and T.L.; Methodology, W.L. and Y.Z.; Software, T.H. and T.L.; Formal analysis, Y.X., W.L. and T.L.; Resources, T.H. and T.L.; Data curation, T.H. and Y.Z.; Writing—original draft, Y.X.; Writing—review & editing, T.H., W.L., Y.Z. and T.L.. All authors have read and agreed to the published version of the manuscript.
Funding
This research was funded by [the National Key Research and Development Program of China] grant number [2016YFC0600904], [the National Natural Science Foundation of China] grant number [41501075 and 41472224] and [the Natural Science Foundation of Jiangsu Province] grant number [BK20200653].
Institutional Review Board Statement
Not applicable.
Informed Consent Statement
Not applicable.
Data Availability Statement
The data set used in this work is publicly available at the Digital Rocks (https://www.digitalrocksportal.org/projects/447). The data archiving is underway and temporarily uploaded a copy as Supporting Information for review purposes.
Acknowledgments
We thank the anonymous reviewers for their professional suggestions in improving this submission.
Conflicts of Interest
The authors declare no conflict of interest.
References
- Yu, Q.; Ma, J.; Hideki, S.; Takashi, S. Influence of coal extraction operation on shaft lining stability in eastern Chinese coal mines. Geotech. Geol. Eng. 2014, 32, 821–827. [Google Scholar] [CrossRef]
- Li, W.; Yu, S. Study on the non-mining rupture of coal mine shaft in thick surface soils. J. Eng. Geol. 1995, 3, 45–55. [Google Scholar]
- Yao, Z.; Yang, J.; Sun, W. Experimental study on sliding shaft lining mechanical mechanisms underground subsidence conditions. J. Coal Sci. Eng. 2003, 9, 95–99. [Google Scholar]
- Liu, X.; Zhu, W.; Guan, K.; Zhang, J. Effect of shaft pillar extraction on stability of main shaft: A case study at Xincheng Gold Mine, China. Math. Probl. Eng. 2018, 2018, 1–16. [Google Scholar] [CrossRef]
- Cui, G.; Cheng, X. Occasions of damaging shaft walls in Xuhuai district. Coal Sci. Technol. 1991, 46–49. [Google Scholar]
- Zhou, G.; Cheng, X.; Cui, G. Simulation research on the additional force acting on the vertical shaft lining in clay. J. China Univ. Min. Technol. 1991, 20, 87–91. [Google Scholar]
- Yang, W.; Cui, G.; Zhou, G.; Meng, Y.; Zhu, J.; Yu, X. Fracture mechanism of shaft lining under special shaft condition and the technique preventing the shaft from fracturing (part one). J. China Univ. Min. Technol. 1996, 25, 1–5. [Google Scholar]
- Kim, H.J.; Mission, J.L.C. Development of negative skin friction on single piles: Uncoupled analysis based on nonlinear consolidation theory with finite strain and the load-transfer method. Can. Geotech. J. 2011, 48, 905–914. [Google Scholar] [CrossRef]
- Cui, G. Fracture mechanism of vertical shaft lining under special stratigraphic conditions. Mine Constr. Technol. 1998, 19, 29–32. [Google Scholar]
- Huang, J.; Yang, W. Study on variation of vertical additional force on shaft lining by simulation tests. Chin. J. Geotech. Eng. 2006, 28, 1204–1207. [Google Scholar]
- Yang, J.; Yao, Z. Finite element solution of stress and ultimate load bearing capacity of concrete shaft lining. J. Anhui Univ. Sci. Technol. (Nat. Sci.) 1992, 12, 11–17. [Google Scholar]
- Yang, J. Study on fracture mechanism of shaft wall by structural analysis method. J. Huainan Min. Inst. 1993, 13, 30–35. [Google Scholar]
- Liu, H.; Li, X.; Wang, S.; Zeng, Q. Three-dimensional coupled numerical, non-mining fracturing process numerical simulation for shaft in thick alluvial. J. Eng. Geol. 2004, 12, 529–532. [Google Scholar]
- Li, W.; Yu, S. Study on non-mining rupture of coal mine vertical shafts in deep and thick topsoil. J. Eng. Geol. 1995, 3, 45–55. [Google Scholar]
- Liu, Q. Study on Mechanical Properties of Shaft Wall Fracture and Treatment Process in Deep and Thick Topsoil. Master’s Thesis, Qingdao University of Technology, Qingdao, China, 2006. [Google Scholar]
- Ding, M. Failure Forecast of the Underground Structure under Complicated Load. Master’s Thesis, Shandong University of Science and Technology, Qingdao, China, 2005. [Google Scholar]
- Shen, M. The Destruction Forecast and Reinforcement Decision-Making of Vertical Shaft in Deep Topsoil. Master’s Thesis, Shandong University of Science and Technology, Qingdao, China, 2008. [Google Scholar]
- Hou, J.; Nie, F. Numerical Analysis on Variation Law about Vertical Additional Force of Monolayer Shaft Lining. Chin. Coal 2012, 198, 31–34. [Google Scholar]
- Mu, K. Stress Mechanism Analysis and Safety Monitoring Research on Simultaneous Water Loss Shaft Wall of Upper and Lower Aquifers in Alluvium. Master’s Thesis, Anhui University of Science and Technology, Huainan, China, 2020. [Google Scholar]
- Wu, Y. Mechanism of Shaft Wall Deformation and Engineering Monitoring in Zhuxianzhuang Coal Mine under the Condition of “Five Contained” Drainage Water. Master’s Thesis, Anhui University of Science and Technology, Huainan, China, 2019. [Google Scholar]
- Guo, L. Strata Deformation Induced by Drainage on One Side of Shaft and Its Influence on the Shaft in Thick Topsoil. Master’s Thesis, China University of Mining and Technology, Xuzhou, China, 2000. [Google Scholar]
- Goodman, R.E.; Taylor, R.L.; Brekke, T.L. A model for the mechanics of jointed rock. ASCE Soil Mech. Found. Div. J. 1968, 99, 637–659. [Google Scholar] [CrossRef]
- Ottosen, N.S. A Failure Criterion for Concrete. J. Eng. Mech. 1977, 103, 527–535. [Google Scholar] [CrossRef]
- Liu, G.; Wang, D.; Wei, Z.; Huang, X. Failure Criterion of Concrete Based on Strain Space Under Triaxial Compression. J. Comput. Theor. Nanosci. 2016, 13, 5879–5886. [Google Scholar] [CrossRef]
- Gerstle, K.H. Simple formulation of biaxial concrete behavior. J. Am. Concr. Inst. 2010, 78, 62–68. [Google Scholar]
- Li, J.; Wang, W. Ultimate Compressive Strain of High Strength Concrete under Non-homogneous Compressive Loading. Ind. Constr. 1997, 27, 41–43. [Google Scholar]
- Liu, J.; Chen, L.; Wang, J. Calculation methods of horizontal ground pressure on shaft wall in deep alluvium. China Min. Mag. 2013, 22, 72–75. [Google Scholar]
- China Coal Construction Association. Code for Design of Coal Mine Shaft and Chamber; China Coal Construction Association: Beijing, China, 2016. [Google Scholar]
- Hu, W. The Research of Caculation Methods for Lateral Pressure on Shaft Lining and Its Numerical Simulations. Master’s Thesis, Central South University, Changsha, China, 2014. [Google Scholar]
- Cui, G.; Yang, W.; Lv, H. Freezing Walls and Shaft Walls in Deep Topsoil Layers; China University of Mining and Technology Press: Xuzhou, China, 1998. [Google Scholar]
- Yang, W. Study on Variation Law of Vertical Additional Force of Shaft Wall in Deep Topsoil. Ph.D. Thesis, China University of Mining and Technology, Xuzhou, China, 1994. [Google Scholar]
- Cui, G. The basic theory for analyzing loads on underground structure in deep alluvium mechanics of deep soil. J. Coal 1999, 24, 13–16. [Google Scholar]
Figure 1.
Schematic diagram of additional forces.

Figure 2.
Calculation model: (a) simplified calculation model, (b) finite element model.

Figure 3.
Evaluation for the grid sensitivity test.

Figure 4.
Field strain of shaft wall: (a) clay layer surrounding the north ventilation shaft, (b) sand layer surrounding the north ventilation shaft, (c) clayey sand layer surrounding the west ventilation shaft, (d) sandy clay layer surrounding the west ventilation shaft.
Figure 4.
Field strain of shaft wall: (a) clay layer surrounding the north ventilation shaft, (b) sand layer surrounding the north ventilation shaft, (c) clayey sand layer surrounding the west ventilation shaft, (d) sandy clay layer surrounding the west ventilation shaft.


Figure 5.
Displacement contour in the initial state of stratum: (a) displacement in X-directional, (b) displacement in Y-directional.
Figure 5.
Displacement contour in the initial state of stratum: (a) displacement in X-directional, (b) displacement in Y-directional.

Figure 6.
Stress contour in the initial state of stratum: (a) stress in X-directional, (b) stress in Y-directional.
Figure 6.
Stress contour in the initial state of stratum: (a) stress in X-directional, (b) stress in Y-directional.

Figure 7.
Displacement contour of shaft wall combined with the stratum in equilibrium: (a) displacement in X-directional, (b) displacement in Y-directional.
Figure 7.
Displacement contour of shaft wall combined with the stratum in equilibrium: (a) displacement in X-directional, (b) displacement in Y-directional.

Figure 8.
Stress contour of shaft wall combined with the stratum in equilibrium: (a) stress in X-directional, (b) stress in Y-directional.
Figure 8.
Stress contour of shaft wall combined with the stratum in equilibrium: (a) stress in X-directional, (b) stress in Y-directional.

Figure 9.
The relationship curves between the water level gap and additional force during the drainage state of the stratum: (a) synchronized drainage settlement, (b) unsynchronized drainage settlement.
Figure 9.
The relationship curves between the water level gap and additional force during the drainage state of the stratum: (a) synchronized drainage settlement, (b) unsynchronized drainage settlement.

Figure 10.
The relationships between this force and topsoil thickness with different water level gap values.
Figure 10.
The relationships between this force and topsoil thickness with different water level gap values.

Figure 11.
The relationships between the increment of this force, the water level gap and the topsoil thickness: (a) the topsoil thickness is constant, (b) the water level gap is constant.
Figure 11.
The relationships between the increment of this force, the water level gap and the topsoil thickness: (a) the topsoil thickness is constant, (b) the water level gap is constant.


Figure 12.
The relationships between this force and shaft wall thickness with different water level gap values.
Figure 12.
The relationships between this force and shaft wall thickness with different water level gap values.

Figure 13.
The relationships between the variance of this force, the water level gap and shaft wall thickness: (a) the shaft wall thickness is constant, (b) the water level gap is constant.
Figure 13.
The relationships between the variance of this force, the water level gap and shaft wall thickness: (a) the shaft wall thickness is constant, (b) the water level gap is constant.

Figure 14.
The relationships between this force and the bottom aquifer thickness with different water level gap values.
Figure 14.
The relationships between this force and the bottom aquifer thickness with different water level gap values.

Figure 15.
The relationships between the variance of this force with the water level gap and the bottom aquifer thickness: (a) the bottom aquifer thickness is constant, (b) the water level gap is constant.
Figure 15.
The relationships between the variance of this force with the water level gap and the bottom aquifer thickness: (a) the bottom aquifer thickness is constant, (b) the water level gap is constant.

Figure 16.
The relationships between this force and the number of central aquifers with different water level gap values.
Figure 16.
The relationships between this force and the number of central aquifers with different water level gap values.

Figure 17.
The relationships between the variance of this force with the water level gap and the number of central aquifers: (a) the number of central aquifers is constant, (b) the water level gap is constant.
Figure 17.
The relationships between the variance of this force with the water level gap and the number of central aquifers: (a) the number of central aquifers is constant, (b) the water level gap is constant.

Figure 18.
The relationships between this force and the central aquifer thickness with different water level gap values.
Figure 18.
The relationships between this force and the central aquifer thickness with different water level gap values.

Figure 19.
The relationships between the variance of this force with the water level gap and the central aquifer thickness: (a) the central aquifer thickness is constant, (b) the water level gap is constant.
Figure 19.
The relationships between the variance of this force with the water level gap and the central aquifer thickness: (a) the central aquifer thickness is constant, (b) the water level gap is constant.

Figure 20.
The relationships between this force and the location of the central aquifer with different water level gap values.
Figure 20.
The relationships between this force and the location of the central aquifer with different water level gap values.

Figure 21.
The relationships between the variance of this force with the water level gap and the location of the central aquifer: (a) the location of the central aquifer is constant, (b) the water level gap is constant.
Figure 21.
The relationships between the variance of this force with the water level gap and the location of the central aquifer: (a) the location of the central aquifer is constant, (b) the water level gap is constant.

Figure 22.
The relationships between this force and the water level gap of the two aquifers.


Table 1.
The relationships between the growth rate b of vertical additional force, soil properties and shaft depth.
Table 1.
The relationships between the growth rate b of vertical additional force, soil properties and shaft depth.
| Shaft Depth z/m | Top Stress Ph/MPa | b /MPa Month−1 | |||
|---|---|---|---|---|---|
| Clay | Sandy Clay | Clayey Sand | Sand | ||
| 0~50 | 1.0 | 0.112 | 0.190 | 0.479 | 0.927 |
| 50~100 | 2.0 | 0.158 | 0.400 | 0.786 | 1.824 |
| 100~150 | 3.0 | 0.190 | 0.536 | 0.948 | 1.816 |
| 150~200 | 4.0 | 0.258 | 0.552 | 1.076 | 1.116 |
| 200~250 | 5.0 | 0.290 | 0.565 | 1.160 | 1.144 |
| 250~300 | 6.0 | 0.332 | 0.584 | 1.230 | 1.401 |
Table 2.
Table of fixed parameter values.
| Stratum | Density (kg/m3) | Modulus of Elasticity (MPa) | Poisson’s Ratio | Internal Friction Angle (o) | Cohesion (MPa) |
|---|---|---|---|---|---|
| Shaft wall | 2500 | 30,000 | 0.17 | 40 | 6.40 |
| Aquiclude No. 1 | 1900 | 65 | 0.35 | 22 | 0.25 |
| Aquifer No. 1 | 2100 | 120 | 0.25 | 20 | 0.15 |
| Aquiclude No. 2 | 2100 | 80 | 0.30 | 23 | 0.25 |
| Aquifer No. 2 | 1900 | 60 | 0.23 | 15 | 0.20 |
Table 3.
Table of variable parameter values.
| Number | Main Calculation Parameters | Parameter Value Range | Typical Parameter Value |
|---|---|---|---|
| 1 | Shaft wall thickness/m | 0.8,0.9,1.0,1.1,1.2 | 1 |
| 2 | Total thickness of topsoil (H)/m | 100,150,200,250,300 | 200 |
| 3 | Thickness of bottom aquifer/m | 15,20,25,30,35 | 25 |
| 4 | Thickness of central aquifer/m | 0,10,15,20,25,30 | 20 |
| 5 | Water level gap of the bottom aquifer/m | 10,30,50,70,90 | 30 |
| 6 | Water level gap of the central aquifer/m | 10,30,50,70,90 | 30 |
| 7 | Location of central aquifer/m | 0.3 H,0.4 H,0.5 H,0.6 H,0.7 H | 0.5 H |
| 8 | Number of central aquifers | 0,1,2,3,4 | 1 |
Table 4.
The basic geology conditions of the surrounding topsoil and geometric dimensions of these three shafts.
Table 4.
The basic geology conditions of the surrounding topsoil and geometric dimensions of these three shafts.
| Number | Main Calculation Parameters | West Ventilation Shaft | North Ventilation Shaft | Auxiliary Shaft | Typical Parameter Value |
|---|---|---|---|---|---|
| 1 | Shaft wall thickness/m | 0.8 | 0.8 | 1.1 | 1 |
| 2 | Total thickness of topsoil (H)/m | 134.8 | 111.04 | 108.35 | 200 |
| 3 | Thickness of bottom aquifer/m | 23.43 | 19.96 | 37.02 | 25 |
| 4 | Thickness of central aquifer/m | 35.44 | 20.77 | 11.89 | 20 |
| 5 | Water level gap of the bottom aquifer/m | 23.43 | 19.96 | 37.02 | 30 |
| 6 | Water level gap of the central aquifer/m | 35.44 | 20.77 | 11.89 | 30 |
| 7 | Location of central aquifer/m | 0.35 H~0.93 H | 0.19 H~0.60H | 0.25 H~0.53 H | 0.5 H |
| 8 | Number of central aquifers | 6 | 5 | 4 | 1 |
Table 5.
Comparison between the theoretical and field values of the regression coefficient of b.
| Soil Type | Shaft Depth z/m | Theoretical Value | Shaft Depth z/m | Filed Value | Remarks |
|---|---|---|---|---|---|
| Clay | 50~100 | 0.158 | 66 | 0.136~0.271 | north ventilation shaft wall |
| Sandy clay | 100~150 | 0.536 | 126.5 | 0.393~0.589 | west ventilation shaft wall |
| Clayey sand | 100~150 | 0.948 | 114.5 | 0.842~1.202 | west ventilation shaft wall |
| Sand | 50~100 | 1.824 | 96 | 0.932~1.864 | north ventilation shaft wall |
Table 6.
Table of calculation parameter values.
| Calculation Parameters | Thickness of the Shaft Wall | Thickness of the Topsoil | Thickness of the Bottom Aquifer | Thickness of the Central Aquifer | Location of the Central Aquifer | The Number of Central Aquifers |
|---|---|---|---|---|---|---|
| Value | 1 m | 200 m | 25 m | 20 m | 0.5 H | 1 |
Table 7.
Table of calculation parameter values in unsynchronized water level gap conditions.
| Calculation Parameters | The Outer Radius of the Shaft | Thickness of the Shaft Wall | Thickness of the Topsoil | Thickness of the Bottom Aquifer | Thickness of the Central Aquifer | Location of the Central Aquifer |
|---|---|---|---|---|---|---|
| Value | 4 m | 1 m | 200 m | 25 m | 20 m | 90~110 m |
Disclaimer/Publisher’s Note: The statements, opinions and data contained in all publications are solely those of the individual author(s) and contributor(s) and not of MDPI and/or the editor(s). MDPI and/or the editor(s) disclaim responsibility for any injury to people or property resulting from any ideas, methods, instructions or products referred to in the content. |
© 2023 by the authors. Licensee MDPI, Basel, Switzerland. This article is an open access article distributed under the terms and conditions of the Creative Commons Attribution (CC BY) license (https://creativecommons.org/licenses/by/4.0/).
Share and Cite
MDPI and ACS Style
Han, T.; Xue, Y.; Lv, W.; Zhang, Y.; Luo, T. Prediction and Analysis of Vertical Additional Force of Shaft Wall in Topsoil Containing Multiple Aquifers during Drainage. Sustainability 2023, 15, 2877. https://doi.org/10.3390/su15042877
AMA Style
Han T, Xue Y, Lv W, Zhang Y, Luo T. Prediction and Analysis of Vertical Additional Force of Shaft Wall in Topsoil Containing Multiple Aquifers during Drainage. Sustainability. 2023; 15(4):2877. https://doi.org/10.3390/su15042877
Chicago/Turabian StyleHan, Tao, Yong Xue, Weikui Lv, Yu Zhang, and Tingting Luo. 2023. "Prediction and Analysis of Vertical Additional Force of Shaft Wall in Topsoil Containing Multiple Aquifers during Drainage" Sustainability 15, no. 4: 2877. https://doi.org/10.3390/su15042877
Note that from the first issue of 2016, this journal uses article numbers instead of page numbers. See further details here.