

Mechanisms of How Private Equity Drives Industrial Upgrade: An Empirical Study Based on China’s Panel Data
1
School of Government, Beijing Normal University, Beijing 100875, China
2
School of Art & Science, The State University of New York at Stony Brook, New York, NY 11720, USA
*
Author to whom correspondence should be addressed.
Sustainability 2023, 15(3), 2570; https://doi.org/10.3390/su15032570
Submission received: 18 November 2022
/
Revised: 18 January 2023
/
Accepted: 20 January 2023
/
Published: 31 January 2023
(This article belongs to the Special Issue Consumer Behavior and Sustainable Marketing Development in Online and Offline Settings)
Abstract
:In recent years, the investment of private equity funds in China has increased and has become an important tool to promote industrial structure upgrades. Therefore, it is of theoretical and practical significance to study how and why industrial upgrades are driven by private equity funds. First, we use the understanding of heterogeneity to study the differences between the use of private equity funds and other financial instruments to stimulate industrial upgrades, and we represent industrial growth from two perspectives: economic aggregate growth and economic efficiency improvement. Next, we use shift-share analysis to disaggregate industrial upgrades into static and dynamic transfer effects, showing that other financial instruments only promote production factor mobility but not production efficiency, while private equity funds significantly contribute to both mobility and efficiency. Finally, the mediating effect model is used to study how private equity funds drive industrial upgrades: mainly from efficiency improvement based on technological progress and innovation output, and to a lesser extent from the promotion of factor mobility. The findings have practical value and implications for the optimization of financial reforms and the sustainability of regional economies.
1. Introduction
The history of global economic structure changes in recent decades shows that industrial upgrades start with innovation and succeed in capital growth. Since venture capital and private equity (abbreviated as PE) funds have higher investment flexibility and a stronger tolerance for failure, they have become important driving influences in innovation incubation, resource allocation, and accelerated factor flow. Therefore, they are increasingly important financial tools for transforming the developmental stage of the economy, optimizing the economic structure, and promoting industrial upgrades. Since its development in 2003, PE funds in China have become an increasingly important tool in financial investment. According to data published by the China Association of Fund Industry, the scale of PE funds under management in China as of December 2021 was close to RMB 16 trillion, accounting for 14.7% of the GDP in that year.
However, during the accelerated development of private equity in China, there has been a relative lack of theoretical research on the mechanism of the role of PE funds in driving economic structure optimization and industrial upgrades. The relationship between financial development and industrial upgrades has always been the focus of theoretical research. Industrial upgrades can be expressed as the economic growth resulting from the increase in production efficiency formed by factor flow. Early studies created the model that financial development can enhance production efficiency and thus drive economic growth [1]. On the other hand, Pasinetti showed that financial development can lead to an increase in the flow of factors of production to sectors with higher productivity or productivity growth, which in turn leads to an upgrade of the industrial structure [2]. Early studies on the relationship between financial development and economic growth analyzed the overall financial development. However, there are significant differences in the extent to which different financial instruments within the financial system influence economic growth and industrial upgrades. Therefore, the impact of financial development on economic development has shifted from a "scale" study to a "structure" study, and it is necessary to analyze which financial instruments are more conducive to industrial upgrades and economic growth.
Financial structure can be simply broken down into direct financial instruments based on equity investment and indirect financial instruments based on debt credit. The theoretical studies found that equity investment instruments had a comparative advantage in supporting fundamental technological innovation [3], and equity financing was the most important exogenous financing method for corporate R&D [4].In empirical analysis based on several economies around the world, Hsu and Tian further found that more developed equity financing promotes innovation development in the economy, while a boom in indirect financing, such as bank credit, has a certain dampening effect on industry innovation [5].
Existing studies have mainly analyzed the driving value of equity investment on technological innovation, but industrial upgrades are manifested not only as the efficiency improvement brought by technological progress but also as the flow and optimal allocation of production factors among industrial sectors [6]. At the same time, existing studies are based on the technology-driven economic growth model of developed economies such as Europe and the United States; however, the industrial structure of developing countries is dominated by labor-intensive industries, and economic development mainly relies on late-stage advantages. The bank credit system is more effective in overcoming information asymmetry and achieving higher financial allocation efficiency in the context of an industrial structure with a lower degree of technological risk; blindly expanding the ratio of equity investment and pursuing the diversification of financial structure may bring economic growth but may also easily lead to the instability of the financial system [7]. In theoretical studies, Levine and Zervos demonstrated that direct financial instruments such as venture capital have a significant impact on innovation output but not on economic growth [8]. Therefore, it is necessary to study the extent and mechanism of the effect of PE funds on industrial structure upgrades in the context of China’s current stage of economic development and industrial structure.
Financial instruments can effectively support technological innovation, which is the key to upgrading China’s industrial structure, and research shows that the positive driving coefficient of equity financing for technological innovation is much higher than that of debt financing instruments [9]. When the role of PE funds in industrial restructuring is studied in depth using a multi-group structural equation model, it is found that PE funds have a positive and significant impact on corporate R&D investment at the micro level, but the impact on economic growth and employment drive at the macro level is not significant [10]. A number of subsequent studies in recent years empirically measured the significant effect of equity investment funds on innovation output in Chinese firms in recent years, but none of them developed direct evidence that PE funds can drive industrial upgrades and economic optimization [11].
In summary of the above literature, it is clear that financial development significantly drives economic growth, but there are different conclusions about the driving mechanism of private equity funds for economic growth and industrial upgrades. Some studies have concluded that PE funds can generate technological innovation output but do not significantly drive economic growth; others have concluded that PE funds can only increase economic aggregates but do not significantly drive industrial upgrades. Because of these discrepancies, it is necessary to further analyze and empirically test how PE funds affect industrial structure upgrades.
The marginal contributions of this paper are: (1) to investigate whether PE funds drive an increase in economic aggregates or enhance industrial efficiency in developing countries based on data from China; (2) to investigate in depth the mechanism of industrial upgrades driven by PE funds: since industrial upgrades are expressed both as factor efficiency gains from innovation and as factor mobility from inefficient to efficient sectors brought about by allocation optimization, and whether PE funds mainly induce the flow of factors in the process of industrial upgrades or mainly drive efficiency improvement.
Based on the heterogeneity of financial instruments, this paper first analyzes the differences between PE funds and other financial instruments in driving industrial upgrades; then, it deconstructs the industrial structure and studies how private equity affects industrial upgrades using deviation shift-share analysis. Finally, it studies the driving path of PE funds affecting industrial upgrades using the mediating effect model.
2. Theoretical Framework
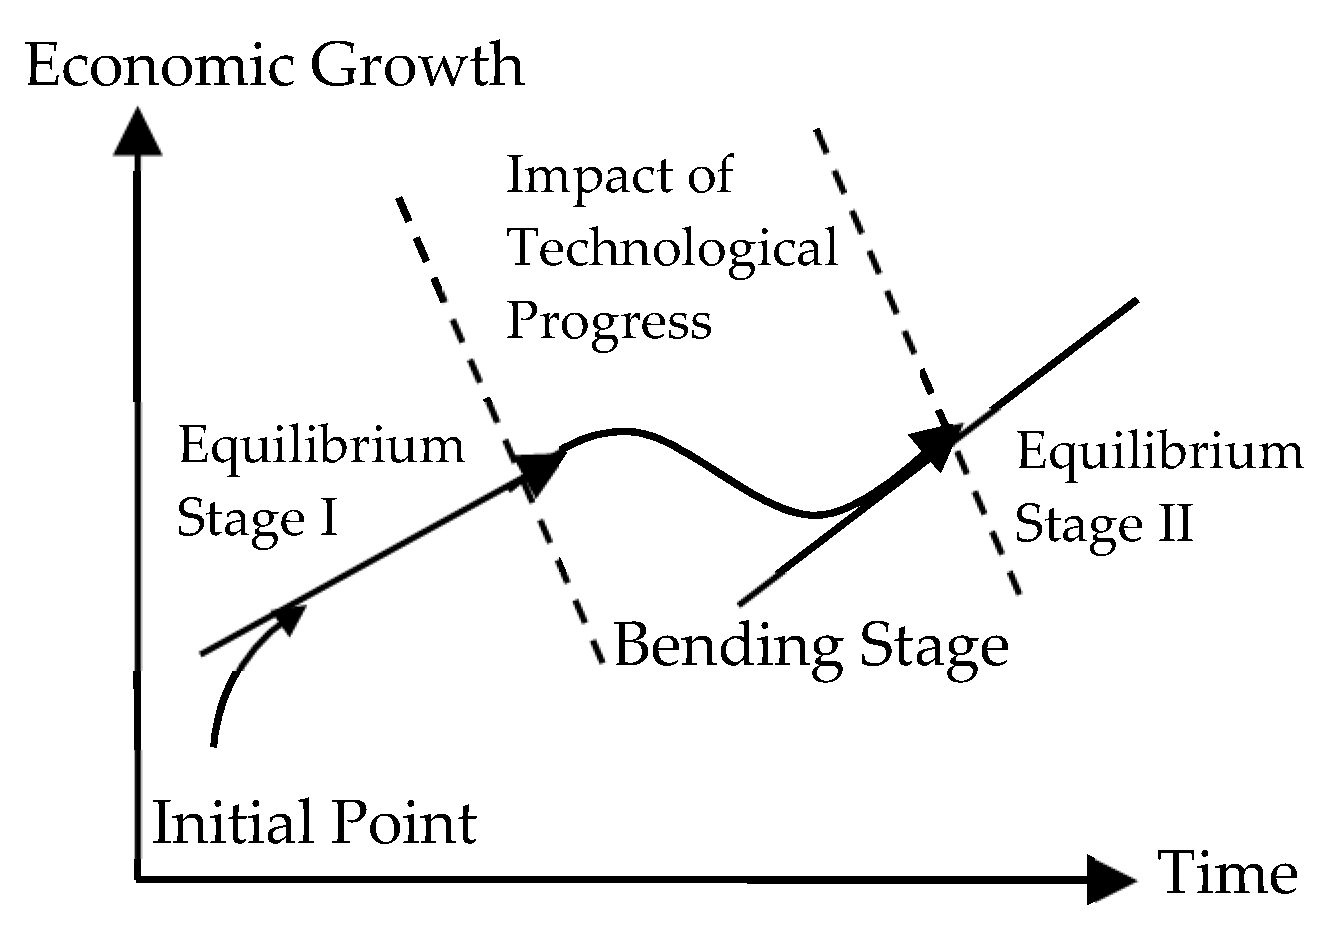
The essence of economic structure optimization is the non-equilibrium stage in the process of economic growth, which can be expressed by the non-equilibrium process in Neumann’s theorem [12]. In stage I of Figure 1, various factors combine according to the optimal structure, economic growth enters a rapid development stage, and the industrial structure is relatively stable. When exogenous shocks such as scientific innovation and technological progress occur, there are differences in the elasticity of technology absorption between different industries, resulting in unbalanced growth in the industrial development of the original economic structure. With the further development of scientific and technological innovation or the gradual deepening and upgrading of demand, the friction between industries gradually decreases, the industrial interface gradually becomes smooth, the factors of production are reconfigured and combined according to the conditions of a more advanced industrial structure, and economic growth enters the balanced stage of more efficient development again, that is, stage II in Figure 1. Neumann’s theorem says that the long-term overall optimal growth path of the economy is such a process of alternating equilibrium growth and unbalanced growth—the equilibrium growth of stage II is more efficient and qualitative than the equilibrium growth of stage I, and the bending stage between the two equilibrium growth periods is the process of economic structural optimization.
It is undeniable that the unbalanced growth of the economy in the bending stage will lead to the structural adjustment of production factors, while factor adjustment itself will form frictional costs [2]. When the benefits brought by technological progress are not enough to make up for the costs incurred by the adjustment of factor distribution, the optimization of economic structure is more difficult to achieve, which results in a time lag effect on industrial upgrades. Therefore, the optimal combination of industrial upgrades and economic growth in the ideal state should also meet an exogenous condition; that is, the change to industrial structure should be completed within the shortest possible time. Thus, the shorter the time in the bending stage of disequilibrium, the better. Private equity is a direct financial instrument that can serve as an important stimulus for early growth to a new equilibrium [8]. This process can be summarized as follows: PE investment makes up for the difference between the benefits of technological progress and the costs of restructuring, which accelerates the flow of factors to more productive sectors, shortens the disequilibrium cycle of the bending stage, and drives the upgrades of the industrial structure. Based on the above analysis, the following research hypothesis can be derived:
H1.
Private equity funds drive industrial upgrades by accelerating factor mobility.
However, the above analysis only suggests that PE funds accelerate the flow of factors to more productive sectors and thus drive industrial upgrades, which is based on the research hypothesis that technological progress leads to productivity gains. However, a further research scenario is also possible: the increase in production efficiency is induced by not only technological innovation but also PE investment itself [5]. Although industrial restructuring is caused by technological innovation within different industries, the structural dividend of industrial upgrades is determined by the overall technological structure of the economy: only the effective convergence of technological innovation among industries and the optimization of the overall technological structure of the economy can effectively drive economic growth. However, PE, with its commercial interests, can effectively combine technological innovation and economic activities between different industries, and this technology–industry interface can bring about productivity improvements and drive industrial structure upgrades. Based on the above analysis, the other research hypothesis can be derived as follows:
H2.
Private equity funds drive industrial upgrades by improving industrial productivity.
3. Methodology
3.1. Variable Setting and Model Design for the Benchmark Test
This study mainly analyzes the mechanism of the role of private equity on industrial upgrades, so the core independent variable of this paper should be the measurable variable of PE funds, and the core dependent variable should serve as a proxy variable for industrial upgrades. In the following study, Section 3.1.1 presents the industrial structure conversion coefficient based on the perspective of total economic growth and uses it as a proxy variable for industrial upgrades. Section 3.1.2 separates PE funds from total financial investment as the core independent variable. Section 3.1.3 creates a new proxy variable for industrial upgrades from the perspective of efficiency improvement based on the variables in Section 3.1.1, and establishes the underlying empirical test model.
3.1.1. Variable Setting of Industrial Upgrades
Industrial upgrades are represented as economic growth driven by the flow of production factors in the process of industrial structural change: there is heterogeneity in productivity growth and the degree of demand expansion in different industries, i.e., resources, cannot be efficiently allocated among industries in the long run. When the industrial structure is upgraded to match the change in demand and the increase in the efficiency of technology utilization, input factors such as labor and capital can flow to sectors with higher productivity or productivity growth rates, and the overall economic growth rate will increase. Therefore, factor flows between industrial sectors with different rates of economic growth have been chosen as the main variables of industrial upgrades. Earlier studies used the share of nonagricultural output as a measure of industrial structure upgrades, which is a good description of the important economic pattern of the development of more efficient nonagricultural industries [1]. Based on the continuous confirmation that the productivity of tertiary industry is higher than that of secondary industry, subsequent studies chose the output ratio of tertiary industry to secondary industry as the proxy variable of industrial structure upgrades [13].
However, this structural coefficient of the industrial hierarchy, which is in line with the service orientation of the industry, is based on the hypothesis that the productivity of the tertiary industry is higher than that of the secondary industry. However, in the context of the rapid development of data technology, new industries with higher productivity have emerged, such as industrial internet, internet of things, and high-end equipment manufacturing, which makes it possible to significantly underestimate the contribution of innovative manufacturing to economic growth when using only the output ratio of industrial sectors as a proxy for industrial structure upgrades.
Therefore, the Moore structure coefficient using the spatial vector measurement method has been commonly chosen in subsequent studies of industrial upgrades, which takes into account the logic of industrial change, such as the tendencies toward deagriculturalization and tertiary industries, and is able to avoid the overestimation bias of industrial structure change [14]. This method will also be chosen to measure industrial structure upgrades in this study, and is expressed in Equation (1):
where STRt is the industrial structure conversion degree as a proxy variable for industrial upgrades, and GDPi,t is the output of industry i in period t. As the industrial structure conversion rate increases, the STR value increases, which is an indication of the effect of upgrading industrial structure.
3.1.2. Variable Setting of Private Equity
Existing studies have shown that the growth of total social financing can significantly contribute to the growth of the economic structure. However, the upgrade of industrial structure is not only expressed in economic growth but also needs to achieve efficiency improvement in the process of economic growth [15]. Different financial investment instruments introduce significant heterogeneity in efficiency improvement during economic growth. Studies have shown that indirect financing such as bank credit inhibits efficiency gains to some extent, but direct financial instruments such as private equity are more significant drivers of efficient innovation output [5]. Therefore, the model in this study includes PE funds and other financial instruments in a unified research framework, and private equity funds (denoted as PE) and total social financing (denoted as FIN) are jointly used as the core explanatory variables in the model.
3.1.3. Model Design and Variable Optimization
The influencing factors of industrial structure upgrades are complex and multifaceted. To study the degree of influence of private equity on industrial upgrades, a benchmark regression model should first be constructed based on controlling variables such as fiscal scale, consumption level, and investment quantity, as shown in Equation (2).
In Equation (2), STR is the industrial structure transformation rate and PE and FIN denote the investment scale of private equity funds and total social financing, respectively. β1 and β2 are the parameters to be estimated for the core variables. In addition, Controls is the control variable, and Π is its coefficient matrix to be estimated; εit is a random disturbance term that obeys the same distribution without serial correlation; αi is a vector of regional fixed effects, reflecting the individual heterogeneity of cross-sectional data in different provinces; and the vector γt represents the time effect, showing the time trend characteristics for each cross-sectional individual.
In Equation (2), the dependent variable STR, which is similar to Moore’s structural transformation coefficient, only uses the difference in the volume of industrial structural output as a proxy variable for industrial upgrades. However, such an increase in total economic output can hardly reflect the efficiency optimization in industrial upgrades. When China’s economy is moving from high growth to high quality development, the trajectory of economic development is gradually moving from aggregate upgrades to efficiency optimization, so this paper needs to further analyze the extent to which PE funds drive factor production efficiency upgrades.
The factor productivity change brought by industrial upgrades can be expressed as the difference between factor flow and economic output, i.e., when the economic growth brought by industrial upgrades is greater than the impact of the disruption to factor distribution, indicating that there is a production efficiency increase in the structural flow of production factors. Therefore, the degree of coupling between the structure of economic output and the structure of factor flows can be used as a measurable variable of the increase in productivity due to industrial upgrades, expressed as Equation (3):
where GDP and FAC denote economic output and production factors (e.g., capital and labor), respectively, so GDPi,t/GDPt denotes the degree of contribution of industry i to total economic output in period t, while FACi,t/FACt denotes the degree of factor mobility in industry i to the total flow of production factors in period t. When E = 0, it indicates that the economic structure is in equilibrium and the flow of factors between industrial sectors does not bring about productivity changes, while a larger value of E indicates that the change in industrial structure brings about a greater change in factor productivity. In addition, Equation (3) can be re-expressed as Equation (4)
GDP/FAC in Equation (4) is the factor productivity, and the weight of the factor productivity contribution of industry sector i in period t is denoted using as Wi,t and is brought into the model of the core research variable STRi,t to construct the Moore structural coefficient based on production efficiency (denoted as EFF), expressed as Equation (5):
Therefore, EFF is used as a proxy variable for industrial upgrades from the perspective of efficiency improvement, and the benchmark test model is again constructed together with private equity (PE) and total financial investment size (FIN), expressed as Equation (6).
In Equation (6), the dependent variable STR in Model I describes industrial structure upgrades based on the perspective of total economic output growth, while the EFF in Model II indicates industrial upgrades from the perspective of production efficiency improvement.
3.2. Intermediary Effects Model Design and Variable Setting
This section focuses on factorizing the industrial upgrade proxy variables from the source perspective of industrial upgrades and establishing the intermediary effects model with the complete industrial upgrade variables and the decomposed subvariables.
Economic growth resulting from efficiency gains is denoted as industrial upgrades, and this economic growth may come from both efficiency gains within the industrial sector and from the flow of production factors from inefficient to efficient sectors. Therefore, it needs to be further analyzed whether the driving impact of private equity on industrial upgrades is mainly due to efficiency gains, mainly due to factor flows, or both the synergistic effect of efficiency improvement and factor mobility.
Based on this, it is necessary to first factorize and disentangle the industrial upgrade variable EFF from the production efficiency perspective. In the EFF variable of Equation (5), if (Wi,t+1 − Wi,t+1) is denoted by Δg, the EFF can be re-expressed in Equation (7) as
In Equation (7), Δg is expressed as the growth rate of factor productivity, and this productivity growth may be brought about by factor mobility as well as efficiency optimization within the industrial structure. The decomposition of Δg by the shift-share method can be expressed as Equation (8):
where Gi,t = GDPi,t/FACi,t denotes the factor productivity of industry i in period t, and Si,t = FACi,t/FACt denotes the share of the factor of production of industry i in the overall economy for that factor of production. In Equation (8), the split-like term (Gi,t+1 × Si,t+1 − Gi,t × Si,t) = Gi,t × (Si,t+1 − Si,t) + (Gi,t+1 − Gi,t) × (Si,t+1 − Si,t) + (Gi,t+1 − Gi,t) × Si,t can be abbreviated as (G × ΔS + ΔG × ΔS + ΔG × S), which is substituted into Equation (8), expressed as Equation (9):
The three functional equations in the numerator of Equation (9) can represent the three main sources of factor efficiency gains. The first term reflects the increase in factor efficiency brought about by factor mobility, which is caused by the transfer of factors from sectors with lower production efficiency to sectors with higher production efficiency. This increase presupposes that the overall efficiency level remains unchanged, so the growth effect can be called the static transfer effect. The second term reflects the superposition effect of the efficiency improvement brought by the factor flow and the production efficiency improvement of the whole economy: the growth effect brought by the redistribution of the factor flow, which is the comprehensive effect of the industrial upgrades and the production efficiency change of the whole economy, so it can be called the dynamic transfer effect. The third term is the production efficiency improvement when the production factors are not mobile, such as the increase in labor productivity after the substitution of high-skilled labor for low-skilled labor, which is not a growth effect brought by upgrades to industrial structure, so it can be called the internal growth effect. Based on this, the three functional equations of Equation (9) can be described as follows: factor efficiency improvement is expressed as the combined result of thestructural transfer effect, divisible into the static transfer effect, dynamic transfer effect, brought by industrial upgrades, and the internal growth effect brought by non-industrial upgrades.
Therefore, based on the relationship between PEi,t (private equity) and EFFi,t (industrial upgrades based on efficiency improvement), Equation (9)’s first functional equation (i.e., static transfer effect, denoted as STEi,t) and the second functional equation (i.e., dynamic transfer effect, denoted as DTEi,t) are included as key dependent variables in the analytical framework.
To further investigate the mechanism of the effect of PE funds on industrial upgrades and analyze whether it is achieved mainly by promoting factor mobility or mainly by driving efficiency gains, it is necessary to include EFF with STE and DTE in a unified research framework to construct a mediating effect model, expressed as Equation (10).
In the above mediating effect model, Function I indicates the total effect of the core explanatory variables on industrial upgrades. The total effect of private equity investment and total social financing on industrial upgrades will be indicated when the parameters β1 and β2 are significant. Function II and Function III reflect the degree of influence of private equity (PE) and total social financing (FIN) on the static transfer effect (STE) and dynamic transfer effect (DTE), respectively. In Function IV, η3 and η4 indicate the influence of STE and DTE, respectively, on industrial upgrades after controlling for the influence of the core explanatory variables.
Function II is brought into Function IV to obtain the mediating effect parameters α1η3 and α2η3, which indicate the influence of PE and FIN, respectively, on industrial upgrades through STE, and Function III is brought into Function IV to obtain the mediating effect parameters γ1η4 and γ2η4, which indicate the influence of PE and FIN on industrial upgrades through DTE. These four parameters are key for determining the mediating effects between the core research variables.
4. Empirical Tests
The technical route of the empirical test section is as follows: in Section 4.1, the variables and data for the empirical test are identified. In Section 4.2, benchmark tests are first conducted using different proxy variables for industrial upgrades, and the mechanism of industrial upgrades driven by PE funds is tested empirically through the intermediary effects model. In Section 4.3, robustness tests are also conducted by using instrumental variables and interaction terms.
4.1. Variables and Data
(1) Dependent Variable. This model aims to study the degree and the mechanism of the influence of private equity on industrial upgrades, which will be taken as the dependent variable. Based on the above analysis, it can be seen that first, the industrial structure transformation rate (denoted as STR) is selected as the proxy variable for industrial upgrades, using total output growth in the empirical test model, which is calculated by selecting the gross domestic product (GDP) of the sample interval for the Moore spatial structure coefficient. Next, the dependent variable is replaced by the Moore structural coefficient based on production efficiency (denoted as EFF), which is used as the proxy variable of industrial structure upgrades. In the empirical test, the unit labor productivity during the sample period is used to express EFF. According to the deviation shift-share analysis, economic efficiency is decomposed into economic growth due to factor mobility (static transfer effect) and economic growth due to the superposition of factor mobility and efficiency improvement (dynamic transfer effect); therefore, in the subsequent test model, the static transfer effect (STE) and the dynamic transfer effect (DTE) are used as the dependent variables of the model. Since this model already includes financial investment as a capital factor in the explanatory variables, the number of employed persons is chosen as the measurement variable of the labor component of the production factors in STE and DTE.
(2) Core independent variable I is private equity funds (denoted as PE). In existing studies, the metric variables of private equity can usually be chosen as the amount of investment, the number of investment targets, and the number of investment strokes [16], where the reason for the difference in the number of investment targets and investment strokes is that multiple funds may invest in the same target, or the same fund may invest in the same target multiple times. However, the study in this paper takes the investment size of private equity as a holistic arrangement, so the structural equilibrium quality within the fund does not affect the conclusion of this study. Based on the need to simplify the empirical analysis of the model, this paper will select only the investment amount as a proxy variable for private equity funds.
(3) Core independent variable II is total social financing (denoted as FIN). This model needs to verify whether it is the PE with equity-based investment attributes itself that brings about industrial upgrades or the growth of total financial investment in the overall economy that brings about industrial upgrades, so it is also necessary to introduce total financial investment as a control variable in the research model. In this paper, total social financing (denoted as FIN) is chosen as a proxy variable for total financial investment.
(4) Control variables. Studies have shown that industrial upgrades are significantly correlated with regional consumption level, investment structure, and population size [17]; therefore, in this study, resident consumption level (denoted as CON), general fiscal budget expenditure (denoted as EXP), total social fixed asset investment (denoted as INVEST), and the resident population (denoted as POP) are added as control variables to the regression model. The resident consumption level (CON) usually can be explained either as consumption amount or as consumption index (above year = 100), but the core explanatory variable in this paper is set to investment amount, so to maintain the consistency of variable setting, the total amount of resident consumption is also chosen for CON.
The sample data of the dependent variables in the above study are based on the WIND database. The sample data of the core explanatory variables, such as private equity and total social financing, are obtained from the databases of the People’s Bank of China and the China Securities Regulatory Commission, and the sample data of the control variables are obtained from the National Bureau of Statistics of China. To reduce the impact of heteroskedasticity on the estimation results in the empirical tests, the explanatory variables are transformed to natural logarithms, and individual outliers are eliminated by applying winsorization. Table 1 shows the results of the descriptive statistics of the variables.
4.2. Results and Analysis of Empirical Tests
4.2.1. Regression Results and Analysis of the Benchmark Test
The benchmark test model analyzes the degree of influence of private equity funds (PE) and total social financing (FIN) on industrial upgrades. In Model I of the benchmark test, the industrial structure transforming rate (STR), understood as economic aggregation, is selected as the proxy variable for industrial upgrades, while the industrial efficiency conversion rate (EFF), understood as economic efficiency, is selected as the proxy variable for industrial upgrades in Model II. In this paper, we select the panel data of Chinese cities from 2004–2019 as the sample data and apply both the LLS and HT methods to perform unit root tests on the data of all variables, which show that the data are stationary.
Existing studies have shown that STR and EFF as the dependent variables and PE as the independent variable have an interactive mechanism of action, and therefore, the baseline regression is endogenously biased. Drawing on Arellano and Bond’s classical approach [18], the first-order lagged term and second-order lagged term of the core explanatory variables are added to the regression model as instrumental variables, and Hansen’s J test also indicates that the instrumental variables are valid.
The regression results of the benchmark test are presented in Table 2, where column (1) of Model I indicates the degree of influence of the core explanatory variables on the industrial structure transformation rate STR on a national sample basis. The results show that PE is positively significant for STR, indicating that equity investment funds have a driving effect on industrial structure upgrades. However, the coefficient of FIN issignificantly negative, indicating that an increase in total social financing is not conducive to an increase in the industrial structure transformation rate. Although studies have shown that financial investment promotes industrial structure upgrades [1], some studies in the literature have also shown that credit financing not only hinders innovation development and thus reduces factor productivity, but also results in labor force solidification, which hinders the flow of factors [8]. Therefore, when the share of credit financing in total social financing is too high, it will also impede upgrades to the industrial structure. This is also verified in the test results of Model II: when the explanatory variable of Model II is the EFF, the coefficients of PE and FIN are the same as those when STR is the dependent variable in Model I. This indicates that private equity not only significantly drives the growth of economic aggregates in the process of industrial upgrading but also significantly improves the production efficiency of economic factors, showing that private equity funds have driving value for industrial upgrades from the dual perspectives of total economic output growth and production efficiency improvement. However, the negative coefficient of FIN also indicates that the growth of total social financing will not improve factor efficiency and will even inhibit the improvement of efficiency to a certain extent. These findings differ from the existing literature. It has been argued that PE funds promote efficiency rather than economic growth [8], but that an increase in total social finance has a significant contribution to economic growth [5]. However, this paper concludes that PE funds have a significant positive effect on both economic growth and efficiency improvement, while the growth of total social financing has a negative effect on efficiency gains.
The regression test results for different regional (eastern, central, and western) groupings are reported in columns (2), (3), and (4) of Table 2, respectively. There are significant differences in industrial structure, economic growth rate, and financial investment between the eastern and western regions of China, so the analysis of the model findings is better facilitated by sub-regional testing of the sample data. Due to the small amount of sample data in the central provinces, the explanatory power of the model is weak, and the effect of private equity on industrial upgrades is not significant. The results of the test in the eastern and western provinces show that private equity (PE) is a significant driver of industrial structure upgrades (STR), and the regression analysis of the eastern regions has relatively stronger explanatory power. Both the partition test results of Model I and Model II indicate that private equity funds have a driving value for industrial upgrades.
4.2.2. Empirical Results and Analysis of Mediating Effects Test
In the mediating effect model, the degree of influence between private equity funds (PE) and industrial upgrades (EFF) is first tested empirically, and the results are indicated in Function I of Table 3. In Function II and Function III, based on the deviation shift-share analysis method, the variable for industrial upgrades (EFF) is split into the static transfer effect (STE) and dynamic transfer effect (DTE), which are used as dependent variables in the regression analysis. The lagged terms of the core explanatory variables continue to be used as instrumental variables in the test model, and Hansen’s J test of the regression model shows that the instrumental variables are valid.
The dependent variable STE in Function II indicates the static transfer effect, which means the economic growth brought about by labor factor mobility with constant production efficiency between industrial sectors can be understood as the structural upgrading of labor by moving it from less efficient sectors to more efficient ones. This static transfer effect is a kind of test variable to identify the efficiency improvement brought by factor flow allocation after controlling for the production efficiency among industrial sectors. The results of Function II show that both PE and FIN are significantly positive for STE, indicating that both private equity funds and total social finance have positive static transfer effects on industrial upgrades, i.e., the development of financial investment drives the flow of labor factors from inefficient sectors to more efficient sectors.
In Function III of Table 3, the dependent variable is the dynamic transfer effect (DTE), which represents the superposition effect of factor flow and efficiency improvement, meaning that economic factors flow from sectors with lower production efficiency growth rates to sectors with higher growth rates. The relationship between the static transfer effect (STE) and dynamic transfer effect (DTE) can be compared simply to the relationship between "speed" and "acceleration". Compared with STE, which tests the efficiency output by measuring production factors, DTE expresses the anchoring of production factors to the trend of efficiency improvement, which results more from the effective convergence of technological innovation between industries [19]. The positive significance of PE on DTE in the test results of Function III is consistent with the findings of existing studies: the development of private equity funds drives technological progress and innovation output. The combination of Functions II and III suggests that private equity not only drives labor to more efficient sectors but also prospectively makes new industries with higher efficiency growth rates attractive to labor factors. However, the results of Function III show that total social financing (FIN) has a negative significance on the dynamic transfer effect (DTE), while the significance of FIN on STE in Function II is positive. This suggests that total social financing with a high share of credit financing drives the flow of factors of production to more efficient sectors, resulting in higher economic output (the findings of Function II), but the less efficient but faster-growing and trending technology and innovation industries are less likely to be supported by the bank credit system, which may even, to a certain extent, create a disincentive to innovate (the findings of Function III).This finding confirms what has been found in the literature: the empirical analysis of panel data from 36 countries had also showed that a boom in indirect financing, such as bank credit, had a certain damping effect on industry innovation [5].
Function IV in Table 3 indicates the test findings of the mediating effect. Functions II and III are brought into Function IV to form the coefficients of the mediating effect, which are presented in the bottom row of Table 3. The Sobel test is first performed on the mediating effect model [20], and its p value is less than 0.05, indicating that the mediating effect is significant at the 95% level. However, since the Sobel test requires a high normal distribution of the interaction coefficients, it is usually applied to data models with large sample sizes. Since the sample in this paper belongs to typical short panel data, the bootstrap test is used again to determine whether the mediation effect is valid to avoid the significance bias of the Sobel test. The test results show that the confidence interval of BS-2 does not contain 0, which again confirms the significance of the mediating effect model. The mediating effect parameters in the bottom row of Table 3 show that the mediating effect coefficients of FIN to EFF are relatively balanced between the mediating effect of STE and DTE; however, DTE accounts for 89% of the mediating effect model of PE to EFF, indicating that private equity funds mainly drive industrial upgrades by promoting the growth of production efficiency. These findings verify the hypothesis (H2: Private equity funds drive industrial upgrades by improving industrial productivity) whichwas presented in Section 2 of this paper, but do not provide significant proof for hypothesis H1, although it is not rejected.
4.3. Robustness Tests
There are two issues that need to be addressed in the robustness test section: the first one is that PE funds are endogenous variables of total financial investment, so the effects of these two variables need to be further separated; the second issue that needs to be addressed is the omitted variable problem in the test model.
For the first issue, instrumental variables of the core independent variables can be used in the robustness test. The objective of this paper is not only to analyze the extent and mechanism of the impact of private equity on industrial structure upgrades but also to distinguish whether private equity itself drives industrial upgrades or whether PE funds bring about an increase in total financial investment and thus affect industrial upgrades. Consequently, both private equity and overall financial investment need to be included in the test model. Based on this, the core explanatory variables in the benchmark test model and the mediating effect model are selected as private equity funds (PE) and total social financing (FIN) to test the degree of influence of financial investment and its different structural instruments on industrial upgrades.
However, to distinguish private equity from other financial instruments, it is also possible to construct a private equity quota (PEQ) as the core explanatory variable, denoted as
where PEQit > 1 indicates that region i has a higher share of private equity funds in total social financing than the national average in period t, reflecting the aggregation of private equity funds to the region. This variable can remove the interference of total social financing (FIN) on the target results of the study and can accurately measure the extent of the role of private equity funds.
The results of the robustness tests using replacement variables are shown in Table 4. Even though the relatively low R-squared indicates a weak explanatory power for the model, the sign and significance of the core explanatory variables remain consistent with the results of the benchmark test and the mediating effects test. The bootstrap test for the mediating effects model using PEQ as the core explanatory variable remains significant, and the mediating effects coefficient is also above 80% of the total effect, which is also consistent with the findings of the original test model.
In addition, another concern about the validity of the model findings lies in the omission of variables. In this model, more variables reflecting the characteristics of regional factor endowments are introduced as much as possible according to the existing research literature, but it is still necessary to control the interaction term between private equity and regional characteristics as much as possible in the robustness test, i.e., to introduce the interaction term between private equity funds (PE or PEQ) and regional control variables in the regression model (Controls). Regardless of whether lnPE or PEQ is used, the key parameters of the robustness test remain significant, and their signs are consistent with the original test model, whether one interaction term is added alone or the interaction terms of all four control variables are added simultaneously. Therefore, all the above test conclusions prove that the regression model in this paper satisfies the robustness condition.
5. Conclusions
The analysis of the impact of the heterogeneity of financial instruments on industrial upgrades has always been the focus of theoretical research. This paper focuses on the degree of influence and mechanism of the role of private equity funds, a micro instrument among direct financing instruments, on industrial upgrades, and draws the following conclusions after empirical tests using 16 annual regional panel data sets in China.
(1) Under the dual perspective of economic growth and production efficiency improvement, the driving force of private equity funds for industrial upgrades is significantly positive. The results of the empirical test that disassembled industrial upgrades by the deviation shift-share method show that private equity funds have both positive static and dynamic transfer effects on industrial structure upgrades, indicating that equity investment can promote the flow of economic factors to industrial sectors with either higher productivity or faster productivity growth (or both), which can be interpreted as private equity funds enhancing both the "speed" and "acceleration" of industrial upgrades. It suggests that private equity has a significant driving effect on the sustainability of regional economic development.
(2) The intermediary effect model shows that the influence of private equity funds on industrial upgrades is accomplished through the intermediary path of static and dynamic transfer, in which the dynamic transfer effect accounts for a very high proportion of the total effect, indicating that the way private equity funds stimulate industrial upgrades mainly from efficiency improvement based on technological progress and innovation output, and to a lesser extent from the promotion of factor mobility. This analysis of the mechanism and path of PE funds driven industrial upgrades is an important supplement to the existing theories.
(3) There is heterogeneity in the impact path of overall financial investment on industrial upgrades. Although the increase in total social financing will drive the flow of economic factors to more efficient industrial sectors and thus bring about the growth of economic output, the current total amount of social financing includes a very high proportion of bank credit, and this indirect financing instrument does not bring about innovative output and even disincentivizes economic efficiency. If the current total financial investment is simply increased, without increasing the proportion of equity financing in the financial structure, it would not be a positive driver for industrial upgrades.
The main limitation of this research is that PE funds are assumed to be homogeneous, but in reality, PE funds differ greatly in various aspects such as investment strategies, fields of application, and external environment [21]. Therefore, the mechanism of the role of PE funds for industrial upgrading will be further investigated in the subsequent study based on the heterogeneity perspective.
Author Contributions
Conceptualization, L.Z. and F.D.; methodology, L.Z.; software, L.Z. and L.H.; validation, L.Z. and F.D.; formal analysis, F.D.; resources, F.D. and L.H.; data curation, L.Z. and F.D.; writing—original draft preparation, L.Z.; writing—review and editing, L.Z., F.D., and L.H.; funding acquisition, F.D. All authors have read and agreed to the published version of the manuscript.
Funding
This research was funded by BNU SOCIAL FUND, grant number SKHX2020456.
Institutional Review Board Statement
Not applicable.
Informed Consent Statement
Not applicable.
Data Availability Statement
The data that support the findings of this study are available in China’s National Bureau of Statistics at http://www.stats.gov.cn.
Conflicts of Interest
The authors declare no conflict of interest. The funders had no role in the design of the study; in the collection, analyses, or interpretation of data; in the writing of the manuscript; or in the decision to publish the results.
References
- McKinnon, R.I. Money and Capital in Economic Development; The Brookings Institution: Washington, DC, USA, 1973; p. 184. [Google Scholar]
- Pasinetti, L.L. Structural Change and Economic Growth: A Theoretical Essay on the Dynamics of the Wealth of Nations; Cambridge University Press: New York, NY, USA, 1983. [Google Scholar] [CrossRef]
- Hirsch-Kreinsen, H. Financial Market and Technological Innovation. Ind. Innov. 2011, 18, 351–368. [Google Scholar] [CrossRef]
- Brown, J.R.; Martinsson, G.; Petersen, B.C. Do financing constraints matter for R&D? Eur. Econ. Rev. 2012, 56, 1512–1529. [Google Scholar] [CrossRef] [Green Version]
- Hsu, P.-H.; Tian, X.; Xu, Y. Financial development and innovation: Cross-country evidence. J. Financ. Econ. 2014, 112, 116–135. [Google Scholar] [CrossRef] [Green Version]
- Xiao, W.; Pan, J.-D.; Liu, L.-Y.; Wen, X.; Jia-Dong, P.; Li-Yun, L. China’s industrial structure upgrade in the “New Normal”: Empirical test and determinants. Singap. Econ. Rev. 2018, 63, 1037–1058. [Google Scholar] [CrossRef] [Green Version]
- Aybar-Arias, C.; Casino-Martínez, A.; López-Gracia, J. On the adjustment speed of SMEs to their optimal capital structure. Small Bus. Econ. 2012, 39, 977–996. [Google Scholar] [CrossRef]
- Levine, R.; Zervos, S. Stock Markets, Banks, and Economic Growth. Am. Econ. Rev. 1998, 88, 537–558. [Google Scholar] [CrossRef] [Green Version]
- Fan, J.-J.; Xu, R.; Su, C.W.; Shi, Q.-H. Demand-following or supply-leading? Trade openness and financial development in China. J. Int. Trade Econ. Dev. 2018, 27, 314–332. [Google Scholar] [CrossRef]
- Zhang, D.; Ma, X.; Zhang, J.; Deng, Q. Can Consumption Drive Industrial Upgrades? Evidence from Chinese Household and Firm Matching Data. Emerg. Mark. Financ. Trade 2020, 56, 409–426. [Google Scholar] [CrossRef]
- Ma, H.; Hao, D. Economic policy uncertainty, financial development, and financial constraints: Evidence from China. Int. Rev. Econ. Financ. 2022, 79, 368–386. [Google Scholar] [CrossRef]
- Carvajalino, J. Unlocking the Mystery of the Origins of John von Neumann’s Growth Model. Hist. Political Econ. 2021, 53, 595–631. [Google Scholar] [CrossRef]
- Zhou, Q.; Li, Z. The impact of industrial structure upgrades on the urban–rural income gap: An empirical study based on China’s provincial panel data. Growth Chang. 2021, 52, 1761–1782. [Google Scholar] [CrossRef]
- Moore, J.H. A measure of structural change in output. Rev. Income Wealth 1978, 24, 105–118. [Google Scholar] [CrossRef]
- Wang, D.; Ren, C.; Zhou, T. Understanding the impact of land finance on industrial structure change in China: Insights from a spatial econometric analysis. Land Use Policy 2021, 103, 105323. [Google Scholar] [CrossRef]
- Lerner, J.; Sorensen, M.; Strömberg, P. Private Equity and Long-Run Investment: The Case of Innovation. J. Financ. 2011, 66, 445–477. [Google Scholar] [CrossRef]
- Zhang, C.; Zhu, Y. The interest group theory of financial development in China: Openness and the role of interest groups. World Econ. 2020, 43, 982–999. [Google Scholar] [CrossRef]
- Arellano, M.; Bond, S. Some Tests of Specification for Panel Data: Monte Carlo Evidence and an Application to Employment Equations. Rev. Econ. Stud. 1991, 58, 277–297. [Google Scholar] [CrossRef] [Green Version]
- Liao, H.; Yang, L.; Ma, H.; Zheng, J. Technology import, secondary innovation, and industrial structure optimization: A potential innovation strategy for China. Pac. Econ. Rev. 2020, 25, 145–160. [Google Scholar] [CrossRef]
- Duda, R.O.; Hart, P.E.; Stork, D.G. Pattern Classification and Scene Analysis; Wiley: New York, NY, USA, 1973; Volume 3, pp. 731–739. [Google Scholar] [CrossRef]
- Gompers, P.A.; Gornall, W.; Kaplan, S.N.; Strebulaev, I.A. How do venture capitalists make decisions? J. Financ. Econ. 2019, 135, 169–190. [Google Scholar] [CrossRef]
Figure 1.
Neumann’s theorem: economic structural optimization expressed as a non-equilibrium stage in growth.
Figure 1.
Neumann’s theorem: economic structural optimization expressed as a non-equilibrium stage in growth.


Table 1.
Description of variables and descriptive statistical analysis.
| Variables | Meaning | Minimal | Maximum | Average | St. De. |
|---|---|---|---|---|---|
| GDP | Economic growth (unit: billion RMB) | 20.01 | 8970.52 | 1467.92 | 1508.84 |
| FAC | Number of employed (unit: ten thousand) | 111.27 | 8437.54 | 2866.24 | 2134.12 |
| PE | Investment of private equity (unit: 100 million) | 0.00 | 1907.31 | 149.74 | 169.21 |
| FIN | Total social financing (unit: 100 million RMB) | 3.27 | 6653.79 | 1378.13 | 1360.14 |
| STR | Industrial structure transformation rate | 0.70 | 33.66 | 3.89 | 6.99 |
| EFF | Factor efficiency structure conversion rate | 1.44 | 31.04 | 3.93 | 7.08 |
| STE | Static transfer effect | 1.08 | 3.19 | 1.76 | 0.55 |
| DTE | Dynamic transfer effect | 2.25 | 34.75 | 4.62 | 5.72 |
| CON | Per capita consumption amount (unit: 1 RMB) | 2301 | 49617 | 10,902.02 | 7951.25 |
| EXP | General budget expenditure (unit: 100 million) | 105.54 | 150,800.78 | 2680.37 | 2307.07 |
| INVEST | Investment in fixed assets(unit: 100 million RMB) | 106.58 | 53,322.94 | 8459.14 | 9068.54 |
| POP | Number of permanent residents(unit: ten thousand) | 270 | 12141 | 4311.19 | 2759.42 |
Table 2.
Regression results of the benchmark test.
| Model | Model I | Model II | ||||||
|---|---|---|---|---|---|---|---|---|
| Variables | (1) STR | (2) EAST-STR | (3) MID-STR | (4) WEST-STR | (1) EFF | (2) EAST-EFF | (3) MID-STR | (4) WEST-STR |
| lnVC | 0.508 * (0.285) | 0.174 ** (0.15) | 0.0624 (0.05) | 0.907 * (0.420) | 0.504 ** (0.286) | 0.413 ** (0.17) | 0.0431 * (0.07) | 0.912 * (0.436) |
| lnFIN | −1.735 * (0.829) | −0.324 *** (0.062) | −0.302 (0.067) | −3.548 *** (1.047) | −1.596 * (0.773) | −0.389 ** (0.050) | −0.219 (0.059) | −4.237 ** (1.104) |
| lnCON | 1.663 * (1.438) | 0.621 * (0.046) | −0.107 (0.059) | 5.421 (4.206) | 2.010 (1.819) | −0.223 ** (0.087) | −0.302 * (0.063) | 6.371 (4.119) |
| lnEXP | −1.703 (1.070) | −0.291 * (0.136) | 0.0459 (0.096) | −0.340 (1.168) | −1.285 * (0.896) | −0.101 (0.123) | 0.0394 (0.093) | −0.410 * (1.629) |
| lnINVEST | 0.258 * (0.652) | 0.196 (0.119) | 0.0392 * (0.077) | −3.107 (2.821) | −0.205 (0.822) | 0.195 (0.130) | 0.0455 * (0.051) | −3.772 (2.980) |
| lnPOP | −1.138 (2.427) | 0.617 ** (0.246) | 0.229 * (0.208) | −20.98 (12.496) | −1.622 * (3.570) | 0.722 ** (0.246) | 0.357 (0.231) | −21.03 (13.029) |
| CONS | 33.63 (26.43) | −0.192 (1.011) | −0.0205 (1.675) | 169.7 (95.506) | 30.71 * (32.510) | −1.222 (0.981) | −0.0336 (1.776) | 172.3 (96.005) |
| R-square | 0.6470 | 0.6528 | 0.1989 | 0.3906 | 0.6190 | 0.6487 | 0.1588 | 0.3737 |
Note: *** indicates significance at the 1% level, ** indicates significance at the 5% level, and * indicates significance at the 10% level. Standard errors are indicated in parentheses.
Table 3.
Empirical test results of the intermediate effect model.
| Function Variables | Function I EFF | Function II STE | Function III DTE | Function IV EFF |
|---|---|---|---|---|
| lnVC | 0.504 ** (0.286) | 0.0651 *** (0.017) | 0.600 * (0.308) | 0.0260 ** (0.010) |
| lnFIN | −1.596 * (0.773) | 0.313 ** (0.039) | −1.694 ** (0.786) | 0.0367 (0.035) |
| STE | 0.573 *** (0.031) | |||
| DTE | 0.755 *** (0.018) | |||
| lnCON | 2.010 (1.819) | −0.0815 * (0.084) | 1.507 * (1.576) | −0.00490 (0.122) |
| lnEXP | −1.285 * (0.896) | 0.0883 (0.081) | −1.263 (0.863) | 0.144 (0.137) |
| lnINVEST | −0.205 (0.822) | −0.0375 * (0.052) | 0.022 (0.714) | −0.0910 (0.095) |
| lnPOP | −1.622 * (3.570) | 0.143 (0.160) | −2.772 * (4.212) | 0.0143 (0.353) |
| CONS | 30.71 * (32.510) | 0.523 (1.165) | 43.29 * (38.146) | 54.03 ** (24.618) |
| R-square | 0.6190 | 0.7749 | 0.6392 | 0.6482 |
| Mediating Effect | VC-STE 0.0373 | VC-DTE 0.453 | FIN-STE 0.179 | FIN-DTE −1.279 |
Note: *** indicates significance at the 1% level, ** indicates significance at the 5% level, and * indicates significance at the 10% level. Standard errors are indicated in parentheses.
Table 4.
Results of robustness tests.
| Variables | STR | EFF | STE | DTE | EFF |
|---|---|---|---|---|---|
| VCQ | 0.193 *** (0.052) | 0.210 ** (0.030) | 0.0980 * (0.049) | 0.196 *** (0.038) | 0.0343 ** (0.001) |
| STE | 0.567 ** (0.036) | ||||
| DTE | 1.154 *** (0.014) | ||||
| lnCON | −0.621 (1.170) | 0.776 * (1.127) | −0.659 (0.626) | −0.753 * (1.146) | −0.0733 * (0.126) |
| lnEXP | 0.484 * (1.795) | 1.063 (2.019) | 0.182 * (0.534) | 1.020 ** (2.020) | 0.198 (0.156) |
| lnINVEST | −0.282 (1.625) | −0.474 (1.696) | 0.201 * (0.413) | −0.494 (1.711) | −0.101 (0.103) |
| lnPOP | −2.264 (6.247) | −3.966 (7.223) | −0.429 * (1.160) | −3.730 (6.845) | 0.0118 * (0.367) |
| CONS | 22.00 (35.442) | 29.03 (41.277) | 6.430 (7.483) | 28.49 * (38.399) | 59.43 *** (20.466) |
| R-square | 0.1965 | 0.1035 | 0.1652 | 0.1988 | 0.2989 |
Note: *** indicates significance at the 1% level, ** indicates significance at the 5% level, and * indicates significance at the 10% level. Standard errors are indicated in parentheses.
Disclaimer/Publisher’s Note: The statements, opinions and data contained in all publications are solely those of the individual author(s) and contributor(s) and not of MDPI and/or the editor(s). MDPI and/or the editor(s) disclaim responsibility for any injury to people or property resulting from any ideas, methods, instructions or products referred to in the content. |
© 2023 by the authors. Licensee MDPI, Basel, Switzerland. This article is an open access article distributed under the terms and conditions of the Creative Commons Attribution (CC BY) license (https://creativecommons.org/licenses/by/4.0/).
Share and Cite
MDPI and ACS Style
Zhu, L.; Dong, F.; Hu, L. Mechanisms of How Private Equity Drives Industrial Upgrade: An Empirical Study Based on China’s Panel Data. Sustainability 2023, 15, 2570. https://doi.org/10.3390/su15032570
AMA Style
Zhu L, Dong F, Hu L. Mechanisms of How Private Equity Drives Industrial Upgrade: An Empirical Study Based on China’s Panel Data. Sustainability. 2023; 15(3):2570. https://doi.org/10.3390/su15032570
Chicago/Turabian StyleZhu, Lin, Fan Dong, and Liangwen Hu. 2023. "Mechanisms of How Private Equity Drives Industrial Upgrade: An Empirical Study Based on China’s Panel Data" Sustainability 15, no. 3: 2570. https://doi.org/10.3390/su15032570
Note that from the first issue of 2016, this journal uses article numbers instead of page numbers. See further details here.