
Rapid Assessment of 2022 Floods around the UNESCO Site of Mohenjo-Daro in Pakistan by Using Sentinel and Planet Labs Missions

1
Centre for Southeast Asian Studies, Kyoto University, 46 Shimo-Adachi, Yoshida, Sakyo-ku, Kyoto 606-8501, Japan
2
Applied Geomorphology and Interdisciplinary Research Centre (CGACI), Department of Geography, West University of Timișoara, 300223 Timișoara, Timis, Romania
3
Earth Observation Cultural Heritage Research Lab, Department of Civil Engineering and Geomatics, Faculty of Engineering and Technology, Cyprus University of Technology, Limassol 3036, Cyprus
*
Authors to whom correspondence should be addressed.
Sustainability 2023, 15(3), 2084; https://doi.org/10.3390/su15032084
Submission received: 16 December 2022
/
Revised: 18 January 2023
/
Accepted: 18 January 2023
/
Published: 21 January 2023
(This article belongs to the Special Issue Remote Sensing and GIS for Cultural Heritage Monitoring and Preservation)
Abstract
:This communication study aims to provide evidence on how Sentinel sensors and Copernicus Programme’s contributing missions can support heritage endangered by natural hazards. The recent catastrophic floods of 2022 in Pakistan, mainly in the Indus Valley, threatened one of the most iconic sites within the country; thus, the UNESCO World Heritage Site of Mohenjo-Daro was selected here as a case study. Even if the main area of the site was not directly affected by the floods but rather by the heavy rains, its landscape suffered profound damage. This study aims to report a combined remote-sensing methodology for a rapid assessment of the flooded areas around the site. By using Sentinel-1 radar data in combination with mid-resolution Sentinel-2 data and Planet Lab images, it was possible to accurately map the affected areas near the site. This approach can be used to better understand the extent of the affected areas and build a better recovery strategy. A near-real-time satellite-based investigation and observations combining various sensors and resolutions (Sentinel 1 and 2 images, as well as Planet Lab images) can provide valuable insights for local heritage managers.
1. Introduction
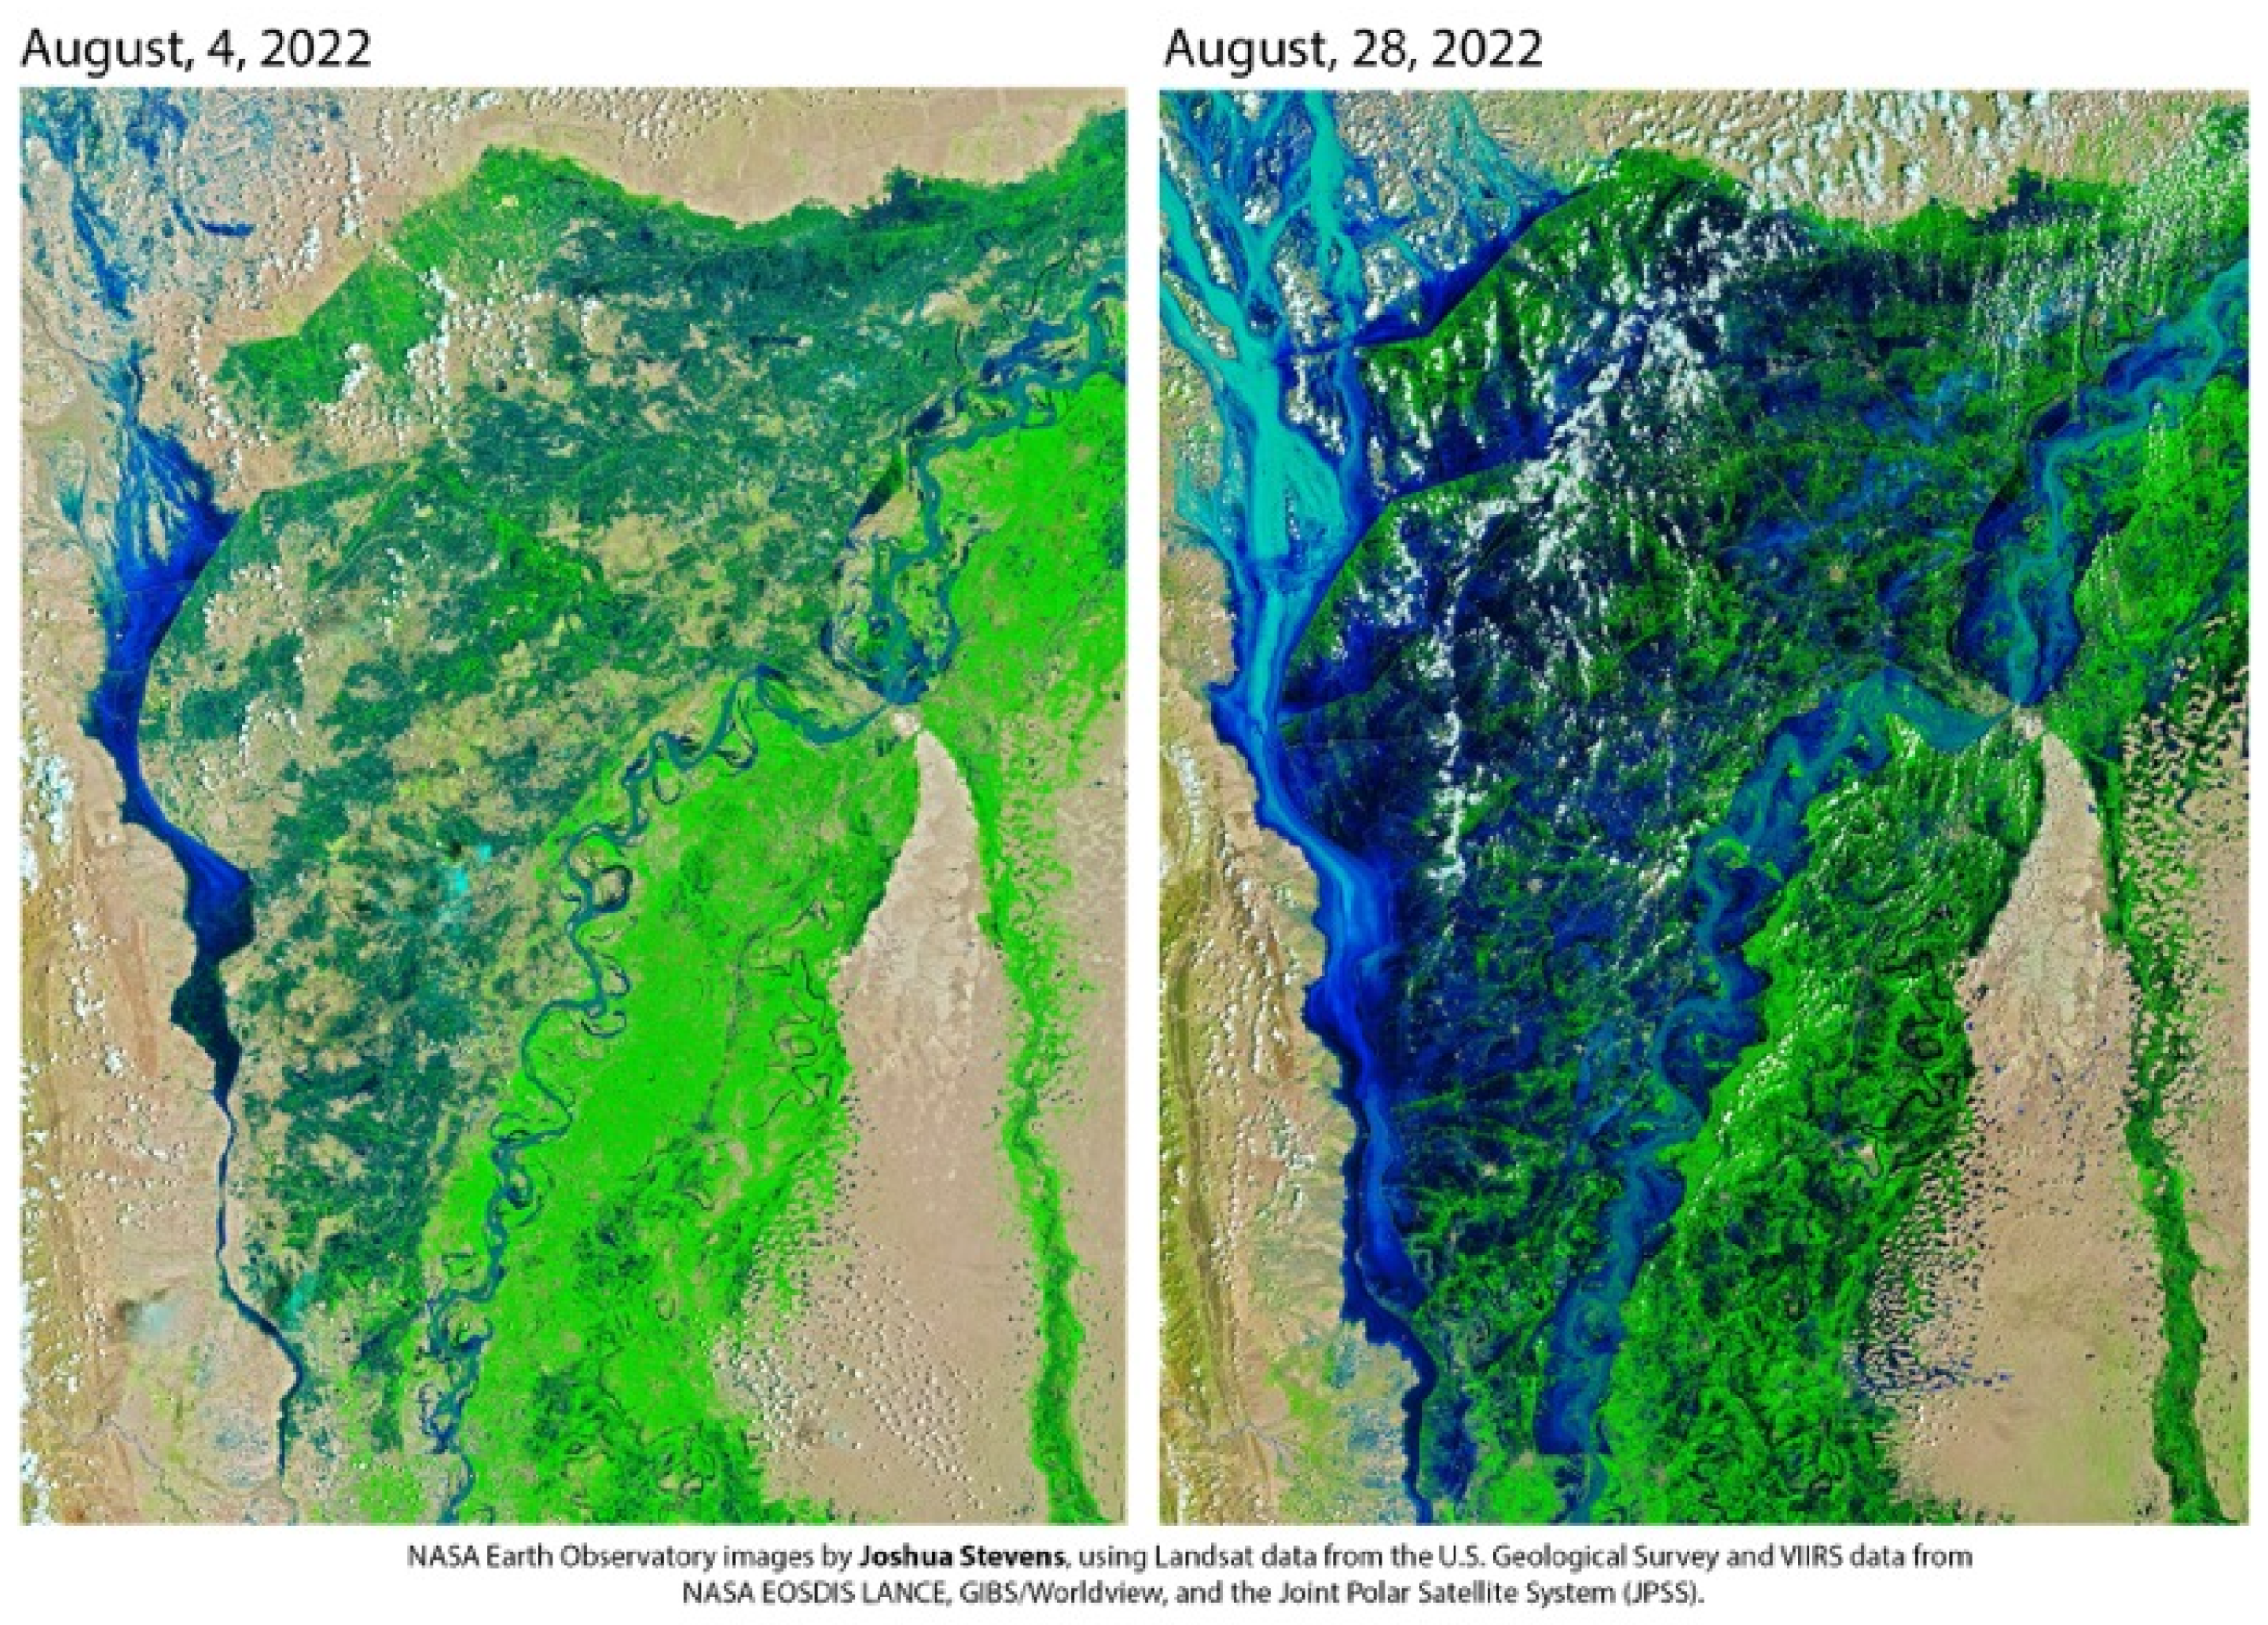
A massive monsoon rainfall (between July and September 2022) triggered devastating flooding in Pakistan. Figure 1, composed of two images produced by Joshua Stevens (Nasa Earth Observatory), shows the real extent of the disaster. According to worldwide statistics [1], during this event, more than 30 million people were affected, and approximately 8 million are displaced at present. The majority of economic sectors, particularly infrastructural and productive sectors, were severely impacted. The floods had a significant impact on the social sector, including housing, health, and education. Additionally, the cultural and heritage sectors were imperiled. Recent assessments predict that more than 150 sites, some of which are UNESCO-listed, suffered partial damage. Losses in the cultural sector are expected to be approximately 6 million dollars [1]. Among the affected archaeological sites is the UNESCO site of Mohenjo-Daro, situated in the Sindh province. Mohenjo-Daro is one of the most iconic sites of the Indus Valley Civilization, also called Harappan civilization, which thrived around 2400 and 1800 BC [2,3,4]. The ancient city, with its impressive architecture, occupies approximately 80 ha on a ridge in the flood plains of the Indus River [2]. The site was discovered in 1922 by R. J. Banerji, who was the director of the western archaeology district in Bombay, and it was excavated until 1964, when archaeological excavations within the area were forbidden [2]. The city of Mohenjo-Daro was already massively endangered by natural causes, especially by natural erosion. It is known that the site has undergone massive disintegration because of sodium sulfate, which was breaking down the bricks long before the excavations began in the area [2,5]. Besides this, the site was irreversibly affected by railway workers, who used the ancient bricks as ballast for the construction of a modern railway [2].
The recent heavy rains and floods within the area have added one more major risk. Heritage damage caused by heavy rains and floods is a common occurrence in South Asia [6]. However, considering the climate conditions at the Mohenjo-Daro site, where the average precipitation is around 100 mm/year, of which around 70 mm occurs in July and August, the approximately 400 mm of precipitation in August 2022 can be seen as a major hazard for the layout of the city and, of course, for its surroundings. Media reports already argue that parts of the walls and some important edifices were destroyed by the rain. Even if the city itself was not directly affected by the floods, its landscape was devastated, as can be seen in our remote sensing analysis below. This will affect the site’s sustainability in the long term, both from a management and touristic point of view. The existing state of degradation will be amplified by the existence of the large body of water near the site, which could aggravate the salinization processes. This communication study aims to demonstrate the potential use of the European Copernicus Programme, including its contributing missions, as a tool for rapid assessment, monitoring, and mapping purposes of flooded areas around archaeological sites, using Mohenjo-Daro as a case study. Even though the potential of the Copernicus Programme has been demonstrated for other natural and anthropogenic threats such as those of earthquakes [7,8,9,10,11,12,13,14], fires [15,16,17,18,19,20], erosion [21,22,23], urbanization [23,24,25,26,27], and technological hazards [28], floods remain a little discussed threat for heritage management. Even though the Copernicus Programme’s active and passive sensors, namely the Sentinel 1 and Sentinel 2 sensors, respectively, provide medium-resolution images, their high temporal resolution and systematic observations can be used as an indicator for areas difficult to reach from the ground. It can be argued that similar rapid satellite-based investigation and assessment supported by different sensors and resolutions (in this study, Sentinel 1 and 2, along with planet imagery) can maximize precision and provide helpful insights for local heritage managers.
2. Materials and Methods
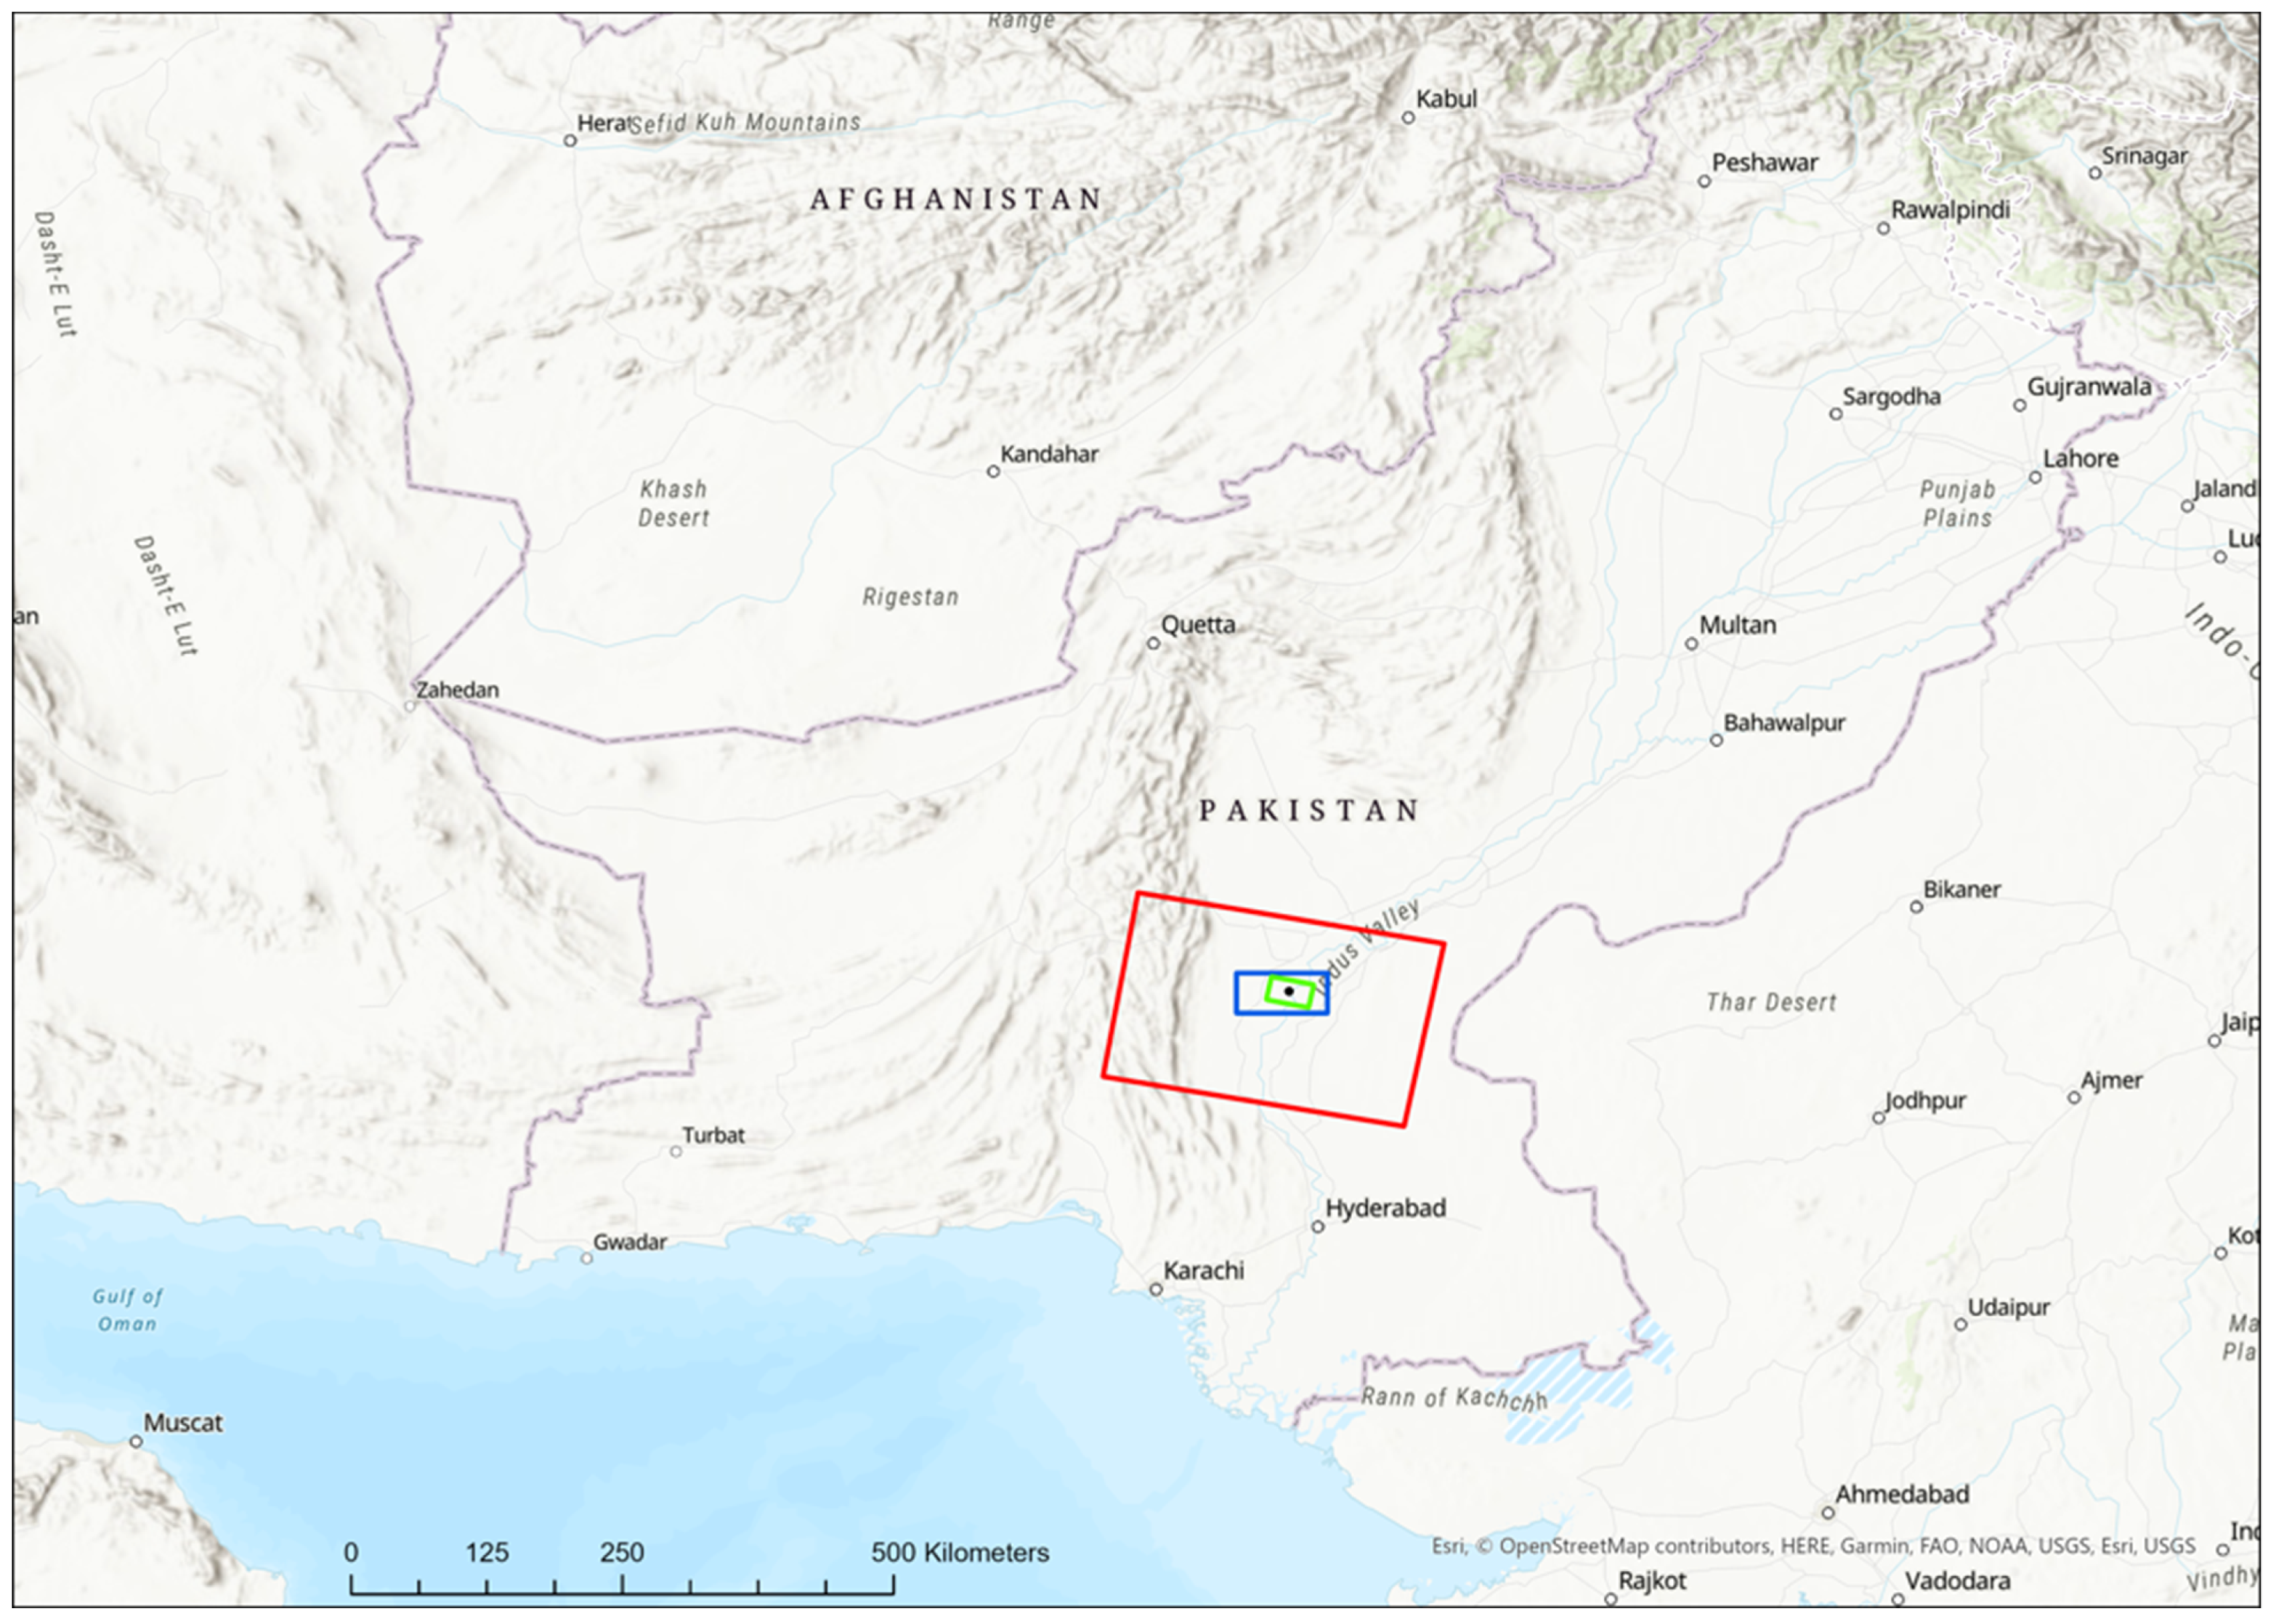
For the purposes of the study, both radar and optical satellite images were used. Four Sentinel-1 images were acquired on 2 May 2022 (prior to flood event data), 18 August 2022 (during flood event data), and 11 September 2022 (during flood event data). Further details related to the Sentinel 1 data sets are provided in Table 1. The scenes were acquired in descending mode with the same track orbit, which helps their co-registration, as the images share almost similar footprints. Figure 2 displays the exact position of the radar scenes.
For a rapid and straightforward processing workflow, the first step in preparing the Sentinel-1 data consisted of averaging the power in azimuth and range directions for each scene using the multilook function with a factor of 3 for the number of range and azimuth looks. In addition, with the multilooking process, the speckle effects are reduced. Following the averaging of azimuth and range direction, each scene was then calibrated to convert the digital pixel to backscatter. The calibration was conducted in accordance with Equation (1), available in SNAP software for Sentinel-1 Calibration (help menu offers full explanation of the equation and the process), where value (i) is the radar backscatter coefficient, DN is the digital number, and Ai is one of the coefficients in the LUT (look-up table).
After calibrating each of the four scenes, terrain correction was applied for topographic distortions, and then the images were reprojected in geographic coordinates (WGS 84) using the range Doppler orthorectification method provided by the Sentinel Application Platform (SNAP) software. The sigma nought band displaying the values on a linear scale was then transformed into a band displaying the values on a logarithmic scale. Every data set was converted into a single-band image. To create an RGB composite depicting the flooded regions within the study area, archive and recently acquired images were combined. For instance, the 02/05/2022 dataset was designated the “red band”, and those from 18/08/2022, 31/08/2022, and 11/09/2022 were the “green band” and “blue band”. Consequently, the images were combined in pairs to visually examine changes in the landscape over time due to the floods. The RGB composite consisted of a red band for the 02/05/2022 image and green and blue bands for the 18/08/2022 image. To illustrate the differences between 18 September 2022, and 31 August 2022, the first band was designated as the red band and the second as the green and blue bands. We repeated this procedure to illustrate any differences between August 31 and September 11. Obviously, individual August and September datasets can be cross-referenced with archive data from 2 May 2022, before the floods. The ArcGIS Pro environment [29] was used to create the RGB composite, while SNAP software was used for the initial processing and calibration of the data.
In addition, optical images were elaborated. In specific, Sentinel-2 and Planet Lab images acquired on the same day (31 August 2022) were used. Sentinel-2 imagery (Level 2A Bottom of Atmosphere) was processed directly in the Sentinel Hub EO Browser, whereas Planet Lab imagery was processed in the ArcGIS Pro environment [29]. The Sentinel-2 image provides systematic satellite data spanning from 443 to 2190 nm (coastal to short-wave infrared (SWIR) part of the spectrum) in 12 different spectral bands with a relevant medium resolution analysis (10 m and 20 m pixel resolution), whereas the Planet Lab sensor provides a multispectral image spanning from the coastal to near infrared part of the spectrum in 8 bands.
Initially, different pseudo-color composites were applied to both optical images. Then different spectral transformations (indices) were applied that could further enhance water content and soil moisture. This step included the implementation of the Normalized Difference Water Index (NDWI) and the Normalized Difference Moisture Index (NDMI). The NDWI index [30] is a remote-sensing-based indicator that is sensitive to changes in the water content. The NDWI is applied to observe changes associated with water content in bodies of water. Since the latest surfaces (i.e., water bodies) strongly absorb the electromagnetic radiation in the visible and infrared parts of the spectrum, the index is computed using the green and near infrared (NIR) bands to highlight water bodies. The NDWI product is dimensionless and varies between −1 and +1, where high values of NDWI correspond to pixels with high water content and low NDWI values correspond to pixels with low water content. The equation for NDWI is provided in Equation (2), where green represents the green band and NIR the near infrared band.
The NDMI [31] explores both the NIR and SWIR bands to determine vegetation water content. The combination of both bands aims to remove vegetation variations and therefore can increase the accuracy of water content. The NDMI equation is shown below, where NIR represents the near infrared band and SWIR is the short-wave infrared.
As is evident, the NDMI could only be applied to the Sentinel-2 image as the Planet sensor is not sensitive to the SWIR part of the spectrum. In addition to these indices, the Normalized Difference Vegetation Index (NDVI) (see Equation (4), where NIR is the near infrared band and red is the red band) was applied. Finally, spectral profiles of specific areas of interest were extracted.
3. Results and Discussion
3.1. Remote Sensing as an Aid for Archaeological Site Flood Rapid Mapping
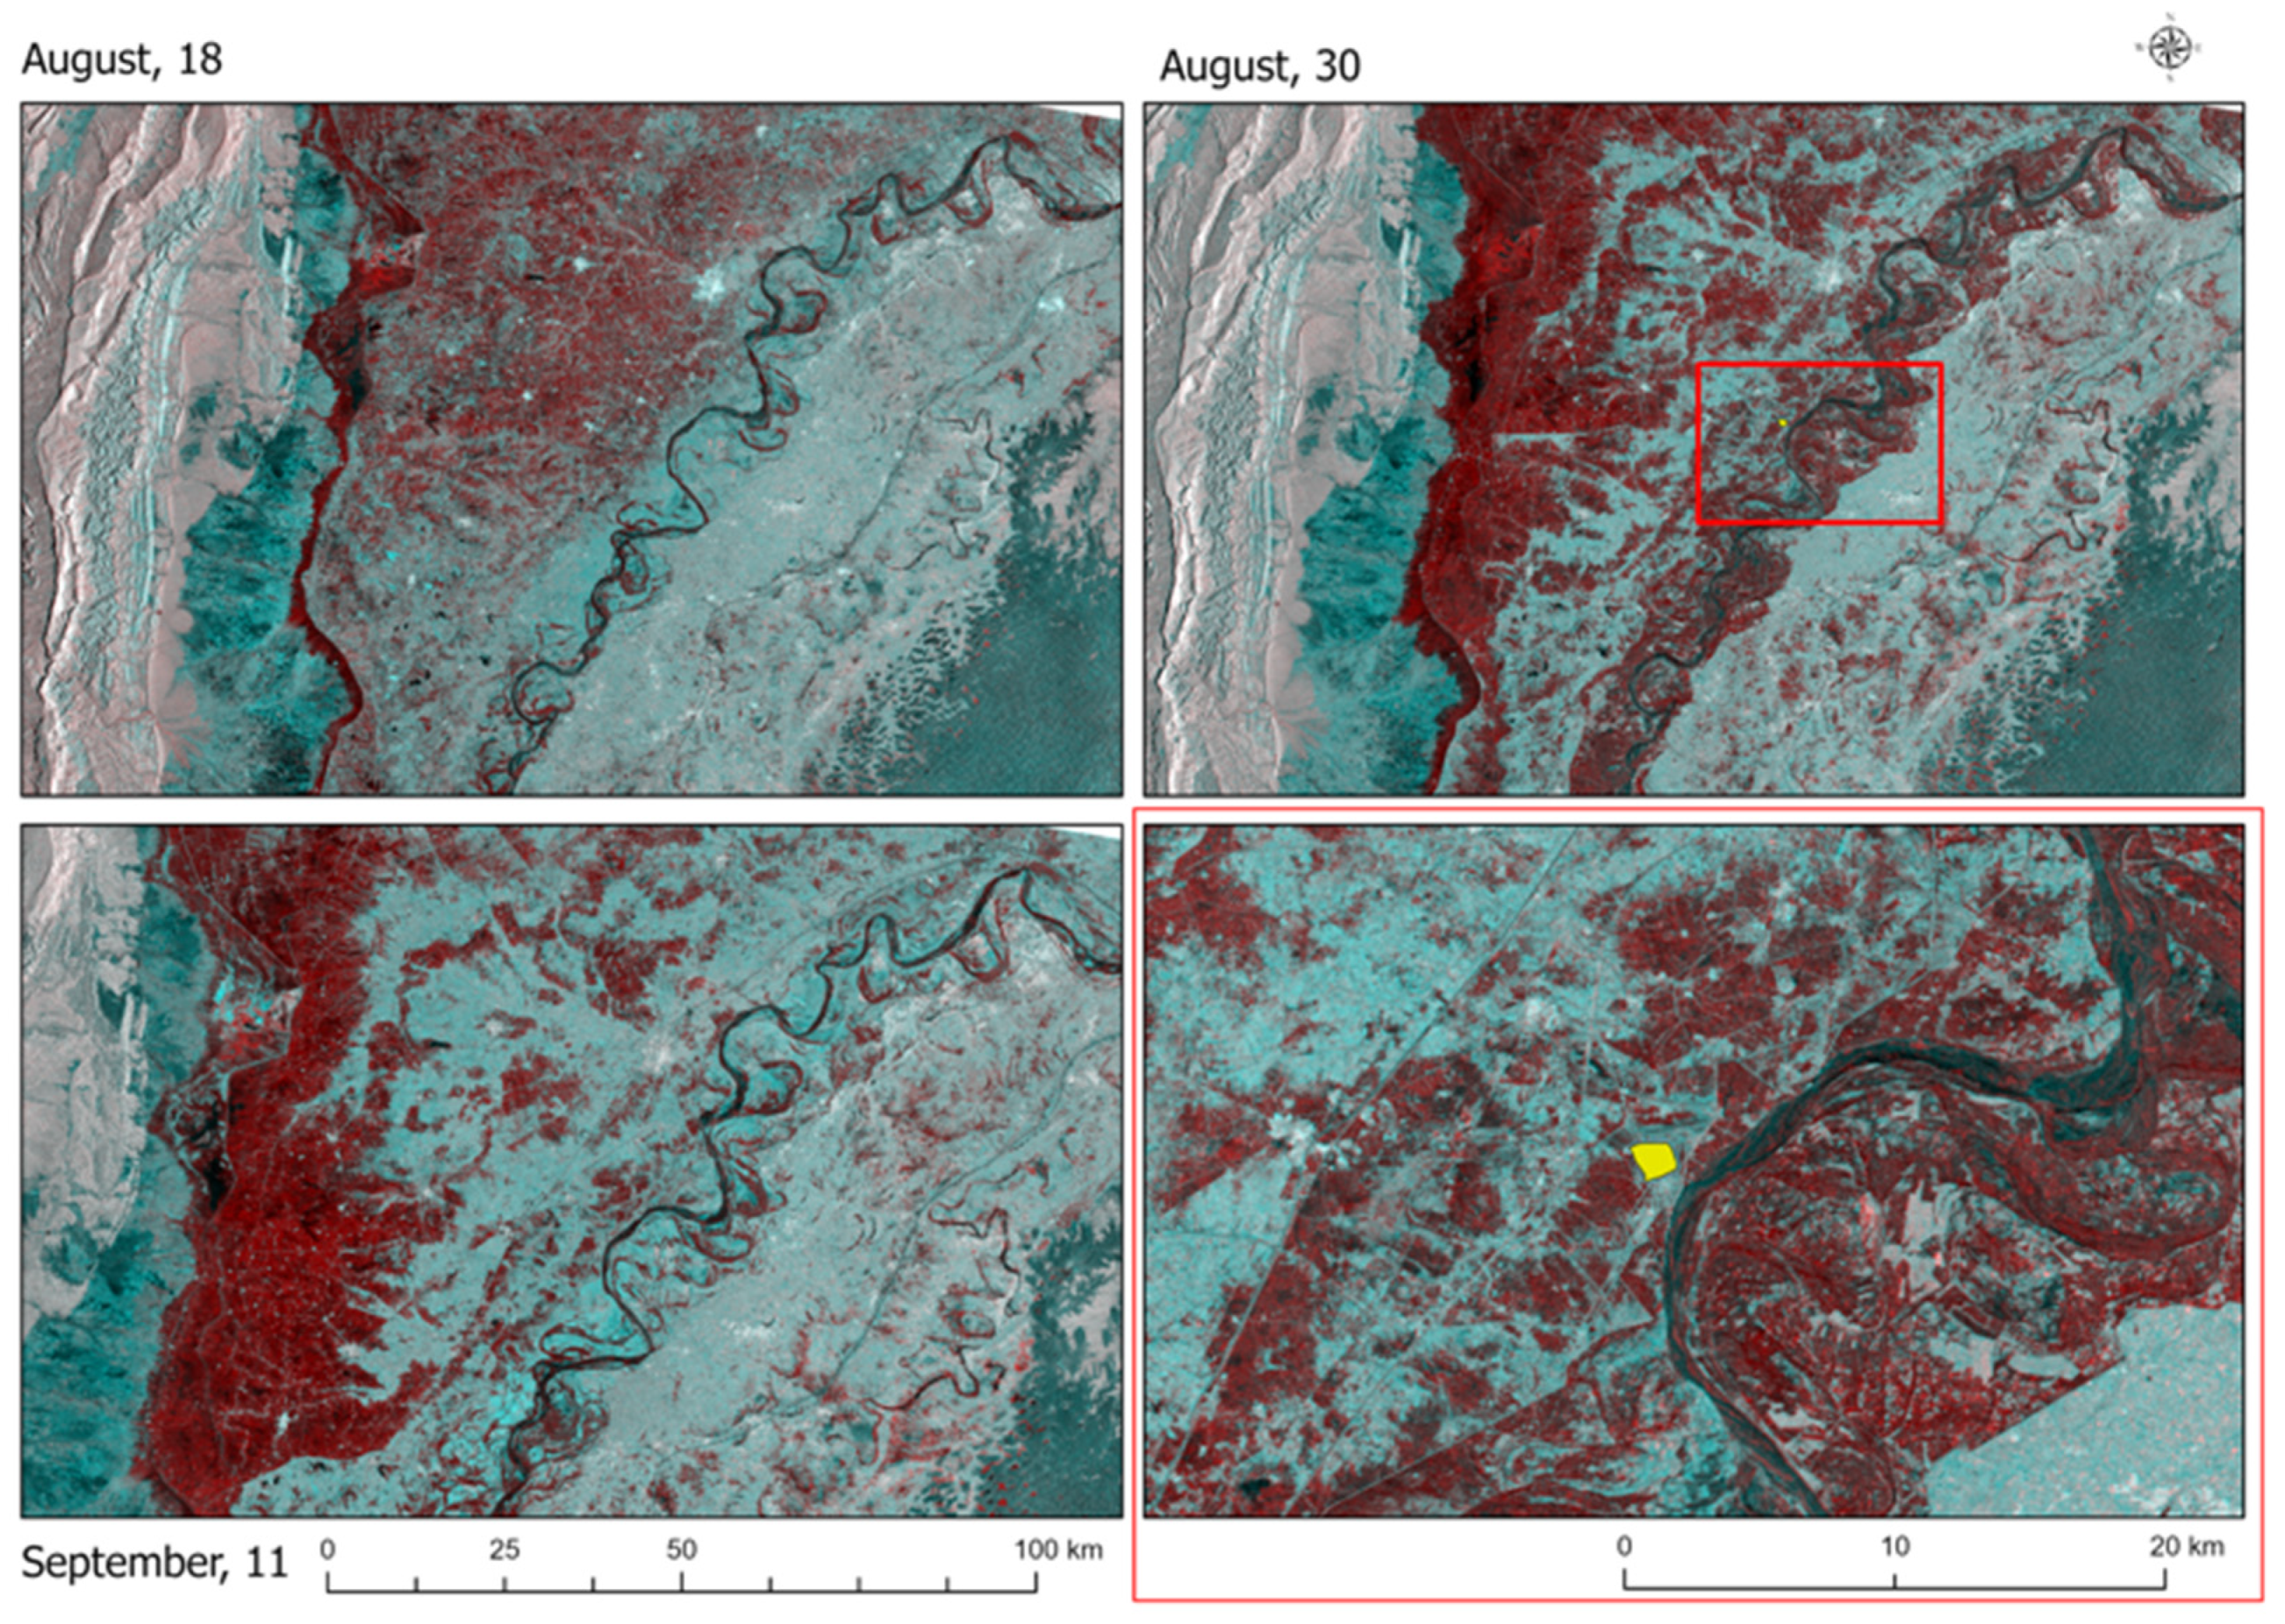
Based on assessments of Sentinel-1 data, Figure 3 presents the flooded areas as an RGB composite. The red band in each RGB composite represents the flooded areas. As demonstrated in Figure 3, we can observe the progression of the floods and the degree to which they escalated by the end of August 2022. In this figure, data from the 18th of August are compared to the data from the 2nd of May, revealing the extent of soil moisture in the majority of agricultural lands within the study area. The second largest lake in the country, Hamal Lake, began to collect water from the Kirthar Mountains and Balochistan. It is important to note that the heatwaves preceding the monsoon, in conjunction with the heavy rainfall, contributed to the melting of Pakistan’s glaciers, which in turn released large quantities of water [31]. The data from August 30, when compared to the data from August 18, indicate that the Hamal Lake dam was breached, and the subsequent release of water fully swamped the neighboring agricultural areas and human settlements. Consequently, considerable population migration has been reported [1]. Figure 3 clearly shows that the Indus Valley was also flooded, and in the detailed images (bottom right corner of Figure 3), one can see that the Mojenjo-Daro landscape (shown in yellow) was also inundated.
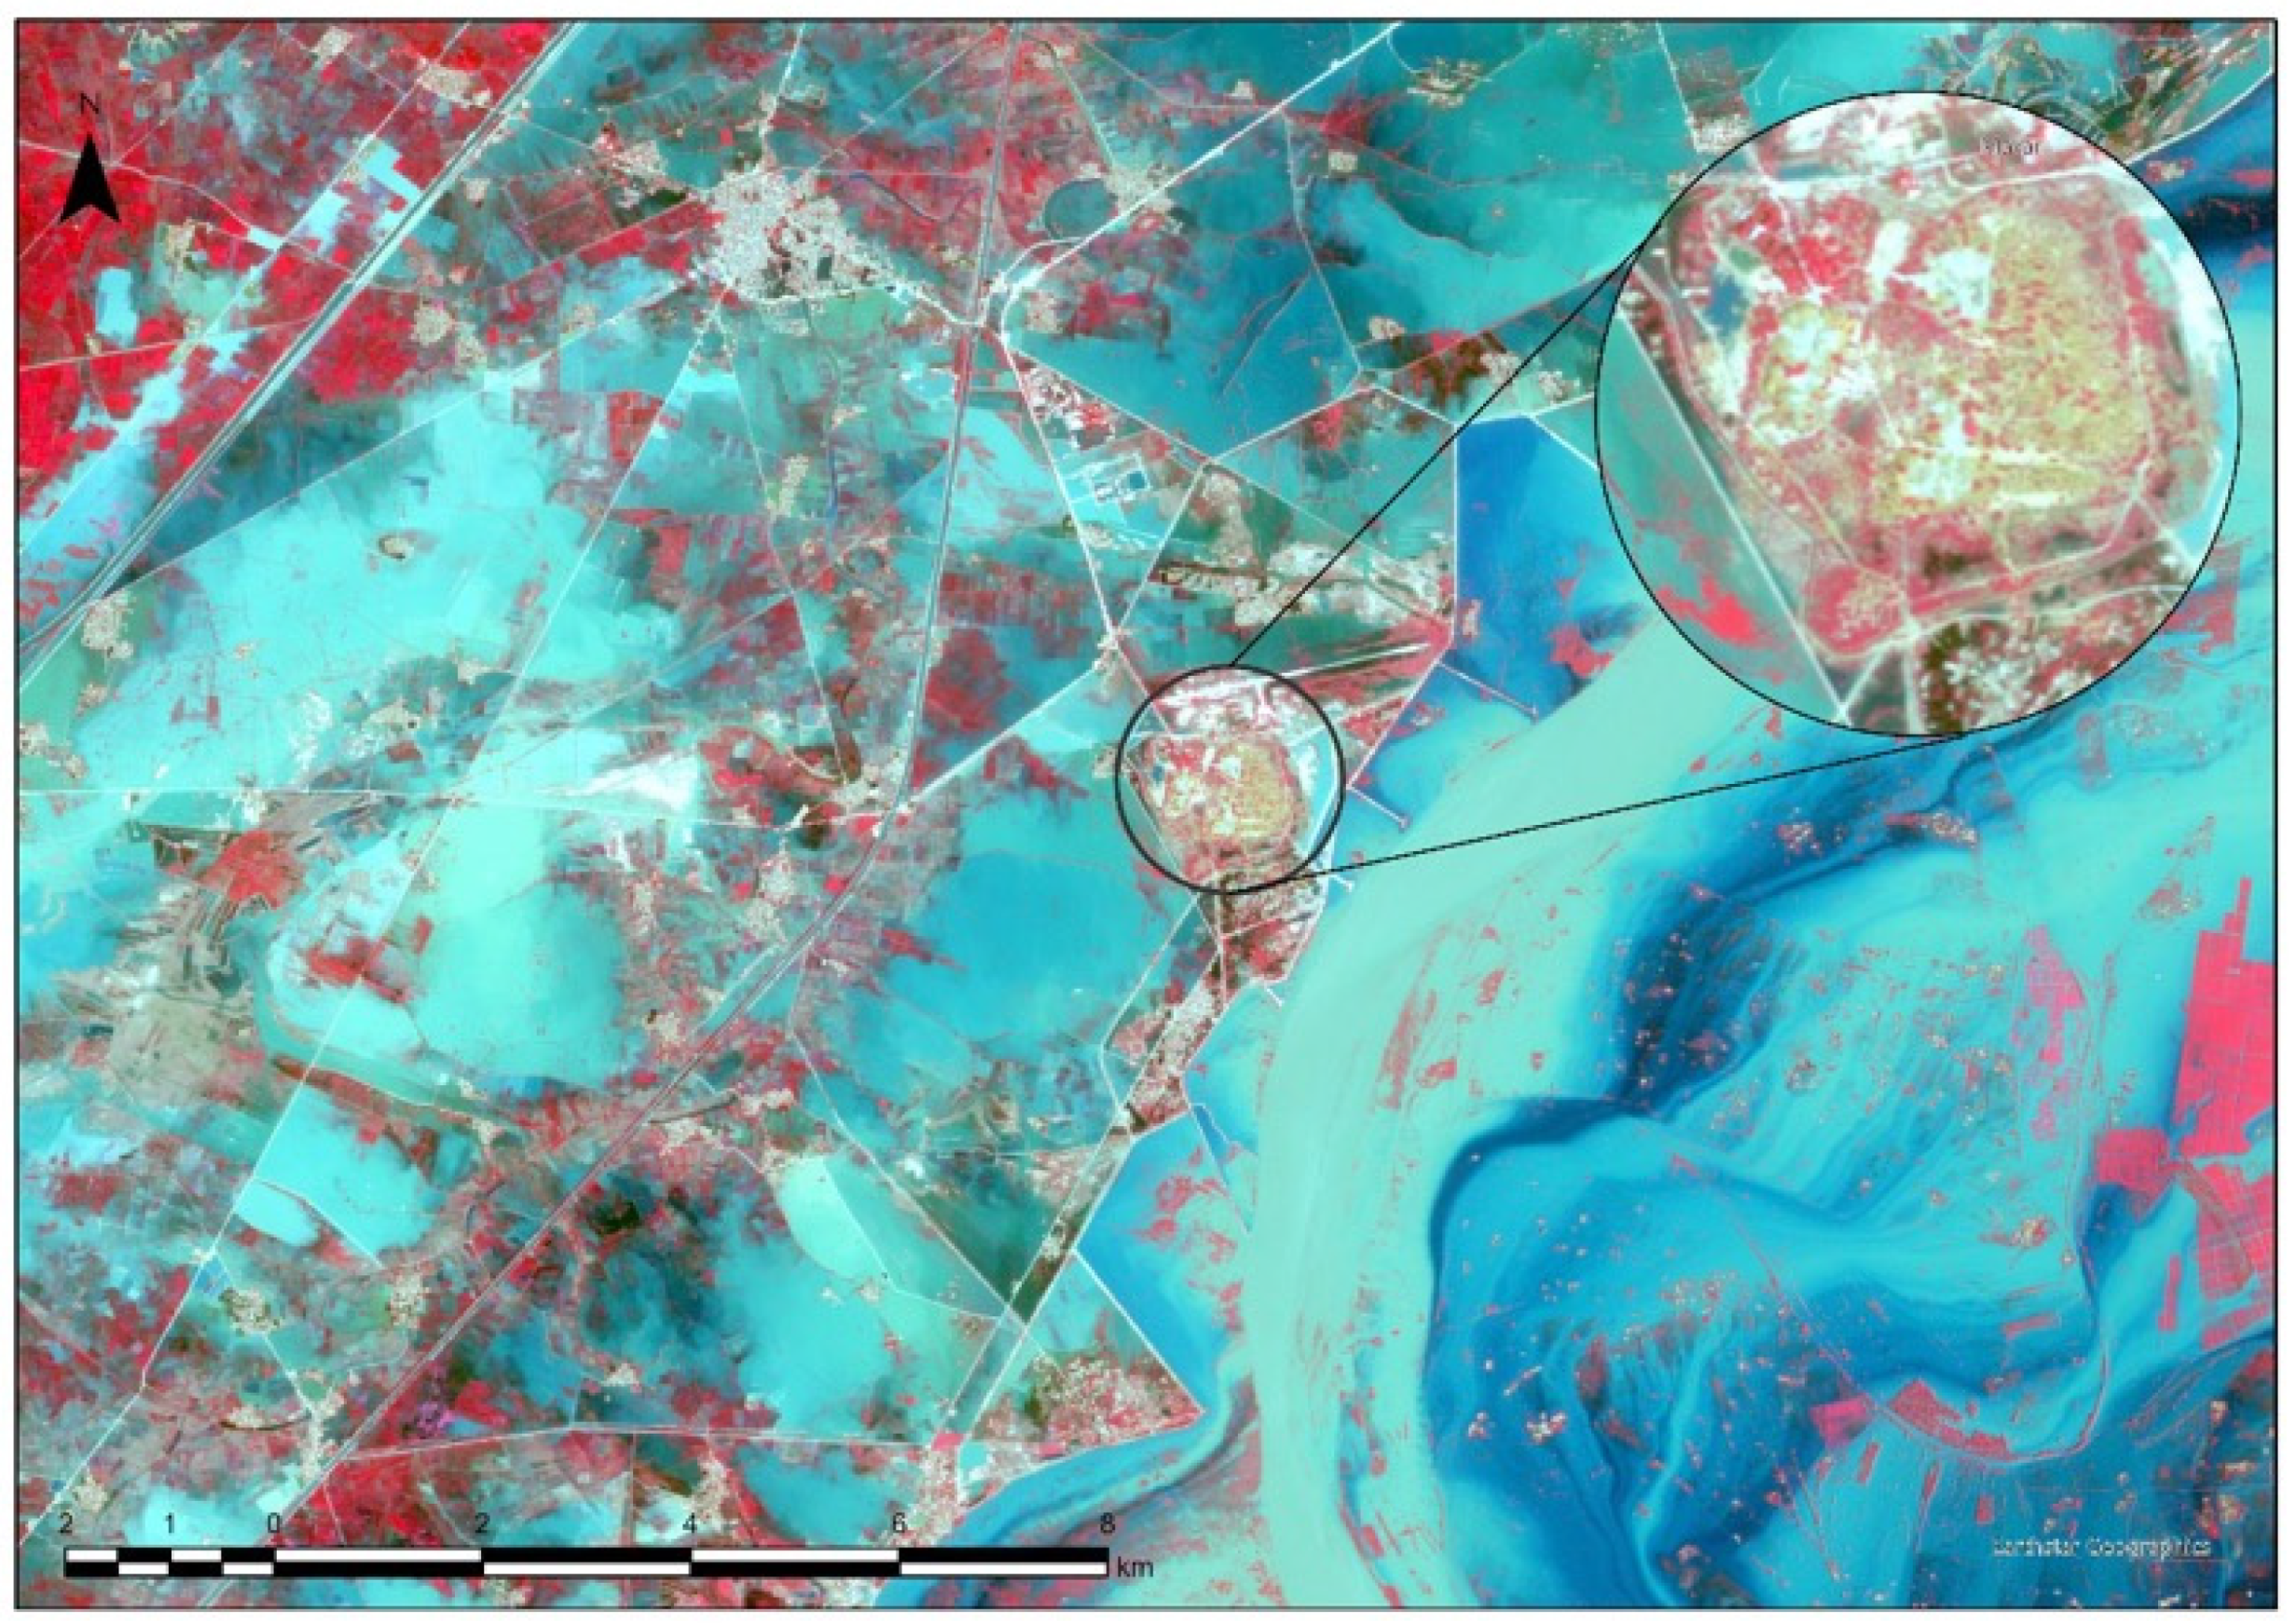
Figure 4 illustrates the extent of the flood using the Planet Lab image (31/08/2022) at a 3 m resolution. The archaeological site of Mohenjo-Daro is shown in the center of this figure (circle). This pseudo-color composite visualizes the near infrared, red, and green bands of the Planet Lab sensor. From visual interpretation and comparison with other datasets like those of Sentinel-1 (with the same date of acquisition as the one of Planet), areas of red indicate areas covered with healthy vegetation, while bare soil is shown with bright colors. Blue areas indicate either water bodies or areas with high levels of moisture.
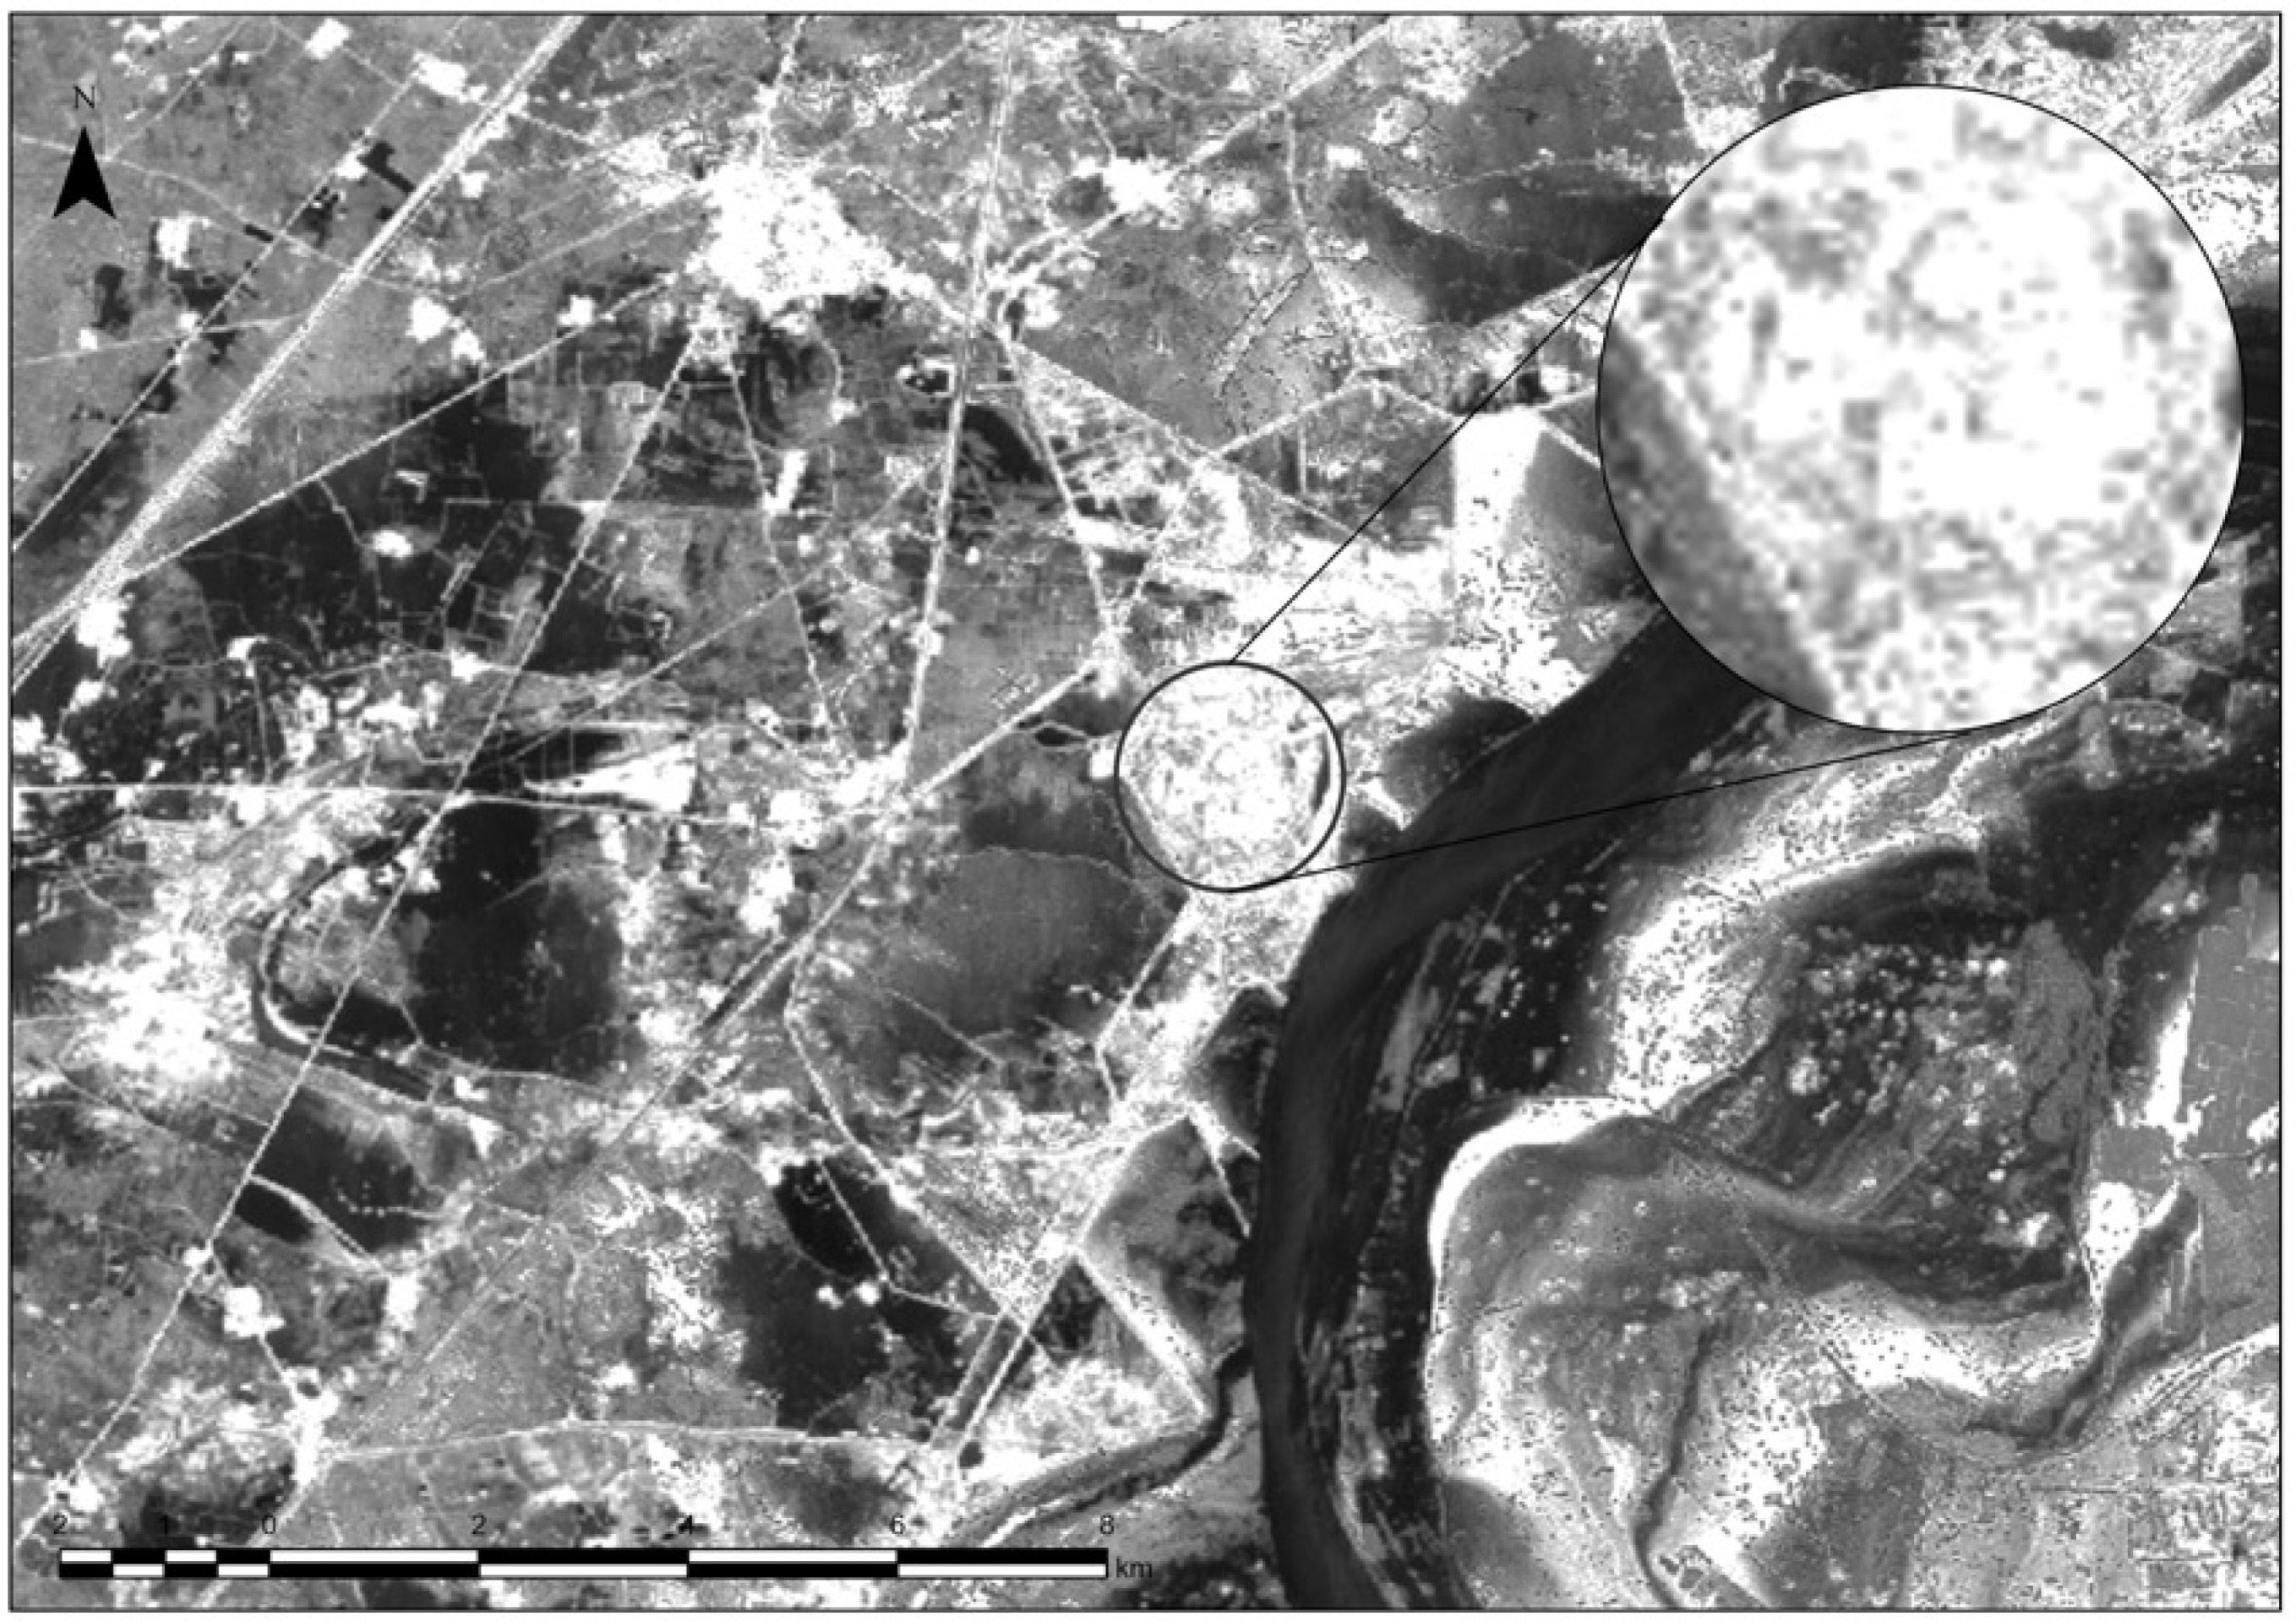
In addition, as mentioned earlier, optical data from Sentinel-2 were used. Figure 5 depicts the results of the NDMI index, which may distinguish the water content within the study area. We were able to extract information about the water content within the site’s borders because of the NDMI index’s capacity to determine the water content of the vegetation and remove the variability of the vegetation. This is observed in Figure 5 (the circle represents the archaeological site area). Dark tones denote areas with high NDMI values, whereas white tones denote areas with low NDMI values [31]. As is evident, the surrounding area of the Mohenjo-Daro site is heavily affected by the floods (see the dark tones of gray surrounding the site), while the site itself seems to be less affected, although some areas (dark tones of gray) are also visible. As mentioned earlier, the NDMI index could not be applied to the Planet Lab image, as the sensor is not sensitive to the SWIR part of the spectrum (needed for the calculation of the NDMI).
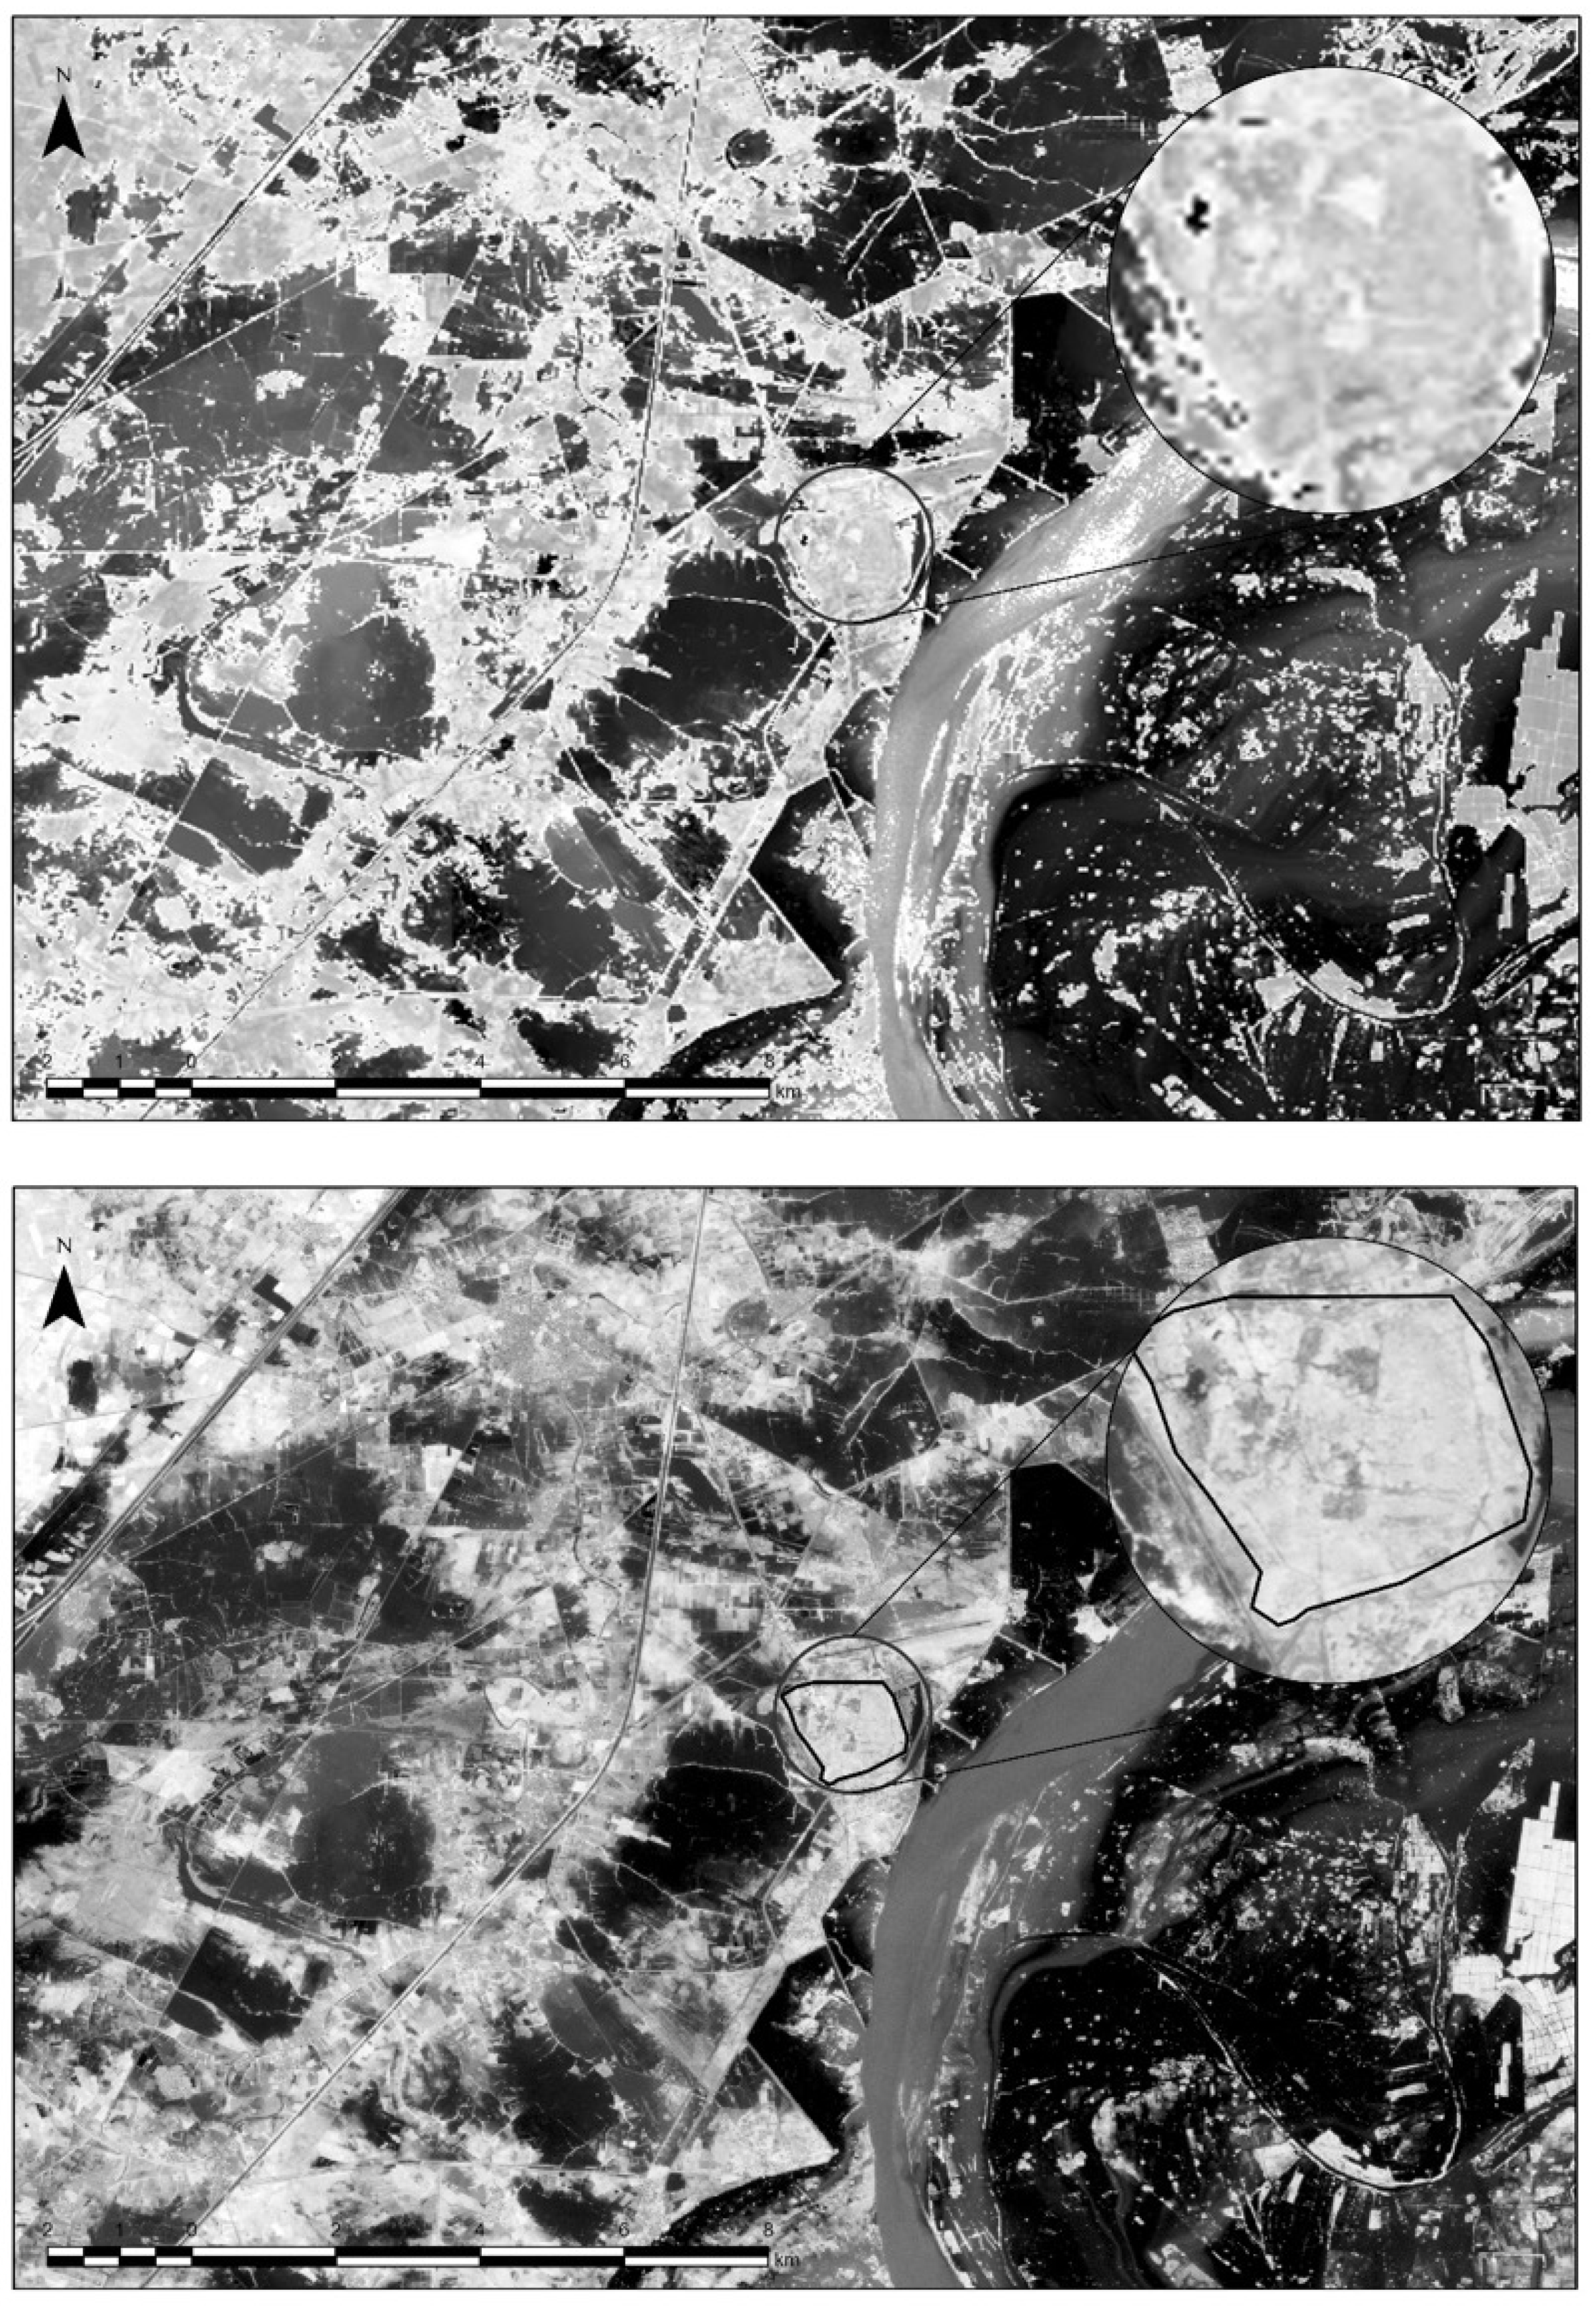
Nevertheless, as both images Both Sentinel-2 and Planet Lab are sensitive to the near infrared and green parts of the spectrum; the NDWI index was estimated for both. Figure 6 displays the NDWI index results in grayscale (−1 white to +1 black), where dark tones of gray reflect areas with high values of NDWI and white tones of grey represent areas with low values of the same index. The NDWI can identify water bodies within the study area. On top of Figure 6, the NDWI is provided at a 10 m resolution (as part of the Sentinel 2 analysis), while Figure 6 (bottom) indicates the same index using the Planet Lab image at a 3 m resolution. A direct comparison between both images can be made, as both of them were acquired on the same day (the 31st of August 2022). Indeed, the results are very similar if we also consider differences due to the spatial resolution of the sensors. Positive values displayed as dark tones of gray within the south-western part of the main prehistoric city highlight a vast body of water that encompasses even portions of the site. In the majority of the images we examined, this body of water could be seen enveloping architectural fields where ancient monuments are most likely to exist. It is important to note that the floods in this location resulted in long-term water saturation, as the water body was still visible in Sentinel-1 imagery from 11 September 2022.
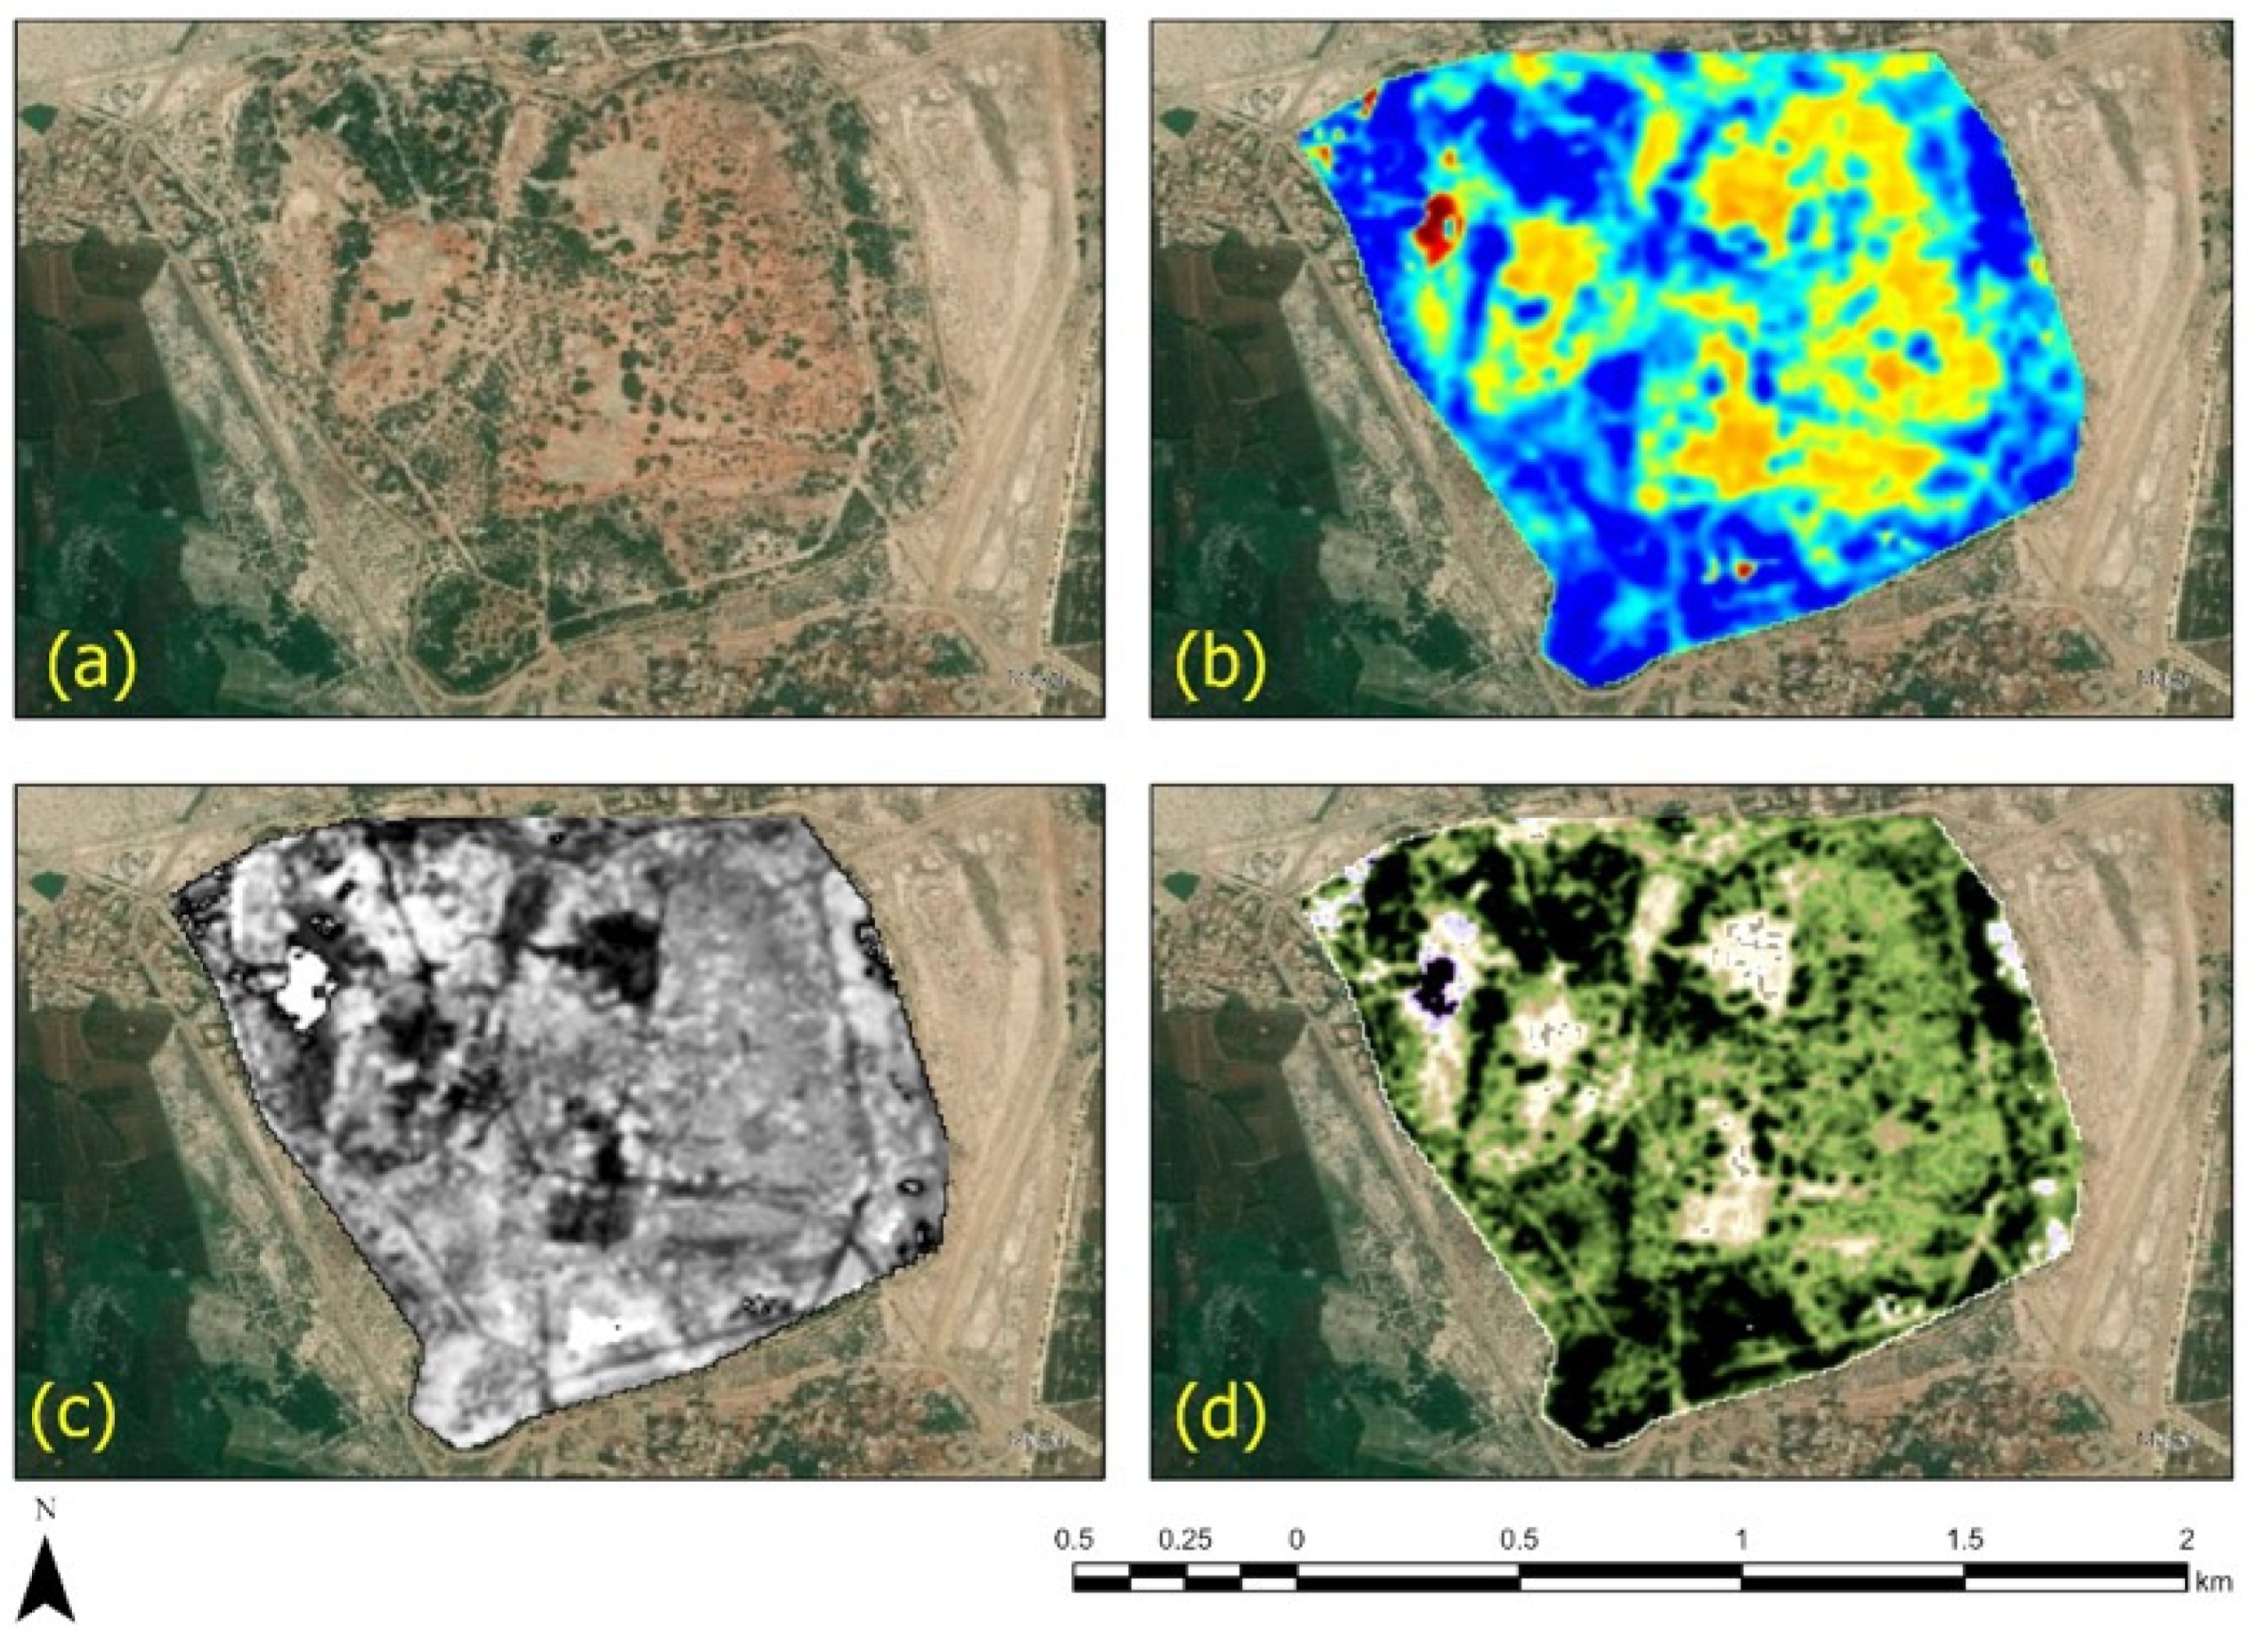
Figure 7 depicts a comparison view of the archaeological site of Mohenjo-Daro based on the previously mentioned indices. Figure 7a indicates a high-resolution image of the site, while Figure 7b shows the results after the implementation of the NDMI using the Sentinel 2 image. Figure 7c,d show the NDWI and NDVI results using the Sentinel-2 image from 31 August 2022. As stated before, the primary archaeological site of Mohenjo-Daro was not flooded due to its elevated location, as depicted in Figure 7a. However, significant rains influenced the uncovered archaeological structures that had been excavated in the past. Even if the structures were not inundated, Figure 7c demonstrates that the opened archaeological structures exposed by the excavations are characterized by an increased water content. Considering that the archaeological buildings at Mohenjo-Daro are already in jeopardy due to natural causes [2,5], the increasing water content within the building’s walls most likely generated the ideal condition for the disintegration of archaeological materials. As indicated in Figure 7b, the water content within the lower portions of the ancient city of Mohenjo-Daro appears to be significantly greater. Some lower portions of the archaeological site were partially flooded, or water accumulated because of precipitation, which will also harm the buried archaeological remains (Figure 7).
3.2. Towards Building a Sustainable Remote Sensing Approach to Mapping and Detecting Flooded Areas for Land Management and Protecting Endangered Archaeological Sites
In this case study, we demonstrated some of the ways in which remote sensing techniques can be utilized for the management of the aftershocks caused by widespread flooding. Remote sensing techniques are widely used on a larger scale, transcending tourism or cultural heritage sectors and presenting deeper implications for both the management of a hazardous situation and, in some cases, the detection of areas that are likely to be flooded. Techniques for optical and radar remote sensing have been employed successfully for these purposes in various parts of the world [32,33,34,35,36,37,38]. Another topic that researchers are interested in exploring is the detection of flood-prone locations [39,40,41,42,43,44,45,46,47,48,49,50,51,52]. Over the course of time, several studies concerning the use of remote sensing techniques in demarcation, monitoring, and damage assessment over the impacted areas in Pakistan have been published [53,54,55,56,57,58,59,60,61,62]. Even for the flooding that took place in 2022, articles have already been published [63,64,65,66,67], because dangerous situations occur frequently within the country because of many factors. For example, climate change is having a significant impact on the country, even though Pakistan is one of the countries that has contributed the least to environmental degradation [68]. Furthermore, according to the forecasts, the situation is not going to improve [69]. Rana et al. (2021) state that Pakistan does not have a coherent multi-hazard and risk reduction policy [70]. Given the circumstances, it is reasonable to predict that situations of a similar nature will, unfortunately, occur again in the future. For this reason, the Pakistani government ought to place a particular emphasis on developing flood risk reduction strategies as part of its overall flood management strategy.
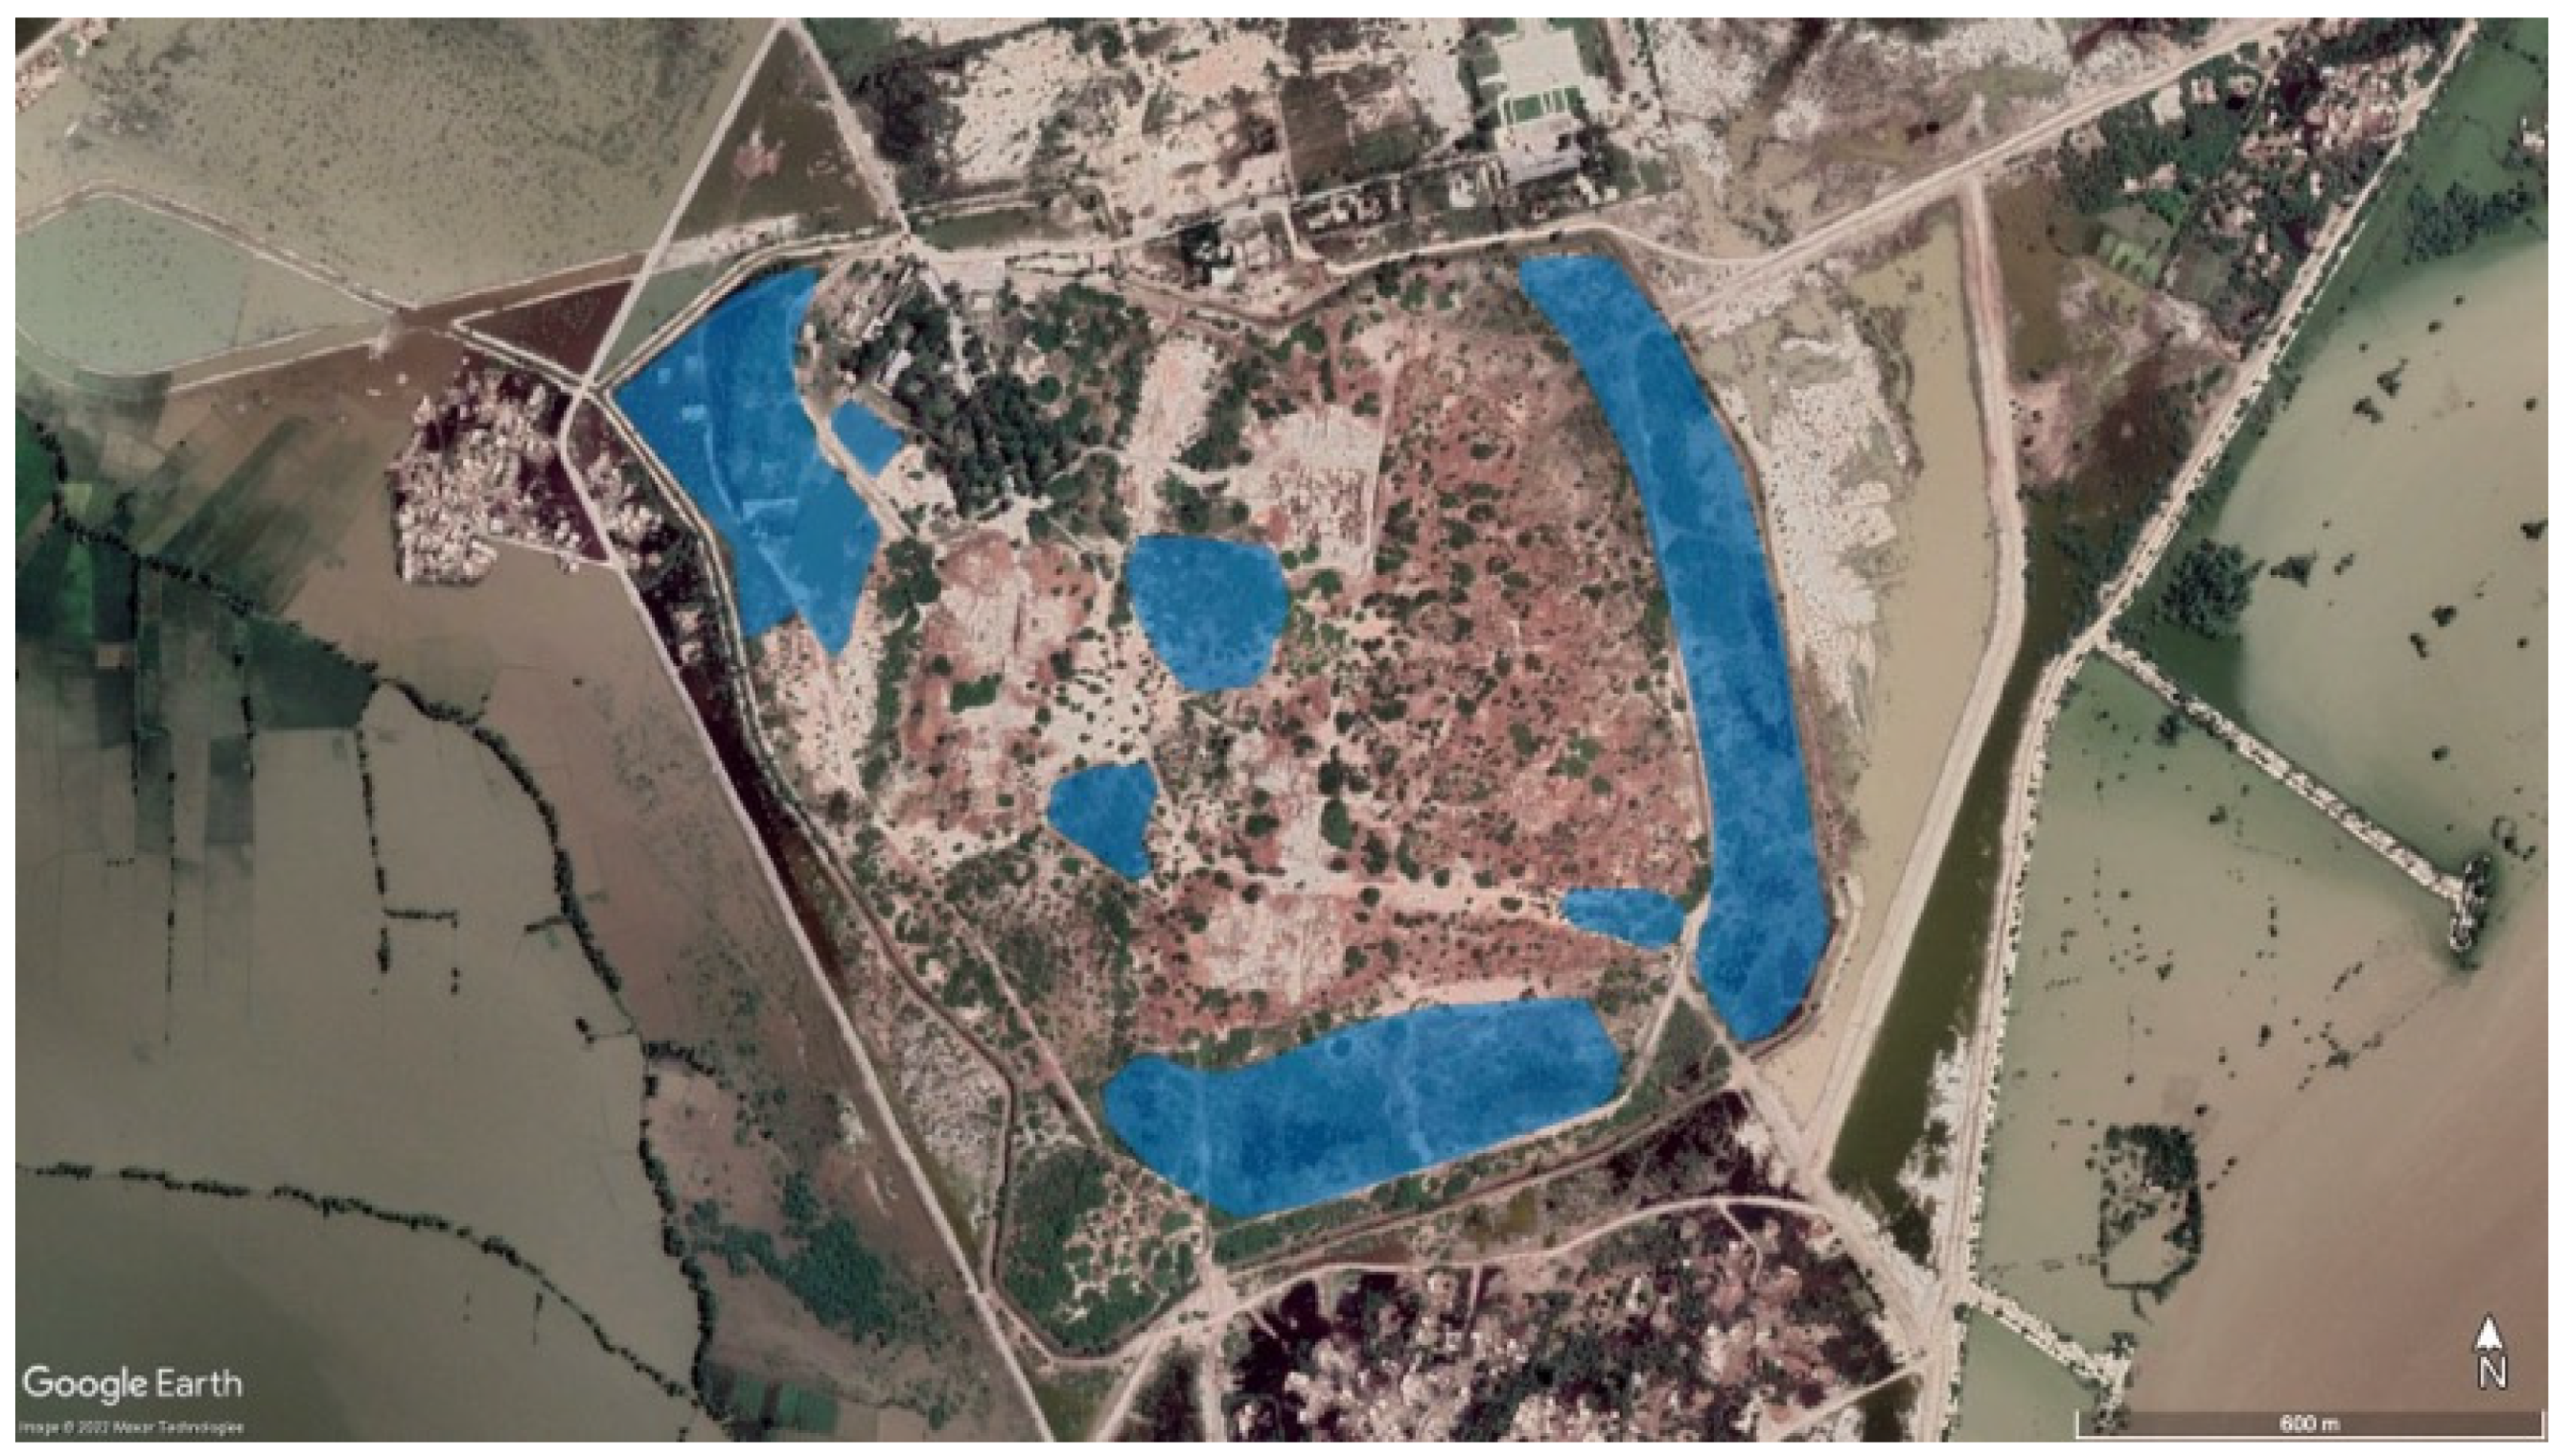
On the other hand, the focus of this communication is to provide evidence on how the integration of active and passive open access and freely distributed images such as those provided by Sentinel 1 and 2 sensors with the support of Copernicus contributing missions (in our case study, the Planet images) maximizes our undertaking for the situation on the ground. Therefore, this study is not designed to assess the danger of flooding across all activity sectors; rather, it focuses on the preservation aspects of heritage sites, after natural hazards, using the site at Mohenjo-Daro as a case study. By correlating the fast assessment of flooded areas around the site with a high-resolution Google Earth image acquired in September 2022, we were able to identify several areas that might have been affected and are susceptible to further degradation in the future. Flooded areas of the site, including both high moisture levels and floods, are shown in blue in Figure 8. The areas depicted in blue are considered the most sensitive regions of the site.
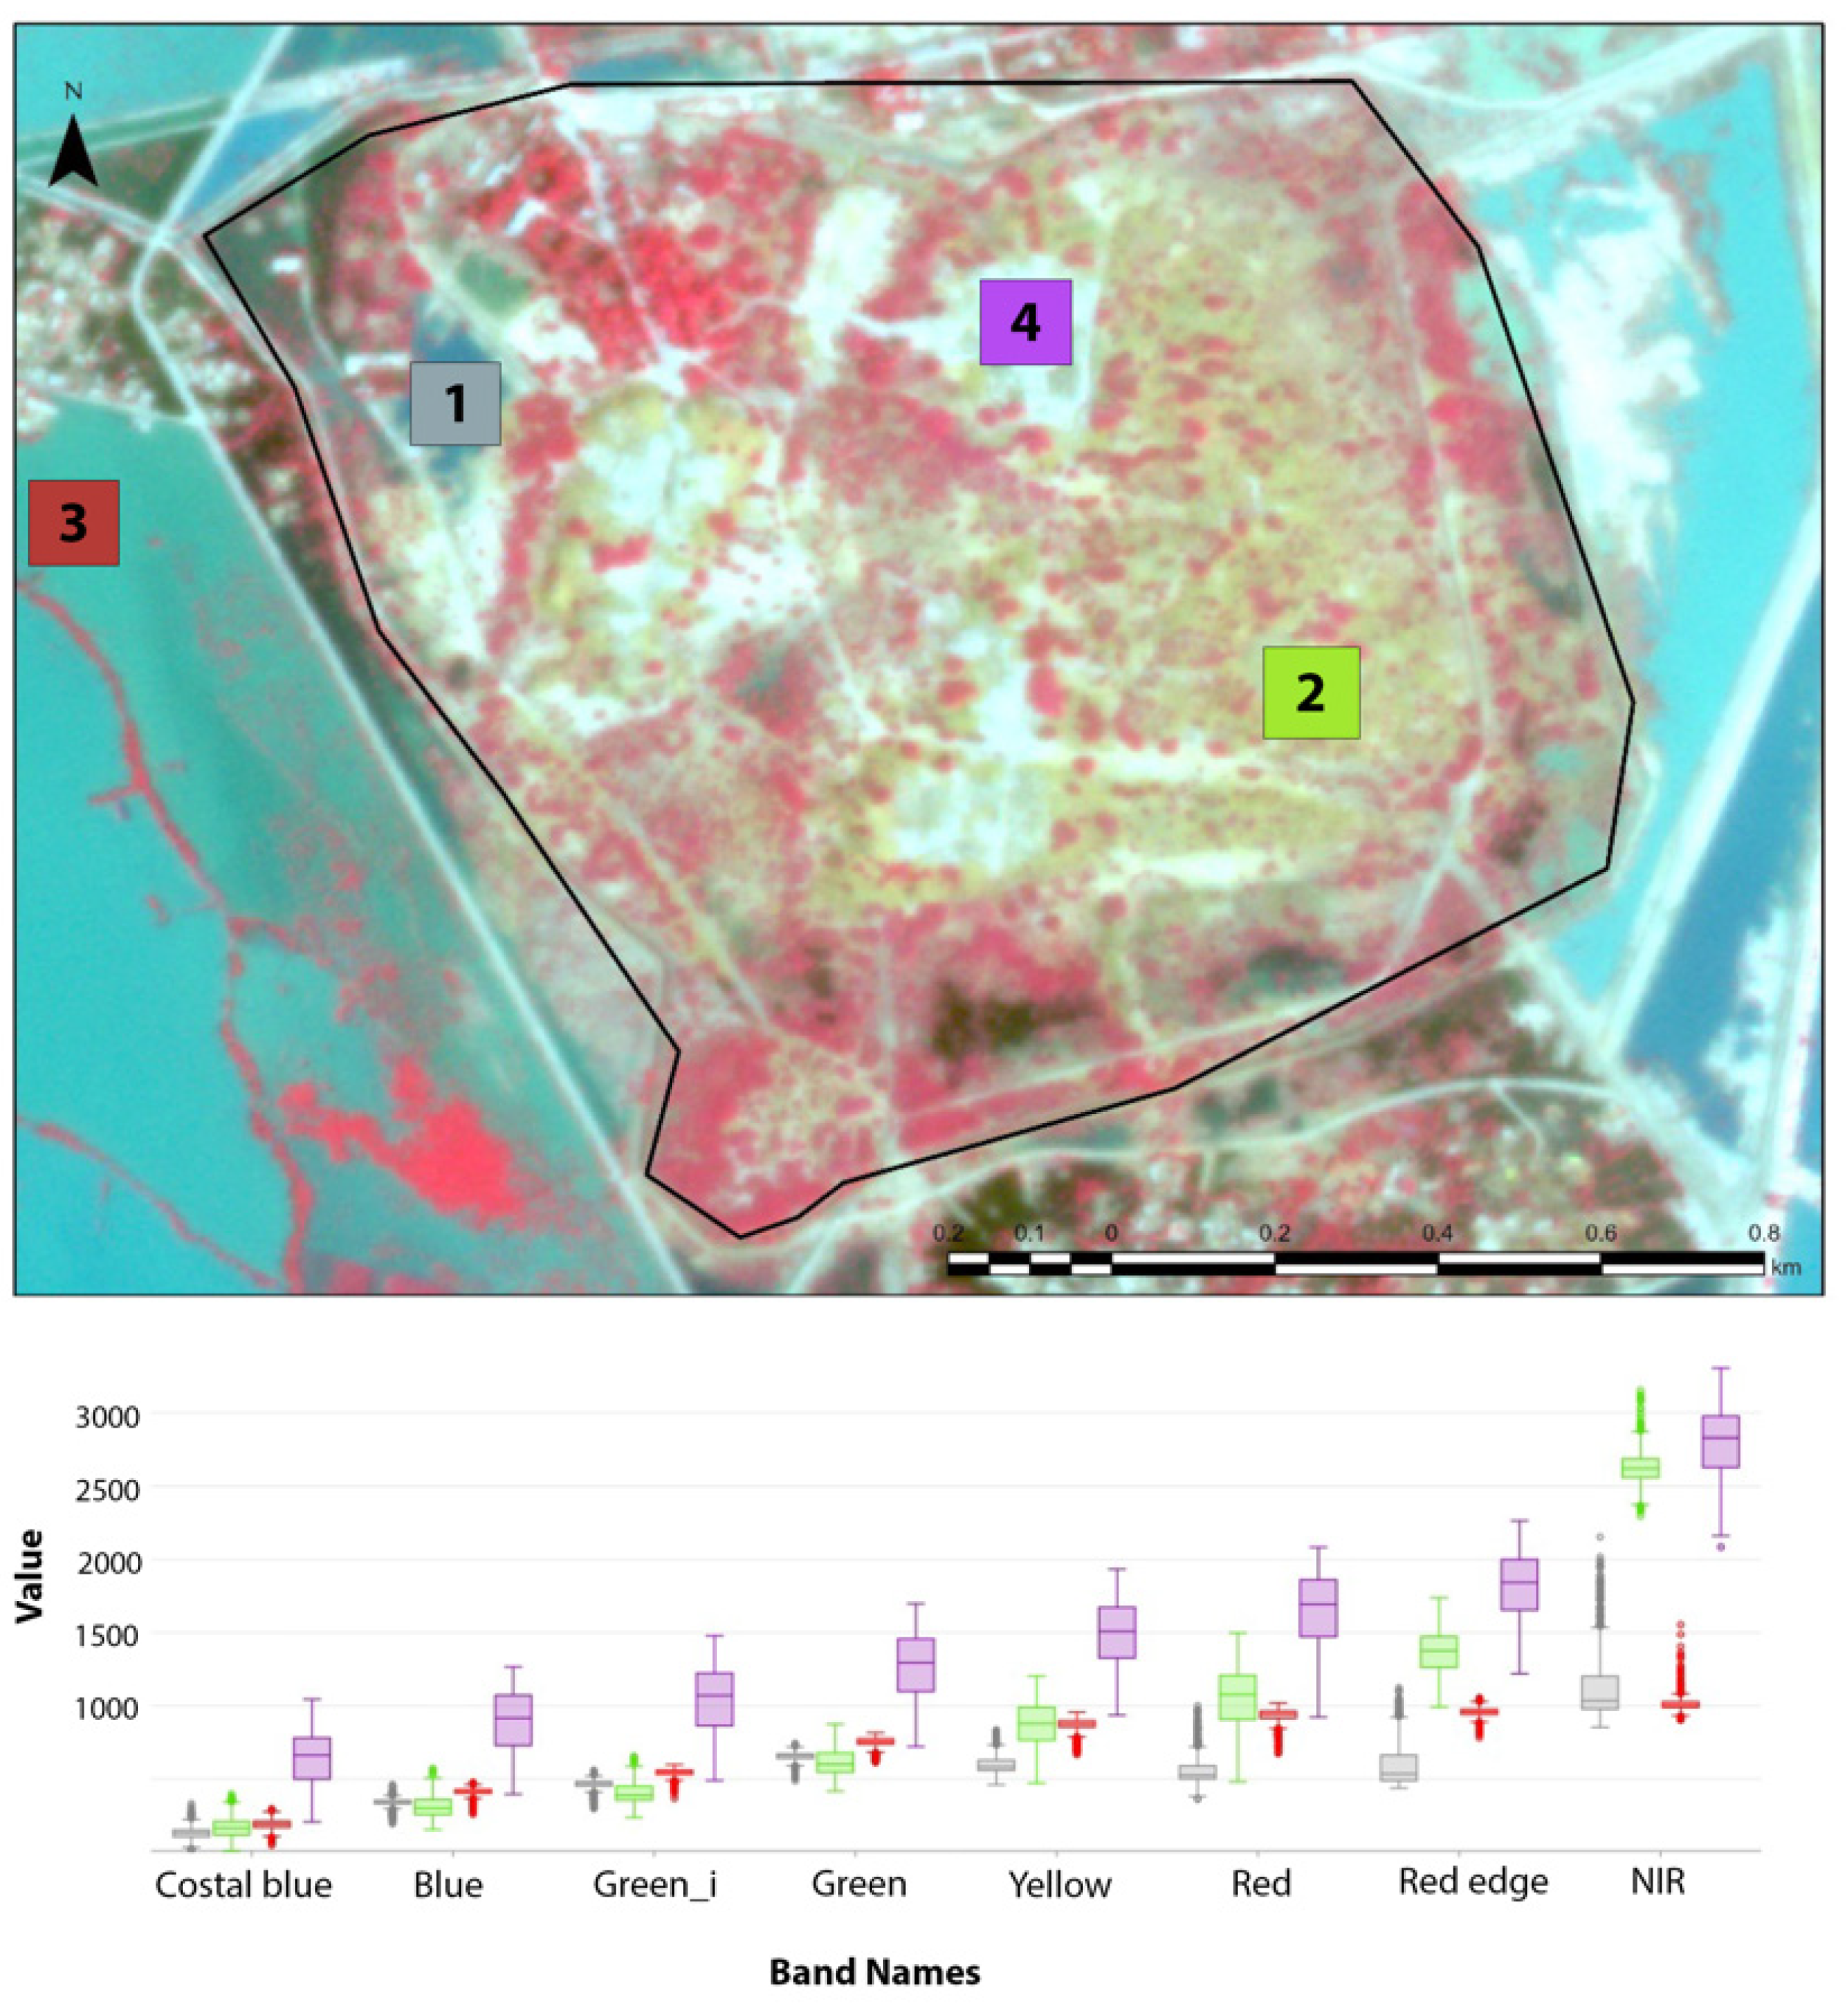
Spectral differences within the archaeological site and in the surrounding area can also be estimated using the eight-band imagery of the Planet Lab. Based on the previous analysis, we focused on four different smaller areas; three of them were located within the site’s boundaries, while the fourth was located beyond the site’s boundaries within the main body of water caused by the flooding. Area 1 is considered an area with levels of moisture as indicated by the evaluation of Sentinel-2 and Planet images (see Figure 7), while area 2 is a bare soil area within the case study. The final two areas (areas 3 and 4) are designated as a moisture area outside the site and a vegetated region, respectively. The four areas are depicted in Figure 9 (top), while statistics for the four areas for all spectral bands (coastal blue to near infrared) are shown in Figure 9 (bottom). As shown, both areas 1 and 3 tend to provide similar spectral behavior, especially in the near infrared part of the spectrum, whereas reflectance is strongly absorbed by water.
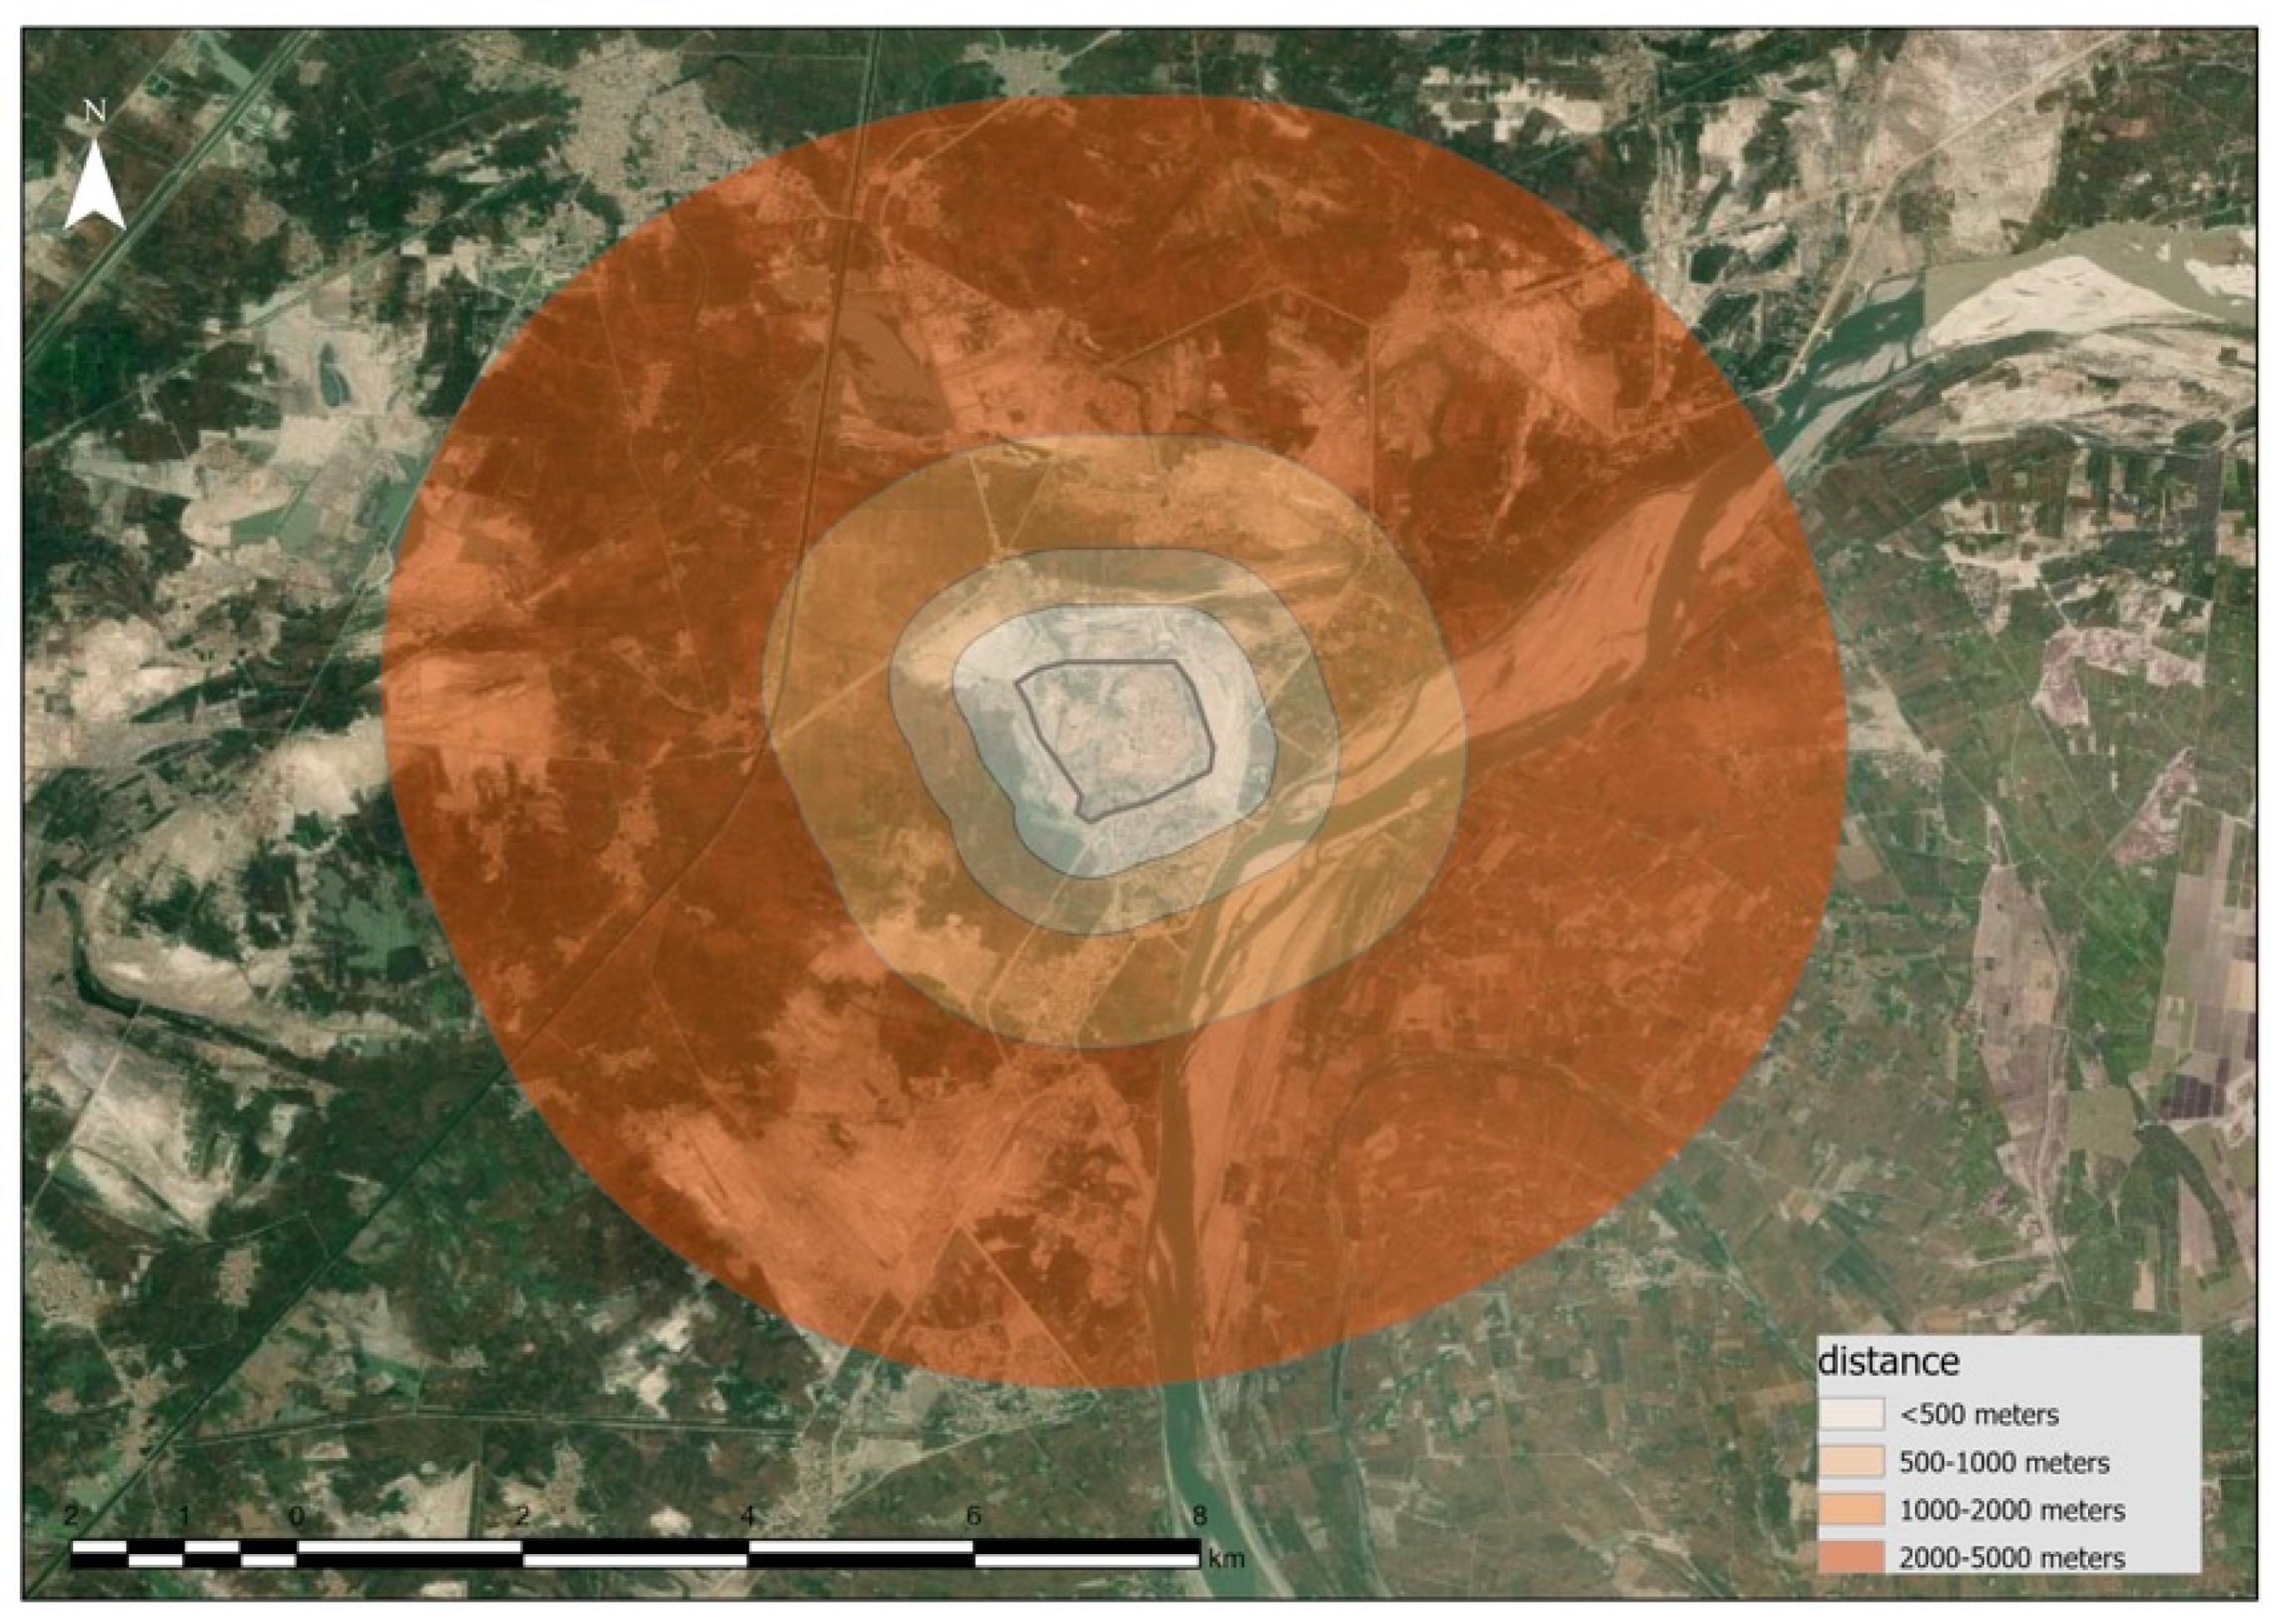
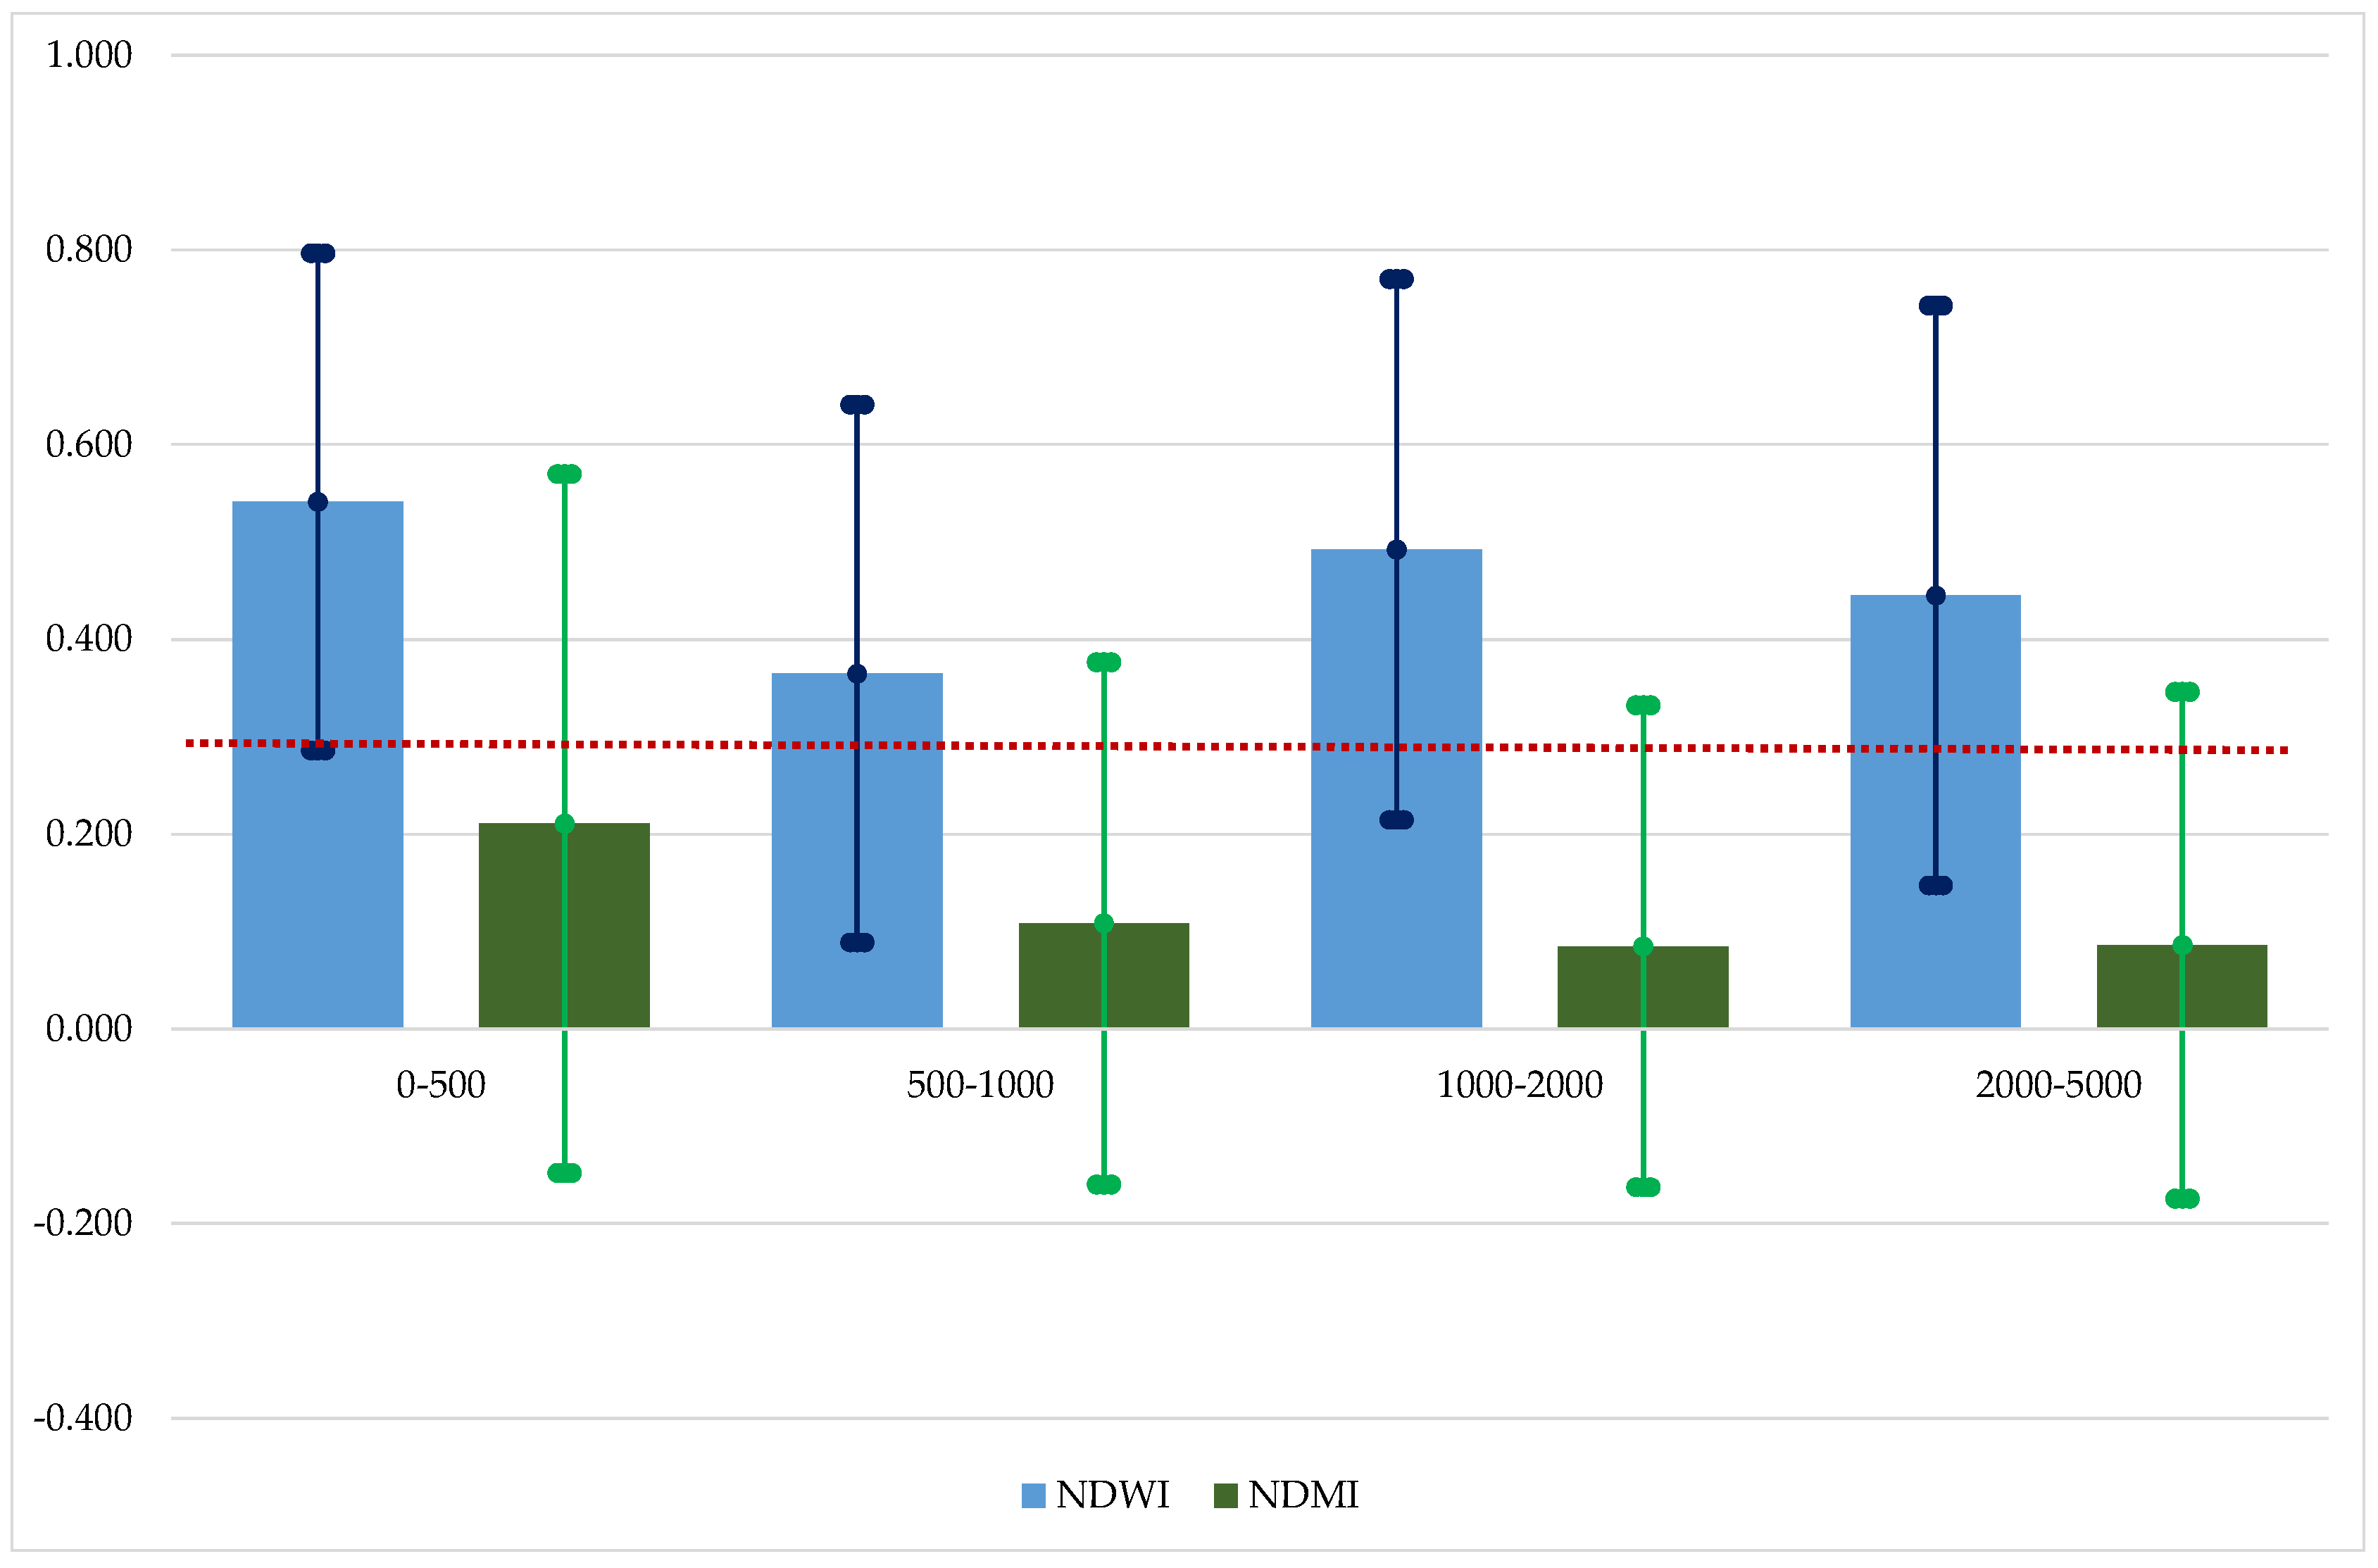
To quantify the impact of the floods in the surrounding area of the Mohenjo-Daro site, spatial statistics were applied to different ranges of buffer areas (0–500 m, 500–1000 m, 1000–2000 m, and 2000–5000 m) based on the NDWI and NDMI indices. These zones correspond to approximately 4.3, 4.3, 12.9, and 73.1 square kilometers of area, respectively, per zone, with a total area of interest of 94.64 square kilometers (see Figure 10). The results per buffer zone are depicted in Figure 11. The mean value and the standard deviation per distance from the site are shown in the specific graph. An empirical threshold around the value 0.30 is also plotted to illustrate values indicating the presence of water (>0.30 for both NDWI and NDMI). As shown, variations between the buffer zones exist. Nevertheless, we can conclude that the first zone in the close vicinity of the site (zone between 0–500 m) is highly affected by the floods, as this was estimated from both indices. Similar findings are also reported for the rest of the zones, with a small decline at the distance between 500 and 1000 m from the Mohenjo-Daro site.
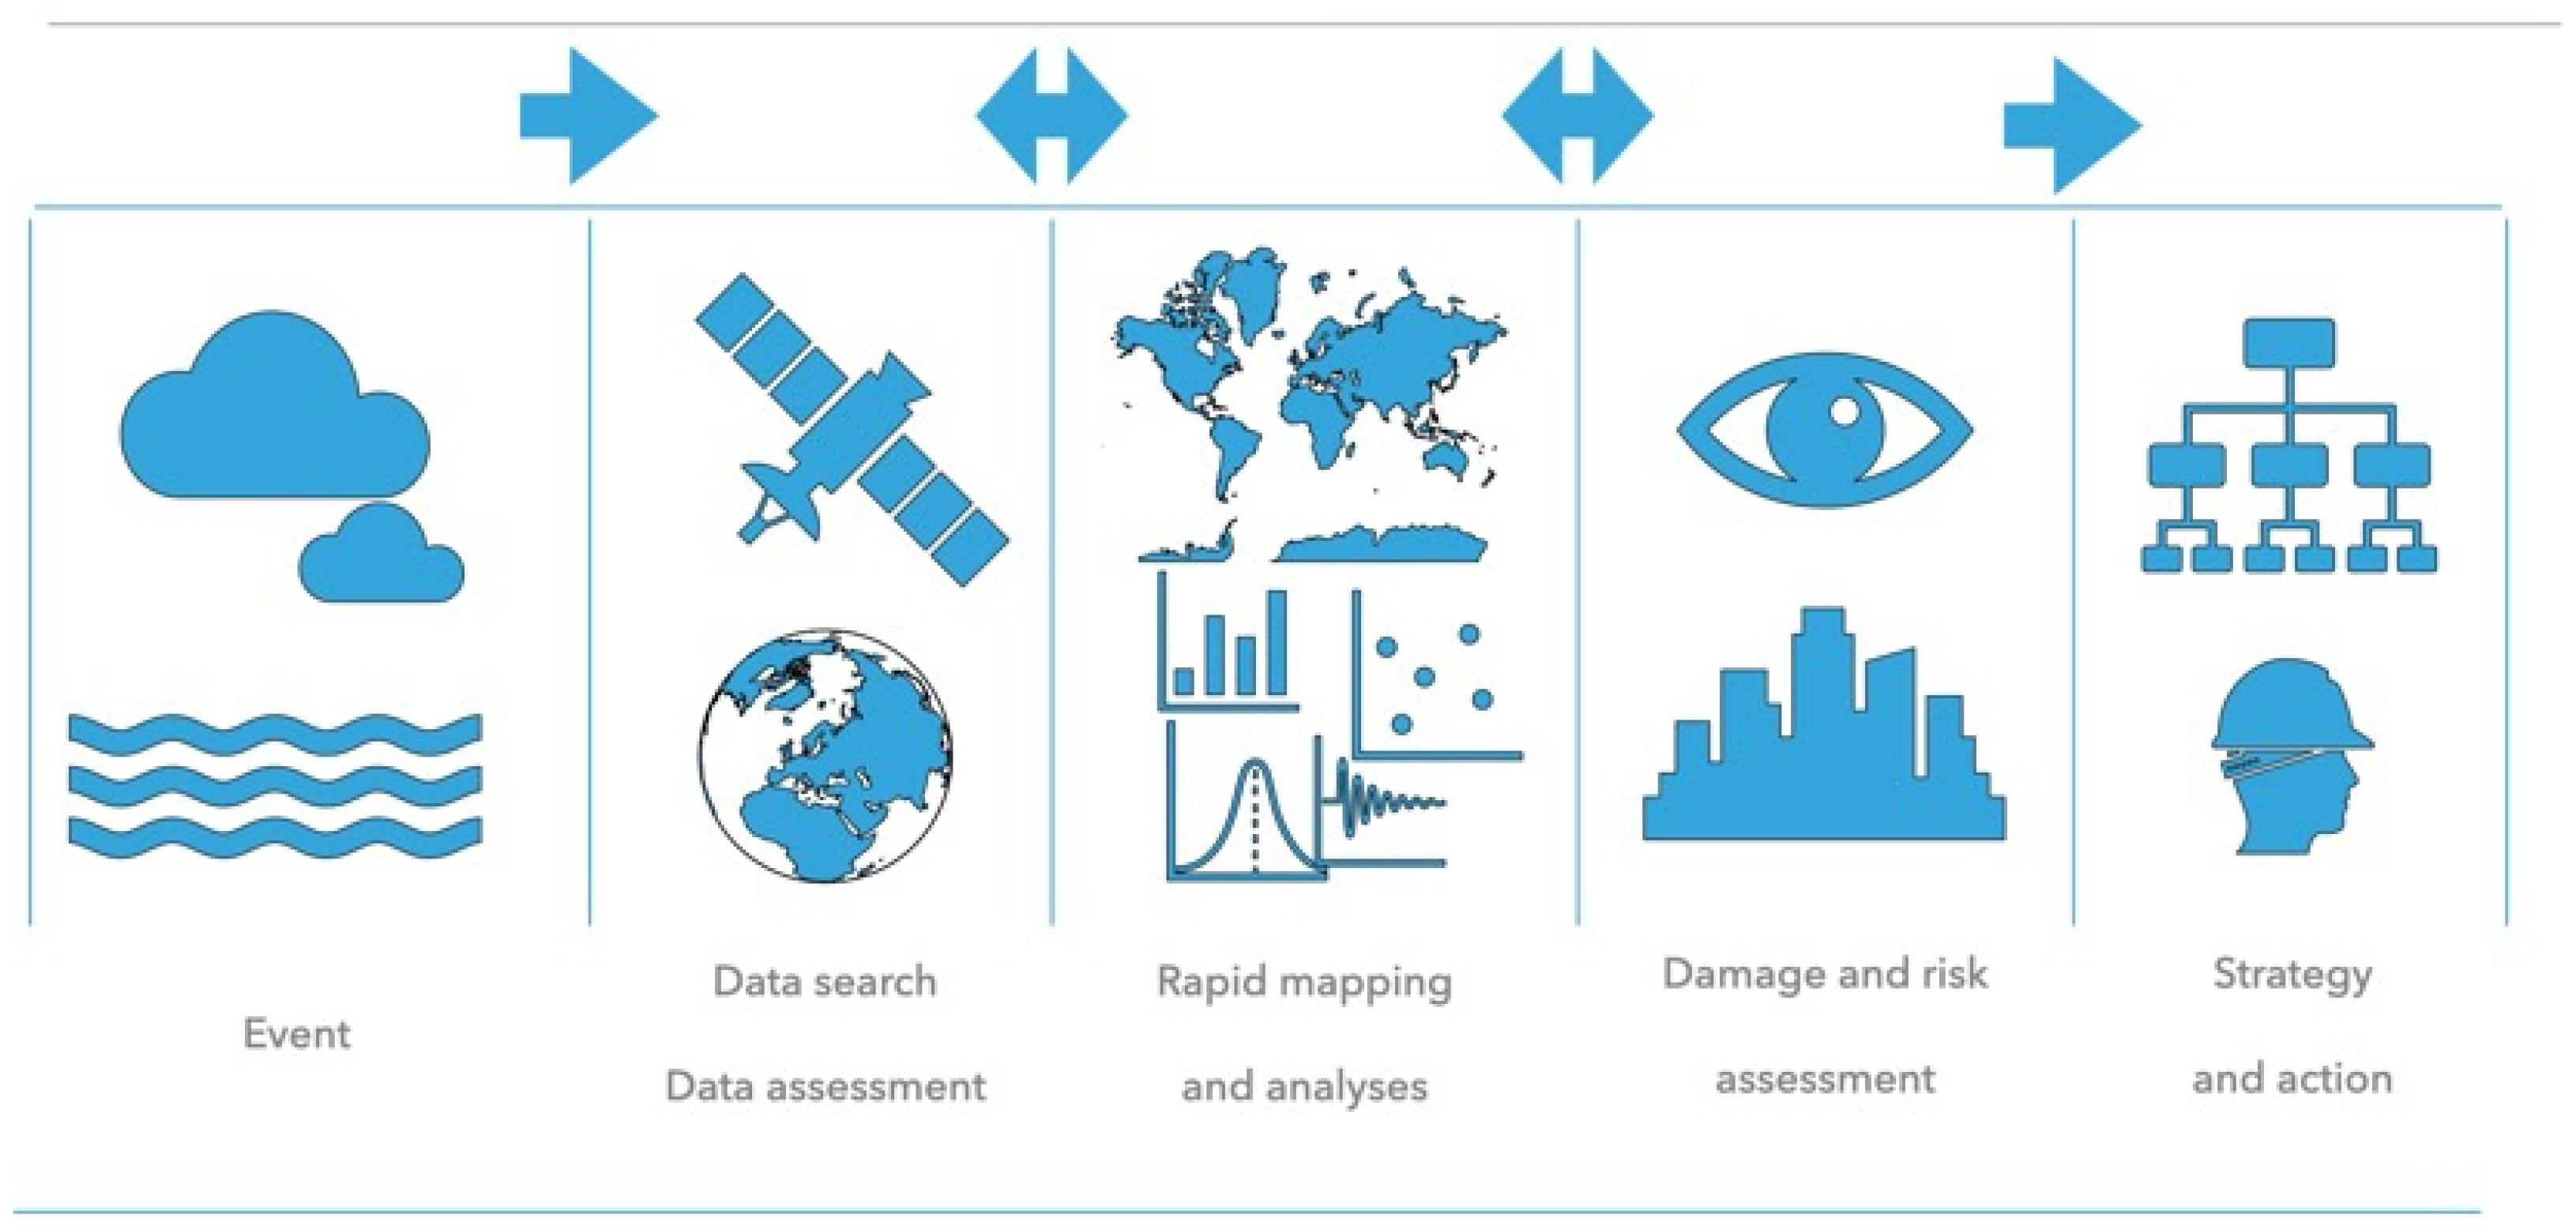
The observation via simple remote sensing techniques could result in a quick response by site management authorities (Figure 12). For example, in the case of Mohenjo-Daro, authorities could use the remote sensing data to delineate the areas most susceptible to flood damage. Additionally, the data could be used for creating better strategies for building protection structures such as covers, drains, etc. In addition to rapid assessment, remote sensing data can be used to better prioritize in situ interventions.
4. Conclusions
The current study demonstrates satellite remote sensing’s ability to rapidly assess hazardous situations endangering cultural heritage. The combination of Sentinel 1 and 2 (European Copernicus Program) products with contributing missions such as Planet Labs can be used successfully to assess and monitor flood events that can cause serious damage to any type of built heritage. We were able to highlight the most vulnerable regions within the UNESCO site of Mohenjo-Daro by using combined satellite remote sensing, which is now threatened even more by the unfortunate events of 2022, in addition to the existing faulty conservation programs. Flood damage within the boundaries and within the landscape of the Mohenjo-Daro archaeological site affects not only the cultural sector in Pakistan but also the tourism sector, as the prehistoric site was one of the country’s main tourist attractions. The observations and methodology of our study could be used further by both local institutions and international organizations to better strategize future heritage protection plans, as these events could occur at any time in the future due to climate change. Future studies can be focused on the automation of such rapid assessments, providing evidence of disturbed areas.
Author Contributions
Conceptualization, methodology, A.H. and A.A.; writing—original draft preparation, A.H. and A.A.; writing—review and editing, A.H. and A.A. All authors have read and agreed to the published version of the manuscript.
Funding
Part of the image processing and analysis in this study was funded by the ENSURE project (innovative survey techniques for detection of surface and sub-surface archaeological remains), the Cyprus University of Technology internal funding.
Institutional Review Board Statement
Not applicable.
Informed Consent Statement
Not applicable.
Data Availability Statement
Not applicable.
Acknowledgments
A.A. would like to acknowledge the ENSURE project (Innovative survey techniques for detection of surface and sub-surface archaeological remains, CUT internal funding). The authors would like to acknowledge the use of open access and freely distributed satellite datasets from Copernicus Open Access Hub (for Sentinel 2 images). The authors would like to acknowledge the use of educational and research access to satellite datasets from Planet Labs, through the Planet Explorer platform (https://www.planet.com/products/explorer/, accessed on 18 December 2022).
Conflicts of Interest
The authors declare no conflict of interest. The funders had no role in the design of the study; in the collection, analyses, or interpretation of data; in the writing of the manuscript; or in the decision to publish the results.
References
- Pakistan Floods 2022, Post-Disaster Needs Assessment, Ministry of Planning, Development and Special Initiatives, Main Report. 2022, p. 72. Available online: https://thedocs.worldbank.org/en/doc/4a0114eb7d1cecbbbf2f65c5ce0789db-0310012022/original/Pakistan-Floods-2022-PDNA-Main-Report.pdf (accessed on 18 December 2022).
- Jansen, M. Mohenjo-Daro, city of the Indus valley. Endeavour 1985, 9, 161–169. [Google Scholar] [CrossRef]
- Jansen, M. Mohenjo-daro: Type site of the earliest urbanization process in South Asia. Stud. Hist. Art 1993, 31, 35–51. [Google Scholar]
- Pruthi, R. Prehistory and Harappan Civilization; A.P.H Publishing Corporation: New Delhi, India, 2004. [Google Scholar]
- Goudie, A.S. Sodium sulphate weathering and the disintegration of Mohenjo-Daro, Pakistan. Earth Surf. Process. Landf. 1977, 2, 75–86. [Google Scholar] [CrossRef]
- Daly, P.; Feener, M.; Noboru, I.; Ibrahim, M.; Maida, I.; Alexandru, H.; Krisztina, B.; Jedrzej, M.; Benjamin, H. Challenges of Managing Maritime Cultural Heritage in Asia in the Face of Climate Change. Climate 2022, 10, 79. [Google Scholar] [CrossRef]
- Xu, X.; Sandwell, D.T.; Smith-Konter, B. Coseismic Displacements and Surface Fractures from Sentinel-1 InSAR: 2019 Ridgecrest Earthquakes. Seism. Res. Lett. 2020, 91, 1979–1985. [Google Scholar] [CrossRef]
- Ganas, A.; Kourkouli, P.; Briole, P.; Moshou, A.; Elias, P.; Parcharidis, I. Coseismic Displacements from Moderate-Size Earthquakes Mapped by Sentinel-1 Differential Interferometry: The Case of February 2017 Gulpinar Earthquake Sequence (Biga Peninsula, Turkey). Remote Sens. 2018, 10, 1089. [Google Scholar] [CrossRef] [Green Version]
- Funning, G.J.; Garcia, A. A systematic study of earthquake detectability using Sentinel-1 Interferometric Wide-Swath data. Geophys. J. Int. 2019, 216, 332–349. [Google Scholar] [CrossRef] [Green Version]
- Jelének, J.; Kopačková-Strnadová, V. Synergic use of Sentinel-1 and Sentinel-2 data for automatic detection of earthquake-triggered landscape changes: A case study of the 2016 Kaikoura earthquake (Mw 7.8), New Zealand. Remote Sens. Environ. 2021, 265, 112634. [Google Scholar] [CrossRef]
- Suresh, D.; Yarrakula, K. InSAR based deformation mapping of earthquake using Sentinel 1A imagery. Geocarto Int. 2019, 35, 559–568. [Google Scholar] [CrossRef]
- Li, Y.; Jiang, W.; Zhang, J.; Li, B.; Yan, R.; Wang, X. Sentinel-1 SAR-Based coseismic deformation monitoring service for rapid geodetic imaging of global earthquakes. Nat. Hazards Res. 2021, 1, 11–19. [Google Scholar] [CrossRef]
- Lu, C.-H.; Ni, C.-F.; Chang, C.-P.; Yen, J.-Y.; Chuang, R.Y. Coherence Difference Analysis of Sentinel-1 SAR Interferogram to Identify Earthquake-Induced Disasters in Urban Areas. Remote Sens. 2018, 10, 1318. [Google Scholar] [CrossRef]
- Bacques, G.; de Michele, M.; Foumelis, M.; Raucoules, D.; Lemoine, A.; Briole, P. Sentinel optical and SAR data highlights multi-segment faulting during the 2018 Palu-Sulawesi earthquake (Mw 7.5). Sci. Rep. 2020, 10, 9103. [Google Scholar] [CrossRef]
- Seydi, S.T.; Hasanlou, M.; Chanussot, J. Burnt-Net: Wildfire burned area mapping with single post-fire Sentinel-2 data and deep learning morphological neural network. Ecol. Indic. 2022, 140, 108999. [Google Scholar] [CrossRef]
- Gibson, R.; Danaher, T.; Hehir, W.; Collins, L. A remote sensing approach to mapping fire severity in south-eastern Australia using sentinel 2 and random forest. Remote Sens. Environ. 2020, 240, 111702. [Google Scholar] [CrossRef]
- Roteta, E.; Bastarrika, A.; Padilla, M.; Storm, T.; Chuvieco, E. Development of a Sentinel-2 burned area algorithm: Generation of a small fire database for sub-Saharan Africa. Remote Sens. Environ. 2019, 222, 1–17. [Google Scholar] [CrossRef]
- Navarro, G.; Caballero, I.; Silva, G.; Parra, P.-C.; Vázquez, Á.; Caldeira, R. Evaluation of forest fire on Madeira Island using Sentinel-2A MSI imagery. Int. J. Appl. Earth Obs. Geoinf. 2017, 58, 97–106. [Google Scholar] [CrossRef] [Green Version]
- Imperatore, P.; Azar, R.; Calo, F.; Stroppiana, D.; Brivio, P.A.; Lanari, R.; Pepe, A. Effect of the Vegetation Fire on Backscattering: An Investigation Based on Sentinel-1 Observations. IEEE J. Sel. Top. Appl. Earth Obs. Remote Sens. 2017, 10, 4478–4492. [Google Scholar] [CrossRef]
- Filipponi, F. BAIS2: Burned area index for Sentinel-2. Multidiscip. Digit. Publ. Inst. Proc. 2018, 2, 364. [Google Scholar]
- Agapiou, A.; Lysandrou, V.; Hadjimitsis, D.G. A European-scale investigation of soil erosion threat to subsurface archaeological remains. Remote Sens. 2020, 12, 675. [Google Scholar] [CrossRef] [Green Version]
- Graw, V.; Dedring, T.; Hiby, R.; Jara-Alvear, J.; Guzman, P.; Juergens, C. Regressive Erosion at River Coca in Northeast Ecuador: Landslide Monitoring with Sentinel-1 to Support Disaster Risk Management. PFG–J. Photogramm. Remote Sens. Geoinf. Sci. 2022, 90, 457–471. [Google Scholar] [CrossRef]
- Freihardt, J.; Frey, O. Assessing riverbank erosion in Bangladesh using time series of Sentinel-1 radar imagery in the Google Earth Engine. EGUsphere 2022, 1–26. [Google Scholar] [CrossRef]
- Agapiou, A.; Lysandrou, V. Remote Sensing Studies on Monitoring Natural Hazards Over Cultural Heritage Sites in Cyprus. In Applications of Space Techniques on the Natural Hazards in the MENA Region; Springer: Cham, Switzerland, 2022; pp. 167–194. [Google Scholar]
- Ma, P.; Zheng, Y.; Zhang, Z.; Wu, Z.; Yu, C. Building risk monitoring and prediction using integrated multi-temporal InSAR and numerical modeling techniques. Int. J. Appl. Earth Obs. Geoinf. 2022, 114, 103076. [Google Scholar] [CrossRef]
- Guzder-Williams, B.; Mackres, E.; Angel, S.; Blei, A.M.; Lamson-Hall, P. Intra-urban land use maps for a global sample of cities from Sentinel-2 satellite imagery and computer vision. Comput. Environ. Urban Syst. 2023, 100, 101917. [Google Scholar] [CrossRef]
- Orellana, F.; Moreno, M.; Yáñez, G. High-Resolution Deformation Monitoring from DInSAR: Implications for Geohazards and Ground Stability in the Metropolitan Area of Santiago, Chile. Remote Sens. 2022, 14, 6115. [Google Scholar] [CrossRef]
- Agapiou, A. Damage Proxy Map of the Beirut Explosion on 4th of August 2020 as Observed from the Copernicus Sensors. Sensors 2020, 20, 6382. [Google Scholar] [CrossRef]
- Esri Inc. ArcGIS Pro, Version 2.5; Esri Inc.: Redlands, CA, USA, 2020. Available online: https://www.esri.com/en-us/arcgis/products/arcgis-pro/overview (accessed on 18 December 2022).
- Gao, B.-C. NDWI—A normalized difference water index for remote sensing of vegetation liquid water from space. Remote Sens. Environ. 1996, 58, 257–266. [Google Scholar] [CrossRef]
- Xu, H. Modification of normalised difference water index (NDWI) to enhance open water features in remotely sensed imagery. Int. J. Remote Sens. 2006, 27, 3025–3033. [Google Scholar] [CrossRef]
- Jain, S.K.; Singh, R.D.; Jain, M.; Lohani, A.K. Delineation of Flood-Prone Areas Using Remote Sensing Techniques. Water Resour. Manag. 2005, 19, 333–347. [Google Scholar] [CrossRef]
- Dewan, A.M.; Islam, M.M.; Kumamoto, T.; Nishigaki, M. Evaluating Flood Hazard for Land-Use Planning in Greater Dhaka of Bangladesh Using Remote Sensing and GIS Techniques. Water Resour. Manag. 2006, 21, 1601–1612. [Google Scholar] [CrossRef]
- Khan, S.I.; Hong, Y.; Wang, J.; Yilmaz, K.K.; Gourley, J.J.; Adler, R.F.; Brakenridge, G.R.; Policelli, F.; Habib, S.; Irwin, D. Satellite Remote Sensing and Hydrologic Modeling for Flood Inundation Mapping in Lake Victoria Basin: Implications for Hydrologic Prediction in Ungauged Basins. IEEE Trans. Geosci. Remote Sens. 2011, 49, 85–95. [Google Scholar] [CrossRef] [Green Version]
- Sanyal, J.; Lu, X.X. Remote sensing and GIS-based flood vulnerability assessment of human settlements: A case study of Gangetic West Bengal, India. Hydrol. Process. 2005, 19, 3699–3716. [Google Scholar] [CrossRef]
- Samarasinghea, S.M.J.S.; Nandalalb, H.K.; Weliwitiyac, D.P.; Fowzed, J.S.M.; Hazarikad, M.K.; Samarakoond, L. Application of remote sensing and GIS for flood risk analysis: A case study at Kalu-Ganga River, Sri Lanka. Int. Arch. Photogramm. Remote Sens. Spat. Inf. Sci. 2010, 38, 110–115. [Google Scholar]
- Isma'il, M.; Saanyol, I.O. Application of remote sensing (RS) and geographic information systems (GIS) in flood vulnerability mapping: Case study of River Kaduna. Int. J. Geomat. Geosci. 2013, 3, 618–627. [Google Scholar]
- Sandholt, I.; Nyborg, L.; Fog, B.; Lô, M.; Bocoum, O.; Rasmussen, K. Remote sensing techniques for flood monitoring in the Senegal River Valley. Geogr. Tidsskr. J. Geogr. 2003, 103, 71–81. [Google Scholar] [CrossRef]
- Wanders, N.; Karssenberg, D.; De Roo, A.; De Jong, S.M.; Bierkens, M.F.P. The suitability of remotely sensed soil moisture for improving operational flood forecasting. Hydrol. Earth Syst. Sci. 2014, 18, 2343–2357. [Google Scholar] [CrossRef] [Green Version]
- Li, Y.; Grimaldi, S.; Walker, J.P.; Pauwels, V.R.N. Application of Remote Sensing Data to Constrain Operational Rainfall-Driven Flood Forecasting: A Review. Remote Sens. 2016, 8, 456. [Google Scholar] [CrossRef] [Green Version]
- Grimaldi, S.; Li, Y.; Pauwels, V.R.N.; Walker, J.P. Remote Sensing-Derived Water Extent and Level to Constrain Hydraulic Flood Forecasting Models: Opportunities and Challenges. Surv. Geophys. 2016, 37, 977–1034. [Google Scholar] [CrossRef]
- Lopez, T.; Al Bitar, A.; Biancamaria, S.; Güntner, A.; Jäggi, A. On the Use of Satellite Remote Sensing to Detect Floods and Droughts at Large Scales. Surv. Geophys. 2020, 41, 1461–1487. [Google Scholar] [CrossRef]
- Munawar, H.S.; Hammad, A.W.A.; Waller, S.T. Remote Sensing Methods for Flood Prediction: A Review. Sensors 2022, 22, 960. [Google Scholar] [CrossRef]
- Bindlish, R.; Crow, W.T.; Jackson, T.J. Role of Passive Microwave Remote Sensing in Improving Flood Forecasts. IEEE Geosci. Remote Sens. Lett. 2008, 6, 112–116. [Google Scholar] [CrossRef]
- Tao, T.; Kouwen, N. Remote Sensing and Fully Distributed Modeling for Flood Forecasting. J. Water Resour. Plan. Manag. 1989, 115, 809–823. [Google Scholar] [CrossRef]
- Klemas, V. Remote Sensing of Floods and Flood-Prone Areas: An Overview. J. Coast. Res. 2015, 314, 1005–1013. [Google Scholar] [CrossRef] [Green Version]
- Hapuarachchi, H.A.P.; Wang, Q.J.; Pagano, T.C. A review of advances in flash flood forecasting. Hydrol. Process. 2011, 25, 2771–2784. [Google Scholar] [CrossRef]
- Revilla-Romero, B.; Hirpa, F.A.; del Pozo Pozo, J.T.; Salamon, P.; Brakenridge, R.; Pappenberger, F.; De Groeve, T. On the Use of Global Flood Forecasts and Satellite-Derived Inundation Maps for Flood Monitoring in Data-Sparse Regions. Remote Sens. 2015, 7, 15702–15728. [Google Scholar] [CrossRef]
- Gu, Y.; Chen, Y.; Sun, H.; Liu, J. Remote Sensing-Supported Flood Forecasting of Urbanized Watersheds—A Case Study in Southern China. Remote Sens. 2022, 14, 6129. [Google Scholar] [CrossRef]
- Zaji, A.H.; Bonakdari, H.; Gharabaghi, B. Remote Sensing Satellite Data Preparation for Simulating and Forecasting River Discharge. IEEE Trans. Geosci. Remote Sens. 2018, 56, 3432–3441. [Google Scholar] [CrossRef]
- Du, J.; Kimball, J.S.; Sheffield, J.; Pan, M.; Fisher, C.K.; Beck, H.E.; Wood, E.F. Satellite flood inundation assessment and forecast using SMAP and landsat. IEEE J. Sel. Top. Appl. Earth Obs. Remote Sens. 2021, 14, 6707–6715. [Google Scholar] [CrossRef]
- Schumann, G.; Bates, P.D.; Apel, H.; Aronica, G.T. Global flood hazard mapping, modeling, and forecasting: Challenges and perspectives. In Global Flood Hazard; Wiley Online Library: Hoboken, NJ, USA, 2018; pp. 239–244. [Google Scholar]
- Schumann, G.J.-P.; Neal, J.C.; Voisin, N.; Andreadis, K.M.; Pappenberger, F.; Phanthuwongpakdee, N.; Hall, A.C.; Bates, P.D. A first large-scale flood inundation forecasting model. Water Resour. Res. 2013, 49, 6248–6257. [Google Scholar] [CrossRef]
- Webster, P.J.; Toma, V.E.; Kim, H.-M. Were the 2010 Pakistan floods predictable? Geophys. Res. Lett. 2011, 38, 1–5. [Google Scholar] [CrossRef]
- Kirsch, T.D.; Wadhwani, C.; Sauer, L.; Doocy, S.; Catlett, C. Impact of the 2010 Pakistan Floods on Rural and Urban Populations at Six Months. PLoS Curr. 2012, 4, e4fdfb212d2432. [Google Scholar] [CrossRef]
- Haq, M.; Akhtar, M.; Muhammad, S.; Paras, S.; Rahmatullah, J. Techniques of Remote Sensing and GIS for flood monitoring and damage assessment: A case study of Sindh province, Pakistan. Egypt. J. Remote Sens. Space Sci. 2012, 15, 135–141. [Google Scholar] [CrossRef] [Green Version]
- Shabir, O.; Frison, S.; Smith, J.; Blanchet, K. A Summary Case Report on the Health Impacts and Response to the Pakistan Floods of 2010. PLoS Curr. 2013, 5, 1–2. [Google Scholar] [CrossRef] [PubMed]
- Murthy, D.; Longwell, S.A. Twitter and disasters: The uses of Twitter during the 2010 Pakistan floods. Inf. Commun. Soc. 2013, 16, 837–855. [Google Scholar] [CrossRef]
- Martius, O.; Sodemann, H.; Joos, H.; Pfahl, S.; Winschall, A.; Crocimaspoli, M.; Graf, M.J.; Madonna, E.; Mueller, B.; Schemm, S.; et al. The role of upper-level dynamics and surface processes for the Pakistan flood of July 2010. Q. J. R. Meteorol. Soc. 2012, 139, 1780–1797. [Google Scholar] [CrossRef]
- van der Schrier, G.; Rasmijn, L.M.; Barkmeijer, J.; Sterl, A.; Hazeleger, W. The 2010 Pakistan floods in a future climate. Clim. Chang. 2018, 148, 205–218. [Google Scholar] [CrossRef]
- Memon, A.A.; Muhammad, S.; Rahman, S.; Haq, M. Flood monitoring and damage assessment using water indices: A case study of Pakistan flood-2012. Egypt. J. Remote Sens. Space Sci. 2015, 18, 99–106. [Google Scholar] [CrossRef] [Green Version]
- Oxley, M. Field note from Pakistan floods: Preventing future flood disasters. Jàmbá J. Disaster Risk Stud. 2011, 3, 453–463. [Google Scholar] [CrossRef]
- Turner, G.; Said, F.; Afzal, U.; Campbell, K. The Effect of Early Flood Warnings on Mitigation and Recovery During the 2010 Pakistan Floods. In Reducing disaster: Early Warning Systems for Climate Change; Springer: Dordrecht, The Netherlands, 2014; pp. 249–264. [Google Scholar]
- HA, A. Pakistan’s floods have displaced 32 million people—How researchers are helping. Nature 2022, 609, 667. [Google Scholar]
- Bhutta, Z.A.; Bhutta, S.Z.; Raza, S.; Sheikh, A.T. Addressing the human costs and consequences of the Pakistan flood disaster. Lancet 2022, 400, 1287–1289. [Google Scholar] [CrossRef]
- Devi, S. Pakistan floods: Impact on food security and health systems. Lancet 2022, 400, 799–800. [Google Scholar] [CrossRef]
- Wyns, A. Disaster diplomacy in the wake of the 2022 Pakistan floods. Lancet Planet. Health 2022, 6, e855–e856. [Google Scholar] [CrossRef] [PubMed]
- Fahad, S.; Wang, J. Climate change, vulnerability, and its impacts in rural Pakistan: A review. Environ. Sci. Pollut. Res. 2020, 27, 1334–1338. [Google Scholar] [CrossRef] [PubMed]
- Hussain, M.; Butt, A.R.; Uzma, F.; Ahmed, R.; Irshad, S.; Rehman, A.; Yousaf, B. A comprehensive review of climate change impacts, adaptation, and mitigation on environmental and natural calamities in Pakistan. Environ. Monit. Assess. 2019, 192, 48. [Google Scholar] [CrossRef] [PubMed]
- Rana, I.A.; Asim, M.; Aslam, A.B.; Jamshed, A. Disaster management cycle and its application for flood risk reduction in urban areas of Pakistan. Urban Clim. 2021, 38, 100893. [Google Scholar] [CrossRef]
Figure 1.
Images produced by Joshua Stevens from NASA Earth Observatory in the aftermath of the floods. The image source can be found at the following link: https://earthobservatory.nasa.gov/images/150279/devastating-floods-in-pakistan, accessed on 18 December 2022).
Figure 1.
Images produced by Joshua Stevens from NASA Earth Observatory in the aftermath of the floods. The image source can be found at the following link: https://earthobservatory.nasa.gov/images/150279/devastating-floods-in-pakistan, accessed on 18 December 2022).

Figure 2.
The position of Sentinel-1 datasets (red polygon) over Pakistan borders. The black dot represents the position of Mohenjo-Daro archaeological site. Sentinel 2 and Planet Lab image footprints are depicted with blue and green color, respectively.
Figure 2.
The position of Sentinel-1 datasets (red polygon) over Pakistan borders. The black dot represents the position of Mohenjo-Daro archaeological site. Sentinel 2 and Planet Lab image footprints are depicted with blue and green color, respectively.

Figure 3.
RGB composites based on Sentinel-1 data from May 2, August 18, September 10, and September 11. The top-left image was created by combining data from May 2 with data from August 18; the top-right image was created by combining data from August 18 and August 30; the bottom-left image is an RGB composite created by combining data from August 30 and September 11; and the bottom-right image is a zoom-in for the top-right image—the red rectangle represents the zoomed area, and the yellow polygon represents the position of the Mojenjo-Daro site.

Figure 4.
Planet NIR-R-G pseudo color composite around the UNESCO site of Mohenjo-Daro (in circle).

Figure 5.
Sentinel 2 NDMI result around the UNESCO site of Mohenjo-Daro (in circle).

Figure 6.
Sentinel 2 NDWI results around the UNESCO site of Mohenjo-Daro (in the circle) (top) and the same result from the Planet image (bottom).
Figure 6.
Sentinel 2 NDWI results around the UNESCO site of Mohenjo-Daro (in the circle) (top) and the same result from the Planet image (bottom).

Figure 7.
(a) High-resolution image of the UNESCO site of Mohenjo-Daro (source: ArcGIS Pro). (b) NDMI using the Sentinel 2 image. (c) NDWI using the Sentinel 2 image. (d) NDVI using the Sentinel 2 image.
Figure 7.
(a) High-resolution image of the UNESCO site of Mohenjo-Daro (source: ArcGIS Pro). (b) NDMI using the Sentinel 2 image. (c) NDWI using the Sentinel 2 image. (d) NDVI using the Sentinel 2 image.

Figure 8.
High resolution Google Earth image from September 2022 showing the affected areas of the sites in terms of both high moisture level and floods. The areas depicted in blue are the most sensitive regions of the site.
Figure 8.
High resolution Google Earth image from September 2022 showing the affected areas of the sites in terms of both high moisture level and floods. The areas depicted in blue are the most sensitive regions of the site.

Figure 9.
Top: Selected areas within or in proximity of the UNESCO site of Mohenjo-Daro. Area 1 is a location with levels of moisture as indicated by the evaluation of Sentinel-2 and Planet images, area 2 a bare soil area within the case study, area 3 a moisture area outside the site. and area 4 a vegetated zone. Bottom: Spectral profiles of these four areas in all eight spectral bands of the Planet image.

Figure 10.
Buffer zones around the Mohenjo-Daro at 0–500, 500–1000, 1000–2000, and 2000–5000 m for the purposes of statical analysis as mentioned in the text.
Figure 10.
Buffer zones around the Mohenjo-Daro at 0–500, 500–1000, 1000–2000, and 2000–5000 m for the purposes of statical analysis as mentioned in the text.

Figure 11.
Zonal statistics for areas at 0–500, 500–1000, 1000–2000, and 2000–5000 m around the site. Mean values for both the NDWI and NDMI indices, along with their standard deviation, are depicted. An empirical threshold of 0.30 indicating the presence of water is also drawn (red dashed line).
Figure 11.
Zonal statistics for areas at 0–500, 500–1000, 1000–2000, and 2000–5000 m around the site. Mean values for both the NDWI and NDMI indices, along with their standard deviation, are depicted. An empirical threshold of 0.30 indicating the presence of water is also drawn (red dashed line).

Figure 12.
Diagram showing the simple steps from remote sensing analysis to a sustainable fast action response to protect endangered archaeological sites.
Figure 12.
Diagram showing the simple steps from remote sensing analysis to a sustainable fast action response to protect endangered archaeological sites.


Table 1.
General identification details about the Sentinel-1 datasets used for flood detection within this study.
Table 1.
General identification details about the Sentinel-1 datasets used for flood detection within this study.
| Sentinel 1 | Mission/Product Type/ File Name | Acquisition Mode/Pass/Track/ Orbit | Polarization |
|---|---|---|---|
| Dataset 1 02/05/2022 | Sentinel-1 A | IW | |
| ground range (GRD) | Descending | VV + VH | |
| S1A_IW_GRDH_1SDV_20220502T012543_20220502T012608_043025_052323_612F | 78 43,025 | ||
| Dataset 2 18/08/2022 | Sentinel-1 A | IW | |
| ground range (GRD) | Descending | VV + VH | |
| S1A_IW_GRDH_1SDV_20220818T012550_20220818T012615_044600_0552D9_EDA4 | 78 44,600 | ||
| Dataset 3 30/08/2022 | Sentinel-1 A | IW | |
| ground range (GRD) | Descending | VV + VH | |
| S1A_IW_GRDH_1SDV_20220830T012551_20220830T012616_044775_0558C6_E8B2 | 78 43,775 | ||
| Dataset 4 11/09/2022 | Sentinel-1 A | IW | |
| ground range (GRD) | Descending | VV + VH | |
| S1A_IW_GRDH_1SDV_20220911T012551_20220911T012616_044950_055EA1_56C8 | 78 44,950 |
Disclaimer/Publisher’s Note: The statements, opinions and data contained in all publications are solely those of the individual author(s) and contributor(s) and not of MDPI and/or the editor(s). MDPI and/or the editor(s) disclaim responsibility for any injury to people or property resulting from any ideas, methods, instructions or products referred to in the content. |
© 2023 by the authors. Licensee MDPI, Basel, Switzerland. This article is an open access article distributed under the terms and conditions of the Creative Commons Attribution (CC BY) license (https://creativecommons.org/licenses/by/4.0/).
Share and Cite
MDPI and ACS Style
Hegyi, A.; Agapiou, A. Rapid Assessment of 2022 Floods around the UNESCO Site of Mohenjo-Daro in Pakistan by Using Sentinel and Planet Labs Missions. Sustainability 2023, 15, 2084. https://doi.org/10.3390/su15032084
AMA Style
Hegyi A, Agapiou A. Rapid Assessment of 2022 Floods around the UNESCO Site of Mohenjo-Daro in Pakistan by Using Sentinel and Planet Labs Missions. Sustainability. 2023; 15(3):2084. https://doi.org/10.3390/su15032084
Chicago/Turabian StyleHegyi, Alexandru, and Athos Agapiou. 2023. "Rapid Assessment of 2022 Floods around the UNESCO Site of Mohenjo-Daro in Pakistan by Using Sentinel and Planet Labs Missions" Sustainability 15, no. 3: 2084. https://doi.org/10.3390/su15032084
Note that from the first issue of 2016, this journal uses article numbers instead of page numbers. See further details here.