Article

Investigation of Thermochemical Properties and Pyrolysis of Barley Waste as a Source for Renewable Energy

1
Department of Civil Engineering, Faculty of Science and Engineering, East West University, Jahurul Islam City, Aftabnagar, Dhaka 1212, Bangladesh
2
Department of Mechanical and Mechatronics Engineering, Faculty of Engineering, Prince of Songkla University, Hatyai 90112, Thailand
3
Faculty of Integrated Technologies, Universiti Brunei Darussalam, Jalan Tungku Link, Gadong BE1410, Brunei
4
School of Chemistry, Joseph Black Building, University of Glasgow, Glasgow G128QQ, UK
5
Department of Chemical Engineering, Bangladesh University of Engineering and Technology, Dhaka 1000, Bangladesh
6
Department of Textile Engineering, Daffodil International University, Dhaka 1341, Bangladesh
7
Department of Chemical Engineering, Zhengzhou University, Zhengzhou 450001, China
*
Authors to whom correspondence should be addressed.
Sustainability 2023, 15(2), 1643; https://doi.org/10.3390/su15021643
Submission received: 13 December 2022 / Revised: 10 January 2023 / Accepted: 12 January 2023 / Published: 14 January 2023

Abstract

:
Energy consumption is rising dramatically at the price of depleting fossil fuel supplies and rising greenhouse gas emissions. To resolve this crisis, barley waste, which is hazardous for the environment and landfill, was studied through thermochemical characterization and pyrolysis to use it as a feedstock as a source of renewable energy. According to proximate analysis, the concentrations of ash, volatile matter, fixed carbon, and moisture were 5.43%, 73.41%, 18.15%, and 3.01%, consecutively. The ultimate analysis revealed that the composition included an acceptable H/C, O/C, and (N+O)/C atomic ratio, with the carbon, hydrogen, nitrogen, sulfur, and oxygen amounts being 46.04%, 6.84%, 3.895%, and 0.91%, respectively. The higher and lower heating values of 20.06 MJ/kg and 18.44 MJ/kg correspondingly demonstrate the appropriateness and promise for the generation of biofuel effectively. The results of the morphological study of biomass are promising for renewable energy sources. Using Fourier transform infrared spectroscopy, the main link between carbon, hydrogen, and oxygen was discovered, which is also important for bioenergy production. The maximum degradation rate was found by thermogravimetric analysis and derivative thermogravimetry to be 4.27% per minute for pyrolysis conditions at a temperature of 366 °C and 5.41% per minute for combustion conditions at a temperature of 298 °C. The maximum yields of biochar (38.57%), bio-oil (36.79%), and syngas (40.14%) in the pyrolysis procedure were obtained at 400, 500, and 600 °C, respectively. With the basic characterization and pyrolysis yields of the raw materials, it can be concluded that barley waste can be a valuable source of renewable energy. Further analysis of the pyrolyzed products is recommended to apply in the specific energy fields.

1. Introduction

Energy is one of the most important commodities for humanity, creating a strong bond between nature and life. There are no alternatives to energy for the social and economic development of a country; i.e., the requirements for energy are escalating day by day. The main energy source is the burning of fossil fuels, which enhances greenhouse gas emissions, especially carbon dioxide (CO2) [1]. Considering the effects of global environmental alteration and humanity’s ecological obligation, the necessity of renewable energy sources becomes unavoidable. Also, lessening fossil fuel reserves forces researchers to seek energy from renewable energy resources that should be environmentally friendly and economically beneficial [2]. To address these issues, renewable energy sources such as biomass, wind, sun, geothermal, and tidal power can be exploited. Among these sources, biomass to bioenergy conversion is particularly promising for minimizing waste and converting the waste into valuable energy products [3].
The major biomass sources are municipal waste, agricultural residues, food waste, and wood waste, which are rising with time [4]. The growth of biomass waste in landfills poses high risks to the environment and human health by producing greenhouse gases and toxic leachate which go toward the surface and groundwater [5]. Agricultural wastes can also be managed by burning, which is prohibited in many areas due to its ecological risk [6]. Action is highly required to minimize the impact of agricultural waste on landfills by recycling or converting it into valuable products. In this context, biomass conversion techniques can be applied to utilize lignocellulosic waste materials for producing valuable energy products and other usable materials [7]. Biofuel technologies are one of the best methodologies to convert these wastes into bioenergy as a renewable energy resource [8].
To convert biomass into bioenergy materials, the thermochemical or biochemical conversion processes are normally applied. The thermochemical process involves heat, and the biochemical process involves enzymes. Among these processes, thermochemical conversion is the easiest and most appropriate technique for transforming biomass into bioenergy compared with the biochemical process [9]. Also, in the thermochemical process, the complex compounds of the raw materials can easily be decomposed, whereas this is tough in the biochemical process [10].
The thermochemical process includes pyrolysis, combustion, and gasification and is hydrothermal, where pyrolysis is more convenient since it has numerous advantages in storage, transportation, and flexibility in solicitation [11]. In the pyrolysis process, biochar, bio-oil, and syngas are three primary products produced from biomass. Typically, biochar is used for heat generation, soil development, CO2 detention, and activated carbon (AC) preparation [12,13]. AC is useful for water/air purification applications due to its large surface area, high porosity, and strong mechanical stability [14,15]. The bio-oils can be applied as a low-grade fuel for heat energy generation and fuel in a diesel engine after purification. Upon upgrading and refining, the syngas is used in the gas generator and the fuel cell to produce power and electricity [16].
Barley waste is one of the most abundant residues generated by the food industry. The amount of this waste can be up to 85% of the total by-products [17]. Every year, millions of tons of barley waste are produced by the food industries, which has a negative impact on management from both ecological and economical points of view [18]. Most wastes are thrown away or burned, which depletes resources and pollutes the environment by releasing greenhouse gases (CO2, N2O, and CH4) and other air pollutants. Utilizing the waste biomass can alleviate the energy crisis as well as pollution issues [19]. The primary focus of this work is on barley waste, which is a readily available feedstock for pyrolysis among other forms of biomass. The aim of this research is to characterize and pyrolyze barley waste to evaluate the potentiality for the production of biofuels as a substitute for renewable energy sources.

2. Experimental

The American Society for Testing and Materials (ASTM) methods were used for the materials preparation and the characterization of the barley waste sample. It is a global standards organization that develops and disseminates the technical standards for a variety of components, systems, and services. For the basic characterization of any biomass sample, the ASTM is widely used [20,21].

2.1. Sample Collection and Preparation

The barley waste sample was prepared following the American Society Testing and Material (ASTM E1757-01) method. The waste sample was collected from a local firm in the UK. After collection, it was cleaned properly with water to remove the dirt and kept under sunlight for one week. Then, the samples were placed inside the oven at 100 °C for 6 h to eliminate the moisture properly. The samples were then ground into small particles. Finally, the ground barley was sieved using a regular sieve No. 60 to obtain particles smaller than 0.25 mm and sealed in a sealed bag to avoid air interaction. The sample processing diagram used in this research is shown in Figure 1.

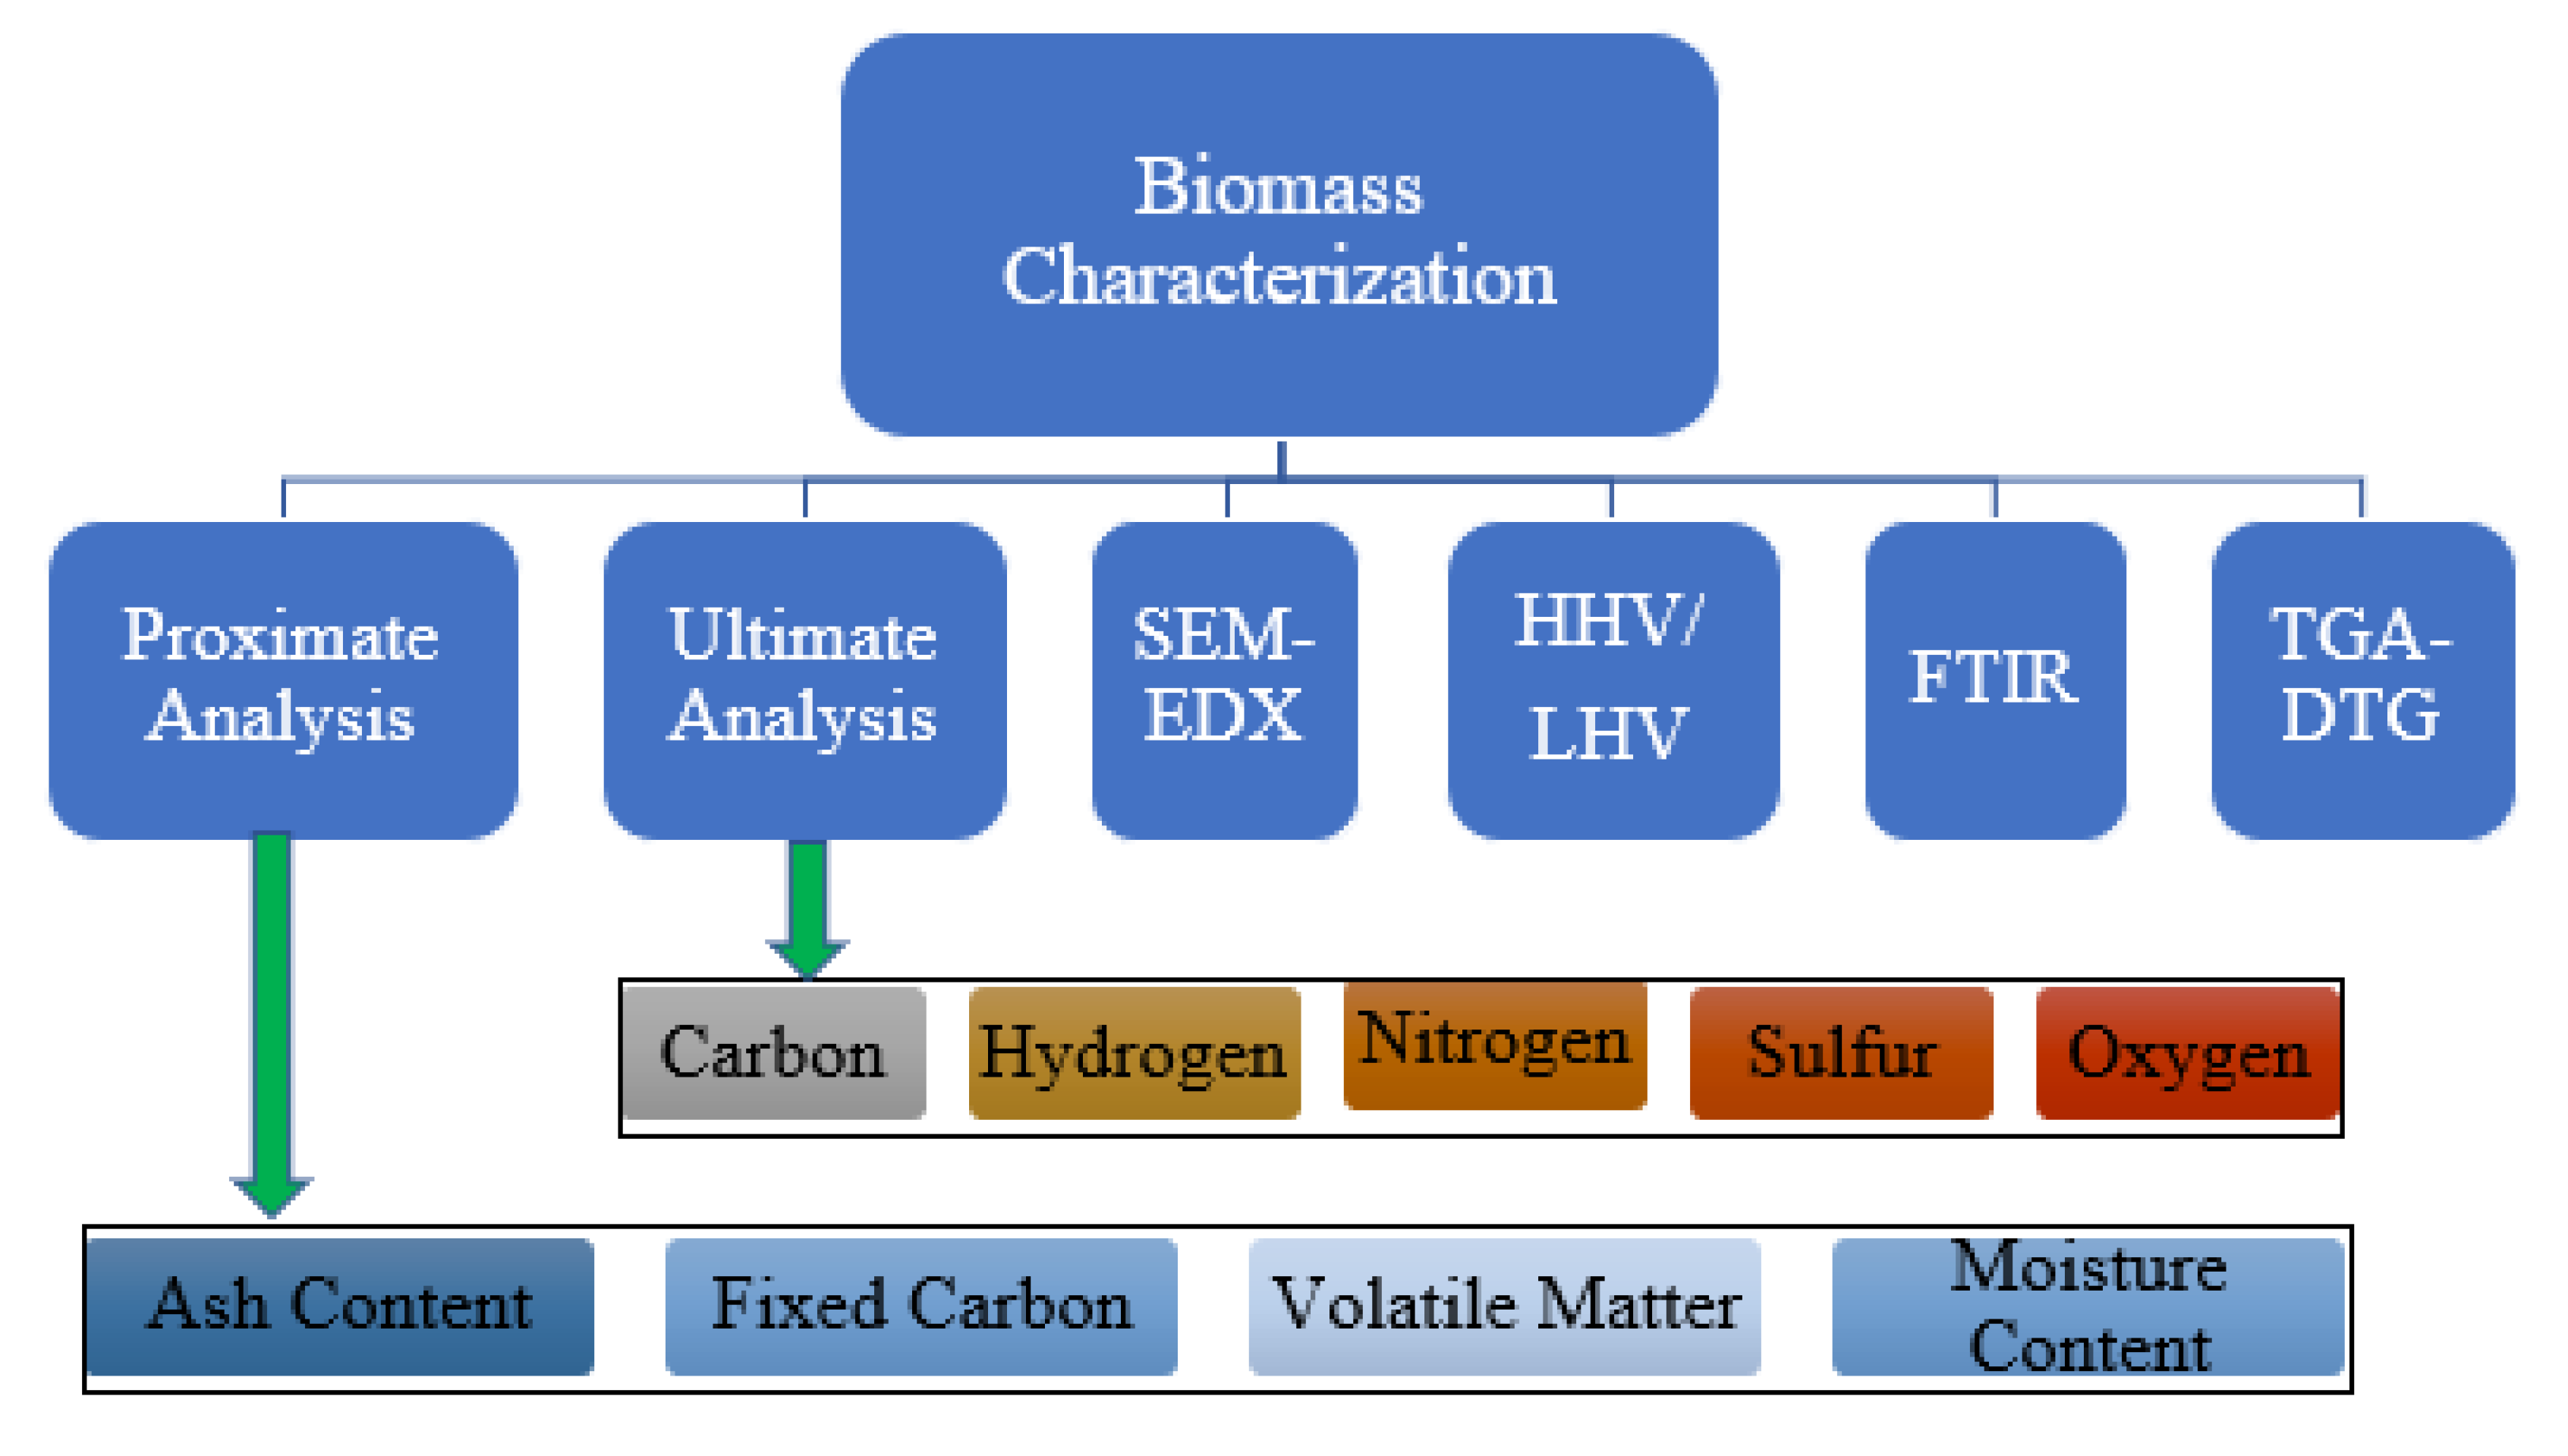
2.2. Biomass Characterization

The analysis of the characteristics of the barley waste biomass sample is illustrated in Figure 2.

2.3. Proximate Analysis

Proximate analysis is one of the most crucial techniques for determining the qualities of biomass, including moisture content (MC), volatile matter (VM), fixed carbon (FC), and ash content (AC), as a source of energy. The proximate analysis of barley waste samples was evaluated using the ASTM methods. Around 1 g of biomass was used as the sample for each experiment. All of the tests were repeated three times, with the average findings presented.
The ASTM D 3173-11 methods [22] were used to measure the moisture content (MC). The proportion of MC was measured by Equation (1).
MC   ( % ) = 100   ×   Biomass   weight   before   dry     Biomass   weight   after   dry   Biomass   weight   before   dry
ASTM D 3175-07 methods [23] were used to compute the ratio of volatile matter (VM) in the sample by Equations (2) and (3).
Weight   loss   ( % ) = Biomass   weight   before   heating     Residue   weight   after   heating Biomass   weight   before   heating   ×   100
VM (%) = Weight loss (%) − MC (%)
Ash content (AC) of the biomass was measured as per the process of ASTM D 3174-04 [24] by Equation (4), and the fixed carbon (FC) content was measured by Equation (5).
AC   ( % ) = 100 {   Sample   weight   before   heating   Residue   weight Sample   weight   before   heating   } ×   100
FC (%) = 100 − {MC (%) + VM (%) + AC (%)}

2.4. Ultimate Analysis

The ultimate analysis of the biomass was accompanied by a CHNS analyzer, CE Instruments (Flash EA 1112 Series) manufactured by Thermo Quest, Italy, in the science equipment center at Prince of Songkla University (PSU), Hat Tai, Thailand. This method was used to evaluate the weight proportions of carbon, hydrogen, nitrogen, and sulfur. The Equation (6) was used to calculate the oxygen content.
Oxygen (%) = 100 − [Carbon (%) + Nitrogen (%) + Hydrogen (%) + Sulfur (%)]

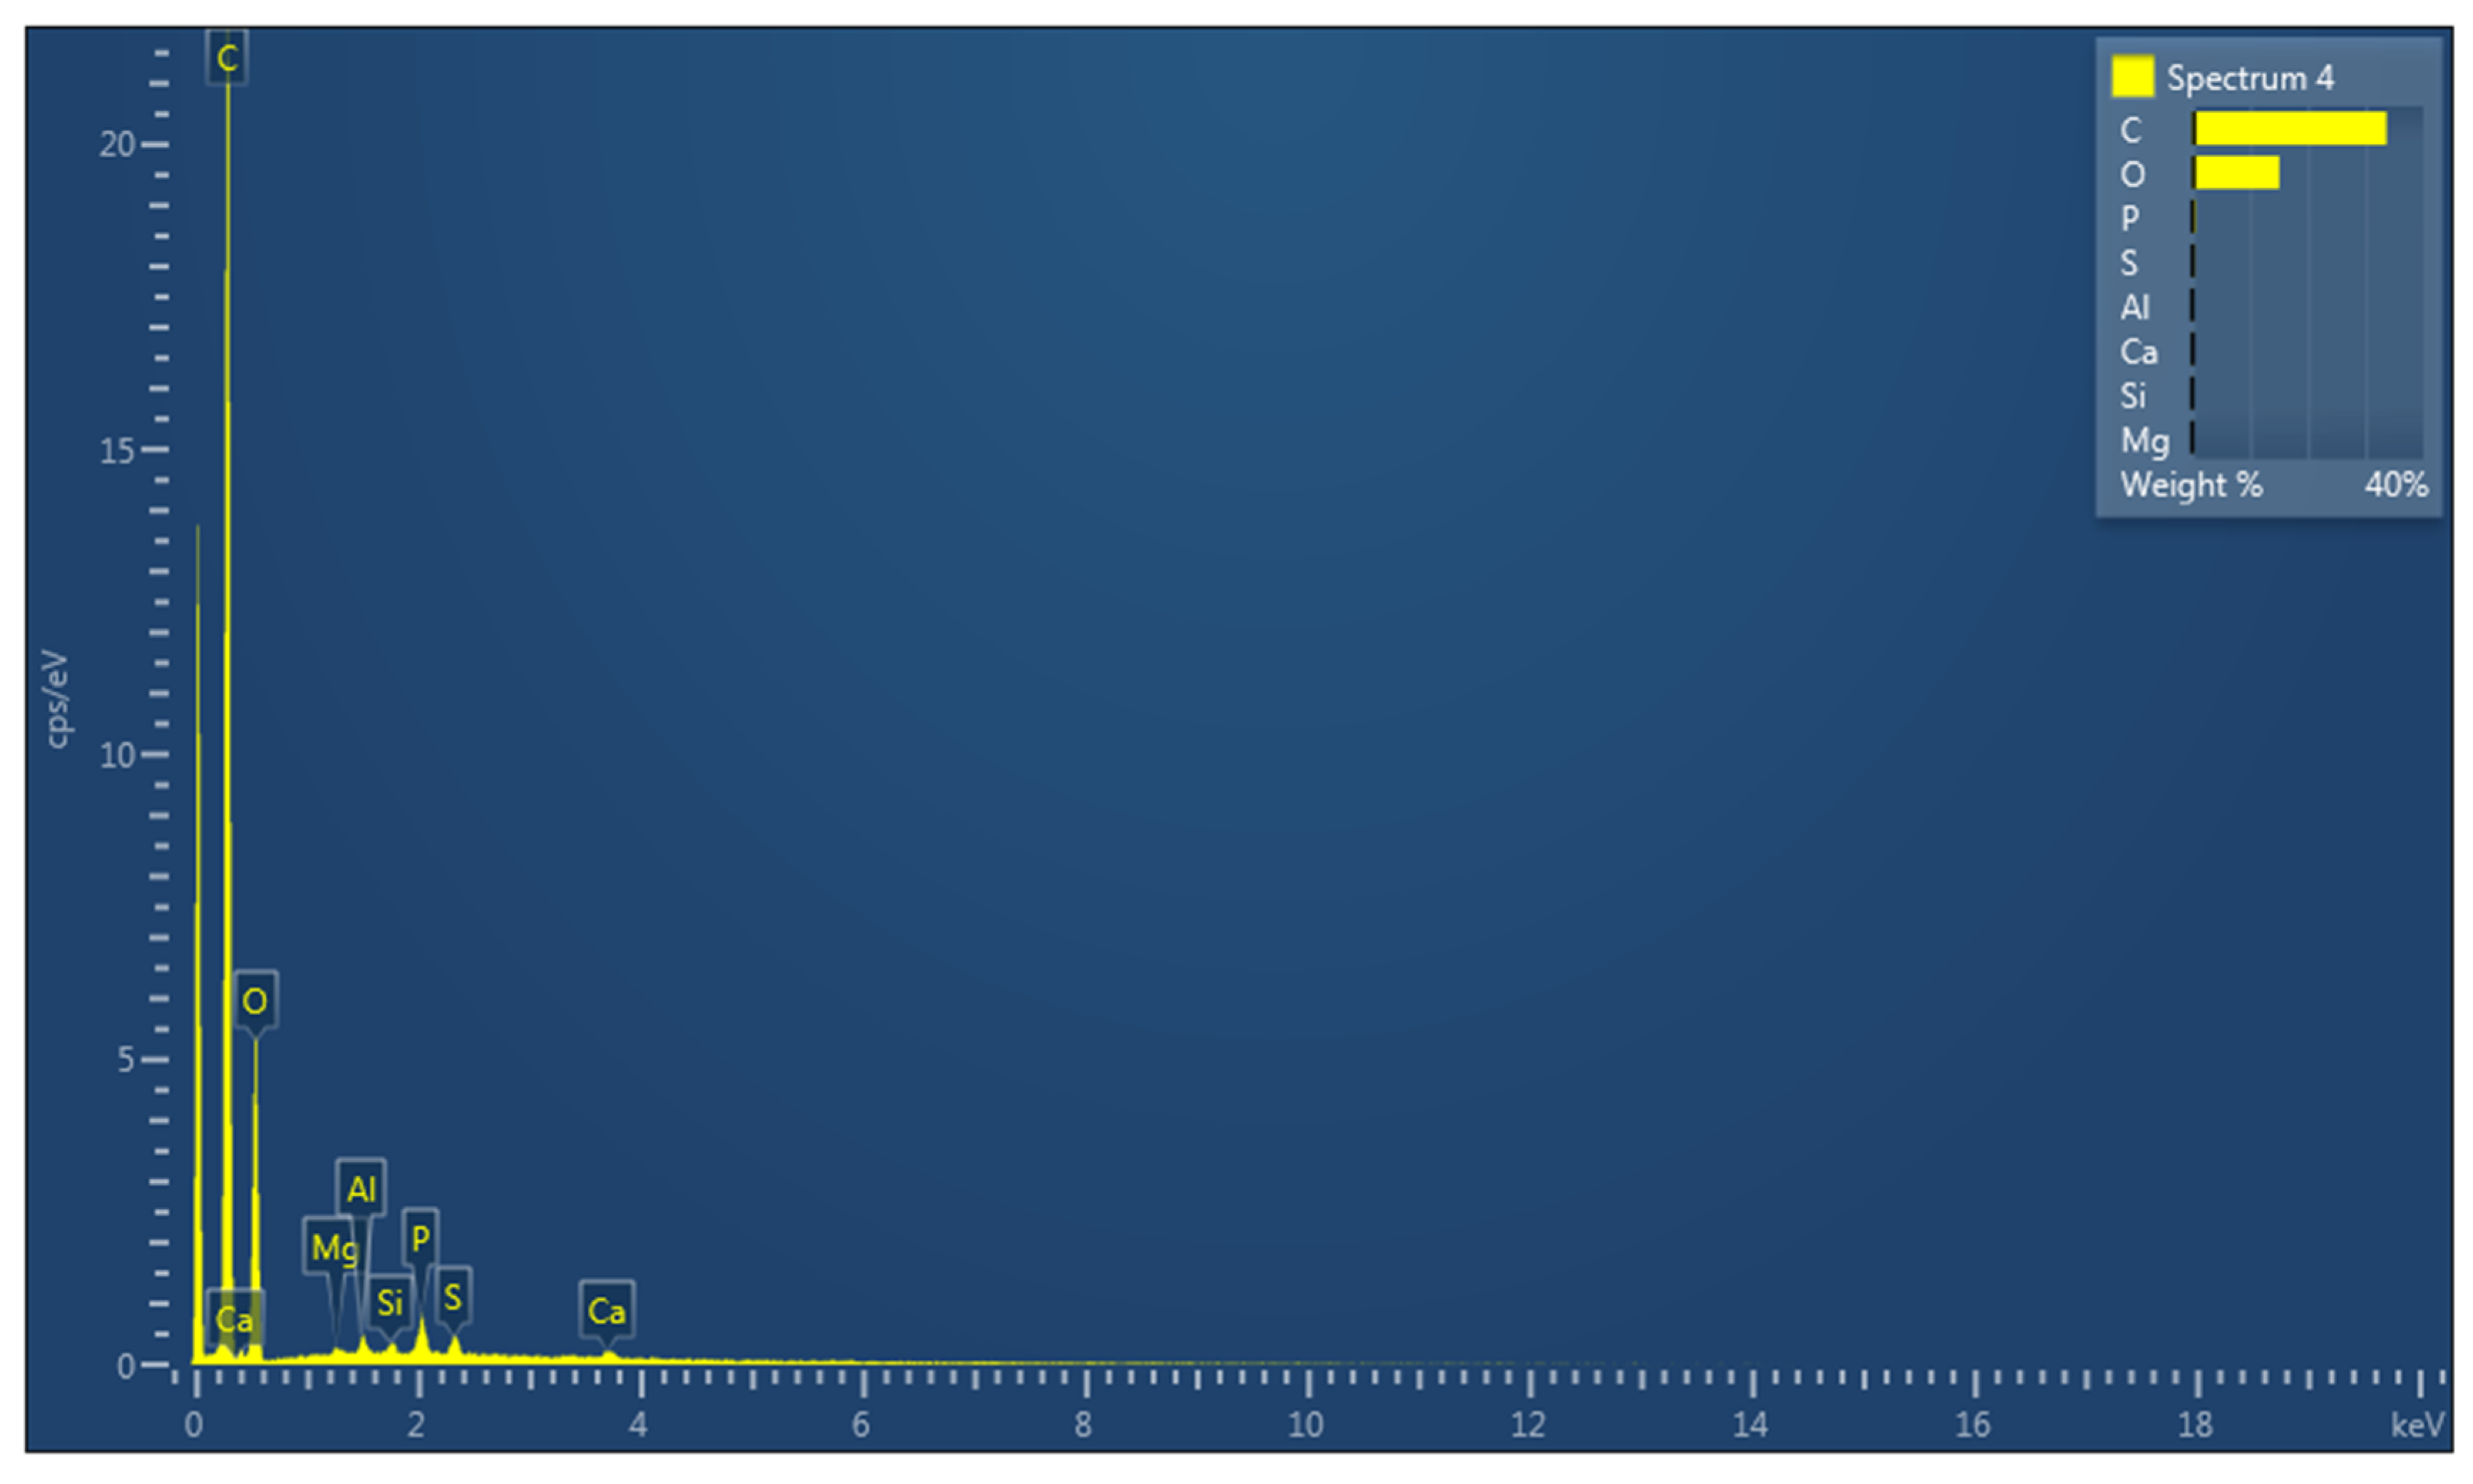
2.5. Morphology and Elemental Analysis (SEM/EDX)

The morphological and elemental research was performed in the SEM (Scanning Electron Microscope) Laboratory, Department of Geology, FOS, UBD, with a JEOL Schottky Field Emission SEM (JSM-7610F) from Akishima, Japan. SEM was used to obtain surface images, and energy-dispersive x-ray (EDX) imaging was used to define the components in the biomass. The photographs were taken at magnifications of 100, 1000, and 5000. To achieve higher accuracy, biomass samples were carbon-coated before imaging. The atomic percentage of the components was determined using the same SEM-EDX unit.

2.6. Calorific Value/Heating Value

Using ASTM D 5468-02 processes, a higher heating value (HHV) of the barley waste sample was estimated [25], and the experiment was evaluated with a C-200 series bomb calorimeter made by P.A. Hilton, UK. The equation was used to measure the lower heating value (LHV) (Equation (7)) [26].
LHV = HHV − 0.212*(H) − 0.0245*(MC) − 0.0008*(O)

2.7. Fourier Transform Infrared (FTIR) Spectroscopy

The functional groups of the sample were investigated by a VERTEX 70, Fourier transform infrared (FTIR) spectrometer, manufactured from Bruker, Germany, at the science equipment center at PSU, Hat Tai, Thailand. All spectra were obtained at wavenumbers between 4000 and 500 cm−1.

2.8. Thermogravimetric Analysis (TGA) and Derivative Thermogravimetry (DTG)

The thermogravimetric analysis (TGA) and the derivative thermogravimetry (DTG) of the barley waste biomass sample were performed in the science equipment center at PSU, Hat Tai, Thailand, using a thermogravimetric analyzer (TGA7) made by Perkin Elmer, USA. The TGA and DTG study was executed at temperatures ranging from 40 to 900 °C with a constant heating rate of 10 °C/min for both pyrolysis and combustion conditions. The pyrolysis state was maintained with pure nitrogen (N2) gas flow, while the combustion condition was maintained with oxygen (O2) gas flow.

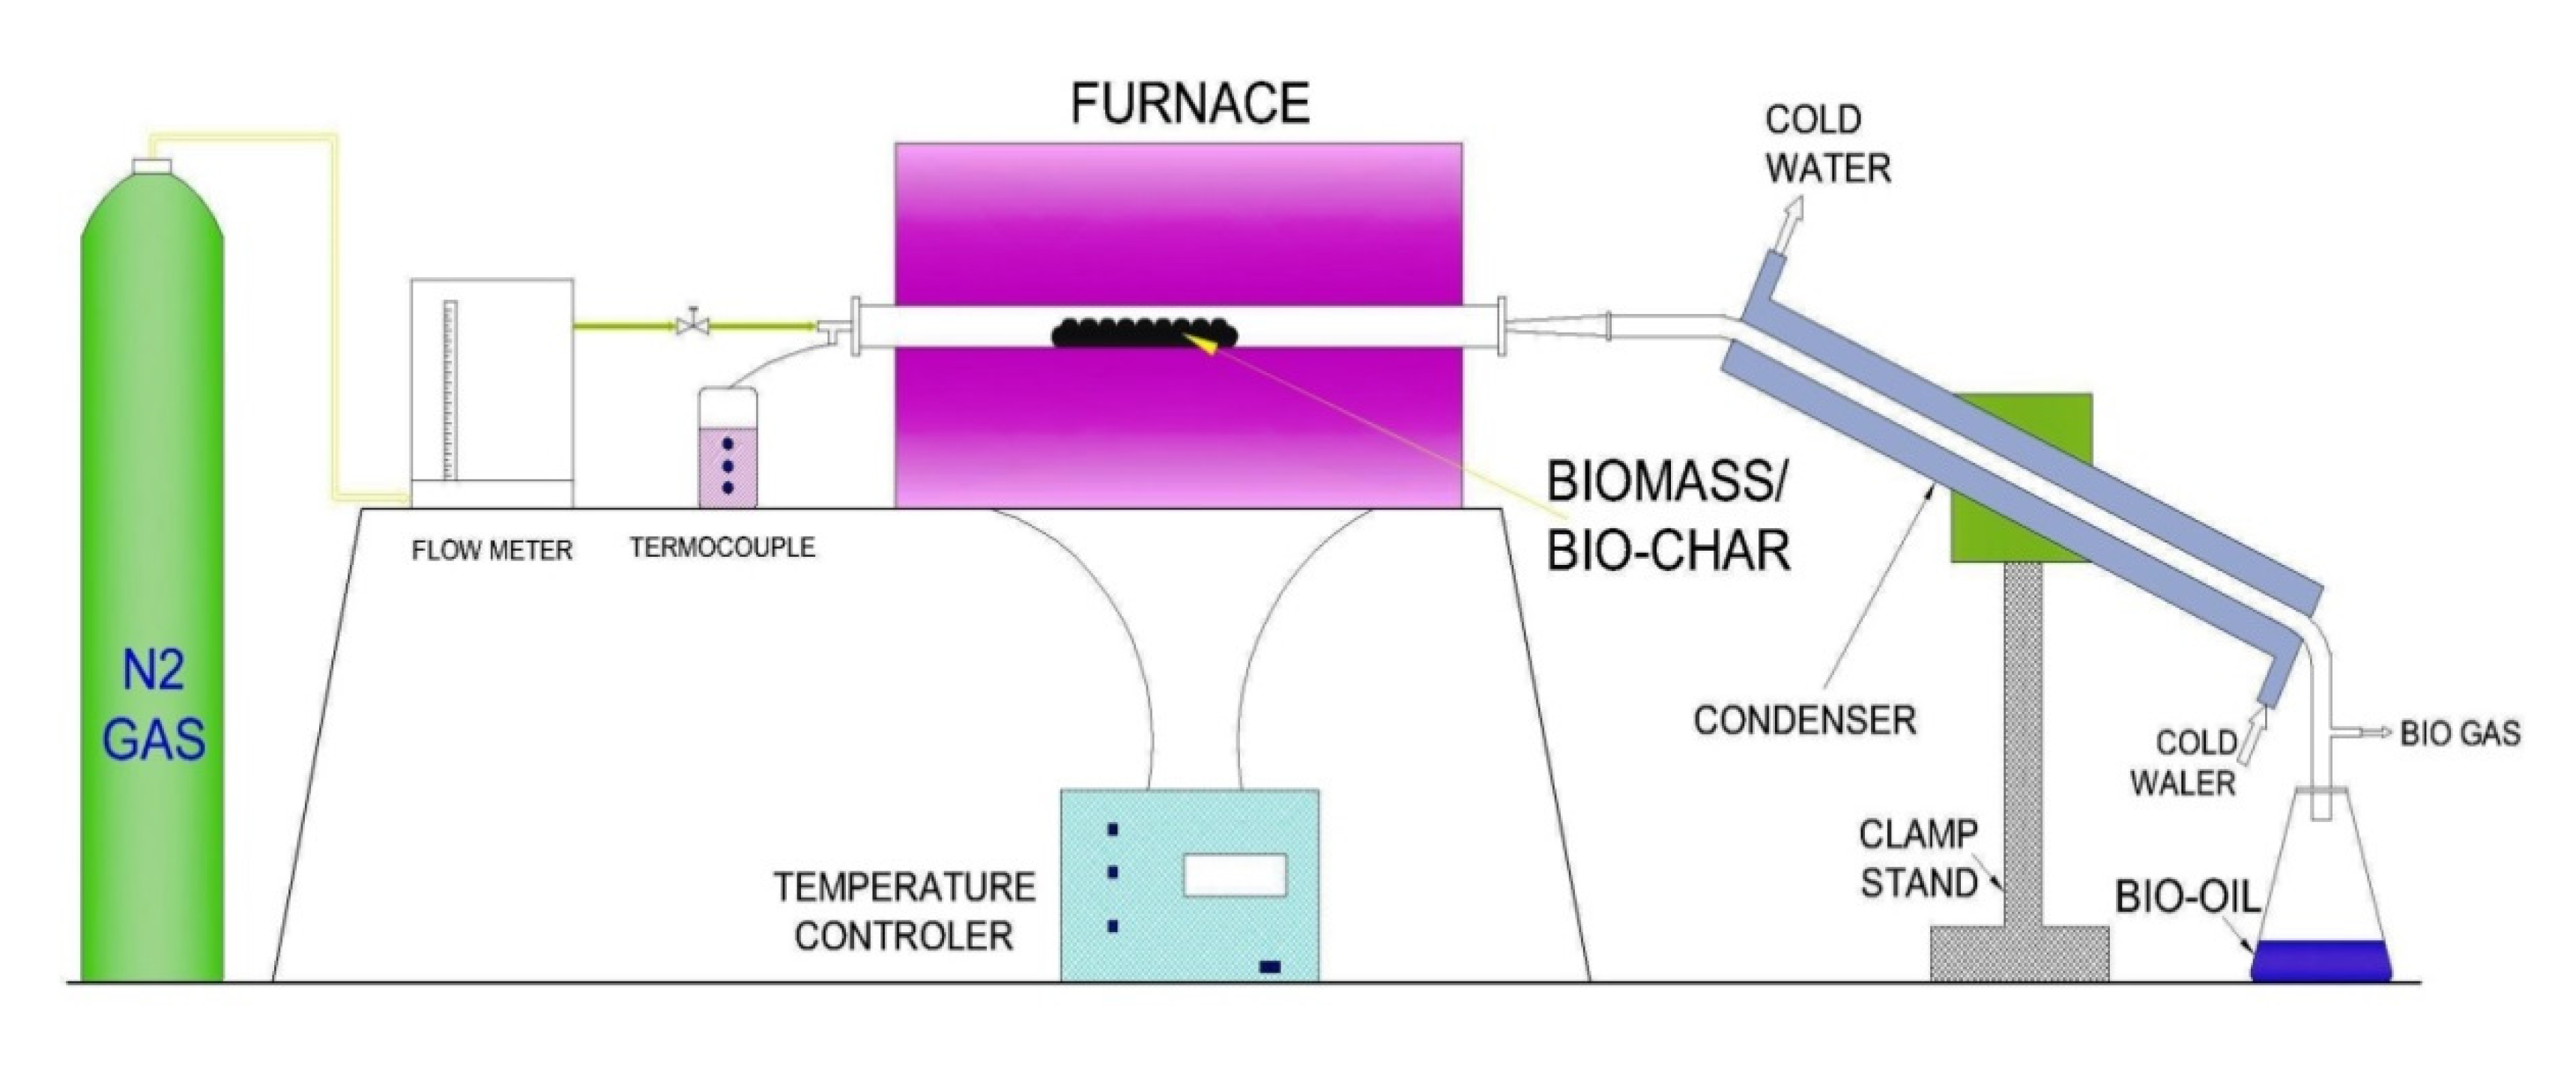
2.9. Pyrolysis (Fixed-Bed)

The pyrolysis process of the barley waste was conducted by a lab-scale, fixed-bed pyrolysis setup (Figure 3). The experiments were performed using the stainless steel reactor (inside dia-27 mm, and length-500 mm) inserted horizontally inside the tube furnace (Gero 300–3000, Carbolite Electrical Furnaces, Hope Valley, UK). For each experiment, 25 g of sample material were fed into the reactor. The biomass with the reactor was placed inside the furnace to run the pyrolysis process. The pyrolysis procedure was carried out at 400, 500, and 600 °C temperatures with a steady heating rate of 25 °C/min under 0.5 L/min of N2 (99.99% pure) flow rate. The procedure was continued after achieving the target temperature until no more bio-oil was generated. Cold water was passed through the condenser to support the condensable gases become condensed. Biochar was collected from the reactor, whereas the bio-oil was taken from the Erlenmeyer flask. The percentage of syngas was computed from the mass balance of the biomass.
The percentage of the pyrolysis products is calculated as per the following Equations [27].
Biochar   ( wt . % ) = [ ( w b   w f ]   ×   100
Bio-oil   ( wt . % ) = [ w 0   w f ]   ×   100
Syngas (wt.%) = 100 − { Biochar (wt.%) + Bio-oil (wt.%) }
where wf is the weight of feedstock; wb is the weight of the biochar from the reactor; and wo is the weight of the bio-oils from the flask and condenser.

3. Results and Discussion

3.1. Proximate Analysis

By the proximate analysis, the moisture content (MC), volatile matter (VM), fixed carbon (FC), and ash content (AC) of any biomass sample can be determined. Table 1 illustrates the proximate analysis relationship between barley waste samples and other biomass.
The moisture content of biomass is classified as the amount of water available in the dry sample. It has a significant effect on the quality and quantity of bio-oils during the pyrolysis process. If the moisture content of the bio-oil is high, the consistency of the bio-oil will degrade [31]. For effective thermochemical decomposition, the MC value of the biomass sample should be less than 10%. The moisture content of this biomass was achieved at 5.43%, which was less than 10% and comparable with the values of Elephant grass (9.80%) [28], Imperata cylindrica (9.30%) [29], and switchgrass (8.40%) [30]. Since this waste showed lower moisture content, it can be a potential candidate for biofuel production.
The volatile matter is the part of the biomass that is driven off at higher temperatures as gases including moisture [32]. The major components of the volatile matters are the combustible substances (tars, light hydrocarbons, CH4, CO, H2, C2H2, H2S, and other similar substances) and certain non-combustible substances (CO2, HCl, H2O, N2, NO, NO2, N2O, NH3, SO2, KCl, NaCl, SO3, NaOH, and KOH) [33]. The volatile matter of this biomass was revealed as 73.41%, which was comparable to the values of Elephant grass (69.20%) [28], Imperata cylindrica (64.30%) [29], and switchgrass (84.20%) [30]. Generally, it varies from 60 to 85% for biomass [32]. If the VM of the biomass is higher, the reactivity will be increased during the thermochemical process. The reactivity depends on the original composition of the biomass and the reactive functional groups of the sample during the pyrolysis process [34]. A higher amount of volatile matter in the biomass indicates the desirable characteristics in the pyrolysis process to convert the biomasses into useful biofuels, where the value for grasses varies from about 70 to 80 wt.% [35]. In combustion, volatile matter was burned firstly as gaseous, and biochar was burnt as a solid in the second stage [36].
Fixed carbon (FC) is the volume of biochar left after separating moisture, volatile matter, and ash content from the feedstock. FC provides an approximate estimation of the heating values during combustion [37,38]. This sample revealed the weight percentage of fixed carbon was 18.15, which was higher than the values of Elephant grass (7.70%) [28], Imperata cylindrica (16.10%) [29], and switchgrass (11.90%) [30]. During combustion, lower fixed carbon and higher volatile matter are utilized in the majority to become gaseous. Biomass with a higher fixed carbon carries a high energy value. The fuel value index also increases if the FC in the biomass increases but decreases if the VM in the biomass increases [39]. The presence of more fixed carbon makes biomass an ideal choice for biochar and activated carbon processing [40].
Ash content (AC) is the non-combustible constituent that obstructs combustion and causes fouling, erosion, and slagging. In the pyrolysis process, if the AC value is lower, it shows high efficacy [41]. The AC value for this work was 3.01%, which was very low and comparable to the values of Elephant grass (13.30%) [28], Imperata cylindrica (10.30%) [29], and switchgrass (3.90%). These differences might be due to the harvesting method or soil conditions for the plants in those specific areas. In the pyrolysis process, ash could show catalytic activity for biofuel generation [31]. The lower amount of potassium added an extra advantage in the pyrolysis process because a higher amount of potassium contributes to slag formation in the furnace. The presence of phosphorus increases the yielding of biochar during the pyrolytic decomposition of biomass [42].

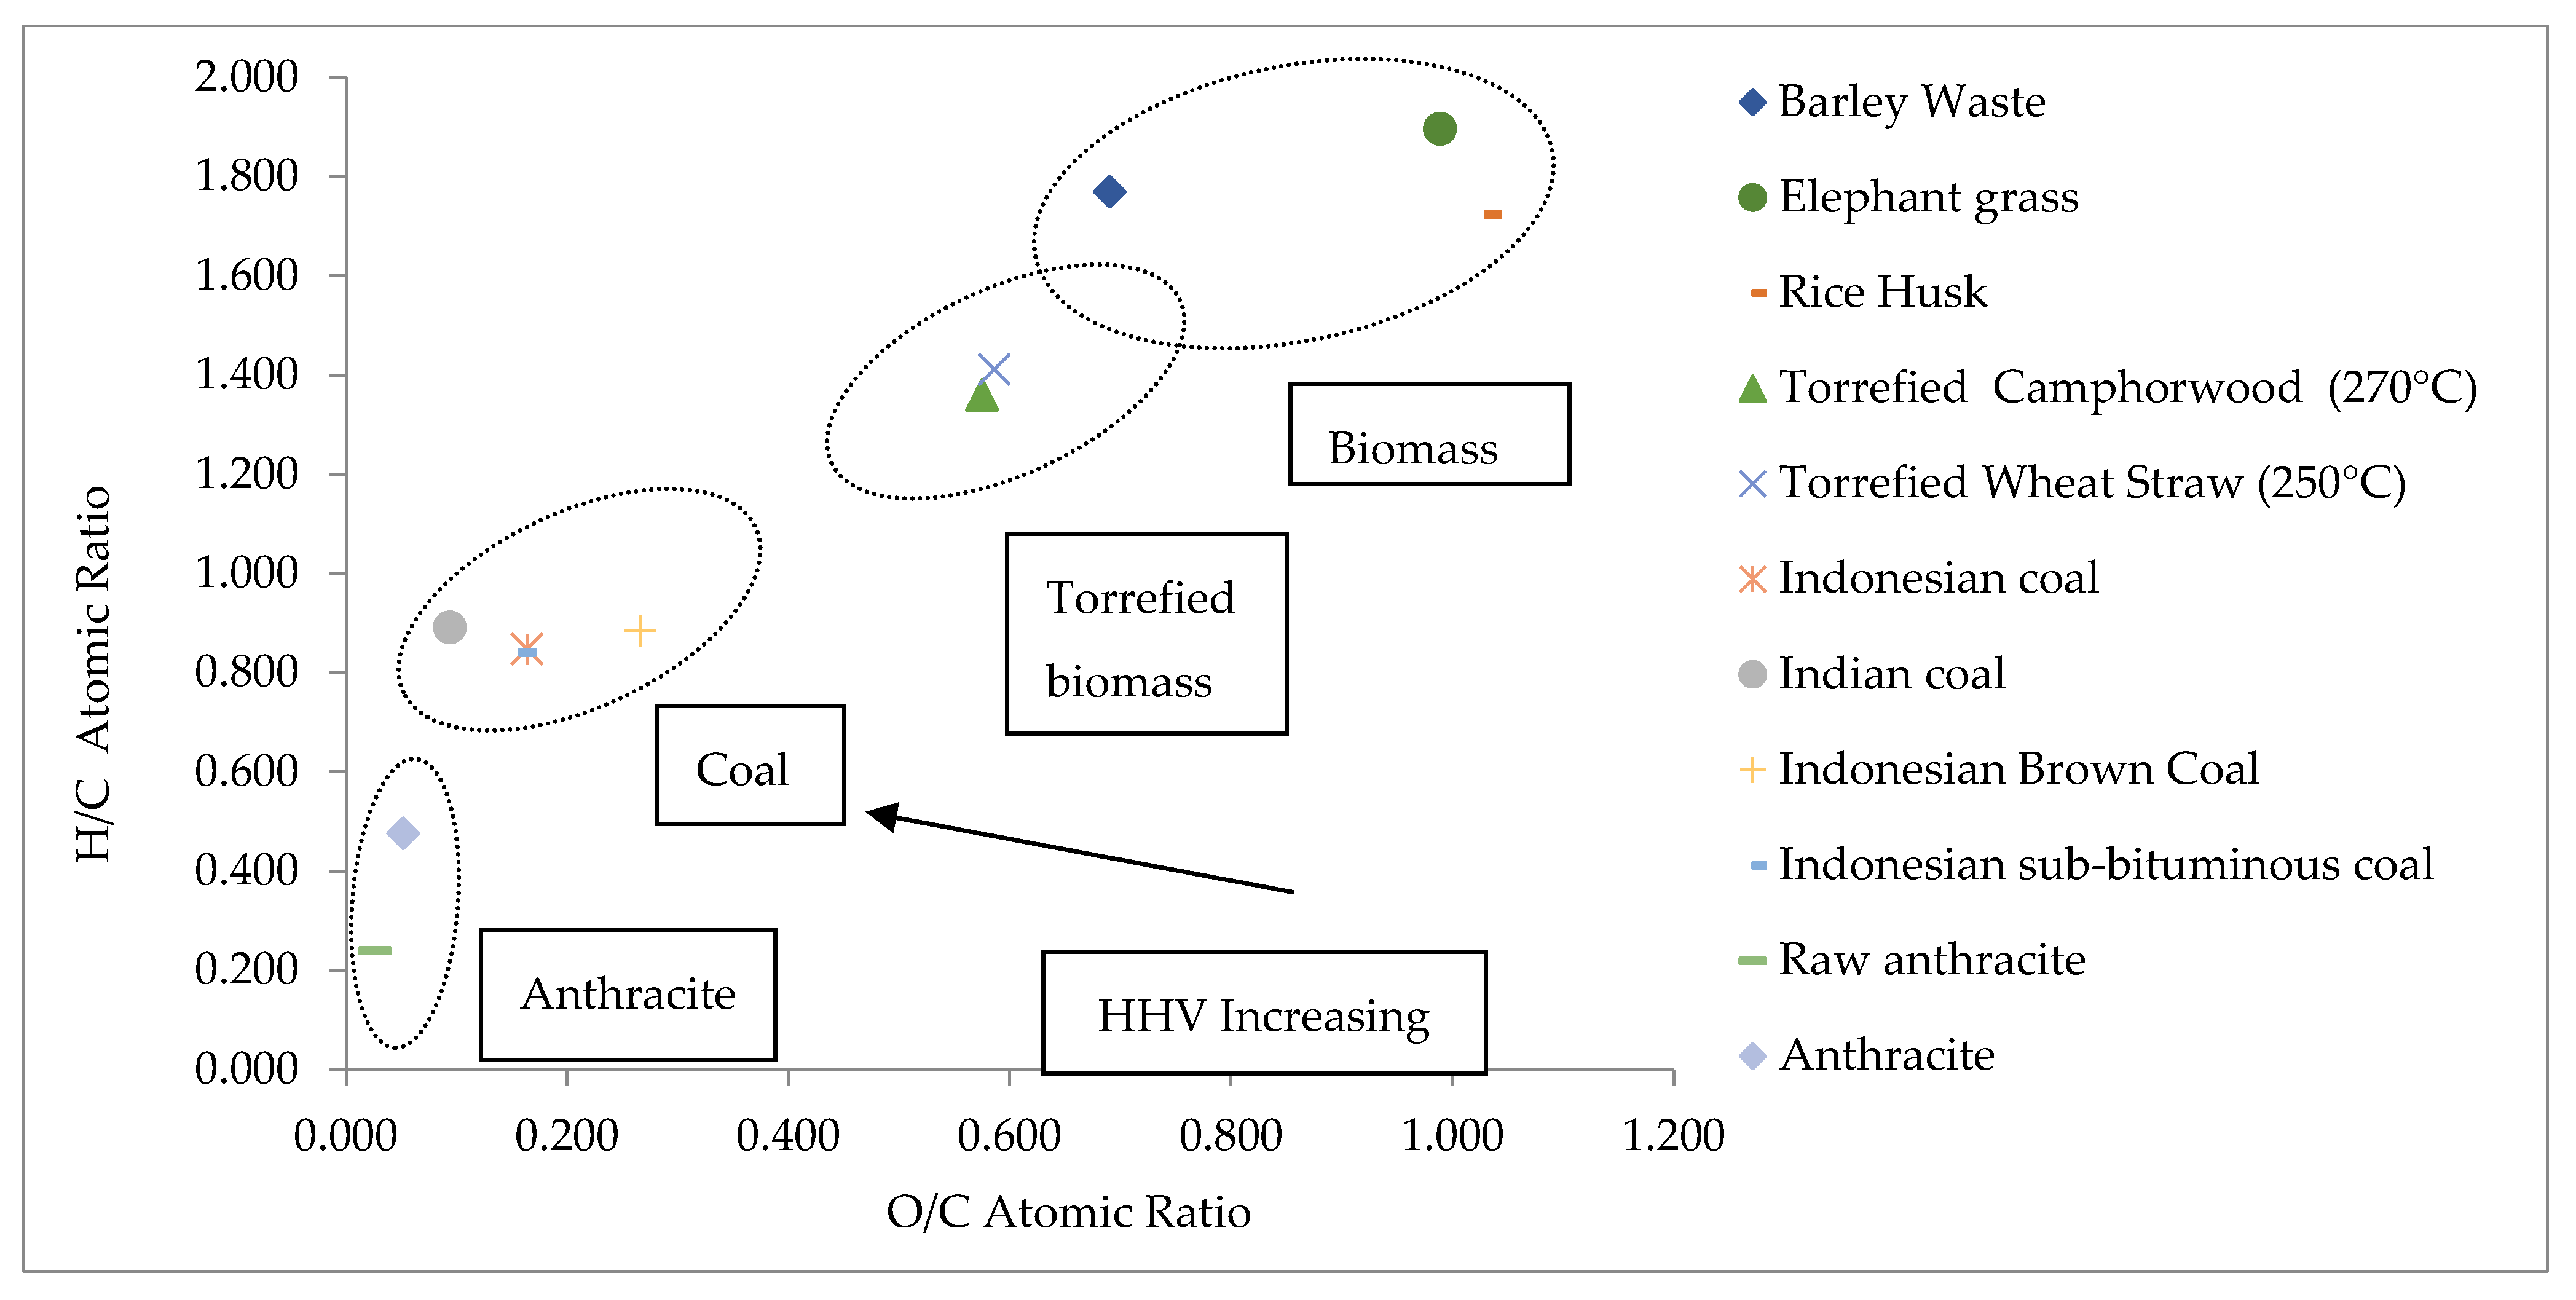
3.2. Ultimate Analysis

Table 2 describes the ultimate analysis of the barley waste and the atomic ratios of H/C with O/C. The carbon (C), hydrogen (H), nitrogen (N), and sulfur (S) ratios of this waste biomass were 46.04%, 6.84%, 3.89%, and 0.91%, respectively. Consequently, the oxygen (O) content was found as 42.32% from the deduction method. The ultimate analyses of the barley waste biomass were compatible with values of Elephant grass (C-39.63%, H-6.31%, N-1.70%, S-0.20%, and O-52.16%), and rice husk (C-39.48%, H-5.71%, N-0.665%, S-<0.10%, and O-54.12%) in Table 2 [4,43]. The most significant ingredients for use as a heating fuel are carbon, hydrogen, and oxygen in any biomass. With greater carbon and less oxygen content, the calorific value of the feedstock can be enhanced [36]. The elemental composition of biomass is also influenced by its ash content. The atomic ratios of H/C and O/C suggest the energy concentration of biomasses on the basis of the bonding between O-C and H-C. Carbon to oxygen (C-O) and carbon to hydrogen (C-H) bonds have lesser energy than carbon to carbon (C-C) bonds for biofuel production [32].
The existence of nitrogen and sulfur in biomass has a negative impact on biofuel production since they form higher energy bonds (C-N, H-N, C-S, and H-S). Any biomass with lower sulfur and nitrogen content is safer for the atmosphere as it produces less SOx and NOx during burning [44]. The sulfur content of this biomass was stated to be less than 1%, making it suitable for bioenergy production.
According to the H/C atomic ratio, the biomass contains a corresponsive amount of aliphatic and aromatic hydrocarbons. This biomass has a H/C ratio of 1.770, which is higher than 1.5 and indicates that it includes alkanes (CnH2n+2) and alkenes (CnH2n) as components [45]. Hydrocarbons with a single bond (-CH2-CH2-) and those with a double bond (-CH=CH-) have H/C values close to 1 and 2, respectively. This biomass was composed of both hydrocarbons (straight and/or branched chain), as shown by the H/C value of 1.770 for the sample of biomass. This waste may be utilized as a possible feedstock for biofuel due to the presence of these hydrocarbons [35].
The O/C atomic ratio is a good indicator to figure out the hydrophilic properties of the biomass. The O/C atomic ratio of the biomass was found to be 0.690, suggesting the hydroxyl (−OH) functional groups are made up of a single-bonded carbon-oxygen (C-O) atom. Biomass has hydroxyl functional groups, and via hydrogen bonding, it can display a hydrophilic character [35]. The (N+O)/C atomic ratios have a positive correlation with the polarity of the biomass compounds. This biomass represented the (N+O)/C atomic ratio of 0.762, meaning that one carbon atom was bound to both nitrogen and oxygen single atoms [46]. Because of its polarity and hydrophilic behavior, barley waste can produce acetic acid by reacting with large organic molecules and water if it is disposed of in a landfill [47].

Van Krevelen Diagram

Based on the data in Table 2, the Van Krevelen diagram was plotted according to the atomic ratio of H/C vs. the atomic ratio of O/C which is represented in Figure 4. The major four zones of anthracite, coal, torrefied biomass, and biomass are all presented in the figure. It is the assessment to check the group of the sample. According to the H/C and O/C results, this waste sample is perfectly fitted in the biomass zone. Barley waste is thus a potential source of biomass for the generation of biofuels [4,43].

3.3. Calorific Value/Heating Value

The quantity of energy released by biomass during burning is known as the calorific value, commonly referred to as the heating value. The energy for the latent heat of moisture vaporization is shown by the higher heating value, whereas the energy without the latent heat of moisture evaporation is shown by the lower heating value [32]. Any thermochemical process must take into account both values because, although HHV is obtained in the laboratory calorimeter, LHV represents the actual energy for practical applications [48]. The HHV and LHV values for the barley waste sample were determined to be 20.06 MJ/kg and 18.44 MJ/kg, correspondingly. The calorific values of this biomass are compared to those of other biomasses in Table 3.
Calorific values provide accurate information for the heating values of biomass to rationalize the probability of being an effective source of the energy [52]. For any biofuel, the calorific values are typically computed as the energy content per unit mass of solids (MJ/kg) and the energy content per unit volume of liquids (MJ/L) and gases (MJ/Nm3). The literature states that when carbon and hydrogen concentration rises, the HHV values rise as well, while nitrogen content rises and decreases [53]. According to Sheng et al., HHV values exhibited a positive connection with the volatile matter and a negative correlation with ash content. The moisture content must be mentioned when quoting the calorific value of any biomass since the values decrease proportionally with moisture content [32].

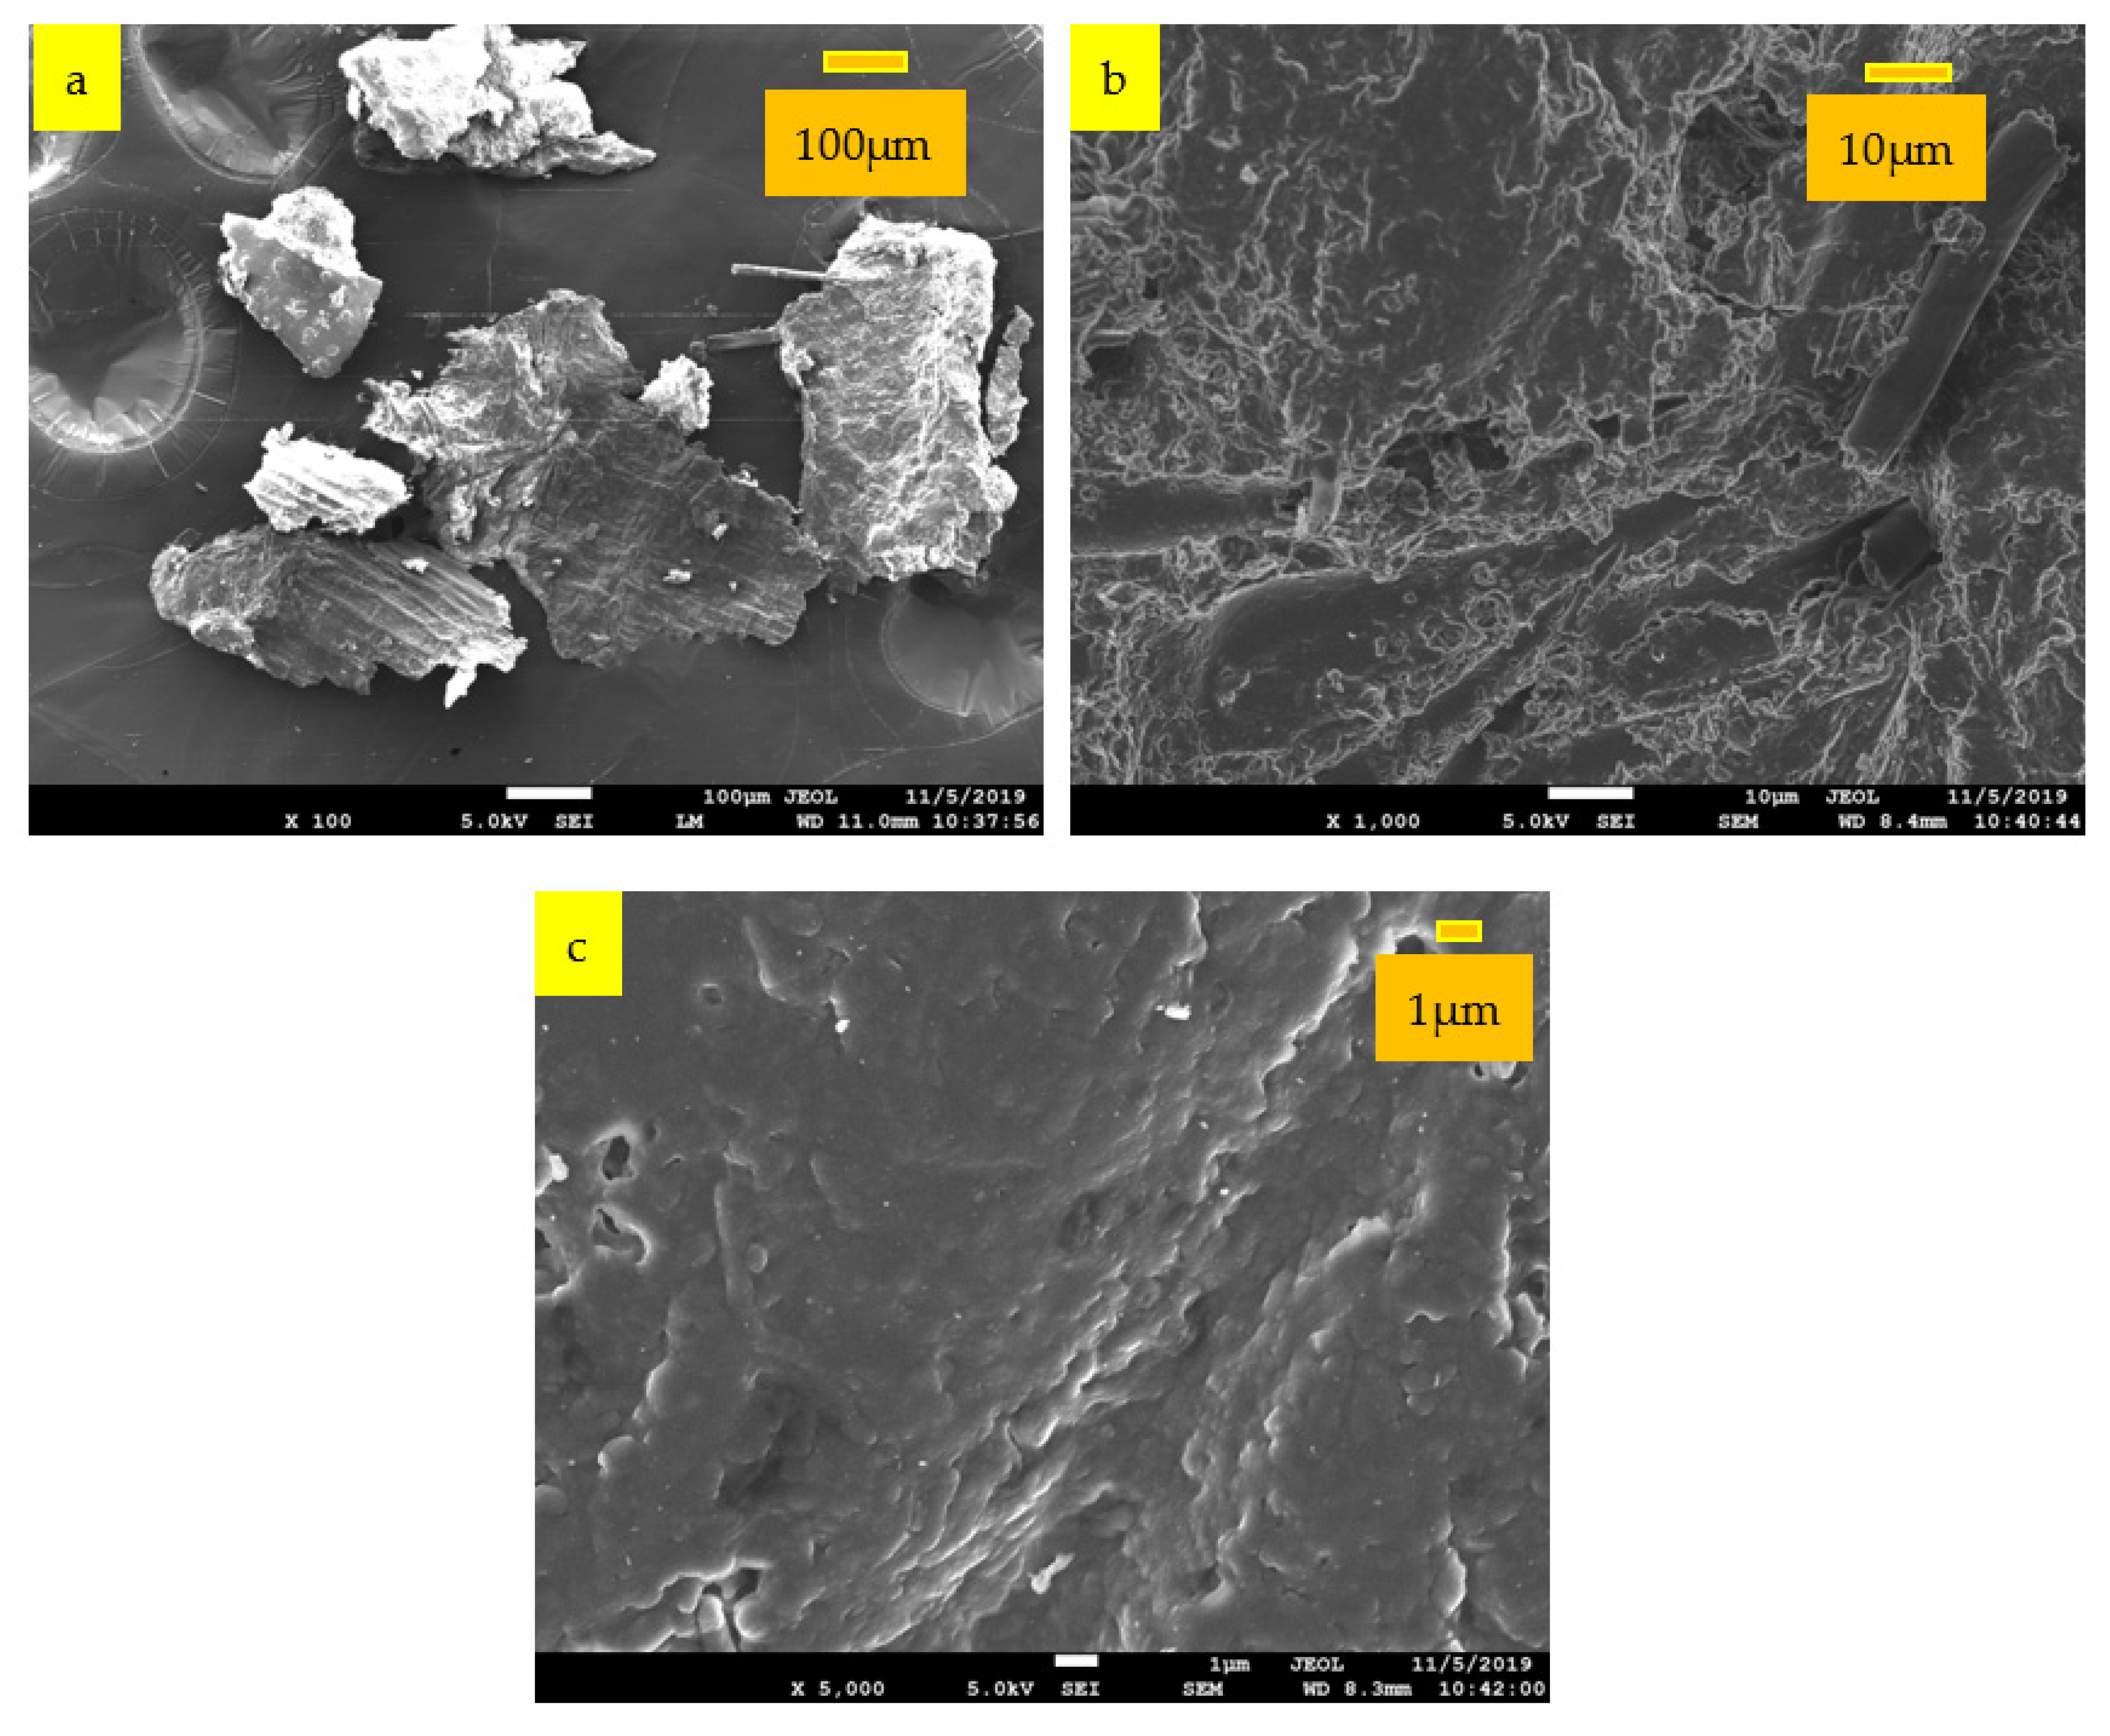
3.4. Scanning Electron Microscope (SEM)

For morphology analysis, SEM is one of the most reliable techniques as it can provide complete, extensive, well-contrasted, and high-resolution images [54]. SEM micrographs of this biomass are shown in Figure 5a–c at 100, 1000, and 5000 magnification levels, respectively. From the images, the barley waste exhibits numerous fibers stuck together with no pores. The surface of the sample is uneven for the durable bond between the pectin and non-cellulosic constituents [55]. The fibrous surface of the sample can be promising for biofuel creation, as this escalates the compressive strength and the impact resistance [56].
An energy dispersive X-ray is considered one of the most authentic and reliable methods to detect the elements and find out their percentage in biomass [57]. The EDX results for this biomass are shown in Table 4 and Figure 6. The results indicate a high density of carbon and oxygen with C-O bonds is available in the biomass [58]. The inorganic components, magnesium (Mg), silicon (Si), aluminum (Al), sulfur (S), phosphorus (P), and calcium (Ca), for this biomass are comparable with the literature [59].

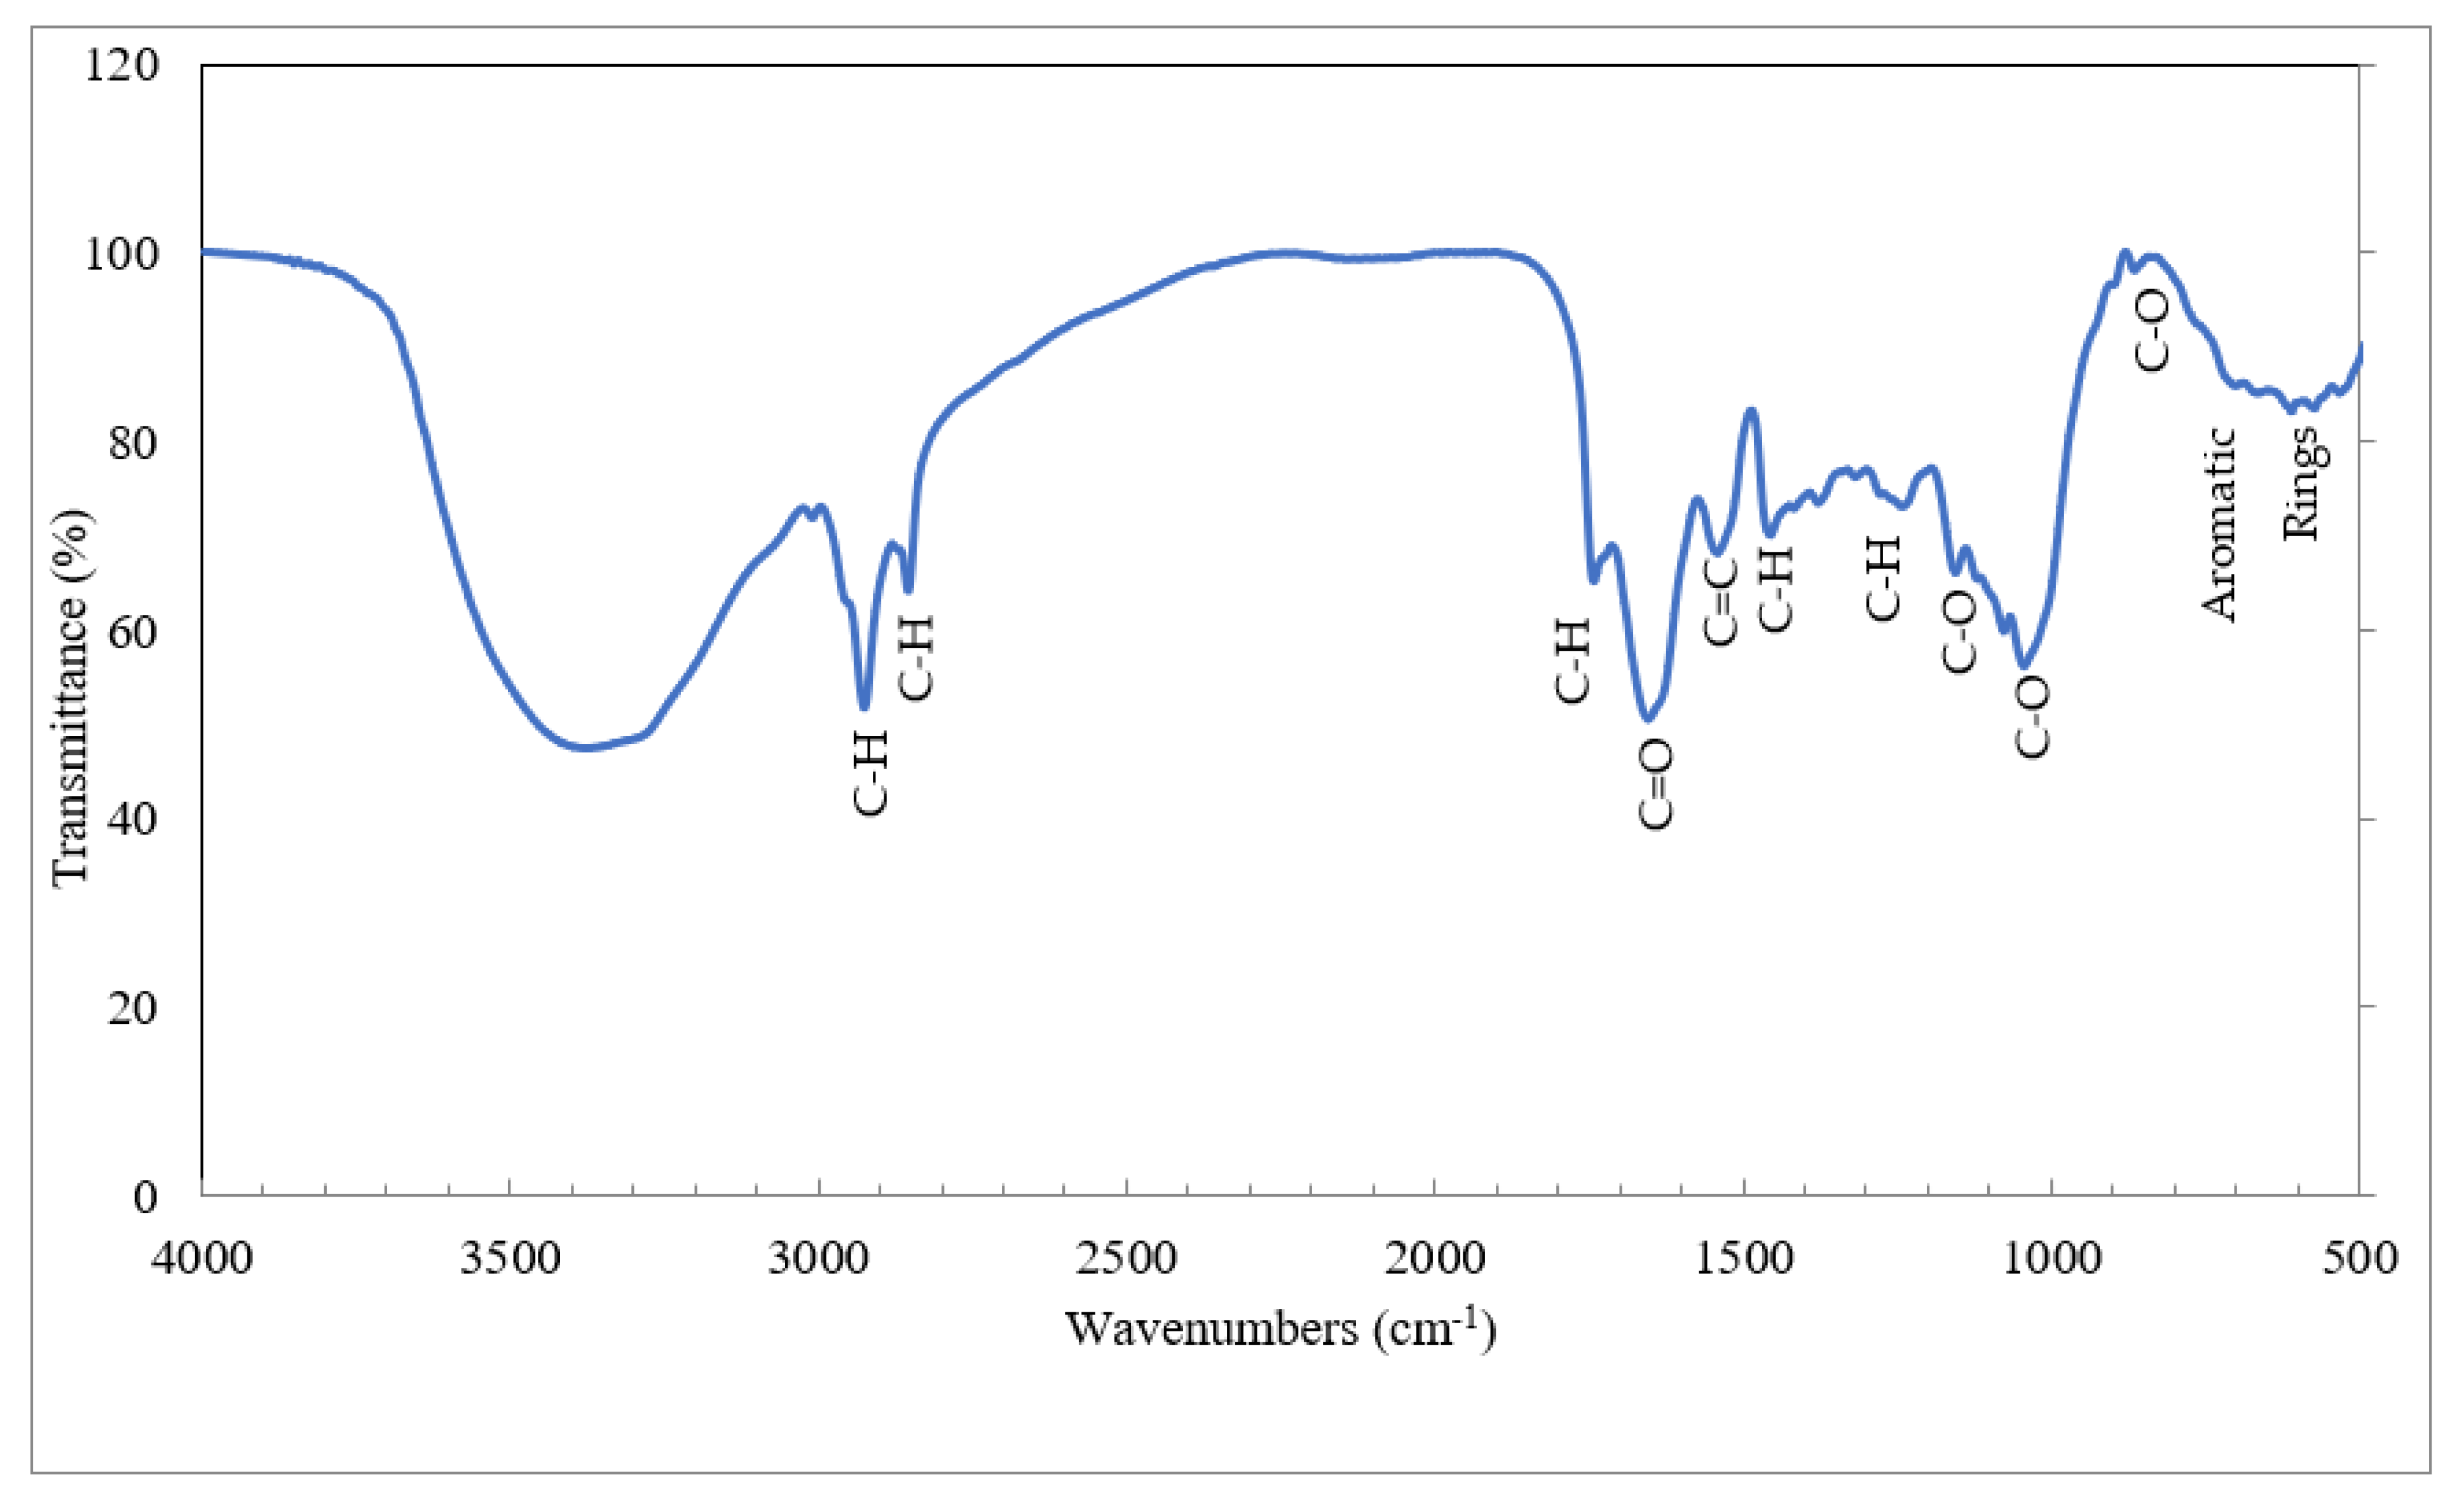
3.5. Fourier Transforms Infrared Spectroscopy

Fourier transform infrared spectroscopies are used to determine the connection between the arrangement and the chemicals of the biomass. Figure 7 depicts the FTIR results from 4000 to 500 cm−1 wavenumbers. Table 5 describes the corresponding groups according to the benchmarks of the literature [60,61]. The reported peaks in the wavenumbers, 2931 (cm−1) and 2860 (cm−1), were for the stretching of C-H bonds in the aliphatic structure of hemicellulose, cellulose, and lignin [62]. The bending of C-H for hemicelluloses and cellulose is between 2000 and 1650 cm−1 where the sample represented 1749 cm−1 [61]. The crest at 1668 cm−1 was for the C=O bond extension within hemicellulose [62].
The crests at wavenumber 1558 cm−1 wase for C=C bending of the aromatic rings of hemicellulose [63]. The peak is located at 1467 cm−1 due to the C-H distortion in the aliphatic structure [64]. The stretching of the C=C bond and the twisting of the O-H bond happened due to the accessibility of moisture [62].
Table 5. Functional groups of barley waste biomass.
Functional GroupsWave Number (cm−1)Reference
C-H stretching in aliphatic creation2931, 2860[62]
C-H stretching in cellulose and hemicellulose1749[61]
C=O Bending of hemicelluloses1668[62]
Aromatic C=C ring stretching1558[65]
Aliphatic C-H deformation1467[64]
C-H deformation in cellulose and hemicellulose1396[62]
C-O stretching in lignin and xylan1271[62]
C-O stretching vibration in cellulose and hemicelluloses1089, 1056[4]
C-O stretching in cellulose912[64]
Aromatic rings734–612[66]
The C-H group bending in hemicellulose and cellulose was represented by the crest that appears for wavenumber 1396 cm−1. With the extension of C-O in lignin and the xylan, the peak was formed at wavenumber 1271 cm−1 [62]. Notable peaks of this test were discovered at 1098 and 1056 cm−1, demonstrating the stable C-O bond expanding in hemicellulose and cellulose [4]. The C-O bond was stretched for the alkene in cellulose with a wavenumber of 912 cm−1 [64]. The aromatic rings of the biomass were revealed within the wavenumber range of 734–612 cm−1 [67].

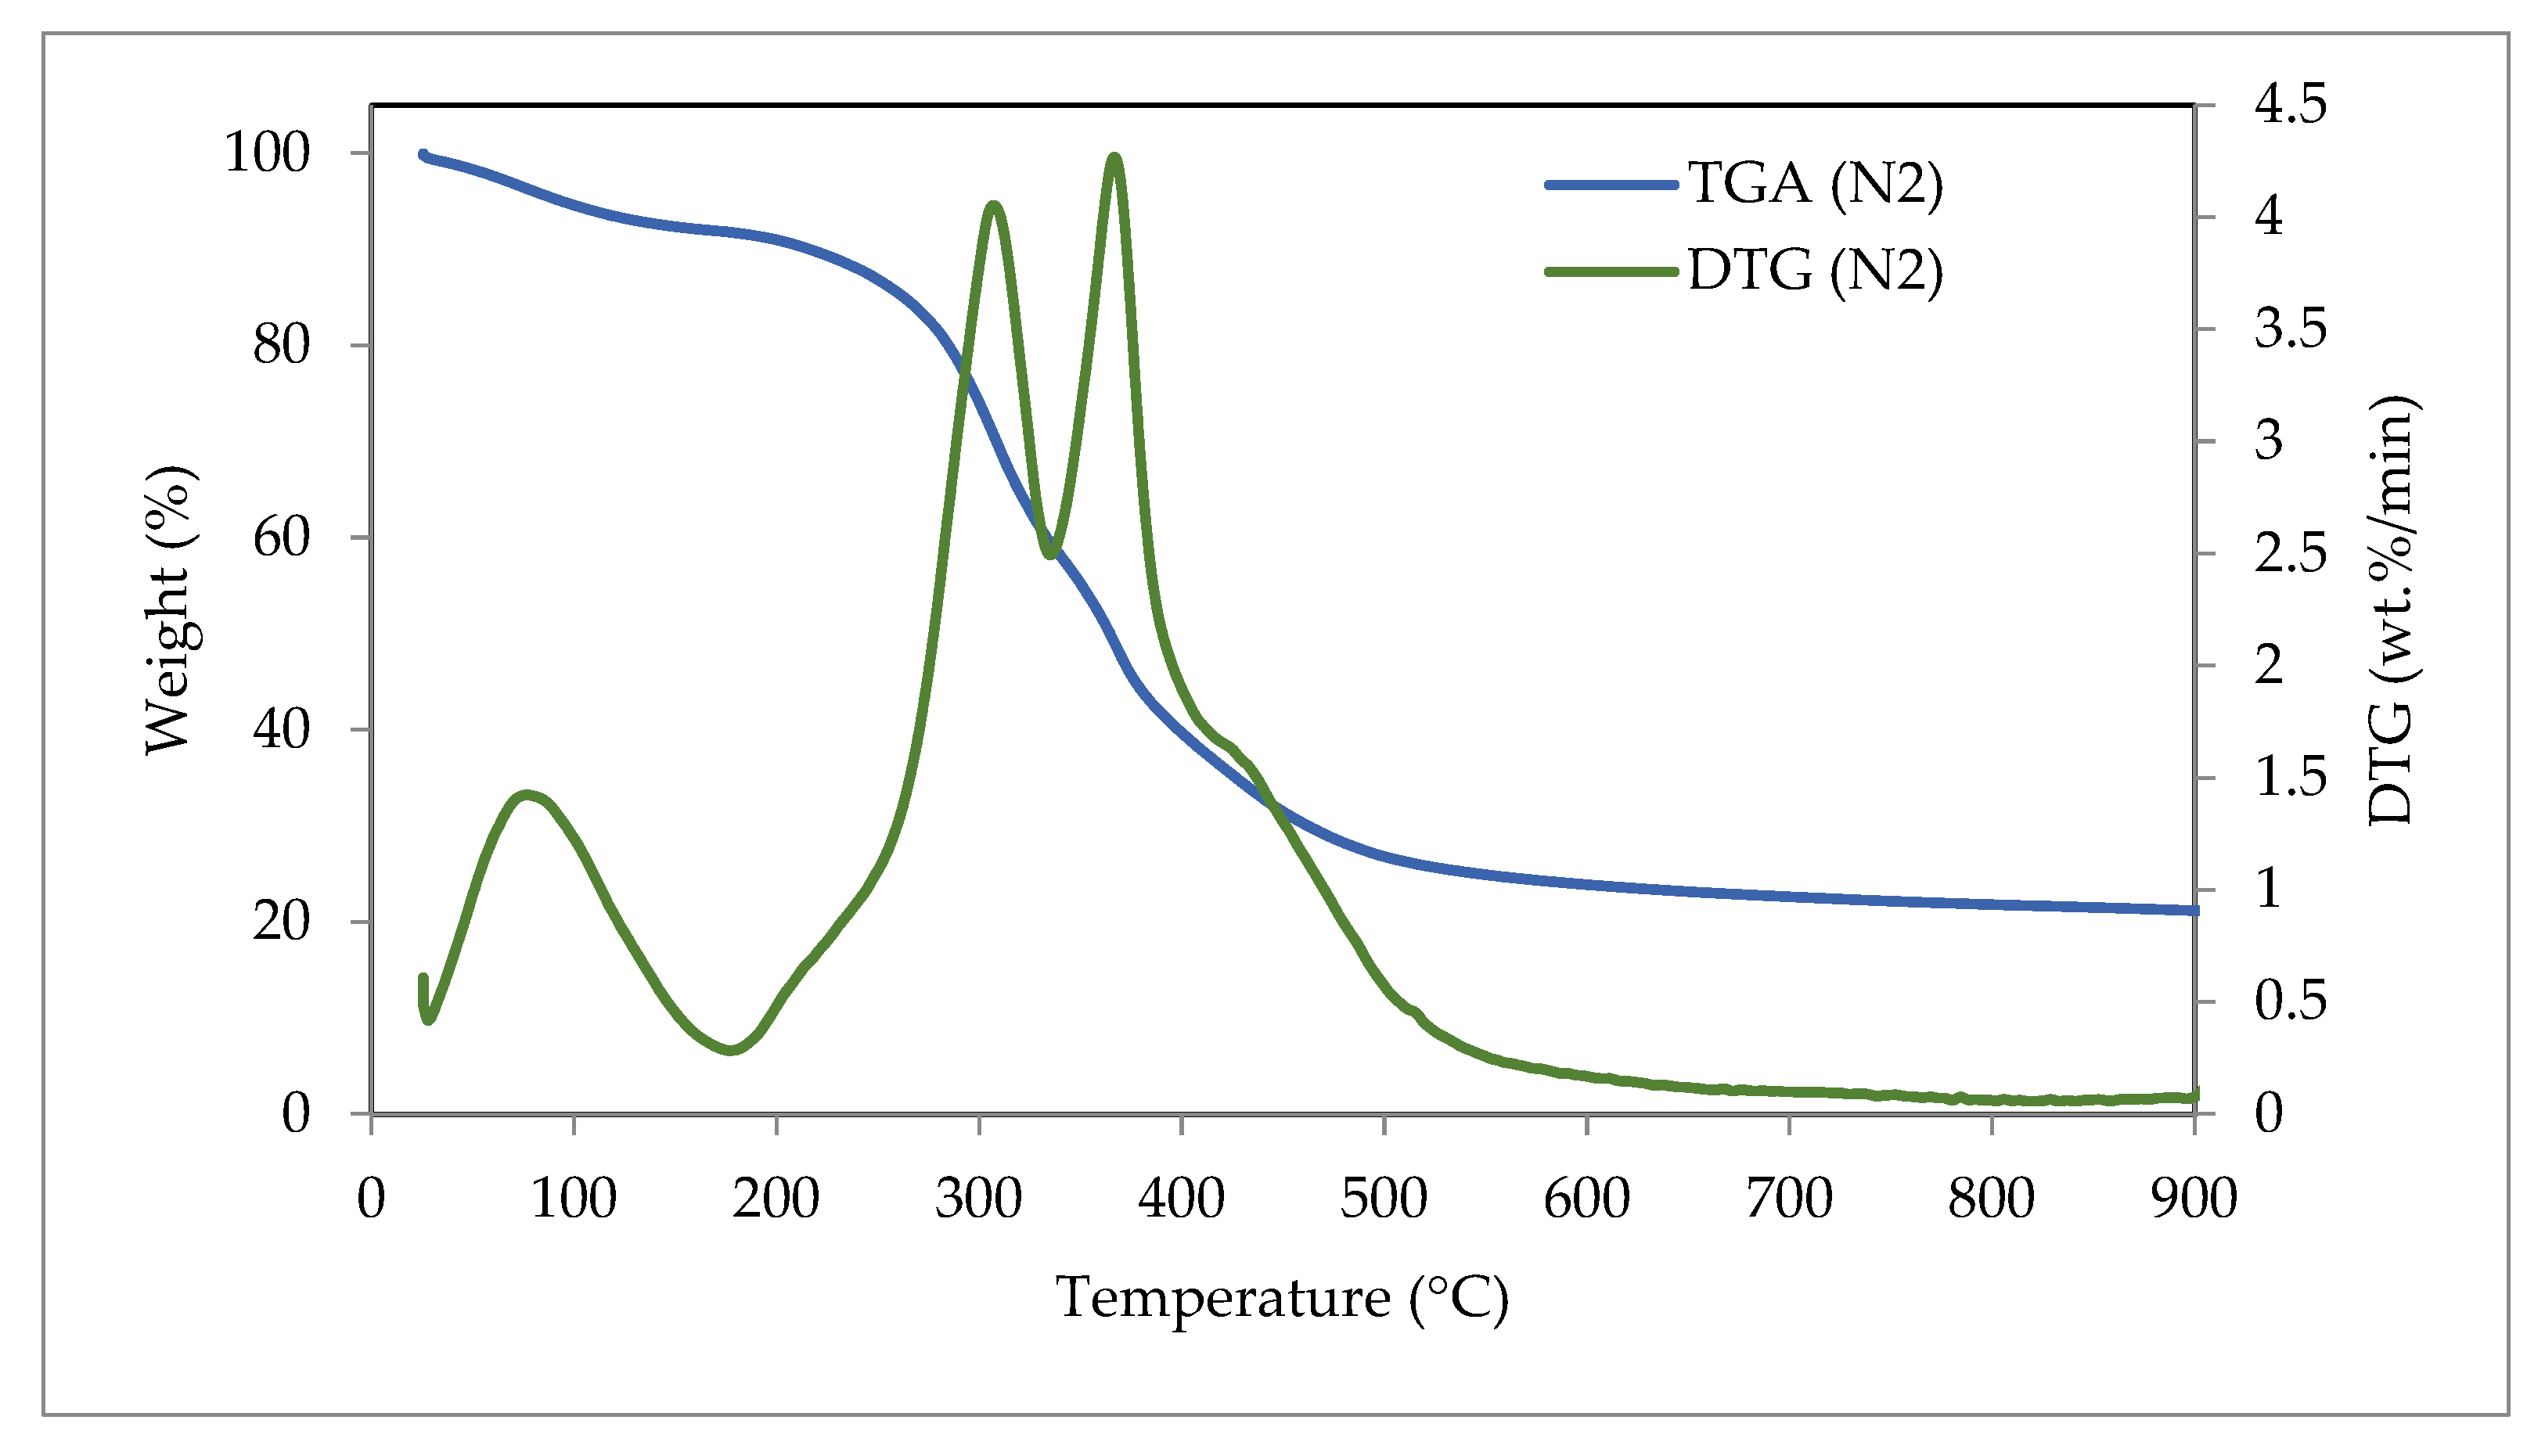
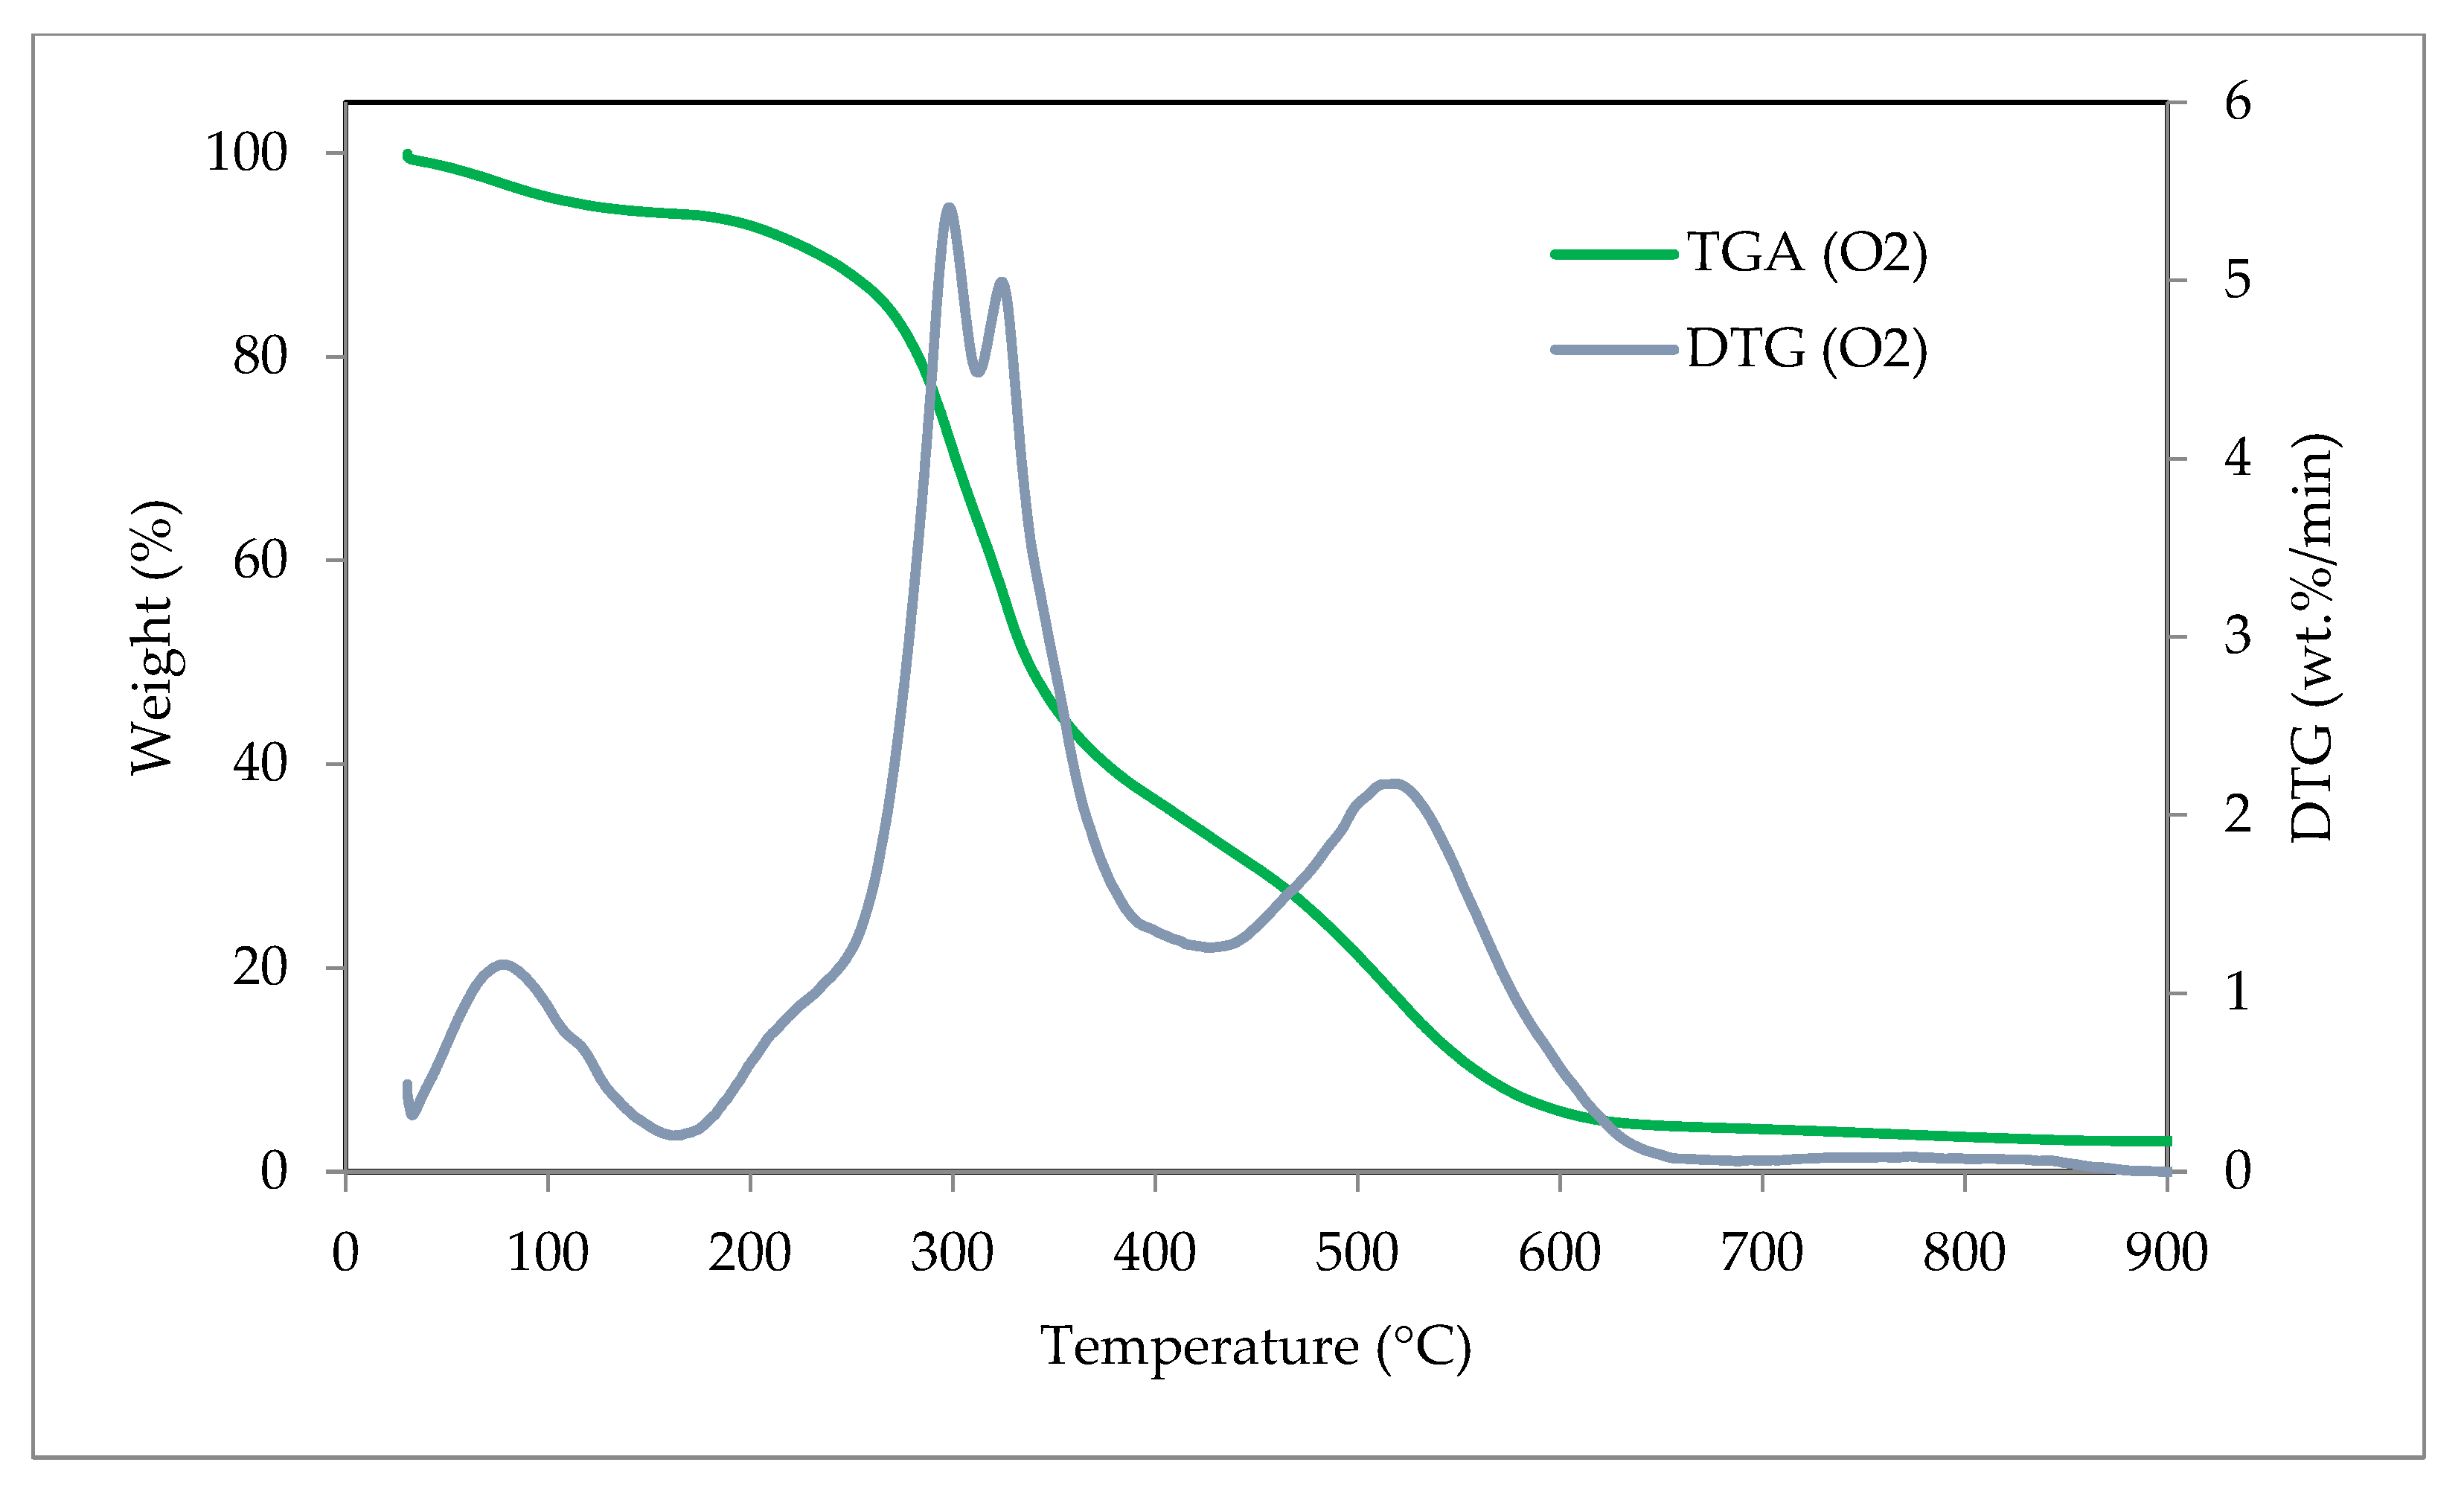
3.6. Thermogravimetric Analysis (TGA) and Derivative Thermogravimetry (DTG)

Thermogravimetric analysis is a significant method for understanding the series of reactions that take place during thermochemical processes [68]. The TGA and the DTG graph of the barley waste under the pyrolysis and the combustion conditions are represented in Figure 8 and Figure 9, correspondingly. The consequent weight loss of the sample is described in Table 6 at different temperature ranges for both conditions. There are three main stages for calculating moisture in biomass and the breakdown of lignocellulosic constituents (hemicellulose, cellulose, and lignin) [51]. Weight loss occurs when light volatile matter is removed at temperatures up to 100 °C, when moisture is removed at temperatures up to 130 °C, when heavy volatile matter is removed at temperatures up to 250 °C, when cellulose is decomposed at temperatures up to 500 °C, and when lignin is gradually broken down at temperatures up to 900 °C [69].
Due to the removal of moisture content and light volatile matter from the biomass, weight loss occurred during the first phase of the pyrolysis situation (40–200 °C temperature) [15]. In this stage, the weight loss is 9.02%, which is comparable to the moisture content of other biomasses (9.80% and 12.20%) [28].
The breakdown of hemicellulose and cellulose caused a weight loss of 59.54% during the second stage (200–450 °C). This indicates that this sample can decompose easily in the thermal decomposition processes [70]. The percentage of weight loss is equal to camel grass weight loss values (59.34%) [51]. At this stage, the highest decomposition occurred where two peaks occurred for the different degradation levels. Due to the breakdown of hemicellulose in the biomass, the first peak was produced at a temperature of 306 °C and a degradation rate of 4.05 wt.%/min. The degradation of the cellulose components in the biomass was the primary factor of the second peak, which developed at 366 °C and had a degradation rate of 4.27 wt.%/min [71].
In the pyrolysis condition, the weight loss rate was slowed down in the third stage (450–900 °C), indicating the steady decomposition of the biomass. The slow degradation is due to the breakdown of the compound chemical configuration of lignin in biomass [72]. The weight loss at this point was 10.29%, which is an indication of the extended breakdown of lignin components. The residue achieved at 21.15% after 900 °C temperature was considered biochar.
The weight loss in the combustion condition was reported to be at 9.11%, mostly due to the removal of moisture content and light volatile matter. Due to the breakdown of the volatile matter of hemicellulose and cellulose, the maximum weight loss (63.03%) was found in the combustion conditions [66]. Two notable peaks from the DTG curve were achieved in the biomass due to the maximum breakdown attained in this stage. The breakdown of hemicellulose in the biomass caused the first peak to appear at 298 °C with a degradation rate of 5.41 wt.%/min. The second peak, which was mostly caused by the breakdown of the cellulose components in the biomass, appeared at 324 °C and had a degradation rate of 4.99 weight percent per minute [71].
In the third phase, the weight loss of 26.5 percent was brought about by the tedious and gradual breakdown of lignin components in biomass. With respect to values published for other biomasses, the findings of this study are quite competitive [66]. At higher temperatures, the polycyclic arrangement of biochar results in the creation of rings that resemble benzene. After 900 °C, there remained 3.01% residual material, the majority of which was ash from the biomass. This waste biomass can serve as a source for the manufacture of biofuels, according to the thermochemical breakdown pattern of the material [4].

3.7. Pyrolysis Yields

During pyrolysis, the thermal breakdown of biomass into smaller particles occurs due to higher temperatures in an inert atmosphere [16]. Fast pyrolysis is primarily used to produce higher amounts of bio-oil and syngas, whereas slow pyrolysis is associated with increased biochar generation [43]. The yields of biochar, bio-oil, and syngas from pyrolyzing barley waste in a fixed-bed reactor are shown in Table 7 at three different temperatures (400, 500, and 600 °C). This suggests that this biomass sample could be an efficient source of biofuels. With the proximate and ultimate analysis results, the lignocellulosic components (lignin, cellulose, and hemicellulose) also play a vital role in the quality and quantity of the products from the thermochemical conversion process [73]. From the literature, it was found that the percentages of lignin, cellulose, and hemicellulose in barley straw from agro-industrial residue were 13.8%, 33.8%, and 21.9%, respectively [74].
It is found that the amount of biochar declined from 38.57 to 30.61% for the rise in temperature from 400 to 600 °C. These results are comparable to the values of barley waste in the same temperature range (37.5% at 400 °C and 25.6% at 600 °C) [75]. Biochar creation is the procedure of breaking down weaker bonds and forming stronger structures through the degradation of lignin. Higher ash content contributes to biochar formation, particularly the inorganic components with sulfur and phosphorus [76,77]. The biochar with a high carbon (63–91%) and low oxygen (10–30%) content can be used to produce greater heat energy [78]. Devolatilization enables the production of biochar with a better grade of porosity and reactivity when biomass is subjected to high pyrolytic temperatures [79]. A. Aqsha et al. achieved the biochar produced from barley straw contain moisture content (2.26%), volatile matter (23.14%), fixed carbon (69.09%), and ash content (5.52%) from proximate analysis, as well as the carbon (72.61%), hydrogen (3.09%), nitrogen (1.73%), sulfur (0.62%), and oxygen (16.44%) from ultimate analysis along with a heating value of 27.70 MJ/kg [74].
In this reactor, bio-oil yields of 33.28%, 36.79%, and 29.25% were achieved at 400, 500, and 600 °C pyrolysis temperatures, respectively [75]. Bio-oils are a mixture of complex compounds such as phenols, aromatics, ketones, sugars, amines, esters, ethers, alcohols, and water. Since oil production depends mostly on the heat breakdown of cellulose, the higher cellulose content of the biomass was responsible for the higher bio-oil production [80]. Production of bio-oil can be raised to 70% in the pyrolysis procedure [81]. After refining, bio-oil may be used as conventional oil for vehicles or as a source of chemical goods. It can also be applied directly as fuel for a boiler or furnace. Bio-oils could be perceived as a suitable fuel for rural areas to resolve socioeconomic difficulties, environmental protection, and energy security [82]. The literature revealed that the major components of the bio-oil (27.47 MJ/kg of heating value) from barley straw were acetic acid, 1-hydroxy-2-butanone, trans-1,3-cyclopentanediol, furfural, 2-furanmethanol, acetoxyacetone, 4-hydroxybutyric acid lactone, 3-methyl-2-cyclopenten-1-one, phenol, 2-cyclopenten-1-one, guaiacol, and 2,6-dimethoxyphenol [74].
In the rise of pyrolysis temperatures from 400 to 600 °C, the syngas yield for this biomass increased from 28.15 to 40.14%. This is because of the secondary cracking of pyrolytic vapor into non-condensable gases (H2, CH4, CO2, and CO) at higher temperatures [83]. Syngas is utilized as a source of heat during the pyrolysis procedure as well as a fuel for gas turbines that generate power [84]. In a fuel cell, these gases may be utilized directly to generate energy with water as a byproduct. Multiple procedures were needed to remove carbon dioxide and carbon monoxide before the hydrogen gas could be separated from the syngas [66]. C. A. Mullen et al. found the pyrolytic non-condensable gases from barley straw were H2 (9.3%), CH4 (11.7%), CO2 (23.5%), and CO (55.5%) [85].

4. Conclusions

This study shows that barley waste has great potential as a source of biomass for the production of bioenergy. The moderate moisture content (5.43%) and lower ash content (3.01%) represented the better source of biofuels. The atomic ratios of (N+O)/C (0.760), O/C (0.690), and H/C (1.770) and the percentages of carbon (46.04%), hydrogen (6.84%), and other elements are very competitive to other biomass for the generation of bioenergy. The small quantity of sulfur (0.91%) indicates less SOx component formation. This biomass is promising for the generation of biochar, bio-oil, and syngas due to the higher HHV (20.06 MJ/kg) and LHV (18.44 MJ/kg) values. The higher level of fibers in the biomass was shown by the SEM analysis can be effective for biochar production to be used for filtration and soil amendment applications. Additionally, the EDX results showed that the waste had increased levels of carbon and oxygen. The substantial bonding between hydrogen, carbon, and oxygen in this biomass from the FTIR indicated the higher possibility of bioenergy generation. According to TGA and DTG, the double peaks for both pyrolysis and combustion conditions are the indication of hemicellulose and cellulose contents in the biomass. The biochar revealed in this study demonstrated the potential application for soil amendment as well as air and water purification. The highest pyrolysis yields were achieved at 400 °C for biochar, at 500 °C for bio-oil, and at 600 °C for syngas. The use of barley waste as a source of biofuel may assist in lessening the impact on landfills and has the potential to be a sustainable energy source that can minimize CO2 gas emissions when compared to fossil fuels. In summary, the conversion of waste biomass into bioenergy appears to be a workable solution to the energy crisis. The detailed characterization and analysis of pyrolyzed biochar, bio-oil, and syngas from barley waste are necessary to apply to the energy sector.

Author Contributions

Conceptualization, M.S.R., S.A. and A.K.A.; formal analysis, M.S.R. and S.A.S.; writing—original draft and final paper preparation, M.S.R., M.S.I. and C.W.; writing—review and editing, M.S.R. and C.W.; supervision S.A.S. and A.K.A.; project administration, A.K.A. and M.S.I.; funding acquisition, J.T. and C.W. All authors have read and agreed to the published version of the manuscript.

Funding

This research was financially supported by Prince of Songkla University and the Ministry of Higher Education, Science, Research and Innovation under the Reinventing University Project (Grant Number REV65011).

Institutional Review Board Statement

Not applicable.

Informed Consent Statement

Not applicable.

Data Availability Statement

Not applicable.

Acknowledgments

All authors are highly acknowledged to the Faculty of Integrated Technologies (UBD) and the scientific equipment center (PSU) for supporting this work.

Conflicts of Interest

There is no conflict of interest.

References

  1. Ahmed, A.; Abu Bakar, M.S.; Azad, A.K.; Sukri, R.S.; Mahlia, T.M.I. Potential thermochemical conversion of bioenergy from Acacia species in Brunei Darussalam: A review. Renew. Sustain. Energy Rev. 2018, 82, 3060–3076. [Google Scholar] [CrossRef]
  2. Kabeyi, M.J.B.; Olanrewaju, O.A. Sustainable Energy Transition for Renewable and Low Carbon Grid Electricity Generation and Supply. Front. Energy Res. 2022, 9, 1–45. [Google Scholar] [CrossRef]
  3. Panwar, N.L.; Kaushik, S.C.; Kothari, S. Role of renewable energy sources in environmental protection: A review. Renew. Sustain. Energy Rev. 2011, 15, 1513–1524. [Google Scholar] [CrossRef]
  4. Reza, M.S.; Ahmed, A.; Caesarendra, W.; Abu Bakar, M.S.; Shams, S.; Saidur, R.; Aslfattahi, N.; Azad, A.K. Acacia Holosericea: An Invasive Species for Bio-char, Bio-oil and Biogas Production. Bioengineering 2019, 6, 33. [Google Scholar] [CrossRef] [Green Version]
  5. Roy, H.; Alam, S.R.; Bin-Masud, R.; Prantika, T.R.; Pervez, M.N.; Islam, M.S.; Naddeo, V. A Review on Characteristics, Techniques, and Waste-to-Energy Aspects of Municipal Solid Waste Management: Bangladesh Perspective. Sustainability 2022, 14, 10265. [Google Scholar] [CrossRef]
  6. Siddiqua, A.; Hahladakis, J.N.; Al-Attiya, W.A.K.A. An overview of the environmental pollution and health effects associated with waste landfilling and open dumping. Environ. Sci. Pollut. Res. 2022, 29, 58514–58536. [Google Scholar] [CrossRef]
  7. Islam, M.S.; Kwak, J.H.; Nzediegwu, C.; Wang, S.; Palansuriya, K.; Kwon, E.E.; Naeth, M.A.; El-Din, M.G.; Ok, Y.S.; Chang, S.X. Biochar heavy metal removal in aqueous solution depends on feedstock type and pyrolysis purging gas. Environ. Pollut. 2021, 281, 117094. [Google Scholar] [CrossRef]
  8. Jha, S.; Nanda, S.; Acharya, B.; Dalai, A.K. A Review of Thermochemical Conversion of Waste Biomass to Biofuels. Energies 2022, 15, 6352. [Google Scholar] [CrossRef]
  9. Halder, P.; Azad, A.K. Recent trends and challenges of algal biofuel conversion technologies. In Advanced Biofuels: Applications, Technologies and Environmental Sustainability; Elsevier: Amsterdam, The Netherlands, 2019; pp. 169–179. ISBN 9780081027912. [Google Scholar]
  10. Zhang, L.; Xu, C.C.; Champagne, P. Overview of recent advances in thermo-chemical conversion of biomass. Energy Convers. Manag. 2010, 51, 969–982. [Google Scholar] [CrossRef]
  11. Zaman, C.Z.; Pal, K.; Yehye, W.A.; Sagadevan, S.; Shah, S.T.; Adebisi, G.A.; Marliana, E.; Rafique, R.F.; Johan, R. Bin Pyrolysis: A Sustainable Way to Generate Energy from Waste. In Pyrolysis; InTech: London, UK, 2017; pp. 1–35. [Google Scholar]
  12. Wang, C.; Sun, R.; Huang, R. Highly dispersed iron-doped biochar derived from sawdust for Fenton-like degradation of toxic dyes. J. Clean. Prod. 2021, 297, 126681. [Google Scholar] [CrossRef]
  13. Luo, D.; Wang, L.; Nan, H.; Cao, Y.; Wang, H.; Kumar, T.V.; Wang, C. Phosphorus adsorption by functionalized biochar: A review. Environ. Chem. Lett. 2022, 2022, 1–28. [Google Scholar] [CrossRef]
  14. Wang, C.; Huang, R.; Sun, R.; Yang, J.; Sillanpää, M. A review on persulfates activation by functional biochar for organic contaminants removal: Synthesis, characterizations, radical determination, and mechanism. J. Environ. Chem. Eng. 2021, 9, 106267. [Google Scholar] [CrossRef]
  15. Reza, M.S.; Azad, A.K.; Bakar, M.S.A.; Karim, M.R.; Sharifpur, M.; Taweekun, J. Evaluation of Thermochemical Characteristics and Pyrolysis of Fish Processing Waste for Renewable Energy Feedstock. Sustainability 2022, 14, 1203. [Google Scholar] [CrossRef]
  16. Reza, M.S.; Yun, C.S.; Afroze, S.; Radenahmad, N.; Bakar, M.S.A.; Saidur, R.; Taweekun, J.; Azad, A.K. Preparation of activated carbon from biomass and its’ applications in water and gas purification, a review. Arab J. Basic Appl. Sci. 2020, 27, 208–238. [Google Scholar] [CrossRef]
  17. Mussatto, S.I. Brewer’s spent grain: A valuable feedstock for industrial applications. J. Sci. Food Agric. 2014, 94, 1264–1275. [Google Scholar] [CrossRef] [Green Version]
  18. Fărcaş, A.C.; Socaci, S.A.; Mudura, E.; Dulf, F.V.; Vodnar, D.C.; Tofană, M.; Salanță, L.C.; Fărcaş, A.C.; Socaci, S.A.; Mudura, E.; et al. Exploitation of Brewing Industry Wastes to Produce Functional Ingredients. In Brewing Technology; IntechOpen: London, UK, 2017. [Google Scholar]
  19. Nigam, P.S. An overview: Recycling of solid barley waste generated as a by-product in distillery and brewery. Waste Manag. 2017, 62, 255–261. [Google Scholar] [CrossRef]
  20. Cai, J.; He, Y.; Yu, X.; Banks, S.W.; Yang, Y.; Zhang, X.; Yu, Y.; Liu, R.; Bridgwater, A.V. Review of physicochemical properties and analytical characterization of lignocellulosic biomass. Renew. Sustain. Energy Rev. 2017, 76, 309–322. [Google Scholar] [CrossRef] [Green Version]
  21. Detailed Overview (ASTM International). Available online: https://www.astm.org/about/overview/detailed-overview.html (accessed on 31 December 2022).
  22. ASTM D 3173-11; Standard Test Method for Moisture in the Analysis Sample of Coal and Coke. ASTM International: West Conshohocken, PA, USA, 2011.
  23. ASTM D 3175-07; Standard Test Method for Volatile Matter in the Analysis Sample of Coal and Coke. ASTM International: West Conshohocken, PA, USA, 2007.
  24. ASTM D3174-04; Standard Test Method for Ash in the Analysis Sample of Coal and Coke from Coal. ASTM International: West Conshohocken, PA, USA, 2010.
  25. ASTM D5468-02; Standard Test Method for Gross Calorific and Ash Value of Waste Materials. ASTM International: West Conshohocken, PA, USA, 2007.
  26. Samuel, O.O.; Olugbenga, E.A. Estimation and assesment of free swelling index and some petro-graphic properties from chemical analysis of coals across river niger. Pet. Coal 2017, 59, 273–287. [Google Scholar]
  27. Gaber, A.; Saif, H.; Ali, M.R.O. C Yields. Bioresour. Bioprocess. 2020. preprint. [Google Scholar]
  28. Collazzo, G.C.; Broetto, C.C.; Perondi, D.; Junges, J.; Dettmer, A.; Dornelles Filho, A.A.; Foletto, E.L.; Godinho, M. A detailed non-isothermal kinetic study of elephant grass pyrolysis from different models. Appl. Therm. Eng. 2017, 110, 1200–1211. [Google Scholar] [CrossRef]
  29. Promdee, K.; Vitidsant, T. Preparation of Biofuel by Pyrolysis of Plant Matter in a Continuous Reactor. Theor. Exp. Chem. 2013, 49, 126–129. [Google Scholar] [CrossRef]
  30. Imam, T.; Capareda, S. Characterization of bio-oil, syn-gas and bio-char from switchgrass pyrolysis at various temperatures. J. Anal. Appl. Pyrolysis 2012, 93, 170–177. [Google Scholar] [CrossRef]
  31. Kenney, K.L.; Smith, W.A.; Gresham, G.L.; Westover, T.L. Understanding biomass feedstock variability. Biofuels 2013, 4, 111–127. [Google Scholar] [CrossRef]
  32. McKendry, P. Energy production from biomass (part 1): Overview of biomass. Bioresour. Technol. 2002, 83, 37–46. [Google Scholar] [CrossRef] [PubMed]
  33. Vassilev, S.V.; Vassileva, C.G.; Vassilev, V.S. Advantages and disadvantages of composition and properties of biomass in comparison with coal: An overview. Fuel 2015, 158, 330–350. [Google Scholar] [CrossRef]
  34. Li, X.; Zhang, H.; Li, J.; Su, L.; Zuo, J.; Komarneni, S.; Wang, Y. Improving the aromatic production in catalytic fast pyrolysis of cellulose by co-feeding low-density polyethylene. Appl. Catal. A Gen. 2013, 455, 114–121. [Google Scholar] [CrossRef]
  35. Lam, S.S.; Liew, R.K.; Lim, X.Y.; Ani, F.N.; Jusoh, A. Fruit waste as feedstock for recovery by pyrolysis technique. Int. Biodeterior. Biodegrad. 2016, 113, 325–333. [Google Scholar] [CrossRef]
  36. Liu, Z.; Quek, A.; Kent Hoekman, S.; Balasubramanian, R. Production of solid biochar fuel from waste biomass by hydrothermal carbonization. Fuel 2013, 103, 943–949. [Google Scholar] [CrossRef]
  37. Mierzwa-Hersztek, M.; Gondek, K.; Jewiarz, M.; Dziedzic, K. Assessment of energy parameters of biomass and biochars, leachability of heavy metals and phytotoxicity of their ashes. J. Mater. Cycles Waste Manag. 2019, 21, 786–800. [Google Scholar] [CrossRef]
  38. Kwak, J.H.; Islam, M.S.; Wang, S.; Messele, S.A.; Naeth, M.A.; El-Din, M.G.; Chang, S.X. Biochar properties and lead(II) adsorption capacity depend on feedstock type, pyrolysis temperature, and steam activation. Chemosphere 2019, 231, 393–404. [Google Scholar] [CrossRef]
  39. Sadiku, N.A.; Oluyege, A.O.; Sadiku, I.B. Analysis of the Calorific and Fuel Value Index of Bamboo as a Source of Renewable Biomass Feedstock for Enegry Generation in Nigeria. Lignocellulose 2016, 5, 34–49. [Google Scholar]
  40. Aup-Ngoen, K.; Noipitak, M. Effect of carbon-rich biochar on mechanical properties of PLA-biochar composites. Sustain. Chem. Pharm. 2020, 15, 100204. [Google Scholar] [CrossRef]
  41. Channiwala, S.A.; Parikh, P.P. A unified correlation for estimating HHV of solid, liquid and gaseous fuels. Fuel 2002, 81, 1051–1063. [Google Scholar] [CrossRef]
  42. Abu Bakar, M. Catalytic Intermediate Pyrolysis of Brunei Rice Husk for Bio-Oil Production. Ph.D. Thesis, Aston University, Birmingham, UK, 2013. [Google Scholar]
  43. Reza, M.S.; Islam, S.N.; Afroze, S.; Bakar, M.S.A.; Sukri, R.S.; Rahman, S.; Azad, A.K. Evaluation of the bioenergy potential of invasive Pennisetum purpureum through pyrolysis and thermogravimetric analysis. Energy Ecol. Environ. 2020, 5, 118–133. [Google Scholar] [CrossRef]
  44. Abu Bakar, M.S.; Titiloye, J.O. Catalytic pyrolysis of rice husk for bio-oil production. J. Anal. Appl. Pyrolysis 2013, 103, 362–368. [Google Scholar] [CrossRef] [Green Version]
  45. Lehmann, J.; Rillig, M.C.; Thies, J.; Masiello, C.A.; Hockaday, W.C.; Crowley, D. Biochar effects on soil biota—A review. Soil Biol. Biochem. 2011, 43, 1812–1836. [Google Scholar] [CrossRef]
  46. Chen, B.; Chen, Z. Sorption of naphthalene and 1-naphthol by biochars of orange peels with different pyrolytic temperatures. Chemosphere 2009, 76, 127–133. [Google Scholar] [CrossRef]
  47. Molino, A.; Nanna, F.; Ding, Y.; Bikson, B.; Braccio, G. Biomethane production by anaerobic digestion of organic waste. Fuel 2013, 103, 1003–1009. [Google Scholar] [CrossRef]
  48. Gravalos, I.; Xyradakis, P.; Kateris, D.; Gialamas, T.; Bartzialis, D.; Giannoulis, K. An Experimental Determination of Gross Calorific Value of Different Agroforestry Species and Bio-Based Industry Residues. Nat. Resour. 2016, 07, 57–68. [Google Scholar] [CrossRef] [Green Version]
  49. Hidayat, S.; Abu Bakar, M.S.; Yang, Y.; Phusunti, N.; Bridgwater, A.V. Characterisation and Py-GC/MS analysis of Imperata Cylindrica as potential biomass for bio-oil production in Brunei Darussalam. J. Anal. Appl. Pyrolysis 2018, 134, 510–519. [Google Scholar] [CrossRef] [Green Version]
  50. Wang, W.-C.; Lee, A.-C. Thermochemical Processing of Miscanthus through Fluidized-Bed Fast Pyrolysis: A Parametric Study. Chem. Eng. Technol. 2018, 41, 1737–1745. [Google Scholar] [CrossRef]
  51. Mehmood, M.A.; Ye, G.; Luo, H.; Liu, C.; Malik, S.; Afzal, I.; Xu, J.; Ahmad, M.S. Pyrolysis and kinetic analyses of Camel grass (Cymbopogon schoenanthus) for bioenergy. Bioresour. Technol. 2017, 228, 18–24. [Google Scholar] [CrossRef] [PubMed]
  52. Vargas-Moreno, J.M.; Callejón-Ferre, A.J.; Pérez-Alonso, J.; Velázquez-Martí, B. A review of the mathematical models for predicting the heating value of biomass materials. Renew. Sustain. Energy Rev. 2012, 16, 3065–3083. [Google Scholar] [CrossRef]
  53. Huang, C.; Han, L.; Yang, Z.; Liu, X. Ultimate analysis and heating value prediction of straw by near infrared spectroscopy. Waste Manag. 2009, 29, 1793–1797. [Google Scholar] [CrossRef] [PubMed]
  54. Okolodkov, Y.B.; Huerta-Quintanilla, D.A. A low voltage scanning electron microscopy study of the theca of marine dinoflagellates. J. Adv. Microsc. Res. 2012, 7, 170–175. [Google Scholar] [CrossRef]
  55. Zhang, J.; Zhang, J.; Rajulu, A.V. Extraction and characterization of cellulose single fi bers from native african napier grass. Carbohydr. Polym. 2018, 188, 85–91. [Google Scholar]
  56. Blesa, M.J.; Fierro, V.; Miranda, J.L.; Moliner, R.; Palacios, J.M. Effect of the pyrolysis process on the physicochemical and mechanical properties of smokeless fuel briquettes. Fuel Process. Technol. 2001, 74, 1–17. [Google Scholar] [CrossRef]
  57. Newbury, D.E.; Ritchie, N.W.M. Performing elemental microanalysis with high accuracy and high precision by scanning electron microscopy/silicon drift detector energy-dispersive X-ray spectrometry (SEM/SDD-EDS). J. Mater. Sci. 2015, 50, 493–518. [Google Scholar] [CrossRef] [Green Version]
  58. Hossain, N.; Zaini, J.; Mahlia, T.M.I.; Azad, A.K. Elemental, morphological and thermal analysis of mixed microalgae species from drain water. Renew. Energy 2019, 131, 617–624. [Google Scholar] [CrossRef]
  59. Smith, F.A.; White, J.W.C. Modern calibration of phytolith carbon isotope signatures for C 3/C4 paleograssland reconstruction. Palaeogeogr. Palaeoclimatol. Palaeoecol. 2004, 207, 277–304. [Google Scholar] [CrossRef]
  60. Özçimen, D.; Ersoy-Meriçboyu, A. Characterization of biochar and bio-oil samples obtained from carbonization of various biomass materials. Renew. Energy 2010, 35, 1319–1324. [Google Scholar] [CrossRef]
  61. Chem.libretexts.org Infrared Spectroscopy Absorption Table—Chemistry LibreTexts. Available online: https://chem.libretexts.org/Ancillary_Materials/Reference/Reference_Tables/Spectroscopic_Parameters/Infrared_Spectroscopy_Absorption_Table (accessed on 8 July 2019).
  62. Akhtar, N.; Goyal, D.; Goyal, A. Physico-chemical characteristics of leaf litter biomass to delineate the chemistries involved in biofuel production. J. Taiwan Inst. Chem. Eng. 2016, 62, 239–246. [Google Scholar] [CrossRef]
  63. Yang, H.; Yan, R.; Chen, H.; Lee, D.H.; Zheng, C. Characteristics of hemicellulose, cellulose and lignin pyrolysis. Fuel 2007, 86, 1781–1788. [Google Scholar] [CrossRef]
  64. Traoré, M.; Kaal, J.; Cortizas, A.M. Application of FTIR spectroscopy to the characterization of archeological wood. SAA 2015, 153, 63–70. [Google Scholar] [CrossRef]
  65. El-Hendawy, A.-N.A. Variation in the FTIR spectra of a biomass under impregnation, carbonization and oxidation conditions. J. Anal. Appl. Pyrolysis 2006, 75, 159–166. [Google Scholar] [CrossRef]
  66. Ahmed, A.; Hidayat, S.; Abu Bakar, M.S.; Azad, A.K.; Sukri, R.S.; Phusunti, N. Thermochemical characterisation of Acacia auriculiformis tree parts via proximate, ultimate, TGA, DTG, calorific value and FTIR spectroscopy analyses to evaluate their potential as a biofuel resource. Biofuels 2018, 7269, 9–20. [Google Scholar] [CrossRef]
  67. Baloch, H.A.; Nizamuddin, S.; Siddiqui, M.T.H.; Riaz, S.; Jatoi, A.S.; Dumbre, D.K.; Mubarak, N.M.; Srinivasan, M.P.; Griffin, G.J. Recent advances in production and upgrading of bio-oil from biomass: A critical overview. J. Environ. Chem. Eng. 2018, 6, 5101–5118. [Google Scholar] [CrossRef]
  68. Mabuda, A.I.; Mamphweli, N.S.; Meyer, E.L. Model free kinetic analysis of biomass/sorbent blends for gasification purposes. Renew. Sustain. Energy Rev. 2016, 53, 1656–1664. [Google Scholar] [CrossRef]
  69. Naik, S.; Goud, V.V.; Rout, P.K.; Jacobson, K.; Dalai, A.K. Characterization of Canadian biomass for alternative renewable biofuel. Renew. Energy 2010, 35, 1624–1631. [Google Scholar] [CrossRef]
  70. Park, Y.H.; Kim, J.; Kim, S.S.; Park, Y.K. Pyrolysis characteristics and kinetics of oak trees using thermogravimetric analyzer and micro-tubing reactor. Bioresour. Technol. 2009, 100, 400–405. [Google Scholar] [CrossRef]
  71. Titiloye, J.O.; Abu Bakar, M.S.; Odetoye, T.E. Thermochemical characterisation of agricultural wastes from West Africa. Ind. Crops Prod. 2013, 47, 199–203. [Google Scholar] [CrossRef]
  72. Choudhury, N.D.; Chutia, R.S.; Bhaskar, T.; Kataki, R. Pyrolysis of jute dust: Effect of reaction parameters and analysis of products. J. Mater. Cycles Waste Manag. 2014, 16, 449–459. [Google Scholar] [CrossRef]
  73. Brownsort, P. Biomass Pyrolysis Processes: Performance Parameters and Their Influence on Biochar System Benefits. Master’s Thesis, University of Edinburgh, Edinburgh, UK, 2009. [Google Scholar]
  74. Aqsha, A.; Tijani, M.M.; Moghtaderi, B.; Mahinpey, N. Catalytic pyrolysis of straw biomasses (wheat, flax, oat and barley) and the comparison of their product yields. J. Anal. Appl. Pyrolysis 2017, 125, 201–208. [Google Scholar] [CrossRef]
  75. Ferreira, S.D.; Manera, C.; Silvestre, W.P.; Pauletti, G.F.; Altafini, C.R.; Godinho, M. Use of Biochar Produced from Elephant Grass by Pyrolysis in a Screw Reactor as a Soil Amendment. Waste Biomass Valorization 2019, 10, 3089–3100. [Google Scholar] [CrossRef]
  76. Kang, Z.; Jia, X.; Zhang, Y.; Kang, X.; Ge, M.; Liu, D.; Wang, C.; He, Z. A Review on Application of Biochar in the Removal of Pharmaceutical Pollutants through Adsorption and Persulfate-Based AOPs. Sustainability 2022, 14, 10128. [Google Scholar] [CrossRef]
  77. Wang, C.; Luo, D.; Zhang, X.; Huang, R.; Cao, Y.; Liu, G.; Zhang, Y.; Wang, H. Biochar-based slow-release of fertilizers for sustainable agriculture: A mini review. Environ. Sci. Ecotechnology 2022, 10, 100167. [Google Scholar] [CrossRef]
  78. Quan, C.; Gao, N.; Song, Q. Pyrolysis of biomass components in a TGA and a fixed-bed reactor: Thermochemical behaviors, kinetics, and product characterization. J. Anal. Appl. Pyrolysis 2016, 121, 84–92. [Google Scholar] [CrossRef]
  79. Reza, M.S.; Afroze, S.; Bakar, M.S.A.; Saidur, R.; Aslfattahi, N.; Taweekun, J.; Azad, A.K. Biochar characterization of invasive Pennisetum purpureum grass: Effect of pyrolysis temperature. Biochar 2020, 2, 239–251. [Google Scholar] [CrossRef]
  80. Lin, B.-J.; Chen, W.-H. Sugarcane Bagasse Pyrolysis in a Carbon Dioxide Atmosphere with Conventional and Microwave-Assisted Heating. Front. Energy Res. 2015, 3, 4. [Google Scholar] [CrossRef] [Green Version]
  81. Xu, Y.; Hu, X.; Li, W.; Shi, Y. Preparation and Characterization of Bio-Oil from Biomass. In Progress in Biomass and Bioenergy Production; Shaukat, S., Ed.; InTech: Shanghai, China, 2011; pp. 197–222. ISBN 978-953-307-491-7. [Google Scholar]
  82. Bridgwater, A.V. Review of fast pyrolysis of biomass and product upgrading. Biomass Bioenergy 2012, 38, 68–94. [Google Scholar] [CrossRef]
  83. Encinar, J.; González, J.; González, J. Fixed-bed pyrolysis of Cynara cardunculus L. Product yields and compositions. Fuel Process. Technol. 2000, 68, 209–222. [Google Scholar] [CrossRef]
  84. Guedes, R.E.; Luna, A.S.; Torres, A.R. Operating parameters for bio-oil production in biomass pyrolysis: A review. J. Anal. Appl. Pyrolysis 2018, 129, 134–149. [Google Scholar] [CrossRef]
  85. Mullen, C.A.; Boateng, A.A.; Hicks, K.B.; Goldberg, N.M.; Moreau, R.A. Analysis and Comparison of Bio-Oil Produced by Fast Pyrolysis from Three Barley Biomass/Byproduct Streams. Energy and Fuels 2009, 24, 699–706. [Google Scholar] [CrossRef]
Figure 1. Biomass/sample preparation diagram.
Sustainability 15 01643 g001
Figure 2. Characterization diagram of biomass.
Sustainability 15 01643 g002
Figure 3. The schematic diagram of pyrolysis setup.
Sustainability 15 01643 g003
Figure 4. Van Krevelen diagram.
Sustainability 15 01643 g004
Figure 5. SEM images of barley waste at (a) 100, (b) 1000, and (c) 5000 magnification levels.
Sustainability 15 01643 g005
Figure 6. Elements peaks of biomass from EDX.
Sustainability 15 01643 g006
Figure 7. Fourier Transform Infrared of barley waste sample.
Sustainability 15 01643 g007
Figure 8. TGA and DTG curves for barley waste biomass under pyrolysis conditions.
Sustainability 15 01643 g008
Figure 9. TGA and DTG curves for barley waste biomass under combustion conditions.
Sustainability 15 01643 g009
Table 1. The proximate analysis of the biomass.
Biomass SampleMC (wt.%)VM (wt.%)FC (wt.%)AC (wt.%)Reference
Barley waste5.4373.4118.153.01This Study
Elephant grass9.8069.207.7013.30[28]
Imperata cylindrica9.3064.3016.1010.30[29]
Switchgrass8.4084.2011.903.90[30]
Table 2. The ultimate analysis results of different biomasses.
SampleC (wt.%)H (wt.%)N (wt.%)S (wt.%)O (wt.%)H/CO/CRef.
Barley Waste46.046.843.890.9142.321.7700.690This Study
Elephant grass39.636.311.700.2052.161.8970.988[4,43]
Rice husk39.485.710.665<0.1054.121.7231.029
Torrefied camphorwood53.056.060.23--40.601.3610.575
Torrefied rape straw48.865.79----38.091.4120.585
Indonesian coal75.475.371.10--16.400.8480.163
Indian coal44.503.331.02--5.550.8920.094
Indonesian brown Coal69.205.140.890.2824.490.8850.266
Indonesian sub-bituminous coal37.952.680.690.317.910.8410.157
Raw anthracite90.60------3.100.2400.025
Anthracite72.492.900.940.394.960.4770.051
Table 3. Calorific Values of barley waste and other biomass.
BiomassHHV (MJ/kg)LHV * (MJ/kg)Reference
Barley waste20.0618.44This Study
Imperata cylindrica18.3916.99[49]
Miscanthus floridulus11.059.67[50]
Camel grass15.0013.40[51]
* Calculated from Equation (7).
Table 4. Biomass elements from EDX results.
ElementWt. (%)Atomic (%)
Carbon (C)67.2073.96
Oxygen (O)30.0824.85
Magnesium (Mg)0.120.07
Aluminum (Al)0.380.19
Silicon (Si)0.240.11
Phosphorus (P)1.000.43
Sulfur (S)0.620.26
Calcium (Ca)0.380.13
Table 6. Biomass weight loss in three steps for both conditions.
TGA and DTG
Conditions
Weight Loss (%)Residue (%)DTG Peak Temperature (°C)DTG Peak (wt.%/min)
Stage I
40 to 200 (°C)
Stage II
200 to 450 (°C)
Stage III
450 to 900 (°C)
Pyrolysis (N2)9.0259.5410.2921.153664.27
Combustion (O2)7.1163.0326.853.012985.41
Table 7. Products yield of barley waste for the single fixed-bed reactor.
Pyrolysis Temperature (°C)Biochar (wt.%)Bio-Oil (wt.%)Syngas 1 (wt.%)
40038.5733.2828.15
50034.0436.7929.17
60030.6129.2540.14
1 Calculated by deduction.
Disclaimer/Publisher’s Note: The statements, opinions and data contained in all publications are solely those of the individual author(s) and contributor(s) and not of MDPI and/or the editor(s). MDPI and/or the editor(s) disclaim responsibility for any injury to people or property resulting from any ideas, methods, instructions or products referred to in the content.

